water conservation plan - waukesha water utility · amy vickers & associates, inc. water...
TRANSCRIPT

Amy Vickers & Associates, Inc.Water Planning, Policy, and Management
Final
Water Conservation Plan
Prepared for
May 2012

F i na l
Water Conservation Plan
Prepared for
Waukesha Water Utility
May 2012
135 S. 84th Street
Suite 400 Milwaukee, WI 53214


WBG010912212935MKE III
Acknowledgements
City of Waukesha Water Utility Commission Dan Warren, Commission President
Greg Zinda, Commission Secretary Gerald Couri, Commissioner
Joseph J Piatt, Ph.D., M.S.C.E., Commissioner Terry Thieme (Alderman), Commissioner
Bill Boyle, Commissioner Mayor Jeff Scrima, Commissioner
Waukesha Water Utility Staff Dan Duchniak, General Manager
Nancy Quirk, P.E., Technical Services Manager Mary K. Adelmeyer, Water Resources Assistant
Scott B. Lange, Water Quality Technician
Water Conservation Stakeholder Committee
Bill Boyle, WWU Commissioner, resident Ezra Myer, Clean Wisconsin
Pete Conine, City of Waukesha Wastewater Utility Glen Norder, Waukesha School District
Victoria Hekkers, Katydid Owner and City landlord Joe Piatt, Carroll University, WWU Commissioner
James Hill, Waukesha Memorial Hospital Gina Sanchez, La Casa de Esperanza
Mark Keckeisen, Waukesha County Buildings Pete Traczek, City Parks and Forestry
Suzanne Kelley, Waukesha County Business Alliance Andy Yencha, UW-Extension, Fox River Basin educator
Jim Lombardi, Pure Power Technology We gratefully acknowledge the assistance and time of other contributors to the 2012 Water Conservation Plan update including:
Participants in the customer interviews and survey and the planning consultant team members from Amy Vickers & Associates, Inc., Amherst, MA, Beth Foy and Associates, Menomonee Falls, WI, and the team at CH2M HILL


WBG010912212935MKE V
Executive Summary Water conservation is an important element in the City of Waukesha (City) long-range water supply strategy. To rely on water conservation savings as a source of supply, the City adopted its 2006 Water Conservation and Protection Plan, which set forth water savings goals and recommendations for conservation program management and source water protection. Since 2006, the City implemented a variety of conservation measures, including the following:
• First in the state to implement inclining block water rate structure to encourage conservation • City ordinance to restrict outdoor irrigation • High-efficiency toilet rebates • School and general public information and education campaigns
Introduction Through this update to its Water Conservation Plan (Plan), the City is establishing a path forward to achieve greater water use efficiency and is documenting its commitment to water conservation and meeting the environmental standards of the Great Lakes–St. Lawrence River Basin Water Resources Compact (Compact). Further, this Plan complies with the conservation targets and tactics established in the State of Wisconsin Compact implementation rule, NR 852 Water Conservation and Water Use Efficiency (NR 852). The requirements of NR 852 are mandatory for new or increased diversions from the Great Lakes. NR 852 prescribes wide-ranging water conservation and efficiency measures (CEMs) for public water systems with an overall requirement of a 10 percent reduction in water use, or increase in water reuse or efficiency. A 10 percent reduction in water use is equivalent to approximately 1 million gallons per day (mgd) for the ultimate buildout condition of the City’s water supply service area. While the Plan is focused on conservation activities over the next 5 years, the recommendations for program implementation, monitoring, evaluation and refinement are consistent with 20-year (2030) and ultimate buildout (2050) water savings goals listed in Table ES-1.
TABLE ES-1 Target Water Savings from Conservation and Water Use Efficiency
Year Average Day Demand Flowrate (mgd) Cumulative Volume (MG)
2016 0.2 86.8
2030 0.5 182.5
2050 (Ultimate Buildout) 1.0 365 Note: Estimated cumulative savings through 2011 is 36.4 million gallons (MG).
Water Conservation Goals and Objectives The City’s water conservation goals include the following:
• Reducing average day demand by 0.5 mgd by year 2030 and by 1.0 mgd by year 2050.
The objectives met to achieve the City’s goals and develop this Plan include the following:
• Comply with NR 852
• Align with the Southeastern Wisconsin Regional Planning Commission 2035 Regional Water Supply Plan
• Incorporate stakeholder and customer input in the evaluation of CEMs
• Use the Alliance for Water Efficiency (AWE) Water Conservation Tracking Tool (AWE Tool) to estimate CEM cost-effectiveness
• Be inclusive of all City customer classes
• Target highest potential savings

WAUKESHA WATER CONSERVATION PLAN
VI WBG010912212935MKE
• Pursue cost-effective CEMs; leverage lessons learned from other conservation programs across the country and from its own experiences with implementation
• Promote conservation awareness
Key Elements of the Plan Reaching the City’s water savings goals requires capital investment, additional staff time, and cooperation and enthusiasm from a broad range of the citizenry. For these reasons, the City is using a robust planning process to identify and evaluate CEMs for best fit in Waukesha. The approach, shown in Figure ES-1, integrates implementing, monitoring, and refinement of conservation measures to enhance program efficiency. This approach is supported by proven tools, like the Alliance for Water Efficiency (AWE) Water Conservation Tracking Tool (Tool) used to calculate the estimated costs and benefits of CEMs. The resources, in combination with experienced Waukesha Water Utility (WWU) staff and an engaged water conservation stakeholder committee, resulted in the following key elements of the City’s Plan:
• Conservation program flexibility, allowing City discretion to change which measures are implemented, the schedule and the balance between the measures from year to year.
• Youth and public education, especially to meet goals in 2030 and beyond. In the next 5 years, the City will present easily understood, clearly communicated information to help customers understand and manage their water use.
• Financial incentives such as rebates or possible grants for innovative site-specific water saving measures with demonstrated savings, especially for commercial and industrial customers.
• Reduction of excess and inefficient outdoor irrigation.
• Increased collaboration with water conservation partners.
• Continued water conservation pricing.
Evaluation of conservation measures Following the publishing of NR 852 in 2011 and prior to the development of this Plan, the City evaluated numerous CEMs using the AWE Tool. This tool is a water conservation calculator that is recommend by the Wisconsin Department of Natural Resources (WDNR) under NR 852 for estimating water savings and costs associated with CEMs. The initial analysis using the AWE Tool resulted in a short list of candidate CEMs for further evaluation by WWU and stakeholders. Stakeholders were engaged in the water conservation planning process through an online survey, strategic customer interviews, and participation in the water conservation stakeholder committee. Engaging the City’s customers and active community members provided valuable insights regarding the level of awareness of the need for conservation and ways to achieve it. The stakeholder committee input helped establish a baseline for the City’s approach to future public information and education activities. Furthermore, successfully engaging a broad range of stakeholder interests provided useful perspectives used to evaluate CEMs and community acceptance of proposed conservation measures.
Benefit-Cost Analysis A benefit-cost analysis was conducted to compare the costs and benefits of implementing each CEM. Using the AWE Tool, cost encompassed monetary costs and environmental costs, including for example greenhouse gas emissions. Benefits were estimated in monetary terms and as water volumes saved. The CEMs that resulted in neutral or positive benefit to cost (B:C) ratios, and the projected water savings, are listed in Table ES-2.
FIGURE ES-1 Water Conservation Planning Process

EXECUTIVE SUMMARY
WBG010912212935MKE VII
TABLE ES-2 Summary of B:C Ratio and Projected Water Savings
Activity City
B:C Ratio Customer B:C Ratio
Projected Water Savings (gallons) Years 2012 - 2016
Residential high-efficiency toilets (HETs), $100 rebate 3.7 271 7,325,700
Multi-family residential HET direct install, $100 rebate 5.6 38.9 113,000
Commercial tank-type HET, $100 rebate 3.5 24.1 34,500
Commercial valve-type HET 3.5 23.9 57,500
Industrial tank-type HET, $100 rebate 3.5 23.9 80,400
Industrial valve-type HET, $100 rebate 3.5 23.9 80,400
Public tank-type HET, $100 rebate 3.5 23.9 80,400
Public valve-type HET, $100 rebate 3.5 23.9 80,400
Residential water-efficient showerhead 378 3.1 866,200
Multi-family residential water-efficient showerhead 6.9 6.8 11,400
Commercial water-efficient showerhead 6.9 7.4 4,100
Industrial water-efficient showerhead 5.4 7.3 16,500
Public water-efficient showerhead 4.9 6.7 15,200
Residential indoor water use surveys 0 N/A 73,000
Multi-family residential indoor water user surveys 0 N/A 4,000
Commercial indoor water use surveys 0 N/A 17,000
Industrial indoor water use surveys 0 N/A 21,700
Public indoor water use surveys 0 N/A 21,700
Commercial outdoor water use surveys 0 N/A N/A
Public outdoor water use surveys 0 3.0 N/A
Commercial urinals, $100 rebate 1.2 3.0 93,100
Industrial urinals, $100 rebate 1.2 3.0 93,100
Public urinals, $100 rebate 1.2 3.0 93,100
Commercial spray-rinse valves rebates 6.4 478 1,414,300
Industrial spray-rinse valves rebates 6.0 444 1,414,300
Public spray-rinse valves rebates 6.0 444 1,414,300
Public HE clothes washer rebate -0.3 N/A 7,000
Note: N/A = unknown at this time
Recommended Implementation Plan The recommended implementation plan for the next 5 years is summarized in Table ES-3. It includes the following elements:
• New and expanded fixture rebate measures to accelerate replacement of less efficient devices • Expanded public education and information

WAUKESHA WATER CONSERVATION PLAN
VIII WBG010912212935MKE
Additional customer water audits to design tailored customer demand management strategies
Increase program data gathering and monitoring to measure program effectiveness
TABLE ES-3 Estimated Costs—Water Conservation Program
Activity Name 2012 2013 2014 2015 2016
Toilet rebates $5,500 $20,800 $24,900 $33,100 $35,900
Showerhead rebates $500 $0 $3000 $0
Indoor water use audits $0 $13,100 $14,400 $14,400 $16,000
Outdoor water use audits $0 $0 $600 $400 $400
Urinal rebates $0 $0 $0 $2,900 $3,900
Spray‐rinse valve rebates $0 $2,200 $1,300 $1,300 $2,500
Leak detection, mains, and hydrants $7,000 $10,000 $10,000 $10,000 $10,000
Pilot project or tailored incentives $0 $0 $5,000 $5,000 $5,000
Subtotal $12,500 $36,500 $45,900 $52,500 $62,700
Public education and outreach $10,500 $10,500 $10,500 $10,500 $10,500
Program management, auditing, reporting, customer service, sprinkler ordinance $34,800 $38,000 $45,000 $45,000 $45,000
Estimated Program Cost Total $57,800 $95,100 $106,700 $117,900 $124,200
Figure ES‐2 shows how projected water savings over the next 5 years contribute to the City’s long‐term goals. Annually, the City will refine design of conservation program to maximize water savings, return on investment, and customer satisfaction. In 5 years, the City will formally update its water conservation plan and adjust planning strategies to account for actual savings accomplished and future conditions.
FIGURE ES-2 Water Savings Goal and Projected Water Savings

EXECUTIVE SUMMARY
WBG010912212935MKE IX
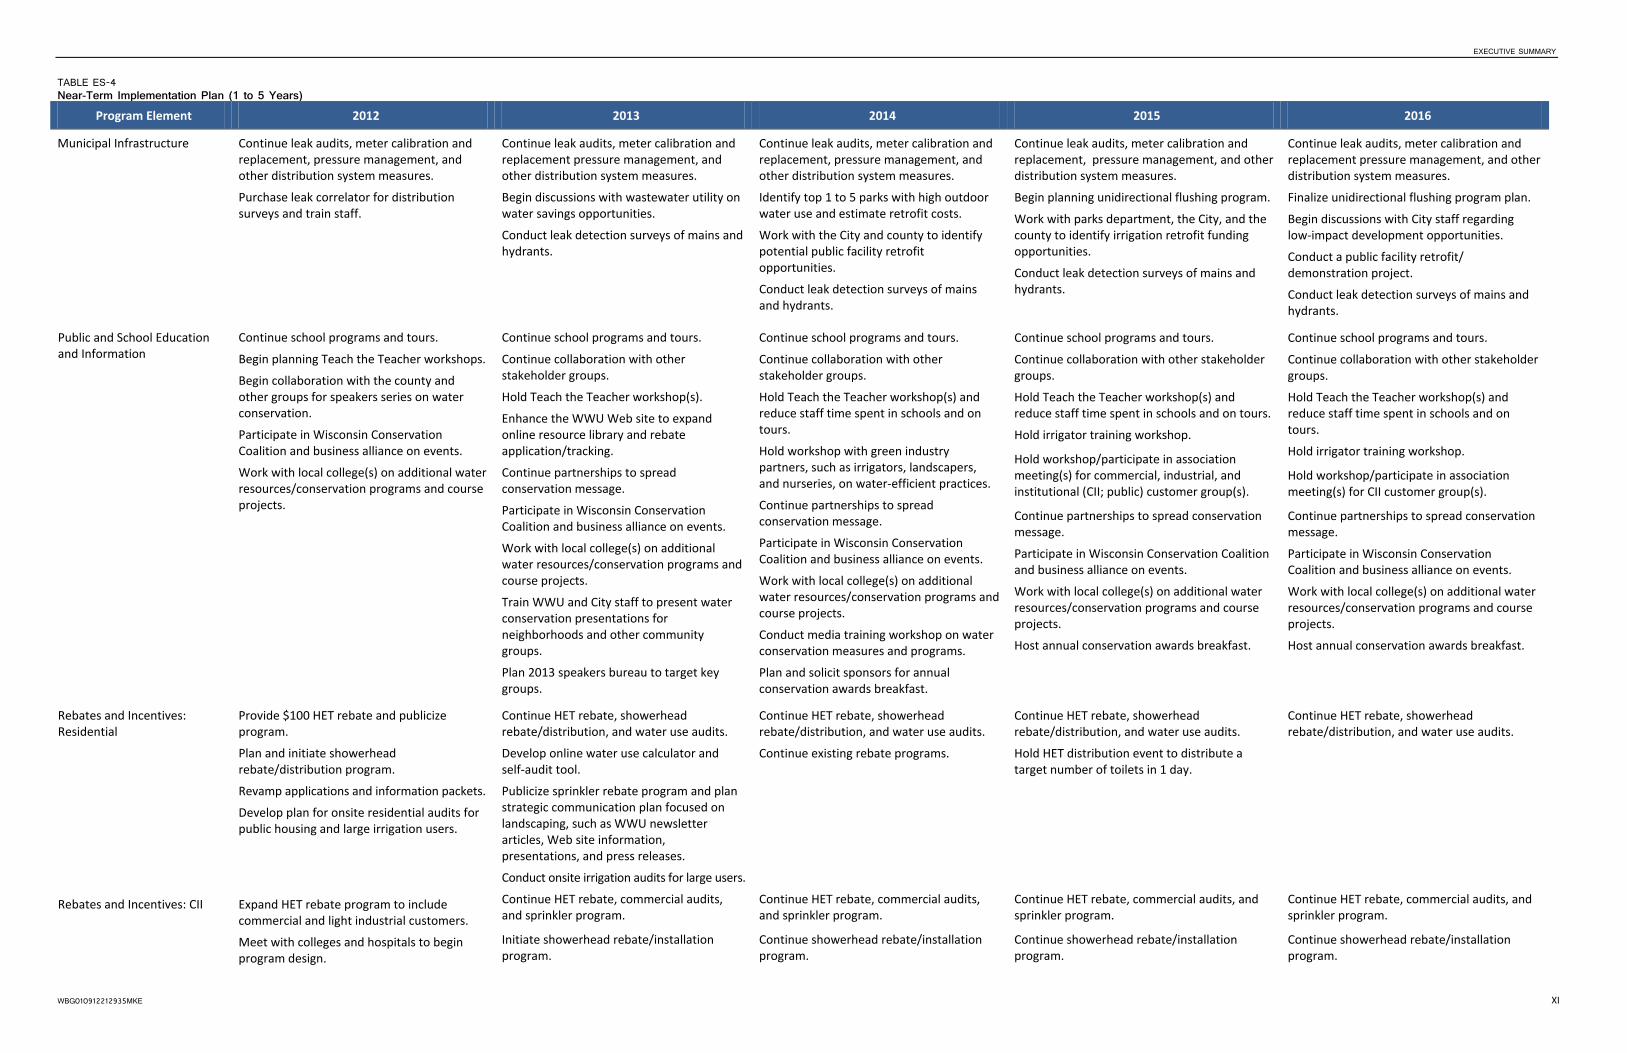
The implementation strategy shown in Table ES-4 is designed to build a strong foundation and support for the programs in Year 1 (2012) through public education and incentives for residential customers, particularly the top 10 percent water users. Starting in Year 2 (2013), the program focus would expand to include incentives for commercial and industrial customers. As the program expands over the subsequent 3 years (2014 to 2016), additional measures would be emphasized to capture the greatest savings and the lowest costs. Preliminary mid-term (6 to 10 years) and long-term (10 to 30 years) implementation schedules for the City’s water conservation program are outlined to provide guidance to future updates to the Plan.

EXECUTIVE SUMMARY
WBG010912212935MKE XI
TABLE ES-4 Near-Term Implementation Plan (1 to 5 Years)
Program Element 2012 2013 2014 2015 2016
Municipal Infrastructure Continue leak audits, meter calibration and replacement, pressure management, and other distribution system measures.
Purchase leak correlator for distribution surveys and train staff.
Continue leak audits, meter calibration and replacement pressure management, and other distribution system measures.
Begin discussions with wastewater utility on water savings opportunities.
Conduct leak detection surveys of mains and hydrants.
Continue leak audits, meter calibration and replacement, pressure management, and other distribution system measures.
Identify top 1 to 5 parks with high outdoor water use and estimate retrofit costs.
Work with the City and county to identify potential public facility retrofit opportunities.
Conduct leak detection surveys of mains and hydrants.
Continue leak audits, meter calibration and replacement, pressure management, and other distribution system measures.
Begin planning unidirectional flushing program.
Work with parks department, the City, and the county to identify irrigation retrofit funding opportunities.
Conduct leak detection surveys of mains and hydrants.
Continue leak audits, meter calibration and replacement pressure management, and other distribution system measures.
Finalize unidirectional flushing program plan.
Begin discussions with City staff regarding low-impact development opportunities.
Conduct a public facility retrofit/
Conduct leak detection surveys of mains and hydrants.
demonstration project.
Public and School Education and Information
Continue school programs and tours.
Begin planning Teach the Teacher workshops.
Begin collaboration with the county and other groups for speakers series on water conservation.
Participate in Wisconsin Conservation Coalition and business alliance on events.
Work with local college(s) on additional water resources/conservation programs and course projects.
Continue school programs and tours.
Continue collaboration with other stakeholder groups.
Hold Teach the Teacher workshop(s).
Enhance the WWU Web site to expand online resource library and rebate application/tracking.
Continue partnerships to spread conservation message.
Participate in Wisconsin Conservation Coalition and business alliance on events.
Work with local college(s) on additional water resources/conservation programs and course projects.
Train WWU and City staff to present water conservation presentations for neighborhoods and other community groups.
Plan 2013 speakers bureau to target key groups.
Continue school programs and tours.
Continue collaboration with other stakeholder groups.
Hold Teach the Teacher workshop(s) and reduce staff time spent in schools and on tours.
Hold workshop with green industry partners, such as irrigators, landscapers, and nurseries, on water-efficient practices.
Continue partnerships to spread conservation message.
Participate in Wisconsin Conservation Coalition and business alliance on events.
Work with local college(s) on additional water resources/conservation programs and course projects.
Conduct media training workshop on water conservation measures and programs.
Plan and solicit sponsors for annual conservation awards breakfast.
Continue school programs and tours.
Continue collaboration with other stakeholder groups.
Hold Teach the Teacher workshop(s) and reduce staff time spent in schools and on tours.
Hold irrigator training workshop.
Hold workshop/participate in association meeting(s) for commercial, industrial, and institutional (CII; public) customer group(s).
Continue partnerships to spread conservation message.
Participate in Wisconsin Conservation Coalition and business alliance on events.
Work with local college(s) on additional water resources/conservation programs and course projects.
Host annual conservation awards breakfast.
Continue school programs and tours.
Continue collaboration with other stakeholder groups.
Hold Teach the Teacher workshop(s) and reduce staff time spent in schools and on tours.
Hold irrigator training workshop.
Hold workshop/participate in association meeting(s) for CII customer group(s).
Continue partnerships to spread conservation message.
Participate in Wisconsin Conservation Coalition and business alliance on events.
Work with local college(s) on additional water resources/conservation programs and course projects.
Host annual conservation awards breakfast.
Rebates and Incentives: Residential
Provide $100 HET rebate and publicize program.
Plan and initiate showerhead rebate/distribution program.
Revamp applications and information packets.
Develop plan for onsite residential audits for public housing and large irrigation users.
Continue HET rebate, showerhead rebate/distribution, and water use audits.
Develop online water use calculator and self-audit tool.
Publicize sprinkler rebate program and plan strategic communication plan focused on landscaping, such as WWU newsletter articles, Web site information, presentations, and press releases.
Conduct onsite irrigation audits for large users.
Continue HET rebate, showerhead rebate/distribution, and water use audits.
Continue existing rebate programs.
Continue HET rebate, showerhead rebate/distribution, and water use audits.
Hold HET distribution event to distribute a target number of toilets in 1 day.
Continue HET rebate, showerhead rebate/distribution, and water use audits.
Rebates and Incentives: CII Expand HET rebate program to include commercial and light industrial customers.
Meet with colleges and hospitals to begin program design.
Continue HET rebate, commercial audits, and sprinkler program.
Initiate showerhead rebate/installation program.
Continue HET rebate, commercial audits, and sprinkler program.
Continue showerhead rebate/installation program.
Continue HET rebate, commercial audits, and sprinkler program.
Continue showerhead rebate/installation program.
Continue HET rebate, commercial audits, and sprinkler program.
Continue showerhead rebate/installation program.
WAUKESHA WATER CONSERVATION PLAN
XII WBG010912212935MKE
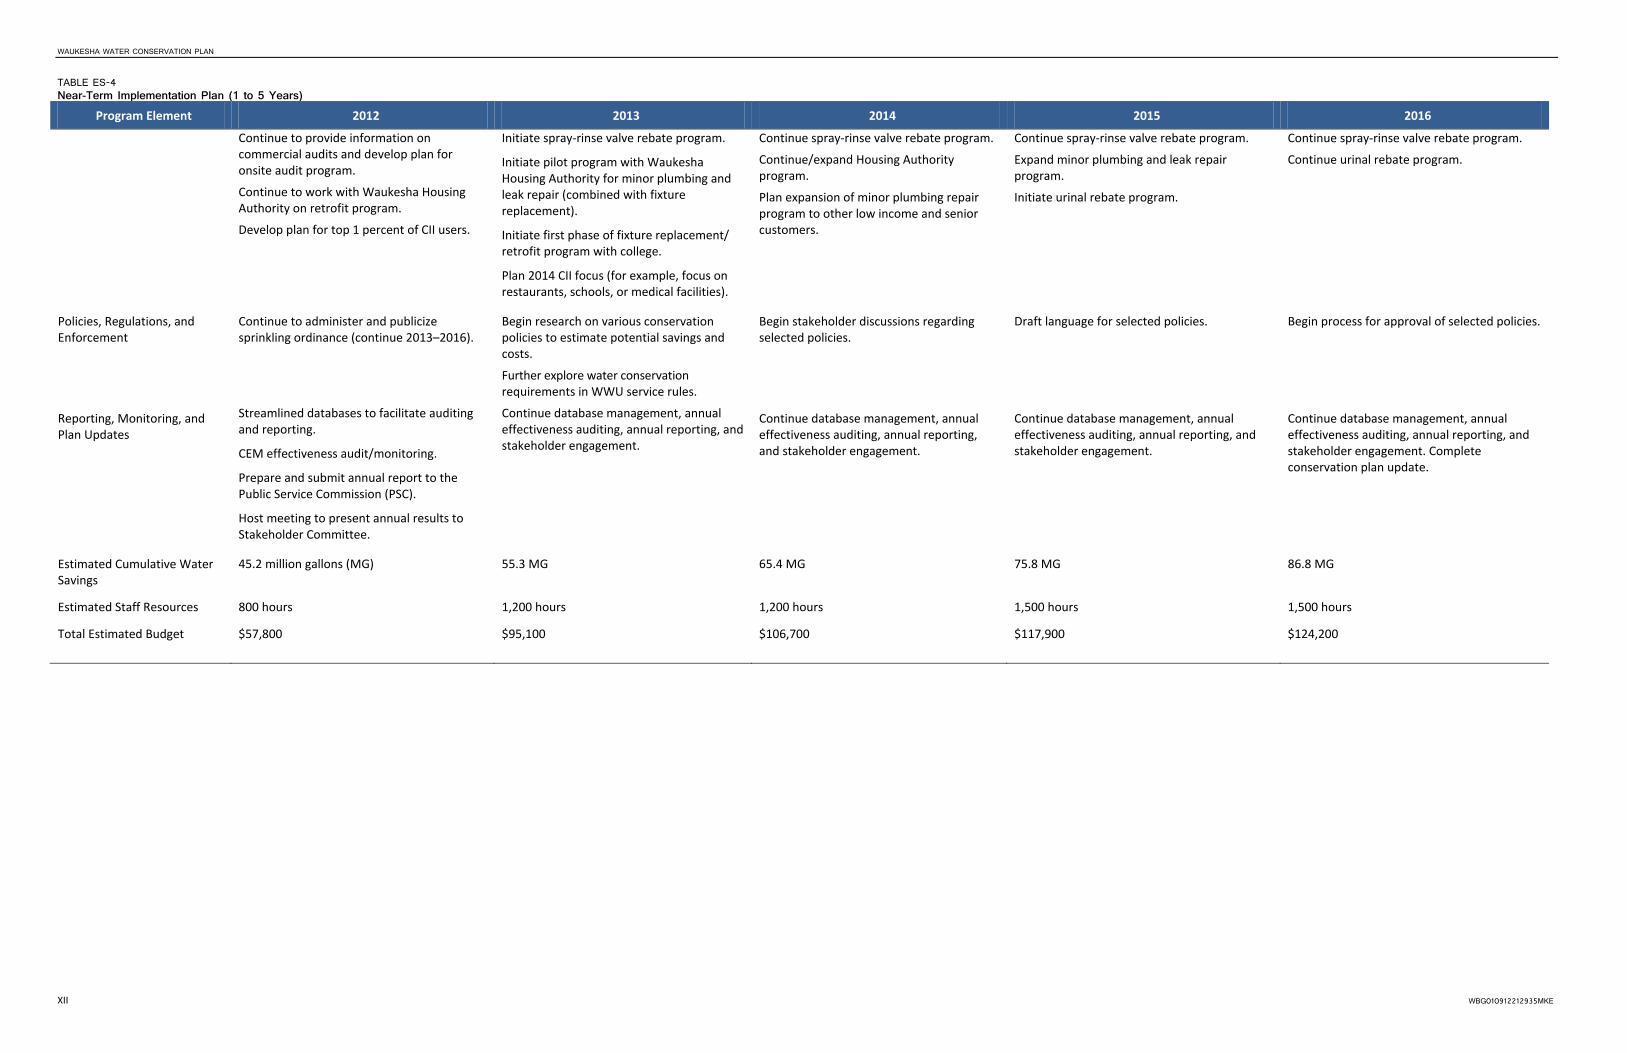
TABLE ES-4 Near-Term Implementation Plan (1 to 5 Years)
Program Element 2012 2013 2014 2015 2016
Continue to provide information on commercial audits and develop plan for onsite audit program.
Continue to work with Waukesha Housing Authority on retrofit program.
Develop plan for top 1 percent of CII users.
Initiate spray-rinse valve rebate program.
Initiate pilot program with Waukesha Housing Authority for minor plumbing and leak repair (combined with fixture replacement).
Initiate first phase of fixture replacement/ retrofit program with college.
Plan 2014 CII focus (for example, focus on restaurants, schools, or medical facilities).
Continue spray-rinse valve rebate program.
Continue/expand Housing Authority program.
Plan expansion of minor plumbing repair program to other low income and senior customers.
Continue spray-rinse valve rebate program.
Expand minor plumbing and leak repair program.
Initiate urinal rebate program.
Continue spray-rinse valve rebate program.
Continue urinal rebate program.
Policies, Regulations, and Enforcement
Continue to administer and publicize sprinkling ordinance (continue 2013–2016).
Begin research on various conservation policies to estimate potential savings and costs.
Further explore water conservation requirements in WWU service rules.
Begin stakeholder discussions regarding selected policies.
Draft language for selected policies. Begin process for approval of selected policies.
Reporting, Monitoring, and Plan Updates
Streamlined databases to facilitate auditing and reporting.
CEM effectiveness audit/monitoring.
Prepare and submit annual report to the Public Service Commission (PSC).
Host meeting to present annual results to Stakeholder Committee.
Continue database management, annual effectiveness auditing, annual reporting, and stakeholder engagement.
Continue database management, annual effectiveness auditing, annual reporting, and stakeholder engagement.
Continue database management, annual effectiveness auditing, annual reporting, and stakeholder engagement.
Continue database management, annual effectiveness auditing, annual reporting, and stakeholder engagement. Complete conservation plan update.
Estimated Cumulative Water Savings
45.2 million gallons (MG) 55.3 MG 65.4 MG 75.8 MG 86.8 MG
Estimated Staff Resources 800 hours 1,200 hours 1,200 hours 1,500 hours 1,500 hours
Total Estimated Budget $57,800 $95,100 $106,700 $117,900 $124,200
WBG010912212935MKE XIII
Contents Acknowledgements ............................................................................................................................................ iii
Executive Summary ............................................................................................................................................. v Introduction ...................................................................................................................................................... v Water Conservation Goals and Objectives ....................................................................................................... v Key Elements of the Plan ................................................................................................................................. vi
Evaluation of conservation measures................................................................................................. vi Benefit-Cost Analysis .......................................................................................................................... vi
Recommended Implementation Plan ............................................................................................................. vii
Acronyms and Abbreviations ............................................................................................................................ xvii
1.0 Introduction ......................................................................................................................................... 1-1 1.1 Purpose ............................................................................................................................................ 1-1 1.2 Background ...................................................................................................................................... 1-1 1.3 Drivers for Water Conservation ....................................................................................................... 1-1 1.4 City Water System and Service Area ............................................................................................... 1-2
1.4.1 Current Water System ........................................................................................................ 1-2 1.4.2 Water Supply Service Area ................................................................................................. 1-2 1.4.3 Water Conservation Applied Across the Water Service Area ............................................ 1-3
2.0 City Goals and Objectives ..................................................................................................................... 2-1 2.1 Conservation Background ................................................................................................................ 2-1 2.2 Goals and Objectives ....................................................................................................................... 2-1
3.0 Planning Approach ............................................................................................................................... 3-1 3.1 Project Team .................................................................................................................................... 3-1 3.2 Water Conservation Planning by the City ........................................................................................ 3-1
3.2.1 Research, Goal Setting, and Potential CEM Identification ................................................. 3-1 3.2.2 Evaluation and Planning ..................................................................................................... 3-1 3.2.3 Implementation .................................................................................................................. 3-2 3.2.4 Monitoring .......................................................................................................................... 3-2 3.2.5 Updating ............................................................................................................................. 3-2
4.0 Water Use and Customer Profile .......................................................................................................... 4-1 4.1 Historical Water Use ........................................................................................................................ 4-1
4.1.1 Water Use Audit ................................................................................................................. 4-2 4.1.2 Nonrevenue Water ............................................................................................................. 4-3 4.1.3 Metered Water Customers ................................................................................................. 4-3
4.2 Variations in Customer Demand ...................................................................................................... 4-4 4.2.1 Seasonal Variation in Water Demand................................................................................. 4-4 4.2.2 Water Demand Variation with Precipitation ...................................................................... 4-4 4.2.3 Water Demand Variation due to Economic Conditions ..................................................... 4-5 4.2.4 Diurnal Variation in Customer Demand ............................................................................. 4-5
4.3 Water Use Analysis Findings and Assessment ................................................................................. 4-6 4.3.1 Per Capita Water Use ......................................................................................................... 4-6 4.3.2 Percentile Analysis of Customer Water Use ....................................................................... 4-7
4.4 Water Demand Forecasts .............................................................................................................. 4-18
WAUKESHA WATER CONSERVATION PLAN
XIV WBG010912212935MKE
5.0 Conservation and Efficiency Measures ................................................................................................. 5-1 5.1 Conservation and Efficiency Measures, NR 852 Table 1 ................................................................. 5-1
5.1.1 PWS-1, Water Use Audit ..................................................................................................... 5-1 5.1.2 PWS-2, Leak Detection and Repair Program ...................................................................... 5-2 5.1.3 PWS-3, Information and Education Outreach .................................................................... 5-2 5.1.4 PWS-4, Source Measurement ............................................................................................. 5-3
5.2 Conservation and Efficiency Measures, NR 852 Table 2 ................................................................. 5-3 5.2.1 PWS-R1, Distribution System Pressure Management ........................................................ 5-4 5.2.2 PWS-R2, Residential Demand Management Program ....................................................... 5-4 5.2.3 PWS-R3, Commercial and Industrial Demand Management Program ............................... 5-5 5.2.4 PWS-R4, Water Reuse ......................................................................................................... 5-5
5.3 Potential CEMs ................................................................................................................................. 5-6 5.3.1 Infrastructure Management ............................................................................................... 5-6 5.3.2 Public Information and Education and School Education .................................................. 5-6 5.3.3 Customer Demand Management Measures and Incentives .............................................. 5-6 5.3.4 Residential Measures ......................................................................................................... 5-6 5.3.5 Commercial, Industrial, and Institutional Measures (includes Public Customers) ............. 5-7 5.3.6 Policies and Regulation ....................................................................................................... 5-7
6.0 Stakeholder Input and CEM Evaluation ................................................................................................ 6-1 6.1 Initial Screening of CEMs ................................................................................................................. 6-1 6.2 Stakeholder Input ............................................................................................................................ 6-1
6.2.1 Stakeholder Committee ...................................................................................................... 6-1 6.2.2 Stakeholder Interviews ....................................................................................................... 6-6 6.2.3 Conservation Awareness Surveys ....................................................................................... 6-6
6.3 CEM Cost-effectiveness with AWE Tool .......................................................................................... 6-7 6.4 AWE Tool Results ............................................................................................................................. 6-7
7.0 Recommended Program CEMs ............................................................................................................. 7-1 7.1 Context for Conservation Recommendations ................................................................................. 7-1
7.1.1 Opportunities for Conservation .......................................................................................... 7-1 7.1.2 Potential Challenges for Conservation Program ................................................................ 7-2
7.2 Water Utility and Other Municipal Infrastructure ........................................................................... 7-2 7.3 Public Education and Information ................................................................................................... 7-2 7.4 Rebates and Other Incentives ......................................................................................................... 7-3
7.4.1 Residential Incentives ......................................................................................................... 7-4 7.4.2 Commercial, Industrial, and Institutional (Public) Incentives ............................................. 7-4 7.4.3 Partnerships ........................................................................................................................ 7-5 7.4.4 Data Collection and Evaluation ........................................................................................... 7-5
7.5 Policies, Regulation, and Governance ............................................................................................. 7-5 7.5.1 New Construction ............................................................................................................... 7-5 7.5.2 Waste Prevention and Leak Repair .................................................................................... 7-5 7.5.3 Billing and Pricing ............................................................................................................... 7-6 7.5.4 Enforcement ....................................................................................................................... 7-6 7.5.5 Other Policies for Consideration in the Long Term ............................................................ 7-6
7.6 Other Recommendations ................................................................................................................ 7-6 7.6.1 Annual Reporting ................................................................................................................ 7-6 7.6.2 Monitoring Plan .................................................................................................................. 7-6 7.6.3 Updating Conservation Plan ............................................................................................... 7-7
8.0 Recommended Plan ............................................................................................................................. 8-1 8.1 Projected Water Savings .................................................................................................................. 8-1
CONTENTS
WBG010912212935MKE XV
8.2 Other Projected Benefits ................................................................................................................. 8-2 8.3 Benefit-Cost Analysis ....................................................................................................................... 8-2 8.4 Projected Program Costs ................................................................................................................. 8-3 8.5 Recommended Implementation Schedule ...................................................................................... 8-4
9.0 References ........................................................................................................................................... 9-1 Tables
ES-1 Target Water Savings from Conservation and Water Use Efficiency ............................................................... v ES-2 Summary of B:C Ratio and Projected Water Savings ...................................................................................... vii ES-3 Estimated Costs—Water Conservation Program .......................................................................................... viii ES-4 Near-Term Implementation Plan (1 to 5 Years) .............................................................................................. xi 4-1 City of Waukesha Historical Annual Water Consumption ............................................................................ 4-1 4-2 City of Waukesha Maximum and Average Daily Flow, 1999–2010 .............................................................. 4-6 4-3 City of Waukesha Categorical and Average Customer Water Use Characteristics, 2008–2010 .................. 4-8 4-4 Combined All Seven Customer Categories: Water Use Characteristics, By Percentile, 2008–2010 ............ 4-9 4-5 Residential (Single-Family) Customers' Water Use Characteristics, By Percentile, 2008–2010 ................. 4-11 4-6 Residential (Two-Family) Customers' Water Use Characteristics, By Percentile, 2008–2010 ................... 4-12 4-7 Residential (Three-Family) Customers' Water Use Characteristics, By Percentile, 2008–2010 ................. 4-13 4-8 Residential (Multi-Family) Customers' Water Use Characteristics, By Percentile, 2008–2010 .................. 4-15 4-9 Commercial Customers' Water Use Characteristics, By Percentile, 2008–2010 ........................................ 4-16 4-10 Industrial Customers' Water Use Characteristics, By Percentile, 2008–2010 ............................................ 4-17 4-11 Public Customers' Water Use Characteristics, By Percentile, 2008–2010 ................................................. 4-18 6-1 Water Conservation and Efficiency Measures Evaluation Criteria ............................................................... 6-2 6-2 Indoor Measures for Residential Customers ................................................................................................ 6-3 6-3 Outdoor Measures for Residential and Commercial, Industrial and Institutional Customers ..................... 6-4 6-4 Indoor Measures for Industrial and Institutional Customers ....................................................................... 6-4 6-5 Potential Policies and Miscellaneous Measures ........................................................................................... 6-5 6-6 Summary of Benefit-Cost Ratio and Projected Water Savings ..................................................................... 6-7 7-1 Recommended Priorities for Various Customer Categories Based on Rank and Percentile Analysis .......... 7-1 8-1 Total Projected Cumulative Water Savings (million gallons per year) ......................................................... 8-1 8-2 Estimated Savings from Utility-Avoided Costs.............................................................................................. 8-2 8-3 Summary of Benefit-Cost Ratio and Projected Water Savings ..................................................................... 8-3 8-4 Estimated Costs—Water Conservation Program ......................................................................................... 8-4 8-5 Near-Term Implementation Plan (1 to 5 Years) ........................................................................................... 8-7
Figures
ES-1 Water Conservation Planning Process ............................................................................................................. vi ES-2 Water Savings Goal and Projected Water Savings ........................................................................................ viii 1-1 Major Utility Assets ....................................................................................................................................... 1-2 1-2 City of Waukesha Water Supply Service Area .............................................................................................. 1-4 1-3 Water Supply Service Area Plan Population Projections .............................................................................. 1-5 3-1 Water Conservation Planning Process .......................................................................................................... 3-1 4-1 City of Waukesha Water Use (2010) ............................................................................................................. 4-1 4-2 City of Waukesha Water Audit Summary ..................................................................................................... 4-2 4-3 City of Waukesha Metered Water Accounts (2010) ..................................................................................... 4-3 4-4 City of Waukesha Seasonal Water Use in 2005 and 2010 ............................................................................ 4-4 4-5 City of Waukesha Annual Water Pumping and Precipitation ....................................................................... 4-5 4-6 City of Waukesha Per Capita Per Day Water Use (2010) .............................................................................. 4-7 4-7 Water Demand Forecasts ........................................................................................................................... 4-19

WAUKESHA WATER CONSERVATION PLAN
XVI WBG010912212935MKE
6-1 Projected Water Savings .............................................................................................................................. 6-9 8-1 Projected Water Savings ............................................................................................................................... 8-2
Appendixes
A Summary of Water Requirements B City PSC Compliance Status C System Pressure Management D Water Use Audit E CEM Summary F Long-term CEM Implementation G AWE Tool Output

WBG010912212935MKE XVII
Acronyms and Abbreviations
AWE Alliance for Water Efficiency
AWE Tool Alliance for Water Efficiency Water Conservation Tracking Tool
AWWA American Water Works Association
B:C benefit to cost
CEM Conservation and Efficiency Measure
CII commercial, industrial, and institutional (public)
City City of Waukesha
gal/day gallons per day
gpcd gallons per capita per day
HET high-efficiency toilet
ILI infrastructure leakage index
MG million gallons
mgd million gallons per day
NAICS North American Industry Classification System
NR 852 Wisconsin Administrative Code Chapter NR 852
Plan Water Conservation Plan and Protection Plan
PSC Public Service Commission
psi pounds per square inch
PWS public water supply
SEWRPC Southeastern Wisconsin Regional Planning Commission
TIRL technical indicator for real losses
USEPA United States Environmental Protection Agency
WDNR Wisconsin Department of Natural Resources
WWU Waukesha Water Utility

WBG010912212935MKE 1-1
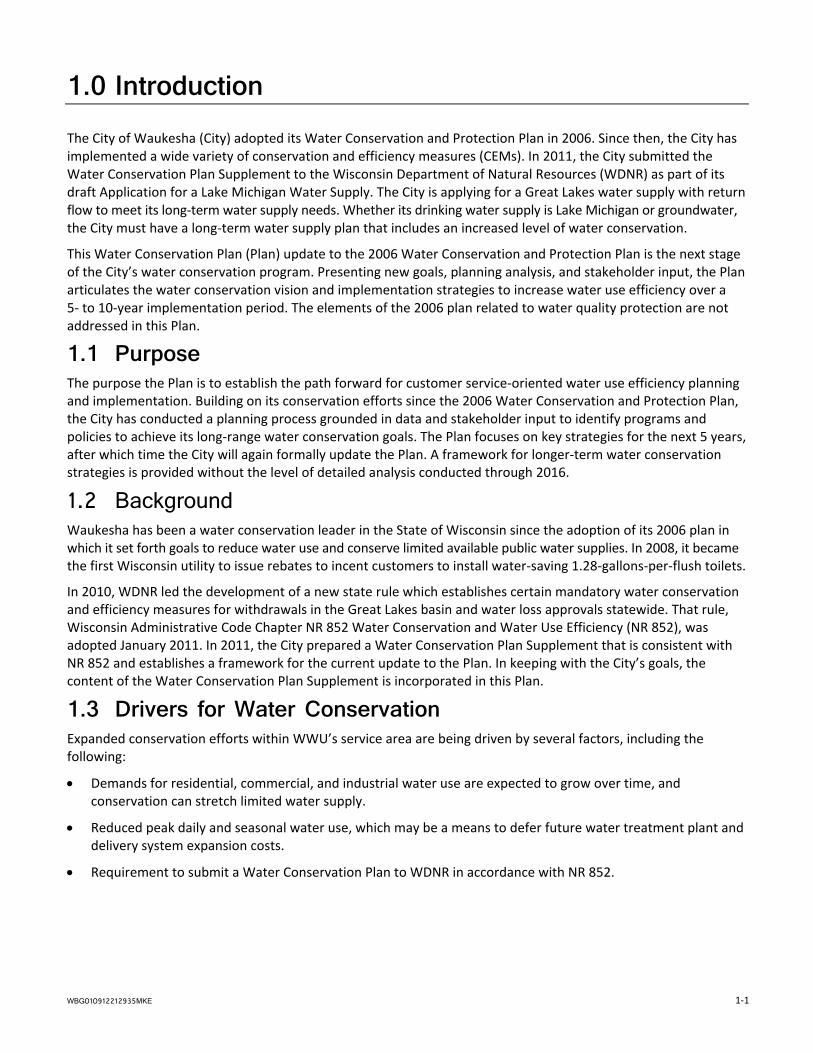
1.0 Introduction The City of Waukesha (City) adopted its Water Conservation and Protection Plan in 2006. Since then, the City has implemented a wide variety of conservation and efficiency measures (CEMs). In 2011, the City submitted the Water Conservation Plan Supplement to the Wisconsin Department of Natural Resources (WDNR) as part of its draft Application for a Lake Michigan Water Supply. The City is applying for a Great Lakes water supply with return flow to meet its long-term water supply needs. Whether its drinking water supply is Lake Michigan or groundwater, the City must have a long-term water supply plan that includes an increased level of water conservation.
This Water Conservation Plan (Plan) update to the 2006 Water Conservation and Protection Plan is the next stage of the City’s water conservation program. Presenting new goals, planning analysis, and stakeholder input, the Plan articulates the water conservation vision and implementation strategies to increase water use efficiency over a 5- to 10-year implementation period. The elements of the 2006 plan related to water quality protection are not addressed in this Plan.
1.1 Purpose The purpose the Plan is to establish the path forward for customer service-oriented water use efficiency planning and implementation. Building on its conservation efforts since the 2006 Water Conservation and Protection Plan, the City has conducted a planning process grounded in data and stakeholder input to identify programs and policies to achieve its long-range water conservation goals. The Plan focuses on key strategies for the next 5 years, after which time the City will again formally update the Plan. A framework for longer-term water conservation strategies is provided without the level of detailed analysis conducted through 2016.
1.2 Background Waukesha has been a water conservation leader in the State of Wisconsin since the adoption of its 2006 plan in which it set forth goals to reduce water use and conserve limited available public water supplies. In 2008, it became the first Wisconsin utility to issue rebates to incent customers to install water-saving 1.28-gallons-per-flush toilets.
In 2010, WDNR led the development of a new state rule which establishes certain mandatory water conservation and efficiency measures for withdrawals in the Great Lakes basin and water loss approvals statewide. That rule, Wisconsin Administrative Code Chapter NR 852 Water Conservation and Water Use Efficiency (NR 852), was adopted January 2011. In 2011, the City prepared a Water Conservation Plan Supplement that is consistent with NR 852 and establishes a framework for the current update to the Plan. In keeping with the City’s goals, the content of the Water Conservation Plan Supplement is incorporated in this Plan.
1.3 Drivers for Water Conservation Expanded conservation efforts within WWU’s service area are being driven by several factors, including the following:
• Demands for residential, commercial, and industrial water use are expected to grow over time, and conservation can stretch limited water supply.
• Reduced peak daily and seasonal water use, which may be a means to defer future water treatment plant and delivery system expansion costs.
• Requirement to submit a Water Conservation Plan to WDNR in accordance with NR 852.

WAUKESHA WATER CONSERVATION PLAN
1-2 WBG010912212935MKE
1.4 City Water System and Service Area 1.4.1 Current Water System The City of Waukesha water system includes groundwater supply, treatment, storage, and conveyance assets, which are summarized Figure 1-1 and described in detail in the City of Waukesha Water Supply Service Area Plan. The water system has a total capacity of 17.9 million gallons per day (mgd).
FIGURE 1-1 Major Utility Assets
1.4.2 Water Supply Service Area The City presently provides water service to the City of Waukesha and limited properties that are located outside the city limits. For long-range water supply planning, the Southeastern Regional Planning Commission (SEWRPC) delineated the City of Waukesha water supply service area that includes nearby parts of neighboring communities. The water supply service area includes 3.7 percent of the City of Pewaukee, 9 percent of the Town of Delafield, 14.9 percent of the Town of Genesee, and 83.6 percent of the Town of Waukesha. One reason the areas are candidates for future municipal water service is because of past private well contamination by pathogens, pollution, and naturally occurring elements in the groundwater. If there is a need and a request for public water service, the City’s municipal water system may be expanded to serve the areas that are currently served by private wells and septic systems. To the extent practical, the water supply service area is consistent with the City’s delineated sewer service area.
The City of Waukesha water supply service area shown in Figure 1-2 represents the full development land use, envisioned in the Waukesha County Comprehensive Plan. Full development, or buildout, condition is projected to occur sometime around 2050, based on historical state population trends. SEWRPC prepared population projections for the water supply service area including 85,800 people in 2028, 88,500 people in 2035, and an ultimate buildout population of 97,400 people (Figure 1-3). The projections are based on municipal estimates from the State of Wisconsin Department of Administration and multiple planning factors, including but not limited to land use, household size, demographic trends, and community development plans.

1.0—INTRODUCTION
WBG010912212935MKE 1-3
1.4.3 Water Conservation Applied Across the Water Service Area The water conservation measures implemented by the City apply to its customers, whether they are located within city limits or not. Under current water service rules regulated by the Wisconsin Public Service Commission (PSC), all customers are subject to the City’s conservation measures, including the water rate schedule, outdoor water use restrictions, and financial incentives to install water-saving toilets. If water service is extended to areas outside the City, customers will be required to adhere to the City’s conservation program as established in the service rules as well as in future service contracts. The City will provide water conservation public education to new customers and make available information, services and incentives to help its customers use water wisely.

WAUKESHA WATER CONSERVATION PLAN
1-4 WBG010912212935MKE
FIGURE 1-2
City of Waukesha Water Supply Service Area

1.0—INTRODUCTION
WBG010912212935MKE 1-5
FIGURE 1-3 Water Supply Service Area Plan Population Projections


WBG010912212935MKE 2-1
2.0 City Goals and Objectives
2.1 Conservation Background The City has demonstrated its commitment to conservation. Since the adoption of the 2006 Conservation Plan, the City has successfully advanced various water conservation measures through public information and education, regulations like the City ordinance to restrict outdoor water use, the inclining block water rate structure that encourages conservation, collaborative partnerships, and incentive programs. Water use in the City has been reduced, in part, because of the measures. Other factors that influence water use include weather, economic conditions, changes in population, and changes in industrial and commercial customers served. Reduced water use is illustrated by the following aggregate metrics:
• Between the base year of 2005 and 20101, total water pumped from wells was reduced 14.0 percent.2
• Between 2005 and 2010, peak season pumping (May 1 to October 1) was reduced 19.4 percent.
3
• Since 2005, declining water use reduced the number of days water demand exceeded 10 mgd from 28 days to zero. The City has an operational goal to pump 10 mgd or less, to help meet its radium compliance order and stipulation.
4
• Residential customers who have replaced a toilet in conjunction with the City’s rebate program are estimated to be saving an average of 9,000 to 11,000 gallons per year depending on household size.
5
• By regulation, the City annually submits detailed information on the performance and costs of its conservation program to the PSC.
2.2 Goals and Objectives The City’s water conservation goals include the following:
• Reducing average day demand by 0.5 mgd by year 2030 and by 1.0 mgd by year 2050. The water savings represent 5 and 10 percent water savings in average day demand, respectively, of projected baseline (not conservation-related) water demands between 2010 and 2050.
Objectives for the planning process used in the development of this Plan include the following:
• Developing planning analysis and implementation time lines in a manner consistent with NR 852 and the SEWRPC 2035 Regional Water Supply Plan
• Leveraging lessons learned from implementation of existing City CEMs
• Incorporating stakeholder and customer input in the evaluation of CEMs
• To the extent practical, using the Alliance for Water Efficiency (AWE) Water Conservation Tracking Tool (AWE Tool) to estimate CEM cost-effectiveness
1 2010 data represents the most recent complete year of City performance data. 2 Annual Reports of City of Waukesha Water Utility to the Public Service Commission of Wisconsin, 2005–2010. 3 City peak season water pumping data, May through September, 2005–2010. 4 Waukesha Water Utility Report on Water Conservation Programs to the Public Service Commission of Wisconsin, 2010. 5 Ibid.

WBG010912212935MKE 3-1
3.0 Planning Approach
3.1 Project Team From the City Common Council to the Water Utility Commission and throughout the dedicated Waukesha Water Utility staff, the City has demonstrated its commitment to efficient water use. The project team for this planning effort was led by Waukesha Water Utility’ s conservation team with support from a consulting team of local and national experts that supported the stakeholder involvement effort and provided technical analyses.
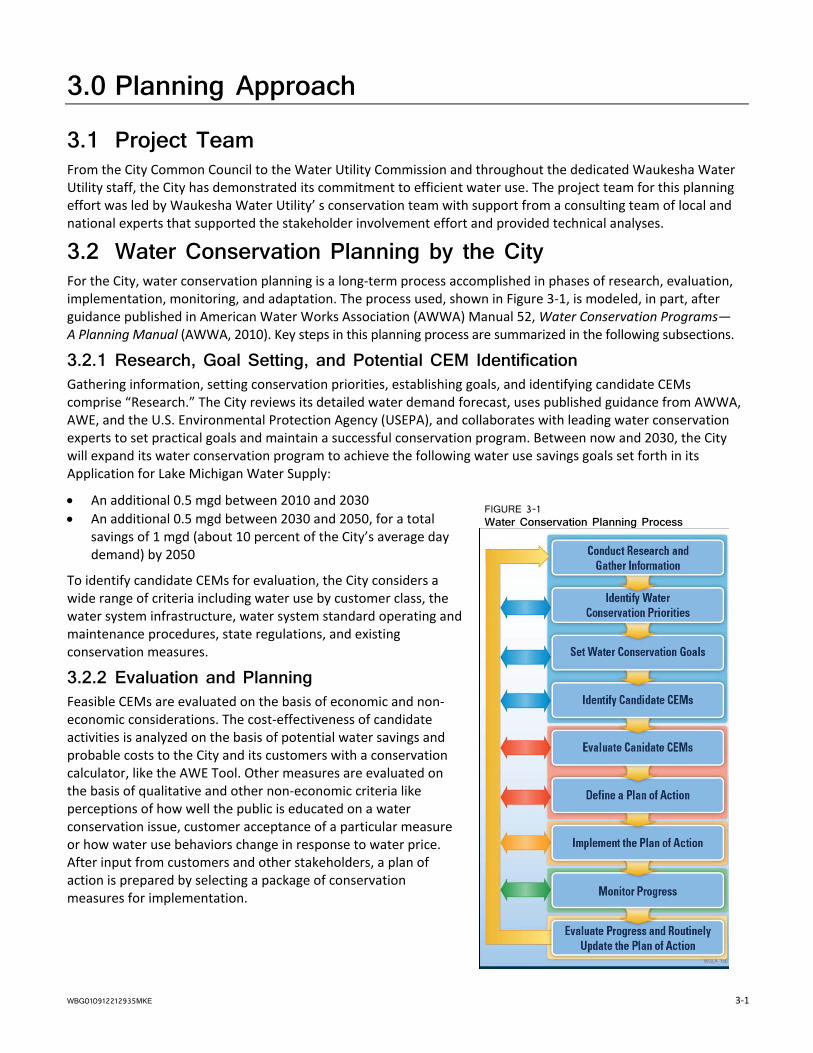
3.2 Water Conservation Planning by the City For the City, water conservation planning is a long-term process accomplished in phases of research, evaluation, implementation, monitoring, and adaptation. The process used, shown in Figure 3-1, is modeled, in part, after guidance published in American Water Works Association (AWWA) Manual 52, Water Conservation Programs—A Planning Manual (AWWA, 2010). Key steps in this planning process are summarized in the following subsections.
3.2.1 Research, Goal Setting, and Potential CEM Identification Gathering information, setting conservation priorities, establishing goals, and identifying candidate CEMs comprise “Research.” The City reviews its detailed water demand forecast, uses published guidance from AWWA, AWE, and the U.S. Environmental Protection Agency (USEPA), and collaborates with leading water conservation experts to set practical goals and maintain a successful conservation program. Between now and 2030, the City will expand its water conservation program to achieve the following water use savings goals set forth in its Application for Lake Michigan Water Supply:
• An additional 0.5 mgd between 2010 and 2030 • An additional 0.5 mgd between 2030 and 2050, for a total
savings of 1 mgd (about 10 percent of the City’s average day demand) by 2050
To identify candidate CEMs for evaluation, the City considers a wide range of criteria including water use by customer class, the water system infrastructure, water system standard operating and maintenance procedures, state regulations, and existing conservation measures.
3.2.2 Evaluation and Planning Feasible CEMs are evaluated on the basis of economic and non-economic considerations. The cost-effectiveness of candidate activities is analyzed on the basis of potential water savings and probable costs to the City and its customers with a conservation calculator, like the AWE Tool. Other measures are evaluated on the basis of qualitative and other non-economic criteria like perceptions of how well the public is educated on a water conservation issue, customer acceptance of a particular measure or how water use behaviors change in response to water price. After input from customers and other stakeholders, a plan of action is prepared by selecting a package of conservation measures for implementation.
FIGURE 3-1 Water Conservation Planning Process
WAUKESHA WATER CONSERVATION PLAN
3-2 WBG010912212935MKE
3.2.3 Implementation Ultimately, the City gains approval for CEM implementation through review by the Water Utility Commission and, if appropriate, with the City Common Council. Whenever possible, the City partners with other organizations like the Wisconsin Water Conservation Coalition, the Waukesha school district or Wisconsin Focus on Energy to implement measures as economically as possible.
Successful performance of the City’s conservation program is achieved when water use efficiency is improved in a cost-effective manner while customers’ needs are met. Implementing CEMs in a stepwise manner provides the City flexibility to monitor and make improvements to the program as needed in response to changing consumption patterns, technology, and customer expectations. Additionally, multi-year forecasting allows the City to plan for changes in revenues and expenditures associated with water demand reductions.
3.2.4 Monitoring To monitor the real costs and water savings that result from implementing CEMs, the City continually gathers and reviews extensive water use and financial data. To determine the overall effectiveness of CEMs, the City solicits feedback from customers. Monitoring the results of water conservation efforts is a part of routine City operations. Annually, the City reports a detailed analysis of the water conservation program to the PSC.
3.2.5 Updating At least annually, CEMs in the City’s water conservation program will be reviewed and modified, as appropriate, to improve performance. In this process, the City will accomplish the following:
• Identify efficiency measures and performance goals based on extensive research. • Communicate the City’s vision for water use efficiency to customers. • Educate customers, using a broad spectrum of media, about the costs and benefits of water conservation. • Implement measures that provide monetary benefits and water use savings. • Make informed decisions about needed changes to the conservation program based on measured water use
and customer feedback.
WBG010912212935MKE 4-1
4.0 Water Use and Customer Profile Data on historical water use, population projections, regional county, and City land use plans, as well as water conservation and efficiency goals, were used to prepare water supply service area water demand forecasts. For water use efficiency measures to be effective, the City uses the data and information to design elements of its water conservation program.
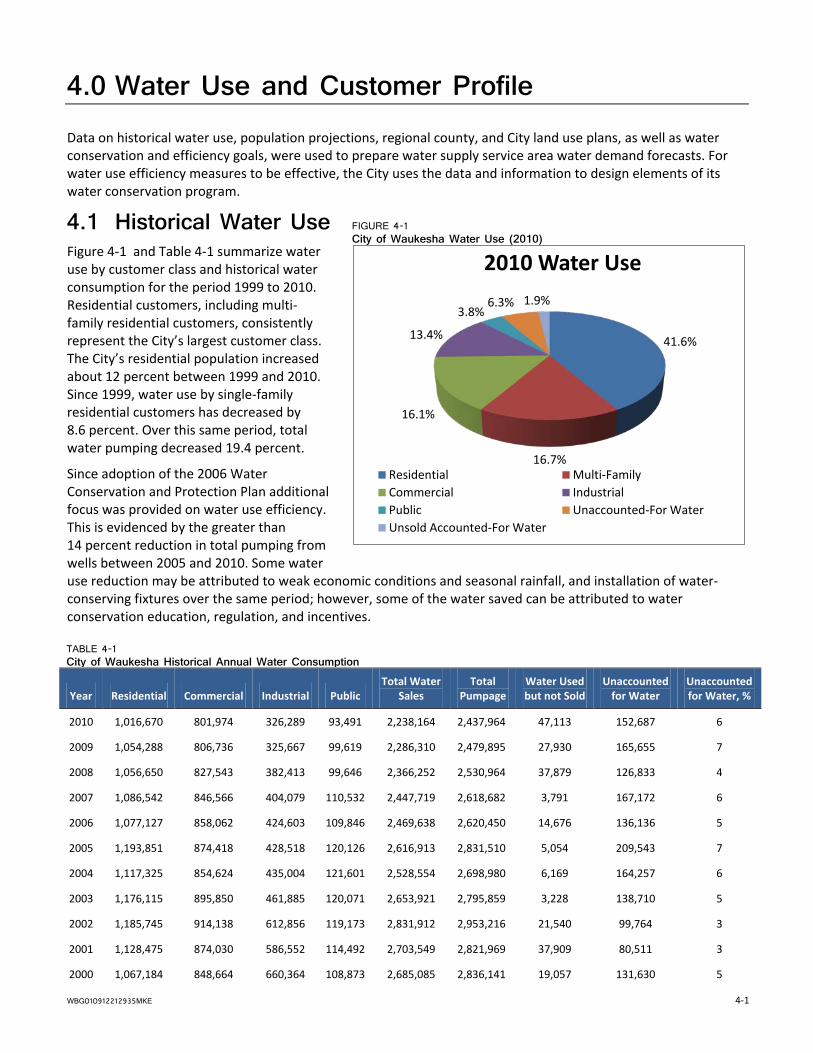
4.1 Historical Water Use Figure 4-1 and Table 4-1 summarize water use by customer class and historical water consumption for the period 1999 to 2010. Residential customers, including multi-family residential customers, consistently represent the City’s largest customer class. The City’s residential population increased about 12 percent between 1999 and 2010. Since 1999, water use by single-family residential customers has decreased by 8.6 percent. Over this same period, total water pumping decreased 19.4 percent.
Since adoption of the 2006 Water Conservation and Protection Plan additional focus was provided on water use efficiency. This is evidenced by the greater than 14 percent reduction in total pumping from wells between 2005 and 2010. Some water use reduction may be attributed to weak economic conditions and seasonal rainfall, and installation of water-conserving fixtures over the same period; however, some of the water saved can be attributed to water conservation education, regulation, and incentives.
TABLE 4-1 City of Waukesha Historical Annual Water Consumption
Year Residential Commercial Industrial Public Total Water
Sales Total
Pumpage Water Used but not Sold
Unaccounted for Water
Unaccounted for Water, %
2010 1,016,670 801,974 326,289 93,491 2,238,164 2,437,964 47,113 152,687 6
2009 1,054,288 806,736 325,667 99,619 2,286,310 2,479,895 27,930 165,655 7
2008 1,056,650 827,543 382,413 99,646 2,366,252 2,530,964 37,879 126,833 4
2007 1,086,542 846,566 404,079 110,532 2,447,719 2,618,682 3,791 167,172 6
2006 1,077,127 858,062 424,603 109,846 2,469,638 2,620,450 14,676 136,136 5
2005 1,193,851 874,418 428,518 120,126 2,616,913 2,831,510 5,054 209,543 7
2004 1,117,325 854,624 435,004 121,601 2,528,554 2,698,980 6,169 164,257 6
2003 1,176,115 895,850 461,885 120,071 2,653,921 2,795,859 3,228 138,710 5
2002 1,185,745 914,138 612,856 119,173 2,831,912 2,953,216 21,540 99,764 3
2001 1,128,475 874,030 586,552 114,492 2,703,549 2,821,969 37,909 80,511 3
2000 1,067,184 848,664 660,364 108,873 2,685,085 2,836,141 19,057 131,630 5
FIGURE 4-1 City of Waukesha Water Use (2010)
41.6%
16.7%
16.1%
13.4%
3.8% 6.3% 1.9%
2010 Water Use
Residential Multi-Family Commercial Industrial Public Unaccounted-For Water Unsold Accounted-For Water

WAUKESHA WATER CONSERVATION PLAN
4-2 WBG010912212935MKE
TABLE 4-1 City of Waukesha Historical Annual Water Consumption
Year Residential Commercial Industrial Public Total Water
Sales Total
Pumpage Water Used but not Sold
Unaccounted for Water
Unaccounted for Water, %
2010 1,016,670 801,974 326,289 93,491 2,238,164 2,437,964 47,113 152,687 6
2009 1,054,288 806,736 325,667 99,619 2,286,310 2,479,895 27,930 165,655 7
2008 1,056,650 827,543 382,413 99,646 2,366,252 2,530,964 37,879 126,833 4
1999 1,112,499 847,914 722,097 177,408 2,859,918 3,028,414 n/a 168,496 6
Note: Consumption volume values are given in 1,000s of gallons. Examples of “water used but not sold” include water used for main flushing, water treatment processes, and firefighting. Examples of “unaccounted for water” include water improperly measured because of meter inaccuracies and service connection leakage.
4.1.1 Water Use Audit In 2006, as part of its comprehensive Water System Master Plan, the City conducted a water use audit following the method developed by the International Water Association Water Loss Task Force and adopted in the latest version of the AWWA Manual of Water Supply Practices M36 Water Audits and Water Loss Control Programs. The results of the analysis are summarized in Appendix D6
• The City’s technical indicator for real losses (TIRL), a measure of the total volume of water losses in a distribution system, is 21 gallons per service connection, the fourth lowest among 34 communities surveyed with TIRL values ranging from 10 to 215 gallons per connection.
and include the following:
7
• The City’s infrastructure leakage index (ILI), a measure of how well a distribution system is managed with respect to real water loss from leakage, is approximately 1.3, significantly less than the average of 5 from among the communities surveyed.
8
The City prepared a less detailed water audit of 2010 system performance, presented in Figure 4-2.
FIGURE 4-2 City of Waukesha Water Audit Summary
6 Earth Tech. May 2006. Water System Master Plan, City of Waukesha. 7 A. Lambert, D. Huntington, and T.G. Brown. 2002. “Water Loss Management in North America: Just How Good Is It?” Water Loss Control Manual. 8 Ibid.
4.0—WATER USE AND CUSTOMER PROFILE
WBG010912212935MKE 4-3
4.1.2 Nonrevenue Water The difference between total pumpage and total water sales is termed nonrevenue water and is usually expressed as a percentage. The portion of nonrevenue water attributed to leakage, meter inaccuracies, and other unknown losses is often termed unaccounted-for water (or real losses) and can be an indicator of the condition of the water system. Between 1999 and 2010, the unaccounted-for water has ranged from 3 to 7 percent (Table 4-1). In 2010, unaccounted-for water was equivalent to 7 gallons per capita per day (gpcd). The City operates and maintains its water system to minimize unaccounted water well below the AWWA-recommended 10 percent and the PSC action level of 15 percent.
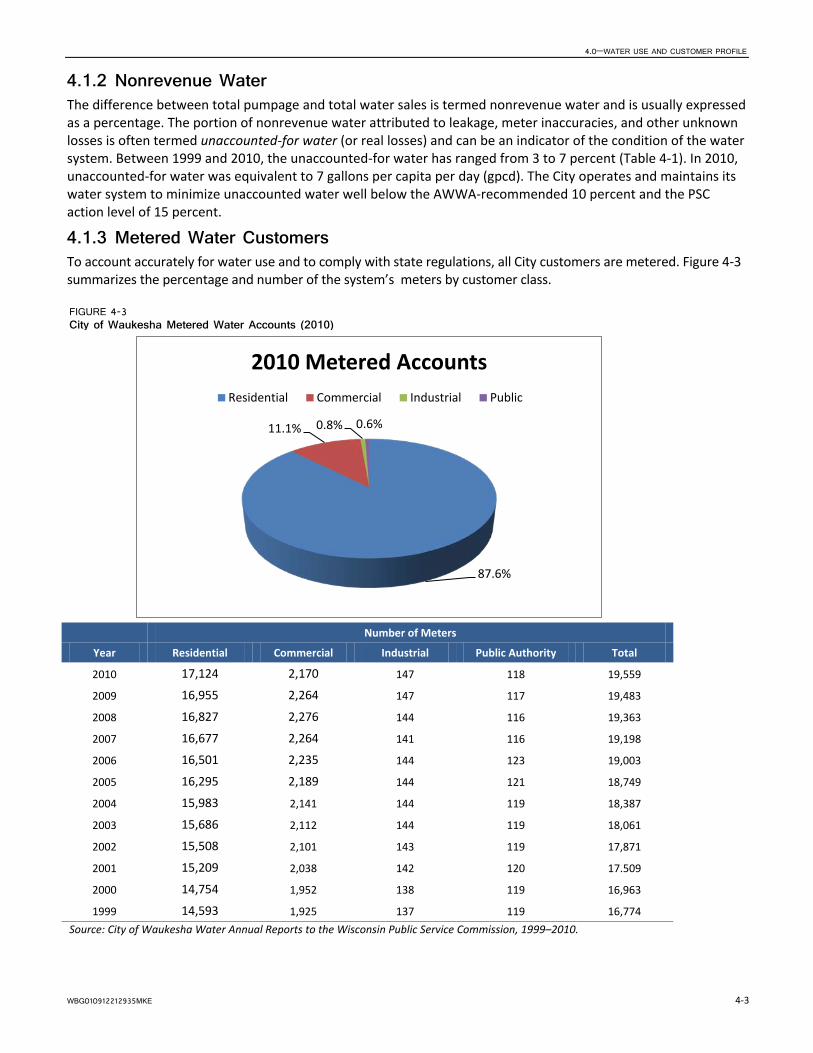
4.1.3 Metered Water Customers To account accurately for water use and to comply with state regulations, all City customers are metered. Figure 4-3 summarizes the percentage and number of the system’s meters by customer class.
FIGURE 4-3 City of Waukesha Metered Water Accounts (2010)
Year
Number of Meters
Residential Commercial Industrial Public Authority Total
2010 17,124 2,170 147 118 19,559
2009 16,955 2,264 147 117 19,483
2008 16,827 2,276 144 116 19,363
2007 16,677 2,264 141 116 19,198
2006 16,501 2,235 144 123 19,003
2005 16,295 2,189 144 121 18,749
2004 15,983 2,141 144 119 18,387
2003 15,686 2,112 144 119 18,061
2002 15,508 2,101 143 119 17,871
2001 15,209 2,038 142 120 17.509
2000 14,754 1,952 138 119 16,963
1999 14,593 1,925 137 119 16,774 Source: City of Waukesha Water Annual Reports to the Wisconsin Public Service Commission, 1999–2010.
87.6%
11.1% 0.8% 0.6%
2010 Metered Accounts Residential Commercial Industrial Public
WAUKESHA WATER CONSERVATION PLAN
4-4 WBG010912212935MKE
4.2 Variations in Customer Demand Water demand varies and is typically influenced by several factors including precipitation, temperature, economic conditions, personal income, and community conservation goals. While reductions in water use in wet and cool years or increases in water use associated with higher personal income may be observed, correlating how the factors affect one another is not a straightforward process. Quantification and disaggregation of the effect of variables such as weather (especially temperature and rainfall), economic conditions, and public awareness on water use require extensive data collection and analysis. Results of the City’s review of available water use-related data indicating trends that provide insights into long-range water demand forecasts are described below.
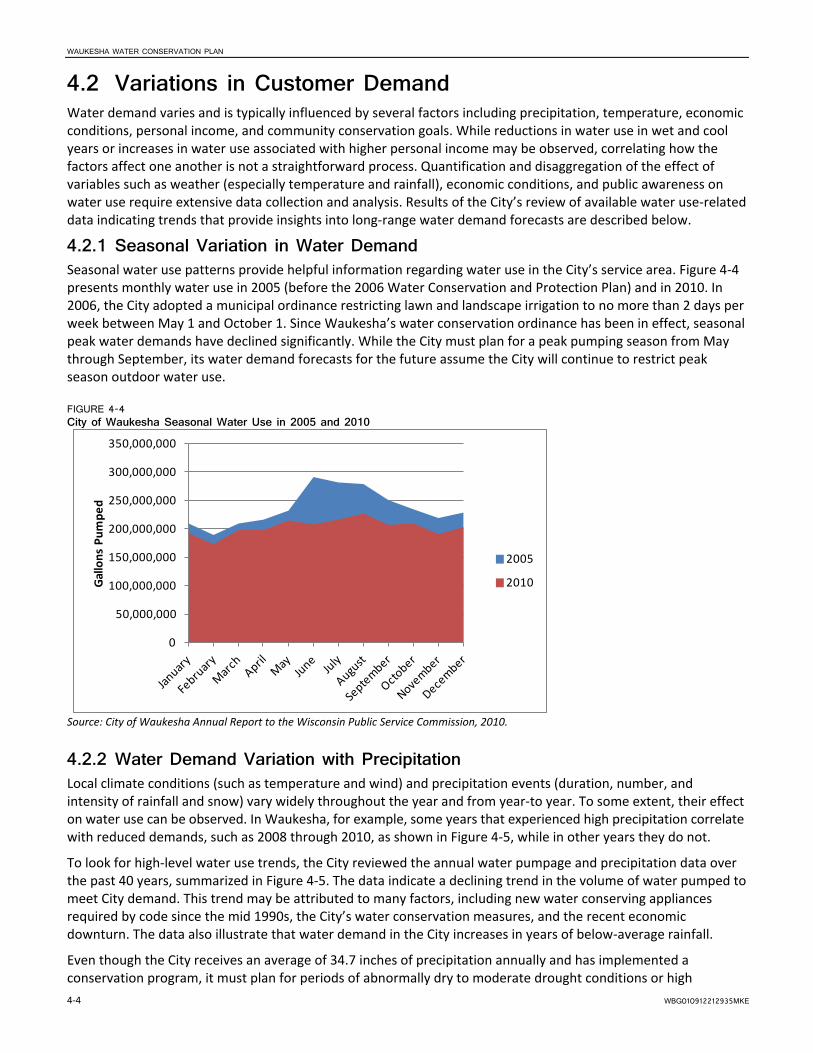
4.2.1 Seasonal Variation in Water Demand Seasonal water use patterns provide helpful information regarding water use in the City’s service area. Figure 4-4 presents monthly water use in 2005 (before the 2006 Water Conservation and Protection Plan) and in 2010. In 2006, the City adopted a municipal ordinance restricting lawn and landscape irrigation to no more than 2 days per week between May 1 and October 1. Since Waukesha’s water conservation ordinance has been in effect, seasonal peak water demands have declined significantly. While the City must plan for a peak pumping season from May through September, its water demand forecasts for the future assume the City will continue to restrict peak season outdoor water use.
FIGURE 4-4 City of Waukesha Seasonal Water Use in 2005 and 2010
Source: City of Waukesha Annual Report to the Wisconsin Public Service Commission, 2010.
4.2.2 Water Demand Variation with Precipitation Local climate conditions (such as temperature and wind) and precipitation events (duration, number, and intensity of rainfall and snow) vary widely throughout the year and from year-to year. To some extent, their effect on water use can be observed. In Waukesha, for example, some years that experienced high precipitation correlate with reduced demands, such as 2008 through 2010, as shown in Figure 4-5, while in other years they do not.
To look for high-level water use trends, the City reviewed the annual water pumpage and precipitation data over the past 40 years, summarized in Figure 4-5. The data indicate a declining trend in the volume of water pumped to meet City demand. This trend may be attributed to many factors, including new water conserving appliances required by code since the mid 1990s, the City’s water conservation measures, and the recent economic downturn. The data also illustrate that water demand in the City increases in years of below-average rainfall.
Even though the City receives an average of 34.7 inches of precipitation annually and has implemented a conservation program, it must plan for periods of abnormally dry to moderate drought conditions or high
0
50,000,000
100,000,000
150,000,000
200,000,000
250,000,000
300,000,000
350,000,000
Gallo
ns P
umpe
d
2005
2010

4.0—WATER USE AND CUSTOMER PROFILE
WBG010912212935MKE 4-5
temperatures when water demands may increase or supplies may be constrained. Sound engineering practice requires planning for potential droughts to ensure adequate water supply availability to meet essential water needs, such as those for residential sanitation, firefighting, economic stability, system maintenance, and other similar requirements.
4.2.3 Water Demand Variation due to Economic Conditions During the economic downturn of the last several years, water use in the City has declined. In fact, water use, both in terms of volume and water use intensity, is at historic low levels. During a weak economy, discretionary water use typically declines, and customers make changes in their behavior, processes, appliances, and equipment to use water more efficiently. In recent years, the City’s commercial and industrial customers have implemented water use efficiency measures to reduce or maintain the cost of providing their services and products. With respect to long-term planning, the City considers the impacts of economic cycles transitory. That is, when economic conditions improve during the future planning period, the forces that restrain growth and water use will be removed and water demand will return to higher levels and gradually increase with future economic growth. Thus, in such a future planning horizon, growth in the commercial and industrial water use sectors is expected to occur at a faster rate than for the residential sector.
4.2.4 Diurnal Variation in Customer Demand Table 4-2 summarizes historical variation in average day and maximum day demand over the past 10 years, with the ratio of the annual maximum day to average day water pumpage ranging from a low of 1.31 to 1.66.
FIGURE 4-5 City of Waukesha Annual Water Pumping and Precipitation
0
500
1000
1500
2000
2500
3000
3500
4000
0
10
20
30
40
50
60
70
1969
1971
1973
1975
1977
1979
1981
1983
1985
1987
1989
1991
1993
1995
1997
1999
2001
2003
2005
2007
2009
Wat
er P
umpa
ge (M
GY)
Annu
al P
reci
pita
tion
(inch
es)
Annual Precipitation and Water Pumpage: 1970-2010
Annual Precipitation Avg Annual Precip (34.7 inches) Annual Water Pumpage

WAUKESHA WATER CONSERVATION PLAN
4-6 WBG010912212935MKE
Based on analysis of the City’s pumpage data for a 40-year period (1970 to 2010), the maximum day to average day pumping factor used for water system facility design is 1.68. The analysis of this system performance metric is included in Appendix A, Summary of Water Requirements. As shown in Appendix A, the appropriate average to peak day ratio used for long-term planning and design (1.68) reflects that value with a 98 percent confidence level (that is, probability) that the actual peak day pumping will be of equal or lesser value. This value is just slightly higher than the average to peak ratio in 2005. Although average to peak ratio appears to be trending downward since 2005, it is unknown how much of the decrease is due to reliable long-term water use efficiency and how much is due to rainfall, the economy, and other factors.
TABLE 4-2 City of Waukesha Maximum and Average Daily Flow, 1999–2010
Year Average Day Pumpage
(mgd) Maximum Day Pumpage
(mgd) Maximum Pumpage Date Ratio of Maximum to
Average Day
2010 6.69 8.65 08/28 1.29
2009 6.79 9.35 08/04 1.38
2008 6.91 9.93 08/19 1.43
2007 7.17 9.79 07/24 1.36
2006 7.18 10.23 07/18 1.42
2005 7.76 12.87 06/23 1.66
2004 7.39 10.48 09/13 1.42
2003 7.66 11.67 08.22 1.52
2002 8.09 12.78 07/17 1.58
2001 7.73 12.53 07/09 1.62
2000 7.72 10.15 06/27 1.31
1999 8.30 11.59 07/07 1.40
Source: City of Waukesha operating data.
4.3 Water Use Analysis Findings and Assessment 4.3.1 Per Capita Water Use Water use intensity by sector (residential or commercial, industrial, and institutional [CII]) is often correlated to a community’s population as an indicator of water efficiency and trends over time as populations grow or change. Figure 4-6 summarizes usage per person for various water use sectors—customer classes—based on water sales records and the population of 70,7819
9 City of Waukesha population, 2010. U.S. Census Bureau.
. To comply with state reporting requirements, commercial water sales include multi-family residential accounts. Consequently, the water use intensity factors showing in Figure 4-6 are general indicators of water use, which are helpful to observe trends, like decreased water use over the past 10 years in all customer classes. However, the general and accepted measures are not as specific and insightful for conservation planning for a specific utility as the factors determined by the percentile analysis of water use presented in Section 4.2.3.
4.0—WATER USE AND CUSTOMER PROFILE
WBG010912212935MKE 4-7
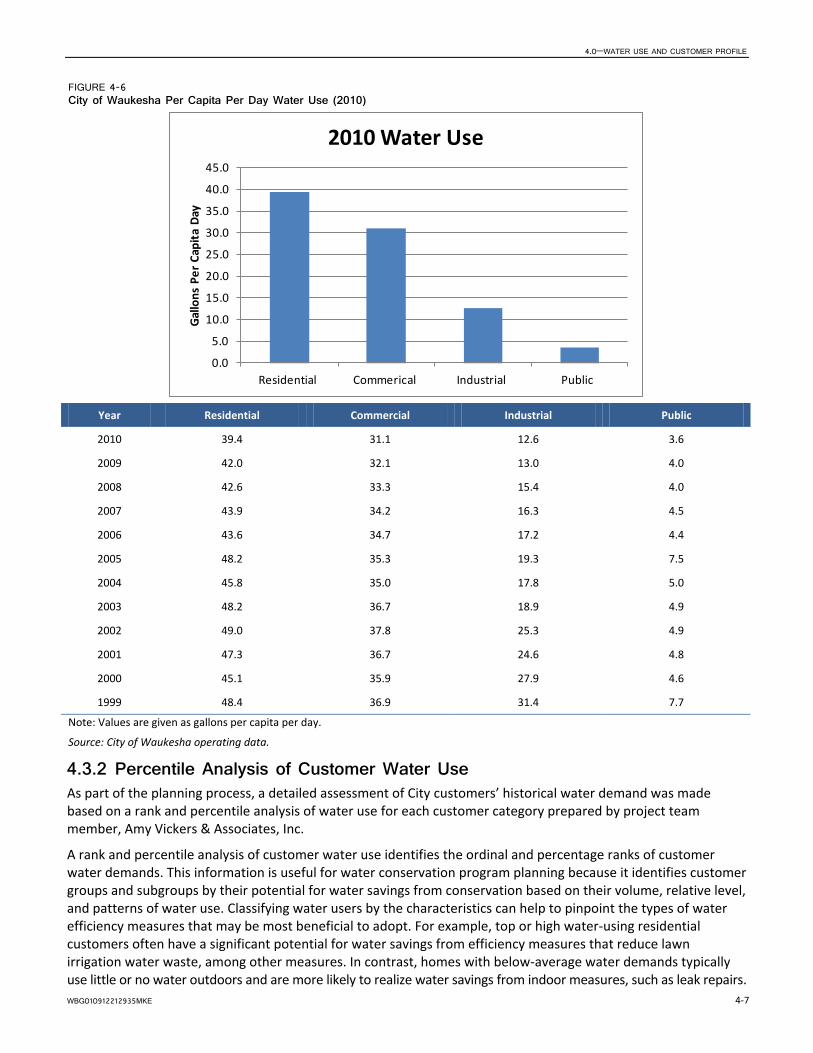
FIGURE 4-6 City of Waukesha Per Capita Per Day Water Use (2010)
Year Residential Commercial Industrial Public
2010 39.4 31.1 12.6 3.6
2009 42.0 32.1 13.0 4.0
2008 42.6 33.3 15.4 4.0
2007 43.9 34.2 16.3 4.5
2006 43.6 34.7 17.2 4.4
2005 48.2 35.3 19.3 7.5
2004 45.8 35.0 17.8 5.0
2003 48.2 36.7 18.9 4.9
2002 49.0 37.8 25.3 4.9
2001 47.3 36.7 24.6 4.8
2000 45.1 35.9 27.9 4.6
1999 48.4 36.9 31.4 7.7
Note: Values are given as gallons per capita per day.
Source: City of Waukesha operating data.
4.3.2 Percentile Analysis of Customer Water Use As part of the planning process, a detailed assessment of City customers’ historical water demand was made based on a rank and percentile analysis of water use for each customer category prepared by project team member, Amy Vickers & Associates, Inc.
A rank and percentile analysis of customer water use identifies the ordinal and percentage ranks of customer water demands. This information is useful for water conservation program planning because it identifies customer groups and subgroups by their potential for water savings from conservation based on their volume, relative level, and patterns of water use. Classifying water users by the characteristics can help to pinpoint the types of water efficiency measures that may be most beneficial to adopt. For example, top or high water-using residential customers often have a significant potential for water savings from efficiency measures that reduce lawn irrigation water waste, among other measures. In contrast, homes with below-average water demands typically use little or no water outdoors and are more likely to realize water savings from indoor measures, such as leak repairs.
0.0
5.0
10.0
15.0
20.0
25.0
30.0
35.0
40.0
45.0
Residential Commerical Industrial Public
Gallo
ns P
er C
apita
Day
2010 Water Use
WAUKESHA WATER CONSERVATION PLAN
4-8 WBG010912212935MKE
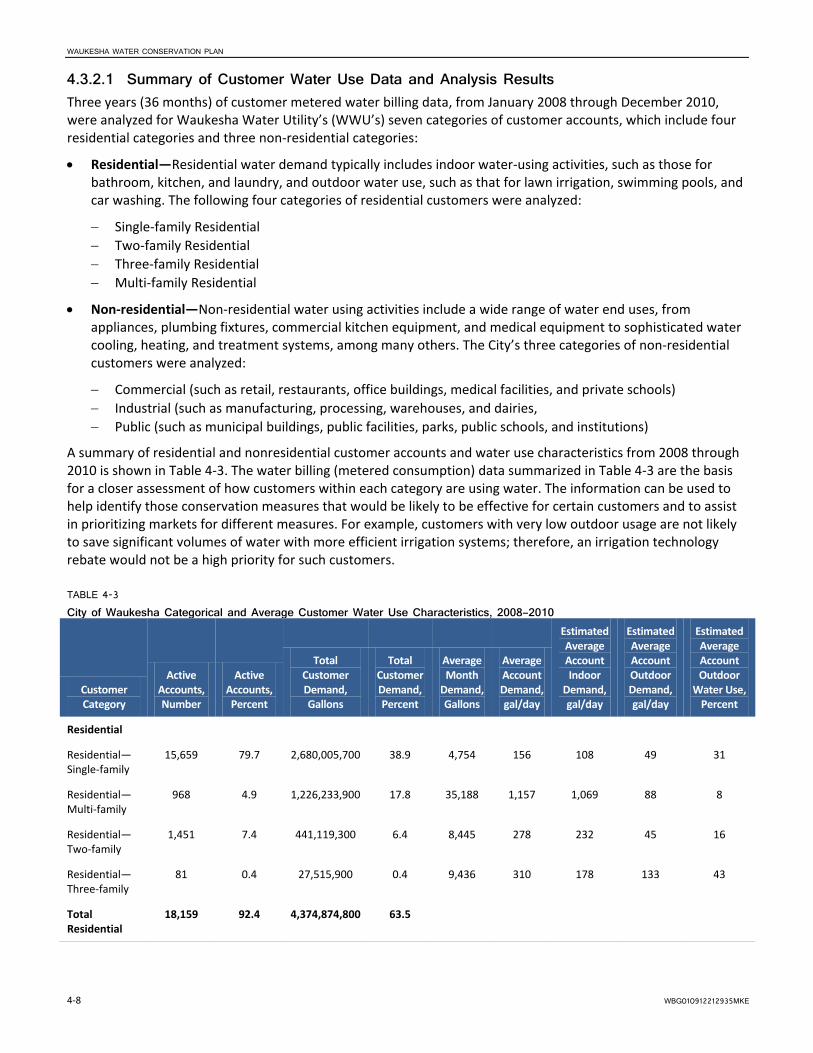
4.3.2.1 Summary of Customer Water Use Data and Analysis Results Three years (36 months) of customer metered water billing data, from January 2008 through December 2010, were analyzed for Waukesha Water Utility’s (WWU’s) seven categories of customer accounts, which include four residential categories and three non-residential categories:
• Residential—Residential water demand typically includes indoor water-using activities, such as those for bathroom, kitchen, and laundry, and outdoor water use, such as that for lawn irrigation, swimming pools, and car washing. The following four categories of residential customers were analyzed:
− Single-family Residential − Two-family Residential − Three-family Residential − Multi-family Residential
• Non-residential—Non-residential water using activities include a wide range of water end uses, from appliances, plumbing fixtures, commercial kitchen equipment, and medical equipment to sophisticated water cooling, heating, and treatment systems, among many others. The City’s three categories of non-residential customers were analyzed:
− Commercial (such as retail, restaurants, office buildings, medical facilities, and private schools) − Industrial (such as manufacturing, processing, warehouses, and dairies, − Public (such as municipal buildings, public facilities, parks, public schools, and institutions)
A summary of residential and nonresidential customer accounts and water use characteristics from 2008 through 2010 is shown in Table 4-3. The water billing (metered consumption) data summarized in Table 4-3 are the basis for a closer assessment of how customers within each category are using water. The information can be used to help identify those conservation measures that would be likely to be effective for certain customers and to assist in prioritizing markets for different measures. For example, customers with very low outdoor usage are not likely to save significant volumes of water with more efficient irrigation systems; therefore, an irrigation technology rebate would not be a high priority for such customers.
TABLE 4-3
City of Waukesha Categorical and Average Customer Water Use Characteristics, 2008–2010
Customer Category
Active Accounts, Number
Active Accounts, Percent
Total Customer Demand, Gallons
Total Customer Demand, Percent
Average Month
Demand, Gallons
Average Account Demand, gal/day
Estimated Average Account Indoor
Demand, gal/day
Estimated Average Account Outdoor Demand, gal/day
Estimated Average Account Outdoor
Water Use, Percent
Residential
Residential—Single-family
15,659 79.7 2,680,005,700 38.9 4,754 156 108 49 31
Residential—Multi-family
968 4.9 1,226,233,900 17.8 35,188 1,157 1,069 88 8
Residential—Two-family
1,451 7.4 441,119,300 6.4 8,445 278 232 45 16
Residential—Three-family
81 0.4 27,515,900 0.4 9,436 310 178 133 43
Total Residential
18,159 92.4 4,374,874,800 63.5

4.0—WATER USE AND CUSTOMER PROFILE
WBG010912212935MKE 4-9
TABLE 4-3
City of Waukesha Categorical and Average Customer Water Use Characteristics, 2008–2010
Customer Category
Active Accounts, Number
Active Accounts, Percent
Total Customer Demand, Gallons
Total Customer Demand, Percent
Average Month
Demand, Gallons
Average Account Demand, gal/day
Estimated Average Account Indoor
Demand, gal/day
Estimated Average Account Outdoor Demand, gal/day
Estimated Average Account Outdoor
Water Use, Percent
Nonresidential
Commercial 1,225 6.2 1,187,364,000 17.2 26,924 885 686 199 22
Industrial 145 0.7 1,034,506,100 15.0 198,181 6,515 5,104 1,411 22
Public 120 0.6 293,666,300 4.3 67,978 2,235 1,194 1,041 47
Total Non-residential
1,490 7.6 2,515,536,400 36.5
GRAND TOTAL 19,649 100.0 6,890,411,200 100.0
A summary of findings from the rank and percentile water use analysis of the seven customer categories for historical water demands between January 2008 and December 2010 are summarized in Table 4-4.
TABLE 4-4 Combined All Seven Customer Categories: Water Use Characteristics, By Percentile, 2008–2010
Account Percentile
No. Active Accounts1
Total Demand, Gallons
Percent Demand of
ALL Accounts
Average Month
Demand, Gallons
Average Account Demand, gal/day
Estimated Average Account Indoor
Demand2, gal/day
Estimated Average Account Outdoor
Demand3, gal/day
Estimated Average Account Outdoor
Water Use, Percent
All Accounts 19,649 6,890,411,200 100 350,907 11,535 8,570 2,965 26
Top 1% of Accounts
196 766,768,500 11 7,003,168 230,216 148,489 81,727 35
Top 10% of Accounts
1,965 2,987,117,100 43 2,469,323 81,174 58,958 22,216 27
Top 25% of Accounts
4,912 4,363,240,300 63 1,217,203 40,013 29,154 10,860 27
Top 50% of Accounts
9,825 5,645,640,700 82 666,571 21,912 16,142 5,771 26
Bottom 50% of Accounts
9,825 1,244,770,500 18 35,243 1,159 746 412 36
TOTAL 19,649 6,890,411,200 701,814 23,071 16,888 6,183 62
Note: 1 Number of active accounts shown may not add due to rounding. 2 Based on an average of the three lowest months per year, 2008-2010 3 Average annualized, 2008-2010

WAUKESHA WATER CONSERVATION PLAN
4-10 WBG010912212935MKE
The findings from this analysis lay a strong technical foundation for many of the recommendations presented in Section 7. Key findings from this analysis include the following:
• Percentile demands of all customers indicate that the largest potential future water savings from conservation are likely in the top 50 percent of accounts:
− The top 10 percent uses 43 percent of all customer demands; most are the largest commercial, industrial, and public accounts.
− The top 50 percent uses 82 percent of all customer demands.
− The bottom 50 percent uses only 18 percent of all City customer demand; these customers likely have a much lower per-account potential for water savings compared to the top 50 percent of customers.
• Residential single-family customer water use:
− On average, single-family residential customers have relatively low water use.
− However, the top 10 percent of single-family residential customers are using disproportionately high volumes of water.
• Two-, three-, and multi-family customer water use:
− For multi-family customers, it is difficult to assess water use efficiency without account-specific population or occupancy data and because the number of units can vary significantly by account.
− It is likely that the top 10 percent of two- and three-family customers are inefficient users.
• Bottom 50 percent of residential users (single-, two-, three-, and multi-family):
− Low occupancy, part-time residents, and water-thriftiness may explain many of the customers’ very low usage, but at least spot checks are warranted to confirm those potential reasons. In some cases, meter problems, such as sizing, calibration, or theft, may be factors that warrant follow-up action.
• CII (public) customer water use:
− The top 1 to 10 percent of users are the highest priority for future water conservation efforts because they likely have the greatest potential for water savings per customer.
− Individual nonresidential users use water at their facilities in a myriad of ways that are often not comparable from customer-to-customer; therefore, it is important to remember that high water use does not necessarily mean that water is being used inefficiently.
− The best approach for large- and medium-sized commercial, industrial, and public/institutional customers is usually to implement targeted programs by business/public sector and water end-use similarities (such as cooling towers, metal finishing, food processing, etc.) with the effort and resource allocation equal to the savings potential.
4.3.2.2 Detailed Customer Water Use Data and Analysis Results Detailed results of the percentile analysis for the seven customer categories are provided in Tables 4-5 through 4-11. Water use efficiency assessments for multi-family, commercial, industrial, and public10
10 Throughout this Plan, commercial, industrial and institutional (CII) customers are referred to as a single category. Institutional customers generally include public facilities; however, for this assessment, public institutions were analyzed separately. Other institutional such as hospitals and private schools users were included in the commercial category.
customers can only be roughly assessed because these customer types represent a diverse range of water end uses, users, and property types that are not easily comparable (for instance, a dairy operation compared to a foundry). Further, some nonresidential customers using large volumes of water are not necessarily inefficient users (for instance, a beverage bottling plant that also employs an air sterilization process for bottles).

4.0—WATER USE AND CUSTOMER PROFILE
WBG010912212935MKE 4-11
Furthermore, benchmark water use data are available for only a small number of nonresidential water usages, such as hospital beds, to provide some information about water use efficiency, as described in this section. For these customers, volume and seasonal demand characteristics can be useful indicators for targeting future water-saving programs.
TABLE 4-5 Residential (Single-Family) Customers' Water Use Characteristics, By Percentile, 2008–2010
Single-Family Account Percentile
No. Active
Accounts1
Total Demand, Gallons
Percent Demand of
Single-Family Accounts
Average Month
Demand, Gallons2
Estimated Average Account
Outdoor Water Use, Percent3
Average Gallons Per Capita Per Day, gpcd 4
All Accounts 15,659 2,680,005,700 100 4,754 31 60
Top 1% of Accounts 157 86,355,500 3 15,319 44 194
Top 10% of Accounts 1,566 549,879,300 21 9,754 30 123
Top 25% of Accounts 3,915 1,123,101,300 42 7,969 33 101
Top 50% of Accounts 7,830 1,857,302,700 69 6,589 32 83
Bottom 50% of Accounts 7,830 822,703,000 31 2,919 29 37
Note: 1. Number of active accounts shown may not add due to rounding. 2. Based on an average of the three lowest months per year 3. Based on an average of the three highest months per year 4. Based on an average of 2.6 persons per household.
Source: U.S. Census Bureau, 2005–2009 American Community Survey.
Key findings for single-family customer category percentile analysis:
• Average single-family account:
− Relatively low water use compared to national average.
− An average of 60 gpcd is relatively water efficient, falling below the national household average of 98 gpcd (U.S. Geological Survey, 2005).
• Top 1 percent of customers:
− Very high water use.
− An average of 194 gpcd is more than 3 times the average single-family household served by the City, and nearly twice the national average of 98 gpcd.
− Estimated outdoor water use is very high, more than 4.5 times the average single-family account.
− Estimated indoor water use is more than 2.5 times higher than the average single-family account.
− Customers likely have the highest potential for saving water from both indoor and outdoor water efficiency measures.
• Top 10 percent of customers:
− High water use.
− An average of 123 gpcd is more than 2 times the average single-family household, and above the national average of 98 gpcd.
− Customers likely have a high potential for saving water from both indoor and outdoor water efficiency measures.

WAUKESHA WATER CONSERVATION PLAN
4-12 WBG010912212935MKE
• Top 25 percent to 50 percent of customers:
− Use is close to national average.
− Averages of 101 gpcd (top 25 percent) to 83 gpcd (top 50 percent) are close to the national average of 98 gpcd.
− Customers have some potential for saving water from both indoor and outdoor water efficiency measures.
• Bottom 50 percent of customers:
− Very low water use; Super Savers.
− Average of 37 gpcd is 62 percent of average use (60 gpcd) for all single-family customers, and roughly one-third of the national average (98 gpcd).
− Average water use figures in this single-family group may reflect some single occupancy, other small households, and part-time occupied or infrequently occupied households, such as part-time residents and unoccupied houses for sale or under foreclosure. A disproportionate number of accounts in this group had zero water use recorded for at least 1 year. Nevertheless, even the relatively higher water users in this percentile group use less than the average single-family household.
− This single-family percentile group appears to be already very water thrifty and/or not a full-time water user with a relatively low potential for future water savings from conservation.
TABLE 4-6 Residential (Two-Family) Customers' Water Use Characteristics, By Percentile, 2008–2010
Two-Family Account Percentile
No. Active Accounts 1
Total Demand, Gallons
Percent Demand of
Two-Family
Accounts
Average. Month
Demand, Gallons
Estimated Average Account
Outdoor Water Use, Percent2
Average Gallons Per Capita Per
Day, gpcd 3
All Accounts 1,451 441,119,300 100 8,445 16 58
Top 1% of Accounts 15 14,669,300 3 28,083 63 192
Top 10% of Accounts 145 88,747,800 20 16,990 35 116
Top 25% of Accounts 363 182,554,000 41 13,979 30 96
Top 50% of Accounts 726 301,618,200 68 11,548 21 79
Bottom 50% of Accounts 726 139,501,100 32 5,341 17 37
Note: 1 Number of active accounts shown may not add due to rounding. 2 Based on an average of the three highest months 3 Based on an average of 2.4 persons per household in a two-family dwelling (average 4.8 persons per account).
Source: U.S. Census Bureau, Wisconsin Quick Facts, Persons per household, 2005–2009.
Key findings for two-family customer category percentile analysis:
• Average two-family account:
− Relatively low water use compared to national average.
− Average of 58 gpcd is relatively water efficient, falling below the national household average of 98 gpcd (U.S. Geological Survey, 2005). The figure is very similar to the average 60 gpcd for all single-family accounts.
• Top 1 percent of customers:
− Very high water use.
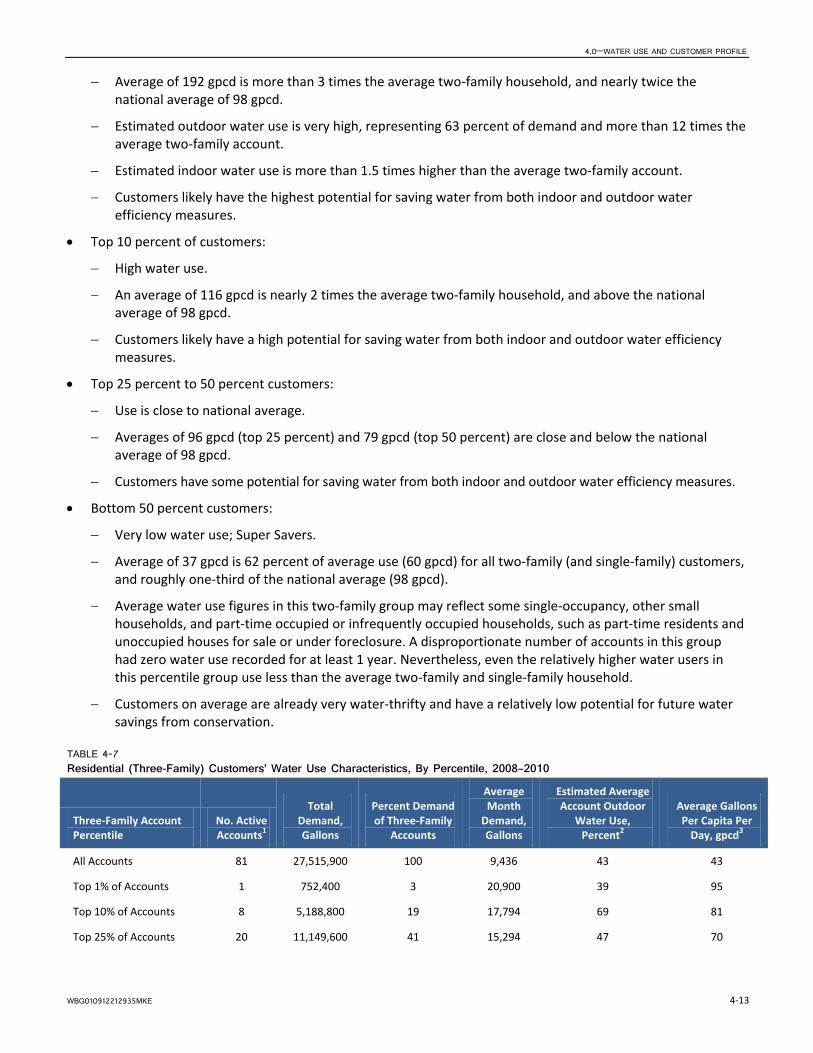
4.0—WATER USE AND CUSTOMER PROFILE
WBG010912212935MKE 4-13
− Average of 192 gpcd is more than 3 times the average two-family household, and nearly twice the national average of 98 gpcd.
− Estimated outdoor water use is very high, representing 63 percent of demand and more than 12 times the average two-family account.
− Estimated indoor water use is more than 1.5 times higher than the average two-family account.
− Customers likely have the highest potential for saving water from both indoor and outdoor water efficiency measures.
• Top 10 percent of customers:
− High water use.
− An average of 116 gpcd is nearly 2 times the average two-family household, and above the national average of 98 gpcd.
− Customers likely have a high potential for saving water from both indoor and outdoor water efficiency measures.
• Top 25 percent to 50 percent customers:
− Use is close to national average.
− Averages of 96 gpcd (top 25 percent) and 79 gpcd (top 50 percent) are close and below the national average of 98 gpcd.
− Customers have some potential for saving water from both indoor and outdoor water efficiency measures.
• Bottom 50 percent customers:
− Very low water use; Super Savers.
− Average of 37 gpcd is 62 percent of average use (60 gpcd) for all two-family (and single-family) customers, and roughly one-third of the national average (98 gpcd).
− Average water use figures in this two-family group may reflect some single-occupancy, other small households, and part-time occupied or infrequently occupied households, such as part-time residents and unoccupied houses for sale or under foreclosure. A disproportionate number of accounts in this group had zero water use recorded for at least 1 year. Nevertheless, even the relatively higher water users in this percentile group use less than the average two-family and single-family household.
− Customers on average are already very water-thrifty and have a relatively low potential for future water savings from conservation.
TABLE 4-7 Residential (Three-Family) Customers' Water Use Characteristics, By Percentile, 2008–2010
Three-Family Account Percentile
No. Active Accounts1
Total Demand, Gallons
Percent Demand of Three-Family
Accounts
Average Month
Demand, Gallons
Estimated Average Account Outdoor
Water Use, Percent2
Average Gallons Per Capita Per
Day, gpcd3
All Accounts 81 27,515,900 100 9,436 43 43
Top 1% of Accounts 1 752,400 3 20,900 39 95
Top 10% of Accounts 8 5,188,800 19 17,794 69 81
Top 25% of Accounts 20 11,149,600 41 15,294 47 70

WAUKESHA WATER CONSERVATION PLAN
4-14 WBG010912212935MKE
TABLE 4-7 Residential (Three-Family) Customers' Water Use Characteristics, By Percentile, 2008–2010
Three-Family Account Percentile
No. Active Accounts1
Total Demand, Gallons
Percent Demand of Three-Family
Accounts
Average Month
Demand, Gallons
Estimated Average Account Outdoor
Water Use, Percent2
Average Gallons Per Capita Per
Day, gpcd3
Top 50% of Accounts 41 18,698,700 68 12,825 41 59
Bottom 50% of Accounts 41 8,817,200 32 6,047 55 28
Note: 1 Number of active accounts shown may not add due to rounding. 2 Based on an average of the three highest months per year. 3 Based on an average of 2.4 persons per household in a three-family dwelling (average 7.2 persons per account).
Source: U.S. Census Bureau, Wisconsin Quick Facts, Persons per household, 2005–2009.
Key findings for three-family customer category percentile analysis:
• Average three-family account:
− Very low water use compared to national average.
− An average of 43 gpcd is very water efficient at less than half the national household average of 98 gpcd (U.S. Geological Survey, 2005).
• Top 1 percent of customers:
− Comparable to average U.S. household.
− An average of 95 gpcd is more than 2 times the average three-family household but is very close to the national average of 98 gpcd.
− These customers use one-third more water than the average single-family household does.
− Estimated indoor and outdoor water use percentages are also close to national averages.
− Customers likely have a moderate potential for saving water from both indoor and outdoor water efficiency measures
• Top 10 percent, 25 percent, and 50 percent of customers:
− Use is below national average, some higher than average single-family households.
− Averages of 81 gpcd (top 10 percent), 70 gpcd (top 25 percent), and 59 gpcd (top 50 percent) are below the national average of 98 gpcd, and are relatively water-efficient.
− Customers likely have a moderate potential for saving water from both indoor and outdoor water efficiency measures.
• Bottom 50 percent of customers:
− Very low water use; Super Savers.
− An average of 28 gpcd is roughly one-third of the national average.
− Average water use figures in this group may reflect some single and small households and temporarily unoccupied or infrequently occupied households, such as part-time residents and unoccupied houses for sale or under foreclosure. A disproportionate number of accounts in this group had zero water use recorded for at least 1 year.
− Customers on average are already very water-thrifty and have a relatively low potential for future water savings from conservation.

4.0—WATER USE AND CUSTOMER PROFILE
WBG010912212935MKE 4-15
TABLE 4-8 Residential (Multi-Family) Customers' Water Use Characteristics, By Percentile, 2008–2010
Multi-Family Family Account Percentile
No. Active Accounts 1
Total Demand, Gallons
Percent Demand of Multi-
Family Accounts
Average Month
Demand, Gallons
Estimated Average Account Outdoor Demand, gal/day2
Estimated Average Account
Seasonal / Outdoor Water
Use, Percent
All Accounts 968 1,226,233,900 100 35,188 88 8
Top 1% of Accounts 10 108,007,700 9 309,939 3,155 31
Top 10% of Accounts 97 461,751,500 38 132,504 1,872 43
Top 25% of Accounts 242 766,008,300 62 87,926 844 29
Top 50% of Accounts 484 1,011,683,900 83 58,063 186 10
Bottom 50% of Accounts 484 214,550,000 17 12,313 138 34
Note: 1 Number of active accounts shown may not add due to rounding. The total number of Commercial accounts shown is higher than the number of Commercial properties, since some large customer properties have multiple meters (and separate billing accounts). 2 Based on the three highest months per year.
Key findings for multi-family customer category percentile analysis:
• Average multi-family account:
− Wide variation in use.
− An average of 1,157 gallons per day (gal/day) per account cannot be easily evaluated for water use efficiency.
− The estimated outdoor use (8 percent) is very low.
• Top 10 percent of customers:
− Use 2 times more than average two- and three-family accounts.
− These customers also have high (43 percent) outdoor water use.
• Bottom 50 percent of customers:
− Low water use.
− An average of 405 gal/day per account is low, especially if there are at least 2 to 3 dwelling units per account.
• Outdoor use may be more representative of seasonal than irrigation water demands
− Transient populations, such as students, may reflect seasonal water use variation. Multi-family buildings often have little or no landscaping that can be attributed to outdoor usages, such as lawn irrigation and pools.

WAUKESHA WATER CONSERVATION PLAN
4-16 WBG010912212935MKE
TABLE 4-9 Commercial Customers' Water Use Characteristics, By Percentile, 2008–2010
Commercial Account Percentile
No. Active Accounts 1
Total Demand, Gallons
Percent Demand of Commercial
Accounts
Average Month
Demand, Gallons
Estimated Average Account Outdoor Demand, gal/day2
Estimated Average
Seasonal / Outdoor
Water Use,
Percent
All Accounts 1,225 1,187,364,000 100 26,924 199 22
Top 1% of Accounts 12 346,639,300 29 786,030 7,400 29
Top 10% of Accounts 123 821,679,200 69 186,322 1,370 22
Top 25% of Accounts 306 1,029,974,700 87 93,422 674 22
Top 50% of Accounts 613 1,144,308,000 96 51,896 384 23
Bottom 50% of Accounts 613 43,056,000 4 1,953 27 42
Note: 1 Number of active accounts shown may not add due to rounding. The total number of Commercial accounts shown is higher than the number of Commercial properties, since some large customer properties have multiple meters (and separate billing accounts). 2 Average annualized, 2008–2010.
Key findings for commercial customer category percentile analysis:
• Top (highest) volume commercial accounts use a disproportionate volume of water:
− The top 1 percent of accounts uses 29 percent of commercial water demand.
− Includes hospitals and medical and senior care centers
− Moderately high (29 percent) seasonal/outdoor demands
− The top 10 percent of accounts use 69 percent of commercial water demand.
− Includes hotels, spas, restaurants, and office parks
− Top 25 percent to 50 percent accounts represent a wide range of North American Industry Classification System (NAICS) establishments, some with many different types of water use.
• The bottom (lowest) volume 50 percent of commercial accounts represent only 4 percent of demand:
− The average account use is 64 gal/day, ranging from 1 to 170 gal/day.
− Very low accounts should be checked for meter size accuracy and calibration, or explanation for very low use, and possible theft.
− Some very low use accounts may also reflect a low-use or infrequently used submeter. Current economic conditions may also be a factor for some customers.
− Meters that are undersized and not calibrated represent potential revenue losses that could be recouped.
• Outdoor use may be more representative of seasonal than irrigation water demands.
− Twenty-two percent of average commercial account water demands appear to be for seasonal or outdoor water usages. However, a wide range in seasonal usage can be found with some accounts.

4.0—WATER USE AND CUSTOMER PROFILE
WBG010912212935MKE 4-17
TABLE 4-10 Industrial Customers' Water Use Characteristics, By Percentile, 2008–2010
Industrial Account Percentile
No. Active Accounts 1
Total Demand, Gallons
Percent Demand of Industrial Accounts
Average Month
Demand, Gallons
Estimated Average Account Outdoor Demand, gal/day2
Estimated Average Account
Seasonal / Outdoor
Water Use, Percent
All Accounts 145 1,034,506,100 100 198,181 1,411 22
Top 1% of Accounts 1 160,814,300 16 4,467,064 64,224 44
Top 10% of Accounts 15 870,559,200 84 1,667,738 11,798 22
Top 25% of Accounts 36 997,315,700 96 764,227 5,295 21
Top 50% of Accounts 73 1,024,428,300 99 392,501 2,829 22
Bottom 50% of Accounts 73 10,077,800 1 3,861 42 33
Note: 1 Number of active accounts shown may not add due to rounding. The total number of Industrial accounts shown is higher than the number of Industrial properties, since some large customer properties have multiple meters (and separate billing accounts). 2 Average annualized, 2008–2010.
Key findings for industrial customer category percentile analysis:
• Top (highest) volume industrial accounts use a substantial percentage of water used by industrial customers:
− The top 1 percent of accounts (1 customer) uses 16 percent of industrial water demand.
− High (44 percent) seasonal/outdoor water demands
− The top 10 percent of accounts use 84 percent of industrial water demand
− Includes processing operations for metal and food, manufacturing, and warehouses
− The top 50 percent of accounts represent the City’s largest users among all customer categories.
• The bottom (lowest) volume, 50 percent of industrial accounts, represents only 1 percent of demand.
− The average account use is 127 gal/day, ranging from 2 gal/day to 322 gal/day, which is very low for an industrial account.
− Very low accounts should be check for meter size accuracy and calibration, explanation for very low use, and possible theft.
− Some very low use accounts may also reflect a low-use or infrequently used submeter. Current economic conditions may also be a factor for some customers.
− Meters that are undersized and not calibrated represent potential revenue losses that could be recouped.
− Very low industrial accounts with legitimate low usage may be more appropriately classified as commercial accounts.
• Outdoor use may be more representative of seasonal than irrigation water demands:
− Twenty-two percent of average industrial account water demands appear to be for seasonal or outdoor water usages. However, a wide range in seasonal usage can be found with some accounts.

WAUKESHA WATER CONSERVATION PLAN
4-18 WBG010912212935MKE
TABLE 4-11 Public Customers' Water Use Characteristics, By Percentile, 2008–2010
Public Account Percentile
No. Active Accounts 1
Total Demand, Gallons
Percent Demand of Public Accounts
Average Month
Demand, Gallons
Estimated Average Account Outdoor Demand, gal/day2
Estimated Average Account
Seasonal / Outdoor
Water Use, Percent
All Accounts 120 293,666,300 100 67,978 1,041 47
Top 1% of Accounts 1 49,530,000 17 1,375,833 5,872 13
Top 10% of Accounts 12 189,311,300 64 438,221 6,477 45
Top 25% of Accounts 30 253,136,700 86 234,386 3,583 46
Top 50% of Accounts 60 287,600,900 98 133,149 2,053 47
Bottom 50% of Accounts 60 6,065,400 2 2,808 38 42
Note: 1 Number of active accounts shown may not add due to rounding. The total number of Public accounts shown is higher than the number of Public properties, since some large customer properties have multiple meters (and separate billing accounts). 2 Average annualized, 2008 – 2010.
Key findings for public customer category percentile analysis:
• The top (highest) volume public accounts use a disproportionate volume of water:
− The top 1 percent of accounts (1 customer) uses 17 percent of public account water demand.
− City of Waukesha Wastewater Treatment Plant
− The top 50 percent of accounts use 98 percent of public account water demand.
− Schools, courthouses, jails, office buildings, parks, and recreation
− The top 50 percent of accounts have high outdoor/seasonal usage (approximately 47 percent of the total gpcd is seasonal use).
− School, playing field, and park irrigation − Pools
• The bottom (lowest) volume, 50 percent of public accounts, represents only 2 percent of demand.
− The average account use is 92 gal/day, which is very low for a public building or facility.
− Outdoor water use is estimated to be 42 percent; some of the accounts may be for seasonal usage.
− Very low accounts should be checked for meter size accuracy and calibration, explanation for very low use, and possible theft.
− Some very low use accounts may also reflect low-use or infrequently used submeters.
− Meters that are undersized and not calibrated represent potential revenue losses that could be recouped.
4.4 Water Demand Forecasts As part of its 2006 water system master plan, the City prepared water demand forecasts. The forecasts were updated in 2009 to reflect updated water service area population projections and City water use after implementation of conservation measures. Appendix A, Summary of Water Requirements, contains the analysis of

4.0—WATER USE AND CUSTOMER PROFILE
WBG010912212935MKE 4-19
future water demands used during the planning process. Figure 4-7 shows the average day and maximum day water demand projections.
The future water demand forecasts are based on the following major assumptions:
• The City’s water conservation program is maintained and expanded to meet long-term conservation goals and customer needs.
• If water conservation measures are not in place, the estimated increase in water demand from 2009 levels is forecast to be 0.5 mgd in 2030 and 1 mgd in 2050. That is, without water conservation, the projected average day demand would be 10.4 mgd in 2030 and 11.9 mgd in 2050.
• The target 10 percent savings of 1 mgd average day flow by 2050 complies with A Regional Water Supply Plan for Southeastern Wisconsin (SEWRPC, 2010), which evaluated several levels of water conservation ranging from 4 to 10 percent reductions of average daily demand.
• The ranges of future water forecasts shown in Figure 4-7 were determined by applying water use intensity factors, water savings from conservation, and some contingency to address uncertainty associated in long-term water supply planning for the project population. The uncertainties considered include drought, changes in customer class (particularly the number and type of commercial and industrial users), and prevailing economic conditions.
FIGURE 4-7 Water Demand Forecasts


WBG010912212935MKE 5-1
5.0 Conservation and Efficiency Measures The City has implemented or completed the water CEMs specified by Wisconsin Administrative Code Chapter NR 852, Tables 1 and 2. The CEMs implemented by the City have not resulted in adverse environmental impacts. The environmental soundness of proposed future CEMs will be evaluated prior to implementation to ensure that water savings are not gained at the expense of other important environmental considerations; for example, at the cost of higher energy use and greater carbon footprint. Existing conservation efforts are discussed in Sections 5.1 and 5.2. Additional CEMs for consideration and evaluation in the planning process are identified in Section 5.3.
5.1 Conservation and Efficiency Measures, NR 852 Table 1 NR 852 requires all Public Water Supply (PWS) systems applying for a new or increased withdrawal, diversion, or water loss to provide documentation showing implementation or completion of specified CEMs that do not require retrofitting. Prior to the submission of its application for a Great Lakes diversion with return flow, the City has implemented all the CEMs in NR 852 Table 1. The City will continue the best practices on an ongoing basis into the future.
5.1.1 PWS-1, Water Use Audit CEM # Description Required Element
PWS-1 Water Use Audit
Perform a water use audit and prepare written documentation of the audit results using the process outlined in one of the following:
1. Public water systems regulated by the PSC shall follow the audit procedures indicted in ch. PSC 185.
2. Public water systems not regulated by the PSC, shall submit water use audit results with the water conservation plan required in s. NR 852.07.
The City continuously audits water use with the following established practices:
• Measures and records all water that is withdrawn from groundwater aquifers. • Measures and records all water that used in water treatment processes. • Measures and records all the water pumped at distribution system booster stations. • Meters and records all water use by customer class. • Measures and records water used each month for flushing, firefighting, and main breaks. • Calculates the percentage of unaccounted-for water each month and reports it to the PSC annually. • Performs customer water audit and repairs leaks in response to billing system alerts that detect water usage
above and below the normal usage of that meter.
The City prepared a water use audit in 2006 in accordance with ch. PSC 185, as described in Section 3, Water Use, and presented in detail in Appendix D. The City used the water use audit to understand more clearly the system’s condition and water balance; that is, the volumes of water supplied and used. This understanding helped identify ways to minimize nonrevenue water, or water that has been produced and “lost” before it reaches the customer. For example, to minimize non-revenue water, the City implements capital improvements, such as looping mains to eliminate dead ends and minimize the volume of water that would be lost to routine main flushing.
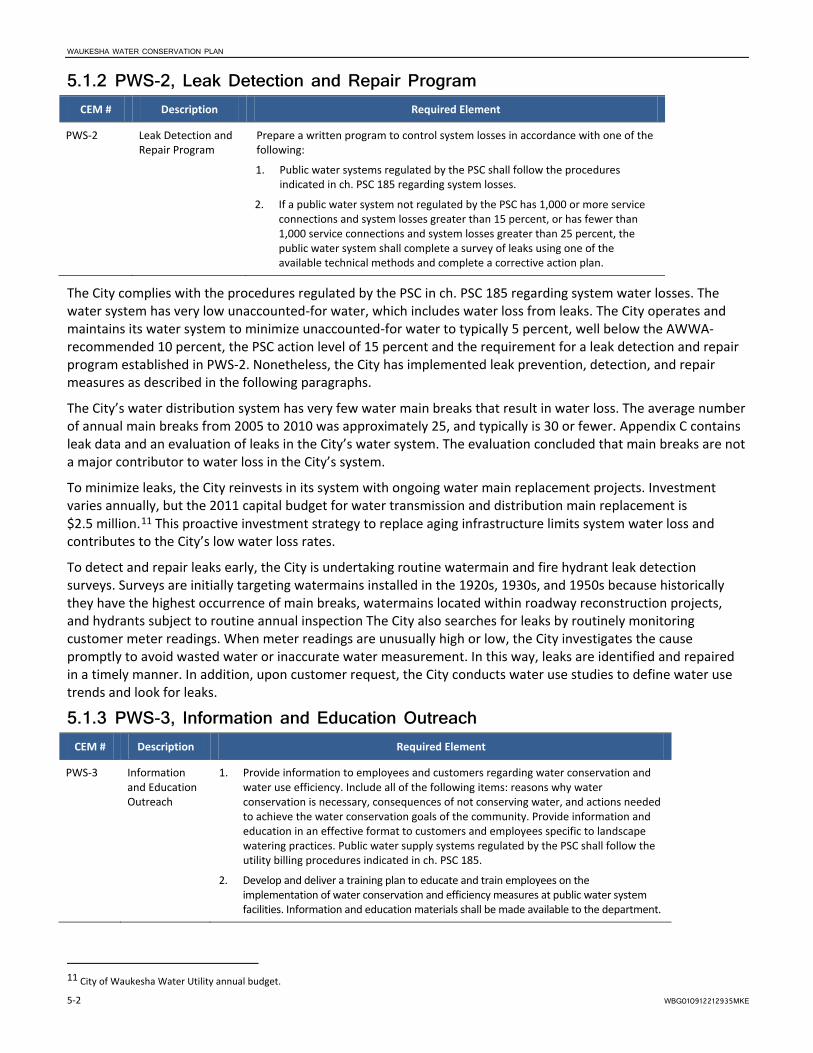
WAUKESHA WATER CONSERVATION PLAN
5-2 WBG010912212935MKE
5.1.2 PWS-2, Leak Detection and Repair Program CEM # Description Required Element
PWS-2 Leak Detection and Repair Program
Prepare a written program to control system losses in accordance with one of the following:
1. Public water systems regulated by the PSC shall follow the procedures indicated in ch. PSC 185 regarding system losses.
2. If a public water system not regulated by the PSC has 1,000 or more service connections and system losses greater than 15 percent, or has fewer than 1,000 service connections and system losses greater than 25 percent, the public water system shall complete a survey of leaks using one of the available technical methods and complete a corrective action plan.
The City complies with the procedures regulated by the PSC in ch. PSC 185 regarding system water losses. The water system has very low unaccounted-for water, which includes water loss from leaks. The City operates and maintains its water system to minimize unaccounted-for water to typically 5 percent, well below the AWWA-recommended 10 percent, the PSC action level of 15 percent and the requirement for a leak detection and repair program established in PWS-2. Nonetheless, the City has implemented leak prevention, detection, and repair measures as described in the following paragraphs.
The City’s water distribution system has very few water main breaks that result in water loss. The average number of annual main breaks from 2005 to 2010 was approximately 25, and typically is 30 or fewer. Appendix C contains leak data and an evaluation of leaks in the City’s water system. The evaluation concluded that main breaks are not a major contributor to water loss in the City’s system.
To minimize leaks, the City reinvests in its system with ongoing water main replacement projects. Investment varies annually, but the 2011 capital budget for water transmission and distribution main replacement is $2.5 million.11
To detect and repair leaks early, the City is undertaking routine watermain and fire hydrant leak detection surveys. Surveys are initially targeting watermains installed in the 1920s, 1930s, and 1950s because historically they have the highest occurrence of main breaks, watermains located within roadway reconstruction projects, and hydrants subject to routine annual inspection The City also searches for leaks by routinely monitoring customer meter readings. When meter readings are unusually high or low, the City investigates the cause promptly to avoid wasted water or inaccurate water measurement. In this way, leaks are identified and repaired in a timely manner. In addition, upon customer request, the City conducts water use studies to define water use trends and look for leaks.
This proactive investment strategy to replace aging infrastructure limits system water loss and contributes to the City’s low water loss rates.
5.1.3 PWS-3, Information and Education Outreach CEM # Description Required Element
PWS-3 Information and Education Outreach
1. Provide information to employees and customers regarding water conservation and water use efficiency. Include all of the following items: reasons why water conservation is necessary, consequences of not conserving water, and actions needed to achieve the water conservation goals of the community. Provide information and education in an effective format to customers and employees specific to landscape watering practices. Public water supply systems regulated by the PSC shall follow the utility billing procedures indicated in ch. PSC 185.
2. Develop and deliver a training plan to educate and train employees on the implementation of water conservation and efficiency measures at public water system facilities. Information and education materials shall be made available to the department.
11 City of Waukesha Water Utility annual budget.

5.0—CONSERVATION AND EFFICIENCY MEASURES
WBG010912212935MKE 5-3
Using lessons learned by other cities across the country, the City designed its water conservation program with education and outreach as the cornerstone. Through a wide array of events, media, and strategic collaborations, the City’s customers have been made aware of the City’s conservation goals and been given resources to help them save water. In addition to traditional communication channels, the City’s inclining block water rate structures have been designed to communicate a price signal to customers. Customers learn that greater costs result from higher water use.
The City designs and delivers water conservation and water use efficiency information to its customers through a variety of communication channels. A library of outreach program materials is included on the City’s Web site. Because of its efforts, ranging from educating thousands of City elementary school students to showcasing customer water conservation success stories, the City has been recognized by the Waukesha School District Most Valuable Partner Award (2007) and the Wisconsin Water Association’s Water Efficiency Award (2008).
Through education and outreach, the City has learned that its customers value saving money, understanding local water issues, and doing the right thing. The City also learned that its customers are willing to change their water use practices. For example, through the Residential Customer Challenge in 2008, some City customers reduced water use by 50 percent.12
The City has also learned the value of strategic partnerships in getting the message out. In particular, the City’s innovative collaboration with the Wisconsin Water Conservation Coalition advances outreach to the residential, commercial, and industrial sectors and creates the opportunity to neighboring communities to coordinate conservation efforts.
The City trains its employees annually on water conservation so that they may serve as ambassadors of the program and help enforce water use restrictions. Employees, particularly those who interface directly with customers, are provided with resources like standard forms and information to help them educate customers and, if necessary, enforce conservation measures like the sprinkler ordinance.
5.1.4 PWS-4, Source Measurement CEM # Description Required Element
PWS-4 Source Measurement Measure or estimate all water withdrawals monthly or more frequently to allow for identifying and understanding variability in water use over time. Public water supply systems regulated by the PSC shall follow the metering requirements provided in ch. PSC 185.
The City measures water withdrawals daily and reports all water meter data in accordance with ch. PSC 185. In addition, the City meters all of its customer connections. The City complies with the meter flow testing and accuracy requirements stipulated in ch. PSC 185.
Section 3 summarizes 11 years of water production and water use data. The City uses this information to understand better the variability of water use over time for each customer class. It also uses the information to design effective conservation measures, including the sprinkler ordinance to shave peak season flows, and an inclining rate block structure. Such information also is used to identify water trends and to develop future programs to encourage water savings.
5.2 Conservation and Efficiency Measures, NR 852 Table 2 In addition to the mandatory measures required in Table 1, the CEMs identified in NR 852 Table 2 are required to be implemented by Tier 3 applicants for Great Lakes diversion. The City has implemented all of the measures in Table 2. The City will maintain the best practices on an ongoing basis into the future.
12 City of Waukesha customer meter data.

WAUKESHA WATER CONSERVATION PLAN
5-4 WBG010912212935MKE
5.2.1 PWS-R1, Distribution System Pressure Management CEM # Description Required Element
PWS-R1 Distribution System Pressure Management
Analyze distribution system pressure management to identify opportunities to reduce water use and minimize plumbing fixture leaks.
Following development of the City’s 2006 water system master plan, an analysis of distribution system pressure management was conducted. Conclusions from this work, contained in Appendix C, include the following:
• The distribution system is operated to meet pressure requirements stipulated in Wisconsin Administrative Code NR 811.70 (4). The requirements include maintaining a minimum 20 pounds per square inch (psi) of pressure under all conditions and maintaining pressures from 35 to 100 psi under normal static conditions.
• The system’s eight pressure zones are designed to deliver adequate water supply and pressure over widely varied service area topography.
• Through comparison of published drinking water industry benchmarks and historical system performance data, pressure does not appear to be a major contributor to main breaks or leaks.
• The City notifies its customers via mailings when they make occasional adjustments to system pressures due to system upgrades. They use this opportunity to further educate their customers about checking for and repairing potential leaks in their home.
5.2.2 PWS-R2, Residential Demand Management Program CEM # Description Required Element
PWS-R2 Residential Demand Management Program
Establish and publicize a program to complete residential customer water use audits and leak surveys upon customer request based on high or aberrant water use. In developing the program, a waiver of liability and written permission from the customer may be needed.
The City provides resources for residential customers to conduct home water use audits. For example, in 2010 the City started and will maintain distribution of leak tablets along with home water audit guidance in conjunction with USEPA’s WaterSense Fix-A-Leak Week promotional event.
In addition, upon customer request, the City will conduct a water use study by monitoring real-time water use to define water use trends and look for leaks.
Furthermore, because residential customers represent the City’s largest customer class in terms of water consumption and number of connections, residential demand management is the initial focus for the City’s water conservation program. Early activities include customer outreach and information, a residential water use reduction contest, fixture replacement incentives, and policies to encourage efficient outdoor water use. These residential demand management measures have resulted in water savings:
• Toilet rebate program participants save over 15,000 gallons per year.13 As of 2010, the total volume of water saved from the toilet rebate program was 1,430,825 gallons.14
• Between 2005 and 2009, peak season pumping was reduced 16.8 percent.
• Since 2005, declining water use reduced the number of days water demand exceeded 10 mgd from 28 to 0. The City has an operational goal to pump 10 mgd or less, to meet its radium compliance consent order.
• There is a declining trend in peak season use.
13 City residential meter reading data, 2008–2010. 14 Waukesha Water Utility Report on Water Conservation Programs to the Public Service Commission of Wisconsin, 2010.

5.0—CONSERVATION AND EFFICIENCY MEASURES
WBG010912212935MKE 5-5
5.2.3 PWS-R3, Commercial and Industrial Demand Management Program CEM # Description Required Element
PWS-R3 Commercial and Industrial Demand Management Program
Establish and publicize a program to complete commercial and industrial customer water use audits and leak surveys upon customer request based on high or aberrant water use. In developing the program, a waiver of liability and written permission from the customer may be needed.
The largest industrial customers in the City include food processors, metal processors, foundries, and health care facilities. The City actively provides water conservation information to the industries it serves. Through the Wisconsin Water Conservation Coalition, representatives of several large industrial customers collaborate with the City to promote and accomplish water conservation. Some examples include the following:
• Navistar Waukesha Manufacturing performed a water use assessment and replaced hard water in its cooling tower applications with softened water. As a result, less water is added to the system and fewer purge cycles are needed. Automatic shutoff valves and controls further optimize water use in the water cooled heat exchangers. The effort saves 15,000,000 gallons per year, a 23 percent decrease in water usage, saves $30,000 annually, and has a return on investment of 6 months.15, 16
• Dean Foods/Golden Guernsey Dairy conducted a water audit and identified several water saving ideas. The company implemented changes to water lubricated systems, cooling water recirculation in homogenizing units, and wash water handling with an estimated total water savings of 1,850,000 gallons per year.
• GE Healthcare Waukesha Campus focused water conservation efforts on employee education, installation of faucet aerators, leak detection, and reducing water wasted in janitorial services. The resultant water savings is 324,000 gallons per year.17
Through the Wisconsin Water Conservation Coalition, the City has worked with commercial class customers to promote water conservation in restaurants, use of rain barrels in the City’s business district, and development of “green” residential homes with high-efficiency plumbing fixtures and grey-water systems.
5.2.4 PWS-R4, Water Reuse CEM # Description Required Element
PWS-R4 Water Reuse Conduct a technical assessment to evaluate the feasibility of water reuse in the operation of the facility. Implement water reuse projects identified by the assessment and allowed under current state law.
The City has evaluated the feasibility of water reuse in the operation of its water supply, treatment, and distribution facilities. There are negligible opportunities for water reuse for the following reasons:
• Plumbing fixtures in the Administration Building have been retrofit with high-efficiency units. • Landscaped areas are not irrigated. • Water used in water treatment processes cannot be recycled because of high radium concentrations.
Based on preliminary outreach with industrial customers, the City will investigate industrial water reuse opportunities. For example, it may be cost-effective to replace water used for seasonal irrigation with spent cooling water that otherwise would be discharged to the sewer.
15 Navistar Waukesha Manufacturing, WAU Use Softened Make-Up Water to Furnace Cooling Tower, 11/22/2010. 16 Case Study: Pure Power Technologies Water Savings Summary. 2010. 17 GE Healthcare water conservation summary presentation, 2010.
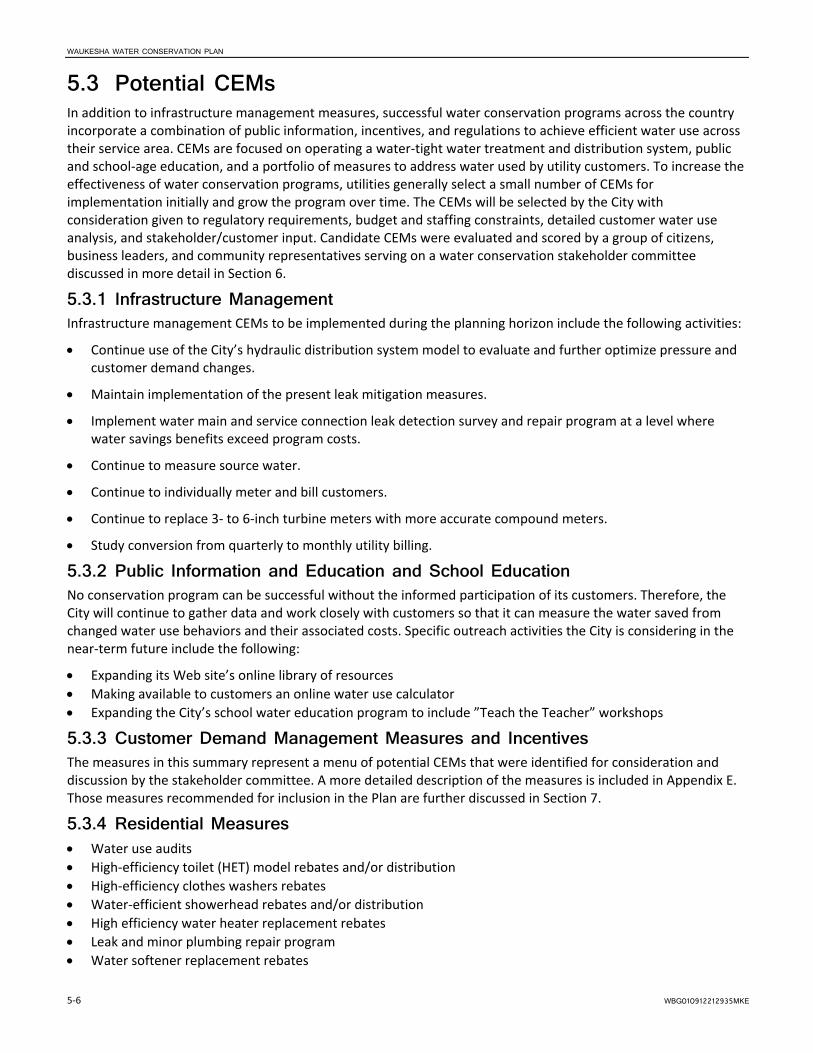
WAUKESHA WATER CONSERVATION PLAN
5-6 WBG010912212935MKE
5.3 Potential CEMs In addition to infrastructure management measures, successful water conservation programs across the country incorporate a combination of public information, incentives, and regulations to achieve efficient water use across their service area. CEMs are focused on operating a water-tight water treatment and distribution system, public and school-age education, and a portfolio of measures to address water used by utility customers. To increase the effectiveness of water conservation programs, utilities generally select a small number of CEMs for implementation initially and grow the program over time. The CEMs will be selected by the City with consideration given to regulatory requirements, budget and staffing constraints, detailed customer water use analysis, and stakeholder/customer input. Candidate CEMs were evaluated and scored by a group of citizens, business leaders, and community representatives serving on a water conservation stakeholder committee discussed in more detail in Section 6.
5.3.1 Infrastructure Management Infrastructure management CEMs to be implemented during the planning horizon include the following activities:
• Continue use of the City’s hydraulic distribution system model to evaluate and further optimize pressure and customer demand changes.
• Maintain implementation of the present leak mitigation measures.
• Implement water main and service connection leak detection survey and repair program at a level where water savings benefits exceed program costs.
• Continue to measure source water.
• Continue to individually meter and bill customers.
• Continue to replace 3- to 6-inch turbine meters with more accurate compound meters.
• Study conversion from quarterly to monthly utility billing.
5.3.2 Public Information and Education and School Education No conservation program can be successful without the informed participation of its customers. Therefore, the City will continue to gather data and work closely with customers so that it can measure the water saved from changed water use behaviors and their associated costs. Specific outreach activities the City is considering in the near-term future include the following:
• Expanding its Web site’s online library of resources • Making available to customers an online water use calculator • Expanding the City’s school water education program to include ”Teach the Teacher” workshops
5.3.3 Customer Demand Management Measures and Incentives The measures in this summary represent a menu of potential CEMs that were identified for consideration and discussion by the stakeholder committee. A more detailed description of the measures is included in Appendix E. Those measures recommended for inclusion in the Plan are further discussed in Section 7.
5.3.4 Residential Measures • Water use audits • High-efficiency toilet (HET) model rebates and/or distribution • High-efficiency clothes washers rebates • Water-efficient showerhead rebates and/or distribution • High efficiency water heater replacement rebates • Leak and minor plumbing repair program • Water softener replacement rebates
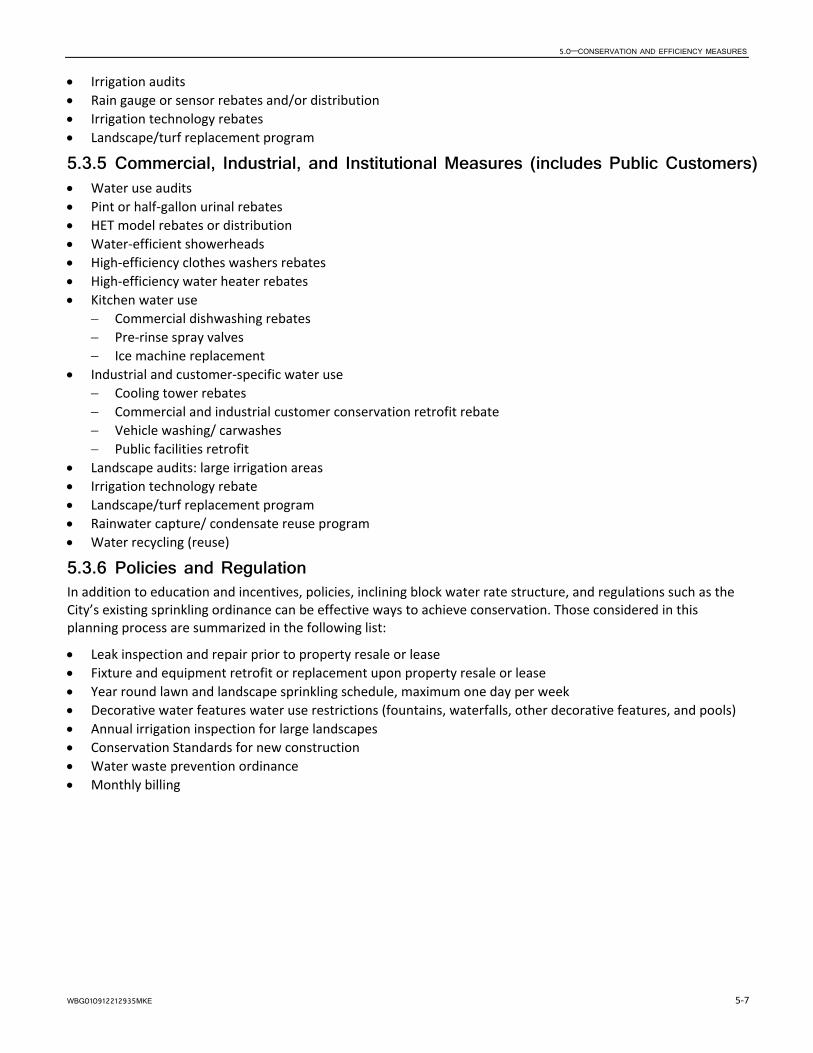
5.0—CONSERVATION AND EFFICIENCY MEASURES
WBG010912212935MKE 5-7
• Irrigation audits • Rain gauge or sensor rebates and/or distribution • Irrigation technology rebates • Landscape/turf replacement program
5.3.5 Commercial, Industrial, and Institutional Measures (includes Public Customers) • Water use audits • Pint or half-gallon urinal rebates • HET model rebates or distribution • Water-efficient showerheads • High-efficiency clothes washers rebates • High-efficiency water heater rebates • Kitchen water use
− Commercial dishwashing rebates − Pre-rinse spray valves − Ice machine replacement
• Industrial and customer-specific water use − Cooling tower rebates − Commercial and industrial customer conservation retrofit rebate − Vehicle washing/ carwashes − Public facilities retrofit
• Landscape audits: large irrigation areas • Irrigation technology rebate • Landscape/turf replacement program • Rainwater capture/ condensate reuse program • Water recycling (reuse)
5.3.6 Policies and Regulation In addition to education and incentives, policies, inclining block water rate structure, and regulations such as the City’s existing sprinkling ordinance can be effective ways to achieve conservation. Those considered in this planning process are summarized in the following list:
• Leak inspection and repair prior to property resale or lease • Fixture and equipment retrofit or replacement upon property resale or lease • Year round lawn and landscape sprinkling schedule, maximum one day per week • Decorative water features water use restrictions (fountains, waterfalls, other decorative features, and pools) • Annual irrigation inspection for large landscapes • Conservation Standards for new construction • Water waste prevention ordinance • Monthly billing


WBG010912212935MKE 6‐1
6.0 Stakeholder Input and CEM Evaluation During the fall of 2011, representative water users and other key stakeholders were identified to form a stakeholder committee that could provide input to the water conservation planning process. Through a series of workshops, stakeholder committee members gained knowledge to actively participate in the technical evaluation of CEMs, provided valuable input on approaches to implementing CEMs, and offered review comments on the City’s Water Conservation Plan.
6.1 Initial Screening of CEMs As part of the development of the Water Conservation Plan Supplement (CH2M HILL, 2011), the City evaluated numerous CEMs using the AWE Tool. This tool is a water conservation calculator that is recommend under Wisconsin Administrative Code NR 852 for estimating water savings and costs associated with CEMs. The initial analysis using the AWE Tool resulted in a short list of candidate CEMs for further evaluation by WWU and stakeholders. The CEMs are described in Appendix E.
6.2 Stakeholder Input Information gathered from the stakeholder committee provided valuable insights regarding the level of awareness of the need for conservation and ways to achieve it. The stakeholder committee input helped establish a baseline for the City’s approach to future public information and education activities. Furthermore, engaging a broad range of stakeholder interests provided useful information on CEMs that are likely to be implemented.
During the planning process, stakeholder input was gathered using the following three methods:
1. Stakeholder Committee 2. Stakeholder Interviews 3. Survey
6.2.1 Stakeholder Committee 6.2.1.1 Committee Membership The City created a water conservation stakeholder committee representing a diverse group of interests, including business, healthcare, developers, residents, community‐based organizations, education, and others. The purpose for the committee was to create a way to get meaningful input from a variety of perspectives about the future of water conservation in the City as well as to get a sense of the community’s understanding of conservation.
6.2.1.2 CEM Evaluation Process Overview The process for involving stakeholders in the evaluation of CEMs took place in three meetings. Each meeting was designed to provide the stakeholders with the information and tools needed to prioritize candidate CEMs and provide input to the City conservation program.
Meeting 1, November 17, 2011—During this meeting, stakeholders were provided background information on the utility, existing conservation activities, and the conservation planning process. They discussed and refined evaluation criteria to be used to prioritize conservation measures as a group. Evaluation criteria encompassed a variety of factors that include quantifiable criteria such as cost per million gallons saved and estimated savings per unit installed. Other criteria that address community values and customer acceptance were also useful considerations when selecting and prioritizing measures for implementation.
Stakeholders score potential Conservation and Efficiency Measures during their meeting

WAUKESHA WATER CONSERVATION PLAN
6-2 WBG010912212935MKE
• Meeting 2, December 13, 2011—Brief descriptions of proposed CEMs were presented (Appendix E). After discussion, the committee members scored each measure using the criteria refined during Meeting 1. Each measure was evaluated from 1 to 5 with 1 being the lowest ranking and a 5 being the highest. Scores were combined to determine overall ranking of the measures. The result of this process was a prioritized ranking of measures that were considered by the City along with local knowledge of feasibility, compliance with state regulations, and financial factors. The prioritization provided insights about which measures are likely to achieve the most success and be supported by customers.
• Meeting 3, January 24, 2012—The final meeting, held after the draft 2012 Conservation Plan was prepared, provided feedback to the City before the plan was finalized and considered by the Water Utility Commission.
6.2.1.3 Evaluation Criteria Based loosely on guidance in AWWA Manual of Water Supply Practices, the criteria used in the ranking process (listed in Table 6-1) reflect stakeholder comments and discussion during the committee meetings. Some of the criteria are technical in nature (for example, estimated savings and costs) and were ranked by WWU staff and presented for review by the stakeholder committee. Other criteria are value-based and were applied by the committee members.
TABLE 6-1 Water Conservation and Efficiency Measures Evaluation Criteria
Criterion Description Key questions Who applies criterion
Cost-effectiveness Assesses the return on investment for a given measure. Metrics may include cost per million gallons per day (or acre-feet per year) of savings.
What is the cost for volume of expected savings? What is the administrative cost? How is reduced water use from the program as a whole likely to affect future water rates?
WWU
Technology/ market maturity
Seeks to assess the availability of a given device or best management practice in the local area as well as the track record of a device or technology.
To what degree is the proposed device or practice developed from a technical perspective? Is the measure available to customers locally?
WWU
Time to implement Assesses the time needed for WWU to implement a measure considering additional research, stakeholder input, and technical evaluation needed.
Are standards in place to establish water saving specifications for the technology or CEM proposed? How long will it take to develop accountability procedures or contracts to implement the measure?
WWU
Certainty of savings Assesses the likelihood that potential savings will actually be achieved. Some measures may have a high potential for saving water, but rely heavily on behavioral changes or other conditions.
Have potential savings from this measure been realized in other places? Are conditions that lead to maximum savings from this measure likely to occur?
WWU
Magnitude (relative volume) of savings
Evaluates the potential for total savings of a given measure.
Will the total estimate savings from this measure materially contribute to the savings goal? What is the savings potential? Are there many customers who can implement this measure?
WWU
Complements sustainable use of other natural resources
Assesses the balance of potential water savings with other natural resources such as energy, water quality, urban forests, and solid waste.
Is the measure consistent with other best practices such as those to protect water quality or reduce energy conservation? Does it complement efforts to protect the urban forest or create additional solid waste?
WWU and Stakeholder Committee Members
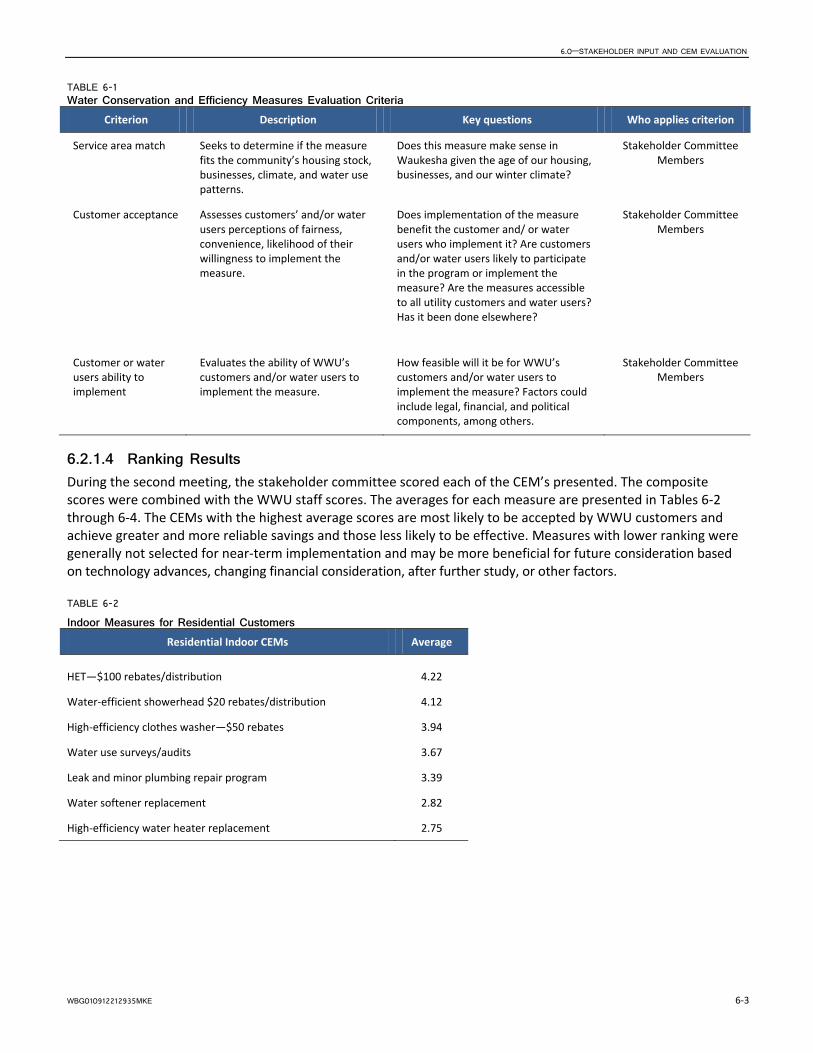
6.0—STAKEHOLDER INPUT AND CEM EVALUATION
WBG010912212935MKE 6-3
TABLE 6-1 Water Conservation and Efficiency Measures Evaluation Criteria
Criterion Description Key questions Who applies criterion
Service area match Seeks to determine if the measure fits the community’s housing stock, businesses, climate, and water use patterns.
Does this measure make sense in Waukesha given the age of our housing, businesses, and our winter climate?
Stakeholder Committee Members
Customer acceptance Assesses customers’ and/or water users perceptions of fairness, convenience, likelihood of their willingness to implement the measure.
Does implementation of the measure benefit the customer and/ or water users who implement it? Are customers and/or water users likely to participate in the program or implement the measure? Are the measures accessible to all utility customers and water users? Has it been done elsewhere?
Stakeholder Committee Members
Customer or water users ability to implement
Evaluates the ability of WWU’s customers and/or water users to implement the measure.
How feasible will it be for WWU’s customers and/or water users to implement the measure? Factors could include legal, financial, and political components, among others.
Stakeholder Committee Members
6.2.1.4 Ranking Results During the second meeting, the stakeholder committee scored each of the CEM’s presented. The composite scores were combined with the WWU staff scores. The averages for each measure are presented in Tables 6-2 through 6-4. The CEMs with the highest average scores are most likely to be accepted by WWU customers and achieve greater and more reliable savings and those less likely to be effective. Measures with lower ranking were generally not selected for near-term implementation and may be more beneficial for future consideration based on technology advances, changing financial consideration, after further study, or other factors.
TABLE 6-2
Indoor Measures for Residential Customers Residential Indoor CEMs Average
HET—$100 rebates/distribution 4.22
Water-efficient showerhead $20 rebates/distribution 4.12
High-efficiency clothes washer—$50 rebates 3.94
Water use surveys/audits 3.67
Leak and minor plumbing repair program 3.39
Water softener replacement 2.82
High-efficiency water heater replacement 2.75
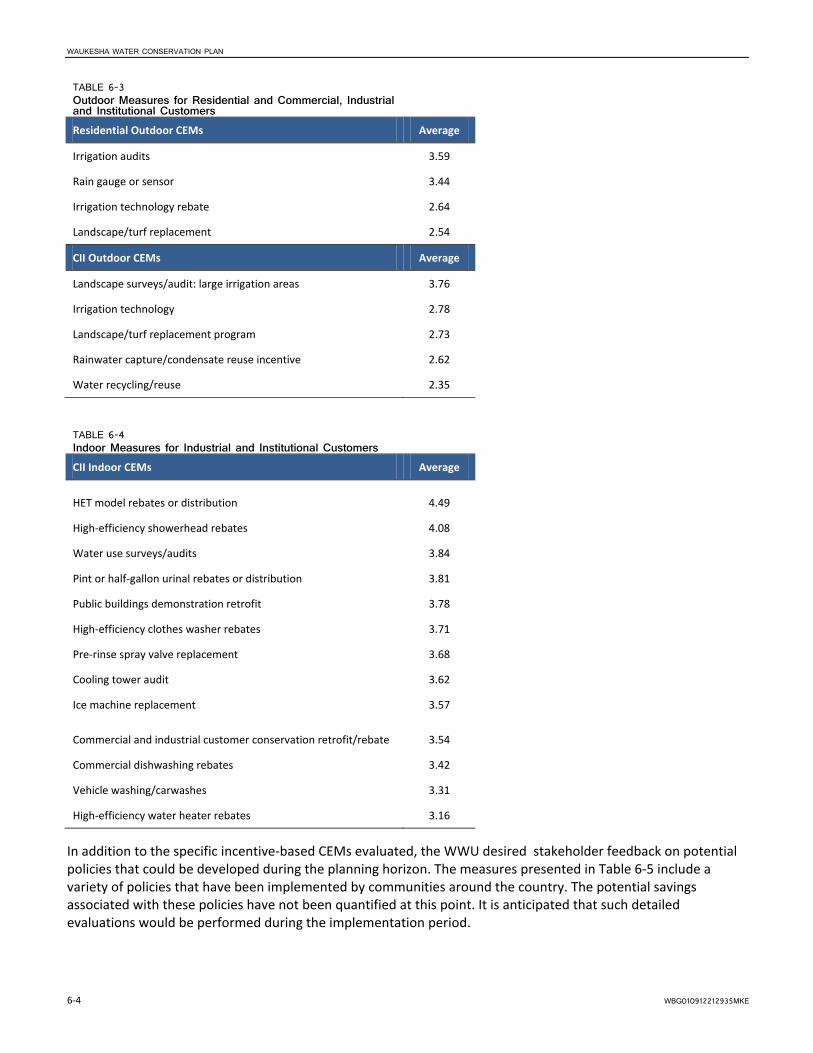
WAUKESHA WATER CONSERVATION PLAN
6-4 WBG010912212935MKE
TABLE 6-3 Outdoor Measures for Residential and Commercial, Industrial and Institutional Customers
Residential Outdoor CEMs Average
Irrigation audits 3.59
Rain gauge or sensor 3.44
Irrigation technology rebate 2.64
Landscape/turf replacement 2.54
CII Outdoor CEMs Average
Landscape surveys/audit: large irrigation areas 3.76
Irrigation technology 2.78
Landscape/turf replacement program 2.73
Rainwater capture/condensate reuse incentive 2.62
Water recycling/reuse 2.35
TABLE 6-4 Indoor Measures for Industrial and Institutional Customers CII Indoor CEMs Average
HET model rebates or distribution 4.49
High-efficiency showerhead rebates 4.08
Water use surveys/audits 3.84
Pint or half-gallon urinal rebates or distribution 3.81
Public buildings demonstration retrofit 3.78
High-efficiency clothes washer rebates 3.71
Pre-rinse spray valve replacement 3.68
Cooling tower audit 3.62
Ice machine replacement 3.57
Commercial and industrial customer conservation retrofit/rebate 3.54
Commercial dishwashing rebates 3.42
Vehicle washing/carwashes 3.31
High-efficiency water heater rebates 3.16
In addition to the specific incentive-based CEMs evaluated, the WWU desired stakeholder feedback on potential policies that could be developed during the planning horizon. The measures presented in Table 6-5 include a variety of policies that have been implemented by communities around the country. The potential savings associated with these policies have not been quantified at this point. It is anticipated that such detailed evaluations would be performed during the implementation period.

6.0—STAKEHOLDER INPUT AND CEM EVALUATION
WBG010912212935MKE 6-5
TABLE 6-5 Potential Policies and Miscellaneous Measures Policies and Miscellaneous Measures Average
Building standards for new construction 4.20
Monthly billing 4.05
Leak inspection and repair upon resale or lease 4.00
Fixture retrofit or replacement upon resale or lease 3.46
Water waste prevention ordinance 3.34
Annual irrigation inspections 3.14
Year-round 1 day per week sprinkling 2.98
Decorative water fountains and swimming pool covers 2.89
6.2.1.5 Other Committee Findings The Conservation Stakeholder Committee met for the third time on January 24, 2012. The goal of the meeting was to provide comments on the Draft Plan; the comments and suggestions were incorporated into the Final Plan. Additionally, the Committee developed a set of consensus messages regarding Waukesha’s conservation program and plan. To be successful, the plan must meet the following criteria:
• Cost-effective. The proposed conservation plan considered cost-effectiveness and return on investment from both customers’ and the utility’s perspective. The majority of water-saving measures appear to be cost-effective. During implementation, WWU should focus on the largest water-using customers (the top 10 percent) to get the “biggest bang for the buck.”
• Flexible and Innovative. To be effective over time, the conservation program should be flexible, allowing the utility staff the discretion to change which measures are implemented, the schedule and the balance between the measures from year to year. Implementation has to be adaptive process with routine trial, assessment and study over time to determine what will work in Waukesha. The plan should allow for innovative ways to save water, such as using sources other than treated water (such as discharges from cooling towers or the wastewater treatment plant) for non-drinking purposes (such as sewer flushing or construction and landscape irrigation).
• Education and Outreach. The long-term success of the conservation program lies in the education of our youth, especially to meet the 2030 goals. In the near-term, the City must present easily understood, clearly communicated information for customers to that they can benchmark and manage their water use. While an underlying message of all communication strategies is that using water efficiently provides benefits to the environment and makes sense financially, information should be tailored to reach customers such as multi-family users, customers in the central city, and bilingual speakers.
• Water Supply Portfolio. Conservation and water-use efficiency is very important and a key strategy in meeting future water needs; however, it is only one strategy to meet long-term water supply needs.
• Efficiency measures should fit Waukesha. Conservation measures, including incentives and policies, should focus on implementing both water-saving technologies and changing water use behavior. Measures should include code revisions for new construction as well as for renovations, and should consider potential unintended consequences that could arise. For example, for some campuses with onsite piping with small scopes, lower flows could lead to collection system maintenance issues.
• Financial and Other Incentives. Conservation programs should provide financial incentives such as rebates or possible grants for innovative site-specific water saving measures with demonstrated savings. The savings may

WAUKESHA WATER CONSERVATION PLAN
6-6 WBG010912212935MKE
be particularly effective in this economy. In addition to financial incentives, the City should consider non-financial incentives such as awards, publicity for water-savings, and rewards for water-savers.
• Strategic Investments. The utility should consider strategically investing in certain activities that advance water conservation efforts and awareness, such as monthly billing, if the benefits outweigh the costs.
6.2.2 Stakeholder Interviews In addition to the ranking completed by the stakeholder committee, WWU also conducted interviews with customers representative of the largest water users to gather more detailed information about how the customers use water, their awareness of conservation measures and effective ways the utility can assist in water-use efficiency for these customers. Because each industry is different, the feedback from the customers can help WWU tailor programs to best meet customers’ needs while achieving the utility overall water use reduction goals. Interviews were conducted with the following customers:
• Waukesha County • Waukesha Memorial Hospital • MetalTek • Country Springs Hotel
Key messages learned during the interviews include the following:
• For hospitals and patient care facilities, care must be taken so that water-saving equipment such as faucet aerators do not conflict with best practices for infection control.
• While some facilities may provide their own laundering services, Waukesha Memorial Hospital outsources its laundry service; thus, a one-size-fits-all approach may not be as effective as programs tailored for individual customers.
• Many industries that use a significant amount of water already have implemented some water use efficiency measures. For example, MetalTek will be installing sub-meters to determine the specific water users within their plant. They reuse and recycle water.
• Focusing on measures that save water and other resources are preferred; WWU should consider programs similar to those offered by WE Energies.
• Some organizations have outreach and training programs and may be able to add water conservation awareness to their offerings. For example, Waukesha County’s Partners in Training program could be an opportunity to bring in a conservation expert to talk to various county communities about conservation.
• WWU could consider adding a small fee to its utility bills to fund conservation programs, similar to the fee assessed by WE Energies for the Wisconsin Focus on Energy initiative.
• Payback periods to recoup investment range in the 2- to 3-year timeframe.
6.2.3 Conservation Awareness Surveys Two important elements of a successful conservation program include a well-designed public education and awareness program and a reasonable estimate of the “market” for conservation technologies. To gather baseline information , the project team conducted a survey to gauge customer awareness and the extent of their water-saving practices. Ideally, a random survey would be conducted on a statistically significant number of WWU customers to validate the findings of the survey conducted for this planning effort. Due to time and budget constraints, a survey of utility employees was conducted as a proxy for customers within the service area.
Approximately 75 survey responses (12 percent of employees) were received. The results were used to provide local data on the potential market for various measures. For example, about 38 percent of the respondents indicated that they had retrofitted their homes with water-saving toilets. While one could conclude that utility employees are likely to have a higher awareness of conservation activities, it was reasonable to assume that about 30 to 40 percent of the homeowners within WWU service area have also changed out their toilets—or, only
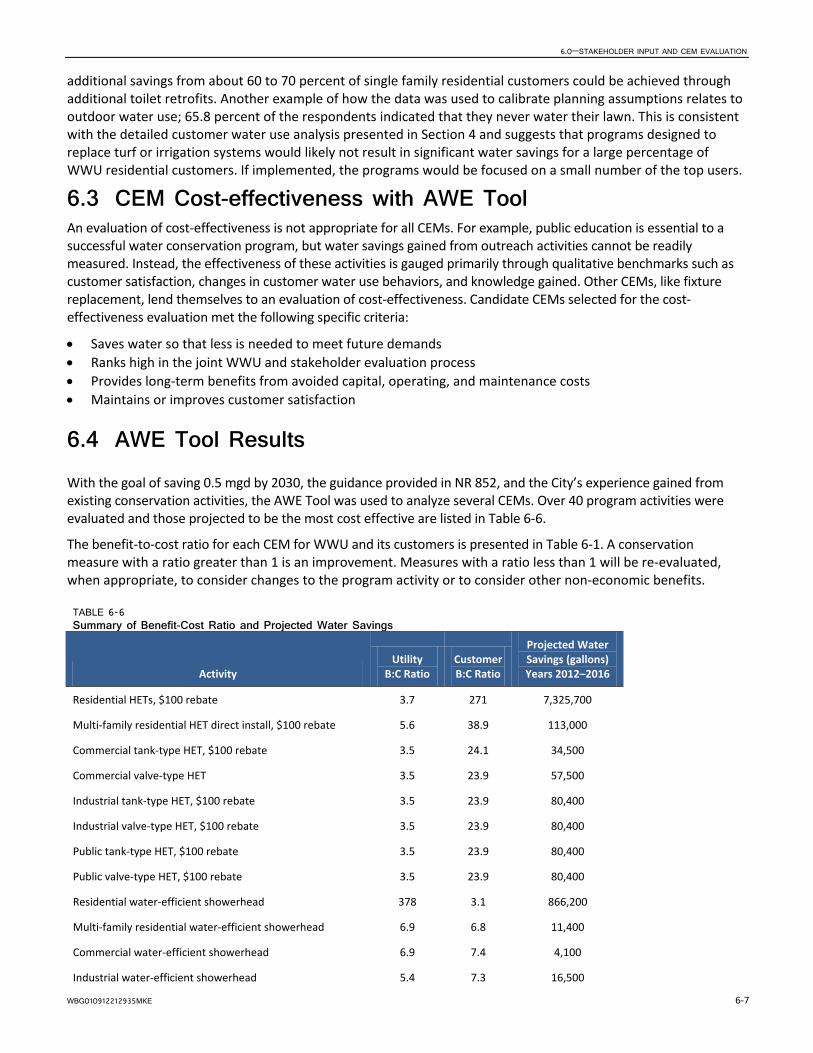
6.0—STAKEHOLDER INPUT AND CEM EVALUATION
WBG010912212935MKE 6-7
additional savings from about 60 to 70 percent of single family residential customers could be achieved through additional toilet retrofits. Another example of how the data was used to calibrate planning assumptions relates to outdoor water use; 65.8 percent of the respondents indicated that they never water their lawn. This is consistent with the detailed customer water use analysis presented in Section 4 and suggests that programs designed to replace turf or irrigation systems would likely not result in significant water savings for a large percentage of WWU residential customers. If implemented, the programs would be focused on a small number of the top users.
6.3 CEM Cost-effectiveness with AWE Tool An evaluation of cost-effectiveness is not appropriate for all CEMs. For example, public education is essential to a successful water conservation program, but water savings gained from outreach activities cannot be readily measured. Instead, the effectiveness of these activities is gauged primarily through qualitative benchmarks such as customer satisfaction, changes in customer water use behaviors, and knowledge gained. Other CEMs, like fixture replacement, lend themselves to an evaluation of cost-effectiveness. Candidate CEMs selected for the cost-effectiveness evaluation met the following specific criteria:
• Saves water so that less is needed to meet future demands • Ranks high in the joint WWU and stakeholder evaluation process • Provides long-term benefits from avoided capital, operating, and maintenance costs • Maintains or improves customer satisfaction
6.4 AWE Tool Results
With the goal of saving 0.5 mgd by 2030, the guidance provided in NR 852, and the City’s experience gained from existing conservation activities, the AWE Tool was used to analyze several CEMs. Over 40 program activities were evaluated and those projected to be the most cost effective are listed in Table 6-6.
The benefit-to-cost ratio for each CEM for WWU and its customers is presented in Table 6-1. A conservation measure with a ratio greater than 1 is an improvement. Measures with a ratio less than 1 will be re-evaluated, when appropriate, to consider changes to the program activity or to consider other non-economic benefits.
TABLE 6-6 Summary of Benefit-Cost Ratio and Projected Water Savings
Activity Utility
B:C Ratio Customer B:C Ratio
Projected Water Savings (gallons) Years 2012–2016
Residential HETs, $100 rebate 3.7 271 7,325,700
Multi-family residential HET direct install, $100 rebate 5.6 38.9 113,000
Commercial tank-type HET, $100 rebate 3.5 24.1 34,500
Commercial valve-type HET 3.5 23.9 57,500
Industrial tank-type HET, $100 rebate 3.5 23.9 80,400
Industrial valve-type HET, $100 rebate 3.5 23.9 80,400
Public tank-type HET, $100 rebate 3.5 23.9 80,400
Public valve-type HET, $100 rebate 3.5 23.9 80,400
Residential water-efficient showerhead 378 3.1 866,200
Multi-family residential water-efficient showerhead 6.9 6.8 11,400
Commercial water-efficient showerhead 6.9 7.4 4,100
Industrial water-efficient showerhead 5.4 7.3 16,500
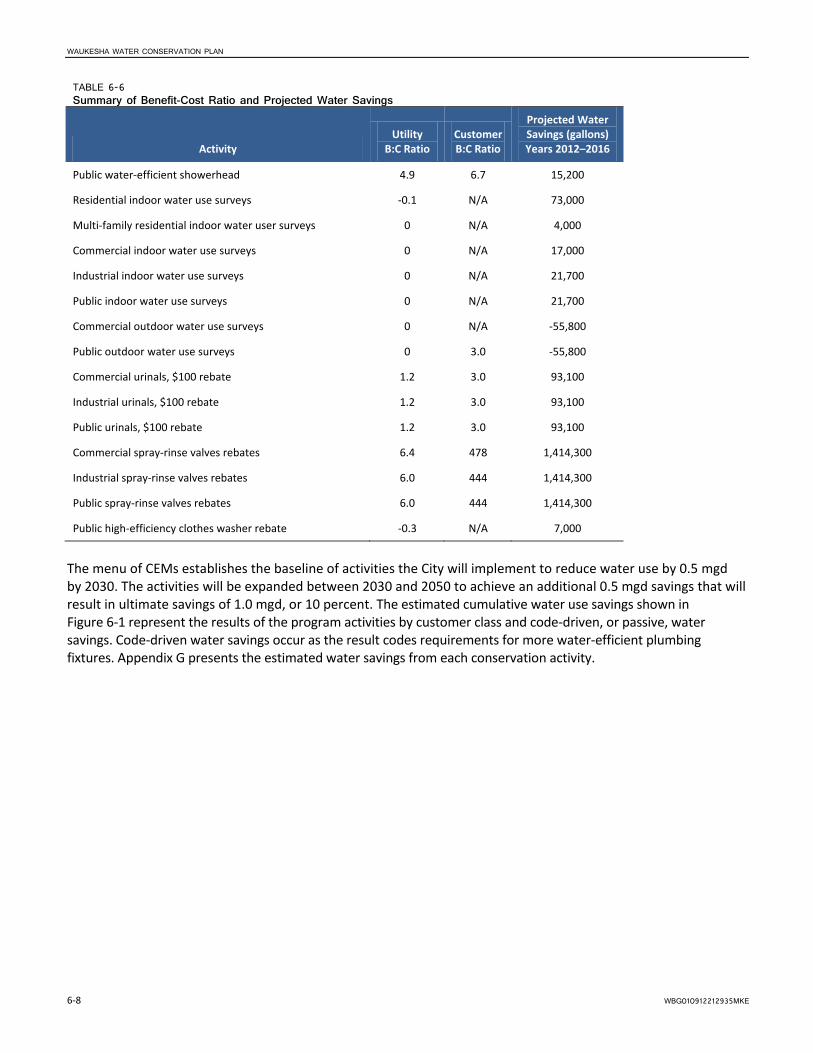
WAUKESHA WATER CONSERVATION PLAN
6-8 WBG010912212935MKE
TABLE 6-6 Summary of Benefit-Cost Ratio and Projected Water Savings
Activity Utility
B:C Ratio Customer B:C Ratio
Projected Water Savings (gallons) Years 2012–2016
Public water-efficient showerhead 4.9 6.7 15,200
Residential indoor water use surveys -0.1 N/A 73,000
Multi-family residential indoor water user surveys 0 N/A 4,000
Commercial indoor water use surveys 0 N/A 17,000
Industrial indoor water use surveys 0 N/A 21,700
Public indoor water use surveys 0 N/A 21,700
Commercial outdoor water use surveys 0 N/A -55,800
Public outdoor water use surveys 0 3.0 -55,800
Commercial urinals, $100 rebate 1.2 3.0 93,100
Industrial urinals, $100 rebate 1.2 3.0 93,100
Public urinals, $100 rebate 1.2 3.0 93,100
Commercial spray-rinse valves rebates 6.4 478 1,414,300
Industrial spray-rinse valves rebates 6.0 444 1,414,300
Public spray-rinse valves rebates 6.0 444 1,414,300
Public high-efficiency clothes washer rebate -0.3 N/A 7,000
The menu of CEMs establishes the baseline of activities the City will implement to reduce water use by 0.5 mgd by 2030. The activities will be expanded between 2030 and 2050 to achieve an additional 0.5 mgd savings that will result in ultimate savings of 1.0 mgd, or 10 percent. The estimated cumulative water use savings shown in Figure 6-1 represent the results of the program activities by customer class and code-driven, or passive, water savings. Code-driven water savings occur as the result codes requirements for more water-efficient plumbing fixtures. Appendix G presents the estimated water savings from each conservation activity.

6.0—STAKEHOLDER INPUT AND CEM EVALUATION
WBG010912212935MKE 6‐9
FIGURE 6-1 Projected Water Savings

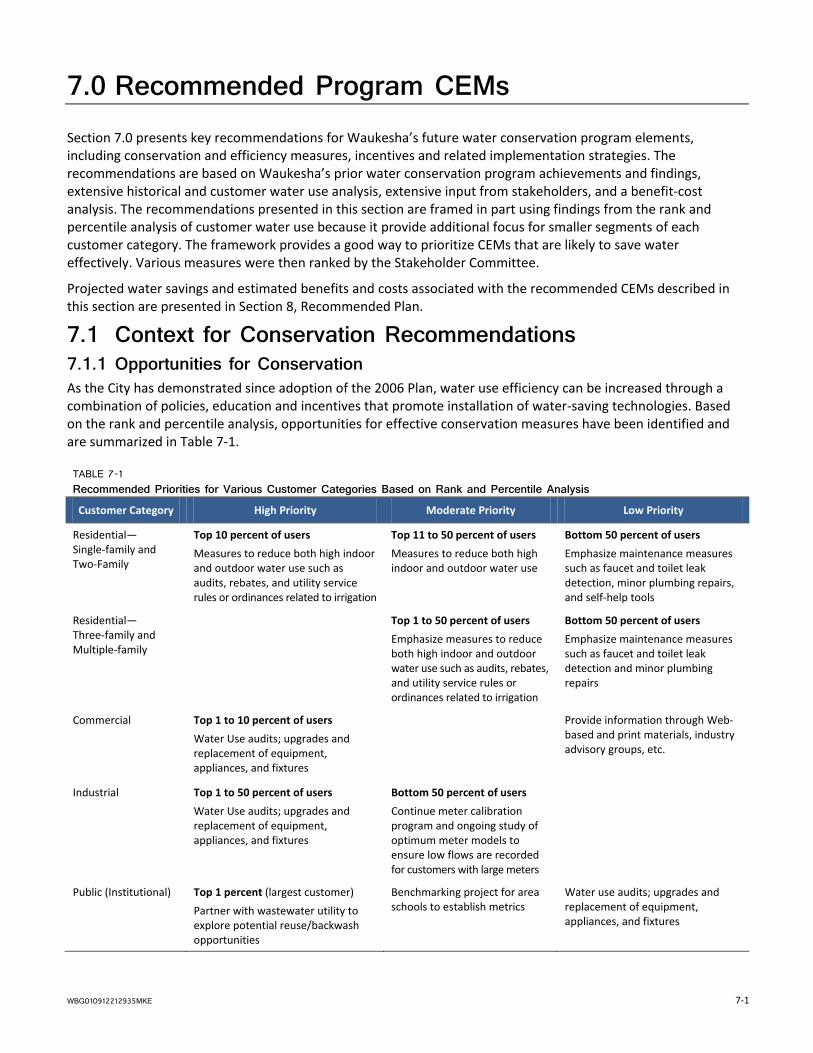
WBG010912212935MKE 7-1
7.0 Recommended Program CEMs Section 7.0 presents key recommendations for Waukesha’s future water conservation program elements, including conservation and efficiency measures, incentives and related implementation strategies. The recommendations are based on Waukesha’s prior water conservation program achievements and findings, extensive historical and customer water use analysis, extensive input from stakeholders, and a benefit-cost analysis. The recommendations presented in this section are framed in part using findings from the rank and percentile analysis of customer water use because it provide additional focus for smaller segments of each customer category. The framework provides a good way to prioritize CEMs that are likely to save water effectively. Various measures were then ranked by the Stakeholder Committee.
Projected water savings and estimated benefits and costs associated with the recommended CEMs described in this section are presented in Section 8, Recommended Plan.
7.1 Context for Conservation Recommendations 7.1.1 Opportunities for Conservation As the City has demonstrated since adoption of the 2006 Plan, water use efficiency can be increased through a combination of policies, education and incentives that promote installation of water-saving technologies. Based on the rank and percentile analysis, opportunities for effective conservation measures have been identified and are summarized in Table 7-1.
TABLE 7-1 Recommended Priorities for Various Customer Categories Based on Rank and Percentile Analysis
Customer Category High Priority Moderate Priority Low Priority
Residential—Single-family and Two-Family
Top 10 percent of users Measures to reduce both high indoor and outdoor water use such as audits, rebates, and utility service rules or ordinances related to irrigation
Top 11 to 50 percent of users Measures to reduce both high indoor and outdoor water use
Bottom 50 percent of users Emphasize maintenance measures such as faucet and toilet leak detection, minor plumbing repairs, and self-help tools
Residential—Three-family and Multiple-family
Top 1 to 50 percent of users Emphasize measures to reduce both high indoor and outdoor water use such as audits, rebates, and utility service rules or ordinances related to irrigation
Bottom 50 percent of users Emphasize maintenance measures such as faucet and toilet leak detection and minor plumbing repairs
Commercial Top 1 to 10 percent of users Water Use audits; upgrades and replacement of equipment, appliances, and fixtures
Provide information through Web-based and print materials, industry advisory groups, etc.
Industrial Top 1 to 50 percent of users Water Use audits; upgrades and replacement of equipment, appliances, and fixtures
Bottom 50 percent of users Continue meter calibration program and ongoing study of optimum meter models to ensure low flows are recorded for customers with large meters
Public (Institutional) Top 1 percent (largest customer) Partner with wastewater utility to explore potential reuse/backwash opportunities
Benchmarking project for area schools to establish metrics
Water use audits; upgrades and replacement of equipment, appliances, and fixtures

WAUKESHA WATER CONSERVATION PLAN
7-2 WBG010912212935MKE
7.1.2 Potential Challenges for Conservation Program WWU has a 2011 staffing level of 32 employees and an operating budget of approximately $7.4 million. Given the WWU’s size and available resources, it is recommended that the conservation program expand slowly with annual work plans focused on specific measures and customer categories.
During implementation, challenges to implementation must be addressed and, potentially, mitigated. Examples of challenges to the implementation of a conservation plan include the following:
• Increased spending demands of an already stretched budget—that is, competition for funding against other essential programs
• Initiation of spending in a troubled economy
• Actual savings less than estimated savings due to the current economy, such as fewer new developments to implement the measures
Furthermore, while conservation programs typically save utilities money in the long term by reducing energy and other variable operating costs and deferring costs for expanded water treatment facilities, reducing water sold can have short-term consequences for the utility’s budget. Gradual implementation will facilitate greater financial stability and allow for multi-year financial forecasts that provide adequate time for customers and utility managers to adjust.
7.2 Water Utility and Other Municipal Infrastructure The City operates and maintains its water system to minimize unaccounted-for water ranges from 3 to 7 percent, well below the AWWA-recommended 10 percent and the PSC action level of 15 percent. Therefore, few additional system operational measures appear to be necessary at this time to further reduce WWU’s unaccounted-for water. Recommendations for additional utility infrastructure CEMs are addressed in this section. Additionally, other water savings can be achieved in other municipal facilities and infrastructure, including the following recommendations:
• Continue measures currently in place (Section 5.3) to maintain the system’s efficiency.
• Develop a unidirectional flushing program within the next 5 years and initiate program within 10 years. Unidirectional flushing thoroughly cleans water mains and requires less water than conventional flushing.
• Explore a partnership with WWU to assess water savings opportunities and costs.
• Install efficient irrigation systems and other landscape practices to save water in City parks and other irrigated areas.
• Consider low-impact development techniques such as re-grading and rain gardens in rights-of-way and other irrigated areas to conserve water, reduce stormwater runoff, and improve stormwater quality.
7.3 Public Education and Information WWU actively provides information to its staff, the public, its customers, and school-age children. Communication is the foundation of a successful conservation program. The first step is to provide a foundation of the importance of conservation and then build upon that to encourage participation in a particular program. Given the available resources, it will be important for WWU to partner with others in the community to reach the broadest number of water customers. Key recommendations for the outreach and education include the following:
• Leverage technology to stretch limited resources.
− Expand the WWU Web site’s online library of resources and work to have other agencies and non-profit groups include the WWU Web site link on their Web sites.
− Make online water use calculator available to customers.
7.0—RECOMMENDED PROGRAM CEMS
WBG010912212935MKE 7-3
− Provide water-saving information on program-specific (CEM) matters and streamline rebate processing and tracking using Web-based applications.
− Develop software program to manage data used to track water use to facilitate internal reporting and reporting to regulatory agencies (such as PSC).
• Develop partnerships with public and private organizations to spread the conservation message.
− Provide “Teach the Teacher” workshops to augment limited staff resources for school education program.
− Work with local universities to establish internship programs, course-related projects to collect and analyze data, and lecture series related to water resource management and conservation.
− Work with Waukesha County’s “Partners in Training” program to bring in a conservation expert to talk to various county communities about conservation.
− Train WWU and City staff to present conservation programs as part of a WWU speakers bureau.
− Work with Wisconsin Focus on Energy and WE Energies on conservation information and rebate programs.
− Continue to work with business groups to distribute a limited number of rain barrels to raise awareness about water use.
− Continue to work with regional conservation groups to develop conservation awareness programs.
• Market CEMs to specific customer groups.
− Implement annual or biannual themes that focus written materials, workshops, and meetings on specific high water use customers or specific water uses. (For example, one theme might be a 1-year focused effort for hospitals followed by years for schools, manufacturers, or parks. General conservation messages and information will be available, but not a priority effort, during that year.)
− Expand water use audit program to provide self-audits for residential customers using the online calculator recommended previously, and also to provide a limited number of field irrigation audits for the top 10 percent of residential users.
− Conduct a limited number of industrial audits each year for top users to assist owners and operators in identifying water-saving measures unique to their sites.
− Conduct a limited number of onsite irrigation audits for CII customers and residential customers with large irrigated acreage.
− Hold industry- or customer-specific workshops or training sessions for specific programs (for example, work with a restaurant association to develop focused outreach to restaurants for commercial kitchen CEMS).
− Conduct individual meetings with top CII users to assist with savings measures.
• Work with local media, professional associations, and non-profit groups to publish articles on the benefits of water conservation and specific programs.
7.4 Rebates and Other Incentives Incentives to encourage conservation include financial incentives such as rebates and other approaches. Financial incentives can include rebates, equipment or fixture distributions, or direct installation or repairs. While similar in nature, financial incentive program design will differ between the programs to meet the needs of residential and CII customers.

WAUKESHA WATER CONSERVATION PLAN
7-4 WBG010912212935MKE
7.4.1 Residential Incentives The following are incentives for residential customers:
• Increase the number of HETs installed by residential customers because they provide significant savings with a high degree of certainty.
− Increase the expenditure per toilet from $25 per toilet to $100.
− Develop a distribution program to efficiently use staff resources in a single annual event rather than administering rebates throughout the year.
− Develop an installation program for qualifying low-income customers and public housing.
• Implement a showerhead replacement program.
− In collaboration with housing managers, develop an installation program for qualifying low-income customers and public housing.
− Distribute and install showerheads as part of an onsite audit or toilet replacement program.
− Consider a rebate program to encourage replacement for those users who would not be likely to install showerheads available for distribution.
• Establish a high-efficiency clothes washer rebate program.
• Develop a leak and minor plumbing repair program for qualifying low-income customers and public housing.
• Distribute rain gauges or sensors to high water users with large lots or high peak seasonal use.
• Establish an irrigation technology or sprinkler head replacement rebate.
• Develop a recognition program for customers who meet conservation goals.
7.4.2 Commercial, Industrial, and Institutional (Public) Incentives CII customers typically have unique water using characteristics even within the same industry. Therefore, evaluating potential measures and developing implementation approaches takes time. This planning effort was constrained by budget and time and did not include detailed industry- and customer-specific analyses.
Recommendations for the customer categories identify measures that are anticipated to be effective; however, some additional research may be required during the implementation period. Key recommendations include the following activities:
• Expand the HET model replacement program to include light commercial applications and other CII facilities where their use is recommended. This program can be done through rebates, distribution, or direct installation approaches.
• Provide rebates for water-efficient showerheads for facilities with showers, such as schools with locker rooms or dormitories, hospitals, and hotels.
• Implement the other incentives listed in Section 5.3.3.2 over time with priority given to those measures needing little or no further research, apply to high water use customers and are the most cost-effective.
• Develop a recognition or conservation certification programs for customers who meet conservation goals or standards, such as manufacturers, institutions, and homeowners that have achieved significant water savings through conservation.
• Form customer working group(s) or councils to share ideas for saving water and to provide feedback to WWU staff on new CEMs or ways to more effectively administer programs.

7.0—RECOMMENDED PROGRAM CEMS
WBG010912212935MKE 7-5
7.4.3 Partnerships Regional partnerships can be an effective way to share costs and effectively use limited resources. Some potential recommendations regarding partnerships include the following:
• Where applicable, develop inter-local agreements with other utilities in the region for joint installation programs or purchasing of fixtures and appliances such as HET models for distribution.
• Coordinate public messaging, link Web resources, and build a shared program identity or brand that represents the region and its partners.
7.4.4 Data Collection and Evaluation One of the most difficult challenges for a conservation program is evaluating the effectives of various measures and programs over time. Early in the implementation process, WWU should develop a database to track expenditures, water use by customers to conduct before-and-after studies for program participants, water savings attributed to specific measures, and other similar information. Recommendations regarding data collection include the following:
• Long-term customer water use efficiency tracking:
− Benchmark common end users, such as schools and hospitals, to develop metrics such as gallons per day per student, per square foot, or per bed.
− Continue adding NAICS codes to customer accounts. This step will help WWU over the long term to be able to quickly identify water demand trends and conservation program priorities among customer groups.
− Link customer accounts with the rebate application and receipt processing data to facilitate future before–and-after evaluations and other program evaluations.
7.5 Policies, Regulation, and Governance A number of policies were explored during the planning process and evaluated by the stakeholder group. The policies will require time to develop and vet with customers, decision makers, and other stakeholders before they are proposed for final adoption as municipal ordinances or water service rules.
7.5.1 New Construction Generally, implementing water-saving elements in new buildings and construction is more cost-effective than retrofitting existing structures and landscapes.
Develop water-saving standards for new construction. This ordinance would establish requirements for new construction to require certain water efficiency standards for indoor and outdoor water use.
7.5.2 Waste Prevention and Leak Repair Require leak inspection and repair upon resale or lease. This utility service rule or ordinance would require that a property be inspected for existing and potential indoor and outdoor leaks prior to signing of property resale or lease agreements. This policy could be implemented in one of several ways, such as at the point a property owner seeks a certificate of occupancy or when a new customer initiates water service. Generally, the policy would provide that indoor leak inspections and repair be conducted.
Develop a water waste prevention ordinance. Water waste prevention ordinances establish general rules for water use that prevent non-beneficial use of water. Because many such practices increase water runoff, they can also benefit stormwater quality efforts. Elements of such a policy could include the following: prohibiting offsite runoff from hose washing of driveways, sidewalks, and patios; prohibiting car washing in paved areas (such as, parking lots and driveways); increased cycles of concentration for new cooling towers; prohibiting single-pass water-cooled ice machines; and requiring positive shutoff valves for handheld dishwashing wands.
Require annual irrigation inspections for customers with large irrigated areas. This utility service rule or ordinance would establish requirements for irrigation system inspections for large properties, such as properties

WAUKESHA WATER CONSERVATION PLAN
7-6 WBG010912212935MKE
irrigating 5 acres or more, athletic fields, and golf courses. Generally, the policy would require annual inspections and completion of a simple form documenting that an inspection was conducted and any necessary water waste repairs and adjustments were made.
7.5.3 Billing and Pricing Evaluate costs and benefits of monthly billing. More frequent billing increases customer awareness of water use and can help identify customer water leaks more quickly. The financial signal from seasonal or inverted block rates (that is, higher cost per gallon of water used as volume increases) is stronger with more frequent billing and may offset some of the additional costs required for a monthly billing system.
Ensure full-cost recovery. Water pricing plays a role in a comprehensive conservation program. Conducting cost-of-service studies enables a utility to allocate those capital and variable costs to the highest water users that contribute to those costs. This policy can be accomplished through rate structures, meter fees, surcharges, and other methods. Full-cost recovery is also a way to maintain the utility’s financial stability over time as water consumption is reduced as a result of conservation programs.
7.5.4 Enforcement Investigate whether amending WWU water service rules, rather than establishing ordinances, would be allowed as a means to enhance enforcement of water use regulations and policies. Used by some utilities, such as the Southern Nevada Water Authority, this approach would allow WWU to exact a fee directly on a customer’s water bill for violating water use restrictions instead of managing a burdensome and costly court or hearing process.
7.5.5 Other Policies for Consideration in the Long Term Some policies that have been implemented by other utilities across the country may be appropriate for WWU as its conservation program develops over the longer-term. Policies for longer-term implementation include the following:
• Requiring fixture and appliance replacement upon resale, lease, or change of occupancy
• Year-round lawn and landscape sprinkling schedule with additional restrictions, such as a maximum of 1 day per week or reduced hours
• Requiring efficiency measures for decorative water features, fountains, and swimming pools
7.6 Other Recommendations In addition to those activities that directly save water or provide public education and information, other activities, described in this subsection, are recommended for inclusion in the implementation plan.
7.6.1 Annual Reporting WWU prepares annual reports to the PSC as required and will continue to do so. An additional recommendation related to annual reporting is that WWU should consider reconvening the Conservation Stakeholder Committee annually to present information on the implementation status, seek customer feedback, and solicit help with implementation challenges.
7.6.2 Monitoring Plan To monitor the actual costs and water savings that result from implementing CEMs, the City should continue to gather and review water use and financial data. To determine the overall effectiveness of CEMs, the City solicits feedback from customers. Monitoring the results of water conservation efforts is a part of routine City operations. Annually, the City reports a detailed analysis of the water conservation program to the PSC.
To facilitate collection and reporting of the extensive data, WWU should consider developing Web-based rebate application and tracking processes and leverage database tools to collect information and generate reports required by the PSC and for its own management purposes. Potentially, WWU could partner with one of the local colleges to develop the database tools as a course project.

7.0—RECOMMENDED PROGRAM CEMS
WBG010912212935MKE 7-7
7.6.3 Updating Conservation Plan The implementation plan presented in Section 8 is a road map for implementing water conservation programs and measures to achieve the City’s conservation goals. Considerably more detail is provided for activities in the first 5 years of the program than in later years. To keep pace with changing conditions, enhanced technologies, and customer water use patterns, actual implementation should be flexible. CEMs, programs, policies, and education/marketing efforts should be adjusted based on actual results. Furthermore, several of the more complicated recommendations require detailed research that may result in actual implementation being substantially different from that discussed in this plan.
A more formal update to the plan should be conducted every 5 years.


WBG010912212935MKE 8-1
8.0 Recommended Plan This section presents the recommended Water Conservation Plan for a 5-year planning period, 2012 to 2016. Projected water savings, benefits, costs, recommended program budget, and describes the implementation schedule based on the recommended CEMs (Section 7). The recommended Plan is the summation of the results of research, input from stakeholders and customers, and detailed analysis by WWU staff and the consultant team.
8.1 Projected Water Savings The City’s water conservation goal is to reduce annual average demand by 0.5 mgd by year 2030. This flow rate is equivalent to a cumulative volume of about 182.5 million gallons (MG) water saved through year 2030. The AWE Tool was used to estimate the projected water savings from conservation program measures and from passive savings that are the result of plumbing code changes that require water efficient fixtures. The estimated water savings since 2006 and the projected water savings from the recommended CEMs through 2016 are summarized in Figure 8-1. The result is over 86 MG saved through year 2016, which indicates the City will be in a strong position to achieve its water savings goal of 182.5 MG by 2030.
This approach reflects a gradual but significant expansion of the conservation program. As noted in Section 7, it is important to maintain credibility through well-planned and administered conservation measures. Successful conservation programs across the country have suffered set-backs resulting from launching measures that were difficult for customers to use and difficult to administrator. Therefore, it is recommended the program now focus on expanding conservation measures with the highest potential for cost-effective water savings and on learning more about the City’s top 1 and top 10 percent water users to target future conservation measures. The actions will ensure a strong return on the City’s investment while maintaining customer satisfaction and utility service standards.
TABLE 8-1 Total Projected Cumulative Water Savings (million gallons per year)
Customer Class 2007 2008 2009 2010 2011 2012 2013 2014 2015 2016
Residential 6.1 12.0 17.7 23.0 28.1 35.4 43.2 51.0 59.1 67.0
Commercial 1.7 3.4 5.0 6.5 7.9 9.3 11.0 12.5 14.1 16.0
Industrial 0.1 0.2 0.2 0.3 0.4 0.5 0.8 1.2 1.6 2.2
Public - - - - - - 0.3 0.6 0.9 1.5
Total 7.9 15.5 22.9 29.8 36.4 45.2 55.3 65.4 75.8 86.8

WAUKESHA WATER CONSERVATION PLAN
8-2 WBG010912212935MKE
FIGURE 8-1 Projected Water Savings
8.2 Other Projected Benefits Water conservation provides other benefits to the City and its customers, including the following:
• Reduced wastewater pumping and treatment costs • Reduced water pumping and treatment costs • Reduced volume of water needed to meet projected future water demands • Fewer greenhouse gas emissions from water and wastewater treatment and pumping
Some estimated projected savings resulting from the implementation of water-saving CEMs are summarized in Table 8-2.
TABLE 8-2
Estimated Savings from Utility-Avoided Costs Avoided Cost Type 2012 2013 2014 2015 2016
Water Supply $400 $1,100 $2,100 $3,400 $5,300
Wastewater $300 $900 $1,600 $2,600 $4,100
8.3 Benefit-Cost Analysis As noted in Section 6.4, CEMs were evaluated using the AWE Tool to estimate benefit-cost ratio. Those selected for implementation are summarized in Table 8-3.

8.0—RECOMMENDED PLAN
WBG010912212935MKE 8-3
TABLE 8-3 Summary of Benefit-Cost Ratio and Projected Water Savings
Activity Utility
B:C Ratio Customer B:C Ratio
Projected Water Savings (gallons) Years 20122016
Residential HETs, $100 rebate 3.7 271 7,325,700
Multi-family residential HET direct install, $100 rebate 5.6 38.9 113,000
Commercial tank-type HET, $100 rebate 3.5 24.1 34,500
Commercial valve-type HET 3.5 23.9 57,500
Industrial tank-type HET, $100 rebate 3.5 23.9 80,400
Industrial valve-type HET, $100 rebate 3.5 23.9 80,400
Public tank-type HET, $100 rebate 3.5 23.9 80,400
Public valve-type HET, $100 rebate 3.5 23.9 80,400
Residential water-efficient showerhead 378 3.1 866,200
Multi-family residential water-efficient showerhead 6.9 6.8 11,400
Commercial water-efficient showerhead 6.9 7.4 4,100
Industrial water-efficient showerhead 5.4 7.3 16,500
Public water-efficient showerhead 4.9 6.7 15,200
Residential indoor water use surveys -0.1 N/A 73,000
Multi-family residential indoor water user surveys 0 N/A 4,000
Commercial indoor water use surveys 0 N/A 17,000
Industrial indoor water use surveys 0 N/A 21,700
Public indoor water use surveys 0 N/A 21,700
Commercial outdoor water use surveys 0 N/A -55,800
Public outdoor water use surveys 0 3.0 -55,800
Commercial urinals, $100 rebate 1.2 3.0 93,100
Industrial urinals, $100 rebate 1.2 3.0 93,100
Public urinals, $100 rebate 1.2 3.0 93,100
Commercial spray-rinse valves rebates 6.4 478 1,414,300
Industrial spray-rinse valves rebates 6.0 444 1,414,300
Public spray-rinse valves rebates 6.0 444 1,414,300
Public high-efficiency clothes washer rebate -0.3 N/A 7,000
8.4 Projected Program Costs The projected costs of water saving CEMs are summarized in Table 8-4. Activity details and allocation of program costs across all customer sectors are included in Appendix G. Cost estimates include rebates, customer water use audits, public education and outreach, and administrative costs for program management, performance auditing, customer service and annual reporting. It was assumed that WWU staff would administer the program. The cost estimates rely, in part, on data provided in the AWE Tool with adjustments for local conditions and
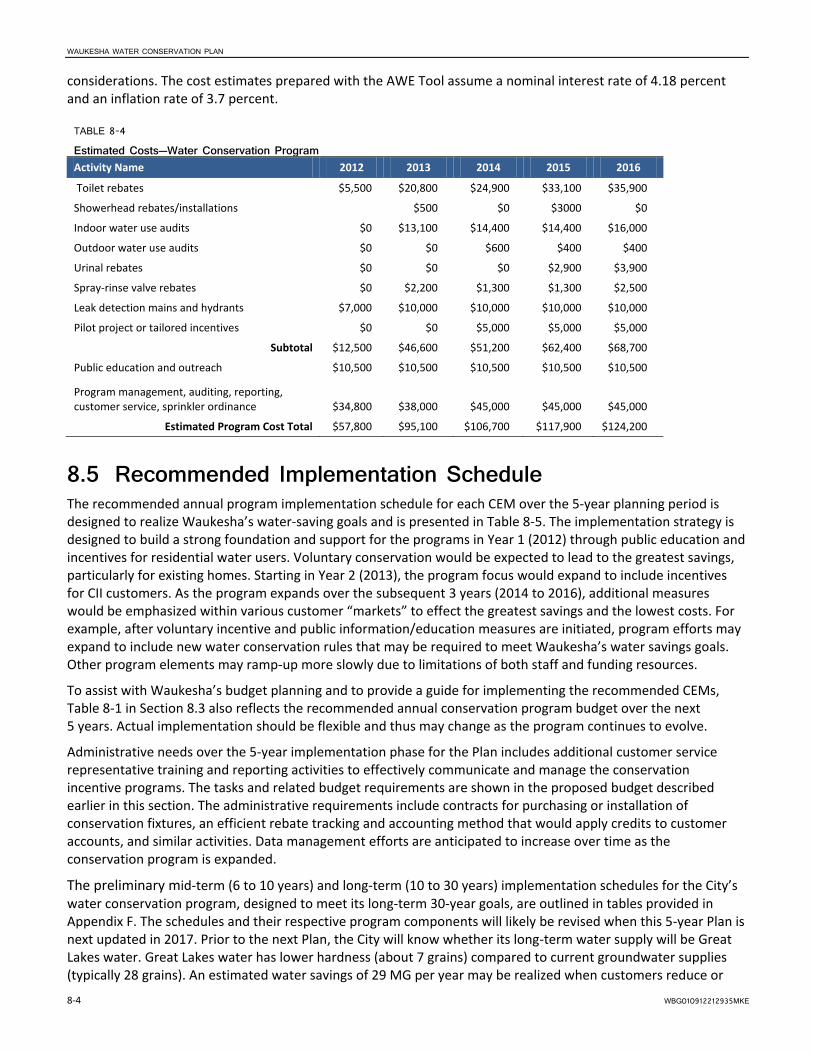
WAUKESHA WATER CONSERVATION PLAN
8-4 WBG010912212935MKE
considerations. The cost estimates prepared with the AWE Tool assume a nominal interest rate of 4.18 percent and an inflation rate of 3.7 percent.
TABLE 8-4
Estimated Costs—Water Conservation Program Activity Name 2012 2013 2014 2015 2016
Toilet rebates $5,500 $20,800 $24,900 $33,100 $35,900
Showerhead rebates/installations $500 $0 $3000 $0
Indoor water use audits $0 $13,100 $14,400 $14,400 $16,000
Outdoor water use audits $0 $0 $600 $400 $400
Urinal rebates $0 $0 $0 $2,900 $3,900
Spray-rinse valve rebates $0 $2,200 $1,300 $1,300 $2,500
Leak detection mains and hydrants $7,000 $10,000 $10,000 $10,000 $10,000
Pilot project or tailored incentives $0 $0 $5,000 $5,000 $5,000
Subtotal $12,500 $46,600 $51,200 $62,400 $68,700
Public education and outreach $10,500 $10,500 $10,500 $10,500 $10,500
Program management, auditing, reporting, customer service, sprinkler ordinance $34,800 $38,000 $45,000 $45,000 $45,000
Estimated Program Cost Total $57,800 $95,100 $106,700 $117,900 $124,200
8.5 Recommended Implementation Schedule The recommended annual program implementation schedule for each CEM over the 5-year planning period is designed to realize Waukesha’s water-saving goals and is presented in Table 8-5. The implementation strategy is designed to build a strong foundation and support for the programs in Year 1 (2012) through public education and incentives for residential water users. Voluntary conservation would be expected to lead to the greatest savings, particularly for existing homes. Starting in Year 2 (2013), the program focus would expand to include incentives for CII customers. As the program expands over the subsequent 3 years (2014 to 2016), additional measures would be emphasized within various customer “markets” to effect the greatest savings and the lowest costs. For example, after voluntary incentive and public information/education measures are initiated, program efforts may expand to include new water conservation rules that may be required to meet Waukesha’s water savings goals. Other program elements may ramp-up more slowly due to limitations of both staff and funding resources.
To assist with Waukesha’s budget planning and to provide a guide for implementing the recommended CEMs, Table 8-1 in Section 8.3 also reflects the recommended annual conservation program budget over the next 5 years. Actual implementation should be flexible and thus may change as the program continues to evolve.
Administrative needs over the 5-year implementation phase for the Plan includes additional customer service representative training and reporting activities to effectively communicate and manage the conservation incentive programs. The tasks and related budget requirements are shown in the proposed budget described earlier in this section. The administrative requirements include contracts for purchasing or installation of conservation fixtures, an efficient rebate tracking and accounting method that would apply credits to customer accounts, and similar activities. Data management efforts are anticipated to increase over time as the conservation program is expanded.
The preliminary mid-term (6 to 10 years) and long-term (10 to 30 years) implementation schedules for the City’s water conservation program, designed to meet its long-term 30-year goals, are outlined in tables provided in Appendix F. The schedules and their respective program components will likely be revised when this 5-year Plan is next updated in 2017. Prior to the next Plan, the City will know whether its long-term water supply will be Great Lakes water. Great Lakes water has lower hardness (about 7 grains) compared to current groundwater supplies (typically 28 grains). An estimated water savings of 29 MG per year may be realized when customers reduce or

8.0—RECOMMENDED PLAN
WBG010912212935MKE 8-5
discontinue using water softeners. If the City’s long-term water supply is Great Lakes water, it will implement a public education campaign to explain the potential water savings and operational and maintenance cost savings provided by reduced or discontinued water softener use.

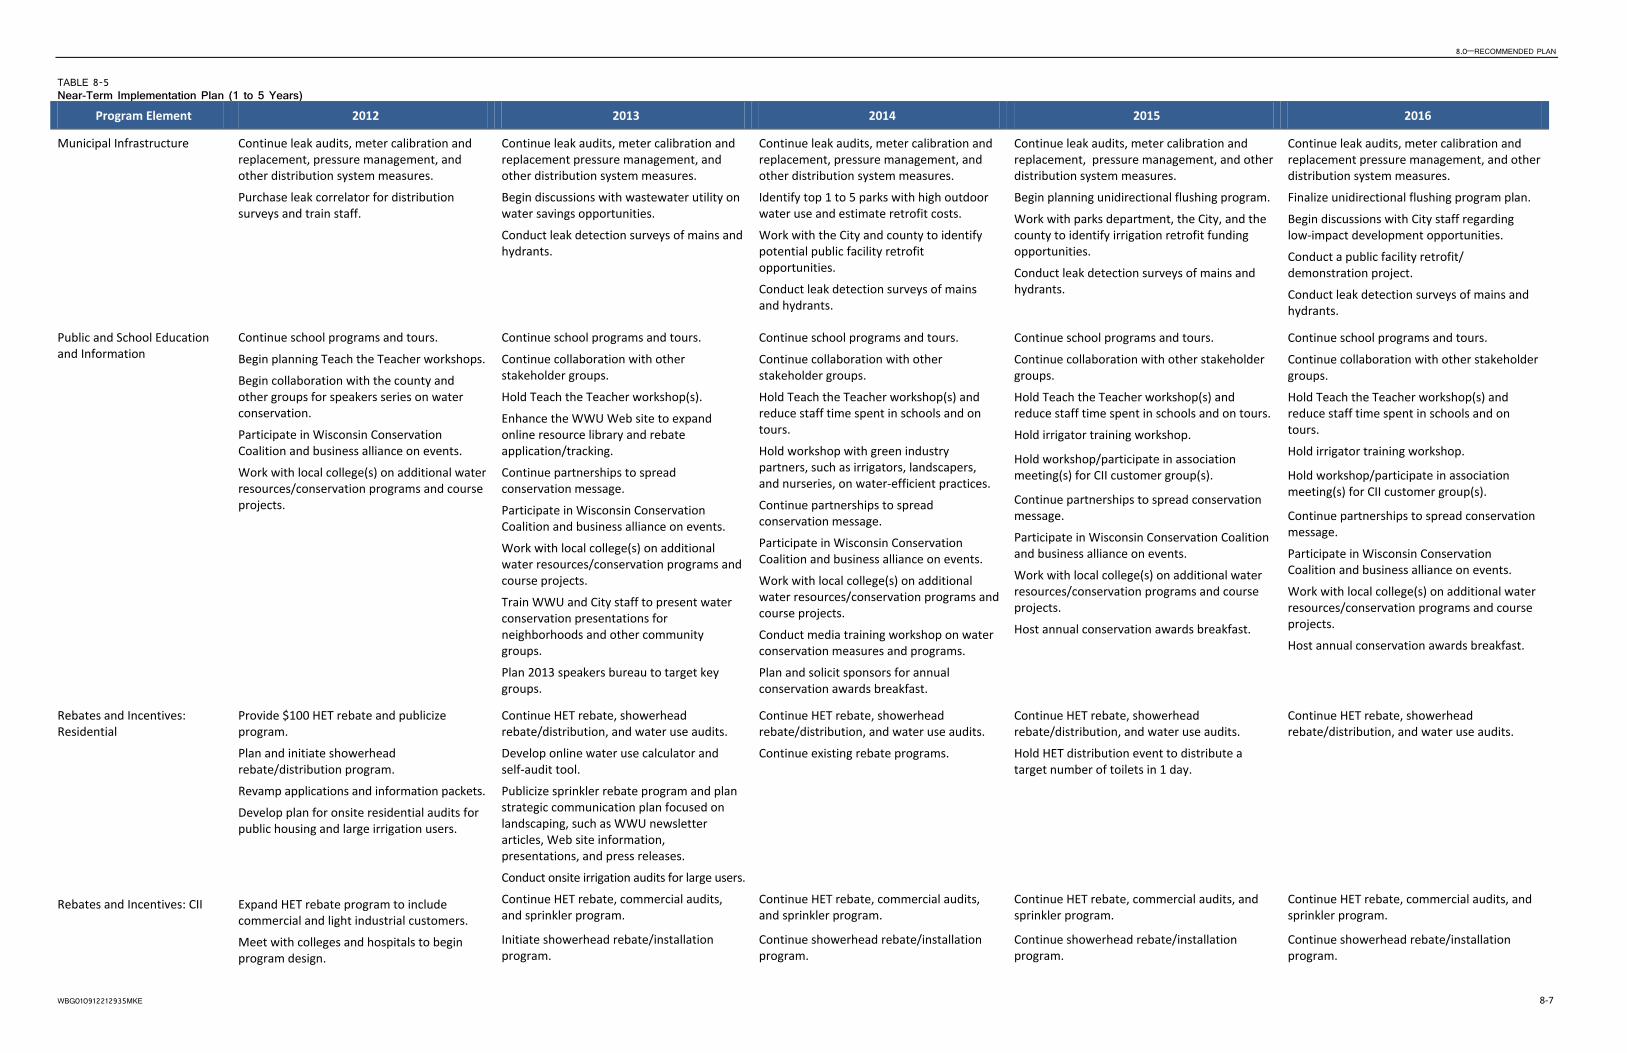
8.0—RECOMMENDED PLAN
WBG010912212935MKE 8-7
TABLE 8-5 Near-Term Implementation Plan (1 to 5 Years)
Program Element 2012 2013 2014 2015 2016
Municipal Infrastructure Continue leak audits, meter calibration and replacement, pressure management, and other distribution system measures.
Purchase leak correlator for distribution surveys and train staff.
Continue leak audits, meter calibration and replacement pressure management, and other distribution system measures.
Begin discussions with wastewater utility on water savings opportunities.
Conduct leak detection surveys of mains and hydrants.
Continue leak audits, meter calibration and replacement, pressure management, and other distribution system measures.
Identify top 1 to 5 parks with high outdoor water use and estimate retrofit costs.
Work with the City and county to identify potential public facility retrofit opportunities.
Conduct leak detection surveys of mains and hydrants.
Continue leak audits, meter calibration and replacement, pressure management, and other distribution system measures.
Begin planning unidirectional flushing program.
Work with parks department, the City, and the county to identify irrigation retrofit funding opportunities.
Conduct leak detection surveys of mains and hydrants.
Continue leak audits, meter calibration and replacement pressure management, and other distribution system measures.
Finalize unidirectional flushing program plan.
Begin discussions with City staff regarding low-impact development opportunities.
Conduct a public facility retrofit/
Conduct leak detection surveys of mains and hydrants.
demonstration project.
Public and School Education and Information
Continue school programs and tours.
Begin planning Teach the Teacher workshops.
Begin collaboration with the county and other groups for speakers series on water conservation.
Participate in Wisconsin Conservation Coalition and business alliance on events.
Work with local college(s) on additional water resources/conservation programs and course projects.
Continue school programs and tours.
Continue collaboration with other stakeholder groups.
Hold Teach the Teacher workshop(s).
Enhance the WWU Web site to expand online resource library and rebate application/tracking.
Continue partnerships to spread conservation message.
Participate in Wisconsin Conservation Coalition and business alliance on events.
Work with local college(s) on additional water resources/conservation programs and course projects.
Train WWU and City staff to present water conservation presentations for neighborhoods and other community groups.
Plan 2013 speakers bureau to target key groups.
Continue school programs and tours.
Continue collaboration with other stakeholder groups.
Hold Teach the Teacher workshop(s) and reduce staff time spent in schools and on tours.
Hold workshop with green industry partners, such as irrigators, landscapers, and nurseries, on water-efficient practices.
Continue partnerships to spread conservation message.
Participate in Wisconsin Conservation Coalition and business alliance on events.
Work with local college(s) on additional water resources/conservation programs and course projects.
Conduct media training workshop on water conservation measures and programs.
Plan and solicit sponsors for annual conservation awards breakfast.
Continue school programs and tours.
Continue collaboration with other stakeholder groups.
Hold Teach the Teacher workshop(s) and reduce staff time spent in schools and on tours.
Hold irrigator training workshop.
Hold workshop/participate in association meeting(s) for CII customer group(s).
Continue partnerships to spread conservation message.
Participate in Wisconsin Conservation Coalition and business alliance on events.
Work with local college(s) on additional water resources/conservation programs and course projects.
Host annual conservation awards breakfast.
Rebates and Incentives: Residential
Provide $100 HET rebate and publicize program.
Plan and initiate showerhead rebate/distribution program.
Revamp applications and information packets.
Develop plan for onsite residential audits for public housing and large irrigation users.
Continue HET rebate, showerhead rebate/distribution, and water use audits.
Develop online water use calculator and self-audit tool.
Publicize sprinkler rebate program and plan strategic communication plan focused on landscaping, such as WWU newsletter articles, Web site information, presentations, and press releases.
Conduct onsite irrigation audits for large users.
Continue HET rebate, showerhead rebate/distribution, and water use audits.
Continue existing rebate programs.
Continue HET rebate, showerhead rebate/distribution, and water use audits.
Hold HET distribution event to distribute a target number of toilets in 1 day.
Continue HET rebate, showerhead rebate/distribution, and water use audits.
Rebates and Incentives: CII Expand HET rebate program to include commercial and light industrial customers.
Meet with colleges and hospitals to begin program design.
Continue HET rebate, commercial audits, and sprinkler program.
Initiate showerhead rebate/installation program.
Continue HET rebate, commercial audits, and sprinkler program.
Continue showerhead rebate/installation program.
Continue HET rebate, commercial audits, and sprinkler program.
Continue showerhead rebate/installation program.
Continue HET rebate, commercial audits, and sprinkler program.
Continue showerhead rebate/installation program.

WAUKESHA WATER CONSERVATION PLAN
8-8 WBG010912212935MKE
TABLE 8-5 Near-Term Implementation Plan (1 to 5 Years)
Program Element 2012 2013 2014 2015 2016
Continue to provide information on commercial audits and develop plan for onsite audit program.
Continue to work with Waukesha Housing Authority on retrofit program.
Develop plan for top 1 percent of CII users.
Initiate spray-rinse valve rebate program.
Initiate pilot program with Waukesha Housing Authority for minor plumbing and leak repair (combined with fixture replacement).
Initiate first phase of fixture replacement/ retrofit program with college.
Plan 2014 CII focus (for example, focus on restaurants, schools, or medical facilities).
Continue spray-rinse valve rebate program.
Continue/expand Housing Authority program.
Plan expansion of minor plumbing repair program to other low income and senior customers.
Continue spray-rinse valve rebate program.
Expand minor plumbing and leak repair program.
Initiate urinal rebate program.
Continue spray-rinse valve rebate program.
Continue urinal rebate program.
Policies, Regulations, and Enforcement
Continue to administer and publicize sprinkling ordinance (continue 2013–2016).
Begin research on various conservation policies to estimate potential savings and costs.
Further explore water conservation requirements in WWU service rules.
Begin stakeholder discussions regarding selected policies.
Draft language for selected policies. Begin process for approval of selected policies.
Reporting, Monitoring, and Plan Updates
Streamlined databases to facilitate auditing and reporting.
CEM effectiveness audit/monitoring.
Prepare and submit annual report to PSC.
Host meeting to present annual results to Stakeholder Committee.
Continue database management, annual effectiveness auditing, annual reporting, and stakeholder engagement.
Continue database management, annual effectiveness auditing, annual reporting, and stakeholder engagement.
Continue database management, annual effectiveness auditing, annual reporting, and stakeholder engagement.
Continue database management, annual effectiveness auditing, annual reporting, and stakeholder engagement. Complete conservation plan update.
Estimated Cumulative Water Savings
45.2 MG 55.3 MG 65.4 MG 75.8 MG 86.8 MG
Estimated Staff Resources 800 hours 1,200 hours 1,200 hours 1,500 hours 1,500 hours
Total Estimated Budget $57,800 $95,100 $106,700 $117,900 $124,200

WBG010912212935MKE 9-1
9.0 References AWWA. 2009. Water Audits and Loss Control Programs. Manual 36.
AWWA. 2010. Water Conservation Programs—A Planning Manual. Manual 52.
Beecher, Janice A. 2010. “The Conservation Conundrum: How Declining Demand Affects Water Utilities.”Journal AWWA. February.
Camp, Dresser & McKee, Inc. and Water Accountability, LLC. 2011. Water Efficiency Potential Study for Wisconsin.
CH2M HILL. 2011. Water Conservation Plan Supplement. April.
City of Waukesha, Wisconsin. 2010. Draft Application for Lake Michigan Water Supply. May.
Earth Tech. 2006. Water System Master Plan, Waukesha Water Utility.
Hoffman, H. W. 2008. “Capturing the Water You Already Have: Using Alternate Onsite Sources.” Journal AWWA. May.
Rockaway, T. D., P. A. Coomes, J. Rivard, and B. Kornstein. 2011. “Residential Water Use Trends in North America. Journal AWWA. February.
SEWRPC. 2010. Regional Water Supply Plan for Southeastern Wisconsin, Technical Report No. 52. December.
Vickers, Amy. 2001. Handbook of Water Use and Conservation: Homes, Landscapes, Businesses, Industries, Farms (WaterPlow Press, Amherst, MA).
Waukesha Water Utility. 2005–2010. Water pumpage data.
Waukesha Water Utility. 1999–2010. Annual Report of the City of Waukesha Water Utility to Public Service Commission of Wisconsin.
Waukesha Water Utility. 2009, 2010. Waukesha Water Utility Conservation Report, Docket-6240-WR-106.
U.S. Census Bureau. 2005–2009 American Community Survey.
U.S. Census Bureau. 2005-2009. Wisconsin Quick Facts, Persons per household.
U.S. Census Bureau. 2010. City of Waukesha population.
U.S. Geological Survey. 2005. Estimated Use of Water in the United States in 2005. http://ga.water.usgs.gov/edu/wateruse/pdf/wudomestic-2005.pdf.

Appendix A Summary of Water Requirements


Final Draft Technical Memorandum
200 Indiana Avenue T 715.341.8110
Stevens Point, WI F 715.341.7390
54481 www.aecom.com
May 28, 2009 To: Nancy Quirk, Waukesha Water Utility Copy: Richard Hope, AECOM From: Kathy Beduhn, AECOM Subject: Summary of Water Requirements
Waukesha, Wisconsin As part of the 2006 Water System Master Plan project, historical water customer demands and pumpage records were reviewed and future water requirements were projected. This technical memorandum summarizes updated water pumpage projections considering 2006, 2007, and 2008 water pumpage and sales information and updated population projections for the City of Waukesha. POPULATION PROJECTIONS The Wisconsin Department of Administration estimated the 2008 population of the City of Waukesha to be 68,030. The following table summarizes the population projections developed by the Southeastern Wisconsin Regional Planning Commission for the Waukesha water supply service area that were used to update water pumpage projections.
WATER CONSUMPTION The following sections summarize historical water consumption including water metered and sold to customers, total water pumpage, per capita water usage, and system maximum day demand. Metered Water Sales and Water Pumpage A summary of historical water sales and pumpage is provided in Table 1. Water sales and total pumpage have decreased slightly in the past 5 years. Over the 39-year period of data summarized in the table, water sales varied from a low of 2,366 million gallons per year (MGY) in 2008 to a high of 3,462 MGY in 1988. Total pumpage over the 39-year period has varied from a low of 2,366 MGY in 2008 to 3,607 MGY in 1988.
SUMMARY OF POPULATION PROJECTIONS Year Population 2028 85,800 2035 88,500
Ultimate 97,400 Source: Letter from Southeastern Wisconsin Regional Planning Commission dated March 17, 2009 (included in Attachment A).

Summary of Water Requirements May 28, 2009 Page 2
Per Capita Water Usage City of Waukesha residential, commercial, and public water usage can be related to the City’s population. An analysis of per capital water consumption for each of these customer classifications was performed from sales records and is summarized in Table 2. As indicated in this table, overall per capita sales to residential, commercial, and public customers have all remained fairly constant or declined slightly since the early 1990s. Figure 1 illustrates the City of Waukesha per capital consumption trends since 1970. To project future water needs, the average daily water usage projection for customers was updated to reflect recent trends in water consumption. The per capital water consumption rate is summarized in the following table.
System Maximum Day Pumpage Table 3 summarizes the average and maximum day pumpage for each year from 1970 to 2008. A statistical analysis was performed of historical maximum day pumpage ratios. Two periods of analysis were examined, the entire period of 1970 to 2008, and the latest 11-year period from 1998 to 2008. Table 4 summarizes the results of this analysis. Table 4 also includes an analysis of expected maximum day pumpage ratios for various confidence levels. To evaluation future water supply needs, a maximum day pumpage ratio of 168 percent was used which provides a confidence level of 98 percent based on maximum day pumpage ratios over the last 39 years and an approximately 96 percent confidence level over the last 11 years WATER CONSUMPTION AND PUMPAGE PROJECTIONS Water sales and pumpage projections were based on assumptions of water demand, coupled with estimates of future populations. A detailed summary of the individual components of the projected water sales and pumpage requirements is provided in Table 5. The industrial sales projections are based on planning data provided during the Water System Master Plan project that included an ultimate industrial acreage slightly less than the existing acreage and some large customer surveys indicating a decline in current water usage. In addition, unaccounted-for water (difference between pumpage and sales) was estimated to be 7 percent.
PER CAPITA WATER CONSUMPTION RATE Per Capita Sales Residential Commercial Public
Average 1970 to 2008 53 gpcd 32 gpcd 8 gpcd Maximum 1970 to 2008 72 gpcd 39 gpcd 13 gpcd Minimum 1970 to 2008 43 gpcd 19 gpcd 4 gpcd Average 2000 to 2008 46 gpcd 36 gpcd 5 gpcd Average 2005 to 2008 45 gpcd 34 gpcd 4 gpcd
Used for Projection 45 gpcd 35 gpcd 5 gpcd Note: gpcd = gallons per capita per day

Summary of Water Requirements May 28, 2009 Page 3
Figure 2 and Figure 3 illustrate the projected average and maximum day water supply requirements, respectively. The supply projections for the ultimate population projection for the City of Waukesha are illustrated as year 2050. The lower band illustrated on Figures 2 and 3 represents the projected water supply requirements based on current knowledge of water usage and population trends; however, there are uncertainties inherent to these projections. Because of the importance of not underestimating the future water supply needs, upper bands for projected water supply requirements were established. The upper bands for water supply projections illustrated in Figure 2 (average day) and Figure 3 (maximum day) are based on the following: 1. Residential per capita demand increased from 45 gpcd to 50 gpcd. 2. Commercial per capita demand increased from 35 gpcd to 39 gpcd. 3. Public per capita demand increased from 5 gpcd to 6 gpcd. 4. Increased population projection for 2028 by 10 percent to 94,380. 5. Increased population projection for 2035 by 10 percent to 97,350. 6. Increased ultimate population projection by 10 percent to 107,140. 7. Population projection was assumed to remain as projected to 2015 and then estimated
linearly to the 2028 increased population projection. It is recommended for long-term planning purpose that the upper band for average and maximum day water supply be used. It is also recommended that water supply be continually updated to ensure a proactive response to changes in population growth, development, and water demand patterns are addressed SUMMARY The following table summarizes the upper band of water supply needs for the City of Waukesha which is recommended to be used for planning purposes.
l:\work\projects\105762\wp\n1\finaldraft090528_wau_demand_tm.doc
SUMMARY OF WATER SUPPLY NEEDS Year Average Day Demand Maximum Day Demand 2015 8.8 MGD 14.8 MGD 2028 10.7 MGD 18.0 MGD 2035 11.0 MGD 18.5 MGD
Ultimate (2050) 12.0 MGD 20.2 MGD Note: MGD= million gallons per day


TABLES

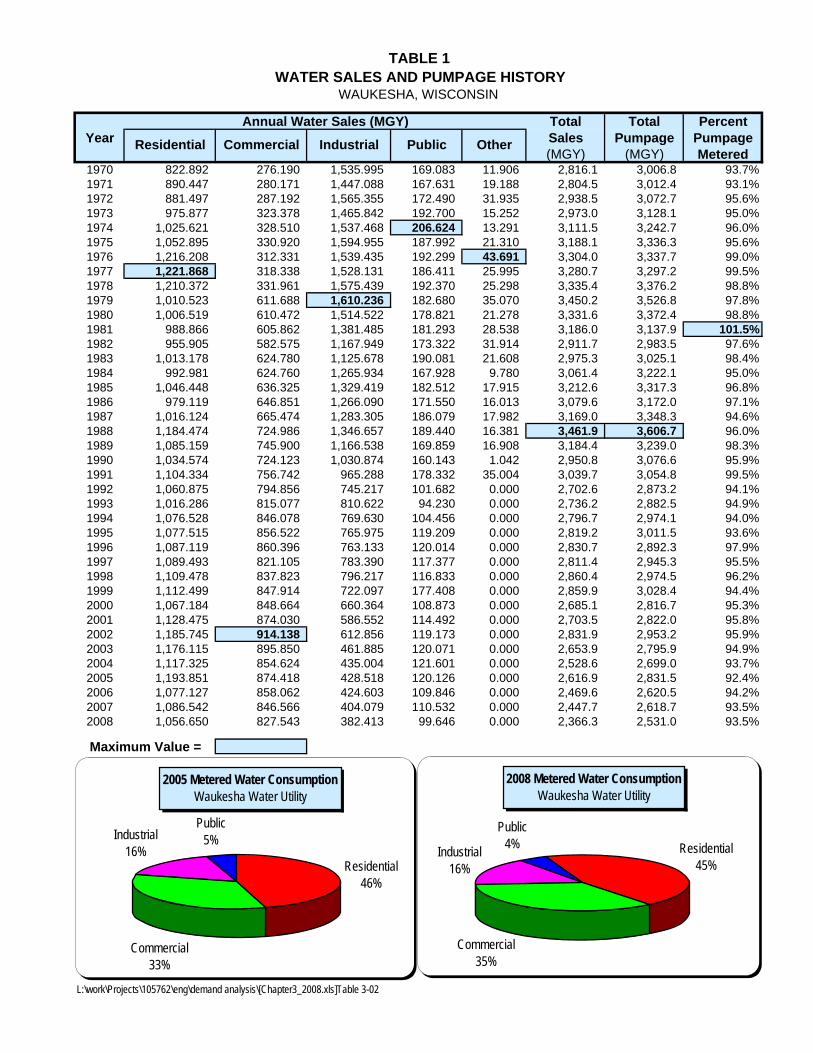
TABLE 1WATER SALES AND PUMPAGE HISTORY
WAUKESHA, WISCONSIN
Annual Water Sales (MGY) Total Total PercentYear Sales Pumpage Pumpage
(MGY) (MGY) Metered1970 822.892 276.190 1,535.995 169.083 11.906 2,816.1 3,006.8 93.7%1971 890.447 280.171 1,447.088 167.631 19.188 2,804.5 3,012.4 93.1%1972 881.497 287.192 1,565.355 172.490 31.935 2,938.5 3,072.7 95.6%1973 975.877 323.378 1,465.842 192.700 15.252 2,973.0 3,128.1 95.0%1974 1,025.621 328.510 1,537.468 206.624 13.291 3,111.5 3,242.7 96.0%1975 1,052.895 330.920 1,594.955 187.992 21.310 3,188.1 3,336.3 95.6%1976 1,216.208 312.331 1,539.435 192.299 43.691 3,304.0 3,337.7 99.0%1977 1,221.868 318.338 1,528.131 186.411 25.995 3,280.7 3,297.2 99.5%1978 1,210.372 331.961 1,575.439 192.370 25.298 3,335.4 3,376.2 98.8%1979 1,010.523 611.688 1,610.236 182.680 35.070 3,450.2 3,526.8 97.8%1980 1,006.519 610.472 1,514.522 178.821 21.278 3,331.6 3,372.4 98.8%1981 988.866 605.862 1,381.485 181.293 28.538 3,186.0 3,137.9 101.5%1982 955.905 582.575 1,167.949 173.322 31.914 2,911.7 2,983.5 97.6%1983 1,013.178 624.780 1,125.678 190.081 21.608 2,975.3 3,025.1 98.4%1984 992.981 624.760 1,265.934 167.928 9.780 3,061.4 3,222.1 95.0%1985 1,046.448 636.325 1,329.419 182.512 17.915 3,212.6 3,317.3 96.8%1986 979.119 646.851 1,266.090 171.550 16.013 3,079.6 3,172.0 97.1%1987 1,016.124 665.474 1,283.305 186.079 17.982 3,169.0 3,348.3 94.6%1988 1,184.474 724.986 1,346.657 189.440 16.381 3,461.9 3,606.7 96.0%1989 1,085.159 745.900 1,166.538 169.859 16.908 3,184.4 3,239.0 98.3%1990 1,034.574 724.123 1,030.874 160.143 1.042 2,950.8 3,076.6 95.9%1991 1,104.334 756.742 965.288 178.332 35.004 3,039.7 3,054.8 99.5%1992 1,060.875 794.856 745.217 101.682 0.000 2,702.6 2,873.2 94.1%1993 1,016.286 815.077 810.622 94.230 0.000 2,736.2 2,882.5 94.9%1994 1,076.528 846.078 769.630 104.456 0.000 2,796.7 2,974.1 94.0%1995 1,077.515 856.522 765.975 119.209 0.000 2,819.2 3,011.5 93.6%1996 1,087.119 860.396 763.133 120.014 0.000 2,830.7 2,892.3 97.9%1997 1,089.493 821.105 783.390 117.377 0.000 2,811.4 2,945.3 95.5%1998 1,109.478 837.823 796.217 116.833 0.000 2,860.4 2,974.5 96.2%1999 1,112.499 847.914 722.097 177.408 0.000 2,859.9 3,028.4 94.4%2000 1,067.184 848.664 660.364 108.873 0.000 2,685.1 2,816.7 95.3%2001 1,128.475 874.030 586.552 114.492 0.000 2,703.5 2,822.0 95.8%2002 1,185.745 914.138 612.856 119.173 0.000 2,831.9 2,953.2 95.9%2003 1,176.115 895.850 461.885 120.071 0.000 2,653.9 2,795.9 94.9%2004 1,117.325 854.624 435.004 121.601 0.000 2,528.6 2,699.0 93.7%2005 1,193.851 874.418 428.518 120.126 0.000 2,616.9 2,831.5 92.4%2006 1,077.127 858.062 424.603 109.846 0.000 2,469.6 2,620.5 94.2%2007 1,086.542 846.566 404.079 110.532 0.000 2,447.7 2,618.7 93.5%2008 1,056.650 827.543 382.413 99.646 0.000 2,366.3 2,531.0 93.5%
Maximum Value =
L:\work\Projects\105762\eng\demand analysis\[Chapter3_2008.xls]Table 3-02
OtherResidential IndustrialCommercial Public
2005 Metered Water ConsumptionWaukesha Water Utility
Industrial16%
Public5%
Commercial33%
Residential46%
2008 Metered Water ConsumptionWaukesha Water Utility
Industrial16%
Public4%
Commercial35%
Residential45%

TABLE 2HISTORICAL PER CAPITA CONSUMPTION
WAUKESHA WATER UTILITYWAUKESHA, WISCONSIN
Estimated Gallons per capita per dayYear Population Residential Commercial Industrial Public Total1970 39,695 56.8 19.1 106.0 11.7 1941971 40,762 59.8 18.8 97.3 11.3 1881972 41,829 57.7 18.8 102.5 11.3 1921973 42,896 62.3 20.7 93.6 12.3 1901974 43,963 63.9 20.5 95.8 12.9 1941975 45,030 64.1 20.1 97.0 11.4 1941976 46,097 72.3 18.6 91.5 11.4 1961977 47,164 71.0 18.5 88.8 10.8 1911978 48,231 68.8 18.9 89.5 10.9 1891979 49,298 56.2 34.0 89.5 10.2 1921980 50,365 54.8 33.2 82.4 9.7 1811981 51,024 53.1 32.5 74.2 9.7 1711982 51,684 50.7 30.9 61.9 9.2 1541983 52,343 53.0 32.7 58.9 9.9 1561984 53,002 51.3 32.3 65.4 8.7 1581985 53,662 53.4 32.5 67.9 9.3 1641986 54,321 49.4 32.6 63.9 8.7 1551987 54,980 50.6 33.2 63.9 9.3 1581988 55,639 58.3 35.7 66.3 9.3 1701989 56,299 52.8 36.3 56.8 8.3 1551990 56,958 49.8 34.8 49.6 7.7 1421991 57,613 52.5 36.0 45.9 8.5 1451992 58,268 49.9 37.4 35.0 4.8 1271993 58,923 47.3 37.9 37.7 4.4 1271994 59,578 49.5 38.9 35.4 4.8 1291995 60,232 49.0 39.0 34.8 5.4 1281996 60,887 48.9 38.7 34.3 5.4 1271997 61,542 48.5 36.6 34.9 5.2 1251998 62,197 48.9 36.9 35.1 5.1 1261999 63,027 48.4 36.9 31.4 7.7 1242000 64,825 45.1 35.9 27.9 4.6 1132001 65,324 47.3 36.7 24.6 4.8 1132002 66,237 49.0 37.8 25.3 4.9 1172003 66,807 48.2 36.7 18.9 4.9 1092004 66,816 45.8 35.0 17.8 5.0 1042005 67,580 48.4 35.4 17.4 4.9 1062006 67,750 43.6 34.7 17.2 4.4 1002007 67,880 43.9 34.2 16.3 4.5 992008 68,030 42.6 33.4 15.4 4.0 96
Maximum Value =
L:\work\Projects\105762\eng\demand analysis\[Chapter3_2008.xls]Table 3-04
2005 Per Capita ConsumptionWaukehsa Water Utility
48 gpcd35 gpcd
17 gpcd5 gpcd
0
20
40
60
Residential Commercial Industrial Public
2008 Per Capita ConsumptionWaukehsa Water Utility
43 gpcd33 gpcd
15 gpcd4 gpcd
01020304050
Residential Commercial Industrial Public
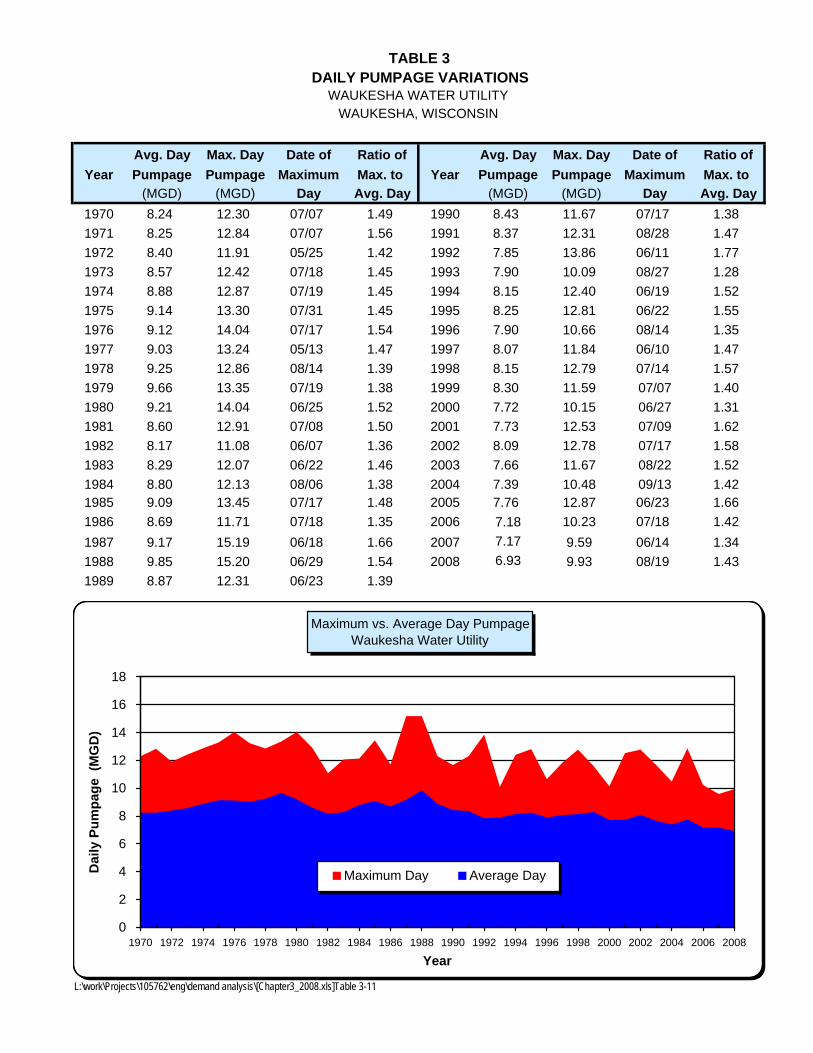
TABLE 3DAILY PUMPAGE VARIATIONS
WAUKESHA WATER UTILITYWAUKESHA, WISCONSIN
Avg. Day Max. Day Date of Ratio of Avg. Day Max. Day Date of Ratio of
Year Pumpage Pumpage Maximum Max. to Year Pumpage Pumpage Maximum Max. to
(MGD) (MGD) Day Avg. Day (MGD) (MGD) Day Avg. Day
1970 8.24 12.30 07/07 1.49 1990 8.43 11.67 07/17 1.38
1971 8.25 12.84 07/07 1.56 1991 8.37 12.31 08/28 1.47
1972 8.40 11.91 05/25 1.42 1992 7.85 13.86 06/11 1.77
1973 8.57 12.42 07/18 1.45 1993 7.90 10.09 08/27 1.28
1974 8.88 12.87 07/19 1.45 1994 8.15 12.40 06/19 1.52
1975 9.14 13.30 07/31 1.45 1995 8.25 12.81 06/22 1.55
1976 9.12 14.04 07/17 1.54 1996 7.90 10.66 08/14 1.35
1977 9.03 13.24 05/13 1.47 1997 8.07 11.84 06/10 1.47
1978 9.25 12.86 08/14 1.39 1998 8.15 12.79 07/14 1.57
1979 9.66 13.35 07/19 1.38 1999 8.30 11.59 07/07 1.40
1980 9.21 14.04 06/25 1.52 2000 7.72 10.15 06/27 1.31
1981 8.60 12.91 07/08 1.50 2001 7.73 12.53 07/09 1.62
1982 8.17 11.08 06/07 1.36 2002 8.09 12.78 07/17 1.58
1983 8.29 12.07 06/22 1.46 2003 7.66 11.67 08/22 1.52
1984 8.80 12.13 08/06 1.38 2004 7.39 10.48 09/13 1.421985 9.09 13.45 07/17 1.48 2005 7.76 12.87 06/23 1.66
1986 8.69 11.71 07/18 1.35 2006 7.18 10.23 07/18 1.42
1987 9.17 15.19 06/18 1.66 2007 7.17 9.59 06/14 1.34
1988 9.85 15.20 06/29 1.54 2008 6.93 9.93 08/19 1.43
1989 8.87 12.31 06/23 1.39
L:\work\Projects\105762\eng\demand analysis\[Chapter3_2008.xls]Table 3-11
Maximum vs. Average Day PumpageWaukesha Water Utility
0
2
4
6
8
10
12
14
16
18
1970 1972 1974 1976 1978 1980 1982 1984 1986 1988 1990 1992 1994 1996 1998 2000 2002 2004 2006 2008
Year
Dai
ly P
um
pag
e (
MG
D)
Maximum Day Average Day

TABLE 4
STATISTICAL ANALYSIS:RATIO OF MAXIMUM TO AVERAGE DAY DEMAND
WAUKESHA WATER UTILITY
WAUKESHA, WISCONSIN
1998 to 2008 1970 to 2008
Number of years of Data 11 39
Maximum Ratio - Max. to Avg. Day Pumpage 165.9% 176.6%
Minimum Ratio - Max. to Avg. Day Pumpage 131.5% 127.8%
Average Ratio Max. to Avg. Day Pumpage 148.0% 146.9%
Standard Deviation 11.1% 10.3%
Ratio of Max. to Ratio of Max. to
Confidence Level (%) Avg. Day Pumpage Avg. Day Pumpage
80% 157% 156%
85% 159% 158%
90% 162% 160%
95% 166% 164%
98% 171% 168%
99% 174% 171%
Note
The "Confidence Level" represents the probability (%) that in any given year, the actual ratio of maximum to average
day pumpage will be less than or equal to the ratio indicated in the table. The ratios in the table were determined
based on a statistical analysis of historical ratios over each period of analysis, assuming a normal distribution.
L:\work\Projects\105762\eng\demand analysis\[Chapter3_2008.xls]Table 3-12
Historical Maximum Day RatiosWaukesha Water Utility
0.0
0.2
0.4
0.6
0.8
1.0
1.2
1.4
1.6
1.8
2.0
1970 1972 1974 1976 1978 1980 1982 1984 1986 1988 1990 1992 1994 1996 1998 2000 2002 2004 2006 2008
Year
Max
. Day
Rat
io
1.68 Maximum Day Factor Based on Confidence Level
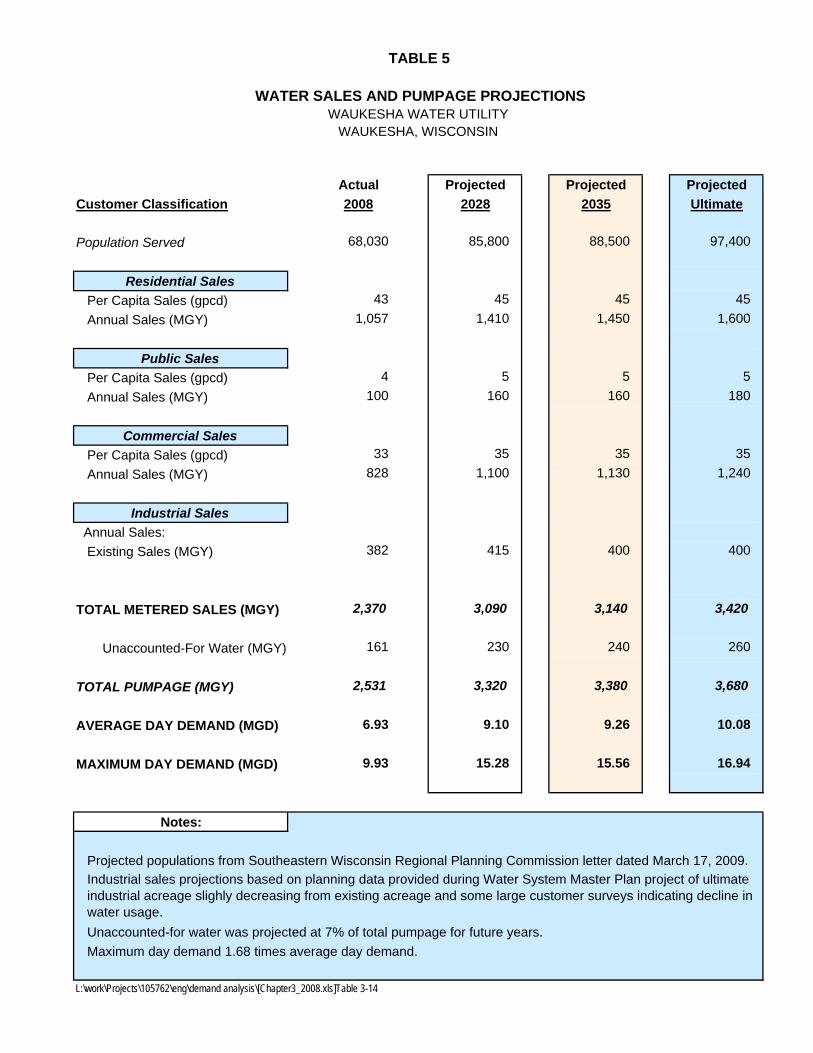
TABLE 5
WATER SALES AND PUMPAGE PROJECTIONSWAUKESHA WATER UTILITY
WAUKESHA, WISCONSIN
Actual Projected Projected Projected
Customer Classification 2008 2028 2035 Ultimate
Population Served 68,030 85,800 88,500 97,400
Residential Sales Per Capita Sales (gpcd) 43 45 45 45
Annual Sales (MGY) 1,057 1,410 1,450 1,600
Public Sales Per Capita Sales (gpcd) 4 5 5 5
Annual Sales (MGY) 100 160 160 180
Commercial Sales Per Capita Sales (gpcd) 33 35 35 35
Annual Sales (MGY) 828 1,100 1,130 1,240
Industrial Sales Annual Sales:
Existing Sales (MGY) 382 415 400 400
TOTAL METERED SALES (MGY) 2,370 3,090 3,140 3,420
Unaccounted-For Water (MGY) 161 230 240 260
TOTAL PUMPAGE (MGY) 2,531 3,320 3,380 3,680
AVERAGE DAY DEMAND (MGD) 6.93 9.10 9.26 10.08
MAXIMUM DAY DEMAND (MGD) 9.93 15.28 15.56 16.94
Notes:
Projected populations from Southeastern Wisconsin Regional Planning Commission letter dated March 17, 2009.
Unaccounted-for water was projected at 7% of total pumpage for future years.
Maximum day demand 1.68 times average day demand.
L:\work\Projects\105762\eng\demand analysis\[Chapter3_2008.xls]Table 3-14
Industrial sales projections based on planning data provided during Water System Master Plan project of ultimate industrial acreage slighly decreasing from existing acreage and some large customer surveys indicating decline in water usage.


FIGURES

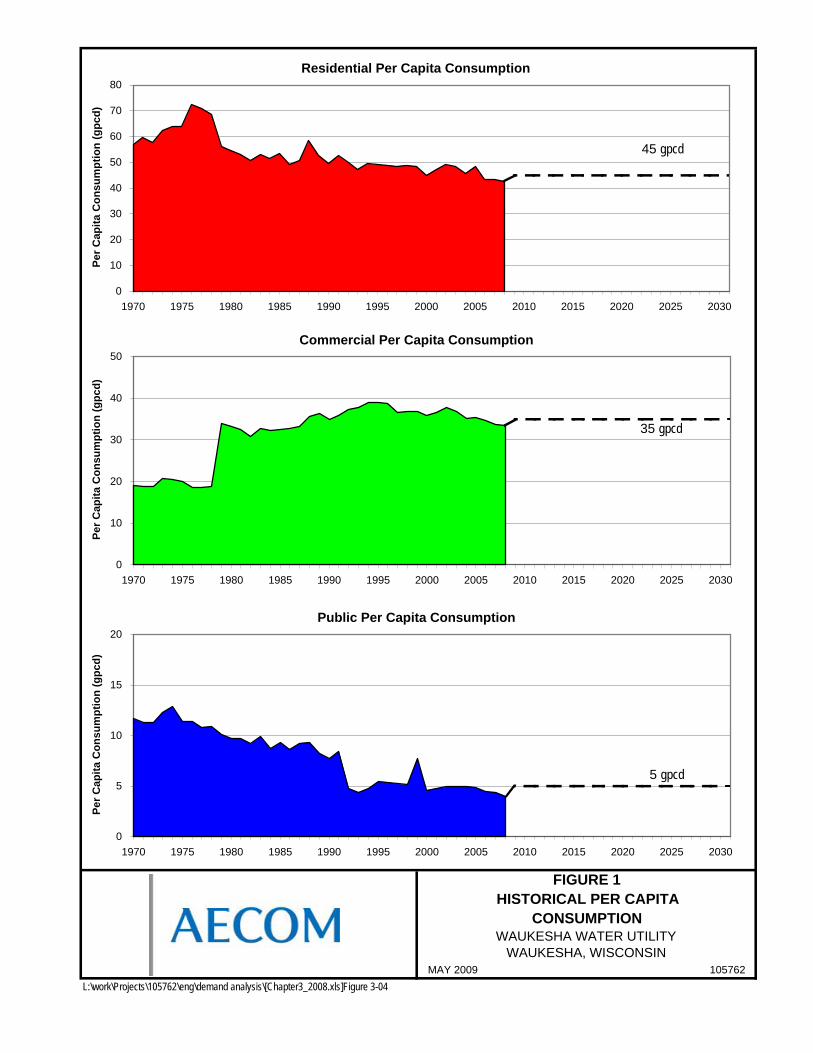
MAY 2009 105762
L:\work\Projects\105762\eng\demand analysis\[Chapter3_2008.xls]Figure 3-04
FIGURE 1HISTORICAL PER CAPITA
CONSUMPTIONWAUKESHA WATER UTILITY
WAUKESHA, WISCONSIN
Residential Per Capita Consumption
0
10
20
30
40
50
60
70
80
1970 1975 1980 1985 1990 1995 2000 2005 2010 2015 2020 2025 2030
Per
Cap
ita
Co
nsu
mp
tio
n (
gp
cd)
45 gpcd
Commercial Per Capita Consumption
0
10
20
30
40
50
1970 1975 1980 1985 1990 1995 2000 2005 2010 2015 2020 2025 2030
Per
Cap
ita
Co
nsu
mp
tio
n (
gp
cd)
35 gpcd
Public Per Capita Consumption
0
5
10
15
20
1970 1975 1980 1985 1990 1995 2000 2005 2010 2015 2020 2025 2030
Per
Cap
ita
Co
nsu
mp
tio
n (
gp
cd)
5 gpcd
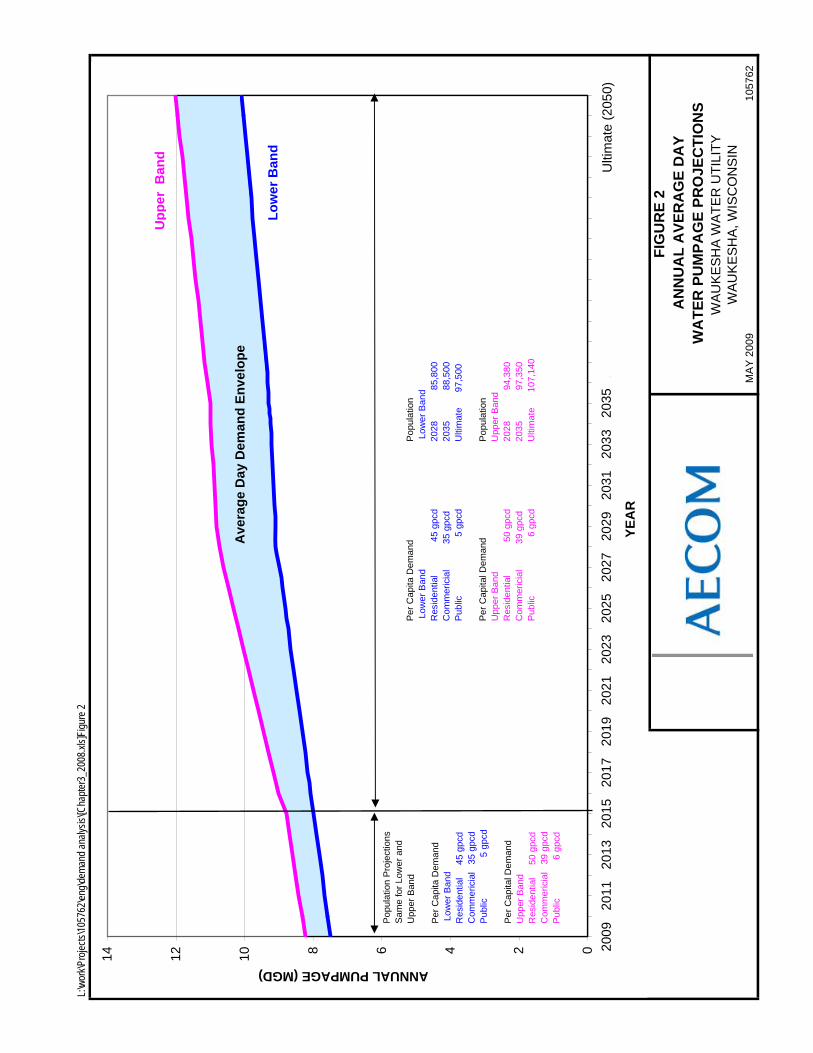
L:\wo
rk\Pr
ojects
\1057
62\en
g\dem
and a
nalys
is\[C
hapte
r3_2
008.x
ls]Fig
ure 2
M
AY
200
910
5762
FIG
UR
E 2
AN
NU
AL
AV
ER
AG
E D
AY
WA
TE
R P
UM
PA
GE
PR
OJE
CT
ION
SW
AU
KE
SH
A W
AT
ER
UT
ILIT
YW
AU
KE
SH
A, W
ISC
ON
SIN
02468101214
2009
2011
2013
2015
2017
2019
2021
2023
2025
2027
2029
2031
2033
2035
2037
2039
2041
2043
2045
2047
2049
YE
AR
ANNUAL PUMPAGE (MGD)
Pop
ulat
ion
Pro
ject
ions
Sam
e fo
r Lo
wer
and
U
pper
Ban
d
Per
Cap
ita D
eman
d L
ower
Ban
dR
esid
entia
l
45 g
pcd
Com
mer
icia
l 3
5 gp
cdP
ublic
5
gpc
d
Per
Cap
ital D
eman
d U
pper
Ban
dR
esid
entia
l
50 g
pcd
Com
mer
icia
l 3
9 gp
cdP
ublic
6
gpcd
Ulti
mat
e (2
050)
Up
per
Ban
d
Per
Cap
ita D
eman
d L
ower
Ban
dR
esid
entia
l
45
gpcd
Com
mer
icia
l
3
5 gp
cdP
ublic
5
gpc
d
Per
Cap
ital D
eman
d U
pper
Ban
dR
esid
entia
l
50
gpcd
Com
mer
icia
l
3
9 gp
cdP
ublic
6
gpc
d
Lo
wer
Ban
d
Pop
ulat
ion
Low
er B
and
2028
85,8
0020
35
88
,500
Ulti
mat
e
97,
500
Pop
ulat
ion
Upp
er B
and
2028
94,3
8020
35
97
,350
Ulti
mat
e
107
,140
Ave
rag
e D
ay D
eman
d E
nve
lop
e

L:\wo
rk\Pr
ojects
\1057
62\en
g\dem
and a
nalys
is\[C
hapte
r3_2
008.x
ls]Fig
ure 3
M
AY
200
910
5762
FIG
UR
E 3
AN
NU
AL
MA
XIM
UM
DA
YW
AT
ER
PU
MP
AG
E P
RO
JEC
TIO
NS
WA
UK
ES
HA
WA
TE
R U
TIL
ITY
WA
UK
ES
HA
, WIS
CO
NS
IN
0246810121416182022
2009
2011
2013
2015
2017
2019
2021
2023
2025
2027
2029
2031
2033
2035
2037
2039
2041
2043
2045
2047
2049
YE
AR
ANNUAL PUMPAGE (MGD)
Pop
ulat
ion
Pro
ject
ions
Sam
e fo
r Lo
wer
and
U
pper
Ban
d
Per
Cap
ita D
eman
d L
ower
Ban
dR
esid
entia
l
45 g
pcd
Com
mer
icia
l 3
5 gp
cdP
ublic
5
gpc
d
Per
Cap
ital D
eman
d U
pper
Ban
dR
esid
entia
l
50 g
pcd
Com
mer
icia
l 3
9 gp
cdP
ublic
6
gpc
d
Ulti
mat
e (2
050)
Up
per
Ban
d
Per
Cap
ita D
eman
d L
ower
Ban
dR
esid
entia
l
45
gpcd
Com
mer
icia
l
3
5 gp
cdP
ublic
5
gpc
d
Per
Cap
ital D
eman
d U
pper
Ban
dR
esid
entia
l
50
gpcd
Com
mer
icia
l
3
9 gp
cdP
ublic
6
gpc
d
Lo
wer
Ban
d
Pop
ulat
ion
Low
er B
and
2028
85,8
0020
35
88
,500
Ulti
mat
e
97,
500
Pop
ulat
ion
Upp
er B
and
2028
94,3
8020
35
97
,350
Ulti
mat
e
107
,140
Max
imu
m D
ay D
eman
d E
nve
lop
e
Max
imum
Day
Dem
and
1.68
tim
es A
vera
ge D
ay D
eman
d.


ATTACHMENT A
POPULATION PROJECTIONS


Appendix B City PSC Compliance Status


Appendix C System Pressure Management


\ AECOM
200 Indiana Avenue
Stevens Point, WI 54481
www.aecom.com
715 341 8110 tel
715 341 7390 fax
Final Memorandum
1.0 INTRODUCTION
The City of Waukesha has submitted an application to the Wisconsin Department of Natural Resources (DNR) for the diversion of Lake Michigan water. The DNR has requested additional information on and clarification of the application. Specifically, Wisconsin Administrative Code NR 852 (Table 2) requires the review of distribution system pressure management to determine if opportunities exist to reduce water system pressure and minimize water loss, and the DNR has requested clarification of whether Waukesha Water Utility is operating the water system within acceptable water system pressures, especially with respect to minimizing water loss. This memorandum responds to that specific request for clarification. The Wisconsin Administrative Code NR 852 requiring the review of the distribution system pressure management is documented below.
Table 2. Required Conservation and Efficiency Measures Wisconsin Administrative Code NR 852
CEM # Description Required Elements Public Water Supply Water Use Sector (PWS)
PWS-R1 Distribution System Pressure Management
Analyze distribution system pressure management to identify opportunities to reduce water use and minimize plumbing fixture leaks.
AECOM prepared the Water System Master Plan (August 2006) for the Waukesha Water Utility. As part of the Water System Master Plan a calibrated hydraulic model was developed and used to assist in the evaluation of system capacity and water system pressure throughout the water system. AECOM has the experience in the evaluation of water systems and specific knowledge of the Waukesha water system to provide an opinion on the whether the water system is being operated within acceptable water system pressures.
To Nancy Quirk, Waukesha Water Utility
CC Kathy Beduhn, AECOM
Subject Distribution Water System Pressure Waukesha Water Utility
From Richard Hope, AECOM
Date February 25, 2011

Distribution Water System Pressure Waukesha Water Utility February 25, 2011
Page 2
2.0 WATER SYSTEM PRESSURE
A water system needs to be designed so that adequate water system pressure is available to meet customers’ needs and to provide required fire flows. In addition, regulatory requirements specify minimum pressure requirements because of health concerns that can results from the ingress of water into the water mains. Wisconsin Administrative Code Clause 811.70 (4) discusses system pressure:
(4) PRESSURE. All water mains, including those not designed to provide fire protection, shall be sized after a hydraulic analysis based on flow demands and pressure requirements. The minimum and maximum normal static pressure in the distribution system shall be 35 psi and 100 psi, respectively, at ground level. The system shall be designed and operated to maintain a minimum residual pressure of 20 psi at ground level at all points in the distribution system under all conditions of flow.
Further guidelines are provided in the Ten State Standard:
8.2 SYSTEM DESIGN
8.2.1 Pressure
All water mains, including those not designed to provide fire protection, shall be sized after a hydraulic analysis (is completed) based on flow demands and pressure requirements. The system shall be designed to maintain a minimum pressure of 20 psi (140 kPa) at ground level at all points in the distribution system under all conditions of flow. The normal working pressure in the distribution system should be approximately 60 to 80 psi (410 - 550 kPa) and not less than 35 psi (240 kPa).
3.0 WAUKESHA WATER SYSTEM
Water system pressure varies throughout a distribution system due to topography and water demands. The service area for the Waukesha Water Utility has a varied topography (with elevations ranging from approximately 780 feet to 1,050 feet. To accommodate this topography change, the Waukesha Water Utility water distribution system is divided into eight pressure zones. Each pressure zone was developed to maintain system pressure within regulatory requirements. As part of the Water System Master Plan, a detailed evaluation of the water system pressure in each pressure zone was performed. To assist in the evaluation of water system pressures and available fire flow, a detailed hydraulic model of the Waukesha water system was developed. The model allowed system pressures and fire flows to be evaluated under a range of existing and future water demand and operating conditions. The evaluation confirmed that water system pressures were adequate to meet customer needs and fire flow requirements. One of the recommendations resulting from the evaluation was to readjust some of the pressure zone boundaries to better serve residents. The Waukesha Water Utility has implemented the recommended pressure zone boundary realignments; that realignment has improved system pressure, and from a hydraulic prospective the water system pressures are optimized.

Distribution Water System Pressure Waukesha Water Utility February 25, 2011
Page 3
4.0 BENEFITS OF LOWER SYSTEM PRESSURES
The previous section discussed the hydraulic reasons for the current water system pressures to ensure adequate flow to customers and the required fire flows. However, operating a water system at a lower water system pressure can have the following benefits: 1. Reduction in the number of water main failures (breaks/leaks) 2. Reduction in loss of water at leaks
These benefits and their impact on the Waukesha water system are addressed in greater detail in the following sections. 4.1. Reduction in Water Main Failures
Water mains are designed to withstand a specific pressure in excess of the pressure the pipe will experience. As with most assets, as the water main ages, its condition deteriorates, and the water main will eventually fail. Water utilities are continually replacing/rehabilitating water mains to minimize water main failures. Table 1 provides details of the number of water breaks that the Waukesha Water Utility has repaired since 2005. To benchmark this with industry guidelines, the failure rate has been converted to number of breaks per 100 miles, based on the 330 miles of water main that comprise the Waukesha water system. Table 1. Water Main Breaks
Year Total Number of Water Main Breaks Water Main Breaks/100 miles of Water Mains 2005 23 7.0 2006 10 3.0 2007 21 6.4 2008 31 9.4 2009 32 9.7 2010 30 9.1
Many factors besides water main pressure—such as pipe material and corrosion—affect water main failure rate, so it is not possible to provide a standard for the allowable number of water main breaks per 100 miles. However, research from the Water Research Foundation provides the data in Table 2 regarding criteria for water main breaks/leaks. Table 2. Criteria for Water Main Breaks/Leaks
Reference Criteria Distribution System Performance Evaluation American Water Works Association (AWWA) Research Foundation, 1995 Typical goal: 25-30 breaks and leaks per 100 miles
Benchmarking Performance Indicators for Water and Wastewater Utilities: 2007 Annual Survey Data and Analysis Report, AWWA, 2007
Top quartile performance range: 14.9–21.7 breaks and leaks per 100 miles
Water Audits and Loss Control Programs, AWWA M36, 2009 Performance goals: no more than 15 reported breaks and leaks per 100 miles
Therefore, the Waukesha Water Utility is well below the criteria presented in Table 2 and it does not appear that water system pressure is a major contributor to water main failure.
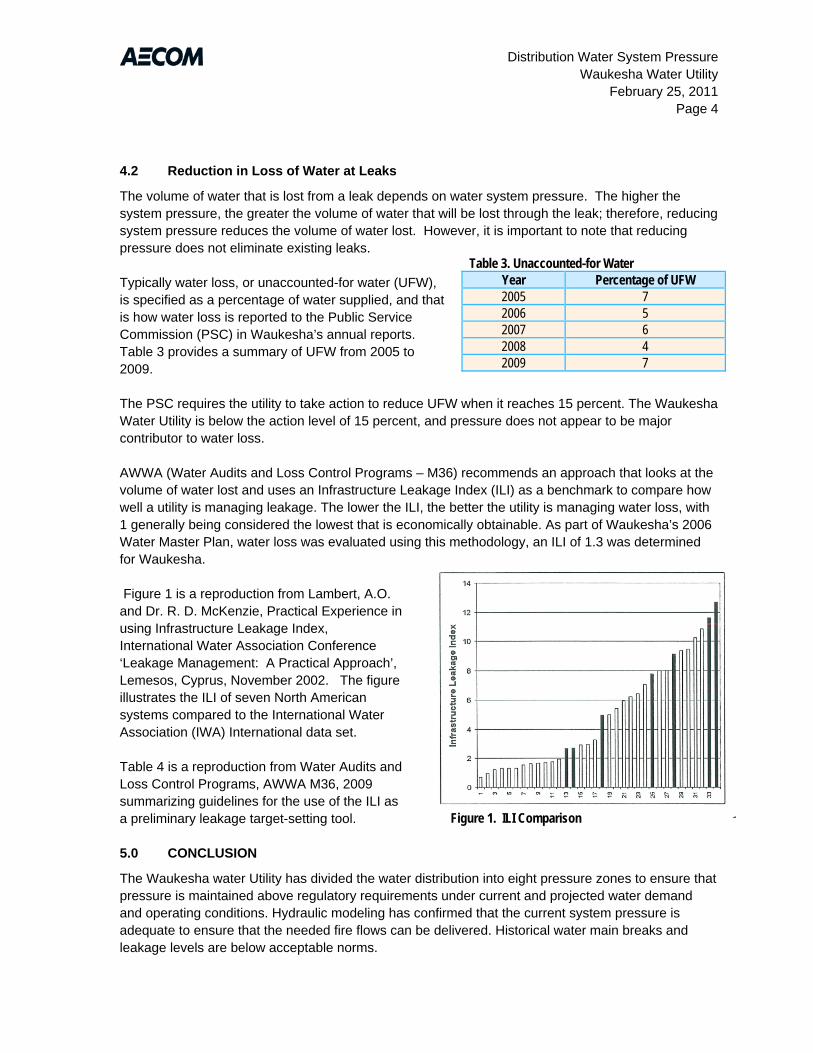
Distribution Water System Pressure Waukesha Water Utility February 25, 2011
Page 4
4.2 Reduction in Loss of Water at Leaks
The volume of water that is lost from a leak depends on water system pressure. The higher the system pressure, the greater the volume of water that will be lost through the leak; therefore, reducing system pressure reduces the volume of water lost. However, it is important to note that reducing pressure does not eliminate existing leaks. Typically water loss, or unaccounted-for water (UFW), is specified as a percentage of water supplied, and that is how water loss is reported to the Public Service Commission (PSC) in Waukesha’s annual reports. Table 3 provides a summary of UFW from 2005 to 2009. The PSC requires the utility to take action to reduce UFW when it reaches 15 percent. The Waukesha Water Utility is below the action level of 15 percent, and pressure does not appear to be major contributor to water loss. AWWA (Water Audits and Loss Control Programs – M36) recommends an approach that looks at the volume of water lost and uses an Infrastructure Leakage Index (ILI) as a benchmark to compare how well a utility is managing leakage. The lower the ILI, the better the utility is managing water loss, with 1 generally being considered the lowest that is economically obtainable. As part of Waukesha’s 2006 Water Master Plan, water loss was evaluated using this methodology, an ILI of 1.3 was determined for Waukesha. Figure 1 is a reproduction from Lambert, A.O. and Dr. R. D. McKenzie, Practical Experience in using Infrastructure Leakage Index, International Water Association Conference ‘Leakage Management: A Practical Approach’, Lemesos, Cyprus, November 2002. The figure illustrates the ILI of seven North American systems compared to the International Water Association (IWA) International data set. Table 4 is a reproduction from Water Audits and Loss Control Programs, AWWA M36, 2009 summarizing guidelines for the use of the ILI as a preliminary leakage target-setting tool. 5.0 CONCLUSION
The Waukesha water Utility has divided the water distribution into eight pressure zones to ensure that pressure is maintained above regulatory requirements under current and projected water demand and operating conditions. Hydraulic modeling has confirmed that the current system pressure is adequate to ensure that the needed fire flows can be delivered. Historical water main breaks and leakage levels are below acceptable norms.
Table 3. Unaccounted-for Water Year Percentage of UFW 2005 7 2006 5 2007 6 2008 4 2009 7
Figure 1. ILI Comparison
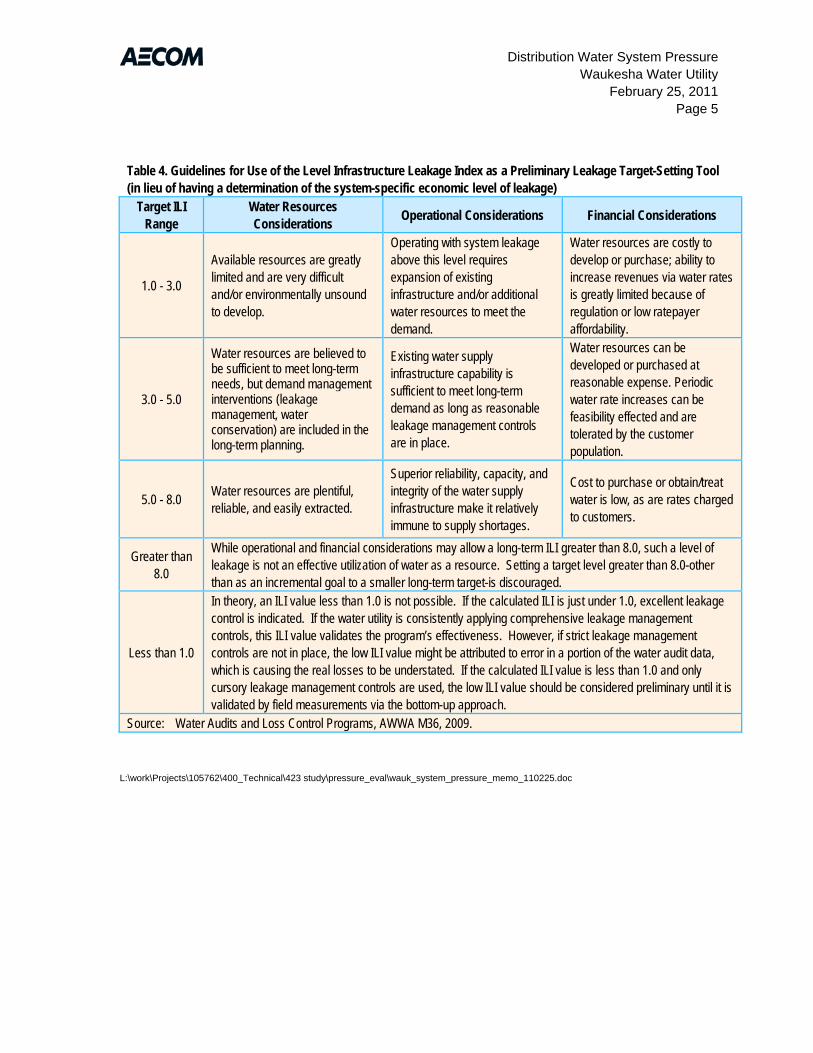
Distribution Water System Pressure Waukesha Water Utility February 25, 2011
Page 5
Table 4. Guidelines for Use of the Level Infrastructure Leakage Index as a Preliminary Leakage Target-Setting Tool (in lieu of having a determination of the system-specific economic level of leakage)
Target ILI Range
Water Resources Considerations Operational Considerations Financial Considerations
1.0 - 3.0
Available resources are greatly limited and are very difficult and/or environmentally unsound to develop.
Operating with system leakage above this level requires expansion of existing infrastructure and/or additional water resources to meet the demand.
Water resources are costly to develop or purchase; ability to increase revenues via water rates is greatly limited because of regulation or low ratepayer affordability.
3.0 - 5.0
Water resources are believed to be sufficient to meet long-term needs, but demand management interventions (leakage management, water conservation) are included in the long-term planning.
Existing water supply infrastructure capability is sufficient to meet long-term demand as long as reasonable leakage management controls are in place.
Water resources can be developed or purchased at reasonable expense. Periodic water rate increases can be feasibility effected and are tolerated by the customer population.
5.0 - 8.0 Water resources are plentiful, reliable, and easily extracted.
Superior reliability, capacity, and integrity of the water supply infrastructure make it relatively immune to supply shortages.
Cost to purchase or obtain/treat water is low, as are rates charged to customers.
Greater than 8.0
While operational and financial considerations may allow a long-term ILI greater than 8.0, such a level of leakage is not an effective utilization of water as a resource. Setting a target level greater than 8.0-other than as an incremental goal to a smaller long-term target-is discouraged.
Less than 1.0
In theory, an ILI value less than 1.0 is not possible. If the calculated ILI is just under 1.0, excellent leakage control is indicated. If the water utility is consistently applying comprehensive leakage management controls, this ILI value validates the program’s effectiveness. However, if strict leakage management controls are not in place, the low ILI value might be attributed to error in a portion of the water audit data, which is causing the real losses to be understated. If the calculated ILI value is less than 1.0 and only cursory leakage management controls are used, the low ILI value should be considered preliminary until it is validated by field measurements via the bottom-up approach.
Source: Water Audits and Loss Control Programs, AWWA M36, 2009. L:\work\Projects\105762\400_Technical\423 study\pressure_eval\wauk_system_pressure_memo_110225.doc

Appendix D Water Use Audit

Waukesha, Wisconsin Final Draft Water System Master Plan
L:\work\Projects\84140\wp\reports\master_plan\final draft\wau_append_c_kab.doc C-1 May 2006
APPENDIX C WATER BALANCE AND EVALUATION OF SYSTEM LOSSES
As part of the Water System Master Plan, an evaluation of water loss was performed. This appendix summarizes the results of the evaluation and will provide the following: 1. Establish the current level of water loss 2. Establish the economic level of leakage 3. Identify appropriate active leakage control (ALC) approach C.1 BACKGROUND In the United States, guidelines for preparing a water audit are provided in AWWA Manual M36, which provides a water audit worksheet for the establishment of the level of UFW and associated leakage within a water distribution system. The water loss committee that is responsible for updating and maintaining the guidelines provided in AWWA M36 are in the process of adopting international standards for water audit and loss reduction strategies (Journal AWWA, August 2003). The revised approach to the standards will be based on work performed by the International Water Association (IWA) Water Loss Task Force. This revised approach is a radical change to the current philosophy presented in AWWA M36. A number of new terms have been introduced, but the main difference is the concept of moving away from using the term UFW and expressing UFW as a percentage of water pumped into the system to discuss leakage as an overall volume loss. For the UFW program for Waukesha Water Utility, the new approach being developed by the Water Loss Committee of AWWA, based on the IWA’s Public Utilities Water Loss Task Force recommendations, will be adopted. With the adoption of AWWA’s new approach for evaluating water loss within a water distribution system, it is important to provide definitions of some of the terms currently not widespread in the industry that now will be used. The end of this appendix includes definitions of terms for reference. The definitions are based on IWA’s Blue Pages for Losses from Water Supply Systems Standard Terminology and Recommended Performance Measures. C.2 WATER BALANCE A water balance displays how quantities of water flow into and out of the distribution system and to the customer. Figure C-1 and Table C-1 illustrate the components of a water balance based on IWA recommended best practice. All data in the water balance is expressed as a volume per year. Each component of the water balance is specifically defined in the definition of terms provided at the end of this appendix.

Waukesha, Wisconsin Final Draft Water System Master Plan
L:\work\Projects\84140\wp\reports\master_plan\final draft\wau_append_c_kab.doc C-2 May 2006
TABLE C-1
COMPONENTS OF A WATER BALANCE Billed Metered Consumption [E] Billed Authorized
Consumption [D] Billed Unmetered Consumption [F] Revenue-Generating
Water Unbilled Metered Consumption [H]
Authorized Consumption
[B] Unbilled Authorized Consumption [G] Unbilled Unmetered Consumption [I]
Unauthorized Consumption [K] Apparent Losses [J] Metering Inaccuracies [L] Leakage on Transmission and/or Distribution Mains Leakage and Overflows at Utility’s Storage Tanks
System Input Volume
[A] Water Losses
[C] Real Losses [M]
Leakage on Service Connections up to Point of Customer Metering
Non-Revenue-Generating Water
C.2.1 System Input Volume [A] The system input volume (SIV) for Waukesha is the volume of water entering the distribution system. The information on the SIV was obtained from the 2004 Public Service Commission (PSC) Report. The total SIV in 2004 was 2,699 MG.
Non-revenue-generating water
Revenue-generating waterSystem Input System Input Volume [A]Volume [A]
Authorized Authorized Consumption [B]Consumption [B]
Billed Authorized Billed Authorized Consumption [D]Consumption [D]
Unbilled Authorized Unbilled Authorized Consumption [G]Consumption [G]
Billed Metered Billed Metered Consumption [E]Consumption [E]
Billed Unmetered Billed Unmetered Consumption [F]Consumption [F]
Unbilled Metered Unbilled Metered Consumption [H]Consumption [H]
Unbilled Unbilled Unmetered Unmetered
Consumption [I]Consumption [I]
Water Loss [C]Water Loss [C]
Apparent Apparent Losses [J]Losses [J] Real Losses [M]Real Losses [M]
Unauthorized Unauthorized Consumption [K]Consumption [K] LeakageLeakage
Customer Customer Metering Metering
Accuracy [L]Accuracy [L]
FIGURE C-1: COMPONENTS OF A WATER BALANCE
Waukesha, Wisconsin Final Draft Water System Master Plan
L:\work\Projects\84140\wp\reports\master_plan\final draft\wau_append_c_kab.doc C-3 May 2006
C.2.2 Authorized Consumption [B] Authorized consumption is any water used for all uses approved by the Utility. Most authorized consumption is metered, however, some is not. Authorized consumption is comprised of the following components: 1. Billed Authorized Consumption [D]
a. Billed Metered Consumption [E] b. Billed Unmetered Consumption [F]
2. Unbilled Authorized Consumption [G]
a. Unbilled Metered Consumption [H] b. Unbilled Unmetered Consumption [I]
C.2.2.1 Billed Authorized Consumption [D]
Billed authorized consumption is the annual volume of billed metered and unmetered water taken by registered customers and others who are authorized by the Utility for residential, commercial, public, and industrial purposes. Billed authorized consumption is comprised of the following two components: 1. Billed Metered Consumption [E] 2. Billed Unmetered Consumption [F]
C.2.2.2 Billed Metered Consumption [E] Billed metered consumption is the component of billed authorized consumption that is metered. The billed metered consumption for Waukesha for the year 2004 was 2,529 MG.
C.2.2.3 Billed Unmetered Consumption [F] No billed unmetered consumption was reported for Waukesha in 2004.
C.2.2.4 Unbilled Authorized Consumption [G] Unbilled authorized consumption is the annual volume of unbilled metered and unmetered water taken by registered customers and others who are authorized by the Utility for residential, commercial, public, and industrial purposes. Unbilled authorized consumption varies from community to community but generally covers the water needed to operate and maintain a water system and water used for public services such as swimming pools and irrigation. Unbilled authorized consumption is comprised of the following two components: 1. Unbilled Metered Consumption [H] 2. Unbilled Unmetered Consumption [I]

Waukesha, Wisconsin Final Draft Water System Master Plan
L:\work\Projects\84140\wp\reports\master_plan\final draft\wau_append_c_kab.doc C-4 May 2006
Table C-2 summarizes the Utility’s unbilled water use (metered and unmetered) for public services and general operations.
TABLE C-2 UNBILLED CONSUMPTION
Description Consumption Unbilled Metered Consumption [H] 0 MG Unbilled Unmetered Consumption [I] 6.2 MG Total 6.2 MG
The unbilled metered and unmetered consumption for Waukesha for the year 2004 was 6.2 MG. C.2.3 Water Losses [C] Water losses are equal to the difference between the system input volume and authorized consumption. The IWA defines two categories under which all types of water loss occurrences fall: 1. Apparent Losses [J] 2. Real Losses [K] Using the formula of “water losses = system input volume - authorized consumption” results in overall water losses of 164 MG for the year 2004 for Waukesha.
C.2.3.1 Apparent Losses [J] Apparent losses are essentially “paper” losses and consist of water use, which is not recorded due to metering error, incorrect assumptions of unmetered use, and unauthorized consumption; therefore, the two components of apparent losses are: 1. Unauthorized Consumption [K] 2. Customer Metering Accuracy [L]
Unauthorized Consumption [K] Unauthorized consumption includes such things as meter or meter reading tampering, illegally opened fire hydrants, unauthorized tapping into service mains, or unauthorized restoration of a water service connection after discontinuance by the Utility. At this stage, there is no known unauthorized consumption; therefore, for 2004, the unauthorized consumption was estimated at zero.
Customer Metering Accuracy [L] The accuracy of customer meters can have a dramatic effect on the water balance. Based on information provided by Waukesha Water Utility personnel, customer meters were assumed to have an accuracy of 99 percent; therefore, the apparent losses due to customer metering accuracy are estimated to be approximately 19 MG.

Waukesha, Wisconsin Final Draft Water System Master Plan
L:\work\Projects\84140\wp\reports\master_plan\final draft\wau_append_c_kab.doc C-5 May 2006
C.2.3.2 Real Losses [M] Real losses are physical water losses in water systems up to the point of measurement of customer use. Real losses are calculated using the following equation:
Real Losses = Water Losses - Apparent Losses Table C-3 summarizes the calculation of real losses for Waukesha for the year 2004. The estimated real losses for Waukesha for the year 2004 are 145 MG.
TABLE C-3 REAL LOSSES
Real Losses Volume System Input Volume [A] 2,699 MG Authorized Consumption [B]=[D]+[G]=[E]+[F]+[H]+[I] 2,535 MGWater Losses [C]=[A]-[B] 164 MGApparent Losses [J]=[K]+[L] 19 MGReal Losses [M]=[C]-[J] 145 MG
C.3 EVALUATION OF SYSTEM LOSSES The previous sections described in detail the components of water balance for the Waukesha Water Utility for 2004. The water balance establishes the real losses for Waukesha. This section discusses in detail the process of evaluating leakage levels for Waukesha. The following performance indicators are discussed: 1. Technical Indicator for Real Losses (TIRL) 2. Unavoidable Annual Real Losses (UARL) 3. Infrastructure Leakage Index (ILI) The parameters used for the evaluation of system losses are consistent with the IWA Water Loss Task Force. C.3.1 Water System Information To evaluate Waukesha’s system losses using the parameters used by the IWA Water Loss Task Force, the water system parameters summarized in Table C-4 are required.
TABLE C-4 WATER SYSTEM INFORMATION
Description Entire System Length of Water Main 305 miles Number of Service Connections 19,159 Distance Customer Meters are Located from Edge of Street 10 feet Percent of Time System Pressurized 100 percent Average System Pressure 65 psi

Waukesha, Wisconsin Final Draft Water System Master Plan
L:\work\Projects\84140\wp\reports\master_plan\final draft\wau_append_c_kab.doc C-6 May 2006
FIGURE C-2: TIRL
C.3.2 TIRL The TIRL is a performance indicator of the total volume of losses in a water distribution system. Typically, this has been defined as the percentage of the amount of water entering the distribution system. In the new approach of looking at water losses, it is recommended that TIRL be expressed in gallons per service connection per day. Table C-5 summarizes the TIRL calculation for Waukesha.
TABLE C-5 TIRL
Calculation of TIRL Entire System Annual Volume of Real Losses 145 MGD Percent of Time System Pressurized 100 percent Number of Service Connections 19,159 TIRL 21 gallons/service connection/day
Using the estimated real losses determined in the water balance of 145 MGD, the total number of service connections is estimated at 19,159, and the TIRL for Waukesha is approximately 21 gallons per service connection per day. Figure C-2 compares the Waukesha TIRL with the TIRL of other communities throughout the world. The seven TIRLs indicated in green on the figure are North American communities. From this figure, it can be seen that the level of real losses for Waukesha is in the middle of those surveyed and on the lower end of the North American communities.
Waukesha, Wisconsin Final Draft Water System Master Plan
L:\work\Projects\84140\wp\reports\master_plan\final draft\wau_append_c_kab.doc C-7 May 2006
C.3.3 UARL The water industry has long recognized that it is impossible to achieve zero leakage. Previous terms that have been used to describe the level of leakage that cannot be completely recovered include the following: background leakage, intrinsic leakage, and non-recoverable leakage. The term UARL has been introduced to define the level of leakage which could be achieved at the current operating pressure if there were no financial or economic constraints on the level of ALC. Similar to TIRL, UARL has the unit of gallons per service connection per day. The UARL consists of the following main elements: 1. Background losses from undetectable leaks 2. Losses from reported leaks 3. Losses from unreported leaks Using an approach adopted in the United Kingdom, an average UARL can be calculated for an individual water system. The parameter values used to calculate the UARL are based on published international data for minimum background loss rates, typical burst flow rates, and frequencies for infrastructure in good condition. The calculated values of the UARL for each component of infrastructure are shown in Table C-6. The calculated UARL should be only used as a guide. Once ALC has been implemented, the background losses and reported and unreported leaks can be better defined for the Waukesha water system, and a more accurate UARL can be established. The Table C-6 values presented as an equation in the most basic form is presented below. UARL = (5.39 x Lm + 0.15 x Nc + 7.47 x Lp) x P Where: Lm is the length of water mains in the distribution system (miles) Nc is the number of service connections Lp is the total length of pipe between the edge of the street and the customer
meter (feet) P is the average operating pressure (psi) UARL is in gallons per day (gpd) The following characteristics of the Waukesha water distribution system were used for the UARL calculation: 1. Approximately 305 miles of water main 2. Approximately 19,159 service connections 3. Average system pressure of 65 psi 4. Average length of service connection between street and water meter of 10 feet The total UARL for Waukesha was calculated to be 16 gallons per service connection per day (312,000 gpd).
Waukesha, Wisconsin Final Draft Water System Master Plan
L:\work\Projects\84140\wp\reports\master_plan\final draft\wau_append_c_kab.doc C-8 May 2006
TABLE C-6 UARL
Calculation of UARL Entire System Length of Water Main 305 miles Number of Service Connections 19,159
Distance Customer Meters are Located from Edge of Street
10 feet
Percent of Time System Pressurized 100 percent
Average System Pressure 65 psi Calculated Components of UARL
Components of UARL Total UARL Background Losses
Reported Bursts
Unmetered Use
UARL Total Units
Mains 106,792 gpd 2.87 1.75 0.77 5.39 gallons/mile of main/day/psi of pressure
Service Connections, Main to Curb-Stop 186,800 gpd 0.11 0.01 0.03 0.15 gallons/serv conn/day/psi
of pressure Service Connections, Curt-Stop to Meter 312,124 gpd 4.8 0.57 2.12 7.47 gallons/mile of
main/day/psi of pressure UARL 312,129 gpd
UARL 16 gallons/ serv conn/day
C.3.4 ILI The difference between the TIRL and UARL represents the maximum potential for future savings in real losses. Also, the ratio of TIRL to UARL is in a useful, non-dimensional index of the overall condition and management of infrastructure. The ratio of TIRL to UARL is known as the ILI. Table C-7 summarizes the ILI calculation for Waukesha.
TABLE C-7 ILI
Calculation of ILI Entire System TIRL 21 gallons/serv conn/day UARL 16 gallons/serv conn/day ILI (ratio of TIRL to UARL) 1.3
Figure C-3 illustrates ILI along with the survey results of several other communities throughout the world. The seven ILIs indicated in green on the figure are North American communities. From this figure, it can be seen that Waukesha is in the low to mid range of communities surveyed.
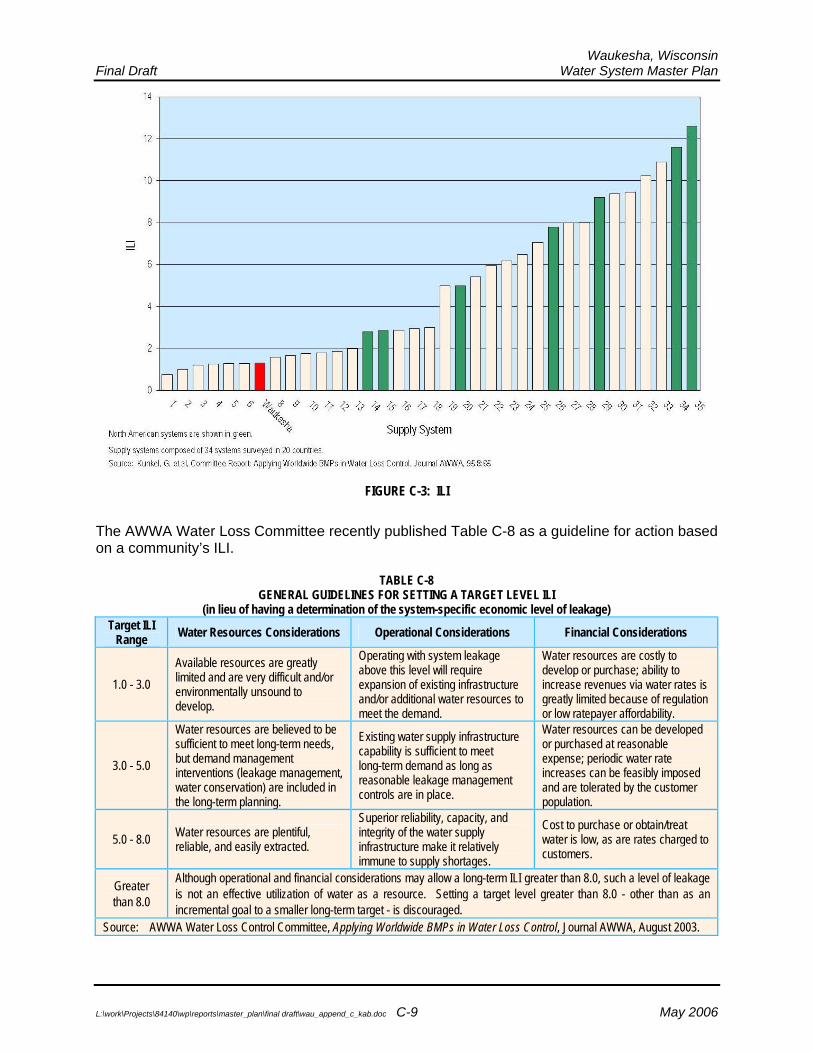
Waukesha, Wisconsin Final Draft Water System Master Plan
L:\work\Projects\84140\wp\reports\master_plan\final draft\wau_append_c_kab.doc C-9 May 2006
The AWWA Water Loss Committee recently published Table C-8 as a guideline for action based on a community’s ILI.
TABLE C-8 GENERAL GUIDELINES FOR SETTING A TARGET LEVEL ILI
(in lieu of having a determination of the system-specific economic level of leakage) Target ILI
Range Water Resources Considerations Operational Considerations Financial Considerations
1.0 - 3.0 Available resources are greatly limited and are very difficult and/or environmentally unsound to develop.
Operating with system leakage above this level will require expansion of existing infrastructure and/or additional water resources to meet the demand.
Water resources are costly to develop or purchase; ability to increase revenues via water rates is greatly limited because of regulation or low ratepayer affordability.
3.0 - 5.0
Water resources are believed to be sufficient to meet long-term needs, but demand management interventions (leakage management, water conservation) are included in the long-term planning.
Existing water supply infrastructure capability is sufficient to meet long-term demand as long as reasonable leakage management controls are in place.
Water resources can be developed or purchased at reasonable expense; periodic water rate increases can be feasibly imposed and are tolerated by the customer population.
5.0 - 8.0 Water resources are plentiful, reliable, and easily extracted.
Superior reliability, capacity, and integrity of the water supply infrastructure make it relatively immune to supply shortages.
Cost to purchase or obtain/treat water is low, as are rates charged to customers.
Greater than 8.0
Although operational and financial considerations may allow a long-term ILI greater than 8.0, such a level of leakage is not an effective utilization of water as a resource. Setting a target level greater than 8.0 - other than as an incremental goal to a smaller long-term target - is discouraged.
Source: AWWA Water Loss Control Committee, Applying Worldwide BMPs in Water Loss Control, Journal AWWA, August 2003.
FIGURE C-3: ILI

Waukesha, Wisconsin Final Draft Water System Master Plan
L:\work\Projects\84140\wp\reports\master_plan\final draft\wau_append_c_kab.doc C-10 May 2006
The table indicates that communities with limited water sources are currently operating near the capacity of existing infrastructure or where there are financial limitations on developing additional supply sources that should set a target ILI of 1 to 3. The guidelines discourage setting a target ILI greater than 8, as such a level of leakage is not an effective utilization of water as a resource; therefore, Waukesha is much lower than the maximum target ILI recommended and is near the minimum target ILI. C.4 SUMMARY This summarizes the completion of the water balance and evaluation of system losses, and determination of potential actions to be taken based on the water balance. Figure C-4 summarizes the components of the 2004 water system balance.
FIGURE C-4: SUMMARY OF 2004 WATER BALANCE The following summarizes the findings from this analysis: 1. The 2004 TIRL for Waukesha is approximately 21 gallons per service connection per
day. For the 34 communities surveyed throughout the world, TIRL varied from approximately 10 gallons per service connection per day to approximately 215 gallons per service connection per day, with an average of approximately 70 gallons per service connection per day; therefore, benchmarked against other communities, the TIRL for Waukesha is below average.
2. The 2004 ILI (ratio of TIRL to UARL) for Waukesha is approximately 1.3. For the
34 communities surveyed throughout the world, the ILI varied from approximately 1 to approximately 13, with an average of approximately 5; therefore, benchmarked against other communities, the ILI for Waukesha is very low.
Non-revenue-generating water
Revenue-generating waterSystem Input System Input Volume [A]Volume [A]
2,699 MG2,699 MG
Authorized Authorized Consumption [B]Consumption [B]
2,535 MG2,535 MG
Billed Authorized Billed Authorized Consumption [D]Consumption [D]
2,529 MG2,529 MG
Unbilled Authorized Unbilled Authorized Consumption [G]Consumption [G]
6 MG6 MG
Billed Metered Billed Metered Consumption [E]Consumption [E]
2,529 MG2,529 MG
Billed Unmetered Billed Unmetered Consumption [F]Consumption [F]
0 MG0 MG
Unbilled Metered Unbilled Metered Consumption [H]Consumption [H]
0 MG0 MG
Unbilled Unmetered Unbilled Unmetered Consumption [I]Consumption [I]
6 MG6 MG
Water Loss [C]Water Loss [C]
164 MG164 MG
Apparent Losses [J]Apparent Losses [J]
19 MG19 MG
Real Losses [M]Real Losses [M]
145 MG145 MG
Unauthorized Unauthorized Consumption [K]Consumption [K]
0 MG0 MG
LeakageLeakage
145 MG145 MG
Customer Metering Customer Metering Accuracy [L]Accuracy [L]
19 MG19 MG
Waukesha, Wisconsin Final Draft Water System Master Plan
L:\work\Projects\84140\wp\reports\master_plan\final draft\wau_append_c_kab.doc C-11 May 2006
3. It is recommended for good accounting practice that the Utility attempt to track and/or meter the current unmetered water usage such that the accuracy of the water balance can be improved.
REFERENCES
AWWA Water Loss Control Committee, Applying Worldwide BMPs in Water Loss Control,
Journal AWWA, August 2003. Flowmeters in Water Supply, AWWA Manual M33, Denver, Colorado, 1989. Lambert, A., D. Huntington, and T.G. Brown, Water Loss Management in North America: Just
How Good Is It?, Water Loss Control Manual, 2002. Lambert, A. O., T.G. Brown, M. Tkizawa, and D. Weimers, A Review of Performance Indicators
for Real Losses from Water Supply Systems, IWSA, J Water SRT - Aqua 48, 227-237, 1999.
Lambert, A., S. Myers, and S Trow, Managing Water Leakage, Economic and Technical Issues,
Financial Times Energy, A Division of Financial Times Business Limited, London, England.
Losses from Water Supply Systems: Standard Terminology and Recommended Performance
Measures, The Blue Pages, International Water Association, October 2000. Thornton, Julian, Water Loss Control Manual, McGraw-Hill, 2002. Various authors, UK Water Industry: Managing Leakage, Engineering and Operations
Committee, October 1994. Water Meters - Selection, Installation, Testing, and Maintenance, AWWA Manual M6, Denver,
Colorado, 1999.


Appendix E CEM Summary


Conservation Efficiency Measures
Summary
Prepared for
City of Waukesha Water Conservation Stakeholder Committee
December 2011
135 South 84th Street
Suite 400 Milwaukee, WI 53214

1-2 WBG010912212935MKE
WBG010912212935MKE III
Executive Summary Successful water conservation programs across the country incorporate a combination of public information, incentives, and regulations to achieve efficient water use across their service area. Conservation efficiency measures (CEMs) are focused on operating a watertight water treatment and distribution system, public and school-age education, and a portfolio of measures to address water used by utility customers. To increase the effectiveness of water conservation programs, utilities generally select a small number of CEMs for implementation. CEMs for Waukesha Water Utility (WWU) will be selected with consideration given to regulatory requirements, budget and staffing constraints, detailed customer water use analysis, stakeholder/customer input, and prioritization by the Conservation Stakeholder Committee.
Required measures including a distribution system water use audit, leak detection and repair program, source management, and distribution system pressure management are part of WWU’s current program and future conservation program and are, therefore, not included in the CEMs in this listing. Similarly, public information/ education and school education programs are not included in this listing, but will be included in the Conservation Plan Update. The CEMs included in this summary provide a broad selection of possible CEMs to be evaluated and prioritized for implementation over time. While many of CEMs identified in this summary may be implemented in the long term, it is anticipated that only the most effective measures will be implemented over the next 3 to 5 years.
Technology and approaches to increase water efficiency are rapidly changing. The costs and savings estimates presented in this document represent data from a variety of sources including the Alliance for Water Efficiency (AWE), California Urban Water Conservation Council, the U.S. Environmental Protection Agency WaterSense Program, the American Water Works Association, and other sources. The estimates will be refined based on actual technologies selected for implementation.
In 2011, WWU analyzed a number of CEMs using the AWE tracking tool. Results from the tool include benefit-to-cost ratios as one way to prioritize measures for implementation. The benefit-to-cost ratio (B:C) for the City and its customers is presented in Exhibit 1. A conservation measure with a B:C greater than 1 is an improvement. Measures with a B:C less than one should be re-evaluated to consider changes to the program activity or to consider other non-economic benefits. For the package of CEMs evaluated, the overall B:C for the City is 4.0 and the B:C for City customers is 19.4. Exhibit 1 depicts the B:C of individual conservation activities. Not all of the CEMs summarized herein have been evaluated using the AWE tracking tool. Those measures prioritized through the planning process will be evaluated (or re-evaluated) using current information and more refined water use data.
The measures in this summary represent a menu of potential conservation measures for consideration and discussion by the City of Waukesha water conservation stakeholder committee as part of the 2012 update to the Water Conservation Plan. The description of the measures, estimated costs and savings, rebate amounts and other information should be considered draft. Measures recommended for inclusion in the plan update will be refined and further evaluated.
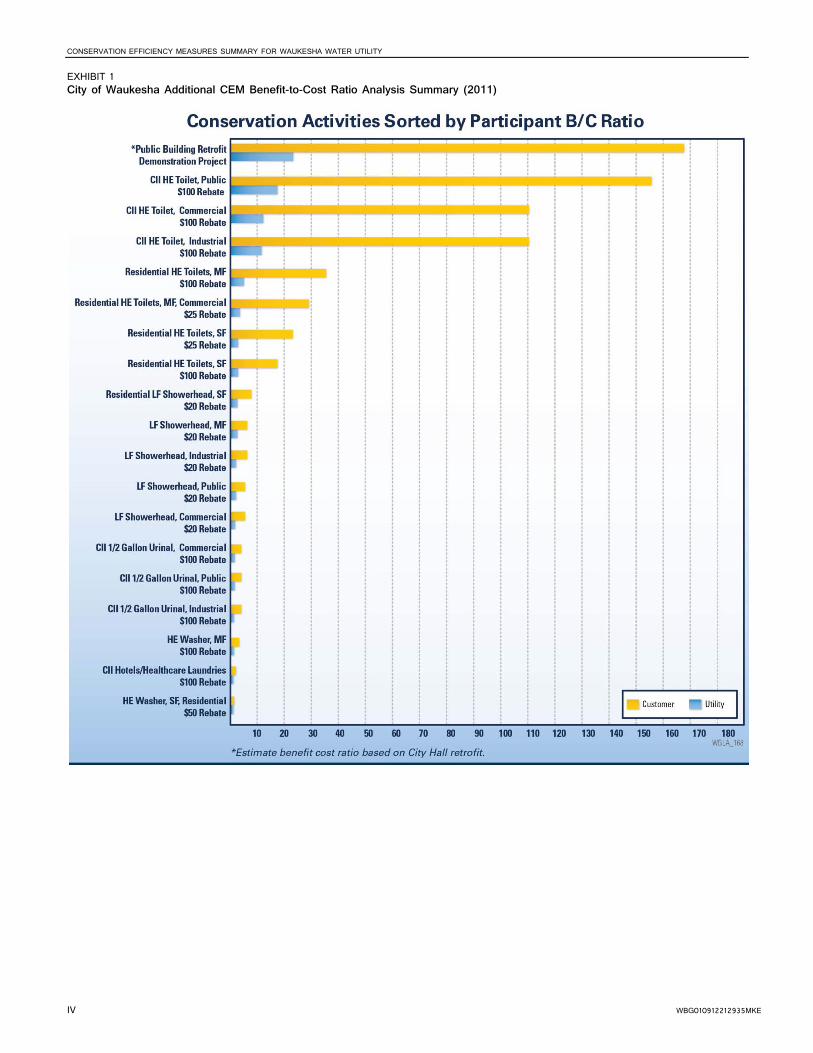
CONSERVATION EFFICIENCY MEASURES SUMMARY FOR WAUKESHA WATER UTILITY
IV WBG010912212935MKE
EXHIBIT 1 City of Waukesha Additional CEM Benefit-to-Cost Ratio Analysis Summary (2011)

Contents Section Page
WBG010912212935MKE V
Executive Summary .......................................................................................................................................... iii
Acronyms and Abbreviations ........................................................................................................................... vii
1 Residential Demand Management: Potential Conservation Efficiency Measures ................................. 1-1 1.1 Residential Indoor CEMs .................................................................................................................. 1-1
1.1.1 Water Use Surveys/Audits .................................................................................................. 1-1 1.1.2 High-efficiency Toilet Model Rebates and/or Distribution ................................................ 1-2 1.1.3 High-efficiency Clothes Washer Rebates ............................................................................ 1-2 1.1.4 Water-efficient Showerheads ............................................................................................. 1-3 1.1.5 High-efficiency Water Heater Replacement ....................................................................... 1-4 1.1.6 Leak and Minor Plumbing Repair Program ......................................................................... 1-4 1.1.7 Water Softener Replacement ............................................................................................. 1-5
1.2 Residential Outdoor CEMs ............................................................................................................... 1-6 1.2.1 Irrigation Audits .................................................................................................................. 1-6 1.2.2 Rain Gauge or Sensor.......................................................................................................... 1-6 1.2.3 Irrigation Technology Rebate ............................................................................................. 1-7 1.2.4 Landscape/Turf Replacement Program .............................................................................. 1-7
2 Commercial, Industrial, and Institutional Demand Management: Potential Conservation Efficiency Measures .......................................................................................................................................... 2-1 2.1 Commercial, Industrial, and Institutional Indoor CEMs—General .................................................. 2-1
2.1.1 Water Use Surveys/Audits .................................................................................................. 2-1 2.1.2 Pint or Half-gallon Urinal Rebates or Distribution .............................................................. 2-2 2.1.3 HET Model Rebates and/or Distribution ............................................................................ 2-2 2.1.4 High-efficiency Showerheads ............................................................................................. 2-3 2.1.5 High-efficiency Clothes Washer Rebates ............................................................................ 2-4 2.1.6 High-efficiency Water Heater Rebates ............................................................................... 2-4
2.2 Commercial, Industrial, and Institutional Indoor CEMs—Kitchen Water Use ................................. 2-5 2.2.1 Commercial Dishwashing Rebates ...................................................................................... 2-5 2.2.2 Pre-rinse Spray Valve Replacement .................................................................................... 2-6 2.2.3 Ice Machine Replacement .................................................................................................. 2-7
2.3 Commercial, Industrial, and Institutional Indoor CEMs—Industrial or Customer-specific Water Use ........................................................................................................................................ 2-7
2.3.1 Cooling Towers Audits ........................................................................................................ 2-7 2.3.2 Commercial and Industrial Customer Conservation Retrofit/Rebate ................................ 2-8 2.3.3 Vehicle Washing/Carwashes .............................................................................................. 2-9 2.3.4 Public Building Facilities Retrofit ........................................................................................ 2-9
2.4 Commercial, Industrial, and Institutional Outdoor CEMs.............................................................. 2-10 2.4.1 Landscape Survey/Audit: Large Irrigation Areas .............................................................. 2-10 2.4.2 Irrigation Technology ........................................................................................................ 2-10 2.4.3 Landscape/Turf Replacement Program ............................................................................ 2-11 2.4.4 Rainwater Capture/Condensate Reuse Incentive ............................................................ 2-12 2.4.5 Water Recycling (Reuse) ................................................................................................... 2-12
3 Policies, Service Rule Provisions, Ordinances, and Building Codes ....................................................... 3-1 3.1 Leak Inspection and Repair prior to Property Resale or Lease ........................................................ 3-1
3.1.1 Measure Description .......................................................................................................... 3-1 3.2 Fixture and Equipment Retrofit or Replacement upon Property Resale or Lease .......................... 3-1
3.2.1 Measure Description .......................................................................................................... 3-1

CONSERVATION EFFICIENCY MEASURES SUMMARY FOR WAUKESHA WATER UTILITY
Section Page
VI WBG010912212935MKE
3.3 Year-round Lawn and Landscape Sprinkling Schedule .................................................................... 3-2 3.3.1 Measure Description .......................................................................................................... 3-2
3.4 Decorative Water Features .............................................................................................................. 3-2 3.4.1 Measure Description .......................................................................................................... 3-2
3.5 Annual Irrigation Inspection ............................................................................................................ 3-3 3.5.1 Measure Description .......................................................................................................... 3-3
3.6 Conservation Standards for New Construction ............................................................................... 3-3 3.6.1 Measure Description .......................................................................................................... 3-3
3.7 Water Waste Prevention ................................................................................................................. 3-4 3.7.1 Measure Description .......................................................................................................... 3-4
3.8 Monthly Billing ................................................................................................................................. 3-4 3.8.1 Measure Description .......................................................................................................... 3-4
4 References ........................................................................................................................................ 4-1
Exhibit
1 City of Waukesha Additional CEM Benefit-to-Cost Ratio Analysis Summary (2011)

WBG010912212935MKE VII
Acronyms and Abbreviations
AWE Alliance for Water Efficiency
AWWA American Water Works Association
B:C benefit-to-cost ratio
CEM conservation efficiency measure
CII commercial, industrial, and institutional
DIR demand-initiated regeneration
gpcd gallons per capita per day
gpm gallons per minute
HET high-efficiency toilet
NAHB National Association of Home Builders
O&M operation and maintenance
USEPA U.S. Environmental Protection Agency
WWU Waukesha Water Utility

WBG010912212935MKE 1-1
SECTION 1
Residential Demand Management: Potential Conservation Efficiency Measures
1.1 Residential Indoor CEMs 1.1.1 Water Use Surveys/Audits Measure Description Water use surveys, also called water audits, provide residents a way to understand how much water they use in and around their home and identify ways to save water. Surveys can be performed with online calculators, bill mail-outs, or distributed (or conducted) door-to-door surveys.
A survey will gather information about water-using fixtures inside the home such as toilets, showers, dishwashers, and washing machines, and water use outside the home for irrigation, swimming pools, hot tubs, and other water-using features. A field survey (or audit) will also provide a way to detect leaks, inefficient irrigation systems and identify other ways to save water. Potentially, audits can be performed by community members who have been trained to conduct audits. In some communities, utilities engage licensed plumbers or contracts to replace fixtures or repair minor leaks during a home water audit.
A survey can also factor in the number of residents and water-using habits to estimate the amount of water used for different purposes. The information can help residents target water-saving technologies or behaviors to reduce the amount of water they use. Additionally, a survey is a good way to teach residents how to read their meter to track water use as well as to look for leaks. The guidance can be provided through online or printed instructions, or during a field survey, and would be available for all single-family and multi-family homes served by WWU. The program would be designed to focus on providing onsite field surveys or audits to the top 10 percent of water users with an online survey or calculator or printed information available to all residential users.
Program Background, Projected Water Savings, and Costs A water use survey or audit is primarily an education tool that fosters awareness of water-using fixtures and habits in homes. Costs include the development of the survey tool such as an online calculator or paper survey, distribution of the tool, and occasional updates. WWU currently provides information on water audits and links to conservation resources on its Web site.
Field or onsite audits, however, can lead to direct savings and can be designed to replace fixtures during the audit. Some water utilities partner with electrical providers to provide comprehensive energy and water audits at the same time. Providing field personnel or contractors to conduct the audits will increase the costs but would be expected to increase the water savings.
Potential Metrics for Evaluation during Implementation If implemented, evaluation of the success of the implemented measure may include the following:
• Number of households participating in a water use survey/audit • Actual savings for onsite audits using before and after tracking

CONSERVATION EFFICIENCY MEASURES SUMMARY FOR WAUKESHA WATER UTILITY
1-2 WBG010912212935MKE
High-efficiency Toilet (HET)
1.1.2 High-efficiency Toilet Model Rebates and/or Distribution Measure Description The high-efficiency toilet (HET) model rebate and/or distribution conservation measure would encourage replacement of older toilets with HET models. The program provides for the limited distribution of HETs or rebates for those customers who replace old toilets with newer HET models. According to the U.S. Environmental Protection Agency (USEPA; 2011a), toilet flushing accounts for approximately 30 percent of indoor water use. The WaterSense partnership program, sponsored by USEPA, has developed a toilet certification program. The WaterSense label is used on toilets that are certified by independent laboratory testing to meet rigorous criteria for both performance and efficiency—for the models, WWU would develop a distribution program or provide rebates.
The measure would affect all single- and multi-family homes served by WWU.
Program Background, Projected Water Savings, and Costs HETs use about 20 percent less water per flush than low-flow toilets, and meet the 1.6 gallons per flush efficiency standard required of new toilets since 1992 (1.6 gallons per flush). The most common HET models use approximately 1.3 gallons per flush; however, some models use as little as 1.0 to 1.1 gallons per flush. Significant water savings can occur when pre-1992 toilets (typically 3.5 gallons per flush) are replaced with HET models. Based upon an average of 5 flushes per capita per day (American Water Works Association [AWWA] 1999), HET models would save 1.5 gallons per capita per day (gpcd) or 1,600 gallons per year for a household of 3 residents. HET models would save about 11 gpcd when compared with pre-1992 toilets (12,000 gallons per year for a household of 3 residents). It is estimated that up to 100 rebates would be issued each year.
HET model costs vary over a wide range, but the average price is approximately $200. For example, the Milwaukee Metropolitan Sewerage District recently announced distribution of 1.28 gallons per flush toilets that cost either $50 or $75 after a $100 rebate was applied. Under this proposed program, the WWU would offer a $100 rebate to homeowners replacing pre-1992 toilets. Based on preliminary cost estimates of purchasing HET models, a cost of $100 per toilet, to be borne by WWU, was assumed for this analysis, whether in the form of rebates or actual toilet distribution.
Potential Metrics for Evaluation during Implementation If implemented, evaluation of the success of the implemented measure may include the following:
• Water savings
• Number of rebates provided/toilets distributed
• Program costs (program administration, public education, contractors, and consultants, etc.) as percent of overall cost of the measure
• Program savings
• Water and sewer costs reduced by customer
• Operation and maintenance (O&M) and/or capital costs avoided by WWU
1.1.3 High-efficiency Clothes Washer Rebates Measure Description The high-efficiency clothes washer rebate measure be managed similar to the toilet rebate program, but would provide a limited number of rebates for customers who replace older washing machine models with high-efficiency washing machines. The national average water use for clothes washing accounts for nearly 22 percent of water used inside residences, or approximately 15.0 gallons per person per day. The measure would affect all

1—RESIDENTIAL DEMAND MANAGEMENT: POTENTIAL CONSERVATION EFFICIENCY MEASURES
WBG010912212935MKE 1-3
High-efficiency Washing Machine
single-family and multi-family homes served by WWU. In many communities, water utilities and energy providers (natural gas or electricity) partner to issue rebates to their customers for both water and energy savings.
Program Background, Projected Water Savings, and Costs A non-conserving washing machine uses approximately 40.9 gallons per load compared with an average of 24.3 gallons for high-efficiency models. (California Urban Water Conservation Council, 2011). A family of 4 could save an average of approximately 8,000 gallons per year. Additionally, they would reduce their wastewater discharges and energy consumption. High-efficiency washing machines often cost $200 or more than conventional washing machines. Rebates for similar programs vary, but for this analysis, it is anticipated that 5 to 20 rebates would be issued each year, with an assumed rebate amount of $50 for a single-family customer and $100 for multi-family customers with public use washing machines. The rebate is higher for the multi-family customer because more water is estimated to be saved each year when more than one family washes laundry with the same washing machine.
Potential Metrics for Evaluation during Implementation If implemented, evaluation of the success of the implemented measure may include the following:
• Water savings
• Number of rebates provided/toilets distributed
• Program costs (program administration, public education, contractors, and consultants, etc.) as a percentage of overall measure cost
• Program savings
• Water and sewer costs reduced by customer; energy savings
• Operation and maintenance (O&M) and/or capital costs avoided by WWU
1.1.4 Water-efficient Showerheads Measure Description Modern (post-1992) low-flow showerheads use 2 gallons per minute (gpm) or less. Overall, homes with only water-efficient showerheads used an average of 21 gallons per day for showers compared to 35 gallons per day in homes with only non-low-flow showerheads.
WWU currently distributes shower timers and publicizes a water-conserving tip to limit length of showers to no more than 5 minutes. The water-efficient showerheads measure could be implemented in alternative ways. For instance, WWU could market the program and provide water-efficient showerheads to residents. Given the low cost of water-efficient showerheads (likely less than $5 per unit if purchased in bulk), WWU would more than likely provide free showerheads, rather than offer a rebate. Distribution would be most efficient in combination with public information efforts (such as during workshops or when conducting a water use audit) or during fixture retrofit programs. Another alternative is to offer a rebate in the $20 per showerhead range to encourage replacement of high-end showerheads that can range in cost from approximately $60 to $250 or more.
Program Background, Projected Savings, and Costs Showering accounts for about 17 percent of indoor water use. Some older showerheads flow at up to 5.5 gpm as compared with the national efficiency standard for new showerheads, which requires a maximum flow rate of 2.5 gallons at a water pressure of 80 pounds per square inch. Showerheads with the WaterSense label have a maximum flow rate of 2.0 gpm. It is estimated that the average household could save 2,300 hundred gallons per
CONSERVATION EFFICIENCY MEASURES SUMMARY FOR WAUKESHA WATER UTILITY
1-4 WBG010912212935MKE
year by replacing old showerheads with a WaterSense-certified showerhead. Residents would also save energy to heat water.
Applicable Metrics for Evaluation If implemented, evaluation of the success of the implemented measure could be based on the number of showerheads distributed or households reached.
1.1.5 High-efficiency Water Heater Replacement Measure Description For this conservation measure, WWU would provide rebates to homeowners that replace traditional water heaters with high-efficiency water heating systems. In addition to saving water, replacing water heaters can also save energy used to heat and distribute the water. The high-efficiency water heater replacement measure may be a good program to implement in partnership with local power providers and Wisconsin Focus on Energy. Additional research is needed to determine which systems would be eligible for rebates based on both water and energy use.
Program Background, Projected Savings, and Costs When an end user turns on a hot water faucet, heated water from a traditional water heater enters the in-house plumbing system, and the existing water in the lines is wasted down the drain. Installing a point of use pump can eliminate the waste as heated water moves to the faucet or shower. Some water providers throughout the country are providing rebates for such systems. Point-of-use pumps send cold water that would normally go down the drain back to the water heater through the cold water line. The pump recirculates the water until it reaches the desired temperature.
Another system, known as tankless water heaters, is placed close to the hot water place of use, such as in the kitchen or bathroom. Tankless water heaters can be electric or powered by natural gas. With a tankless water heater, the water is heated at the source rather than a remote water heater. Some systems save water but increase energy use.
Applicable Metrics for Evaluation If implemented, evaluation of the success of the implemented measure may include the following:
• Water savings
• Number of rebates provided
• Program costs (program administration, public education, contractors, and consultants, etc.) as a percentage of overall measure cost
• Program savings
• Water and sewer costs reduced by customer; energy savings
• O&M and/or capital costs avoided by WWU
1.1.6 Leak and Minor Plumbing Repair Program Measure Description In this program, WWU would contract with plumbing service(s) to repair minor leaks and replace high-water-using toilets, faucet aerators, and showerheads for eligible customers, such as low-income families and seniors.
Program Background, Projected Savings, and Costs Similar programs have been conducted in cities such as San Antonio (Plumbers to People) and Dallas (Minor Plumbing Repair Program) where they have been very successful in reducing water waste cost-effectively.

1—RESIDENTIAL DEMAND MANAGEMENT: POTENTIAL CONSERVATION EFFICIENCY MEASURES
WBG010912212935MKE 1-5
Eligibility for the program would be determined in cooperation with other agencies (for instance, the Waukesha County Health and Human Services Department).
According to the U.S. Census Bureau, approximately 5 percent of the population within the City of Waukesha is over the age of 65, and approximately 8.8 percent is living below the poverty level. Further analysis would be required to determine the potential customers and potential savings that could be achieved with a similar program in the WWU service area.
Applicable Metrics for Evaluation If implemented, evaluation of the success of the implemented measure may include the following:
• Water savings
• Number of rebates provided
• Program costs (program administration, public education, contractors, and consultants, etc.) as a percentage of overall measure cost
• Program savings
• Water and sewer costs reduced by customer; energy savings
• O&M and/or capital costs avoided by WWU
1.1.7 Water Softener Replacement Measure Description The conservation program would provide a rebate for residents replacing water softeners with models that meet USEPA WaterSense standards. Because specifications are being developed by USEPA, WWU will consider more specific program guidelines after the new standards are finalized and products are available in the area.
Program Background, Projected Savings, and Costs Some models of water softeners recharge using a time clock, recharging whether it is necessary or not, such as while a resident is away on vacation. Some providers offer rebates to replace timer-based water softeners (owned or leased) with a new demand-initiated regeneration (DIR) water softener. Modern units have a water meter or hardness sensor to control regeneration. Thus, soft water is produced only as it is needed, and regeneration is typically more infrequent than clock-controlled regeneration.
According to USEPA, some water softeners use up to 25 gallons per day to flush the system of magnesium and calcium. Such flushing can use up to 10,000 gallons per year. During 2011, USEPA published a Notice of Intent to develop specifications for water-efficient water softeners. It is expected that new standards will be published within the next few years.
Applicable Metrics for Evaluation If implemented, evaluation of the success of the implemented measure may include the following:
• Water savings
• Number of rebates provided
• Program costs (program administration, public education, contractors, and consultants, etc.) as a percentage of overall measure cost
• Program savings
• Water and sewer costs reduced by customer; energy savings
• O&M and/or capital costs avoided by WWU
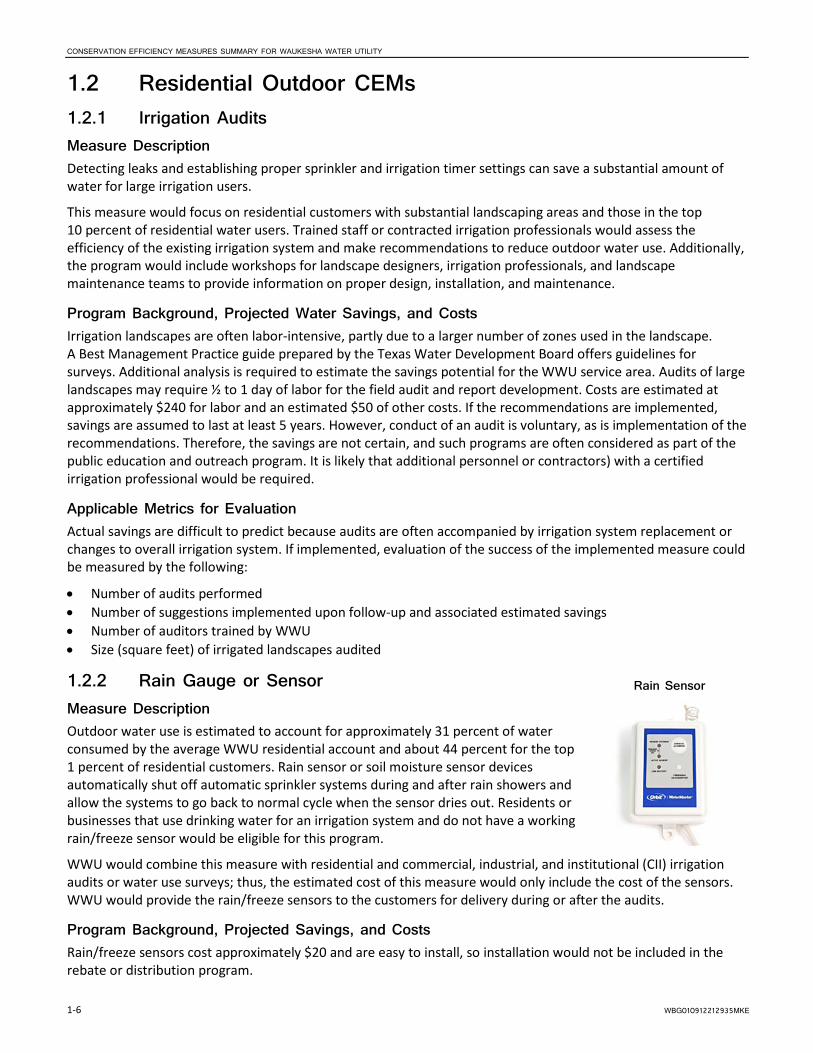
CONSERVATION EFFICIENCY MEASURES SUMMARY FOR WAUKESHA WATER UTILITY
1-6 WBG010912212935MKE
Rain Sensor
1.2 Residential Outdoor CEMs 1.2.1 Irrigation Audits Measure Description Detecting leaks and establishing proper sprinkler and irrigation timer settings can save a substantial amount of water for large irrigation users.
This measure would focus on residential customers with substantial landscaping areas and those in the top 10 percent of residential water users. Trained staff or contracted irrigation professionals would assess the efficiency of the existing irrigation system and make recommendations to reduce outdoor water use. Additionally, the program would include workshops for landscape designers, irrigation professionals, and landscape maintenance teams to provide information on proper design, installation, and maintenance.
Program Background, Projected Water Savings, and Costs Irrigation landscapes are often labor-intensive, partly due to a larger number of zones used in the landscape. A Best Management Practice guide prepared by the Texas Water Development Board offers guidelines for surveys. Additional analysis is required to estimate the savings potential for the WWU service area. Audits of large landscapes may require ½ to 1 day of labor for the field audit and report development. Costs are estimated at approximately $240 for labor and an estimated $50 of other costs. If the recommendations are implemented, savings are assumed to last at least 5 years. However, conduct of an audit is voluntary, as is implementation of the recommendations. Therefore, the savings are not certain, and such programs are often considered as part of the public education and outreach program. It is likely that additional personnel or contractors) with a certified irrigation professional would be required.
Applicable Metrics for Evaluation Actual savings are difficult to predict because audits are often accompanied by irrigation system replacement or changes to overall irrigation system. If implemented, evaluation of the success of the implemented measure could be measured by the following:
• Number of audits performed • Number of suggestions implemented upon follow-up and associated estimated savings • Number of auditors trained by WWU • Size (square feet) of irrigated landscapes audited
1.2.2 Rain Gauge or Sensor Measure Description Outdoor water use is estimated to account for approximately 31 percent of water consumed by the average WWU residential account and about 44 percent for the top 1 percent of residential customers. Rain sensor or soil moisture sensor devices automatically shut off automatic sprinkler systems during and after rain showers and allow the systems to go back to normal cycle when the sensor dries out. Residents or businesses that use drinking water for an irrigation system and do not have a working rain/freeze sensor would be eligible for this program.
WWU would combine this measure with residential and commercial, industrial, and institutional (CII) irrigation audits or water use surveys; thus, the estimated cost of this measure would only include the cost of the sensors. WWU would provide the rain/freeze sensors to the customers for delivery during or after the audits.
Program Background, Projected Savings, and Costs Rain/freeze sensors cost approximately $20 and are easy to install, so installation would not be included in the rebate or distribution program.

1—RESIDENTIAL DEMAND MANAGEMENT: POTENTIAL CONSERVATION EFFICIENCY MEASURES
WBG010912212935MKE 1-7
Applicable Metrics for Evaluation If implemented, evaluation of the success of the measure could be based on the number of sensors distributed.
1.2.3 Irrigation Technology Rebate Measure Description The measure would be designed to allow a variety of irrigation technologies to be considered for a rebate. It could be broadly defined to require minimum savings and demonstrated actual water use reduction over time, as compared to other rebates that are developed for installation of specific technologies. The program would focus on the top 10 percent of residential users who use as much as 4.5 times the average single-family residential customer in the service area. WWU could also combine irrigation audits that assess watering behaviors as well as the irrigation technology.
Program Background, Projected Savings, and Costs Irrigation technology continues to evolve, and irrigation-related companies will continue to offer equipment that enables irrigation systems to use less water. For example, the latest conservation-related innovation includes multi-stream rotating nozzles. This type of sprinkler is a multi-stream rotor the size of a spray nozzle. It fits any conventional spray head body or shrub adapter, and offers high uniformity and low application rates. Additional analysis is required to evaluate potential savings and costs for a program to provide rebates for water-saving irrigation technology. Any such program should also include a focus on education because outdoor water use for irrigation is significantly affected by behavior. For example, in some applications, installation of weather-based irrigation controllers has resulted in increased water use. It is likely that additional field personnel would be required to evaluate the technology as well as to conduct the associated audits and inspections.
Applicable Metrics for Evaluation • Water savings
• Number of rebates provided
• Program costs (program administration, public education, contractors, and consultants, etc.) as a percentage of overall measure cost
• Program savings
• Water and sewer costs reduced by customer; energy savings
• O&M and/or capital costs avoided by WWU
1.2.4 Landscape/Turf Replacement Program Measure Description The landscape/turf replacement measure would provide a limited number of rebates each year for residential customers that replace a minimum of 1,500 square feet of turf with native or well-adapted low-water-using plants or hardscapes such as permeable garden paths. The customer would be required to submit a landscape conversion plan as part of the eligibility process. The rebated amount would be allocated over a 5-year period as water savings are demonstrated.
Program Background, Projected Savings, and Costs Choosing plants that are well adapted to the soil and climate conditions of your yard is most water efficient. Native plants maintain the look and feel of the local landscape and can provide habitat for birds, butterflies, and other wildlife. Well-adapted plants are generally easy to maintain and less likely to be stressed during times of low rainfall or extreme freeze. Landscape practices such as adding soil amendments and zoned irrigation and incorporating hardscapes such as paths and patios can also reduce the need for supplemental irrigation and fertilizers. Such practices can reduce the volume of offsite runoff and enhance stormwater quality.

CONSERVATION EFFICIENCY MEASURES SUMMARY FOR WAUKESHA WATER UTILITY
1-8 WBG010912212935MKE
Estimating water savings from such practices can be difficult because residents may continue to irrigate more frequently or use greater volumes of water than the landscape actually needs. Additionally, such landscape retrofits are often coupled with irrigation system upgrades, making it difficult to determine what savings are due to use of more efficient technology and what savings result from the change in landscape management practices. Furthermore, given the relatively low outdoor use and the relatively high rainfall in the area, it is unclear that landscape or turf replacement would result in significant savings in the WWU service area. This program will take additional time to evaluate and will likely require additional personnel to evaluate the proposed landscape plans and conduct field inspections.
Applicable Metrics for Evaluation • Water savings
• Number of rebates provided/ square feet of landscapes replaced.
• Program costs (program administration, public education, contractors, and consultants, etc.) as a percentage of overall measure cost
• Program savings
• Water and sewer costs reduced by customer; energy savings
• O&M and/or capital costs avoided by WWU

WBG010912212935MKE 2-1
SECTION 2
Commercial, Industrial, and Institutional Demand Management: Potential Conservation Efficiency Measures Descriptions of CEM for CII customers are presented as individual measures because a single measure could be implemented for several customer categories. It is anticipated that final program design would bundle several measures for specific categories of customers to use staff and funding resources more effectively. For example, a school makeover program may include showerhead and toilet replacement, kitchen appliance retrofits, and irrigation system upgrades for ball fields. Implementation could be phased to completely retrofit a limited number of schools each year or, alternatively, to retrofit a specific water use for a larger number of schools each year. For example, the first phase could include an irrigation system upgrade program to reduce season peak demands, which currently average about 42 percent for public facilities.
CII programs would likely be implemented to target the highest water-using categories with the greatest opportunity for water savings. Potential CII program participants include the following:
• Schools, public facilities, and parks • Hospitals and health care facilities • Industrial users • Restaurants • Hotels • Laundromats • Carwashes • County correctional facilities (jail) • Light commercial (offices and retail)
2.1 Commercial, Industrial, and Institutional Indoor CEMs—General
2.1.1 Water Use Surveys/Audits Measure Description The first step in an effective onsite conservation program is determining a baseline of how much water is used for what purposes in a particular business. Building on its existing online information regarding CII water use audits, WWU would expand its resource library for CII customers and provide audits upon request for commercial facilities. The audits will identify leaks that could be fixed, as well as fixtures and appliances that could be replaced, to save water. Potentially, WWU could establish a performance-based contract with a vendor to conduct audits.
Evaluation of some processes may require an industrial engineer to assess the potential for water savings with process or equipment changes. The more complicated audits may also require several days to complete, depending on the size of the facility. WWU will work with local industries to develop an appropriate program for the audits.
Program Background, Projected Savings, and Costs Savings associated with audits are difficult to quantify given the range of CII customers in the service area. Often they are considered as part of the public education program.
Applicable Metrics for Evaluation If implemented, evaluation of the success of the implemented measure may include the following:

CONSERVATION EFFICIENCY MEASURES SUMMARY FOR WAUKESHA WATER UTILITY
2-2 WBG010912212935MKE
High-efficiency Urinal
HET Handle Design
• Number of CII customers requesting and/or using information from the WWU resource library • Number of audits performed • Program costs (program administration, public education, contractors, and
consultants, etc.) as a percentage of overall measure cost
2.1.2 Pint or Half-gallon Urinal Rebates or Distribution Measure Description A high-efficiency urinal uses no more than 0.25 gallon per flush (1.9 liters per flush). The amount is a reduction from the current standard of 1.0 gallon per flush (3.8 liters per flush) as required by the Energy Policy Act of 1992. Before 1994, urinals used between 1.5 and 3.0 gallons per flush. The program would provide a rebate estimated at $100 for non-residential customers that replace both a urinal using at least 1.5 gallons per flush and the flush valve with a urinal using 0.5 gallon per flush or less.
Program Background, Projected Savings, and Costs The WaterSense partnership program, sponsored by USEPA, has developed a water efficient flushing urinal specification and has developed a certification program for those urinals that meet rigorous criteria for both performance and efficiency. They estimate that for every 1.5-gallon urinal that is replaced with a WaterSense urinal, 4,600 hundred gallons per year would be saved (USEPA 2011b).
The average cost of a WaterSense urinal is $350 and the average cost of the flushing device is $250. This cost is approximately the same cost as for a 1.5-gallon per flush urinal.
Applicable Metrics for Evaluation If implemented, evaluation of the success of the implemented measure may include the following:
• Water savings
• Number of rebates provided
• Number of (or percent of eligible) CII establishments participating
• Program costs (program administration, public education, contractors, and consultants, etc.) as a percentage of overall measure cost
• Program savings
• Water and sewer costs reduced by customer; energy savings
• O&M and/or capital costs avoided by WWU
2.1.3 HET Model Rebates and/or Distribution Measure Description High-efficiency toilets use an average volume of 1.3 gallons per flush (Toolbase Services Web site, National Association of Home Builders [NAHB] 2008), which is about 20 percent less water than the efficiency standard that has been required of new toilets since 1992 (1.6 gallons per flush) and about 63 percent less than the average volume per flush (3.5 gallons) used by pre-1992 toilets (AWWA 1999). Based on an average of 5 flushes per capita per day (AWWA 1999), HET models would save 1.5 gpcd (1,600 gallons per year) for a household of 3 residents). HET models save about 11 gpcd when compared with pre-1992 toilets (12,000 gallons per year for a household of 3 residents). Water savings in commercial or institutional facilities would likely be higher.

2—COMMERCIAL, INDUSTRIAL AND INSTITUTIONAL (CII) DEMAND MANAGEMENT: POTENTIAL CONSERVATION EFFICIENCY MEASURES
WBG010912212935MKE 2-3
The measure would be available for all non-residential customers served by WWU; however, HET models may be best suited for light commercial applications, rather than high-volume or heavy-use conditions.
Program Background, Projected Savings, and Costs The WaterSense partnership program, sponsored by USEPA, has developed a toilet certification program. The WaterSense label is used on toilets that are certified by independent laboratory testing to meet rigorous criteria for performance and efficiency. For such models, WWU would develop a distribution program or provide rebates.
Toilet costs vary over a wide range based on style, but the average cost is approximately $200. Under the proposed program, WWU would offer a $100 rebate to CII customers replacing pre-1992 toilets.
Applicable Metrics for Evaluation If implemented, evaluation of the success of the implemented measure may include the following:
• Water savings
• Number of rebates provided/toilets distributed
• Number of (or percent of eligible) CII establishments participating
• Program costs (program administration, public education, contractors, and consultants, etc.) as a percentage of overall cost
• Program savings
• Water and sewer costs reduced by customer; energy savings
• O&M and/or capital costs avoided by WWU
2.1.4 High-efficiency Showerheads Measure Description Shower heads with the WaterSense label use 2 gpm or less. For this conservation measure, WWU would provide, distribute, or install high-efficiency showerheads as part of the water use makeover for CII clients with shower facilities such as hotels, schools, and hospitals. Commercial grade showerheads can be more costly than residential showerheads and water-savings per showerhead are often higher for the CII customer. WWU would offer a $20 per showerhead rebate or pay a similar amount for installation if part of retrofit distribution or installation program.
Program Background, Projected Savings, and Costs Some older showerheads flow at up to 5.5 gpm as compared with the national efficiency standard for new showerheads, which requires a maximum flow rate of 2.5 gpm at a water pressure of 80 pounds per square inch. Showerheads with the WaterSense label have a maximum flow rate of 2.0 gpm. CII customers would also save energy to heat water.
Applicable Metrics for Evaluation If implemented, evaluation of the success of the implemented measure could be based on the following:
• Water savings
• Number of rebates provided
• Number of (or percent of eligible) CII establishments participating
• Program costs (program administration, public education, contractors, and consultants, etc.) as a percentage of overall cost
• Program savings
CONSERVATION EFFICIENCY MEASURES SUMMARY FOR WAUKESHA WATER UTILITY
2-4 WBG010912212935MKE
• Water and sewer costs reduced by customer; energy savings
• O&M and/or capital costs avoided by WWU
2.1.5 High-efficiency Clothes Washer Rebates Measure Description This measure be managed similar to the toilet rebate program, but would provide a limited number of rebates for CII customers who replace older washing machine models with high-efficiency washing machines having the Energy Star label. This measure would focus on laundromats, hotels, hospitals, or other customers with resident populations. In many communities, water utilities and energy providers (natural gas or electricity) partner to issue rebates to their customers for water and energy savings.
Program Background, Projected Water Savings, and Costs A non-conserving washing machine uses approximately 40.9 gallons per load compared with an average of 24.3 gallons for high-efficiency models. (California Urban Water Conservation Council 2011). High-efficiency washing machines often cost $200 or more than convention washing machines. The rebate for washing machine replacement is estimated at $100 per washing machine.
Potential Metrics for Evaluation during Implementation If implemented, evaluation of the success of the implemented measure may include the following:
• Water savings
• Number of rebates provided/toilets distributed
• Number of (or percent of eligible) CII establishments participating
• Program costs (program administration, public education, contractors, and consultants, etc.) as a percentage of overall measure cost
• Program savings
• Water and sewer costs reduced by customer; energy savings
• O&M and/or capital costs avoided by WWU
• Net program cost-effectiveness
2.1.6 High-efficiency Water Heater Rebates Measure Description For this conservation measure, WWU would provide rebates to CII customers that replace traditional water heaters with high-efficiency water heating systems. In addition to saving water, replacing water heaters can also save energy used to heat and distribute the water. The measure may be a good program to implement in partnership with local power providers and Wisconsin Focus on Energy.
Program Background, Projected Savings, and Costs When an end user turns on a hot water faucet, heated water from a traditional water heater enters the facility’s plumbing system, and the existing water in the lines is wasted down the drain. Installing a point-of-use pump can eliminate the waste as heated water moves to the faucet or shower. Some water providers throughout the country are providing rebates for such systems. Point–of-use pumps send cold water that would normally go down the drain back to the water heater through the cold water line. The pump recirculates the water until it reaches the desired temperature.

2—COMMERCIAL, INDUSTRIAL AND INSTITUTIONAL (CII) DEMAND MANAGEMENT: POTENTIAL CONSERVATION EFFICIENCY MEASURES
WBG010912212935MKE 2-5
Another system, known as tankless water heaters are placed close to the hot water place of use, such as in the kitchen or bathroom. Units can be electric or heated by natural gas. With a tankless water heater, the water is heated at the source rather than a remote water heater. Some systems save water but increase energy use.
Water savings will depend on the travel distance and pipe capacity from the water heater to the point of use and will vary among facilities. Additional research is needed to determine which systems would be eligible for rebates based on both water and energy use.
Applicable Metrics for Evaluation If implemented, evaluation of the success of the implemented measure may include:
• Water savings
• Number of rebates provided
• Number of (or percent of eligible) CII establishments participating
• Program costs (program administration, public education, contractors, and consultants, etc.) as a percentage of overall measure cost
• Program savings
• Water and sewer costs reduced by customer; energy savings
• O&M and/or capital costs avoided by WWU
2.2 Commercial, Industrial, and Institutional Indoor CEMs—Kitchen Water Use
2.2.1 Commercial Dishwashing Rebates Measure Description This measure would be available to CII customers, but would focus on restaurants, schools, hospitals, and other facilities with resident populations. Models eligible for rebate would include those that are both water-saving and with a high Energy Star rating. A list of qualifying models would be provided to those applying for rebates.
Program Background, Projected Water Savings, and Costs Newer water- and energy-efficient commercial dishwashing equipment can save varying amounts of water depending on the type of unit as well as usage practices. The Food Service Technology Center has conducted research comparing models. Some models eliminate the need for pre-rinse stations and may achieve considerable savings. Reduced water use will have a significant effect on energy use for heating water for sanitizing dishes in commercial kitchen. Savings will vary for CII customers depending on frequency and volume of meal preparation and service and equipment currently in use. Additional onsite evaluations will be required to estimate overall savings potential for the measure.
Energy Star Appliances and Rebates

CONSERVATION EFFICIENCY MEASURES SUMMARY FOR WAUKESHA WATER UTILITY
2-6 WBG010912212935MKE
Applicable Metrics for Evaluation If implemented, evaluation of the success of the implemented measure could be based on the following:
• Water savings
• Number of rebates provided
• Number of (or percent of eligible) CII establishments participating
• Program costs (program administration, public education, contractors, and consultants, etc.) as a percentage of overall cost
• Program savings
• Water and sewer costs reduced by customer; energy savings
• O&M and/or capital costs avoided by WWU
2.2.2 Pre-rinse Spray Valve Replacement Measure Description A spray-rinse valve is a device used in commercial facilities to remove food from dishes prior to cleaning in a dishwasher. Older devices frequently provide a continuous water flow rather than having a squeeze level to control the flow of water.
This measure would include a rebate for the purchase and installation of a more efficient pre-rinse spray valve used by restaurants, schools, hospitals, or other non-residential customers with kitchen facilities. The efficient valves use a knife-edge spray rather than a shower-type spray to better focus the available energy and remove food particles more efficiently.
Program Background, Projected Water Savings, and Costs A standard pre-rinse spray valve uses 2 to 6 gallons of water per minute; low-flow sprayers use 1.6 or less gallons of water per minute. The Food Service Technology Center estimates that certified pre-rinse spray models can save approximately 60 gallons of water (and wastewater) for every hour used. USEPA’s Energy Star program has developed certification requirements of pre-rinse spray valves; specifications are currently being developed under the WaterSense program.
High-efficiency sprayers cost approximately $60 each when bought in bulk.
Applicable Metrics for Evaluation If implemented, evaluation of the success of the implemented measure could be based on the following:
• Water savings
• Number of rebates provided
• Number of (or percent of eligible) CII establishments participating
• Program costs (program administration, public education, contractors, and consultants, etc.) as a percentage of overall cost
• Program savings
• Water and sewer costs reduced by customer; energy savings
• O&M and/or capital costs avoided by WWU
Pre-rinse spray valve replacements can save water at restaurants, schools, hospitals and other facilities
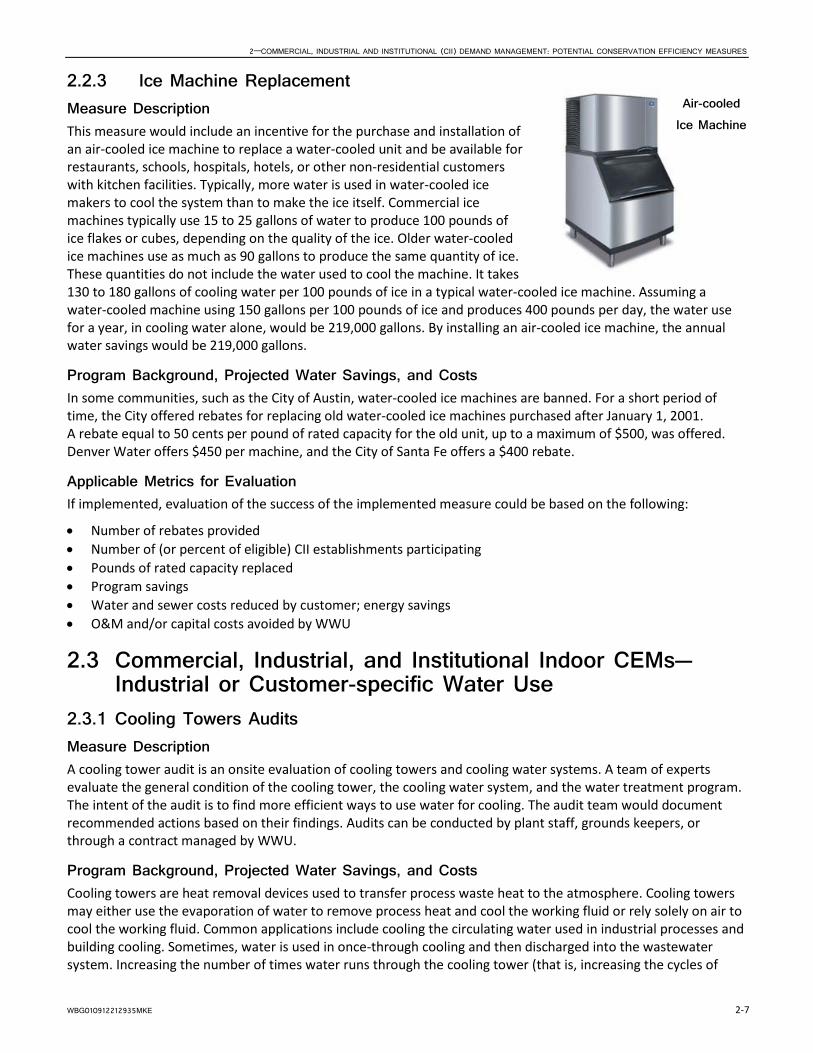
2—COMMERCIAL, INDUSTRIAL AND INSTITUTIONAL (CII) DEMAND MANAGEMENT: POTENTIAL CONSERVATION EFFICIENCY MEASURES
WBG010912212935MKE 2-7
2.2.3 Ice Machine Replacement Measure Description This measure would include an incentive for the purchase and installation of an air-cooled ice machine to replace a water-cooled unit and be available for restaurants, schools, hospitals, hotels, or other non-residential customers with kitchen facilities. Typically, more water is used in water-cooled ice makers to cool the system than to make the ice itself. Commercial ice machines typically use 15 to 25 gallons of water to produce 100 pounds of ice flakes or cubes, depending on the quality of the ice. Older water-cooled ice machines use as much as 90 gallons to produce the same quantity of ice. These quantities do not include the water used to cool the machine. It takes 130 to 180 gallons of cooling water per 100 pounds of ice in a typical water-cooled ice machine. Assuming a water-cooled machine using 150 gallons per 100 pounds of ice and produces 400 pounds per day, the water use for a year, in cooling water alone, would be 219,000 gallons. By installing an air-cooled ice machine, the annual water savings would be 219,000 gallons.
Program Background, Projected Water Savings, and Costs In some communities, such as the City of Austin, water-cooled ice machines are banned. For a short period of time, the City offered rebates for replacing old water-cooled ice machines purchased after January 1, 2001. A rebate equal to 50 cents per pound of rated capacity for the old unit, up to a maximum of $500, was offered. Denver Water offers $450 per machine, and the City of Santa Fe offers a $400 rebate.
Applicable Metrics for Evaluation If implemented, evaluation of the success of the implemented measure could be based on the following:
• Number of rebates provided • Number of (or percent of eligible) CII establishments participating • Pounds of rated capacity replaced • Program savings • Water and sewer costs reduced by customer; energy savings • O&M and/or capital costs avoided by WWU
2.3 Commercial, Industrial, and Institutional Indoor CEMs—Industrial or Customer-specific Water Use
2.3.1 Cooling Towers Audits Measure Description A cooling tower audit is an onsite evaluation of cooling towers and cooling water systems. A team of experts evaluate the general condition of the cooling tower, the cooling water system, and the water treatment program. The intent of the audit is to find more efficient ways to use water for cooling. The audit team would document recommended actions based on their findings. Audits can be conducted by plant staff, grounds keepers, or through a contract managed by WWU.
Program Background, Projected Water Savings, and Costs Cooling towers are heat removal devices used to transfer process waste heat to the atmosphere. Cooling towers may either use the evaporation of water to remove process heat and cool the working fluid or rely solely on air to cool the working fluid. Common applications include cooling the circulating water used in industrial processes and building cooling. Sometimes, water is used in once-through cooling and then discharged into the wastewater system. Increasing the number of times water runs through the cooling tower (that is, increasing the cycles of
Air-cooled Ice Machine
CONSERVATION EFFICIENCY MEASURES SUMMARY FOR WAUKESHA WATER UTILITY
2-8 WBG010912212935MKE
concentration) can result in significant water savings that more than offset the potentially increased cost of water treatment. CII customers would also reduce discharges into the wastewater system and lower wastewater charges.
Savings will vary from customer to customer and are difficult to estimate with accuracy. Often, audits are considered educational processes that increase awareness of water efficiency practices extending beyond just the cooling towers being audited.
Applicable Metrics for Evaluation If implemented, evaluation of the success of the implemented measure could be based on the following:
• Number of (or percent of eligible) CII establishments audited • Water savings, if recommendations implemented • Program savings • Water and sewer costs reduced by customer; energy savings • O&M and/or capital costs avoided by WWU
2.3.2 Commercial and Industrial Customer Conservation Retrofit/Rebate Measure Description CII customers’ type and volume of water use within the WWU service area vary greatly. Similarly the water-using equipment varies for different industrial customers. Several industrial users have already installed water-saving equipment or modified their processes to achieve water savings with considerable savings on their water and wastewater bill. This program would provide a standard rebate amount based on annual savings resulting from permanent structural or technology changes to reduce water use for large industrial users or other specific customer categories such as hospitals, dentist offices or other facilities with specialized equipment or processes. The program would require customers to prepare an engineering report estimating savings from the proposed changes. The rebate would be based on actual savings and paid out over a 5- to 10-year period as water savings are demonstrated.
Program Background, Projected Water Savings, and Costs Additional analysis is required to estimate expected savings from this measure; however, the top 10 percent of commercial customers use approximately 84 percent of the water used by industrial customers within the WWU service area. This indicates volume of water used only and not water-use efficiency. That is, a high volume user may be very efficient in how the water is used. Nonetheless, a focused effort on the top industrial users could complement the water-saving measures that industrial users are already implementing.
Applicable Metrics for Evaluation If implemented, evaluation of the success of the implemented measure could be based on the following:
• Water savings
• Number of rebates provided
• Number of (or percent of eligible) CII establishments participating
• Program costs (program administration, public education, contractors, and consultants, etc.) as a percentage of overall measure cost
• Program savings
• Water and sewer costs reduced by customer; energy savings
• O&M and/or capital costs avoided by WWU

2—COMMERCIAL, INDUSTRIAL AND INSTITUTIONAL (CII) DEMAND MANAGEMENT: POTENTIAL CONSERVATION EFFICIENCY MEASURES
WBG010912212935MKE 2-9
2.3.3 Vehicle Washing/Carwashes Measure Description This measure would offer rebates for commercial carwashes that install water-saving technologies.
Program Background, Projected Water Savings, and Costs Homeowners washing their vehicle at home may use as much as 140 gallons per wash compared with commercial carwashes that can use approximately 40 gallons per wash (About.com 2011). Soaps and detergents used in vehicle washing also typically runoff properties into the stormwater system, thus potentially affecting water quality in streams and rivers. Commercial car washes can implement numerous practices to use water more efficiently, and are required to capture wash and rinse water and discharge into the wastewater collection system.
Examples of possible water-saving technology and processes include regular replacement of wash nozzles as necessary to avoid leaks. Additional water savings can be achieved by installing weep management systems, either weep recovery or intermittent weep systems, to control bleed-off from nozzles during freezing weather. Other possibilities include installing a water reclamation system and replacing plastic or brass nozzles with stainless steel nozzles. WWU could provide rebates for carwash equipment that has demonstrated water savings.
Water savings, as well as implement costs, vary with the type of equipment replaced. More research is needed to develop a rebate program tied to specific technologies; however, incentives could be provided under a general incentive program for commercial customers similar to the Industrial Customer Conservation Retrofit program described in Section 2.2.5.
Applicable Metrics for Evaluation If implemented, evaluation of the success of the implemented measure could be based on the following:
• Water savings
• Number of rebates provided
• Number of (or percent of eligible) CII establishments participating
• Program costs (program administration, public education, contractors, and consultants, etc.) as a percentage of overall measure cost
• Program savings
• Water and sewer costs reduced by customer; energy savings
• O&M and/or capital costs avoided by WWU
2.3.4 Public Building Facilities Retrofit Measure Description This program would allocate funding for the installation of replacement fixtures and water-saving equipment in public buildings, similar to the plumbing fixture and cooling equipment retrofit at City Hall.
Program Background, Projected Water Savings, and Costs Public buildings within the City vary with respect to type and volume of water use. When public buildings, such as schools, administrative offices, libraries, etc., install water-saving fixtures and equipment, water savings and cost savings are shared by City citizens. This program would include survey of public buildings to identify potential retrofit demonstration projects. The program would also include collaborative funding for estimating water savings, planning, and implementing improvements and auditing results.
Applicable Metrics for Evaluation If implemented, evaluation of the success of the implemented measure could be based on the following:
CONSERVATION EFFICIENCY MEASURES SUMMARY FOR WAUKESHA WATER UTILITY
2-10 WBG010912212935MKE
• Water savings
• Program costs (program administration, public education, contractors, and consultants, etc.) as a percentage of overall measure cost
• Program savings
• Water and sewer costs reduced by customer; energy savings
• O&M and/or capital costs avoided by WWU
2.4 Commercial, Industrial, and Institutional Outdoor CEMs Seasonal water use for commercial and industrial customers averages about 22 percent of total water use, which suggests that outdoor CEMs may not provide the greatest water savings for the majority of CII customers. However, for public customers, such as parks and schools, seasonal water use represents about 45 percent of total water use, which indicates that outdoor water use measures may be more effective.
2.4.1 Landscape Survey/Audit: Large Irrigation Areas Measure Description Detecting leaks and establishing proper sprinkler and irrigation timer settings can save a substantial amount of water for large irrigation users.
This measure would affect CII customers with substantial landscaping (such as schools, parks, golf courses, and commercial developments with summer monthly use of at least 25,000 gallons more than winter monthly use). Trained staff or contracted irrigation professionals would assess the efficiency of the existing irrigation system and make recommendations to reduce outdoor water use.
Program Background, Projected Water Savings, and Costs CII irrigation landscapes are often labor intensive, partly due to a larger number of zones used in the landscape, often over 30. It is not uncommon for these users to use up to 100,000 gallons per month for their landscape needs. A best management practice guide prepared by the Texas Water Development Board offers guidelines for audits. The audits require 2 days of labor and an estimated $50 of other costs, for a total cost of $530 per audit. If the recommendations are implemented, savings are assumed to last at least 5 years. However, conduct of an audit is voluntary as is implementation of the recommendations. Therefore, the savings are not certain and such programs are often considered as part of the public education and outreach program.
Applicable Metrics for Evaluation Actual savings are difficult to predict because audits are often accompanied by irrigation system replacement or changes to overall landscape design. If implemented, evaluation of the success of the implemented measure could be measured by the following:
• Number of audits performed • Number of suggestions implemented upon follow-up and associated estimated savings • Number of auditors trained by WWU • Size (square feet) of irrigated landscapes audited
2.4.2 Irrigation Technology Measure Description The irrigation technology measure would be designed to allow a variety of irrigation technologies to be considered for a rebate. It could be broadly defined to require minimum savings and demonstrated actual water use reduction over time as compared to other rebates that are developed for installation of specific technologies.

2—COMMERCIAL, INDUSTRIAL AND INSTITUTIONAL (CII) DEMAND MANAGEMENT: POTENTIAL CONSERVATION EFFICIENCY MEASURES
WBG010912212935MKE 2-11
The program would focus on CII customers with the highest seasonal outdoor water usage. For example, for some CII accounts up to 44 percent of their water use seasonally and may be used for irrigation. WWU could also combine irrigation audits that assess watering behaviors with the irrigation technology.
Program Background, Projected Savings, and Costs Irrigation technology continues to evolve, and irrigation-related companies will continue to offer equipment that enables irrigation systems to use less water. For example, the latest conservation-related innovation includes multistream rotating nozzles, which are a type of sprinkler with a multistream rotor the size of a spray nozzle. The nozzle fits any conventional spray head body or shrub adapter and offers high uniformity and low application rates. Similar to the weather-based irrigation controller, additional analysis is required to evaluate savings and costs to develop a program to provide rebates for water-saving irrigation technology. It is likely that additional field personnel would be required to evaluate the technology as well as to conduct the audits and inspections.
Applicable Metrics for Evaluation If implemented, evaluation of the success of the implemented measure could be based on the following:
• Water savings
• Number of rebates provided
• Number of (or percent of eligible) CII establishments participating
• Program costs (program administration, public education, contractors, and consultants, etc.) as a percentage of overall measure cost
• Program savings
• Water and sewer costs reduced by customer; energy savings
• O&M and/or capital costs avoided by WWU
2.4.3 Landscape/Turf Replacement Program Measure Description This measure would provide a limited number of rebates each year for CII customers that replace a minimum amount of square feet of turf with native or well-adapted low water-using plants or hardscapes, such as permeable garden paths. The customer would be required to submit a landscape conversion plan as part of the eligibility process. The rebated amount would be allocated over a 5-year period as water savings are demonstrated.
Program Background, Projected Savings, and Costs Choosing plants that are well adapted to the soil and climate conditions is most water efficient. Native plants maintain the look and feel of the local landscape and can provide habitat for birds, butterflies, and other wildlife. Well-adapted plants are generally easy to maintain and less likely to be stressed during times of low rainfall or extreme freeze. Landscape practices such as adding soil amendments or zoned irrigation and incorporating hardscapes, such as paths and patios can also reduce the need for supplemental irrigation and fertilizers. Such practices can reduce the volume of offsite runoff and enhance stormwater quality.
Estimating water savings from such practices can be difficult because customers may continue to irrigate more frequently, or use greater volumes of water than the landscape actually needs. Further, such landscape retrofits are often coupled with irrigation system upgrades, making it difficult to determine which savings are due to use of more efficient technology and which savings result from the change in landscape management practices. Given the relatively low outdoor use and the relatively high rainfall in the area, it is unclear that landscape or turf replacement would result in significant savings in the WWU service area. The program will take additional time to evaluate and will likely require additional personnel to evaluate the proposed landscape plans and conduct field inspections.
CONSERVATION EFFICIENCY MEASURES SUMMARY FOR WAUKESHA WATER UTILITY
2-12 WBG010912212935MKE
Applicable Metrics for Evaluation If implemented, evaluation of the success of the implemented measure could be based on the following:
• Water savings
• Number of rebates provided/ square feet of landscapes replaced
• Number of (or percent of eligible) CII establishments participating
• Program costs (program administration, public education, contractors, and consultants, etc.) as a percentage of overall measure cost
• Program savings
• Water and sewer costs reduced by customer; energy savings
• O&M and/or capital costs avoided by WWU
2.4.4 Rainwater Capture/Condensate Reuse Incentive Measure Description During the summer months when landscape irrigation is at its peak, production of condensate from air conditioning units is also at its peak. This measure would provide a rebate for CII customers to capture condensate and reuse it for non-potable purposes such as landscape irrigation. The steady stream of condensate during the summer months can supplement onsite rainwater capture to provide a reliable source for irrigation water. It is possible that expected water and wastewater savings would be sufficient to cover the costs of a condensate reuse system.
Program Background, Projected Water Savings, and Costs Water savings and costs to capture and reuse rainwater and condensate will vary case-by-case. Consideration for the potential for increased energy consumption to pump water to the irrigation system would be a factor as to the effectiveness for this measure on a particular property. It is likely that additional staff would be required to develop standards to prevent cross-connections with the potable system, evaluate the potential savings, and inspect the installation of such systems. Additional time to research this program is needed prior to implementation.
Applicable Metrics for Evaluation If implemented, evaluation of the success of the implemented measure could be based on the following:
• Water savings
• Number of rebates provided
• Number of (or percent of eligible) CII establishments participating
• Program costs (program administration, public education, contractors, and consultants, etc.) as a percentage of overall measure cost
• Program savings
• Water and sewer costs reduced by customer; energy savings
• O&M and/or capital costs avoided by WWU
2.4.5 Water Recycling (Reuse) Measure Description This measure would involve a longer-term exploration of the potential and costs for onsite reuse or wastewater effluent reuse within WWU’s service area. As water use efficiency improves, the opportunities, water savings, and

2—COMMERCIAL, INDUSTRIAL AND INSTITUTIONAL (CII) DEMAND MANAGEMENT: POTENTIAL CONSERVATION EFFICIENCY MEASURES
WBG010912212935MKE 2-13
costs associated with water recycling will change. Investigation into state regulations, plumbing codes, and other regulatory constraints are required to determine the feasibility of additional water recycling within the service area.
Program Background, Projected Water Savings, and Costs Water recycling (or wastewater reuse) is the beneficial use of wastewater from a treatment plant or after another use. Wastewater effluent is domestic or municipal wastewater that has been treated to a quality suitable for a particular beneficial use. Potential beneficial uses of recycled water include golf course, athletic field, or park irrigation, industrial cooling and process water, and other non-potable uses. Some communities in arid or severely water-limited areas provide additional treatment and include this source for potable use as well.
Recycled water use can be achieved onsite in some industrial or public applications, or distributed throughout a utility’s service area through a separate system of pipes and pump stations. When the wastewater treatment facilities are located near potential users, this can be efficient; however, if getting the recycled water to the end user requires an extensive piping system, this process can be expensive as well as energy-intensive.
WWU has evaluated the feasibility of water reuse in the operation of its water supply, treatment, and distribution facilities. There are negligible opportunities for water reuse for the following reasons:
• Plumbing fixtures in the WWU Administration Building have been retrofitted with high-efficiency units • Landscaped areas are not irrigated • Water used in water treatment processes cannot be recycled because of high radium concentrations


WBG010912212935MKE 3-1
SECTION 3
Policies, Service Rule Provisions, Ordinances, and Building Codes In addition to customer incentives and public education and information, policies or regulations are elements of a comprehensive water conservation program. The policies presented here are options for WWU to consider, and could be incorporated into WWU’s service rules, or adopted into the City code through ordinances. Costs for implementation and enforcement would likely be low. The potential for water savings has not yet been determined for the policy options presented; however, savings can be evaluated for policies that achieve a favorable ranking.
3.1 Leak Inspection and Repair prior to Property Resale or Lease
3.1.1 Measure Description This utility service rule or ordinance would provide that property would be inspected for existing and potential indoor and outdoor leaks prior to signing of property resale or lease agreements. Generally, the policy would include the following provisions:
• Leak inspection will include all indoor and outdoor water-using fixtures, appliances, equipment, irrigation systems (such as pipes and sprinkler heads), and plumbing connections as well as the water service line to the property.
• All existing leaks will be repaired, with proof of such repairs (for instance, paid plumber’s invoice) documented as a condition of property sale or lease.
• Potential leaks, such as heavily worn but not broken clothes washer hoses or rusting pipe connections, will also be documented and presented to the new property owner(s) or lessee(s), but will not be required for preemptive repair.
• Public properties, including buildings and outdoor facilities such as public parks and playing fields, will be subject to the same leak inspection and repair requirements described above at least once every 3 years.
3.2 Fixture and Equipment Retrofit or Replacement upon Property Resale or Lease
3.2.1 Measure Description This utility service rule or ordinance would require that properties with existing plumbing fixtures that have flush or flow rates that exceed the Wisconsin Administrative Code, Chapter Comm 84: Plumbing Products, and would replace those fixtures with models that comply with the more water-efficient requirements set forth in the State Code as a condition of property resale or lease of the property. Generally, the policy would include the following provisions:
• Property owners with noncompliant fixtures are encouraged, but not required,1
• High-volume pre-rinse spray valves (exceeding 1.6 gpm) will be replaced at property transfer or lease.
to install new high-efficiency WaterSense-labeled toilets, showerheads, urinals, and bathroom faucets as appropriate. Property owners that install WaterSense-labeled fixtures at resale or lease may be eligible for rebates.
1 The Waukesha Municipal Code incorporates by reference the State of Wisconsin Plumbing Code. The state plumbing code can disallow local authorities from creating rules that supersede or conflict with the state’s code. Thus, in some cases, local plumbing code or ordinances may require state approval.

CONSERVATION EFFICIENCY MEASURES SUMMARY FOR WAUKESHA WATER UTILITY
3-2 WBG010912212935MKE
• Properties with once-through cooling systems, water-cooled ice makers, and other water-using fixtures that are inefficient, will be identified prior to property transfer or lease to determine their eligibility for replacement under existing rebate, loan, grant, or other financial assistance program.
• Public properties, including buildings and outdoor facilities such as public parks and playing fields, will be subject to the same fixture inspection and retrofit and replacement (if necessary) requirements described above at least once every 3 years.
3.3 Year-round Lawn and Landscape Sprinkling Schedule 3.3.1 Measure Description This utility service rule or ordinance would change the existing sprinkling ordinance to reduce sprinkling to 1 day per week and limit time of day watering. Such a policy could include that the following elements:
• Automatic sprinkling systems may be operated for no longer than a prescribed duration (that is, 45 minutes) 1 day per week throughout the year.
• Handheld hoses used for lawn watering may apply water for no longer than a prescribed duration (that is, 30 minutes) 1 day per week.
• Allowable irrigation day may be set by address. For instance, residential odd number addresses may water on Saturdays, residential even number addresses may water on Sundays, nonresidential odd number addresses may water on Tuesdays, and nonresidential even number addresses may water on Thursdays. (Alternative schedule: watering is allowed on the same day as trash collection.)
• No outdoor irrigation is allowed when it is raining.
• Handheld hoses used for lawn and landscape irrigation, vehicle washing, and other tasks must be equipped with an automatic shutoff nozzle.
• Temporary exemptions granted by application and permit may be allowed for newly planted grass, sod, and other plant materials not to exceed 30 days.
Ordinance example:
Franklin, Massachusetts, Water Usage Restrictions, http://town.franklin.ma.us/Pages/FranklinMA_ATM/FranklinMA_PDQhousing/125
3.4 Decorative Water Features 3.4.1 Measure Description This utility service rule or ordinance would establish design standards and water use limitations for outdoor decorative water features. Elements of such a policy could include the following provisions:
• All fountains, ponds, waterfalls, or other decorative water features, excluding swimming pools or spas, will have a maximum total cumulative exposed water surface area of 20 square feet.
• Allowed water features will use a water recirculation system (no once-through systems).
• All water sprayed from the water feature must remain within the water feature and will not spray or run off onto surrounding landscape or hardscape areas.
• Outdoor decorative water features may be operated for no longer than 8 hours per day and not between the hours of 12:00 a.m. and 6:00 a.m.

3—POLICIES, SERVICE RULE PROVISIONS, ORDINANCES AND BUILDING CODES
WBG010912212935MKE 3-3
• Swimming pools and spas would be required to have covers to reduce evaporative losses.
Ordinance example:
City of Santa Monica, California, Water-Efficient Landscape and Irrigation Standards, http://www.smgov.net/uploadedFiles/Departments/OSE/Categories/Landscape/SKMBT_C65211041317010.pdf
3.5 Annual Irrigation Inspection 3.5.1 Measure Description This utility service rule or ordinance would establish requirements for irrigation system inspections for large properties. Generally, the policy would include the following provisions:
• Properties 5 acres or over, athletic fields and golf courses with in-ground irrigation systems must submit an annual irrigation checkup report to WWU.
• The irrigation checkup report will document results from a leak inspection and related water waste repairs and adjustments that were made, such as improvements to distribution uniformity, verification of correct rain sensor operation, and related measures.
• Properties that do not have a current irrigation system checkup on file may be fined and will lose their courtesy water waste warning if the irrigation system is reported being run outside designated irrigation hours or if water from the irrigation system is found running down the street or other impervious cover.
Ordinance example:
San Antonio, Texas, Water System, Irrigation Check-up Ordinance, http://www.saws.org/conservation/Ordinance/IrrigationAudit/
3.6 Conservation Standards for New Construction 3.6.1 Measure Description Generally, implementing water-conserving elements in new buildings and construction is more cost-effective than retrofitting existing structures and landscapes. This ordinance would establish requirements for new construction to require certain water-efficiency standards for indoor and outdoor water use. Such an ordinance would be developed with input and involvement of the building and real estate community, irrigators, landscape professionals, building inspectors, city planners, and other stakeholders. This policy could include the following elements:
• Establishing or amending landscape and/or irrigation requirements in development codes to require rain/freeze sensors and other features
• Establishing standards for landscaped median width to prevent irrigation overspray, or prohibiting pop-up or rotary sprayheads for irrigating narrow areas
• Requiring irrigation plans review and approval
• Requiring submeters or separate metering for multi-family housing units
• Requiring pint or half-gallon urinals, high-efficiency water heaters, or other water-efficient fixtures and appliances
CONSERVATION EFFICIENCY MEASURES SUMMARY FOR WAUKESHA WATER UTILITY
3-4 WBG010912212935MKE
3.7 Water Waste Prevention 3.7.1 Measure Description Water waste prevention ordinances establish general rules for water use that prevent non-beneficial use of water. Because many such practices increase water runoff, they can also benefit stormwater quality efforts. This policy could include the following elements:
• Prohibiting runoff from properties during irrigation • Prohibiting hose washing of driveways, sidewalks, and patios • Prohibiting voluntary carwashes in parking lots other impervious areas • Requiring two to four cycles of concentration for new cooling towers • Prohibiting single-pass water-cooled ice machine • Requiring positive shutoff valves for handheld dishwashing wands
3.8 Monthly Billing 3.8.1 Measure Description Increasing the billing frequency from a quarterly to a monthly system supports conservation efforts in several ways. More frequent billing increases customer awareness of water use and can help identify customer water leaks more quickly. The financial signal from seasonal or inverted block rates (that is, higher cost per gallon of water used as volume increases) is stronger with more frequent billing.
WBG010912212935MKE 4-1
SECTION 4
References About.com. 2011. “Eco-Friendly Car Washing: Is It Better to Wash Cars at Home or at the Car Wash?” Accessed on November 25, 2011, at http://environment.about.com/od/greenlivingdesign/a/car_wash.htm.
American Water Works Association (AWWA), 1999. Residential End Users Water Survey.
California Urban Water Conservation Council. 2011. “Home Tour.” Accessed on November 7, 2011, at http://www.h2ouse.org/tour/index.cfm.
Food Service Technology Center, 2011. “Pre-Rinse Spray Valves.” Accessed on December 2, 2011, at http://www.fishnick.com/equipment/sprayvalves.
National Association of Home Builders (NAHB). 2008.
New Hampshire Department of Environmental Services. 2001. “Implementing a Water Efficiency and Conservation Program for Public Water Utilities.” Accessed on December 2, 2011, at http://des.nh.gov/organization/commissioner/pip/factsheets/dwgb/documents/dwgb-26-9.pdf.
U.S. Environmental Protection Agency (USEPA). 2011a. “WaterSense Labeled Toilets.” Accessed on November 10, 2011, at http://epa.gov/watersense/pubs/toilets.html.
U.S. Environmental Protection Agency (USEPA). 2011b. “WaterSense Labeled Flushing Urinals.” Accessed on November 26, 2011, at http://www.epa.gov/watersense/docs/urinal_factsheet508.pdf.

Appendix F Long-term CEM Implementation

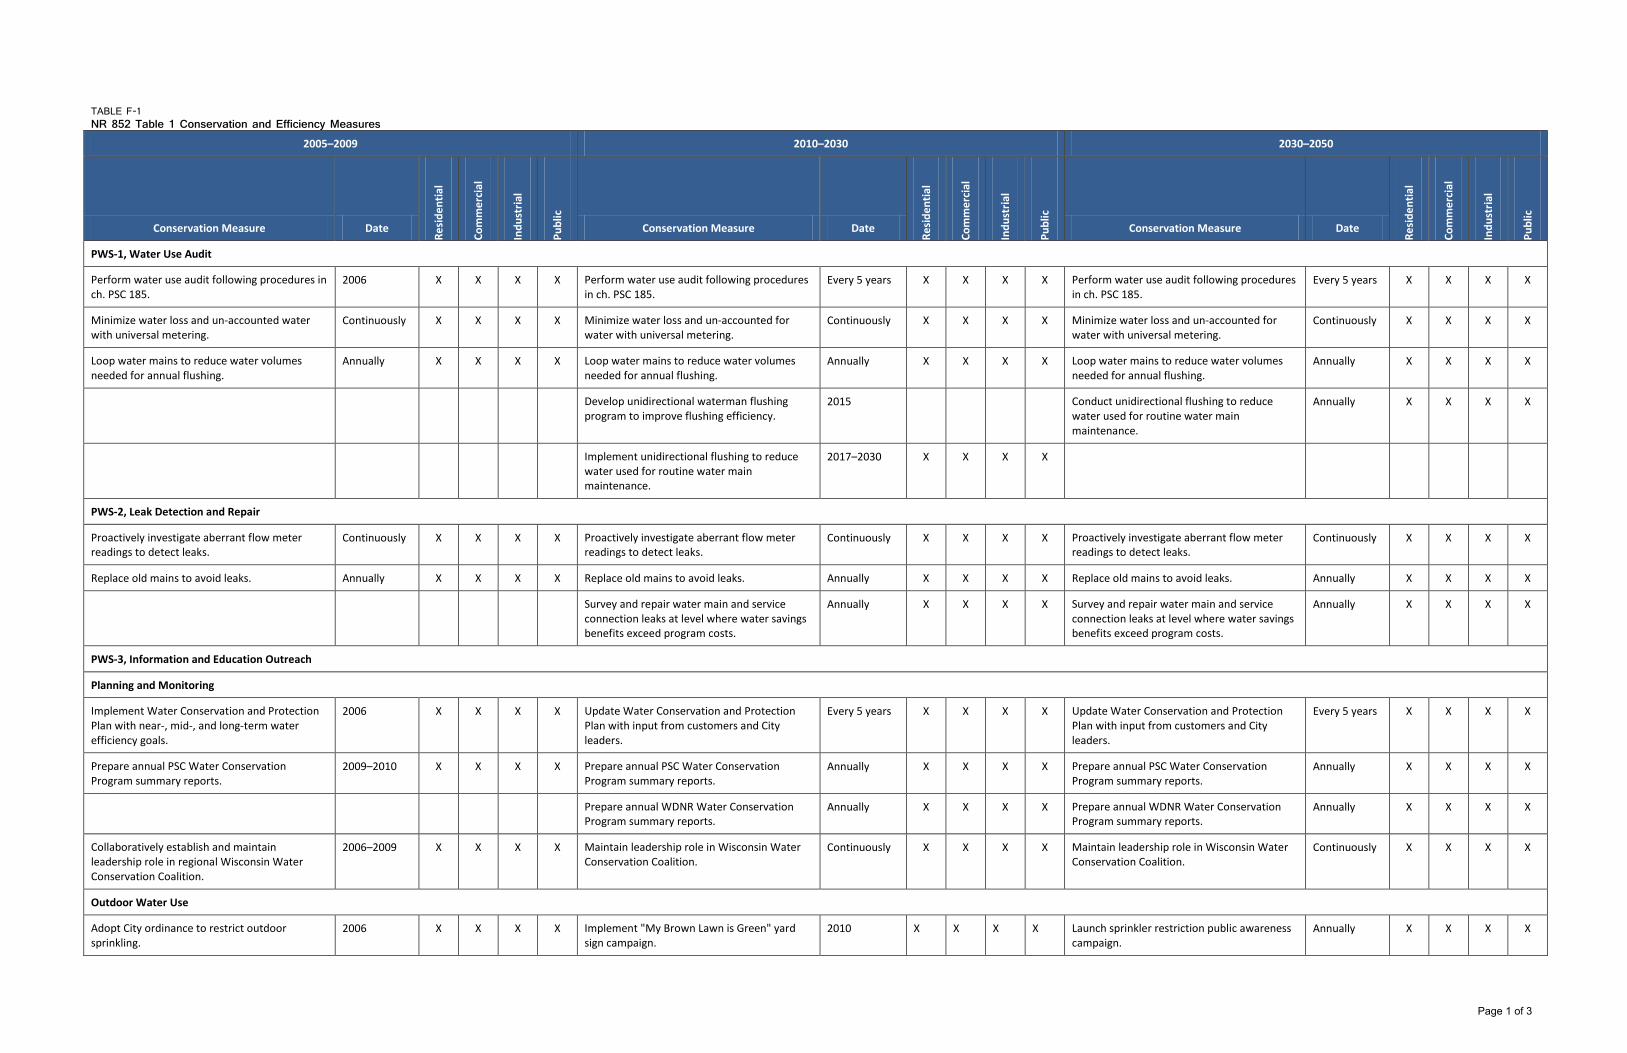
TABLE F-1 NR 852 Table 1 Conservation and Efficiency Measures
2005–2009 2010–2030 2030–2050
Conservation Measure Date
Resi
dent
ial
Com
mer
cial
Indu
stria
l
Publ
ic
Conservation Measure Date
Resi
dent
ial
Com
mer
cial
Indu
stria
l
Publ
ic
Conservation Measure Date
Resi
dent
ial
Com
mer
cial
Indu
stria
l
Publ
ic
PWS-1, Water Use Audit
Perform water use audit following procedures in ch. PSC 185.
2006 X X X X Perform water use audit following procedures in ch. PSC 185.
Every 5 years X X X X Perform water use audit following procedures in ch. PSC 185.
Every 5 years X X X X
Minimize water loss and un-accounted water with universal metering.
Continuously X X X X Minimize water loss and un-accounted for water with universal metering.
Continuously X X X X Minimize water loss and un-accounted for water with universal metering.
Continuously X X X X
Loop water mains to reduce water volumes needed for annual flushing.
Annually X X X X Loop water mains to reduce water volumes needed for annual flushing.
Annually X X X X Loop water mains to reduce water volumes needed for annual flushing.
Annually X X X X
Develop unidirectional waterman flushing program to improve flushing efficiency.
2015 Conduct unidirectional flushing to reduce water used for routine water main maintenance.
Annually X X X X
Implement unidirectional flushing to reduce water used for routine water main maintenance.
2017–2030 X X X X
PWS-2, Leak Detection and Repair
Proactively investigate aberrant flow meter readings to detect leaks.
Continuously X X X X Proactively investigate aberrant flow meter readings to detect leaks.
Continuously X X X X Proactively investigate aberrant flow meter readings to detect leaks.
Continuously X X X X
Replace old mains to avoid leaks. Annually X X X X Replace old mains to avoid leaks. Annually X X X X Replace old mains to avoid leaks. Annually X X X X
Survey and repair water main and service connection leaks at level where water savings benefits exceed program costs.
Annually X X X X Survey and repair water main and service connection leaks at level where water savings benefits exceed program costs.
Annually X X X X
PWS-3, Information and Education Outreach
Planning and Monitoring
Implement Water Conservation and Protection Plan with near-, mid-, and long-term water efficiency goals.
2006 X X X X Update Water Conservation and Protection Plan with input from customers and City leaders.
Every 5 years X X X X Update Water Conservation and Protection Plan with input from customers and City leaders.
Every 5 years X X X X
Prepare annual PSC Water Conservation Program summary reports.
2009–2010 X X X X Prepare annual PSC Water Conservation Program summary reports.
Annually X X X X Prepare annual PSC Water Conservation Program summary reports.
Annually X X X X
Prepare annual WDNR Water Conservation Program summary reports.
Annually X X X X Prepare annual WDNR Water Conservation Program summary reports.
Annually X X X X
Collaboratively establish and maintain leadership role in regional Wisconsin Water Conservation Coalition.
2006–2009 X X X X Maintain leadership role in Wisconsin Water Conservation Coalition.
Continuously X X X X Maintain leadership role in Wisconsin Water Conservation Coalition.
Continuously X X X X
Outdoor Water Use
Adopt City ordinance to restrict outdoor sprinkling.
2006 X X X X Implement "My Brown Lawn is Green" yard sign campaign.
2010 X X X X Launch sprinkler restriction public awareness campaign.
Annually X X X X
Page 1 of 3
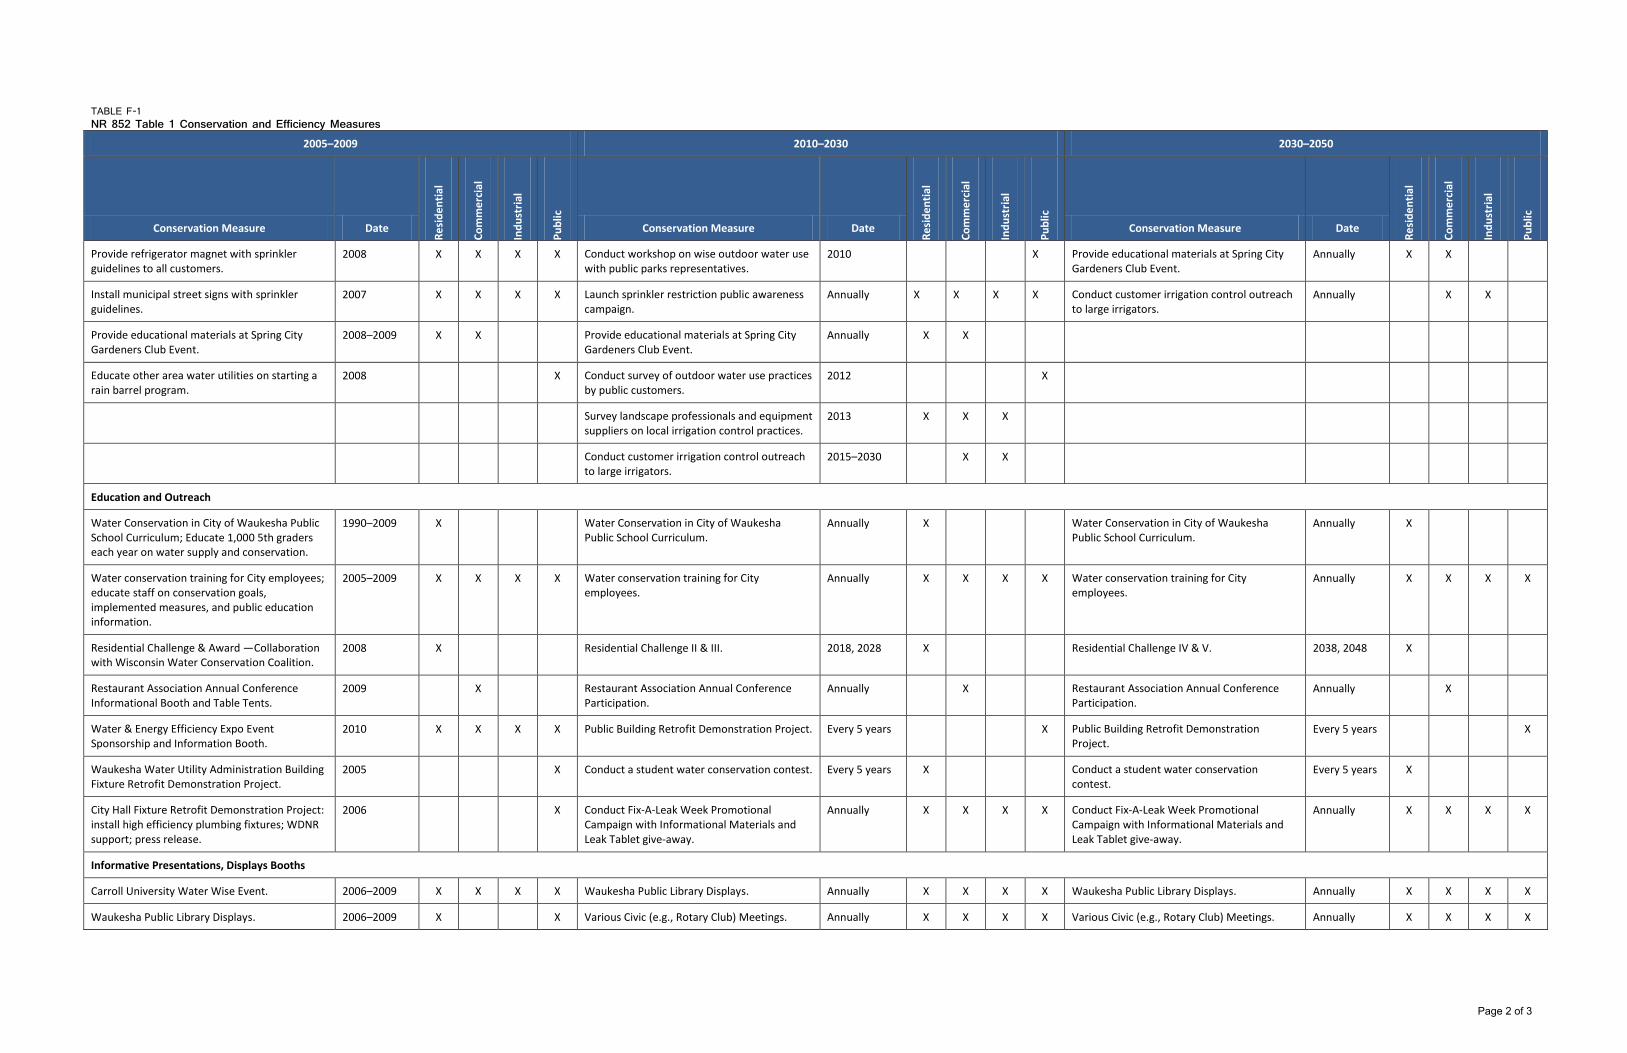
TABLE F-1 NR 852 Table 1 Conservation and Efficiency Measures
2005–2009 2010–2030 2030–2050
Conservation Measure Date
Resi
dent
ial
Com
mer
cial
Indu
stria
l
Publ
ic
Conservation Measure Date
Resi
dent
ial
Com
mer
cial
Indu
stria
l
Publ
ic
Conservation Measure Date
Resi
dent
ial
Com
mer
cial
Indu
stria
l
Publ
ic
Provide refrigerator magnet with sprinkler guidelines to all customers.
2008 X X X X Conduct workshop on wise outdoor water use with public parks representatives.
2010 X Provide educational materials at Spring City Gardeners Club Event.
Annually X X
Install municipal street signs with sprinkler guidelines.
2007 X X X X Launch sprinkler restriction public awareness campaign.
Annually X X X X Conduct customer irrigation control outreach to large irrigators.
Annually X X
Provide educational materials at Spring City Gardeners Club Event.
2008–2009 X X Provide educational materials at Spring City Gardeners Club Event.
Annually X X
Educate other area water utilities on starting a rain barrel program.
2008 X Conduct survey of outdoor water use practices by public customers.
2012 X
Survey landscape professionals and equipment suppliers on local irrigation control practices.
2013 X X X
Conduct customer irrigation control outreach to large irrigators.
2015–2030 X X
Education and Outreach
Water Conservation in City of Waukesha Public School Curriculum; Educate 1,000 5th graders each year on water supply and conservation.
1990–2009 X Water Conservation in City of Waukesha Public School Curriculum.
Annually X Water Conservation in City of Waukesha Public School Curriculum.
Annually X
Water conservation training for City employees; educate staff on conservation goals, implemented measures, and public education information.
2005–2009 X X X X Water conservation training for City employees.
Annually X X X X Water conservation training for City employees.
Annually X X X X
Residential Challenge & Award —Collaboration with Wisconsin Water Conservation Coalition.
2008 X Residential Challenge II & III. 2018, 2028 X Residential Challenge IV & V. 2038, 2048 X
Restaurant Association Annual Conference Informational Booth and Table Tents.
2009 X Restaurant Association Annual Conference Participation.
Annually X Restaurant Association Annual Conference Participation.
Annually X
Water & Energy Efficiency Expo Event Sponsorship and Information Booth.
2010 X X X X Public Building Retrofit Demonstration Project. Every 5 years X Public Building Retrofit Demonstration Project.
Every 5 years X
Waukesha Water Utility Administration Building Fixture Retrofit Demonstration Project.
2005 X Conduct a student water conservation contest. Every 5 years X Conduct a student water conservation contest.
Every 5 years X
City Hall Fixture Retrofit Demonstration Project: install high efficiency plumbing fixtures; WDNR support; press release.
2006 X Conduct Fix-A-Leak Week Promotional Campaign with Informational Materials and Leak Tablet give-away.
Annually X X X X Conduct Fix-A-Leak Week Promotional Campaign with Informational Materials and Leak Tablet give-away.
Annually X X X X
Informative Presentations, Displays Booths
Carroll University Water Wise Event. 2006–2009 X X X X Waukesha Public Library Displays. Annually X X X X Waukesha Public Library Displays. Annually X X X X
Waukesha Public Library Displays. 2006–2009 X X Various Civic (e.g., Rotary Club) Meetings. Annually X X X X Various Civic (e.g., Rotary Club) Meetings. Annually X X X X
Page 2 of 3
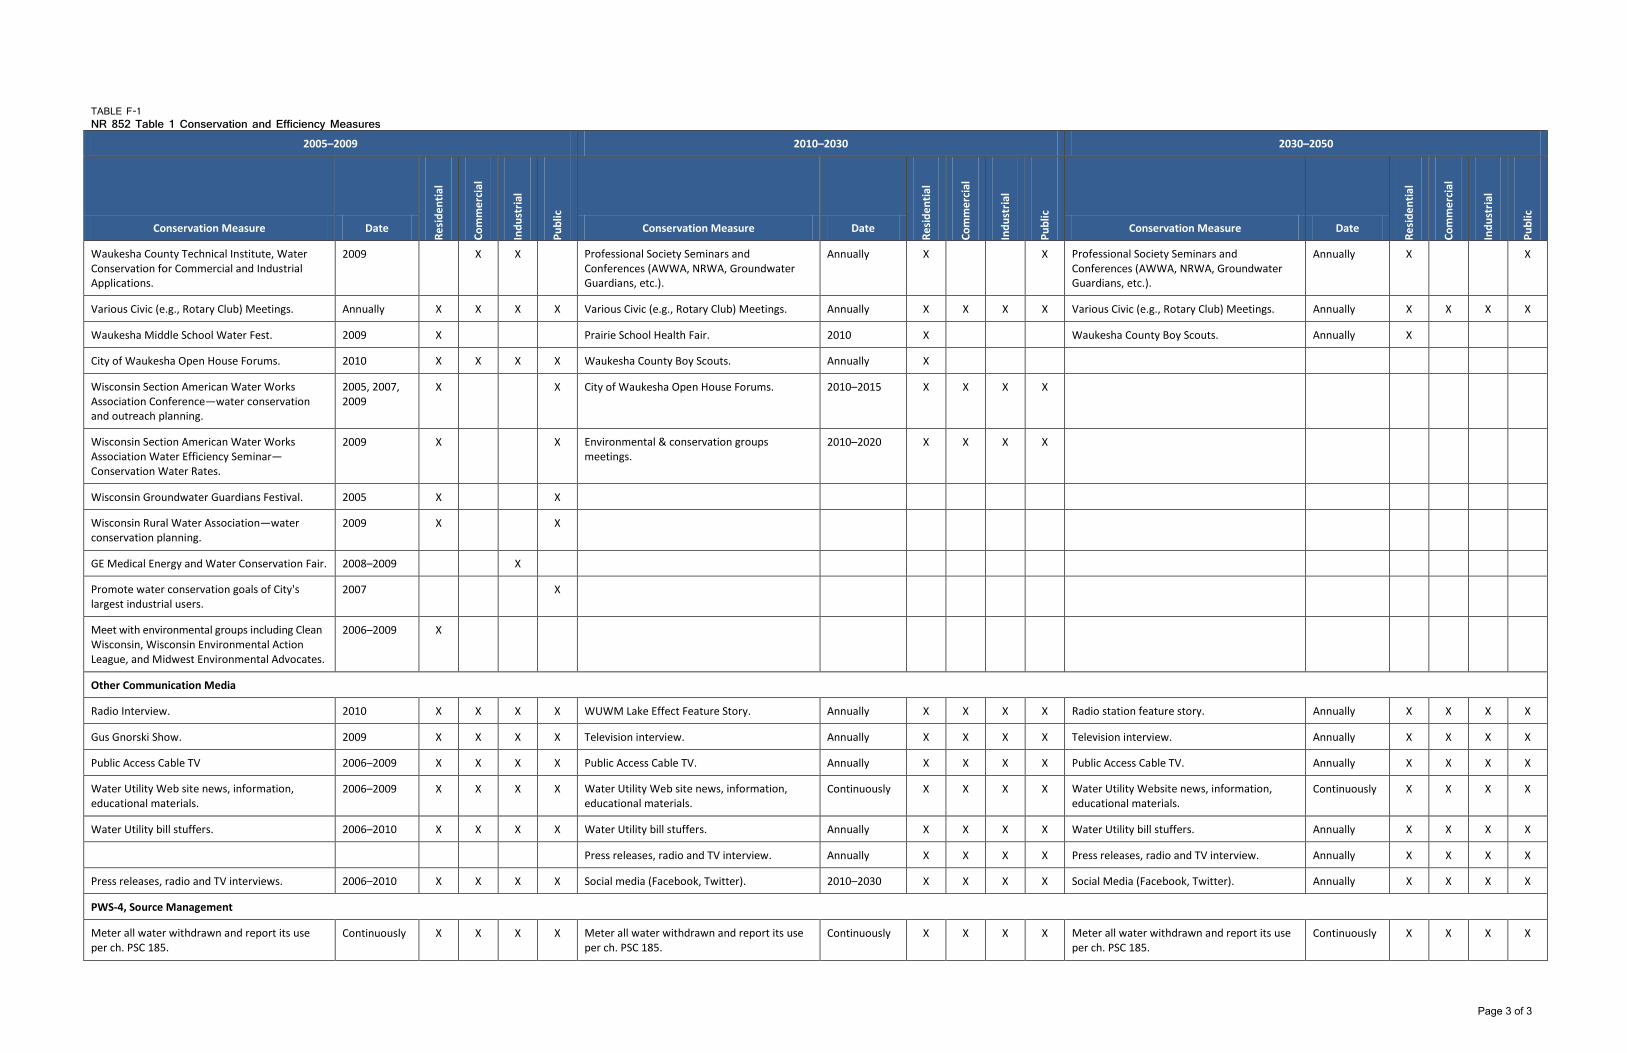
TABLE F-1 NR 852 Table 1 Conservation and Efficiency Measures
2005–2009 2010–2030 2030–2050
Conservation Measure Date
Resi
dent
ial
Com
mer
cial
Indu
stria
l
Publ
ic
Conservation Measure Date
Resi
dent
ial
Com
mer
cial
Indu
stria
l
Publ
ic
Conservation Measure Date
Resi
dent
ial
Com
mer
cial
Indu
stria
l
Publ
ic
Waukesha County Technical Institute, Water Conservation for Commercial and Industrial Applications.
2009 X X Professional Society Seminars and Conferences (AWWA, NRWA, Groundwater Guardians, etc.).
Annually X X Professional Society Seminars and Conferences (AWWA, NRWA, Groundwater Guardians, etc.).
Annually X X
Various Civic (e.g., Rotary Club) Meetings. Annually X X X X Various Civic (e.g., Rotary Club) Meetings. Annually X X X X Various Civic (e.g., Rotary Club) Meetings. Annually X X X X
Waukesha Middle School Water Fest. 2009 X Prairie School Health Fair. 2010 X Waukesha County Boy Scouts. Annually X
City of Waukesha Open House Forums. 2010 X X X X Waukesha County Boy Scouts. Annually X
Wisconsin Section American Water Works Association Conference—water conservation and outreach planning.
2005, 2007, 2009
X X City of Waukesha Open House Forums. 2010–2015 X X X X
Wisconsin Section American Water Works Association Water Efficiency Seminar—Conservation Water Rates.
2009 X X Environmental & conservation groups meetings.
2010–2020 X X X X
Wisconsin Groundwater Guardians Festival. 2005 X X
Wisconsin Rural Water Association—water conservation planning.
2009 X X
GE Medical Energy and Water Conservation Fair. 2008–2009 X
Promote water conservation goals of City's largest industrial users.
2007 X
Meet with environmental groups including Clean Wisconsin, Wisconsin Environmental Action League, and Midwest Environmental Advocates.
2006–2009 X
Other Communication Media
Radio Interview. 2010 X X X X WUWM Lake Effect Feature Story. Annually X X X X Radio station feature story. Annually X X X X
Gus Gnorski Show. 2009 X X X X Television interview. Annually X X X X Television interview. Annually X X X X
Public Access Cable TV 2006–2009 X X X X Public Access Cable TV. Annually X X X X Public Access Cable TV. Annually X X X X
Water Utility Web site news, information, educational materials.
2006–2009 X X X X Water Utility Web site news, information, educational materials.
Continuously X X X X Water Utility Website news, information, educational materials.
Continuously X X X X
Water Utility bill stuffers. 2006–2010 X X X X Water Utility bill stuffers. Annually X X X X Water Utility bill stuffers. Annually X X X X
Press releases, radio and TV interview. Annually X X X X Press releases, radio and TV interview. Annually X X X X
Press releases, radio and TV interviews. 2006–2010 X X X X Social media (Facebook, Twitter). 2010–2030 X X X X Social Media (Facebook, Twitter). Annually X X X X
PWS-4, Source Management
Meter all water withdrawn and report its use per ch. PSC 185.
Continuously X X X X Meter all water withdrawn and report its use per ch. PSC 185.
Continuously X X X X Meter all water withdrawn and report its use per ch. PSC 185.
Continuously X X X X
Page 3 of 3


TABLE F-2 NR 852 Table 2 Conservation and Efficiency Measures
2005–2009 2010–2030 2030–2050
Conservation Measure Date
Resi
dent
ial
Com
mer
cial
Indu
stria
l
Publ
ic
Conservation Measure Date
Resi
dent
ial
Com
mer
cial
Indu
stria
l
Publ
ic
Conservation Measure Date
Resi
dent
ial
Com
mer
cial
Indu
stria
l
Publ
ic
PWS-R1, Distribution System Pressure Management
Maintain optimum system pressure to minimize volume leaked.
2006–2009 X X X X Maintain optimum system pressure to minimize volume leaked.
2010–2030 X X X X Maintain optimum system pressure to minimize volume leaked.
2030–2050 X X X X
Notify customers about planned system pressure changes and importance of leak audits.
2009 X X X X Notify customers about planned system pressure changes and importance of leak audits.
2010 X X X X Notify customers about planned system pressure changes and importance of leak audits.
As Needed X X X X
PWS-R2, Residential Demand Management Program
Incentives Programs
Toilet Rebate Incentive Program. 2008–2009 X Increase $25 toilet rebate to $100. Conduct survey of rebate recipients.
2011 X Audit and refine active incentive programs. Annually X
Initiated City Rainbarrel Incentive Program. 2008 X Audit and refine active incentive programs. Annually X Promote City Rainbarrel Incentive Program. Continuously X
Conduct water use study to define customer use trends
2006–2009 X X X X Conduct water use study to define customer use trends.
Annually X X X X Conduct water use study to define customer use trends
Annually X X X X
Promote City Rainbarrel Incentive Program.
Continuously X
Investigate low income housing fixture replacement incentive program with Wisconsin Focus on Energy.
2010 X
Develop clothes washer rebate incentive program.
2014 X
Implement clothes washer rebate incentive program.
2014–2030 X
Develop showerhead rebate incentive program.
2012 X
Implement showerhead rebate incentive program.
2012–2030 X
Residential Demand Management Water Pricing
Implement first-in-state inclining rate structure to encourage water conservation.
2007 X Evaluate inclining rate structure design. Annually X Evaluate inclining rate structure design. X
Refine inclining rate structure design. 2009 X Investigate converting from quarterly to monthly billing frequency.
2016 X
Page 1 of 3

TABLE F-2 NR 852 Table 2 Conservation and Efficiency Measures
2005–2009 2010–2030 2030–2050
Conservation Measure Date
Resi
dent
ial
Com
mer
cial
Indu
stria
l
Publ
ic
Conservation Measure Date
Resi
dent
ial
Com
mer
cial
Indu
stria
l
Publ
ic
Conservation Measure Date
Resi
dent
ial
Com
mer
cial
Indu
stria
l
Publ
ic
PWS-R3, Commercial and Industrial Demand Management
Conduct Rainbarrel Demonstration Project with City Improvement Business District.
2009 X Conduct water use survey of commercial customers to develop criteria to customize demand management and water use guidance.
2012 X Audit and refine active incentive programs. Annually X X X
Partnered with Metropolitan Builders Asso-ciation in development of "Green" Trend Home.
2007 X Provide customized commercial demand management guidance.
2013–2020 X Refine customized commercial, industrial, and public demand management guidance.
Every 5 years X
Conduct water use survey of industrial customers to develop criteria to customize demand management and water use audit guidance.
2014 X
Provide customized industrial demand management guidance.
2015–2030 X
Conduct water use survey of public customers to develop criteria to customize public demand management and water use audit guidance.
2015 X
Provide customized public demand management guidance.
2016–2030 X
Develop urinal rebate incentive program. 2014 X X X
Implement urinal rebate incentive program.
2015–2030 X X X
Develop clothes washer rebate incentive program.
2014 X
Implement clothes washer rebate incentive program.
2014–2030 X
Develop showerhead rebate incentive program.
2012 X X
Implement showerhead rebate incentive program.
2012–2030 X X
Investigate spray rinse valve incentive program in collaboration with Wisconsin Focus on Energy.
2015 X X X
Implement spray rinse valve incentive program.
2015–2030 X X X
Evaluate inclining rate structure for commercial and industrial customers.
X X
Page 2 of 3

TABLE F-2 NR 852 Table 2 Conservation and Efficiency Measures
2005–2009 2010–2030 2030–2050
Conservation Measure Date
Resi
dent
ial
Com
mer
cial
Indu
stria
l
Publ
ic
Conservation Measure Date
Resi
dent
ial
Com
mer
cial
Indu
stria
l
Publ
ic
Conservation Measure Date
Resi
dent
ial
Com
mer
cial
Indu
stria
l
Publ
ic
PWS-R4, Water Reuse
Recycled filter backwash water until radium levels in water prohibited this practice.
2008–2009 Investigate potential applications for nonpotable water reuse in the City.
2020 X Implement a water reuse demonstration project.
2040 X
Audit water utility facilities to identify water reuse applications.
2008 Implement an environmentally sound water reuse demonstration project.
2030 X
Page 3 of 3


Appendix G AWE Tool Output

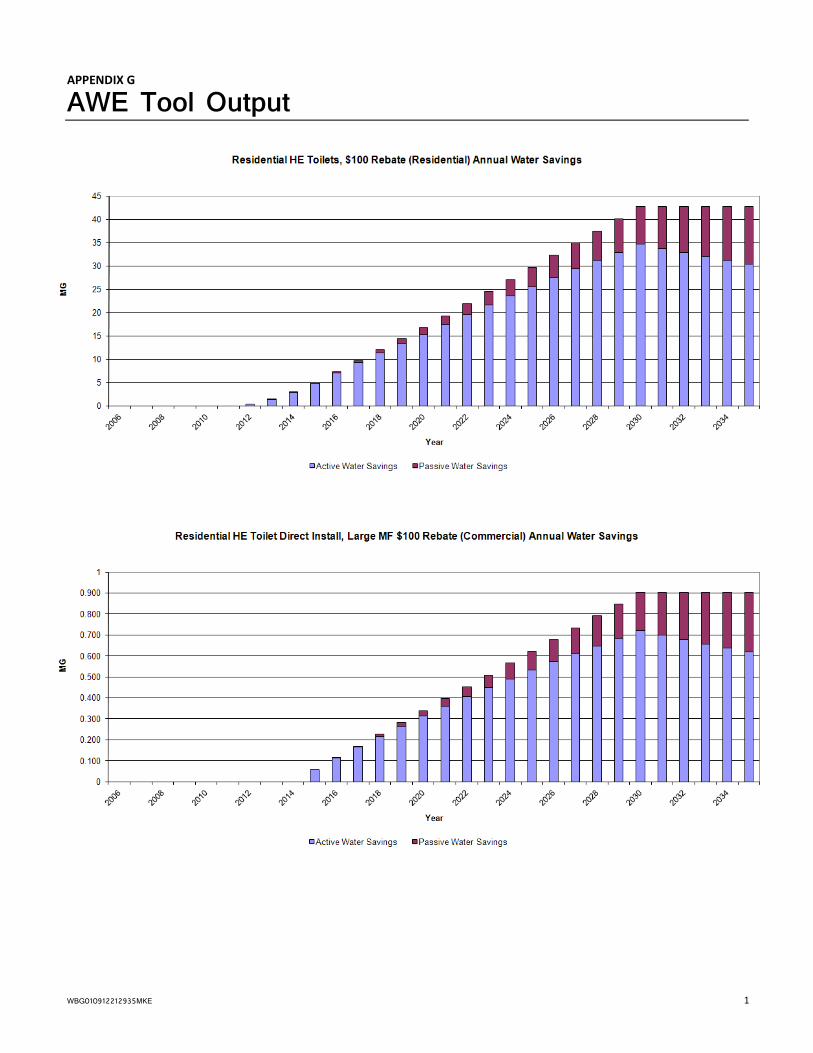
WBG010912212935MKE 1
APPENDIX G
AWE Tool Output

APPENDIX G—AWE TOOL OUTPUT
2 WBG010912212935MKE
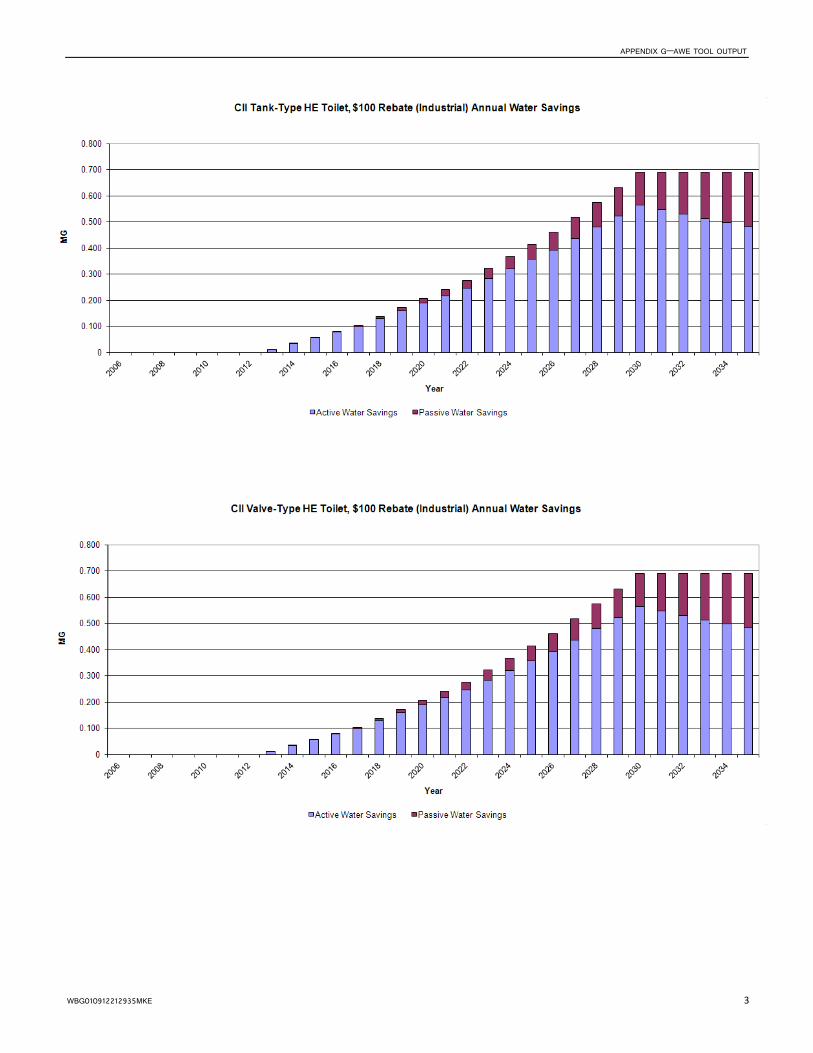
APPENDIX G—AWE TOOL OUTPUT
WBG010912212935MKE 3

APPENDIX G—AWE TOOL OUTPUT
4 WBG010912212935MKE

APPENDIX G—AWE TOOL OUTPUT
WBG010912212935MKE 5

APPENDIX G—AWE TOOL OUTPUT
6 WBG010912212935MKE
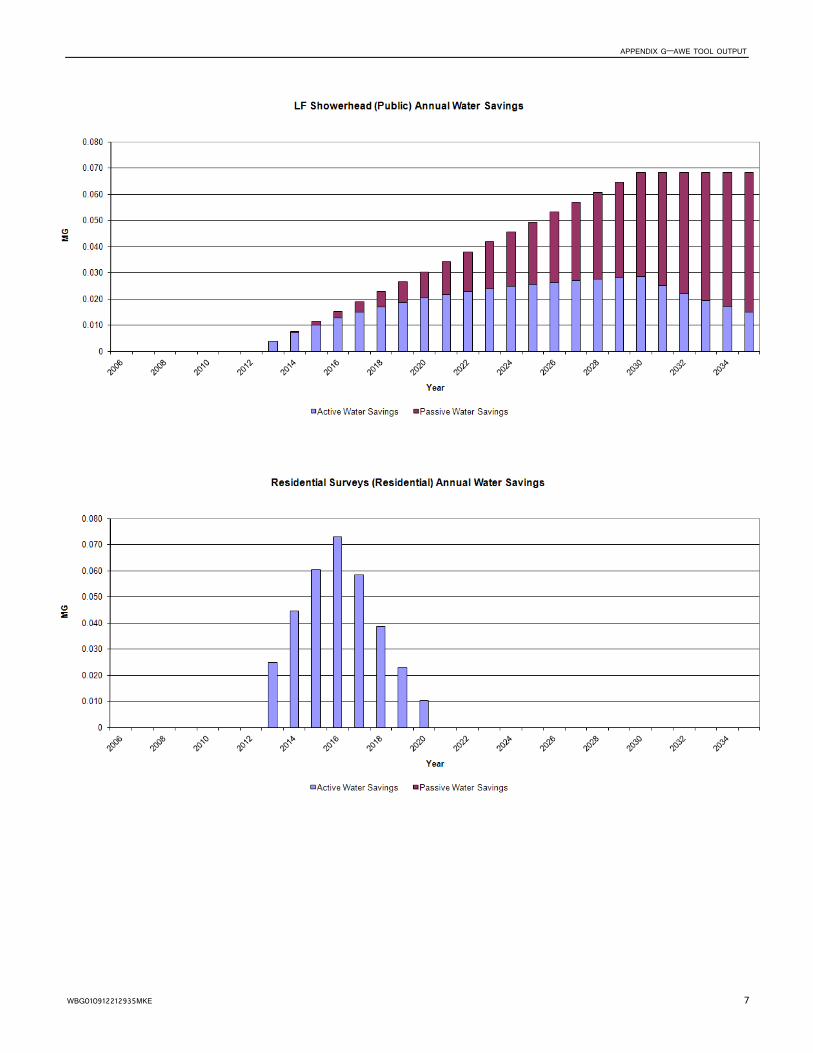
APPENDIX G—AWE TOOL OUTPUT
WBG010912212935MKE 7

APPENDIX G—AWE TOOL OUTPUT
8 WBG010912212935MKE
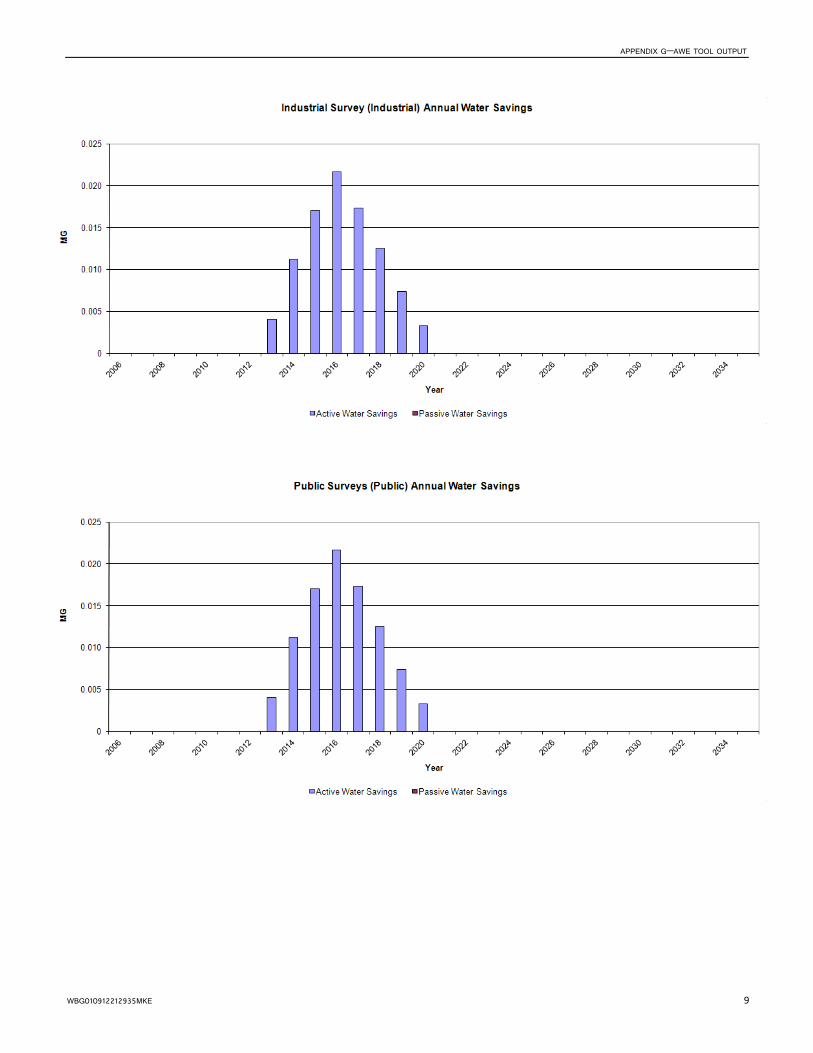
APPENDIX G—AWE TOOL OUTPUT
WBG010912212935MKE 9

APPENDIX G—AWE TOOL OUTPUT
10 WBG010912212935MKE

APPENDIX G—AWE TOOL OUTPUT
WBG010912212935MKE 11

APPENDIX G—AWE TOOL OUTPUT
12 WBG010912212935MKE

APPENDIX G—AWE TOOL OUTPUT
WBG010912212935MKE 13
