water as an alternative asset - universität paderborngroups.uni-paderborn.de/fiwi/repec/working...
TRANSCRIPT

Water as an Alternative Asset
Mike Gilroy Heike Schreckenberg Volker Seiler∗
25.03.2013
Abstract
As correlations of asset returns increased and diversification effects van-
ished during the financial crisis, the search for new and potentially uncor-
related asset classes gains importance. As a result, several asset classes
have been analyzed by academics in order to determine their diversification
properties. In this article we take a closer look at water as an asset and its
potential diversification benefits. Water as an alternative asset improves a
traditional stock and bond portfolio. Though the enhancement of a portfo-
lio’s Sharpe ratio due to the inclusion of water as an additional asset is of
economic significance, we do not find evidence of statistical significance.
Key Words: Alternative Assets, Diversification, Water
JEL classification codes: G11, Q25
∗Corresponding author; University of Paderborn, Warburger Str. 100, 33098 Paderborn,
Germany; Email: [email protected]. The authors would like to thank Janis Back, Jessica
Kohler, Mark Schopf, Patrick Stephan and the participants of the 2013 Campus for Finance -
Research Conference in Vallendar (Germany) for valuable comments.
1

1 Introduction
During the financial crisis, potential diversification benefits of different asset classes
ceased to exist as correlations of returns increased (see for example Szado (2009)).
Hence, the search for new and uncorrelated asset classes gains importance. As the
global population is expanding, water supply becomes one of the most important
issues. Facing increasing demand for this scarce resource, the global water business
seems to offer investment opportunities. For example, the World Bank’s portfolio
of sewerage investments increased from US$ 227 million in 2003 to US$ 1.2 billion
by 2009 (World Bank (2010)). This figure is outnumbered by hydropower projects
(from US$ 3.7 billion in 2003 to US$ 8.5 billion in 2009). However, water invest-
ments have not been studied in a portfolio context so far. The question arises
whether investors can benefit from this development by considering water as an
asset. More precisely, we examine whether water provides an attractive risk-return
trade off. Furthermore, we study whether the inclusion of water as an asset in a
traditional portfolio consisting of stocks and bonds provides diversification benefits
and thus leads to more efficient portfolios.
As our analysis shows, water as an asset has a higher expected return than
stocks and bonds. Moreover, the inclusion of water as an additional asset leads to
an improvement of the efficient frontier, a higher Sharpe ratio1 and a lower value at
risk (VaR). Thus, it seems worthwhile for investors to consider the diversification
effects of water in a portfolio context.
The paper is structured as follows: Section 2 provides a review of the literature
on diversification properties of several asset classes. Section 3 describes our data
and methodology while the results are presented in section 4. Section 5 concludes.
1 See Sharpe (1964) and especially Sharpe (1966).
2

2 Literature Review
One of the asset classes that has been considered among academics as an alterna-
tive to traditional assets such as stocks and bonds is real estate. Rubens, Louton &
Yobaccio (1998) find improvements of the Sharpe ratio of portfolios that contain
real estate investments, though not statistically significant. Georgiev, Gupta &
Kunkel (2003) conclude that direct investments in real estate offer diversification
benefits whereas real estate investment trusts (REITs) do not. Using a 4-quadrant
model (public vs. private, equity vs. debt), Hudson-Wilson, Fabozzi & Gordon
(2003) and Hudson-Wilson, Gordon, Fabozzi, Anson & Giliberto (2005) show that
the inclusion of real estate as an asset class is able to enhance the Sharpe ratio of
investment portfolios. Another asset class similar to real estate is farmland as con-
sidered by Painter & Eves (2008). Their analysis reveals beneficial diversification
effects as farmland shows only very low or negative correlations with other asset
classes such as U.S. and global stocks. At the same time, farmland provides at-
tractive returns at reasonable risk. Consequently, Painter & Eves (2008) conclude
that the inclusion of farmland significantly improves portfolio performance.
Taking a look at derivatives as an asset class in a portfolio context, Van Lennep,
Oetomo, Stevenson & De Vries (2004) consider the diversification benefits of
weather derivatives. Their study shows that including weather derivatives in the
construction of portfolios improves the efficient frontier of portfolios consisting
of traditional asset classes. More precisely, Van Lennep, Oetomo, Stevenson &
De Vries (2004) find that the inclusion of weather derivatives significantly im-
proves the Sharpe ratio while at the same time only marginally increasing the
portfolio’s standard deviation.
Daigler & Rossi (2006) consider volatility as an asset class. Using the new
VIX, i.e, the CBOE Volatility Index, they are able to show positive diversification
properties due to the negative correlation between the VIX and the S&P 500.
3

Szado (2009) takes a closer look at VIX futures and options. As volatility has
negative expected excess returns, the focus of the analysis is not the inclusion of
VIX exposure as part of a long-term portfolio diversification strategy but rather
to assess whether VIX exposure possesses beneficial diversification properties in
times of crisis. The study reveals that allocating funds to VIX futures increases
returns while simultaneously reducing standard deviation. For at the money VIX
calls Szado (2009) finds mixed results as they tend to reduce portfolio losses but
have varying effects concerning the standard deviation of returns. The addition
of out of the money VIX calls significantly increases portfolio returns as well as
portfolio volatility.
Beach (2006) investigates emerging market equities and finds beneficial diversi-
fication properties as the inclusion of emerging market equities in an international
portfolio offers higher returns and a higher Sharpe ratio. Chiang, Wisen & Zhou
(2007) analyze emerging market bonds as an asset class and find significant di-
versification benefits and an improvement of the investment opportunity set for
investors.
Pesando (1993) analyzes the market for modern prints and finds that the return
of modern paintings is below the returns of U.S. Treasury Bills whereas the risk
by far exceeds that of Treasury Bills. However, due to the negative correlation be-
tween modern prints and T-Bills, the minimum-variance portfolio is composed of
6% invested in modern paintings. Using the capital asset pricing model (CAPM)2
and the S&P 500 as a proxy for the market portfolio, Pesando (1993) estimates
the β-coefficient of modern paintings to be 0.32. Pesando & Shum (2007) update
the analysis by Pesando (1993) and come to similar conclusions. All in all, the
authors conclude that modern paintings only play a limited role for portfolio di-
versification. The analysis of Campbell (2008) concurs with these findings as the
2 See Sharpe (1964).
4

low correlation of art (i.e., paintings) with other asset classes offers diversification
benefits. However, due to the risk and return associated with investing in art, the
amount allocated to art is relatively small.
Another asset class that has been of interest in academic research are pre-
cious metals. Hillier, Draper & Faff (2006) find low correlations of precious metals
with stock returns and that portfolios that include precious metals show a sig-
nificantly better performance. Ratner & Klein (2008) take a closer look at gold
as an alternative asset class. They find that the long-term return of gold as a
stand-alone investment generates lower returns than a buy-and-hold strategy of
the U.S. stock market. Although the correlation of gold with other asset classes is
statistically low, Ratner & Klein (2008) do only find limited diversification poten-
tial from adding gold to an internationally diversified stock portfolio. Dempster &
Artigas (2010) however find that in addition to low correlations with traditional
asset classes such as U.S. stocks and bonds, gold offers higher risk-adjusted returns
than other precious metals and commodities. They conclude from their analysis
that gold possesses diversification potential. This view is underlined by Conover,
Jensen, Johnson & Mercer (2009) who find that investments in precious metals
improve portfolio performance by increasing returns and reducing the portfolio’s
standard deviation. Furthermore, they find that investment in equities of precious
metals companies yields higher diversification benefits than direct investment in
precious metals as a commodity. In addition to that, precious metals equities have
only a low correlation with the U.S. stock market.
Grelck, Prigge, Tegtmeier & Topalov (2009) consider potential diversification
properties of shipping investments. They find low correlations of shipping indices
to global stocks and bonds. Furthermore, the inclusion of investments in shipping
increases the Sharpe ratio of a traditional portfolio consisting of stocks and bonds.
5

Au
thor
(s)
Ass
etC
lass
Fin
din
gs
Bea
ch(2
006)
Em
ergin
gm
ark
eteq
uit
ies
Div
ersi
fica
tion
pro
per
ties
for
emer
gin
gm
ark
eteq
uit
ies,
hig
her
retu
rns
an
d
Sh
arp
era
tio,
no
sign
ifica
nt
risk
red
uct
ion
Cam
pb
ell
(200
8)A
rt(p
ainti
ngs
)L
imit
edd
iver
sifi
cati
on
pro
per
ties
of
art
(pain
tin
gs)
Ch
ian
get
al.
(200
7)E
mer
gin
gm
ark
etb
on
ds
Div
ersi
fica
tion
pro
per
ties
for
emer
gin
gm
ark
etb
on
ds,
imp
rovem
ent
of
inve
stm
ent
op
port
un
ity
set,
esp
ecia
lly
ben
efici
al
for
port
foli
os
wit
hlo
wva
rian
ce
Con
over
etal
.(2
009)
Pre
ciou
sm
etals
Div
ersi
fica
tion
pro
per
ties
for
equ
itie
sof
pre
ciou
sm
etals
com
pan
ies,
hig
her
retu
rnan
dlo
wer
stan
dard
dev
iati
on
of
retu
rns
Dai
gler
etal
.(2
006)
Vol
atil
ity
Div
ersi
fica
tion
pro
per
ties
for
vola
tili
ty,
risk
red
uct
ion
wit
hout
sub
stanti
al
effec
ton
port
foli
ore
turn
Dem
pst
eret
al.
(201
0)G
old
Div
ersi
fica
tion
pro
per
ties
for
gold
,lo
wco
rrel
ati
on
wit
hoth
erass
etcl
ass
es
Geo
rgie
vet
al.
(200
3)R
eal
esta
teD
iver
sifi
cati
on
pro
per
ties
for
dir
ect
real
esta
tein
vest
men
ts,
no
div
ersi
fica
tion
pro
per
ties
for
incl
usi
on
of
RE
ITs
Gre
clk
etal
.(2
009)
Sh
ipp
ing
Div
ersi
fica
tion
pro
per
ties
for
ship
pin
gin
vest
men
ts,
hig
her
retu
rns
an
d
Sh
arp
era
tio
Hil
lier
etal
.(2
006)
Pre
ciou
sm
etals
Div
ersi
fica
tion
pro
per
ties
of
pre
ciou
sm
etals
inve
stm
ents
,h
igh
erre
turn
sp
er
un
itof
risk
,lo
wco
rrel
ati
on
toU
.S.
stock
s
6

Au
thor
(s)
Ass
etC
lass
Fin
din
gs
Hu
dso
n-W
ilso
net
al.
(200
3)an
dR
eal
esta
teD
iver
sifi
cati
on
pro
per
ties
of
real
esta
tein
vest
men
ts,
hig
her
retu
rns
per
un
it
Hu
dso
nW
ilso
net
al.
(200
5)of
risk
than
stock
san
db
on
ds,
imp
rove
men
tof
Sh
arp
era
tio
Pai
nte
ret
al.
(2008
)F
arm
lan
dD
iver
sifi
cati
on
pro
per
ties
for
farm
lan
d,
hig
her
retu
rns,
low
corr
elati
on
wit
h
oth
erass
etcl
ass
es
Pes
and
o(1
993)
and
Mod
ern
pain
tin
gs
Lim
ited
div
ersi
fica
tion
pro
per
ties
of
mod
ern
pain
tin
gs,
low
erre
turn
sth
an
Pes
and
oet
al.
(200
6)U
.S.
Tre
asu
ryB
ills
bu
tm
uch
hig
her
risk
Rat
ner
etal
.(2
008)
Gol
dN
egati
veco
rrel
ati
on
of
gold
wit
hU
.S.
equ
itie
s,h
owev
er,
no
sign
ifica
nt
div
ersi
fica
tion
ben
efits
Ru
ben
set
al.
(199
8)R
eal
esta
teL
owor
neg
ati
ve
corr
elati
on
of
real
esta
tew
ith
U.S
.eq
uit
ies
an
db
on
ds,
imp
rove
men
tof
Sh
arp
era
tio
Sza
do
(200
9)V
olat
ilit
yD
iver
sifi
cati
on
pro
per
ties
of
VIX
futu
res
an
dop
tion
s,es
pec
iall
yin
tim
esof
cris
is
Van
Len
nep
etal
.(2
004)
Wea
ther
der
ivati
ves
Div
ersi
fica
tion
pro
per
ties
of
wea
ther
der
ivati
ves,
imp
rovem
ent
of
effici
ent
fronti
eran
dS
harp
era
tio
Vel
det
al.
(200
7)S
tam
ps
Low
corr
elati
on
of
stam
ps
toU
.S.
an
dU
Kst
ock
ind
ices
,gen
erati
on
ofα
for
Bri
tish
an
dA
mer
ican
inves
tors
Tab
le1:
Lit
erat
ure
Rev
iew
7

Veld & Veld-Merkoulova (2007) analyze diversification benefits of adding stamps
to a stock portfolio for British and American investors. Using CAPM-regressions,
they find that the addition of stamps offers positive Jensen alpha3 both, for British
and American investors. Table 1 presents a summary of the literature.
3 Data and Methodology
We use total return indices for all asset classes (see Jorion & Goetzmann (1999) and
Dimson, Marsh & Staunton (2002)). Our base portfolio consists of a traditional
stock and bond portfolio where the MSCI World Index represents a global stock
investment and the Barclays Capital Global Aggregate Bond Index is used as a
proxy for global investment-grade bond investments. Considering water as an asset
class, several funds are available such as the SAM Sustainable Water Fund, the
S&P Global Water Index, the NASDAQ OMX Global Water Index, the Pictet
Water Fund, and the Palisades Water Index. Geman & Kanyinda (2007) provide
an overview.
All indices except the Palisades Global Water Index are heavily dominated by
companies located in the United States. The Palisades index is more equally bal-
anced between the three large regions USA (22.95%), euro area countries (28.13%)
and Asia (26.39%). Table 2 shows the weights by region for the indices.
As we do not want our results to be influenced by the dominance of a specific
region in the index, we use the Palisades Global Water Index that is calculated by
Dow Jones Indexes (see Palisades (2011)) to represent water as an investment asset.
The index includes companies active in the global water business. More precisely,
companies active in wastewater treatment, water infrastructure and distribution,
services and technology, water utilities and the provision of tap water are included
3 See Jensen (1968).
8

Region Palisades SAM S&P NASDAQ Pictet
USA 22.95% 41.70% 40.40% 41.63% 43.30%
United Kingdom 5.80% 10.50% 19.50% 13.96% 10.30%
Eurozone Countries 28.13% 18.50% 15.70% 21.54% 6.20%
Switzerland 4.40% 3.80% 11.40% 8.26% 3.60%
Asia 26.39% 9.40% 10.00% 9.51% 5.30%
Brazil 1.97% 2.60% 3.00% 4.26% 10.70%
Others 10.37% 13.50% 0.80% 20.60%
Palisades: Palisades Global Water Index; SAM: SAM Sustainable Water Fund;
S&P: S&P Global Water Index; NASDAQ: NASDAQ OMX Global Water Index;
Pictet: Pictet Water Fund
Table 2: Weights by Region
in the index. In order to ensure exposure to companies active in the water business,
at least 80% of the index consists of companies that earn at least 50% of their
revenues from these activities.
The data spans the period January 1, 2001 - June 30, 2012. We collect daily
prices for the MSCI World and the Barclays Global Aggregate Bond Index from
Thomson Reuters. Daily prices for the Palisades Global Water Index are collected
directly from Palisades. For the calculation of Sharpe ratios, we use U.S. Treasury
Bills as a proxy for the risk-free interest rate. Interest rates on U.S. T-Bills are
provided by the U.S. Department of the Treasury. Figure 1 shows the development
of the three indices (January 1, 2001 = 100).
The global bond index shows a steady increase with only small fluctuations
as one would expect. However, relative to bonds, stocks did not have a superior
development from January 2001 to June 2012 while at the same time showing
larger fluctuations. The Palisades Global Water Index shows a peak in October
2007 and a sharp decline during the financial crisis. Since January 2009, the index
9

0,00
50,00
100,00
150,00
200,00
250,00
300,00
350,00
400,00
450,00
January 1, 2001 January 1, 2003 January 1, 2005 January 1, 2007 January 1, 2009 January 1, 2011
Ind
ex V
alu
e
MSCI World Index Barclays Global Aggregate Bond Index Palisades Global Water Index
Figure 1: Index Values of Asset Classes from January 2001 to June 2012
has recovered.
During the period under consideration, the Palisades Global Water Index
yielded a return of 11.50% p.a., the Barclays Global Aggregate Bond Index a
return of 5.01% while the MSCI World Index returned 2.01% per year. Hence,
from point of view of enhancing portfolio returns, adding water investments to a
traditional stock and bond portfolio seems to be worthwhile. However, the addi-
tional return comes at the cost of additional risk as the standard deviation of the
Palisades Global Water Index is 17.49% p.a. whereas bonds show a standard devi-
ation of only 5.03%. Thus, the return per unit of risk is greatest for the Barclays
Global Aggregate Bond Index and lowest for stocks as stocks show the same risk
as investments in water but yield a much lower return. This is also reflected by the
Sharpe ratios for the three asset classes. From point of view of diversification po-
10

tential, the Palisades Global Water Index shows a slightly negative correlation with
bonds and a positive correlation with the MSCI World Index. Table 3 summarizes
the descriptive statistics and correlations of the asset classes.
Bonds Stocks Water Mean Std. Dev. Return/Risk Sharpe Ratio
Bonds 1.00 5.01% 5.03% 1.00 0.81
Stocks -0.14 1.00 2.01% 17.49% 0.11 0.06
Water -0.05 0.86 1.00 11.50% 17.49% 0.66 0.60
Table 3: Asset Class Correlations and Descriptive Statistics
As the case for including water as an asset is not clear cut, we take a closer look
at portfolios with and without water investments. We use the standard Markowitz
(1952) approach to portfolio construction to generate the efficient frontiers, i.e., we
minimize portfolio variance for different levels of expected portfolio return. Assets
with beneficial diversification properties allow investors to get higher returns for a
given level of risk or to achieve a given rate of return bearing less risk.
4 Results
As the evaluation of the descriptive statistics of the Palisades Global Water Index
shows no clear evidence concerning potential benefits (higher returns that come
along with higher risk, high positive correlation with the MSCI World Index and
slightly negative correlation with bonds), we compare the efficient frontier of the
base case portfolio consisting of stocks and bonds and the efficient frontier achiev-
able when including water as an additional asset. As figure 2 shows, the inclusion
of the Palisades Global Water Index allows investors to realize much higher portfo-
lio returns for a given level of standard deviation. The minimum variance portfolio
for the enhanced portfolio including water (MVe) consists of 85.84% invested in
11

bonds, 7.08% invested in stocks and 7.08% invested in the Palisades Global Water
Index and has a standard deviation of 4.66% and an expected return of 5.25%
whereas for the base case the minimum variance portfolio (MVb) has a standard
deviation of 4.83% and an expected return of 4.78%. In terms of return per unit of
risk, MVe has a value of 1.13 and a Sharpe ratio of 0.92 while MVb yields a return
per unit of risk of 0.99 and a Sharpe ratio of 0.81, respectively. Thus, the inclusion
of water as an asset class offers positive diversification benefits to investors.
0,00%
2,00%
4,00%
6,00%
8,00%
10,00%
12,00%
0,00% 5,00% 10,00% 15,00% 20,00% 25,00%
Ret
urn
Standard Deviation
Stocks + Bonds (with short selling) Stocks + Bonds + Palisades Global Water Index (without short selling)
MVe
MVb
Figure 2: Efficient Frontiers
Figure 3 shows the relative weights of the three assets for given levels of ex-
pected portfolio performance. Portfolios up to an expected return of 4.50% p.a.
consist solely of bonds and stocks. As the Barclays Global Aggregate Bond Index
delivers higher returns at less risk than the MSCI World Index during the obser-
vation period, the proportion of stocks is decreased in favour of larger exposure
12

to bonds. As investors demand portfolio returns greater than 4.50%, some part of
the capital endowment is invested in the Palisades Global Water Index. Portfo-
lios with an expected return of 6.25% and above consist solely of bonds and the
Palisades Global Water Index. As the expected portfolio return increases, so does
the proportion of funds allocated with the water investment.
0%
10%
20%
30%
40%
50%
60%
70%
80%
90%
100%
2,01% 3,00% 4,00% 5,00% 6,00% 7,00% 8,00% 9,00% 10,00% 11,00%
Ass
et W
eigh
t
Expected Portfolio Return
Barclays Global Aggregate Bond Index MSCI World Index Palisades Global Water Index
Figure 3: Asset Weights for Different Portfolio Returns
However, besides showing diversification benefits that are of economic signif-
icance, the question remains whether these diversification gains are of statistical
significance. In order to test the efficiency gains of including water as an asset for
portfolio diversification, we use the methodology developed by Gibbons, Ross &
Shanken (1989):
W =
[√1 + SR2
e√1 + SR2
b
]2
− 1 (1)
13

where SRe denotes the Sharpe ratio of an enhanced portfolio via the inclusion
of additional assets and SRb denotes the Sharpe ratio for the base case portfolio
without the additional asset. Hence, W is based on a comparison of the Sharpe
ratios of the two portfolios: Under the null hypothesis, the Sharpe ratios of the
two portfolios are equal and W = 0. The Wishart distributed test statistic can be
converted into an F distribution with N and T −N − 1 degrees of freedom:[T (T −N − 1)
N(T − 2)
]W ∼ FN,(T−N−1) (2)
where T denotes the number of observations and N denotes the number of assets
added to the portfolio. As the power of the test statistic depends on the relation
between T and N , Gibbons, Ross & Shanken (1989) recommend that N ≤ 1/3T .
Table 4 presents the results for a base line portfolio consisting of 75% invested
in the Barclays Global Bond Index and 25% invested in the MSCI World Index.
The weight attached to bonds is kept fix whereas the weight of stocks is decreased
in favour of the Palisades Global Water Index in steps of 5%. The inclusion
of water as an asset increases the expected return (4.26% for the base case vs.
6.16% for a 20% investment of funds in the Palisades Global Water Index) and the
Sharpe ratio of the portfolio (0.62 vs. 0.95, respectively). Thus, the addition of
the Palisades Water Index leads to a better risk-adjusted return of the portfolio.
However, the W test statistic is not statistically significant.
To shed further light on whether water investments are beneficial or not, we
calculate the value at risk (VaR) (see for example Longerstacy & Spencer (1996)
and Jorion (2001)) for the different portfolios in table 4. We use Monte Carlo
simulation (MC) to arrive at our results and proceed as follows:
1. Generation of independent and identically distributed (i.i.d.) random vari-
ables.
14

Weight Mean Std. Dev. SR W F p VaR
Barclays Global Bond Index 75.00%
MSCI World Index 25.00% 4.26% 5.35% 0.62 na na na 0.67%
Palisades Global Water Index 0.00%
Barclays Global Bond Index 75.00%
MSCI World Index 20.00% 4.73% 5.33% 0.71 0.09 0.27 0.85 0.60%
Palisades Global Water Index 5.00%
Barclays Global Bond Index 75.00%
MSCI World Index 15.00% 5.21% 5.35% 0.80 0.18 0.55 0.66 0.55%
Palisades Global Water Index 10.00%
Barclays Global Bond Index 75.00%
MSCI World Index 10.00% 5.68% 5.40% 0.88 0.28 0.84 0.51 0.50%
Palisades Global Water Index 15.00%
Barclays Global Bond Index 75.00%
MSCI World Index 5.00% 6.16% 5.50% 0.95 0.37 1.13 0.40 0.47%
Palisades Global Water Index 20.00%
Note: We used base portfolios of 50% bonds and 50% stocks, and 25% bonds and 75% stocks to conduct additional
significance tests. The general results are the same: The addition of water as an asset to the base portfolio leads to
higher returns, lower volatility, an improvement of the Sharpe ratio and a lower value at risk. As before, the results
are not statistically significant. The additional tables are available from the authors on request.
Table 4: Statistical Significance of Diversification Properties for a Base Portfolio
Consisting of 75% Bonds and 25% Stocks
2. Usage of Cholesky decomposition in order to preserve the correlation struc-
ture.
3. Simulation of different portfolio values.
4. Calculation of VaR.
Assuming an investment of USD 1,000,000, the one day VaR (95% confidence
15

level) for the base portfolio consisting of 75% invested in the Barclays Global Bond
Index and 25% invested in the MSCI World Index is about USD 6,700, i.e., 0.67%
of the total portfolio value. Adding the Palisades Water Index reduces the value
at risk to 0.47% or USD 4,700.
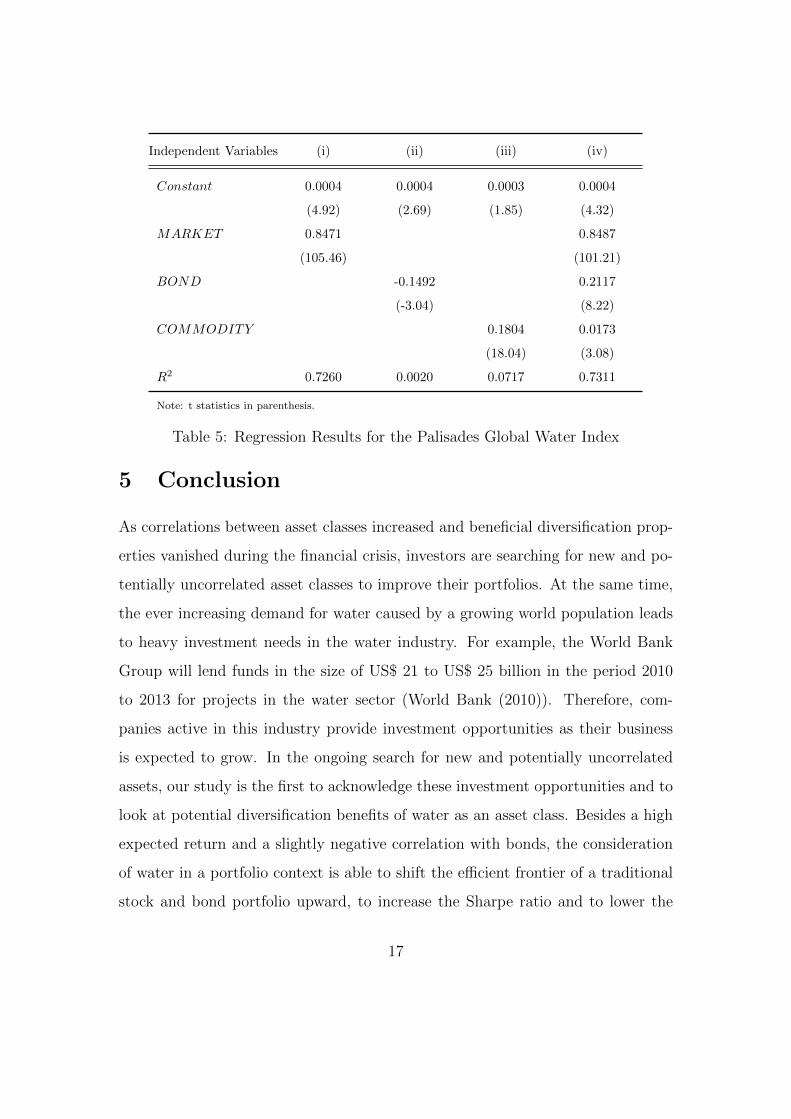
As a last analysis in our attempt to determine the advantages of water as an
asset, we investigate whether the returns of the Palisades Water Index are driven
by the overall market movement or whether the returns of the index are driven
by its ”waterness”. Hence, we regress the returns of the Palisades Water Index on
the returns of the market. As additional factors that might drive the returns of
the water index, we control for movements of bond and commodity returns:
WATER = α + β1MARKET + β2BOND + β3COMMODITY + ε (3)
where WATER is represented by the Palisades Water Index, MARKET is rep-
resented by the MSCI World Index, BOND is represented by Barclays Global
Bond Index and COMMODITY is represented by the S&P GSCI TR Index, ac-
cordingly. If there really is a water factor inherent, we would expect a positive α.
Table 5 shows the results.
The majority of movement of the returns can be explained by movements of the
overall market (slope coefficient: 0.8487). The constant term has a value of 0.0004
and is statistically significant at the 1%-level. Hence, one would expect the returns
of the Palisades Water Index to increase by 0.0004% on a daily basis independent
of movements of the stock, bond and commoditiy markets. Assuming 260 trading
days, this translates into 0.10% on an annual basis. As returns of the water
index are mainly driven by movements of the market as such, the diversification
properties again seem rather limited.
16
Independent Variables (i) (ii) (iii) (iv)
Constant 0.0004 0.0004 0.0003 0.0004
(4.92) (2.69) (1.85) (4.32)
MARKET 0.8471 0.8487
(105.46) (101.21)
BOND -0.1492 0.2117
(-3.04) (8.22)
COMMODITY 0.1804 0.0173
(18.04) (3.08)
R2 0.7260 0.0020 0.0717 0.7311
Note: t statistics in parenthesis.
Table 5: Regression Results for the Palisades Global Water Index
5 Conclusion
As correlations between asset classes increased and beneficial diversification prop-
erties vanished during the financial crisis, investors are searching for new and po-
tentially uncorrelated asset classes to improve their portfolios. At the same time,
the ever increasing demand for water caused by a growing world population leads
to heavy investment needs in the water industry. For example, the World Bank
Group will lend funds in the size of US$ 21 to US$ 25 billion in the period 2010
to 2013 for projects in the water sector (World Bank (2010)). Therefore, com-
panies active in this industry provide investment opportunities as their business
is expected to grow. In the ongoing search for new and potentially uncorrelated
assets, our study is the first to acknowledge these investment opportunities and to
look at potential diversification benefits of water as an asset class. Besides a high
expected return and a slightly negative correlation with bonds, the consideration
of water in a portfolio context is able to shift the efficient frontier of a traditional
stock and bond portfolio upward, to increase the Sharpe ratio and to lower the
17

value at risk (VaR). However, using the efficiency test proposed by Gibbons, Ross
& Shanken (1989), the improvement of the portfolio’s Sharpe ratio is not found to
be statistically significant. In addition, the returns of the water index are largely
determined by the overall market movement rather than the idiosyncratic ”water-
ness”. Hence, we conclude that investors benefit from including water as an asset
in their portfolios. These gains are, however, rather limited. Further research
should carefully monitor the developments in the global water business in order
to seek further investment opportunities that provide diversification benefits and
lead to more efficient portfolios.
18

References
Beach, S. L. (2006), ‘Why emerging market equities belong in a diversified invest-
ment portfolio’, Journal of Investing 15(4), 12–18.
Campbell, R. (2008), ‘Art as a financial investment’, Journal of Alternative In-
vestments 10(4), 64–81.
Chiang, K. C., Wisen, C. H. & Zhou, T. X. (2007), ‘Emerging market bonds as an
asset class: Mean-variance spanning’, Journal of Investing 16(3), 104–110.
Conover, C. M., Jensen, G. R., Johnson, R. R. & Mercer, J. M. (2009), ‘Can
precious metals make your portfolio shine?’, Journal of Investing 18(1), 75–86.
Daigler, R. T. & Rossi, L. (2006), ‘A portfolio of stocks and volatility’, Journal of
Investing 15(2), 99–106.
Dempster, N. & Artigas, J. C. (2010), ‘Gold: Inflation hedge and long-term strate-
gic asset’, Journal of Wealth Management 13(2), 69–75.
Dimson, E., Marsh, P. & Staunton, M. (2002), Triumph of the Optimists. 101
Years of Global Investment Returns, Princeton University Press, Princeton (New
Jersey) and Oxford.
Geman, H. & Kanyinda, A. (2007), ‘Water as the next commodity’, Journal of
Alternative Investments 10(2), 23–30.
Georgiev, G., Gupta, B. & Kunkel, T. (2003), ‘Benefits of real estate investment’,
Journal of Portfolio Management 30(Special Issue), 28–33.
Gibbons, M. R., Ross, S. A. & Shanken, J. (1989), ‘A test of the efficiency of a
given portfolio’, Econometrica 57(5), 1121–1152.
19

Grelck, M. B., Prigge, S., Tegtmeier, L. & Topalov, M. (2009), ‘Diversifica-
tion properties of investments in shipping’, Journal of Alternative Investments
12(1), 55–74.
Hillier, D., Draper, P. & Faff, R. (2006), ‘Do precious metals shine? An investment
perspective’, Financial Analysts Journal 62(2), 98–106.
Hudson-Wilson, S., Fabozzi, F. J. & Gordon, J. N. (2003), ‘Why real estate?’,
Journal of Portfolio Management 30(Special Issue), 12–24.
Hudson-Wilson, S., Gordon, J. N., Fabozzi, F. J., Anson, M. J. & Giliberto,
S. M. (2005), ‘Why real estate?’, Journal of Portfolio Management 32(Special
Issue), 12–22.
Jensen, M. C. (1968), ‘The performance of mutual funds in the period 1945-1964’,
Journal of Finance 23(2), 389–419.
Jorion, P. (2001), Value at Risk: The New Benchmark for Managing Financial
Risk, 2nd edn, McGraw-Hill, New York et al.
Jorion, P. & Goetzmann, W. N. (1999), ‘Global stock markets in the twentieth
century’, Journal of Finance 54(3), 953–980.
Longerstacy, J. & Spencer, M. (1996), ‘Riskmetrics - technical document’.
Markowitz, H. (1952), ‘Portfolio selection’, Journal of Finance 7(1), 77–91.
Painter, M. & Eves, C. (2008), ‘The financial gains from adding farmland to an in-
ternational investment portfolio’, Journal of Real Estate Portfolio Management
14(1), 63–73.
Palisades (2011), ‘Guide to the Palisades Global Water Index’.
20

Pesando, J. E. (1993), ‘Art as an investment: The market for modern prints’,
American Economic Review 83(5), 1075–1089.
Pesando, J. E. & Shum, P. M. (2007), ‘Investing in art: A cautionary tale’, Journal
of Wealth Management 9(4), 80–87.
Ratner, M. & Klein, S. (2008), ‘The portfolio implications of gold investment’,
Journal of Investing 17(1), 77–87.
Rubens, J. H., Louton, D. A. & Yobaccio, E. J. (1998), ‘Measuring the significance
of diversification gains’, Journal of Real Estate Research 16(1), 73–86.
Sharpe, W. F. (1964), ‘Capital asset prices: A theory of market equilibrium under
conditions of risk’, Journal of Finance 19(3), 425–442.
Sharpe, W. F. (1966), ‘Mutual fund performance’, Journal of Business 39(1), 119–
138.
Szado, E. (2009), ‘Vix futures and options: A case study of portfolio diversification
during the 2008 financial crisis’, Journal of Alternative Investments 12(2), 68–
85.
Van Lennep, D., Oetomo, T., Stevenson, M. & De Vries, A. (2004), ‘Weather
derivatives: An attractive additional asset class’, Journal of Alternative Invest-
ments 7(2), 65–74.
Veld, C. & Veld-Merkoulova, Y. V. (2007), ‘Portfolio diversification benefits of
investing in stamps’, Journal of Alternative Investments 10(1), 56–61.
World Bank (2010), ‘Sustaining water for all in a changing climate’, Washington.
21