watching the brain remember - mit opencourseware · three brain scan images of increasing ... –...
TRANSCRIPT

Watching the brain remember
Neuroimaging techniques for studying learning and memory
David A. Ziegler
Wednesday, Sept 12, 2007
Outline
• Imaging brain anatomy – Structural magnetic resonance imaging (MRI)
• Imaging brain function – Positron emission tomography (PET)
– Functional MRI (fMRI)
– Magnetoencephalography (MEG)
– Strengths and limitations of each method
Please interrupt me if you have questions!
1
Image removed due to copyright reasons.Cartoon.
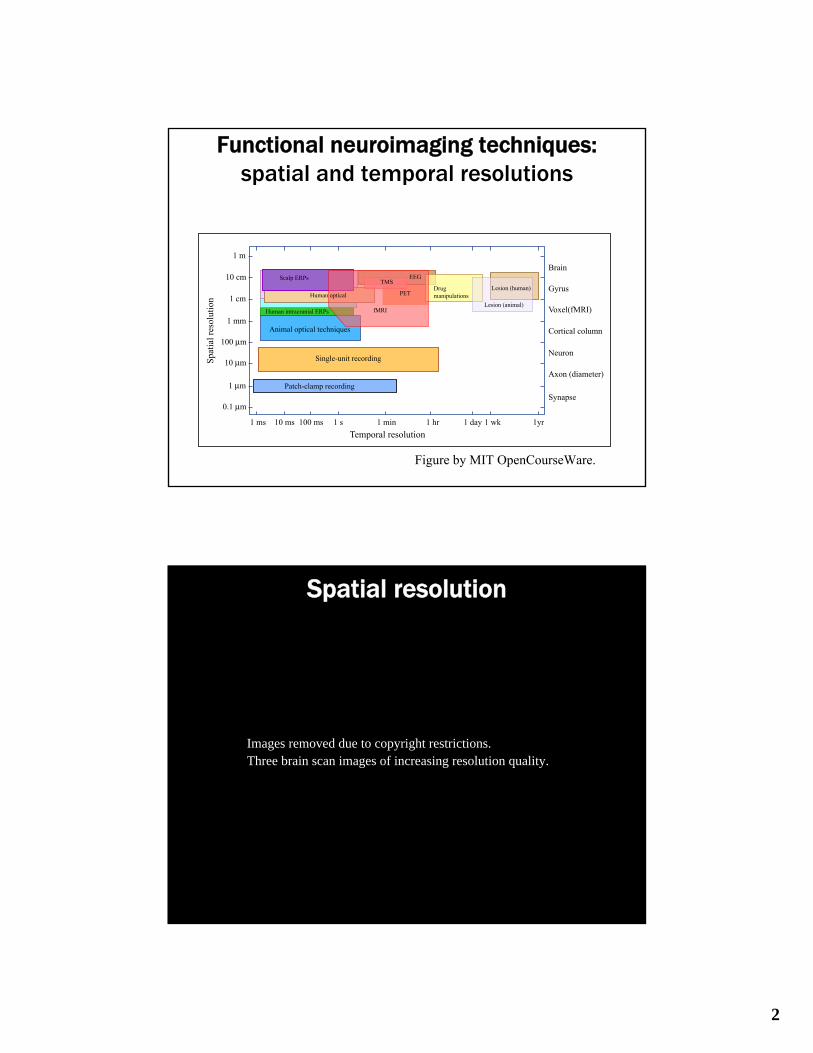
Functional neuroimaging techniques: spatial and temporal resolutions
Spatial resolution
2
Images removed due to copyright restrictions.Three brain scan images of increasing resolution quality.
Patch-clamp recording
Single-unit recording
Animal optical techniques
Human intracranial ERPs
Brain
Gyrus
Voxel(fMRI)
Cortical column
Neuron
Axon (diameter)
Synapse
Temporal resolution
Spat
ial r
esol
utio
n
1yr1 wk1 day1 hr1 min1 s100 ms10 ms1 ms
0.1 µm
1 µm
10 µm
100 µm
1 mm
1 cm
10 cm
1 m
Drugmanipulations
Lesion (human)
Lesion (animal)
Scalp ERPs
Human optical
fMRI
PET
EEGTMS
Figure by MIT OpenCourseWare.
MRI then and now
First MRI of a human chest
3
Images removed due to copyright restrictions.Photographs of original and modern MRI machines.
Images removed due to copyright restrictions.First MRI, of a human chest; photograph of man in first MRI machine;handwritten notes describing these results.
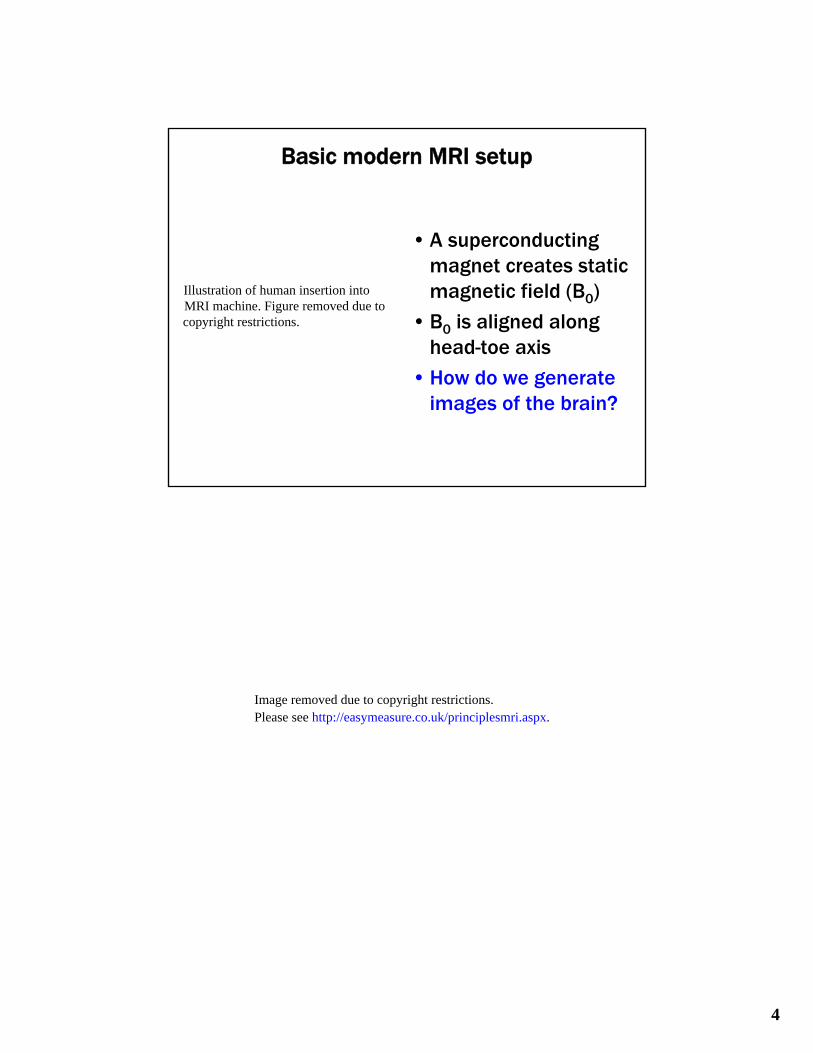
Basic modern MRI setup
• A superconducting magnet creates static magnetic field (B0)
• B0 is aligned along head-toe axis
• How do we generate images of the brain?
4
Illustration of human insertion intoMRI machine. Figure removed due tocopyright restrictions.
Image removed due to copyright restrictions.Please see http://easymeasure.co.uk/principlesmri.aspx.
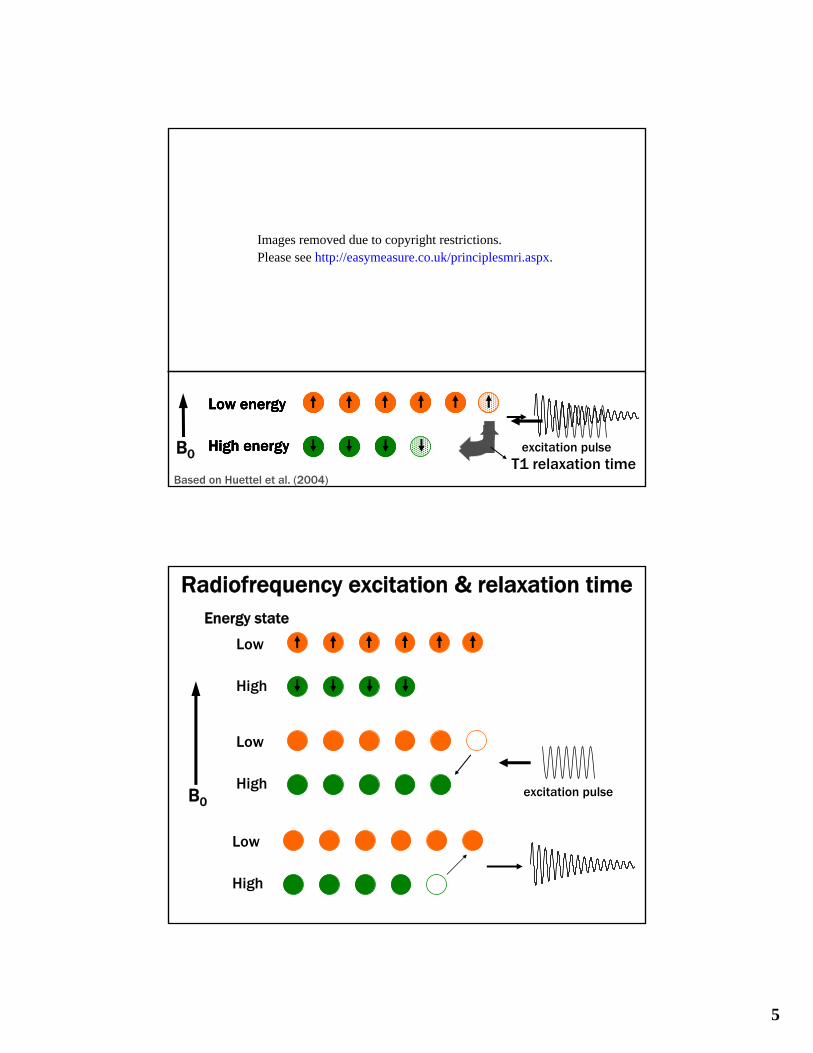
Low energyLow energyLow energyLow energy
B0 High energyHigh energyHigh energyHigh energy excitation pulse T1 relaxation time
Based on Huettel et al. (2004)
Radiofrequency excitation & relaxation time Energy state
Low
High
Low
High excitation pulseB0
Low
High
5
Images removed due to copyright restrictions.Please see http://easymeasure.co.uk/principlesmri.aspx.

Longitudinal T1 relaxation time:
Following excitation, the amount of dephasing differs depending on the tissue type, leading to different T1 relaxation times
Typical T1 relaxation times at 1.5 Tesla:
White matter = 787 ms Gray matter = 921 ms CSF = 2650 ms
Nitz & Reimer (1999)
Anatomical contrast
Huettel et al. (2004)
6
Images removed due to copyright restrictions.MRI image with illustrative diagrams of white matter and CSF moleculardephasing activities. Figure from: Nitz, W.R., and P. Reimer."Contrast Mechanisms in MR Imaging." Eur Radiol 9 (1999): 1032–1046.
Images removed due to copyright restrictions.MRI images of different brain slices, with contrast between the typesof tissues highlighted.

MRI of medial temporal lobe (MTL) structures
de Toledo-Morrell et al (2003)
Augustinack et al (2005)
Structure versus function
fMRI for Dummies
7
Images removed due to copyright restrictions.
Image removed due to copyright restrictions.
Mock MRI image
of Homer Simpson's head,showing a very small brainsurrounded by
empty space inside the skull.
Image removed due to copyrightrestrictions. Cartoon of Homer Simpson'shead, with different "brain regions"outlined and labeled; for example, alarge region is labeled "Sleep."
Coincidence detectors
Positron emission tomography (PET)
Positron imaging invented at MIT/MGH in 1950s
by Gordon Brownell
How PET works • Radioactive tracer coupled to biologically active molecule
e.g., fluorine-18 + glucose (18FDG)
• Tracers accumulate in active cells
• Radioisotopes decay, emitting positrons
8
Images removed due to copyright restrictions.Photographs of people undergoing PET scans.
Images removed due to copyright restrictions.Illustration of radioactive fluorine decay and PET scan setup.

An early PET study of memory encoding• Participants were
scanned while they studied lists of words
Compared oxygen-15 uptake during shallow versus deep encoding
• Deeper encoding led to significantly greater subsequent recognition – Consistent with the “level of processing effect”
(Craik & Lockhart, 1972)
• Deep encoding resulted in increased blood flow to left prefrontal cortex – One of the first studies to show activity of
PFC during memory encoding
– Compare these results to Figure 3.4 in your text (i.e., an fMRI study by Lila Davachi)
Kapur et al (1994)
Strengths and limits of PET
High degree of specificity – Glucose metabolism – Blood flow – Neurotransmitters
Limitations – Radiation exposure is risky
(FDA regulation: only one scan per 6 mo period) – Relatively low spatial (≥ 5mm) & temporal (≥ 5sec)
resolution – Long acquisition times – Costly and inconvenient
9
Images removed due to copyright restrictions. •Rough diagram of areas of activation in thebrain during shallow and deep encoding.
Image removed due to copyright restrictions.PET scans of a brain.

The rise of fMRI Why has fMRI largely replaced PET in cognitive neuroscience? – Cheaper
• No radioactive tracers Æ no need for an on-site cyclotron
– Safer • No need to inject radioactive tracers
• Can be repeated without side-effects
– Better temporal (~2sec) & spatial (2-5 mm) resolution
– Faster acquisitions
– Readily available to researchers
– Simultaneous whole brain coverage • Good for identifying of large-scale, distributed neural networks
So, how do we measure brain activity with MRI?
Sending blood to neurons
Artery Vein
Oxyhemoglobin is diamagnetic Dc = 0 ppm
Deoxyhemoglobin is paramagnetic Dc = 0.08 ppm
Magnetic susceptibility
Spin dephasing & signal loss
Animation courtesy of Ravi S. Menon Robarts Research Institute, University of Western Ontario
10
Courtesy of Ravi S. Menon. Used with permission.

Sending blood to neurons
Artery Vein
The rise of oxygenated blood in veins leads to increased signal on MRI: Blood Oxygenation Level Dependent (BOLD) signal
Animation courtesy of Ravi S. MenonRobarts Research Institute, University of Western Ontario
Recap: what does fMRI really measure? • When neurons in the brain are firing, blood flow to that
area increases (Roy & Sherrington, 1890)
• The increased blood flow brings more oxyhemoglobin to that area
• The inflow of oxyhemoglobin increases more than the increase in oxygen consumption Æ increased ratio of oxy-to-deoxyhemoglobin in veins
• The relative decrease in venous deoxyhemoglobin makes the magnetic field more homogeneous • Because deoxyhemoglobin is paramagnetic and causes
magnetic susceptibility, spin dephasing, & signal loss (T2*)
• When the magnetic field becomes more homogeneous, the MR signal increases in intensity
• This is Blood-Oxygen-Level-Dependent (BOLD) contrast
11
Courtesy of Ravi S. Menon. Used with permission.

First BOLD experiment in humans (at MGH!)
Kwong et al., 1992
OFF OFF ON ON
Experimental designs
Rapid event-related design
Block design
Event-related design
Based on Huettel et al (2004)
12
Courtesy of National Academy of Sciences, U. S. A. Used with permission.Source: Kwong, K. K., et al. "Dynamic Magnetic Resonance Imaging of HumanBrain Activity During Primary Sensory Stimulation." PNAS 89 (1992): 5675-5679.Copyright 1992 National Academy of Sciences, U.S.A.
Images removed due tocopyright restrictions.
Image removed due to copyright restrictions.
Image removed due to copyright restrictions.Please see Fig. 3 in Matthews, P. M. and P. Jezzard. "Functional Magnetic ResonanceImaging." Journal of Neurology Neurosurgery and Psychiatry 75 (2004): 6-12.
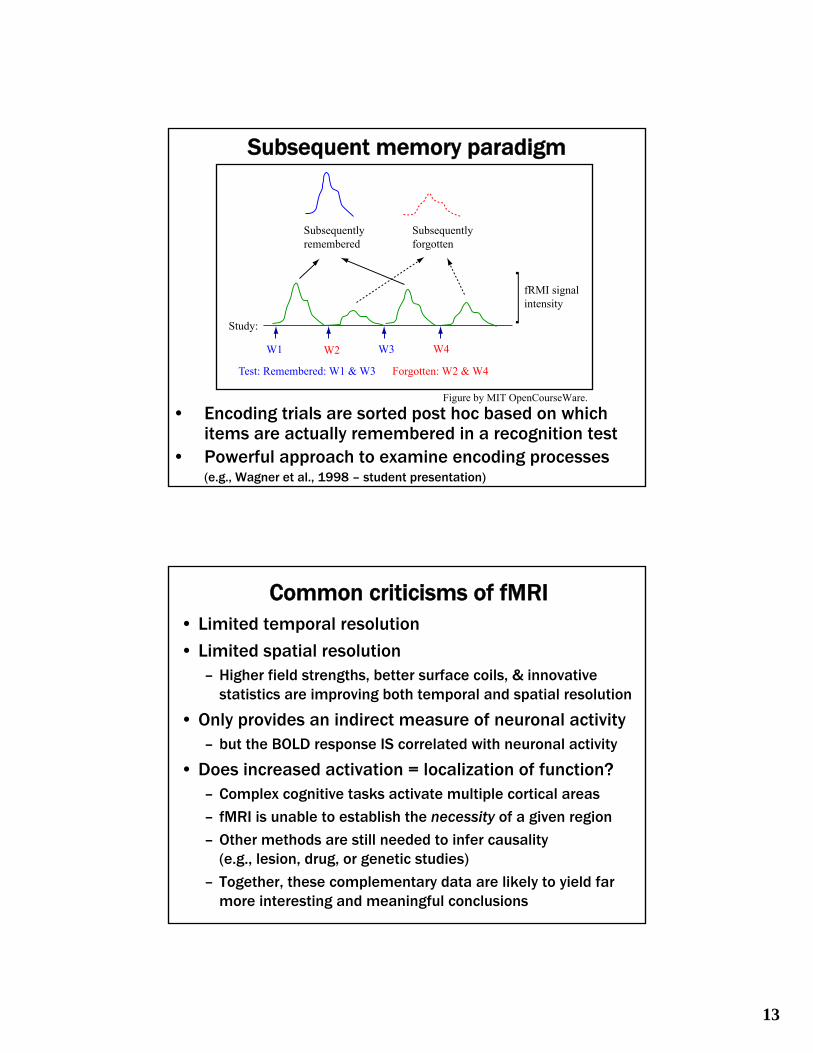
Subsequent memory paradigm
• Encoding trials are sorted post hoc based on which items are actually remembered in a recognition test
• Powerful approach to examine encoding processes (e.g., Wagner et al., 1998 – student presentation)
Common criticisms of fMRI • Limited temporal resolution
• Limited spatial resolution – Higher field strengths, better surface coils, & innovative
statistics are improving both temporal and spatial resolution
• Only provides an indirect measure of neuronal activity – but the BOLD response IS correlated with neuronal activity
• Does increased activation = localization of function? – Complex cognitive tasks activate multiple cortical areas
– fMRI is unable to establish the necessity of a given region
– Other methods are still needed to infer causality (e.g., lesion, drug, or genetic studies)
– Together, these complementary data are likely to yield far more interesting and meaningful conclusions
13
Figure by MIT OpenCourseWare.
Subsequentlyremembered
Subsequentlyforgotten
fRMI signalintensity]
Study:
W1
Test: Remembered: W1 & W3 Forgotten: W2 & W4
W2 W3 W4
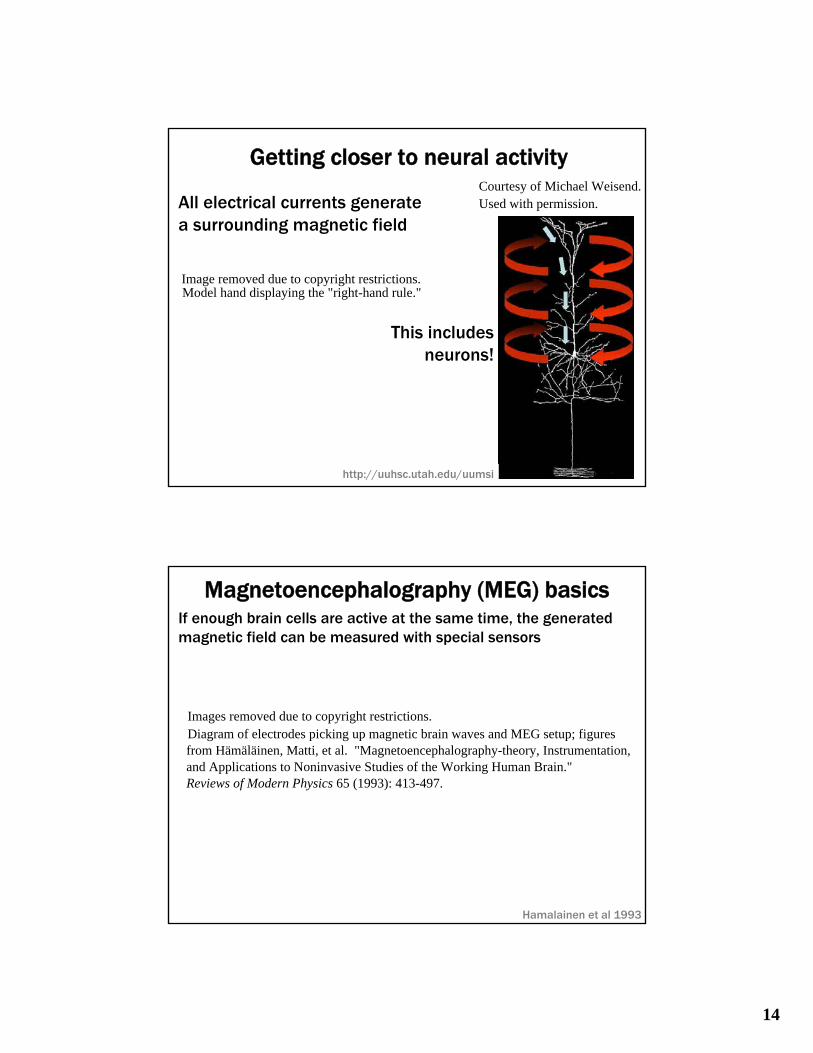
Getting closer to neural activity
All electrical currents generate a surrounding magnetic field
http://uuhsc.utah.edu/uumsi
This includes neurons!
Magnetoencephalography (MEG) basics If enough brain cells are active at the same time, the generated magnetic field can be measured with special sensors
Hamalainen et al 1993
Images removed due to copyright restrictions.Diagram of electrodes picking up magnetic brain waves and MEG setup; figuresfrom Hämäläinen, Matti, et al. "Magnetoencephalography-theory, Instrumentation,and Applications to Noninvasive Studies of the Working Human Brain."Reviews of Modern Physics 65 (1993): 413-497.
14
Image removed due to copyright restrictions.Model hand displaying the "right-hand rule."
Courtesy of Michael Weisend.Used with permission.

Magnetic isofield & timecourse map
MEG study of encoding/retrieval • Encoding: participants studied 240 real-life photographs
– ½ buildings, ½ landscapes
– Instructed to make building/landscape judgment
• Retrieval: 240 original stimuli intermixed with 240 new stimuli – Instructed to make “old”/”new”
judgments
• Brain activity recorded using whole-head MEG
• Looked for differences in oscillatory, or rhythmic, neural activity during encoding (i.e., subsequent memory paradigm) and during retrieval (old/new effect)
• Common neural rhythms: Theta (4-12 Hz), Alpha (5-15 Hz), Beta (20-30 Hz), and Gamma (35+ Hz)
Osipova et al (2006)
15
sc.utah.edu/uumsi
Courtesy of the Society for Neuroscience. Used with permission. Source: Figures 1, 2, & 4from Osipova, Daria, et al. "Theta and Gamma Oscillations Predict Encoding and Retrieval ofDeclarative Memory." The Journal of Neuroscience 26 (2006): 7523-7531.
Courtesy of Michael Weisend. Used with permission. http://uuh
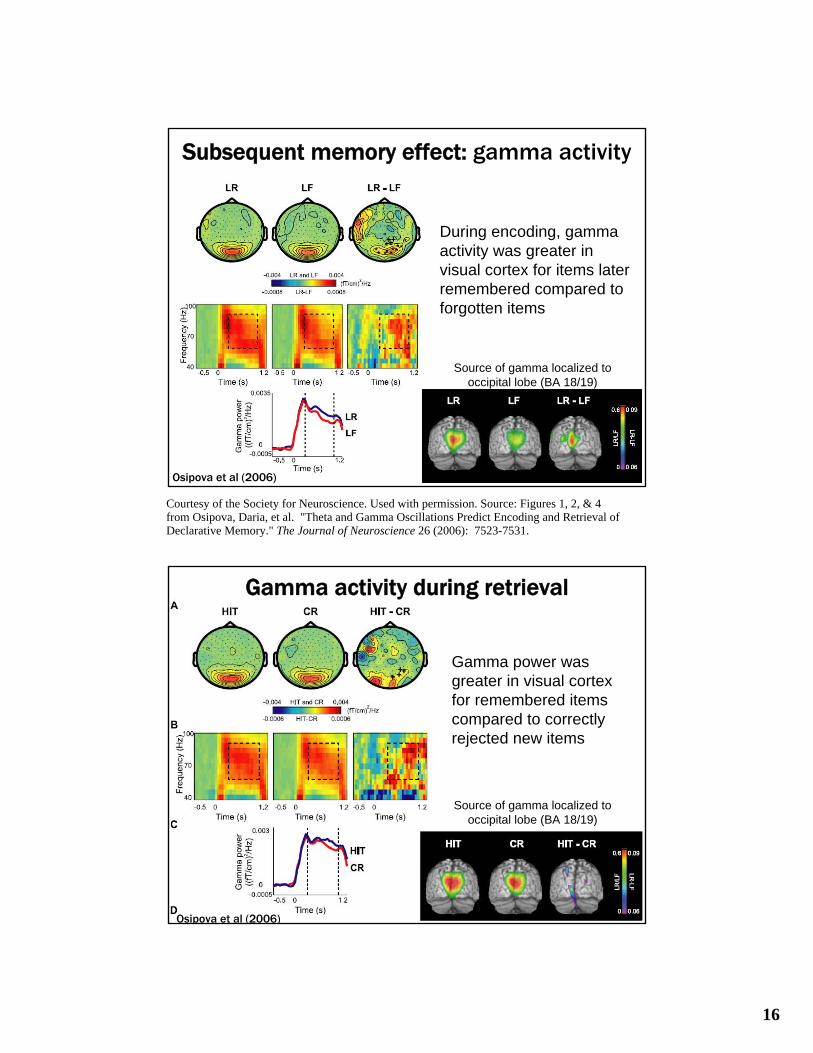
Subsequent memory effect: gamma activity
During encoding, gamma activity was greater in visual cortex for items later remembered compared to forgotten items
Source of gamma localized to occipital lobe (BA 18/19)
Osipova et al (2006)
16
Osipova et al (2006)
Gamma activity during retrieval
Gamma power was greater in visual cortex for remembered items compared to correctly rejected new items
Source of gamma localized to occipital lobe (BA 18/19)
Courtesy of the Society for Neuroscience. Used with permission. Source: Figures 1, 2, & 4from Osipova, Daria, et al. "Theta and Gamma Oscillations Predict Encoding and Retrieval ofDeclarative Memory." The Journal of Neuroscience 26 (2006): 7523-7531.

Putative role of gamma in LTM
• Gamma oscillations in visual areas during encoding may result in increased synaptic drive in downstream association areas – May facilitate plasticity
– In rats, LTP can be induced by phase locking stimulus presentation with hippocampal theta rhythms
• Gamma activity during retrieval may reflect reactivation of visual representations – Likely via top-down, cognitive control
mechanisms
PET
Tradeoffs in functional neuroimaging • High specificity (e.g., glucose, neurotransmitters)
– May be useful for clinical purposes
• Specificity comes at a safety cost (radioactivity)
• Spatial and temporal resolution are relatively poor
fMRI
• Only an indirect measure of neural activity – BOLD contrast is actually caused by an increase in oxyhemoglobin
• Relatively good spatial and temporal resolution
• Allows for simultaneous whole-brain coverage – Well suited for studying networks
• No known health risks (good for longitudinal studies)
MEG
• Very high temporal resolution
• Relatively direct measure of neural activity (magnetic fields)
• Not good for measuring subcortical activity
• Can be difficult to model sources of neural activity – Relies on complex model that may turn out to be incorrect
17