wasting and recycling in the united states 2000 · wasting and recycling in the united states 2000...
TRANSCRIPT

WASTING AND RECYCLING IN THE UNITED STATES 2000
GrassRoots Recycling Network 2000
Prepared by Brenda Platt and Neil Seldman
Institute for Local Self-Reliance
[This Web TEXT VERSION does not contain the graphics or formatting of the printed report.]

About the GrassRoots Recycling Network
The GrassRoots Recycling Network (GRRN) is a North American network of recycling and community-based activists who advocate policies and practices to achieve zero waste, to end corporate welfare for waste, and to create sustainable jobs from discards. GRRN advocates changing outmoded government subsidies and tax policies that promote wasting and inhibit resource conservation, and implementing extended producer responsibility for product and packaging waste. GRRN was founded in 1995 by members of the Sierra Club Solid Waste Committee, the Institute for Local Self-Reliance, and the California Resource Recovery Association.
GrassRoots Recycling Network P.O. Box 49283 Athens, GA 30604-9283 Network Coordinator: Bill Sheehan 706-613-7121 • Fax 706-613-7123 Email: [email protected] • Web site: http://www.grrn.org
About the Institute for Local Self-Reliance
The Institute for Local Self-Reliance (ILSR) is a nonprofit research and educational organization that provides technical assistance and information to city and state governments, citizen organizations, and industry. Since 1974, ILSR has researched the technical feasibility and commercial viability of environmentally sound, state-of-the-art technologies with a view to strengthening local economies. ILSR works to involve citizens, government, and private enterprise in the development of a comprehensive materials policy oriented towards local ownership, efficiency, recycling, and maximum utilization of renewable energy sources.
The Institute for Local Self-Reliance 2425 18th Street, NW Washington, DC 20009 (202) 232-4108 • Fax (202) 332-0463 Email: [email protected] • Web site: http://www.ilsr.org
Copyright 2000 by the GrassRoots Recycling Network.
All rights reserved.
Text printed on 100% postconsumer content, processed chlorine-free stock by EcoPrint. Inks are 100% soy bean based and free of environmentally toxic metals.
GRRN - 2

No part of this document may be reproduced in any form or by any electronic or mechanical means, including information storage and retrieval systems, without written permission from the GrassRoots Recycling Network, Athens, Georgia.
Acknowledgments
This report was made possible by the generous support of the Turner Foundation, The Florence and John Schumann Foundation, Merck Family Fund, Californians Against Waste, and the Alameda County Waste Management Authority and Recycling Board. Brenda Platt and Neil Seldman, Ph.D., of the Institute for Local Self-Reliance (ILSR) researched and authored the report. ILSR research associate Kelly Lease and intern Annemie Berding contributed to the research. Mary Lou Van Deventer and Dan Knapp (Urban Ore, Berkeley, California) deserve special recognition for their thorough edits of part of this document. Special thanks to the following individuals for reviewing and improving this document:
Susan Alexander, Public Media Center, San Francisco, CA
Rick Anthony, Richard Anthony Associates, San Diego, CA
Rick Best, Policy Director, Californians Against Waste, Sacramento, CA
Ed Boisson, Principal, Boisson & Associates, Brattleboro, VT
Resa Dimino, Sustainable Enterprise, City Island, NY
Kathy Evans, Canyon, CA
Pat Franklin, Executive Director, Container Recycling Institute, Arlington, VA
Lance King, Livewell Environmental Designs & Resources, Arlington, VA
David Kirkpatrick, Managing Director, Sustainable Jobs Fund, Durham, NC
Dan Knapp, Ph.D., and Mary Lou Van Deventer, Urban Ore, Inc., Berkeley, CA
Eric Lombardi, Executive Director, Eco-Cycle, Boulder, CO
David Morris, Institute for Local Self-Reliance, Minneapolis, MN
John Reindl, Recycling Manager, Dane County Department of Public Works, Madison, WI
Bill Sheehan, Ph.D., Network Coordinator, GrassRoots Recycling Network, Athens, GA
Helen Spiegelman, Society Promoting Environmental Conservation, Vancouver, BC, Canada
David Wood, Senior Associate, Center on Wisconsin Strategy, Madison, WI
All responsibility for the views expressed in this report or for any errors in it rests with the authoring organizations.
GRRN - 3

executive summary In the last decade and a half, waste prevention, reuse and recycling have made tremendous
gains. The national municipal recycling rate has reached 28%, while many communities are surpassing 50% diversion from landfills and incinerators, and doing so cost-effectively. More than 9,300 communities had curbside recycling programs in 1998, up from 2,700 at the beginning of the decade. Reduction of private sector and industrial process wastes has similarly increased, with some businesses approaching 90% and higher waste reduction levels.
The benefits of waste reduction are more far reaching than previously thought. Recycling reduces costs, creates jobs and businesses, and improves the environment and public health in myriad ways. When a pound of municipal material is recycled, industry avoids wasting many more pounds of mining and manufacturing wastes caused by extracting and processing virgin materials into finished goods. Using recycled materials to make new products saves energy and other resources, reduces greenhouse gases and industrial pollution, and stems deforestation and damage to fragile ecosystems.
Waste reduction also reduces the negative effects of landfilling and burning materials. For landfills, these effects include groundwater pollution, release of global warming gases, and monitoring and remediation costs that will likely span centuries. Incinerators may even be worse, as pollution is borne directly to the air as well as to the land as ash; and energy wasted by not recycling is greater than the amount of energy produced via burning.
Despite these benefits, unsustainable patterns of wasting and consumption hinder further progress in recycling. Recent trends indicate wasting is on the rise and is outpacing the rise in recycling:
• After several years of leveling off and then dropping, municipal wasting increased again in 1997, both in absolute tons and on a per capita basis. Materials landfilled and incinerated rose 4.4 million tons in 1997 (the latest year for which data are available) as compared to 1996.
• Municipal recycling rates since 1994 have increased only slightly, after rapidly increasing in the late 1980s and early 1990s.
• The portion of plastic, aluminum, and glass containers landfilled and burned is rising. In 1998, 75% of plastic PET (no. 1) containers were wasted, up from 60% in 1995. The wasting rate for aluminum cans has climbed from a low of 36% in 1992 to 44% in 1998.
• Manufacturers are producing more products and packaging that are hard to recycle or lack recycled-content. From 1990 to 1997, plastic packaging grew five times faster by weight than plastic recovered for recycling.
• The waste hauling industry continues to consolidate, leading to less recycling. Big hauling companies that are vertically integrated with wasting facilities make more money by landfilling than recycling.
• Some states are considering rescinding recycling goals and policies. A few cities have opted to cut back their recycling budgets. Some industries — particularly the plastic
GRRN - 4

industry — have not followed through on commitments to utilize more recycled material.
Several factors contribute to the increase in wasting. For one, manufacturers and sellers of products and packaging usually have no responsibility for handling materials once discarded. Secondly, recycling competes with raw materials processing and wasting industries on an uneven economic playing field:
• Prices of virgin materials and products (which compete with recovered materials) exclude billions of dollars in taxpayer subsidies, and the true costs that resource extraction and manufacturing impose on the environment and public health.
• Prices for waste disposal (which competes with reuse and recycling for the supply of discarded materials) do not reflect the cost of perpetual landfill maintenance, among other externalities.
• The economic development benefits of recycling are often overlooked (recycling creates at least ten times more jobs than landfills).
The Introduction to this report describes the need for a new paradigm for managing resources sustainably. Zero waste is a design principle for a society that makes products with a minimum investment of natural resources and energy, and in which the end-of-life options for those products are limited to reuse, recycle, repair, and compost. Zero waste implies that the goal of public policy should be to eliminate waste rather than manage it in waste facilities.
Fortunately, technological developments, citizen activism, and public policies in the last 15 years have laid the groundwork for a zero waste and sustainable future. Container deposit laws, curbside collection, recycling requirements, landfill disposal bans, and creative funding mechanisms have increased the supply of recyclable materials. States with minimum recycled-content legislation, buy-recycled programs, and creative funding mechanisms have also begun to spur demand for discarded materials and link recycling with local economic development. Much more remains to be done to reduce waste and increase reuse and recycling.
Two major sections of this report describe the state of wasting and recycling, respectively, in the United States. These sections point to the need to reinvigorate citizen activism and maintain and expand public policies to eliminate waste and conserve resources. To this end, the report concludes with an Agenda for Action that proposes an interconnected, four-part government strategy for moving toward zero waste:
• level the economic playing field so resource conservation businesses can out-compete wasting industries;
• make manufacturers and brand owners share responsibility for their product and packaging waste;
• develop holistic resource management systems, linking zero waste planning to building sustainable communities; and
• build the reuse and recycling infrastructure.
This report is not intended as an exhaustive study on the subject of wasting and recycling. Rather, it aims to refocus attention on critical issues, highlight their interconnectedness, and shed light on the need for a zero waste economy.
GRRN - 5

introduction Our Profligate Consumption Fouls the Nest
The United States consumes a disproportionate share of the world’s resources and contributes a similarly lopsided portion of the world’s pollution. We, for example, use one-third of the earth’s timber and paper and generate almost one-quarter of its carbon dioxide emissions, but represent only 5% of the global population.1 The average American in his or her lifetime accounts for the use of some 540 tons of construction materials, 18 tons of paper, 23 tons of wood, 16 tons of metal, and 32 tons of organic chemicals, and throws away 56 tons of household materials.2 One recent study measuring the burden humanity places on the natural environment determined that a person in the United States exerts almost three times as much pressure on the natural environment as the global average.3
Describing resource use in per capita terms is helpful to describe intensity of resource use, but it has one disadvantage: it tends to make us think primarily of personal and household consumption patterns. Actually as a nation, we use and waste most of our resources in commercial and industrial settings.
Why do we consume so much? In part, because consumption and wasting are cheap and easy and subsidized, and because many products are designed to be thrown away. But this profligate resource consumption and materials production by our “throw-away” society comes with a steep price tag, contributing directly to air and water pollution, toxic waste, global warming, deforestation, loss of biological diversity, contaminated land, and damaged ecosystems.
The adverse environmental effects of waste disposal facilities such as landfills and incinerators are known. However, the initial extraction and processing of raw materials — via mines, smelters, petroleum refineries, chemical plants, logging operations, and pulp mills —
GRRN - 6This report summarizes the state of “wasting” in the United States and the relationship of municipal wasting to industrial wasting, extraction of virgin resources, and environmental and public health impacts. It also contrasts the liabilities of current wasting technologies — primarily landfilling and incineration — with the economic development and environmental benefits of waste prevention, reuse, and recycling.
This report focuses largely on the municipal discard stream and its link to upstream wasting and other problems; it does not address wasted materials from agriculture, sewage treatment, and other sectors. Further study is warranted to more fully explore the impact on resources, wasting, and the environment of these sectors, especially the industrial sector for which data are scant.
In the past decade, we have made tremendous progress in recycling, but this progress has been tempered by recent backsliding in corporate and public sector recycling commitments as well as by the fact that the rise in wasting is outpacing the rise in recycling. This report aims to provide recycling professionals, policy-makers, and other planners with the information they need to support expanded resource conservation and recycling activities and policies and to build a new paradigm based on eliminating waste rather than managing waste. The report concludes with An Agenda for Action, which suggests actions government, industry, and citizens can take to implement the vision of zero waste.

cause even greater environmental damage. Consider, for instance, that just four “primary production” industries — paper, plastics, chemicals, and metals — account for 71% of the toxic emissions from all manufacturing in the United States.4 In addition to pollution, extracting raw materials — particularly mining and logging — increases soil erosion, damages fisheries, destroys wildlife habitat, and causes deforestation.
Wasting Destroys Materials, Forcing Us to Extract New Ones Wasting in landfills and incinerators is closely linked to resource extraction. Wasting
destroys any residual value in used products and packaging. This in turn causes more virgin resources to be mined, extracted, and processed to replace them.
Our present pattern of using resources is not sustainable. The extent of the damage is evident in the global balance sheet. While economic assessments show a doubling of global wealth between 1970 and 1995, a report from the World Wildlife Fund estimates that in the same period, the Earth has lost one-third of its “natural capital,” as measured by the health of its forest, freshwater, and marine ecosystems.5
The amount of municipal discards wasted — used products and packaging from households, businesses, and institutions that end up in landfills and incinerators — can be likened to the canary in the mine shaft, serving as an early warning indicator of the fouling of our environment. Every ton of municipal discards represents many more tons of wasted materials, pollution, and environmental degradation from mining and manufacturing. Wasting municipal discards is a symptom of a much larger problem — our over-consumption and inefficient use of resources and materials.
Wasting Grows in the Absence of Adequate Cost Accounting, Manufacturer Responsibility, and Public Sector Policies
The public has been lulled into accepting myths about recycling and resource conservation. We have been told that recycling has “solved” the solid waste crisis of the 1980s, that state-of-the-art landfills are safe, that trash collection and disposal is a taxpayer responsibility, that recycling and wasting (via landfilling and incineration) are complementary strategies for managing municipal discards, that the marketplace works best in solving our solid waste woes and no public sector intervention is needed, and that wasting is inevitable. Reality, however, paints a different picture.
Myth: Recycling has solved the solid waste crisis of the 1980s.
Reality: Wasting is increasing again, and recycling gains are slowing. Many private and public sector recycling efforts have recently waned or been abandoned.
˛ After a period of increasing recycling rates and decreasing wasting rates in the early and mid 1990s, wasting is now increasing again and recycling gains have slowed. The nation’s recycling level seems to have stagnated at 28% in 1997, not much greater than the 27% level reported the previous year.6 And, for the first time since 1993, the tonnage landfilled and
GRRN - 7
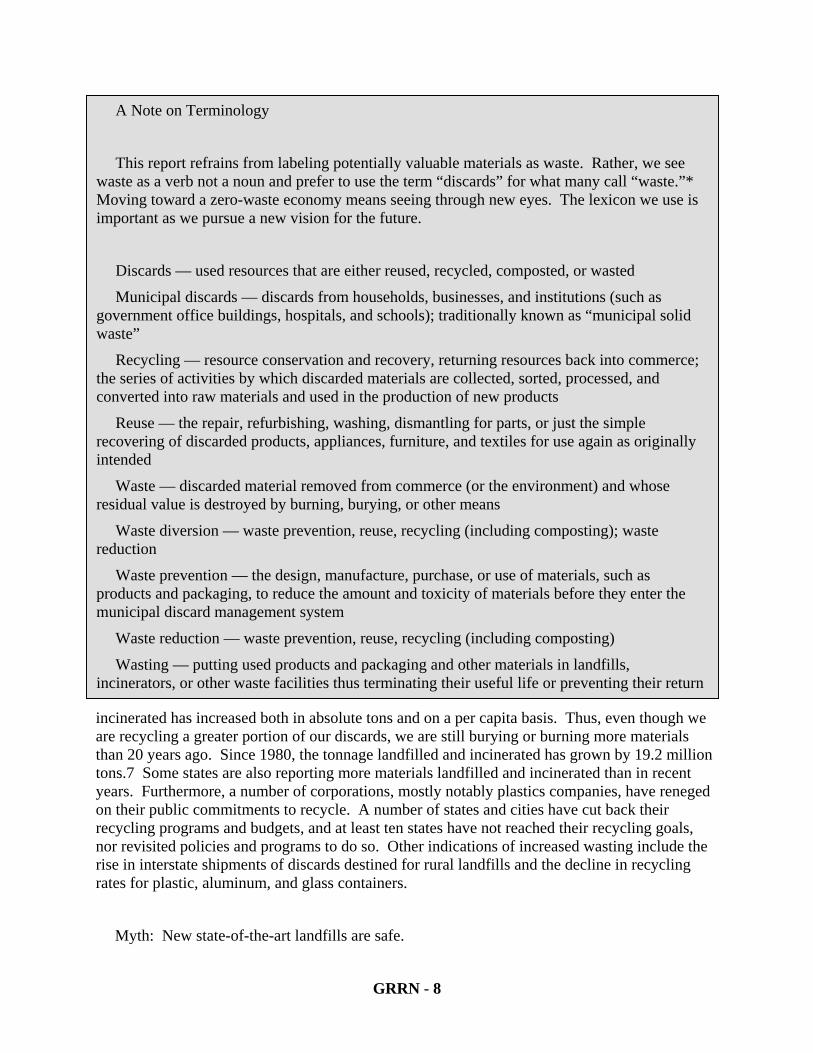
A Note on Terminology
This report refrains from labeling potentially valuable materials as waste. Rather, we see waste as a verb not a noun and prefer to use the term “discards” for what many call “waste.”* Moving toward a zero-waste economy means seeing through new eyes. The lexicon we use is important as we pursue a new vision for the future.
Discards — used resources that are either reused, recycled, composted, or wasted
Municipal discards — discards from households, businesses, and institutions (such as government office buildings, hospitals, and schools); traditionally known as “municipal solid waste”
Recycling — resource conservation and recovery, returning resources back into commerce; the series of activities by which discarded materials are collected, sorted, processed, and converted into raw materials and used in the production of new products
Reuse — the repair, refurbishing, washing, dismantling for parts, or just the simple recovering of discarded products, appliances, furniture, and textiles for use again as originally intended
Waste — discarded material removed from commerce (or the environment) and whose residual value is destroyed by burning, burying, or other means
Waste diversion — waste prevention, reuse, recycling (including composting); waste reduction
Waste prevention — the design, manufacture, purchase, or use of materials, such as products and packaging, to reduce the amount and toxicity of materials before they enter the municipal discard management system
Waste reduction — waste prevention, reuse, recycling (including composting)
Wasting — putting used products and packaging and other materials in landfills, incinerators, or other waste facilities thus terminating their useful life or preventing their return
incinerated has increased both in absolute tons and on a per capita basis. Thus, even though we are recycling a greater portion of our discards, we are still burying or burning more materials than 20 years ago. Since 1980, the tonnage landfilled and incinerated has grown by 19.2 million tons.7 Some states are also reporting more materials landfilled and incinerated than in recent years. Furthermore, a number of corporations, mostly notably plastics companies, have reneged on their public commitments to recycle. A number of states and cities have cut back their recycling programs and budgets, and at least ten states have not reached their recycling goals, nor revisited policies and programs to do so. Other indications of increased wasting include the rise in interstate shipments of discards destined for rural landfills and the decline in recycling rates for plastic, aluminum, and glass containers.
Myth: New state-of-the-art landfills are safe.
GRRN - 8

Reality: New “state-of-the-art” landfills are NOT safe and the current price of using them does not reflect their true costs.
˛ Landfills delay groundwater contamination but cannot prevent it, because the liners will leak. Furthermore, despite capture and use of the methane gas from landfills, enough methane escapes to the atmosphere to be a significant contributor to the global greenhouse effect. And now, recent studies have linked landfill air emissions with cancer, which takes time to develop. But even though the future costs in air and water pollution and in public health are significant, they are not incorporated into the price of using landfills today. In addition, current regulations do not require care and funding for landfill maintenance and monitoring 30 years after closure (providing groundwater contamination has not yet been detected), even though the waste is chemically and biologically active for longer.
Myth: Taxpayers and local government are best equipped to take responsibility for trash.
Reality: Wasting is an unfunded mandate on local government.
˛ Neither municipalities nor the general public have much ability to control the design of products and packaging to enhance their reusability and recyclability. For the most part, manufacturers and retailers in the United States are neither accountable nor responsible for the products and packaging they produce and sell. This is remarkable given that manufactured goods constitute 76% of the materials we discard.8 In essence, disposal of municipal discards is an unfunded mandate. It’s one of the largest line items in cities’ budgets. Local governments and taxpayers get stuck with a $43.5 billion annual bill for collecting and disposing municipal discards.9 Making manufacturers responsible for the entire lifecycle of their products and packaging from cradle to grave (or better yet, cradle to cradle) is essential to lessening the burden of municipal discards on local government and taxpayers.
Myth: Recycling and wasting are complementary strategies for managing municipal discards.
Reality: Wasting competes with recycling for the supply of discarded materials.
˛ However large the supply of discards, it is finite, and different handling systems compete for market share. Wasting takes discards and crushes, blends, and compresses them, after which they are burned or buried. In contrast, recycling takes discards and spreads them out, classifies, sorts, and cleans them, and returns them to commerce as refined resources. As recycling has gained, wasting has lost market share. Waste companies and some local governments have gone to court and to legislatures to limit competition from recyclers. They have attempted to block recyclers from access to the supply with restrictions that direct discards to particular facilities or companies. Such restrictions — referred to as flow control — would protect wasting facilities built with public and private money. Furthermore, national trash hauling firms have a vested interest in disposing materials in their landfills over recycling these resources (for instance, according to one financial analyst, WMX’s profit margin is ten times higher for landfill disposal than for recycling10).
Myth: Recycling industries compete on a level playing field with virgin materials industries.
GRRN - 9
Reality: Taxpayers subsidize virgin materials extraction and processing far more.
˛ Taxpayers subsidize virgin resource extraction and processing — over $2.6 billion per year in federal subsidies alone. Recycling, however, is viewed as a charity case for receiving service fees or taking subsidies from government similar to those enjoyed by mining and extraction companies. The imbalance undermines recycling’s ability to compete and makes an accurate economic evaluation of recycling difficult.
Myth: Wasting is cheaper than recycling.
Reality: Recycling is cheaper than wasting.
˛ Recycling is fundamentally cheaper than wasting when economic analyses account for four key elements: (1) upstream subsidies for virgin resource extractive industries, (2) downstream subsidies for landfills and incinerators, (3) the true long-term societal and environmental costs of resource extractive and wasting facilities, and (4) the local economic benefits of reuse and recycling. Wasting is nearly always underpriced if its long-term environmental and public-health costs are considered, and even its artificially low prices may be hidden in annual tax bills. One European study, for instance, estimated the external environmental costs of landfilling paper at approximately $300 per ton.11 On the flip side, recycling’s added value should not be overlooked. Just sorting recyclables sustains ten times more jobs on a per-ton basis than landfilling. Recycling jobs and businesses have become major economic drivers in many states. But even with an unlevel playing field, recycling can out-compete wasting in today’s marketplace. A new U.S. Environmental Protection study, for example, indicates that communities with record-setting recycling levels have cost-effective recycling programs.12
Myth: The marketplace works best in solving “solid waste management” problems; no public-sector intervention is needed.
Reality: The discard management system has always operated under public sector rules and always will. Currently these rules encourage unchecked product consumption and disposal. Public-sector intervention is needed to shape a system in which resources are conserved and materials are produced, used, discarded, and recovered efficiently.
˛ Our discard management systems do not flow naturally from a preordained plan or even from the so-called free market. They are governed by a complex set of rules and regulations, from local ordinances to international agreements. These rules take many forms — tax laws, virgin materials subsidies, business regulations, environmental laws, land use requirements, the Commerce Clause of the U.S. Constitution, flow control, the Public Utilities and Regulatory Policy Act — but together they shape what sort of discard management infrastructure thrives. Right now, these rules generally favor a one-way flow of materials from extraction to landfills or incinerators. It is a system in which trash collection and disposal are falsely viewed as cost-effective while more efficient materials use through waste prevention, reuse, and recycling is falsely viewed as having to pay for itself. In the absence of full and accurate environmental and social costing, public-sector intervention is needed to fashion a system in which resources are conserved and materials are produced and utilized efficiently with minimal environmental and public health impacts and maximum sustainable development benefits. Indeed, many public
GRRN - 10

policy initiatives in the last decade have played a key role in the nation reaching a 28% municipal recycling level.
Myth: Wasting is inevitable.
Reality: Wasting is not inevitable.
˛ More than a hundred U.S. communities report waste reduction levels of 50% or higher. Several hundred businesses and institutions have waste reduction levels approaching and even surpassing 90% and many have adopted zero-waste goals. We largely have the technical and institutional tools to move closer to a zero-waste economy. We need only to muster the political will.
Zero Waste: A New Paradigm for the Future A decade ago, the focus on recycling was to save landfill space and avoid incineration. This
is only a small part of the picture. Today we need a paradigm shift in how we approach waste. Instead of managing waste, we need to manage resources and eliminate waste. We need to redesign products and packaging to minimize and more efficiently utilize materials. We need the least packaging and material to deliver the product or service. We need to aim for a zero-waste economy.
Now is the time to avoid a narrow focus on "waste management" and on achieving a certain recycling level. Our goal cannot simply be to achieve 25% or 50% recycling, but rather to reduce pollution and build sustainable communities. Resource conservation, materials efficiency, waste prevention, reuse, and recycling are all integral components of a sustainable economy. We need to make compelling arguments and adopt effective policies for reducing consumption, increasing materials efficiency, and substituting renewable for non-renewable resources.
Now is the time for recycling advocates and professionals to foster strategic alliances with organizations pursuing the larger goals of resource conservation and sustainable development. Now is the time to spread the message that waste prevention, reuse, and recycling are among the most important activities we can undertake to reduce pollution and environmental degradation. Resource conservation and efficiency are our upstream path to meeting our sustainability goals. Aiming for zero waste is our downstream path.
Fortunately, waste reduction efforts and sound public policy in the last decade have laid the groundwork for a zero waste and sustainable future. Municipal recycling rates have tripled since 1980, recycling jobs and businesses have sprouted around the country becoming major sectors in some states, and pollution has been cut.
Recycling’s success is owed in no small measure to myriad state and local government policies. These policies, ranging from buy-recycled programs and minimum recycled-content product laws to recycling goals and mandatory recycling ordinances, have made a tremendous difference. Local governments and the public have embraced recycling. Indeed, more people may recycle than vote in this country.13 The public and local and state governments deserve credit for much of the progress in the fight against waste and wasting.
GRRN - 11

Recycling has made gains despite an unlevel playing field and despite persistent attacks. Still, recycling is not yet the cornerstone of a sustainable materials economy. Now is the time to integrate the best features of the best programs, technologies, policies, and other practices in place around the country (and even the globe). It is time to remove antiquated and unneeded incentives for wasting (such as subsidies, untaxed pollution, and the system where producers lack cradle-to-grave responsibility for their products and packages). We need fundamental economic reforms that make products’ prices reflect their true long-term costs of production so that waste prevention, reuse, and recycling can out-compete wasting every time.
There are numerous strategies for bringing a zero-waste economy a little closer, such as shifting back to refillable containers or engineering plastics from crops and plants, which are completely biodegradable and compostable. The guiding principles are conserving resources, reducing consumption, minimizing pollution, transforming the byproducts of one process into the feedstocks for another, maximizing employment opportunities, and providing the greatest degree of local economic self-reliance.
A zero waste society is not merely an option. It is a necessity if we hope to develop healthy communities within a healthy environment.
GRRN - 12

GRRN - 13
Moving Toward A Zero Waste Economy
Zero Waste is a policy, a path, a target. It is a process, a way of thinking. Most of all, it is a vision. Zero Waste represents a new planning approach for the 21st Century to encompass the principles of conserving resources, minimizing pollution, maximizing employment opportunities, and providing the greatest degree of economic self-reliance. Zero Waste is the next logical step beyond the short-term goals established for recycling. If we embrace Zero Waste, we do not stop at 35% or 50% recycling and then build landfills and incinerators to waste the rest of our discards. Rather, we continue to build on waste prevention, reuse, and recycling success stories, while tackling the more fundamental aspects of wasting and working to eliminate waste at the source.
Striving for Zero Waste means:
˛ Recognizing that pollution, energy consumption, and destruction of natural habitats starts with virgin resource extraction and processing.
˛ Moving up responsibility for the waste stream from consumers to advertisers, manufacturers, and product designers, to the "front end" of the system in order to redesign products to reduce material consumption and facilitate reuse, recycling, and recovery.
˛ Minimizing mining and extraction from third-world nations and closing more of our wilderness to this use.
˛ Eliminating subsidies for harvesting and extracting virgin materials, and eliminating mining byproducts’ exemptions from hazardous waste rules.
˛ Paying up-front the full costs of environmental degradation and public health impacts by including those costs in the price of products and services.
˛ Eliminating the gap between the average price of landfilling and the real cost of landfilling.
˛ Harnessing the forces of the marketplace through variable rate pricing for residential trash collection systems, paying haulers to recycle, and other mechanisms.
˛ Pursuing waste prevention, reuse, repair, recycling and composting, and banning materials and products that do not allow for those activities.
˛ Repairing, reselling, and reusing durable products that are made of fewer material types and are designed for recyclability when they outlive their usefulness.
˛ Developing information about resources and materials used and wasted, so the public can make good choices based on hard facts.
˛ Defining economic success as delivering more services with less energy and fewer material resources.
˛ Focusing on renewable resources and doing more with less.
˛ Moving from a linear consumption-driven economy to a cyclical service-oriented economy.
˛ Developing a sustainable system that everyone can replicate.
Source: Adapted from Gary Liss, What Is Zero Waste?, Gary Liss & Associates (a consultant and member of the GrassRoots Recycling Network Loomis California) personal

the state of wasting Introduction
Household trash disposal has traditionally been a community responsibility. Since World War II, communities have primarily employed two waste disposal methods: incineration and landfilling. In the 1950s incineration was prevalent in urban centers, but eventually air pollution problems encouraged landfilling. America’s abundant land and relatively dispersed population made landfilling attractive. Landfills required no preparation, nothing more than an unimproved piece of earth and a heavy machine to compress the trash and cover it with dirt. Landfill fees were often less than $3 per ton. Landfills were generally close by, keeping transportation costs low.
This situation has been replaced with a highly volatile one. Between 1988 and 1991 alone, the number of U.S. landfills operating dropped by 27%.1 Landfill fees skyrocketed in some areas of the country, surpassing $100 a ton in New Jersey. The discovery of groundwater pollution from leaking landfills prompted citizens to demand higher design standards. Federal regulations passed in 1991 require landfills in most locations to have liners of plastic and compacted clay, leachate collection systems, and groundwater monitoring systems that must be maintained for 30 years after the landfill stops accepting material.
Because of these concerns, diverting discards from landfills became a top priority for many communities in the late 1980s and early 1990s. A number of communities embraced a newer breed of incinerators, while many more adopted recycling programs. Yet, despite the astonishing growth of recycling during that time, landfilling continued to predominate as the primary method of disposing discarded resources. In 1992, we landfilled 65% of our municipal discards. By 1997, this had decreased to 55%, while the amount we incinerated remained relatively constant at 17%.2
The reasons to avoid landfilling have not changed. Landfills are still dangerous. They still pollute; new landfill designs only delay pollution (see page 16). They still make poor neighbors. But more compelling is the fact that by destroying materials, landfilling (and incineration) forces us to extract new materials to feed our consumptive habits. We bury or burn 156 million tons of municipal discards a year, but we extract from the environment billions of tons of virgin materials to make our products.
Recycling a ton of steel prevents 200 pounds of air pollutants, almost 3 tons of mining waste, and about 25 tons of water use. One ton of remelted aluminum eliminates the need for 4 tons of bauxite and almost a ton of petroleum coke and pitch.3 Burning a ton of paper generates 1,500 pounds of carbon dioxide. Recycling that paper saves about 17 trees, which absorb 250 pounds of carbon dioxide from the air each year, reducing the global greenhouse effect.4
Wasting is directly linked to resource extraction, processing, and manufacturing. Our current state of wasting is based on a linear economic system; that is, virgin materials are extracted and made into products that are increasingly used once before being destroyed. This system developed when natural resources seemed limitless.
GRRN - 14

Wasting and resource extraction are so firmly entrenched in our economy and lifestyle that they receive unfair competitive advantage in myriad ways. Waste prevention, reuse, and recycling cannot effectively compete with the billions of dollars in taxpayer subsidies that wasting and resource extraction receive. Local government and taxpayers readily subsidize waste collection and disposal services but recycling services are often expected to pay for themselves. In reality, wasting — to the tune of $43.5 billion a year — is an unfunded mandate on local government and taxpayers.5
This section explores the connections between wasting and raw materials extraction and processing, documents the rising trend in wasting, dispels the landfilling-is-safe myth, and shows how resource extraction and wasting compete with recycling and other waste reduction efforts.
Wasting Amounts and Rates Despite Rising Recycling Rates, We Are Wasting More
Between 1960 and 1990, wasting steadily rose. During this period the amount of municipal materials buried and burned more than doubled to 172 million tons. Municipal recycling increased during this period, too (by 28 million tons), but was far outpaced by the level of wasting. After peaking in 1990, the level of wasting slowly began to drop, in no small part to a boom in recycling. By 1996, the tonnage buried and burned had decreased to 152 million tons.6
However, wasting is increasing nationally again and recycling gains have slowed. U.S. Environmental Protection Agency figures indicate that the nation’s municipal recycling level has stagnated at 28% in 1997, not much greater than the 27% level reported the previous year.7 And, for the first time since 1993, the tonnage landfilled and incinerated has increased both in absolute tons and on a per capita basis. In 1997 4.4 million more tons were landfilled and incinerated as compared to 1996. Per capita wasting rates increased from 3.14 to 3.2 pounds per person per day.8
At the state level, several states, such as Georgia, Oregon, Washington, and Minnesota, report increasing per capita and total wasting levels.9
Thus, even though we are recycling a greater portion of our discards, we are still burying and burning more materials than 20 years ago. Since 1980, the tonnage landfilled and incinerated has grown by 19.2 million tons.10 These trends are also reflected in data reported by BioCycle, an industry journal, which tracks national recycling and wasting rates by state.11
Interstate Shipments Are on the Rise
A decade ago, the Long Island garbage barge Mobro traveled 6,000 miles in two months searching for a dump site for its cargo. After being refused entry by five states and a half dozen nations on three continents, the boat returned to New York where its cargo was eventually incinerated. Despite the fever for recycling that the Mobro ignited, dumping garbage in our neighbors’ yards still persists and, in fact, is on the rise.
Between 1995 and 1997, interstate waste imports have increased by 6 million tons, about 32%. Twenty states report increased imports since 1995, the largest tonnage going to
GRRN - 15
Pennsylvania, Virginia, and Indiana. Virginia, in fact, has seen trash imports increase 43% in 1998 from the previous year. New York is the largest exporter of waste, but Illinois, New Jersey, Maryland, and Missouri also ship out more than one million tons each year.12 The closure of small local landfills and the increasing consolidation of the waste management industry account for rising interstate shipments of trash.13 Local opposition to wasting facilities and differences in state and local laws have also played a role.
Increasing interstate waste shipments are a problem because federal law treats garbage as a harmless commodity, when in fact it is not. Consequently, federal law forces states to accept other states’ garbage. This undermines investment efforts by responsible states, such as Wisconsin, in recycling and waste reduction, and forces those states to fill their landfills with other states’ trash.
Furthermore, transporting more waste across state borders means more garbage trucks on the road — an unsafe proposition. Consider that Pennsylvania’s surprise inspections of trash trucks uncovered more than a hundred violations around the state. Dozens of these violations were so serious that the trucks were not allowed back on the road until repairs were made.14
Product Trends Point to More Wasting
A visit to any supermarket, drugstore, or department store reveals many products and packages produced and sold with no thought to durability, waste prevention, or design for recyclability. That this was true in the 1970s and 1980s is no surprise. What is surprising is the lack of change. During the last three decades, many manufacturers have even switched to disposable or single-use products, and from recyclable materials to non-recyclable materials. Not nearly enough have changed back, and some are introducing new, worse products.
Single-use products, which are designed to be thrown away after one use, constitute a substantial portion of total municipal discards generated. In 1997, 33% by weight of all municipal discards consisted of packaging and containers, and an additional 10% was disposable products such as paper and plastic plates and cups, diapers, third-class mail, trash bags, and tissue paper and towels.15
These products can appear and increase in market share abruptly. In 1960, disposable diapers, for instance, were a negligible amount of the U.S. municipal discard stream. By 1997, they comprised 1.4% of municipal discards. Over 3 million tons of discarded diapers were discarded, which is over 8,000 tons per day, enough to fill a couple of landfills.16 In 1960, only 270,000 tons of disposable plates and cups were used in the U.S. By 1997, Americans generated 1,830,000 tons and less than 1% were recovered.17
Over the past few decades, packaging interests have succeeded in replacing recyclable and reusable with non-recyclable packaging. Glass packaging is 100% recyclable, but after peaking near 1980, its use has been declining. The same is true for steel packaging, which has decreased in use by one-third since 1960. Meanwhile, plastic packaging has grown nearly fourfold since 1970, and its production has skyrocketed during the past several years. From 1990 to 1997, plastic packaging production increased by 2.53 million tons (while plastics recycling increased by only 560,000 tons — a ratio of 4.5 to 1.) Recovery suffers. In 1997, 28% of glass packaging was recovered; 61% of steel packaging; and only 9% of plastics packaging.18
GRRN - 16

A recent example of a package introduced in late 1998 that could have major negative implications for recycling is the new Miller Brewing Company five-layer plastic amber beer bottle.19 The bottle’s amber color and oxygen barrier will add expense to recyclers’ costs to sort and process plastic bottles. Little if any processing capacity exists to sort this color of plastic.
The rise in packages made of multiple materials also poses problems for recycling. For example, juice boxes are made of paper, plastics, and aluminum. Separating these materials takes special equipment and is an added expense for recyclers. Packages made of multiple plastic types are hard to recycle too. Mixed plastics resins are often incompatible and do not chemically adhere to each other. And the more plastic types in a blend, the poorer are its properties. In addition to not being recyclable, packaging made from multiple resins can hinder recycling of other plastics if they are not properly source separated. Just a small amount of other resins can contaminate otherwise pure materials.
Single-serve packages are another type of packaging that is growing in use and that results in higher resource consumption and more wasting. Each individual single-serve package may be lighter than its multi-serve counterpart, but much more packaging is required per unit of food sold.
Startling Quantities of Readily-Recycled Materials Are Landfilled or Incinerated
Recycling levels for many commonly recycled materials have stalled or decreased in recent years:
• The recovery of aluminum cans, the king of recyclables, has decreased from 64% in 1992 to 59.5% in 1997. The Container Recycling Institute reports that the 1998 recycling rate for the aluminum can dropped to a 10-year low recycling rate of 56%.20
• Paper and cardboard recovery has stagnated at about 42%.21
• The recycling rate for glass containers (excluding refilled containers) was 27.5% in 1997, down from 28.9% the previous year. Including refillable glass containers, the 1997 glass container recovery level was 35.2%, still lower than the comparable 1996 rate of 37.9%.22
• Recovery of wood and recovery of all types of plastics remain about 5%.23
• Recovery of plastic polyethylene terephthalate (PET) soda bottles dropped from a high of 53% in 1994 to 35.5% in 1997, according to EPA figures. Industry figures indicate that the container recycling levels for all PET containers have dropped from 39.7% in 1995 to 27.1% in 1997 and 24.8% in 1998.24
If we look at the flip side of the coin and consider the portion of materials landfilled and incinerated as a “wasting rate,” we get some idea of the size of the untapped supply stream.
• About 45% of discarded newspapers are buried or burned, along with 49% of office paper and 65% of glass containers.25
• The wasting rate for plastic soda and milk bottles is similarly high. Two out of every three plastic soda bottles are wasted.26
• The wasting rate for all plastic packaging is on the rise. In 1997, 91.3% of plastics packaging was wasted, up from 90.2% in 1996. While the tonnage of plastic packaging recycled
GRRN - 17

increased by 20,000 tons between 1996 and 1997, this was dwarfed by the 1.28 million ton increase in plastic packaging entering the marketplace (virtually all from virgin resources).27 Plastics recycling has plateaued but production continues to increase — increasing 15.7% from 1996 to 1997 alone.
• 59% of yard trimmings are landfilled or incinerated.28
• The wasting rates for discarded tires, clothing and footwear, food, third-class mail, and many types of plastics and paper packaging are all above 75%.29 (See table at right.)
Wasting Household Products and Packaging Means More Mining, Manufacturing, and Industrial Waste
The biggest reason to reduce consumption and increase recovery is that many more virgin resources are extracted than end up in products. Wasting and pollution occur at every step in the refining and manufacturing process.
Municipal materials wasted represent only the tip of a very big iceberg. In the United States, 156 million tons of municipal materials were wasted in 1997.30 In contrast, 11 billion tons of waste of all types were created. (See chart on page 14.) For every ton of municipal discards wasted, about 71 tons of manufacturing, mining, oil and gas exploration, agricultural, coal combustion, and other discards are produced.31 By destroying materials, landfills and incinerators force us to extract and process new virgin materials to make new products.
Consider paper and paperboard products. Americans bury or burn 48.9 million tons of paper and paperboard each year.32 But to make this supply, the pulp and paper industry discards about 2.25 billion tons of manufacturing residues each year (this includes wastewater discharges).33 Thus, for every ton of household paper wasted, the papermaking industry discards 46 tons of industrial sludges.
Similarly, producing plastics and resins generates significant industrial discards, about 181 million tons per year. Many of these residues contain organic solvents and unreacted monomers, which are frequently toxic.34 For every ton of municipal plastics wasted, the industry generates almost nine tons of manufacturing residues.
Few studies have documented how much manufacturing, mining, and energy-related wasting could actually be eliminated for every ton of municipally generated discards reduced or recovered. But we do know that for every ton of consumer products and packaging recycled “downstream,” we eliminate wasting of many more tons of materials “upstream.” Recycling one ton of steel prevents almost three tons of mining waste. One ton of remelted aluminum eliminates the need for four tons of bauxite and almost a ton of petroleum coke and pitch.35
One study estimated that in the United States, almost 3.2 tons of “hidden” resources are consumed to produce about 1 ton of direct products. These hidden material flows are from mining, earth moving, erosion, and other sources.36
GRRN - 18

Wasting Has Major Liabilities Wasting has significant health and environmental impacts. Some of these are “upstream”
impacts, taking place during the extraction, processing, manufacturing, and transportation of raw materials and products. These impacts occur before the items reach the consumer. Other impacts are “downstream” and occur after products are bought and consumed. These impacts include the impacts of landfills and incinerators on public health and the environment. The full costs of these negative health and environmental impacts are not reflected in the price we pay for either products or waste disposal — they are hidden costs.
Recycling too has hidden costs and can cause pollution, which is why reducing consumption is so important. For example, deinking mills for paper emit pollutants that can threaten nearby ecosystems. The Fort James Corporation paper recycling mill in Green Bay, Wisconsin, is the second largest individual polluter in the state of Wisconsin.37 Aluminum can resmelting is currently a polluting process. Aluminum dross, a byproduct of the smelting process, is not recycled but commonly dumped on open land. This hazardous material is exempt from federal regulations because of industry pressure. About 90% of dross could be recycled, but so far industry refuses to do this.38
Recycling operations should be regulated too. But recycled materials have already been refined and processed once, so the virgin resource extraction need not be repeated, and eliminating this step alone prevents tremendous environmental impact. Also manufacturing the second time around is in almost all cases far cleaner and less energy-intensive than the first time. Detailed analysis has shown that these environmental benefits of recycling far outweigh any additional environmental burdens resulting from the collection, processing, and transport of recyclable materials in curbside recycling programs.39
Upstream Liabilities
Extraction, Production, and Consumption Threaten Environmental and Human Health
At every point in the process, developing resources into products creates problems. That is why resource extraction must be minimized.
Non-fuel mining produces an estimated 1 to 1.3 billion tons of wasted material each year in this country alone.40 Mining waste often contains acid-forming chemicals, heavy metals such as lead and cadmium, and other contaminants. Of the 1,100 sites on the Superfund National Priorities List as of August 1996, 66 were former hardrock mine sites.41
Smelting and refining’s pollutants include sulfur oxides, which contribute to acid rain, and arsenic, lead, and other heavy metals.42
Many communities are still battling proposed mining projects that will destroy habitats, endanger water supplies, and harm cultural resources. For instance, the Carlota Copper Project, a proposed copper mine east of Phoenix, Arizona, would have a devastating effect on one of the Southwest's highest quality and rarest riparian areas.43
Developing oil and gas also wreaks havoc, from drilling damage to fragile ecosystems, to oil spills during transport, and air and water pollution from refining.
Many oil and gas products and synthetic industrial chemicals harm public health.
GRRN - 19

• In 1991 an international group of 23 scientists issued a consensus statement of concern that many industrial chemicals can interfere with hormones in wildlife and humans.44
• In May 1996, a different international group of scientists and physicians expressed further concern about the effects of hormone-disrupting chemicals on the brain and central nervous system.45
• In the United States, chemical and plastic makers account for 35% of the toxic chemicals released from manufacturing.46
Production of lumber and paper are also disruptive. Logging practices such as clearcutting increase soil erosion, damage fisheries, and destroy wildlife habitat. Liquid effluents from paper mills — especially those resulting from chlorine used to bleach paper — include a range of organic, toxic, and chlorinated organic matter, which adversely affect water quality and can be lethal to fish and other aquatic organisms. In 1997, the paper products industry released 233.5 million pounds of toxic air emissions, water discharges, and other toxic residues (9.1% of the national total).47
In addition to the direct environmental damage they do, virgin raw-materials industries are among the world’s largest consumers of energy. Mining and smelting account for 5% to 10% of world energy use. In the United States, five primary materials industries — paper, steel, aluminum, plastics, and container glass — consume 31% of the energy used for all manufacturing.48 This high energy demand aggravates such problems as global warming, acid rain, and the flooding of valleys and destruction of rivers for hydroelectric dams.
Some mining, petroleum drilling, logging, and other forms of raw materials extraction and processing are inevitable. But the scale of these activities today — driven by wasting downstream — is causing great environmental harm. By allowing their hidden or externalized costs to mask their damage, we hinder recycling and stymie innovative design solutions.
GRRN - 20

Downstream Liabilities
Landfills Pollute and Threaten Public Health
Today’s state-of-the-art landfills are not safe. The primary purpose of the new composite liner systems (layers of plastic and clay) is to protect groundwater. But this is not possible, according to the U.S. Environmental Protection Agency:
“First, even the best liner and leachate collection system will ultimately fail due to natural deterioration, and recent improvement in municipal solid waste containment technologies suggest that releases may be delayed by many decades at some landfills.”49
“Once the unit is closed, the bottom layer of the landfill will deteriorate over time, and consequently, will not prevent leachate transport out of the unit.”50
A landfill liner failure will lead to moisture entering the landfill, which in turn, generates leachate that will ultimately pollute groundwaters in the vicinity of the landfill once the leachate collection system fails.51
Protecting groundwater quality is essential. Groundwater resources are today’s and future generations’ water supplies. Once landfill leachate pollutes groundwaters, it is difficult, expensive, and often impossible to clean the groundwaters to acceptable drinking water quality. Such groundwaters and their associated aquifer areas are then permanently damaged.52
Growing evidence suggests that air pollution from landfills is also dangerous. Landfills are the second highest source of greenhouse gas emissions in the United States, surpassed only by fossil fuel combustion.53 Also gases that escape from a landfill can contain toxic chemicals such as paint thinner, solvents, pesticides, and other hazardous volatile organic compounds (VOCs), many of them chlorinated.54 A 1990 study of 356 California landfills found 67% of them emitted one or more toxic solvents.55
A new study by the New York State Department of Health reports that women living near solid waste landfills where gas is escaping have a four-fold increase in their chance of developing bladder cancer or leukemia.56 Other studies have linked living near landfills with cancer. A 1995 study of families living near a large municipal solid waste landfill (the Miron Quarry) in Montreal, Quebec, reported an elevated incidence of cancers of the stomach, liver, prostrate, and lung among men, and stomach and reproductive organs among women.57 A 1989 EPA study that examined 593 waste sites in 339 U.S. counties found elevated cancers of the bladder, lung, stomach and rectum in counties with the highest concentration of waste sites.58
In short, all landfills will eventually leak contaminating groundwater, and all landfills release gases contaminating the air. Living near a landfill can be dangerous.
Incinerators Have Proven Environmental and Economic Pitfalls
Some communities have turned to incineration as an alternative to landfills. While today’s waste incineration technology is more sophisticated than the “smoke and soot” producers of the 1950s, it is expensive and does not eliminate or adequately control toxic emissions from today’s chemically complex municipal discards. The heterogeneous mixture of natural and synthetic materials that comprises the urban discard stream undergoes a variety of chemical reactions during and after incineration. Even new municipal solid waste incinerators emit toxic metals,
GRRN - 21

dioxins, and acid gases. Far from eliminating the need for a landfill, they produce an ash residue that is toxic.
The latest dioxin and furan inventory from the U.N. Environment Programme says municipal waste incinerators are responsible for 69% of the dioxin in the global environment.59 At least
GRRN - 22

GRRN - 23
THE REAL LANDFILL CRISIS
In the 1980s, the existence of a landfill crisis based on shrinking disposal capacity was widely accepted. Since then, landfill capacity has grown, but a landfill crisis still persists. The real landfill crisis is not one of disposal capacity, but of deferred pollution and increased public health risks.
all landfill liners will eventually leak, polluting nearby groundwater
˛ Even the best landfill liner and leachate collection system will ultimately fail due to natural deterioration. Leachate that has leaked, like any liquid, will find its way to the nearest water source. When leachate enters groundwater, it becomes highly hazardous to those communities who use that source of groundwater. Regulations that protect groundwater quality do not adequately or reliably address the wide variety of constituents in municipal solid waste leachate that can prevent groundwater from being used for domestic water supplies.
Landfill monitoring systems to detect groundwater pollution are inadequate
˛ Lined landfills will eventually leak through the liner via small holes, rips, tears, and points of deterioration that will develop. These leaks will produce finger-like plumes of leachate that are likely to pass between monitoring wells without being detected. By the time groundwater pollution will be detected, the aquifer will likely be severely damaged.
Post-Closure liability for Landfills is inadequate
˛ Current Subtitle D landfill regulations are significantly deficient because they do not require care and funding for monitoring and maintenance of landfills 30 years after closure, provided contamination has not been detected by then. The vast majority of today’s landfills will be threats to groundwater quality for hundreds to thousands of years. Taxpayers will ultimately pay the price for landfill failures.
Landfill air emissions contribute to global warming, are toxic, and can increase the risk of cancer
˛ As wastes decompose in a landfill, methane and carbon dioxide gases form. These gases create pressure inside the landfill, which in turn forces the gases to move. They escape either through the surrounding soil or upward into the atmosphere, where they drift away. Landfill gases are a major contributor to the global greenhouse effect. Furthermore, escaping gases will typically carry along toxic chemicals such as paint thinner, solvents, pesticides, and other hazardous volatile organic compounds. Women living near solid waste landfills where gas is escaping have a four-fold increased chance of bladder cancer and leukemia.
Landfills make poor neighbors
˛ Besides generating serious health and environmental impacts, landfills generate odors, dust, and blowing trash; attract birds; increase truck traffic; and decrease property values.
Landfill prices do not reflect their true costs and, as a result, distort the market
˛ Tipping fees do not currently incorporate the true perpetual costs of monitoring and maintaining landfills, the Superfund costs of cleaning up the groundwater pollution associated with the failure of landfill liner systems, nor the adverse impacts of landfills on those who own or use properties within the sphere of influence of the landfill. Most of these and other external costs are being passed on to future generations.
Sources: G. Fred Lee, Ph.D, P.E., D.E.E., and Anne Jones-Lee, Ph.D., Three R’s Managed Garbage Protects Groundwater Quality, (El Macero, California: G. Fred Lee & Associates, May 1997); and “Landfills are Dangerous,” Rachel’s Environment & Health Weekly #617 (S t b 24 1998)

70% of the lead emissions from burning combustible materials come from plastic products.60 The detrimental public health impacts of incinerator pollutants have been well documented.61
Because the new breed of waste incinerators recover heat to produce steam and electricity, incinerator advocates describe their installations as “resource recovery” or “waste-to-energy” facilities. Such terminology is misleading. Incinerators recover few resources (with the exception of ferrous metals) and are net energy losers when the embodied energy of the materials burned is accounted for. When a ton of office paper is burned for its heating value, it generates about 8,200 megajoules. But when this same ton is recycled, it saves about 35,200 megajoules. Recycling office paper saves four times more energy than what can be generated through burning it.62 Recycling other materials offers similar energy savings. Thus, it could be said incinerators are “wasted-energy” plants.
Incinerators are expensive to build and operate and are the most costly option available for managing municipal discards. One study found that tip fees at incinerators built since 1989 averaged $60 per ton and ranged from $30 to $90 per ton, higher than tip fees at most materials recovery facilities and at landfills.63
Incinerators’ high costs can lead to financial trouble. Taxpayers must often subsidize the facilities so that their tip fees can be cut to attract enough material to keep the plant functioning. For example, in Montgomery County, Maryland, officials responded to tonnage shortfalls by lowering the county incinerator’s tip fees from $59 per ton to $44 per ton. They made up the shortfall in revenue by assessing extra taxes on all county property owners.64
In New Jersey, one of the first states to embrace municipal waste incineration, counties that have built incinerators have accumulated $1.35 billion in debt. In November 1993, voters approved a $153 million state bailout to help counties defray their waste debts. After a May 1999 state appeals court ruling, New Jersey’s counties are free to charge municipalities special fees, which they call “environmental investment charges,” to help pay down the rest of their incinerator debts.65
Incineration, like landfilling, competes with recycling and composting for the same materials. A study that evaluated Florida’s seven largest incinerators found that these facilities regularly burn significant amounts of highly recyclable materials.66 Some local governments have signed “put-or-pay” contracts, which require them to deliver a guaranteed tonnage of material to incinerators or pay a penalty. These contracts are a major disincentive to maximizing recycling or waste reduction, and thus an obstacle to low-cost recycling programs.
One alarming new trend is the increase in projects to use incinerator ash. Incinerator ash that comes from the stack may be classified toxic and require handling as hazardous waste, but if it is mixed with ash from the bottom of the burner, it may be labeled less toxic. Some new efforts disperse this incinerator ash throughout the environment by mixing it into road sub-base materials, asphalt, concrete, and structural fill. For example, the American Ash Recycling Facility in York, Pennsylvania, began operations June 1998 and has a capacity to process 240,000 tons per year of incinerator ash into commercial products. A number of counties with waste incinerators are considering building similar facilities.67
Composting Mixed Trash Is Garbage in, Garbage out
GRRN - 24

A few U.S. communities have built facilities that compost mixed trash — that is, municipal discards that have not been source-separated. These facilities can reduce trash by as much as 50% by weight and roughly 60 to 80% by volume. However, composting non-source-separated material has an Achilles heel: the compost can be contaminated by toxic and non-biodegradable materials. Questions of compost quality and odor control hinder compost market development and continue to trouble this industry. Furthermore, mixed waste composting, like incineration, destroys the resource value of discarded materials.
Economics of Wasting Our current economic system favors wasting. The environmental and social costs of our
profligate consumption are not reflected in the prices we pay for products. Similarly, the benefits of resource conservation and recycling, such as business and job creation, are not accounted for in our economic analyses. Taxpayers subsidize wasting in myriad ways, which means these costs are also excluded from the economic equation. As a result, the marketplace is distorted and recycling does not compete with wasting on a level playing field.
This section identifies three specific examples of how our economic system currently favors wasting:
• taxpayers subsidize virgin material extraction and processing industries and wasting;
• manufacturers and sellers of products and packaging usually have no responsibility for collecting, recycling, or landfilling discarded materials (i.e., waste is an unfunded mandate on local government and taxpayers); and
• big hauling companies that have a vested interest in burying and burning materials are allowed to gain oligopolistic control of collection and disposal of all discarded products.
Taxpayers Subsidize Resource Extraction and Wasting
Virgin materials extraction and processing industries receive billions of dollars each year in subsidies. These subsidies distort the marketplace and make recycling compete with virgin materials extraction on an uneven playing field.
According to a 1994 U.S. EPA study of disincentives to recycling, “Subsidies to virgin industries (which undoubtedly raise their profit margins) to new entrants over the long run. Entry into the virgin inless likely in comparison to the unsubsidized world — wi‘overproduction’ of virgin material compared to quantitiemarket.”68
GRRN - 25
The Real Cost of Wasting
The price of wasting does not reflect its true costs. Costs typically overlooked include:
• Superfund clean-up
• Value of lost resources
• Environmental damage measured in:
— deforestation
— acres of new mines
— carbon dioxide production
— loss of biodiversity
— pollution
render these industries more attractive dustries becomes more likely and exit th the total effect being s that would result from an undistorted

A 1999 report by the Grassroots Recycling Network and three other organizations identified more than a dozen federal taxpayer subsidies worth $2.6 billion dollars a year for resource extractive and waste disposal industries.69
Aluminum smelters, for instance, receive more than $200 million each year in subsidies for cut-rate power from federal dams. This means that for every ton of aluminum recycled, taxpayers spend more than $200 in subsidies to counteract that recycling.70 If aluminum smelters paid market rates for their electricity, aluminum can recycling would surely benefit.
Direct state subsidies compound the impact of federal programs. California alone, for instance, spends more than $180 million annually in timber, mining, and oil and gas subsidies.71
Indirect subsidies are also not accounted for. These include:
• cheap energy that disproportionately benefits the more energy-intensive extractive industries,
• road building at taxpayer expense to serve industries remote from metropolitan markets, and
• tax policies that favor capital expenditures over labor costs.72
Even more substantial are the costs that virgin materials and landfills and incinerators do not pay but should. These include impacts of environmental and health damage, pollution clean-up, and disposal in landfills and incinerators. Consider the following examples:
• One study estimated the public health costs from releases of hazards during the production of PET plastic containers at $331 per ton.73
• Another study compared the environmental impacts of producing certain products from virgin versus recycled materials. The impacts from virgin materials production were significantly greater. For boxboard production, for example, the environmental cost impact was $269 per ton (twice as high as the cost impactct from recycled boxboard production). For aluminum production, the environmental cost impact was $1,933 per ton (six times higher than the cost impact from recycled aluminum production).74
• The tab for collecting and disposing discarded materials in landfills and incinerators alone amounts to $43.5 billion a year in local government and taxpayer subsidies.75
• Studies done in the United Kingdom, Norway, and Israel have all shown that landfills have significant environmental costs. For instance, the Norway study estimated that the environmental costs of landfilling paper are approximately $300 per ton. (Both the United Kingdom and Norway have subsequently imposed surcharges on landfills to discourage their use and Israel is currently considering a surcharge.)76
Imagine the impact on virgin materials extraction and product manufacturing if these industries internalized the above costs.
Waste Is an Unfunded Mandate
Taxpayers pay for wasting three times: first to buy the product, second to collect and dispose of it, and a third time to clean up the environmental damage and pick up the health costs associated with its production and disposal. Neither the municipalities nor the consumers have
GRRN - 26

much ability to control the design of products. Currently manufacturers have little responsibility to fund the handling of the residues their products generate. Manufacturers produce an ever increasing avalanche of throw-away products and packaging. They largely refuse to create or expand markets for recyclable materials. As a result, communities and taxpayers have to foot the $43.5-billion-a-year bill for managing discarded materials, representing essentially an unfunded mandate. This drains money from quality-of-life endeavors and profitability of local economies.
Municipal wasting is three times greater than recycling. Why is wasting so common and so cheap? Post-consumer wasting is prevalent because:
• producers are not held responsible for the environmental impact of their products,
• taxpayers are forced to pay all disposal costs (recycling is expected to pay for itself),
• production of disposable/single-use products and over-packaged products is profitable to industry,
• the cost of managing material for recycling and waste disposal is not included in the price of products and packaging, and
• disposal facilities such as landfills and incinerators are often subsidized.
Pre-consumer industrial wasting is common because its full costs are not reflected in prices that consumers pay. Virgin materials receive extensive subsidies and many of the true costs of extraction, processing, transportation, and manufacturing are externalized at the public’s expense.
One study focusing on the New York City region, found that source reducing the region’s municipal discards by 15% would prevent 43 million tons of waste. The environmental and cost benefits would be tremendous. Between 2000 and 2015, $4.25 billion in waste collection and handling costs and $7.6 billion in environmental impact costs to air and water could be avoided. This translates to $270 per ton of waste avoided.77 (Despite these compelling figures and the looming closure of the Fresh Kills Landfill, New York City has been unable to develop and implement an effective plan to reduce waste. The problem perhaps stems from the fact that the city Department of Sanitation’s know-how lies in trash collection and transfer by barge, not in the more complicated task of teaching households and businesses to reduce waste and in building local markets for recovered materials.78)
Industry Consolidation Points to More Wasting
Consolidation in the waste industry, coupled with increased privatization, threatens waste reduction efforts. The recent consolidation of the largest firms — WMX/USA Waste and BFI/Allied — brings these companies closer to national control over the collection, transfer, and disposal process. And because these firms (1) earn more from landfilling and incinerating than from recycling, and (2) are publicly traded companies that answer to their shareholders, they must opt for landfilling and incinerating.
In mid-1998, the CEO of WMX stated: “with some weaker companies gone from the industry in recent years and continuing consolidation, disposal prices can be increased without losing competitors.”79 In mid-1999, one year after its merger with USA Waste, WMX raised tip
GRRN - 27

fees 40% to 138%. Landfills in Pennsylvania, Virginia, and Ohio were among those affected. The new rates affect about one of every eight tons of trash disposed at WMX facilities.80
In areas where many reuse and recycling companies are vying for the discard supply, raising landfill prices can stimulate recycling, because recycling can now save or even make money. But where competition is weak or discouraged by governmental actions and inactions, monopoly control by large companies can result in substantial reductions in recycling service. This happened in 1998 in New York City, where WMX shut down recycling at its big commercial processing facilities and removed the equipment from the buildings.81
Recent corporate background offers a perspective. In 1995, WMX took in $10.25 billion worldwide, and BFI made $5.88 billion.82 But despite their size, both suffered loss of market share and shareholder value while independent recyclers expanded rapidly in the 1990s. The new companies that have taken over WMX and BFI have less stake in recycling.83 Supporting the idea that the decline in recycling is an exercise in corporate cost-cutting, one report estimated that WMX’s profit margin on landfilling is ten times that for recycling.84
Another factor is that waste companies’ contracts with municipalities and counties often encourage landfilling over recycling. Firms often get a fixed fee for providing recycling services to each household (as opposed to a per-ton or performance-based fee). But the companies get paid for driving by the household whether or not recyclables are placed in front. Since the companies make more money the less handling they do, the payment system structures in an incentive to the companies to discourage people from recycling.
Legislators who could regulate negative corporate behavior may have little incentive to do so. The big publicly-traded waste hauling companies influence legislatures up to and including Congress. One effect over time is that when commodity prices for recyclables are high, the big hauling companies may support certain laws or acquiesce on recycling issues. When prices are low, they push the “free market” for interstate flows of trash, no matter what the cost is to taxpayers in the long run.85
Wasting has serious financial clout, too, as a result of its technologies. Landfills and incinerators are capital- and asset-intensive. Recycling operations, on the other hand, are labor- and knowledge-intensive and can be financed privately or out of general budgets, not bonds. Bankers and bond firms like assets and capital projects and see little underpinning to justify lending to small businesses that have few assets and spend what would otherwise be profits on financing their own growth.
Furthermore, capital-intensive landfills and incinerators qualify for tax breaks such as Private Activity Bonds (PABs), which discriminate against recycling. About 70% of all bonds used to finance disposal facilities are PABs. Federal law treats income earned on PABs as tax-exempt on the theory that infrastructure development serves the public interest.86
This difference in the capital and labor intensity between recycling and waste disposal leads to powerful supporters in the waste disposal camp.
Profitability may go a long way toward explaining the big hauling industry’s animus toward recycling. Haulers vertically integrated with landfills and incinerators have a vested interested in sending materials they collect to these facilities.
GRRN - 28

the state of recycling Introduction
In the last decade, recycling has come of age. The number of curbside recycling programs has climbed to 9,349, and the national recycling rate for municipal discards has reached 28% for the first time since the U.S. Environmental Protection Agency started tracking the rate.1
At the local level, many communities are setting new records, surpassing 50%, and even 60% waste diversion levels. A number of individual establishments — public and private sector — such as office buildings, schools, hospitals, restaurants, and supermarkets have approached 90% and higher levels. Recycling has made gains despite an unlevel playing field: competition from raw materials processing and wasting industries and expectations that it has to “pay for itself.”
From coast to coast, the public and state and local government have embraced recycling as an important environmental activity. They understand that recycling conserves resources and saves energy, that it extends the life of landfills, that it reduces pollution and public health risk, that it can save taxpayers and the private sector money while building jobs and businesses for local communities.
By 1994, the yearly increase in materials discarded was absorbed by impressive gains in recycling and we had achieved a zero net increase in materials wasted.2 Public policies in the 1980s and early 1990s spurred recycling around the country. Mandatory recycling requirements, pay-as-you-throw trash fees, buy recycled campaigns, minimum recycled-content legislation, grant programs, and recycling market development zones encouraged both the supply and demand for recyclable materials and products.
Private sector initiatives have been remarkable too. Many businesses reduced their waste and redesigned their products and packaging with materials efficiency and cost cutting in mind. Some even adopted zero waste goals. The technology available to utilize recyclable materials has never been better.
However, the pendulum is now swinging backward and the movement forward in recycling appears to have stalled. Recently released EPA figures put the 1997 national recycling level at 28%, not much greater than the 27% reported the previous year.3 Some states are considering rescinding recycling goals and policies. Recycling levels have plateaued in some areas and for some materials. A few cities have opted to cut back their recycling budgets. Some industries have not followed through on commitments to create more markets for the growing supply of recyclable materials.
Some rationales for why recycling has stalled include:
• Disposal has remained too cheap: When we began recycling we assumed that landfill prices and disposal costs would continue to soar, when in fact they have dropped. Just as the movement toward alternative fuels stalled when oil prices dropped in the late 1980s, so too has the movement for recycling stalled.
• Further increases in recycling are viewed as more complicated: We have picked the “low-hanging fruit” (such as newspaper and beverage container recycling, and yard debris
GRRN - 29

recovery). To further recycling, we need to expand beyond conventional recyclables. We also need to address the demand side of the picture more (that is, manufacturers using more recycled content), rather than simply the supply side (collecting materials). It takes political will to tackle the thorny issue of regulating industry.
• Institutional inertia exists, especially in the public sector: Many city administrators prefer convenience to complication, and garbage incineration or landfills are viewed as more convenient than getting thousands of households and businesses to change their habits, find new markets, build storehouses, and set up future markets.
• Consolidation of the waste hauling and disposal industry leads to less recycling: Big hauling companies that are vertically integrated with wasting facilities make more money by landfilling than recycling. When we let big waste hauling companies decide which to choose, we will get less recycling.
Economics is perhaps the most important key to reversing the pendulum’s swing and spurring further waste prevention, reuse, and recycling. When the price of wasting reflects its true costs and the price of recycling reflects its true benefits, recycling will out-compete wasting every time.
In the following sections, we discuss benefits of recycling, identify key advances in recycling in the last decade, and then highlight instances of backsliding. The Agenda for Action at the end of this report suggests ways to counter the backsliding and to level the playing field between wasting and recycling.
Benefits of Waste Prevention, Reuse, and Recycling Waste Prevention, Reuse, and Recycling Conserve Resources and Reduce Pollution
For every ton of material destroyed by landfilling and incineration, many more tons of raw materials must be mined, extracted, processed, or distributed to manufacture a new product to take its place. The environmental costs of extracting virgin materials and producing goods in the first place are far greater than the environmental costs of landfilling and incineration. Thus, the real environmental savings comes when we reduce consumption and when we replace virgin materials with recycled materials, closing the loop.
Extensive life-cycle analyses show that using recycled materials to make new products saves energy in almost all cases.4 Mining and smelting aluminum into cans is especially energy intensive. Making a ton of aluminum cans from its virgin source, bauxite, uses 229 Btus. In contrast, producing cans from recycled aluminum uses only 8 Btus per ton, an energy savings of 96% (see graph at left).5 (Despite this, 45 billion aluminum cans were wasted in the U.S. in 1998.6) Likewise, extracting and processing petroleum into common plastic containers (polyethylene terephthalate, PET, and high-density polyethylene, HDPE) takes four to eight times more energy than making plastics from recycled plastics.7 (The recycling rate for all plastic containers was only 20.2% in 1998.8)
Extensive life-cycle analyses also show that overall emissions to all environmental media are lower when recovered materials are used to make products.9 Water use, water pollution, air pollution, and extraction wastes are all significantly reduced. For example, making paper from
GRRN - 30

recycled paper saves 58% of the water use and 74% of the air pollution associated with making paper from trees (see table at right). And this does not count major environmental impacts associated with clear-cutting such as soil erosion, stream sedimentation, and loss of biodiversity.
And of course, when we avoid consumption in the first place, the environmental benefits are magnified.
Recycling Reduces Greenhouse Gas Emissions
Naturally occurring water vapor, carbon dioxide, methane, and nitrous oxide trap radiant heat from the Earth and help maintain its livable temperature range — the greenhouse effect. Since the pre-industrial era, atmospheric concentrations of carbon dioxide have increased by nearly 30% and methane concentrations have more than doubled. These changes now threaten to increase mean global surface temperatures. The cause, according to scientists, is human activity, primarily the burning of fossil fuels.10
Waste prevention and recovery reduce greenhouse gases by:
• reducing energy consumption associated with making, transporting, and using the product or material;
• reducing non-energy-related manufacturing emissions, such as carbon dioxide released when limestone is converted to lime (which is needed for aluminum and steel manufacturing);
• reducing methane emissions from landfills; and
• increasing carbon uptake by forests, which take carbon from the atmosphere and store it for long periods (thus rendering the carbon unavailable to make greenhouse gases).11
Net carbon emissions are four to five times lower when materials are produced from recycled steel, copper, glass, and paper. They are 40 times lower for aluminum.12
If Americans reduced waste generation to 1990 levels and increased recycling to only 35%, greenhouse gases would be reduced by 11.4 million metric tons of carbon equivalent (MTCE). This is equivalent to taking nearly 7 million cars off the road for one year.13
Waste prevention also makes an important difference. By cutting the amount of materials discarded by just 5%, we could reduce greenhouse gas emissions by another 10.2 million MTCE. Together, these modest increases in recycling and waste prevention could reduce emissions by an amount equal to the emissions from the annual electricity consumption of households in three cities the size of the city of Los Angeles.14
Waste Prevention and Recycling Reduce Costs
Recycling is fundamentally cheaper than wasting when all costs are considered. In addition to providing net pollution prevention benefits, recycling adds value and jobs to local and regional economies.
Recycling is a win-win proposition when we account for (1) upstream subsidies for virgin resource extraction industries, (2) downstream subsidies for landfills and incinerators, (3) the true long-term societal and environmental costs of resource extractive and wasting facilities, and (4) the local economic development benefits of reuse and recycling.
GRRN - 31

Some state and local governments are improving accounting techniques for evaluating discard management options. Florida, North Carolina, Indiana, and Georgia are some states that promote some level of “full-cost accounting” (although these methods do not incorporate major categories such as subsidies and environmental externalities). Local governments already using “full-cost accounting” techniques include Plano, Texas; Sacramento, California; and Seattle, Washington.15 Still, these techniques need refinement to truly account for appropriate remediation, contingent, environmental, and social costs.
But even with an unlevel playing field, many businesses and communities that prevent waste and recycle have reduced their costs.
The U.S. EPA reports that in 1997, its WasteWise partners — businesses and institutions that commit to reducing their waste — saved an estimated $218 million in avoided disposal fees alone through recycling efforts. Avoided paper purchasing costs for all reporting partners in 1997 may have been as high as $60 million.16
Local government can also save. A recent U.S. EPA study of 14 communities recovering between 44% and 65% of their residential waste, found that 13 of these had cost-effective programs.17 Other research shows that costs for recycling decrease as recovery levels increase.18 One factor for this is the costs for processing recyclables and yard debris are often much less than landfill or incinerator disposal tip fees.19
GRRN - 32

BUSINESSES SAVE MILLIONS OF DOLLARS BY REDUCING WASTE
˛ Bell Atlantic — put all its forms and purchase orders online, reduced its paper-sourcing by 553,000 pounds, and saved $525,000 in 1997
˛ The Battelle Memorial Institute — saved 28,400 pounds of paper and almost $90,000 by publishing its policies, standards, procedures, and directory electronically
˛ CITGO Corporation — has reduced its computer paper use by 69% and saved a staggering $2.5 million, by publishing its reports online since 1991
˛ Clorox Corporation — lightweighted some of its primary packaging and eliminated more than 3 million pounds of transportation packaging, saving the company over $536,100 in 1995
˛ Herman Miller — halved its volume of transport packaging by using fewer wood pallets and corrugated boxes, saving the company over $4 million
˛ Anheuser-Busch breweries — saves nearly $1 million a year in landfill charges by recycling many of its by-products
˛ The U.S. Postal Service — made $8 million in revenue in 1997 by selling its recyclables, and revenues have been growing every year
˛ Eastman Kodak Company — earned $2.9 million in revenue in 1995 from the sale of materials and assets for reuse that would otherwise be discarded
Sources: U.S. EPA, WasteWise 1998 Award and Recognition Recipients (Washington, DC: U.S. EPA, September 1998), pp. 3, 12, 13, 15; U.S. EPA, <http://www.epa.gov/epaoswer/non-hw/reduce/wastewise/mainsite/images/
winbook2.txt>; U.S. EPA, Fourth Year WasteWise Progress Report, EPA530-R-98-016 (Washington, DC: U.S. EPA, September 1998), p. 2; U.S. EPA, EnviroSense Web site at <http://es.epa.gov/partners/wise/wwsamp.html>; U.S. Postal Service, From Garbage into Gold: The U.S. Postal Service Finds Profitable Ways to Recycle Mail (U.S. Postal Service Web page <http://www usps gov/environ/webpages/> June 1999); U S EPA WasteWise Second-Year
Restructuring waste management systems can pay off handsomely. For example, Madison, Wisconsin, reduced trash routes by 32% and switched to smaller trash trucks, after introducing its multi-material curbside recycling and yard debris collection programs. These trucks cost less and have lower repair costs than the trucks the city needed to collect all discarded materials as trash. The overall collection cost went down in Madison compared to the cost of operating a single fleet to pick up unseparated waste.20 Falls Church, Virginia, reduced trash collection frequency from twice to once a week, one year after implementing a multi-material curbside recycling program. As a result, the city raised its material recovery rate from 39% to 65%, cut trash collection costs by more than half, and reduced annual per household waste management costs by more than a third.21
In some communities recycling is viewed as an expensive burden. But often that is because these communities are recycling at low rates and are treating recycling as an add-on to their traditional trash system rather than as a replacement for it. When communities reach high waste reduction levels, recycling becomes more cost-effective. Communities that maximize recycling save money by redesigning their collection schedules and/or trucks. Staff once devoted to trash collection now collect recyclables or yard trimmings. As communities attain ever higher recovery levels, planners and public works administrators are beginning to realize that recycling and composting can be the primary strategy for handling discards, rather than a supplement to
GRRN - 33

the conventional system. The economics of recycling improves when, instead of adding the cost of recycling onto the costs of conventional collection and waste disposal, recycling becomes the heart of the system.
Recycling Means Business
Recycling is an economic development tool as well as an environmental tool. Reuse, recycling, and waste reduction offer direct development opportunities for communities. When collected with skill and care, and upgraded with quality in mind, discarded materials are a local resource that can contribute to local revenue, job creation, business expansion, and the local economic base.
On a per-ton basis, sorting and processing recyclables alone sustain 10 times more jobs than landfilling or incineration.22 However, making new products from the old offers the largest economic pay-off in the recycling loop. New recycling-based manufacturers employ even more people and at higher wages than does sorting recyclables. Some recycling-based paper mills and plastic product manufacturers, for instance, employ on a per-ton basis 60 times more workers than do landfills.
Value is added to discarded materials as a result of cleaning, sorting, and baling. Manufacturing with locally collected discards adds even more value by producing finished goods. For example, old newspapers may sell for $30 per ton, but new newsprint sells for $600 per ton. Each recycling step a community takes locally means more jobs, more business expenditures on supplies and services, and more money circulating in the local economy through spending and tax payments.23
Recycling has had a major impact on job creation in local and state economies:
• In North Carolina, recycling industries employ over 8,700 people. The job gains in recycling in this state far outnumber the jobs lost in other industries. For every 100 recycling jobs created, just 10 jobs were lost in the waste hauling and disposal industry, and 3 jobs were lost in the timber harvesting industry.24
• A survey of ten northeastern states found that they employ 103,413 people in recycling.25
• A 1992 survey in Washington found that this state had created 2,050 recycling-based jobs since 1989.26
• Massachusetts employs more than 9,000 people in more than 200 recycling enterprises. About half of these jobs are in the recycling-based manufacturing sector. These businesses represent more than half a billion dollars in value added to the state’s economy.27
• In California, meeting the state’s 50% recycling goal is expected to create about 45,000 recycling jobs by the year 2000, over 20,000 of which are slated to be in the manufacturing sector.28
Regional studies of employment and the remanufacturing industry indicate that recycling activities employ more than 2.5% of manufacturing workers. Extrapolating these findings to the entire nation, recycling and remanufacturing activities could account for approximately 1 million manufacturing jobs and more than $100 billion in revenue.29
GRRN - 34

Product reuse is even more job-intensive than recycling. It is a knowledge-based industry, with a premium placed on accurate sorting and pricing, and good inventory management. One reuse company is Urban Ore in Berkeley, California. This company handles a broad range of reusable goods, from building materials to books and art. Materials are sorted and cleaned, and sometimes repaired. For the most part, what does not sell becomes scrap. Urban Ore calculates value-added monthly, which ranges from 30% to 60%. This reflects the large contribution its staff and handling system make to its monthly income. As in recycling, Urban Ore is the first link in a value-added chain that involves and employs hundreds of remodeling and landscape contractors, artists, inventors, builders, collectors, property managers, homeowners, and second-hand dealers.30
The reuse industry competes with mass-marketed commodities such as diapers, tires, and plastic, glass, and metal drink containers. Each year Americans spend billions of dollars on these new products. Some of this money remains in communities where the products are purchased, but most leaves the community for the home offices of the corporations. A handful of companies dominate the markets for soft drinks, disposable diapers, and new tires.
By contrast, reuse industry alternatives — refillable bottle washing plants, cloth diaper services, tire retreading enterprises — create wealth and jobs for local communities. Such reuse companies tend to be small and locally owned and operated, providing local jobs and increased capital retention. Reuse is thus a tool for miniaturizing global and national economies, making them more sustainable.
There are 1,700 tire retreading operations in North America. About 95% of these are small businesses. Reusable diaper services employ 10,000 to 12,500 people. Each business employs 5 to 50 workers. A complete switch to diaper services would generate 72,000 jobs nationwide in this service industry alone.
Other reuse efforts can have similar impacts. For instance, if building deconstruction were fully integrated into the demolition industry, at least 100,000 jobs could be created in this sector.31
Recycling is Close to the People
Recycling enjoys bedrock popular support. Indeed, more people may recycle than vote in the United States.32
Until the 1950s, recycling was part and parcel of America’s heritage. From self-reliant pioneer homesteaders to frugal immigrants landing on our shores in the 1890s; from the 17th Century Quilting Bee to 20th Century wartime materials drives, Americans pooled once-used materials for household, community, and national interests.
The post-World War II recycling movement was born in the 1960s. Rachel Carson’s Silent Spring alerted the United States’ population to the dangers of industrial pollution, leading to a generation of ecological activists. Earth Day 1970 was the “coming-out” party. National environmental organizations were formed, which pressured for new air, water, and waste laws that helped the price of landfill disposal approach its true cost. The local drop-off recycling center became a gateway institution for activists. In the 1980s, during the “rush to burn,” citizens organized for expanded recycling programs and policies and recycling came of age (see 1980s in the history of recycling, next page).
GRRN - 35

The appeal of recycling crossed all political and social values. The recycling movement that followed has been the most cross-class, cross-gender, cross-generation and cross-race movement the country has ever seen. It has brought the country to 28% recycling, and is advocating for more. Citizen activism and voter support for recycling is found virtually in every city and county across the country.
Recycling Advances During the last decade, recycling has reached new heights and citizens, government, and the
private sector have learned to recover ever-increasing amounts of materials from our discard stream. Numerous retailers and manufacturers have redesigned their products and packaging with waste prevention and recycling in mind, saving money to boot.
At the same time, community-based organizations, recycling planners, and recycling entrepreneurs have embraced recycling-based economic development and the notion that recycling does indeed mean business.
To succeed, recycling and recycling-based businesses depend on conditions in the collection, transportation, processing, and marketing sectors. Government policies targeting these sectors have improved the environment for recycling and recycling-based businesses by improving the supply of feedstock, by assisting manufacturers’ operations directly, or by influencing demand for the resulting products. State policies in particular have been effective in increasing recycling levels. Perhaps it is not surprising that the top waste reducing states rely on a mix of strategies (see table, page 32).
Curbside collection programs, state beverage container deposit bills, and landfill bans on recyclable materials have provided recycling-based businesses with needed materials. Minimum recycled-content policies, grant and loan programs, and recycling market development zones have encouraged the development of recycling-based manufacturing. Buy-recycled programs have increased demand for recycled products.
Most recently, grassroots recyclers have made dramatic changes in policies at the U.S. Department of Housing and Urban Development (HUD). Deconstruction, the recovery of building materials from old buildings, is now an encouraged activity under HUD’s HOPE VI housing program. Recycling is transforming the lives of public housing residents who are establishing new recycling businesses in the midst of their communities.
While the new ground recycling has charted is remarkable, much remains that can and should be done to further advance recycling and move us closer to a zero waste economy. The Agenda for Action, pages 45 to 55, focuses on some initiatives needed. This State of Recycling section highlights progress made in recycling to date and keys to recycling’s current success.
National Recycling Rates Are Increasing Despite Unlevel Playing Field
The U.S. EPA reports that the national recycling rate for municipal discards increased from 16.4% in 1990 to 28.0% in 1997.33 Using a very different methodology, the industry journal BioCycle reports the national recycling rate as 30% in 1997.34
GRRN - 36

The Last Four Decades — A History of Recycling
prior to 1960 — Vibrant industry engaged in recycling (from scrap dealers, paper mills, and textile processors to charitable thrift organizations). Many businesses are family owned and have been in operation for generations.
by 1960 — Discard management system overwhelmed by increased generation from “baby boom" population, new products and packages, and new composite materials. Close-in landfills no longer available to larger cities as suburbs arise and use political clout to prevent new sites. Hydraulic compactor trucks introduced that mash discards into garbage, and transfer stations established to haul garbage longer distances.
1965 — First federal solid waste legislation calling on the U.S. Department of Health, Education, and Welfare (now the Department of Health and Human Services) to start research.
1968 — The first "Survival Walk" in California; drop-off center started at site of each night’s rest. The drop-off center becomes the metaphor for responsible discard management. Recycling posed as alternative to war to protect access to raw materials. Madison, Wisconsin, begins first post-World War II curbside collection program in the country by collecting old newspapers.
1969 — More community-based curbside collection programs start.
1969 — Industry forms National Center for Solid Waste Management. Uses "Crying Indian" image to convince Americans that people cause pollution. Renamed National Center for Resource Recovery which was the leading proponent of waste incineration to solve the solid waste problem.
1970 — First Earth Day. 3,000 drop-off centers started within months of this event.
1971 — Second U.S. beverage container deposit law passed in Oregon in 1971 (effective in 1972). (Vermont passed the first container deposit law in 1953, but the legislature allowed the law to expire four years later after strong lobbying from the beer industry.)
1972-6 — U.S. EPA established, first four Reports to Congress provide program and policy initiatives for national recycling and source reduction efforts. Sponsors municipal curbside collection programs. Local, regional, and statewide meetings spread word of recycling rationale and know-how throughout the United States. California Resource Recovery Association formed as the first state recycling association linking grass roots recyclers, secondary materials processors and brokers, end users, and elected officials.
1976 — The Resource Recovery and Conservation Act (RCRA) passed as nation’s first comprehensive discard management regulatory system.
1977 — Maryland is one of the first states to pass recycled paper procurement legislation. Its 1977 law required the state to increase its recycled paper purchases from 5% in 1978, to 25% in 1981 and 40% in 1985. (By 1999, more than 95% of the paper the state buys is recycled.) Columbia, Missouri, becomes first and only local U.S. government to require deposits on certain beverage containers.
1979 — U.S. EPA and U.S. DOE sign Memorandum of Understanding creating commercialization program for waste incineration (cancelled in 1981 by the Reagan administration) The Public Utilities and Regulatory Policy Act (PURPA) passed which
GRRN - 37

GRRN - 38
1980s — Industry and local governments promote incineration using profits from bond sales to pay for government staff and consultants to lobby for waste incineration plants. Massive mobilization of ad hoc citizens groups to fight incinerators. Anti-incineration groups merge with recyclers and secondary materials industry and new recycling entrepreneurs. By 1985 more incinerators are canceled than built. By 1990, 270 of 300 planned incinerators canceled; 24 in California and 16 in New Jersey alone. Citizens’ science efforts started to counter-act government and industry scientists who state that incineration is safe. Citizens inspire dioxin research that leads to U.S. EPA 1996 confirmation on dangers of dioxin to human immune and reproductive systems.
1986, 1987 — Philadelphia ash ship (1986) and Long Island, New York Garbage Barge (1987) alert nation to grave crisis in discard management. Source reduction and recycling become conventional wisdom.
1985-95 — New rules are imposed by local governments as citizens gain upper hand in local politics over discard management. These include: mandatory residential and commercial recycling, procurement preferences, pay-as-you-throw trash fees, minimum recycled-content product legislation, bans of recyclables from landfills and incinerators, landfill surcharges to acquire capital for investment in recycling infrastructure, bans of specific products. Markets adjust to secondary materials.
1986 — Philadelphia becomes first major U.S. city to mandate participation in recycling programs.
1987 — New Jersey’s “Statewide Source Separation and Recycling Act” signed into law. It set a mandatory recycling goal of 25% by 1990, required counties to develop recycling plans for recovery of leaves and three additional materials, and to hire a recycling coordinator.
1987 — The Berkeley City Council enacts into law the first local ordinance prohibiting use of chlorofluorocarbon-processed food packaging in order to reduce the health hazards created by the manufacture of these products. About 40 local governments in all pass laws restricting use of polystyrene (many of which were later repealed as a result of industry pressure).
1988 — The Florida State legislature signs The Solid Waste Act into law. The law’s centerpiece, the “advance disposal fee” starts out as a 1¢ charge to be levied on every container sold at retail that is not recycled at a 50% rate statewide. (The fee took effect 1992 and sunset in 1995.)
1988 — U.S. EPA publishes its original guideline on buying recycled paper. These guidelines specify minimum recovered-fiber-content levels for a wide variety of paper and paperboard products.
1989 — U.S. EPA releases its Solid Waste Dilemma: Agenda for Action, establishing a national 25% recycling goal for municipal discards and the “solid waste hierarchy,” which prioritizes source reduction, reuse, recycling, and composting over incineration and landfilling. Many states embrace the goal and the hierarchy.
1989-91 — Numerous states pass mandatory recycled-content legislation and landfill bans for specific materials.
1990 — New Jersey revises its recycling goal to 60% of total waste and 50% of municipal solid waste by 1995. (The goal has since been revised to 65% recycling of the state’s total waste stream by December 31, 2000.)

1995 — Wisconsin’s landfill/incinerator bans become effective on plastic, steel, glass and aluminum containers; paperboard; polystyrene packaging; corrugated cardboard; newspaper, magazines, office paper, and other paper; and tires. (Communities determined to have an “effective recycling program” are exempted from the ban.) Wisconsin’s bans are later successfully challenged by the waste industry and no longer apply to out-of-state waste.
1990s — Recycling and economic development issues merge. New institutions and programs emerge including California’s Recycling Market Development Zones, New York State Office of Recycling Market Development (now the Empire State Development Environmental Management Investment Group), California Integrated Waste Management Board, Materials for the Future Foundation, U.S. EPA Jobs Through Recycling program, HUD’s addition of building deconstruction programs to HOPE VI demolition program, expansion of federal procurement preferences.
1994 — California State Supreme Court ruled (Waste Management of the Desert and the City of Rancho Mirage vs. Palm Springs Recycling Center) that recycling cannot be prohibited by an exclusive franchise. This allowed recyclers access to discarded materials in franchise areas controlled by waste haulers.
1995 — GrassRoots Recycling Network formed by the Institute for Local Self-Reliance, members of the California Resource Recovery Association, and members of the Sierra Club Solid Waste Committee. Adopts goal of “Zero Waste or Darn Close To It.”
1997 — Nation reaches 28% recycling of municipal discards. Bottle bill states (29% of the population) account for about half of U.S. beverage container recycling.
1997 — Recycling rates for plastic, aluminum, and glass containers each drop as compared to previous years.
1998 — Nation reaches 9,349 curbside programs and 3,807 yard debris programs. Del Norte County, California, becomes the first U.S. jurisdiction to adopt a zero waste plan.
Source: Neil Seldman, Institute for Local Self-Reliance, “History of Recycling in U.S.,” Encyclopedia of Energy, Technology and Environment (New York: Wiley Brothers, 1995); Beverage Container Deposit Systems in the U.S.-II (Arlington, Virginia: The Container Recycling Institute, 1997); Elizabeth Gallagher, “The Barge Can Stay Home,” BioCycle (June 1989); Elise R. Browne, “Crossing Borders... and Oceans: Philadelphia’s take a cruise, too,” Waste Age (December 1988); Jim Glenn “State of Garbage in America,” BioCycle (April 1999);
Many Communities and Businesses Have Achieved Record-Setting Waste Reduction Levels
More than 100 communities and several hundred businesses and institutions report 50% and higher waste reduction levels.35 (See table on page 35 for select private sector examples.) These “record-setters” are demonstrating that waste reduction levels much higher than the national average can be achieved.
Keys to residential program success include:
• targeting a wide range of materials,
GRRN - 39

• composting yard debris,
• designing programs for convenience,
• using pay-as-you-throw trash fees, and
• requiring resident participation.36
A few communities have endorsed zero waste goals. Del Norte, California, is the first U.S. community to adopt a zero waste management plan. Canberra, Australia (pop. 330,000) is probably the largest city to have a zero waste plan. Its plan aims to eliminate the city’s two landfills by 2010 and replace them with comprehensive “recycling estates.” Other communities are moving in this direction as well. Seattle’s recently revised solid waste plan has adopted zero waste as a guiding principle.37 Halifax, Nova Scotia, has adopted a resource management strategy to achieve zero waste.38 In New Zealand, as of November 1999, 12 councils comprising 15% of the nation’s population have adopted zero waste landfill policies by 2015, and a movement is striving to make the country the first committed to zero waste.39
While zero waste planning may be new at the municipal level, it is not new to many businesses. Bell Canada, Herman Miller (a furniture maker headquartered in Michigan), Southern California Edison, Interface Carpets (GA), and Fetzer Vineyards (CA) all have zero waste goals.40
Composting of Yard Debris Diverts a Significant Portion of the Discards Stream
The number of composting facilities that process yard debris has grown from under 1,000 in 1988 to over 3,800 in 1998.41 Nationally, yard debris represents 13% of municipal discards. But, of course, it can account for much more of a community’s residential discard stream, especially in communities with large lawns and mature trees. Composting yard trimmings is an essential element in striving for zero waste. A recent study of 18 waste reduction record-setting communities indicated that in 11 of these, composting yard trimmings accounted for half or more of all residential waste reduction. Composting levels alone ranged from 17% to 43% of residential discards generated.42
Product Reuse Has Taken Root
Reuse is an age-old practice. Car “junk yards,” thrift stores, and charities such as Goodwill, St. Vincent de Paul, and Purple Heart have long practiced reuse. Now a new generation of product reuse and building deconstruction operations are saving more materials from landfill disposal.
Reuse organizations such as Materials for the Arts (New York City), LA Shares (Los Angeles), Urban Ore (Berkeley), and the ReStore (Montpelier, Vermont) accept a wide range of reusable items from furniture and electronics to books and clothing and even corks and wax from candle stubs.43 They accept items from the public and/or private sectors and then sell or donate items to the general public or select constituencies. A growing trend in many communities are “swap shops,” where residents can leave or take reusable items. Often these are located at permanent recycling drop-off sites. And some vanguard communities, such as Saint Paul,
GRRN - 40

Minnesota, and Fitchburg, Wisconsin, have taken the step of adding reusable household items to their curbside recycling programs.44
Reuse of old buildings through building deconstruction programs is beginning to spread as a method for reducing demolition materials (estimated at 64.8 million tons from building-related demolition activities),45 while recovering materials such as old-growth lumber, doors, windows, and ceiling and floor tiles.
An estimated 200,000 public housing units will be demolished as a result of the U.S. Department of Housing and Urban Development’s HOPE VI program. Hundreds of other government buildings have been slated for removal as a result of military base closures. While deconstruction, as a discard management strategy is relatively new, numerous government buildings have served as demonstrations of the technique and its feasibility. These include Building 901 at the Presidio of San Francisco; barracks at Fort McCoy, Wisconsin; a motor pool building at the Navy FISC in San Diego; public housing units in Riverdale, Maryland, and Hartford, Connecticut; and warehouses at the Twin Cities Army Ammunition Plant in Minnesota.46 Industry experts estimate the U.S. deconstruction industry is growing by 200% per year, and based on Canada’s experience, should to continue to grow for years to come, albeit not at the same rate.47
Pay-as-you-throw Trash Fees Are an Effective Waste Reduction Strategy
The U.S. EPA reports nearly 4,000 communities charge pay-as-you-throw (PAYT) fees for trash, in which residents pay by bag or can for the amount of trash they set out at the curb for pick-up. These systems are not a recent innovation; in fact, Richmond, California, implemented PAYT fees in 1912.48 Recent growth in programs, though, has been spurred by the success of PAYT trash fees in encouraging recycling and waste reduction. Research has indicated that PAYT trash fees contribute to waste prevention or source reduction.49 Other research has shown that when variable-rate programs are combined with frequent curbside collection and drop-off programs for recyclables, the highest recycling rates are achieved.50
Dover, New Hampshire, for example, has experienced impressive results with its PAYT trash program. After instituting per-bag fees for trash, per household trash generation dropped from 6.2 pounds per day to only 4.7 pounds per day, and the city’s residential recycling rate increased from 3% to 52%.51
Disposal Bans Have Spurred Recycling
Forty-seven states ban selected discarded materials from landfills and incinerators. Forty-three of these states ban vehicle batteries; 22 ban some or all yard trimmings. Only Massachusetts, South Dakota, and Wisconsin ban recyclable paper from disposal facilities.52 Some of the bans, such as those targeting batteries, mercury products, and motor oil, serve to keep hazardous materials out of landfills and incinerators. Other bans on materials such as yard trimmings, paper, and containers were designed to encourage recycling of these materials. Indeed, they have been a very effective mechanism. The 22 states with yard debris disposal bans are home to 49% of the U.S. population and 74% of the country’s yard trimmings composting sites.53 In a 1996 survey of state recycling programs, the majority of state managers responding stated that landfill bans have been an effective tool for recycling; 19 checked that landfill bans
GRRN - 41

have been effective in reducing landfilled waste; while 20 agreed they were useful in changing business habits.54
Beverage Container Deposits Have Been Highly Effective
Although many beverage container deposit bills (popularly known as bottle bills) were originally enacted to fight litter, the bills have also been a boon to recycling. Recovery of beer and soda containers is higher in deposit bill states than in the rest of the country. In non-deposit states, approximately 38% of beer and soda containers are recovered. In contrast, 78% are recovered in states where these containers have a refund value. Some deposit states report even high recovery rates for certain containers. Iowa and Michigan, for example, report that 95% of aluminum cans are redeemed.55
GRRN - 42

Select Community Waste Reduction Record-Setters
˛ Ann Arbor, Michigan (pop. 112,000)
City programs recover 47% of household waste. The state’s bottle return law diverts another 5%. The non-profit Recycle Ann Arbor weekly picks up 24 different recyclables and also runs a drop-off station. April through November, city crews collect at curbside grass clippings, leaves, and brush (which are banned from the landfill). The city-owned compost siteearns $38,000 per year from compost and mulch sales.
˛ Bellevue, Washington (pop. 103,700)
Bellevue’s residential waste reduction climbed from 11% in 1989 to 60% in 1996. Its pay-as-you-throw trash system, combined with comprehensive curbside collection, is the heart of the program. Almost two-thirds of customers subscribe to one 30-gallon can or 19-gallon mini-can a week trash service.
˛ Dover, New Hampshire (pop. 26,100)
A pay-as-you-throw trash system is responsible for Dover’s residential recovery level increasing from 3% in 1990 to 52% in 1996. During the same period, per household costs for solid waste management were cut from $122 to $73.
˛ Falls Church, Virginia (pop. 10,000)
After implementing multi-material curbside collection, Falls Church reduced trash collection from twice to once weekly and cut the number of trash crew members from ten to seven. The solid waste management budget dropped from $1.05 million in FY90 to $630,000 in FY97. Falls Church recovers 65% of its residential waste.
˛ Fitchburg, Wisconsin (pop. 17,300)
Fitchburg’s mandatory recycling ordinance and multi-family recycling ordinance were among the first in Wisconsin. It is also one of the few communities collecting clothing, toys, books, small appliances, and housewares at curbside monthly. The town disposed less waste in 1996 than in 1992 despite a nearly 20% growth in households. Per household waste handling costs dropped from $126 in 1992 to $108 in 1996.
˛ Loveland, Colorado (pop. 44,300)
In the early 1990s, Loveland overhauled its waste management system in response to rising worker compensation insurance rates and aging trash trucks needing replacement. Specially designed dual-collection vehicles now pick up recyclables and trash each week. This system along with pay-as-you-throw trash fees and several options for yard debris recovery result in a 56% residential recovery level. The city estimates it saves $100,000 per year through dual-collection as compared to separate trash and recycling collection.
˛ San Jose, California (pop. 873,300)
This culturally diverse urban city diverts 43% of its municipal solid waste. Single-family household diversion levels reach 55%. Residential curbside recycling service to all single-family and multi-family households, PAYT trash fees, weekly year-round residential yard trimmings collection, and financial incentives for businesses to reduce waste drive San Jose’s high recovery levels.
GRRN - 43
About half the beer and soft drink containers recycled in 1998 came from deposit bill states (29% of the population). In all, containers collected through deposit bill systems account for between 5% and 15% of total municipal materials recovery in those states.56
State and Local Recycling Goals and Requirements Have Helped Increase Recycling
Forty-two states and the District of Columbia have enacted formal recycling or waste diversion goals ranging from 20% in Maryland to 70% in Rhode Island. Although a number of states have not met their recycling goals (see pages 43-44), the goals have spurred recycling activities. Most goals were enacted along with other provisions such as disposal bans and grant programs, and serve to confirm state commitment to waste reduction and recycling.
Seven states’ goals include requirements that local governments individually meet the state goals. These include California, Connecticut, New Jersey, and Wisconsin.57
In the years after New Jersey passed its “Statewide Source Separation and Recycling Act,” the state’s recycling rate increased quickly. This act mandated residents and commercial and institutional generators of municipal solid waste recover materials for recycling. In 1986, the year before this legislation passed, the state’s municipal recycling rate was 12%. By 1991, only five years later, the rate had reached 39%.58
Wisconsin is one of the few states that has mandatory residential, commercial, industrial, and institutional recycling programs and the state appears to have succeeded in getting Wisconsinites to recycle. In 1998, 98% of surveyed residents reported they recycled some of their residential trash. Ninety-percent of those surveyed reported their employers provide recycling services in the workplace.59
Local ordinances in particular are effective in spurring recycling activities and private and public sector participation. For example, in 1994, the city of Philadelphia enacted a commercial recycling ordinance and set up a recycling program for its businesses. The program documented materials recycled, ordinance enforcement, and provided technical training to help businesses and commercial establishments set up their own recycling programs. The city’s recycling rate jumped from 10% in 1994 to 29% in 1996. Furthermore, through recycling, Philadelphia businesses saved more than $2 million in 1995 — $1.5 million from sale of materials and $500,000 in avoided disposal costs.60
A study of more than three dozen communities found that fourteen of the nineteen programs with recycling participation levels above 80% were mandatory programs.61
Buy-Recycled Programs Have Increased Demand for Recycled Products
In 1986, only 13 states and a handful of cities and counties had some sort of buy-recycled policy on the books. Five years later, the other 37 states had followed suit and more than 250 local jurisdictions had formal buy-recycled policies.
In June 1988, the U.S. EPA issued its original guideline on buying recycled paper. These guidelines specified minimum recovered-fiber-content levels for a variety of paper and paperboard products. They have since been updated and expanded to other products. Despite the extensive delay in implementation,62 federal guidelines for recycled-content product
GRRN - 44

procurement, particularly the federal numerical standards for defining recycled products, have been critical to effective state and local buy-recycled programs. They have enabled other jurisdictions to readily implement the guidelines. They have provided industry with a clear definition of products that are acceptable, and thus have helped increase production of recycled products that meet the standards.
King County, Washington, has a nationally recognized award-winning program. Like many jurisdictions, it has adopted the federal guidelines as its minimum content standards and updates its standards in accordance with federal updates. King County’s recycled paper purchases have grown from 8% in 1989 to 94% in 1998, exceeding the County’s 60% goal. In 1998, County agencies purchased recycled paper goods valued at $1.6 million.63
Maryland’s and Massachusetts’ buy-recycled programs are among the best state programs. Maryland’s 1977 law required the state to increase its recycled paper purchases (up to 40% in 1985). Currently, more than 95% of the paper the state buys is recycled.64 In fiscal year 1998, Massachusetts purchased $35.3 million in recycled products, up from $2.8 million in fiscal year 1992.65
Minimum Recycled-Content Legislation, ReMarkets for Recovered Materials
Minimum recycled-content legislation, requrecycled-content goods. For example, Californ2000, at least 50% of newsprint used by state pconsumer paper content.66 In 1996, California800,000 tons of recycled newsprint. This surpaof the state’s requirement for the year 2000, acNationally, the average amount of recycled fibe25% in 1997.68
Newsprint is the material most often targeteConnecticut, the District of Columbia, Illinois,all set minimum-content goals or requirementsminimum-content programs include telephone plastic containers, and other paper products. Oplastic containers to maintain a 25% recycling
GRR
Purchasing Decisions Have an Environmental Impact
Consider President Clinton’s Executive Order 13101 directing all federal agencies to purchase copier paper made with 30% recycled content. This decision will result in:
˛ 450,000 to 500,000 fewer trees cut down annually for paper production.
˛ 16,000 tons of carbon absorbed annually by the trees remaining standing.
˛ 12% reduction in energy used in producing copier paper.
˛ 14% average reduction in air emissions and greenhouse gases.
˛ 13% reduction in the amount of solid waste requiring disposal.
˛ 13% reduction in water pollutants.
Source: Recycling...for the future:
quirements, and Goals Have Helped Build
irements, and goals have supported markets for ia’s newsprint law requires that by January 1, rinters and publishers have at least 40% post-’s publishing and printing industry reported using ssed the state’s 1996 goal of 35% and fell just shy counting for 49.3% of total newsprint used.67 r in newsprint has grown from 10% in 1989 to
d by minimum-content policies. California, Oregon, Maryland, Missouri, and Wisconsin have for newsprint. Other materials targeted by directories, glass containers, plastic trash bags, regon and California, for instance, require rigid rate or to contain 25% post-consumer recycled
N - 45

material. Industry has already met Oregon’s requirements. In California, recyclers recovered 21.9% of rigid plastic containers generated in 1997, short of the requirement. In 1998, the state moved to enforce its law by sending out letters to 500 manufacturers at random asking for compliance information.69
New York is one state that has taken a successful voluntary approach to encourage industry to use recycled feedstock. In 1989, the state brought to the negotiating table representatives of eleven companies that together bought or produced more than 80% of all newsprint in the country. New York asked the manufacturers to voluntarily increase use of recycled-content newsprint and offered to help with technical difficulties (for e.g., sponsoring research into the quality of recycled-content paper versus virgin paper). In the 18 months following these negotiations, industry invested $1.5 billion in recycled newsprint deinking capacity in North America.70
Creative Funding Mechanisms Have Boosted Recycling-Based Industries
In the late 1970s, Steve Babinchak wanted to start a plastics recycling company as a way to create jobs for unemployed miners in northeast Pennsylvania. The banks told him it was hopeless to try to raise capital for a plastics recycling business. He nonetheless persevered and opened his business, but he named his company St. Jude Polymer, after the patron saint of hopeless causes.
This experience typifies the experiences of pioneer recycling entrepreneurs. Financing of these companies was an ad hoc affair, falling outside of the mainstream of business financing. Recycling proponents went to their local governments to get access to capital for new recycling companies. Slowly but surely new funding mechanisms were created. These included bond issues, container deposit residuals, litter tax funds, landfill surcharge funds, oil overcharge funds, tax credits and exemptions, and environmental fine reimbursements. By the 1990s, 37 states and the federal government had developed special funding mechanisms such as tax credits, tax exemptions, loans, and grants.71
• Pennsylvania has awarded more than $38 million in funds to companies and local government to expand recycling markets and economic development opportunities. More than 100 Pennsylvania companies now manufacture products with recycled content. These companies represent more than 4% of all manufacturing jobs in the Commonwealth.72
• New York’s Empire State Development Environmental Management Investment Group’s (formerly the Office of Recycling Market Development) multi-million dollar grant program has, to date, created or retained 681 jobs and resulted in the installation or retention of industrial capacity to use 940,000 tons of recycled materials per year.73
• California’s Recycled Market Development Zone (RMDZ) program, administered by the state’s Integrated Waste Management Board, has grown from the initial 12 zones in 1992 to 40.74 To date the program has made 60 loans worth $25.5 million. The results have been the creation or saving of 690 jobs and the annual recycling of 1.6 million tons of materials.75
• The U.S. EPA Jobs Through Recycling (JTR) program has helped spur recycling-based economic development. EPA’s 1994 JTR grantees have leveraged more than $329 million in investment for recycling businesses. These investments have resulted in the development of
GRRN - 46

capacity to process 3.6 million tons of secondary materials a year, assisted more than 1,900 businesses, and created nearly 2,500 new jobs.76
The private sector has also responded to the need for capital sources of recycling. In 1998, the Sustainable Jobs Fund, a community development venture capital fund, was launched with a $10 million pool to invest in recycling and other enterprises that need equity and that benefit low-income communities.77 The U.S. EPA sponsored eight recycling investment forums from 1995 to 1998. As a result of these forums, companies have secured more than $50 million in financing.78
The Private Sector Has Stepped Up to the Plate
The unsung hero in recycling achievements is the recycling-based manufacturer. Our discards are not recycled until they are made into new products and returned to the economy. Most major industries have used recycled materials as their feedstock since their beginnings. For example, paper in the United States was originally made from old rags. Metals of all types always have been remelted and formed into new products. Glass containers, because of their inherent value, were commonly refilled.
In the last decade, the recycling-based manufacturing sector has grown and made important technological advances, allowing greater use
GRRN - 47Examples of Products Made by Recycling-Based Manufacturers
Asphalt
asphalt aggregate
fill
hot mix pavement
hot-mix asphalt modifiers
landfill cover
low-cost pavement
pothole patch
road sub-based
Glass
aggregate
art glass
fiberglass insulation
flat glass
foam glass
glass-bonded tile
glass containers
pressed glass
road sub-base
wastewater filter media
Metals
additives
automobile parts
cans
I-beams
sheet
siding
Paper
animal bedding
bag paper
boxboard
cellulose insulation
Rubber
artificial reefs/breakwaters
asphalt additive
die cut machine par
dock bumpers
erosion control
floor mats
gaskets
highway crash barri
lightweight gravel substitute
playground equipm
polymer oil
rubber railroad cros
ts
ers
ent
sing
shoe soles

of recycled feedstocks. For instance certain paper mills today can now accept paper envelopes with plastic windows because of installation of new screening systems. Glass manufacturers have learned to use higher percentages of cullet — recycled glass — in production of new bottles (although the glass industry abandoned most of the refillable market). Industry has made technological innovations in contaminant removal, color and grade sorting, and utilizing rarely recycled materials.
Other manufacturers are increasing their materials efficiency too. Driven by existing laws, the threat of new legislation, public pressure, and a growing awareness that better environmental performance can be profitable, a number of producers and retailers have redesigned their products and packaging with waste reduction in mind.
• The Mad Brewing Company (Blue Lake, California), for instance, has reduced its waste by 98%. It composts spent grain and hops, reuses and recycles shipping pallets, takes back 6-pack containers, utilizes recycled materials in its products and packaging, and more.79
• SC Johnson Wax has cut its manufacturing waste in half, reduced virgin packaging waste by 25%, and reduced the use of volatile organic compounds by 16%; at the same time, production has increased by more than 50%. The company has realized more than $20 million in annual cost savings.80
• A number of other well-known national companies have embraced packaging and product redesign, reuse, and recycling initiatives. These include Eastman Kodak, Wal-Mart, Hewlett-Packard, Coors, Target, Bodyshop International, Ben & Jerry’s Homemade, Inc., and many others.
While new technologies, redesigned products, and reconfigured processes are increasing the efficiency of resource use and cutting process waste, more can be done. The portion of companies actively pursuing sustainable industrial growth is still quite small.
Recycling Backslides Despite impressive recycling gains since the 1980s, in recent years, evidence that recycling is
backsliding is mounting:
• Corporations have reneged on their public commitments to recycle.
• Less attention is paid to waste prevention through packaging and product redesign and producer responsibility.
• Some states and cities have cut back their recycling programs and budgets.
• A number of states have not reached their recycling goals, nor revisited policies and programs to do so.
Corporations Backtrack on Their Commitment to Recycle
In the early 1990s, following the wave of public demand for recycling and the looming threat of legislation, several industries — most notably the plastics and paper industries — made commitments to recycle.
GRRN - 48

The American Plastics Council (APC, formerly the Council on Solid Waste Solutions) proclaimed a 25% recycling goal for plastic rigid containers. As they phased out recycled-content glass and faced mounting pressure for state minimum recycled-content legislation, Coca Cola and Pepsi committed nationally to making new plastic bottles with 25% post-consumer recycled plastic content. Companies such as Union Carbide, Occidental Chemical, and Amoco invested in plastics recycling systems for high-density polyethylene (HDPE), polyvinyl chloride (PVC), and polystyrene, respectively. The National Polystyrene Recycling Company, a consortium of seven polystyrene manufacturers, announced a $14 million plan to recycle 25% of all disposable polystyrene products by 1995. All of these commitments to recycling have since been abandoned.81
• In 1996, the American Plastics Council abandoned its self-proclaimed 25% recycling goal for plastics. Between 1992 and 1995, it spent $18 million on advertising plastics’ benefits and another $20 million in 1996, supplemented by still another $2 million from individual plastics producers. During this time, the APC had to sign a consent decree and pay a fine to 11 states attorneys general for deceptive advertising. In 1999, APC eliminated its recycling staff position.
• In 1996, Union Carbide and Quantum Chemical, which make HDPE for milk and other bottles, sold their recycling plants. Amoco, too, sold its polystyrene facility, which shortly thereafter discontinued operation. Occidental Chemical sold its PVC bottle recycling facility to a small firm and promised to buy that company’s output of recycled PVC. Occidental soon reneged on its promise and the small company dropped recycling PVC. The Vinyl Institute now tells callers that it no longer deals with recycling.
• In 1996, the Rutger’s Center for Plastics Recycling Research in New Jersey closed its doors when funding vanished. The Center was previously supported by plastic resin companies.
• Coca Cola and Pepsi discontinued making plastic bottles from recycled content three years after introducing them in the U.S. (while continuing to use recycled content in Europe, Australia, and elsewhere).
• In 1996, industry pressure led the California Legislature to amend the state’s minimum recycled-content requirements for rigid plastic containers by exempting food and cosmetic containers.
Newsprint producers, many of which control extensive virgin timber holdings, have also retreated from recycling. Minimum-recycled-content legislation spurred the paper industry to invest in deinking mills in the early 1990s. As a result, the average recycled content of newsprint in North America has increased from 10% in 1989 to 25% in 1997.82 However, beginning in 1995, paper mills stopped adding the necessary capacity to meet each year’s higher state recycled-content goal. The various state laws and policies call for an average 38% recycled content in newsprint by 2002. Ironically, newsprint mills justify their inability to meet standards above 25% because the capacity for handling recycled paper does not exist.83
Corporations that oppose and undermine recycling efforts in the United States survive — indeed thrive — under recycling, mandatory recycled-content, and producer responsibility systems in Europe and Asia. What beverage and petrochemical giants oppose in the United States, they often make part of their business plan (and bottom line) in other parts of the world.
GRRN - 49

Waste Prevention Garners Lip Service
While waste prevention, or source reduction, tops the discard management hierarchy, it does not garner the commensurate dollar resources or attention as other solid waste management strategies.
At the root of our wasting woes are the types and amount of products and materials we use and discard. Single-use products, which are designed to be thrown away after one use, constitute a substantial portion of total municipal discards generated. In 1997, 33% by weight of all municipal discards consisted of packaging and containers, and an additional 10% consisted of disposable products such as paper and plastic plates and cups, disposable diapers, third class mail, trash bags, and tissue paper and towels.84
While other industrialized countries, such as Germany and Canada, have national policies to reduce and recycle packaging, the U.S. has none. Twenty-eight countries now have take-back laws for packaging.85 In Canada, the National Packaging Protocol (established in 1990) asks manufacturers to voluntarily reduce packaging by specified amounts: reduce packaging disposed to 80% of the 1988 level by December 31, 1992; 65% by December 1996; and 50% by 2000. If the targets are not met, a regulatory framework was to be implemented.86 A recent survey commissioned by the Canadian Council of Ministers of the Environment indicates that the 2000 goal has already been met. In 1996, Canada diverted 52% of packaging from landfills.87
U.S. states have yet to implement comprehensive source reduction strategies, although a number have established source reduction goals.
Few communities have established comprehensive source reduction goals, partly because source reduction is more difficult to measure than waste diversion through recycling and composting. States’ recycling goals, which frequently determine local recycling goals, rarely include measurement of source reduction. In many instances, communities do not receive credit toward their state diversion goal for implementing source reduction programs. In addition, communities frequently lack control over decisions regarding product design and manufacture, and have little guidance on how to bring about changes in the discard stream.
States and Cities Back Away from Recycling
Some governments have backed away from previous recycling programs and commitments. Perhaps the most drastic step back was taken by Maine in 1995, when it eliminated its Waste Management Agency.88 State grant aid for recycling programs has also been dropping in recent years. In 1995, 40 states distributed nearly $245 million in recycling grants.89 By 1997, 33 states distributed only $183 million in grants.90
States have also delayed effective dates of minimum-content requirements and rescinded other recycling requirements. Of the 14 states with mandatory programs, only 10 still maintain them, and four have delayed their goals. No states with expired goals have reinstituted them.91 In 1997, Connecticut eliminated its requirement that directory publishers file a plan to collect and recycle their directories. In the same year, Maryland extended its deadline for users of newsprint to reach 40% recycled content to 2005 and Oregon delayed the enforcement of its glass recycled-content law so manufacturers do not have to reach 35% until 1999 and 50% by 2002.92 In Wisconsin, a number of communities have sought and received waivers from the statutory landfill bans because they cannot find markets for their recycled materials — especially
GRRN - 50
plastics. Moreover, during the 1999 budget bill debates, the Wisconsin Assembly voted to repeal the landfill bans, which lay at the heart of the state’s recycling programs.93
In a 1998 survey of state recycling programs, 12 states reported that one or several local recycling programs had dropped glass from its curbside program for market reasons. Programs in six states have stopped collecting plastics. Ohio reports it has lost whole programs. (In the 1997 survey, 11 states reported dropping glass from some programs; seven dropped mixed paper and six eliminated collection of mixed paper.)94 New York City cut its curbside recycling program from weekly to biweekly and made drastic cuts in its recycling public education budget. Approximately $38 million was eliminated from the budget. In recent years, Washington, DC, twice suspended its recycling program, citing budget shortfalls. Citizen pressure brought the program back. In Philadelphia, the recycling program is languishing without administrative leadership since the recycling coordinator left. There are no plans to fill the position. New York state may have similar problems: about half the recycling coordinator positions in the state have been eliminated.
States Did Not Reach Their Recycling Goals
Eleven states failed to reach their recycling goals by the deadlines they set for themselves (see table next page). Five of these states (Idaho, Louisiana, Mississippi, Montana, and Nevada) had recycling goals of 25%, less than the current national recycling rate. Most are not even close. Montana’s 1997 rate was only 5%. The other six states had set their goals at from 40% to 50% and with the exception of the District of Columbia, all have achieved recycling rates within 10% of their goals.95
Conclusion We have made great progress in recycling in the last fifteen years. Citizens, government, and
the private sector all deserve credit. Curbside household recycling programs, increased recycling in the commercial sector, technological developments in the recycling-based manufacturing industry, and strong public policies have brought the nation to a 28% recycling level of municipal discards, and more has been done to reduce and recycle industrial process waste. Yet, despite these advances, more can and must be done to achieve a sustainable materials economy. In fact, there is ample evidence indicating recycling has backslid in recent years, pointing to the need to reinvigorate citizen activism and maintain and expand public policies to reduce waste and increase materials efficiency. Particularly needed are policies to level the playing field so recycling can out-compete wasting.
Recycling activism has a proven track record for changing the rules. In the 1980s, citizens saved the country billions of dollars by defeating hundreds of proposals for waste incinerators and pushing for better alternatives. Recycling will likely continue to backslide unless citizens get involved again. This is a critical time for renewed activism. Recycling is a gateway for other environmental activities and for sustainable and healthy local communities and economies.
GRRN - 51

agenda for action We are living through what John Naisbitt, author of Megatrends, has described as a
parenthesis of history — an in-between time when the old ways of doing things have become too expensive, but when we have yet to fully develop new regulations, new laws, new ethics, new organizational structures, and new technologies to construct a new order.
We have the technical ability to move toward a zero waste society. We need only to muster the political will to make it a reality. It is now time to take stock of where wasting and recycling stand, what our vision for the future of America is, and how we can begin to move toward realizing that vision. Most of the elements needed to achieve sustainable communities now exist in some form, in some community. Weaving these elements into a workable and comprehensive strategy is the challenge. What are the next steps?
One vital next step is altering the rules at the federal, state, and local levels of government in order to send signals to the marketplace that reflect the priorities we want. Currently, the rules governing the marketplace favor a one-way flow of materials from the extractor or harvestor of virgin resources, to the producer, to the consumer, to the landfill or incinerator. Public-sector intervention is needed to fashion a system in which resources are conserved and materials are produced and utilized sustainably with minimal environmental and public health impacts.
Many stakeholders in the materials disposal arena believe the unfettered marketplace works best in solving our wasting problems. But the marketplace already consists of rules governing economic activity. In the midst of the Depression of the 1930s, the marketplace did not work for many people, so the 30-year home mortgage was invented. This changed the marketplace to allow for family economic stability. Similarly, our leading industries from mining to transportation, to banking and finance, to the Internet and sports teams, all push the government to make rules that favor their interests.
Recycling came of age in the last decade and a half due to citizens organizing at the local level to change the rules: mandatory recycling, recycling finance mechanisms, material disposal bans, minimum recycled-content products, favorable procurement regulations, beverage container deposits. This was the infrastructure of policies and regulations that brought us as a nation from 6% municipal recycling in 1968 to 28% in 1997.
If we want to approach zero waste, we have to alter the rules to create a marketplace in which resource conservation and waste reduction are rewarded and wasting becomes economically painful and socially frowned upon.
This Agenda for Action suggests specific policies that federal, state, and local governments might alter or introduce in order for resource efficiency and recycling to reach their full potential in the United States.
Corporations and private citizens also have important leadership roles. Following the policies suggested for government, we propose some steps that businesses and citizens can take to bring us closer to our zero-waste goal.
GRRN - 52

We view the actions outlined below as a work in progress; they are not intended to be final, but rather to start a dialogue. We welcome response to these ideas and participation in the conversation.
GOVERNMENT ACTION — CHANGING THE RULES Government’s role in managing discards has traditionally been viewed as a sanitation issue.
But our goals are no longer simply to pick up and take away discarded materials at curbside. Rather, we aim to reduce wasting through product and packaging redesign, to develop the means to reuse and recycle what is left, and to make fundamental economic reforms so resource conservation out-competes wasting. To this end, government’s role needs to shift to changing the rules and requiring internalization of true costs. Each level of government — federal, state, and local — has an important role.
We propose an interconnected four-part government strategy for moving toward zero waste:
• level the economic playing field so resource conservation and waste reduction businesses can out-compete wasting industries,
• make manufacturers share responsibility for their products, from cradle to cradle,
• develop holistic resource management systems, and
• build the reuse and recycling infrastructure.
Level the Economic Playing Field for Resource Conservation
The marketplace works well when it relies on accurate price signals, but today the prices we pay for many of our goods and services do not fully reflect the cost of providing them. The prices of virgin materials exclude billions of dollars in taxpayer subsidies. The price consumers pay for products do not account for the true costs these goods impose on the environment and public health. Landfill prices do not reflect the costs of landfill maintenance beyond 30 years. The fees taxpayers and ratepayers pay for waste disposal services do not account for most environmental and social costs imposed by landfills and incinerators.
Public sector intervention is needed to alter the economic equation so waste prevention, reuse, and recycling can out-compete wasting every time. The following government actions and policies will help level the playing field between recycling and wasting and send more accurate price signals to the marketplace.
Federal and State Action:
• Identify and alter tax policies that enhance polluting industries and products at the expense of more environmentally benign systems and goods. Shift taxes from income and labor (“goods”) to resource depletion, wasting, and polluting activities (“bads”).
• End federal and state subsidies for virgin materials extraction, processing, and manufacturing.
GRRN - 53

• Eliminate mining byproducts’ exemptions from hazardous waste rules.
• Make landfill prices reflect their true costs. Revise the Resource Recovery and Conservation Act (RCRA) and revamp federal Subtitle D regulations to require landfills to minimize air emissions and protect groundwater resources in perpetuity.
• End subsidies for wasting facilities (such as tax breaks provided by private activity bonds and guaranteed markets for electricity from waste incinerators through the Public Utilities and Regulatory Policy Act).
• Identify and implement mechanisms that internalize environmental and social costs into market prices (for example, mechanisms that incorporate the cost of disposal in the price of products). National advance disposal fees or deposits on products are two options that have proven successful.
• Promote full-cost accounting techniques for evaluating discard management options that take into account remediation, contingent, environmental, and social costs. A full-cost accounting system might reveal that the cost of doing business the traditional way exceeds the cost of less harmful alternatives, and it would therefore provide rewards for alternatives.
• Promote full-value accounting techniques. Full-value accounting should account for the value captured by the local and state economy, such as recycling job and business creation, local community development, and diversified economies.
• Implement campaign finance reforms. Much of the political opposition to changing resource policies is funded by industries that profit from virgin resource extraction and from wasting.
Local Government Action:
• Institute full-cost accounting techniques in evaluating and implementing discard management programs, especially techniques that account for remediation, contingent, environmental, and social costs.
• Allow for-profit and nonprofit recyclers to compete with waste disposal companies and facilities for the supply of discards.
• End hidden subsidies for wasting (such as fees on property owners to subsidize incinerators).
Make Manufacturers Share Responsibility for Their Product and Packaging Waste
Manufactured goods make up 76% of municipal materials discarded.1 Thus, manufacturers have a special duty to lessen the burden of municipal discards on local government and taxpayers by accepting responsibility for their products and packaging. Indeed, manufacturers are best positioned to alter the way products are designed, manufactured, delivered, reused, and recycled throughout their lifecycle.
An emerging movement within industry is promoting the idea that waste equals inefficiency. But if asking for producer responsibility is not effective, we must change rules and laws to require such behavior. Extended producer responsibility (EPR), based on the "polluter pays"
GRRN - 54

principle, entails making manufacturers responsible for the entire lifecycle of the products and packaging they produce, from cradle to grave — or preferably, from cradle to cradle.
EPR provides the missing link between product design and recycling — a link that is the key to making zero waste efficient and economical. Recent EPR efforts aim to make manufacturers responsible for the take-back, recycling, and final disposal of their products. EPR programs typically require recycling and reuse and often contain mandated recycling targets.
One drawback of some take-back programs is their potential adverse impact on local reuse and recycling operations and other small-scale businesses. Take-back programs may in effect create longer distribution lines, concentrate economic power and productive capacity, and further a materials economy that is not locally or regionally based. For example, if computer manufacturers are required to take back discarded computers, many small-scale electronics recycling and reuse operations may close their doors. Thus, we face the challenge of fashioning rules that meet the twin objectives of manufacturer product responsibility and sustainable community development.
GRRN - 55

Producer Responsibility Policies Commonplace Outside the U.S.
Many industrialized countries have or are pursuing extended producer responsibility (EPR) rules: Austria, Germany, Belgium, France, the Netherlands, Sweden, Japan, Taiwan, Korea, the United Kingdom, and Canada. Emerging policies from these countries target a wide range of products including packaging, paper goods, electronics, office machinery, cars, tires, furniture, electric appliances, buildings and construction materials, batteries, and household hazardous materials. It is time EPR garnered similar attention in the United States.
Refillable container requirements
Many European countries and regional jurisdictions (most notably in Canada) have made these laws standard practice. The U.S., at the local, state, and national levels, may be able to pass similar laws.
˛ Denmark has legislated against the use of non-refillable beverage containers and requires deposits on refillable ones. The country banned "one-way" soft drink containers in 1977 and one-way beer containers in 1981.
˛ The Finish government has set a limit for the percentage of non-returnable beer containers at 10% of total sales. It has also imposed a tax on all non-reusable beer and soft drink containers. In Finland and Denmark, as many as 99% of the soft drink, beer, wine, and other beverage containers are refillable.
˛ Prince Edward Island, Canada, mandates that all packaged beer, soft drinks, and wine coolers be sold in refillable bottles.
Bans on products and packaging that cannot be reused, repaired, recycled, or composted
˛ In 1990, the Swedish Ministry of the Environment and Energy, the packaging industry, and retailers reached a voluntary agreement to cease using polyvinyl chloride (PVC) for packaging manufactured in Sweden.
˛ Sweden has also prohibited the use of disposable PET containers, although it permits refillable PET bottles carrying a deposit.
˛ A Swiss law bans plastics containers unless their disposal will meet standards for five hazardous substances (lead, cadmium, bromine, fluorine, and chlorine). This provision essentially bans the use of PVC containers.
˛ In Taiwan, the federal Environmental Protection Agency mandates that discarded polystyrene foam be recycled. If its recovery rates falls below 50% in the first year, polystyrene foam will be banned from use in the country.
˛ In Germany, more than a dozen towns have banned disposable products at public festivals, spurring development of new businesses offering decentralized mobile washing units for reusable dish and cupware.
Packaging reduction guidelines and ordinances
A number of industrialized countries — including Germany, Canada, Australia, New Zealand, Belgium, and the Netherlands — have passed packaging reduction guidelines or regulations.
˛ The Canadian National Packaging Protocol is a good voluntary model and has already diverted 52% of packaging from landfills.
˛ The Netherlands Packaging Covenant (1991) aims to recycle a minimum of 60% of used packaging that cannot be reused. The covenant places a priority on refillable packaging. The use of asbestos and PVC in packaging is banned. Bans exist on landfill disposal for more than 30 types of discarded materials. The Dutch covenants are backed by mandatory regulations if industry does not act voluntarily.
˛ Germany’s mandatory packaging ordinance has resulted in a 13% drop in per capita consumption of packaging from 1992 to 1997. This compares to the 15% increase in per capita packaging use in the United States during the same time period.
Sources: Beverly Thorpe and Iza Kruszewska, "Strategies to Promote Clean Production – Extended Producer Responsibility" (Montreal: Clean Production Action, January 1999); Scott Chaplin, "The Return of Refillable Bottles," BioCycle (June 1992), pp. 70-71; "Assessing the Impacts of Production and Disposal of Packaging and P blic Polic Meas res to Alter its Mi " CGS/Tell s Packaging St d Literat re and P blic
GRRN - 56

Federal and State Action:
• Provide leadership in extending manufacturers’ responsibility for their products and packaging. Reinforce EPR with information and education in addition to legislation and economic reforms.
• Require beverage containers be sold in refillable packaging. Deposit/
refund regulations on refillable beverage containers represent a seasoned and successful EPR strategy.
• Institute other regulatory mechanisms that embody EPR such as minimum recycled-content standards, secondary materials utilization rate requirements, and materials and product bans and restrictions. Consider take-back schemes that will not hamper community-based reuse and recycling efforts.
• Ask manufacturers to voluntarily reduce packaging and meet minimum recycled-content standards for products and packaging (including but not limited to writing and printing paper, building materials, road construction materials, and beverage containers) by specified amounts by certain target dates.2 If goals are not met, institute a regulatory framework.
• Institute economic mechanisms that embody EPR. These include advance disposal fees, virgin material taxes, removing subsidies for virgin materials, deposits/refunds, and environmentally preferable product procurement.
• Institute information mechanisms that embody EPR such as product labeling. Product hazard warnings, product durability labeling, product environmental lifecycle profiles, and environmental information labeling would individually or together help consumers make informed decisions about the impact of their purchasing.3
Local Government Action:
• Pass producer responsibility resolutions calling on producers to share the responsibility for their products and on state and national legislatures to adopt legislation to shift the burden of managing discarded products and packaging from local governments to the producers of those products. The Town of Carrboro, North Carolina, was the first U.S. community to pass such a resolution.4
• Pass local ordinances banning use and/or sale of certain types of materials that cannot be reused, repaired, recycled, or composted. Berkeley, California; Newark, New Jersey; and Portland, Oregon have all passed such ordinances.
• Press local government associations such as the Conference of Mayors, the National League of Cities, and the National Association of Counties, to push for EPR at the state and federal levels.
Develop Holistic Resource Management Systems
In order to solve the problem of resource wasting, we need to address policies that promote the efficient use of resources. Most recycling advocates focus on recycling’s benefits in diverting materials from landfills and, more recently, in contributing to local jobs and businesses.
GRRN - 57

Few effectively link recycling with its upstream benefits of conserving resources and reducing pollution. The converse — wasting’s role in causing us to extract and process more virgin resources — is similarly overlooked.
We need to break out of our narrow focus on "integrated waste management" and on our often too narrow focus on achieving a certain recycling level. Our ultimate goal is not simply to achieve 25% or 50% recycling, but to reduce pollution and build sustainable communities. Resource conservation, materials efficiency, waste prevention, reuse, and recycling are all integral components of a sustainable economy. We need to adopt effective policies for reducing consumption, increasing materials efficiency, and substituting renewable for non-renewable resources.
Resource conservation and efficiency are our upstream path to meeting our sustainability goals. Aiming for zero waste is our downstream path. Government can go a long way toward instituting a materials efficiency and resource conservation policy. Elements of such a policy would include full-cost accounting, full-value accounting, benchmarks to evaluate progress, and tracking model initiatives.5 These and other possible government initiatives are listed below.
Federal, State, and Local Government Action:
• Broaden focus of waste reduction efforts beyond "municipal solid waste" to encompass other types of wasted materials, which need to be part of the waste reduction agenda. About 11 billion tons of materials are wasted each year. The environmental and economic implications of these wasted materials, particularly mining and industrial materials, are critically important.6
• Adopt zero waste management plans with waste elimination goals as well as recycling goals. Become models for the private sector to emulate.
• Require brand owners to include labels on products that show recycled content and key environmental impacts. This will help educate the public and allow them to make better informed choices.
• Connect waste prevention, reuse, and recycling to sustainable development initiatives and agendas. Partner with organizations involved with sustainability issues.
• Expand recycled product procurement programs to environmental preferable product procurement (programs, for instance, might encourage procurement of products that minimize packaging and materials use).
• Establish full-cost and full-value accounting techniques (mentioned under Level the Economic Playing Field, page 47).
• Track model initiatives so that we can learn from others. We need a formal mechanism for monitoring and evaluating developments in other places, for codifying and storing this information, and for developing inexpensive retrieval systems to allow access by citizens, governments, and businesses.
• Develop measuring tools to evaluate progress. Benchmarks of success can monitor improvements in waste prevention, materials efficiency, recycling, use of renewable resources, and value-added.
GRRN - 58

• Educate, educate, educate. Undertake public educational campaigns to link preventing, reusing, and recycling municipal discards with its upstream and downstream benefits and its place within a sustainable economy.
Federal Action:
• Track the economic and environmental impacts of resource consumption and wasting. Document the impact on industrial waste of recycling municipal discards.
• Develop a national database (like the Toxics Release Inventory) to report materials and energy consumed and wasted. Require industry to report wasted materials.
• Develop a national labeling system, similar to the nutritional labeling system on food products, that provides factual information to the public on every product’s: resource consumption, toxics generated, recycled-content, reusability or recyclability, and general impact on the air, soil, and water.
• Appoint and fund a materials czar (similar to the drug czar) who can serve as a national spokesperson raising awareness on and promoting solutions to our resource conservation and wasting problems.
Build the Reuse and Recycling Infrastructure
The reuse and recycling industry is not new. By 1967, the United States already had some 8,000 companies with 79,000 workers and $4.6 billion in sales.7 We still have a vibrant reuse and recycling industry. Many businesses such as scrap dealers, paper mills, and textile processors are family owned and have been in business for generations. In the last decade, the recycling-based manufacturing sector has grown and made important technological advances, allowing greater use of recycled feedstocks, particularly post-consumer feedstocks.
State and local policies have positively influenced the strong reuse and recycling infrastructure we see today. But more can be done. In light of recent trends that point to more wasting and a backsliding in recycling, renewed attention to building the reuse and recycling infrastructure is critical. The following policies will help develop the means to reuse and recycle discarded materials, further stimulating recycling-based and reuse-based economic development.
Federal, State, and Local Government Action:
• Expand recycling market development efforts with an eye toward closing the loop locally (i.e., within the local economy), producing high-value end products, and linking recycling-based economic development with a larger vision of sustainable community development. Avoid a narrow focus on "waste management," which limits potential partners who can help foster recycling as a cornerstone of a sustainable materials economy.
• Require deposits on a wide range of products. Ten states have beverage container deposit laws and several require deposits on tires, batteries, and appliances.
• Establish landfill and incinerator surcharges to finance investment in waste prevention, reuse, and recycling.8 A national disposal surcharge may be in order.
GRRN - 59

• Implement or expand existing buy recycled programs.
• Launch a public information campaign that will allow consumers to make smart choices when making purchases.
Federal Action:
• Fund research and development to continue to identify new technologies and innovative ways to turn used materials into useful new products. Provide research dollars and support to fund both the upstream process and product redesign component and the downstream material handling, separation, and recycled product development components.
• Congress should revise the Commerce Clause of the U.S. Constitution to give states and local communities authority to ban other states’ and communities’ waste (do not accord waste the same respect as other forms of commerce). This will force jurisdictions to focus on in-state waste reduction solutions.
• Adopt a national beverage container deposit law that requires a high portion of refillables. Refillable containers are significantly more environmentally friendly than recyclable containers.
• Ensure implementation of the federal government’s existing buy recycled product procurement programs. Develop purchasing guidelines for all products (including construction materials) and services purchased by governmental bodies and their contractors. Purchasing guidelines should consider the total environmental impact of the products’ lifecycles.
• Establish a national recycling investment tax credit.
• Foster recycling-based economic development through grants, low-interest loans, and loan guarantee programs.
• Require building material reuse and salvage (deconstruction) in federal projects (such as in the U.S. Department of Housing and Urban Development’s public housing demolition program).
State Action:
• Adopt a zero waste goal and provide leadership, dialogue, and information on how to achieve it.
• Invest in resource conservation and recycling- and reuse-based businesses. Expand market development efforts, especially community-based recycling economic development policies and strategies. Support recycling-based economic development through grants, low-interest loans, loan guarantee programs, tax credits, technical assistance, research and development, and other initiatives.
• Institute or expand existing beverage container deposit systems. Amend laws to require refillable containers, starting with soft drink and beer containers.
• Ban products and packaging that cannot be reused, repaired, recycled, or composted.
GRRN - 60

• Require counties and municipalities to institute pay-as-you-throw trash fees. Per-bag or per-can fees for trash are a direct economic incentive for residents to throw away as little as possible and recycle as much as possible.
• Create regional waste exchanges. A waste exchange involves one company giving or selling its discards to another company, which in turn uses the material for another purpose. Government agencies can set up and facilitate waste exchanges.
Local Government Action:
• Adopt a zero waste goal and provide leadership, dialogue, and information on how to achieve it.
• Retain authority over the collection and handling of municipal discards so that haulers undertake, encourage, and invest in recycling.
• Acquire public property for reuse, recycling, and composting in order to provide a stable land base for eco-industrial parks and reuse and recycling facilities. Establish “discard malls” and lease space to private sector tenants, the same way airports are usually run.
• Ban recyclable and reusable materials and products from landfills and incinerators.
• Institutionalize pay-as-you-throw trash fees.
• Support local nonprofit or for-profit mission-driven recyclers and reuse operations. Community-based recyclers are in business for the good of the community and often provide services that the market undervalues.
• Ban single-use disposable products from public events and festivals.
• Improve recycling levels by targeting a wide range of materials for recovery, providing convenient collection service for reusable, recyclable, and compostable materials, offer service to all households, stimulate recycling in the commercial and institutional sectors, establish incentives for participation, and educate, educate, educate.
• Institute building policies that require reuse and recovery of building materials in new construction and in building demolition projects (deconstruction).
CORPORATE ACTION — ACCEPTING RESPONSIBILITY FOR PRODUCTION AND CONSUMPTION
Manufactured goods account for about three-quarters of our municipal discards and a good deal of the pollution impacting our air, soil, and water. We cannot hope to achieve zero waste and sustainable communities without leadership and cooperation in the private sector, particularly the manufacturing industries. Businesses that show leadership in resource conservation and moving toward zero waste will reap significant rewards. They can simultaneously clean up their own environments and strengthen their internal economics. And in doing so, they can develop new technologies and knowledge that will become an attractive export as other parts of the country and world adapt to the needs of a new age.
(Several organizations provide assistance to businesses interested in reducing waste and increasing materials and resource efficiency.9)
GRRN - 61

CITIZEN ACTION — ORGANIZE AND PRESS FOR CHANGES
No Agenda for Action can work unless there is leadership and organization for achieving it. Since the 1960s that leadership has come from grassroots citizen organizations, which literally turned the nation’s discard management paradigm around 180 degrees: from disposal-oriented policies to reduction, recycling, and economic-development-oriented policies.
Wasting will likely continue to increase and recycling to backslide unless citizens get involved again. Citizens can take the following steps to promote zero waste and resource conservation:
• Make your voice heard.
• Join a local or national public interest or environmental group (such as the GrassRoots Recycling Network) and work to get zero waste, extended producer responsibility, and recycling issues on its agenda (if they are not already).
• Press local government to pass producer responsibility resolutions and to improve waste prevention, reuse, and recycling programs.
• Press state officials to pass extended producer responsibility policies.
• Do not buy products from wasteful corporations.
• Write letters to the editor.
• Support mission-based local reuse, recycling, and waste prevention groups.
• Focus on renewable resources and do more with less.
• Avoid over-packaged products. Buy durable, reused, recycled, reusable, and recyclable products and packaging.
• Inform product manufacturers of intent to buy only reusable, recyclable, and recycled-content products.
• Participate in reuse and recycling programs.
• Compost yard trimmings and food scraps.
With renewed efforts, citizens can build on past experiences and use resource efficiency and recycling as a gateway for an ample and environmentally sound life in the United States and around the globe.
GRRN - 62

footnotes Introduction
1. Jonathan Loh et al., Living Planet Report 1998 (Gland, Switzerland: World Wildlife Fund International, 1998), available on WWF’s Web site: <http://www.panda.org>; and The World Resources Institute, The United Nations Environment Programme, The United Nations Development Programme, and The World Bank, World Resources 1998-99: A Guide to the Global Environment (New York: Oxford University Press, 1998).
2. John E. Young and Aaron Sachs, The Next Efficiency Revolution: Creating a Sustainable Materials Economy (Washington, DC: Worldwatch Institute, September 1994), p. 11; tons of household materials thrown away based on average life span of 76.5 years (from the National Center for Health and Statistics) and discarding 4 pounds of materials per day per person.
3. Jonathan Loh et al., Living Planet Report 1998, p. 1.
4. U.S. EPA, Office of Pollution Prevention and Toxics (OPPT), 1997 Toxics Release Inventory Public Data Release (Washington, DC: April 1999), p. 4-7, available on the Web at: <http://www.epa.gov/opptintr/tri/tri97/drhome.htm>.
5. Jonathan Loh et al., Living Planet Report 1998, p. 2.
6. U.S. EPA, Characterization of Municipal Solid Waste in The United States: 1998 Update EPA530-R-99-021 (Washington, DC: U.S. EPA, September 1999), p. 5.
7. Ibid.
8. Ibid., p. 67.
9. Based on data reported in David R. Berg and Grant Ferrier, Meeting the Challenge: U.S. Industry Faces the 21st Century/The U.S. Environmental Industry (Washington, DC: Office of Technology Policy, U.S. Department of Commerce, September 1988), p. 20. 1996 revenues for the solid waste industry in the United States totalled $57.4 billion: $33.9 billion for solid waste hauling and disposal, $100 million for analytical services, $110 million for consulting and engineering, $8.4 billion for waste management equipment, and $13.9 billion for resource recovery. Excluding resource recovery, revenues totaled $43.5 billion in 1996.
10. Mari Bari, The Solid Waste Industry (New York: Deutsche Morgan Grenfell, October 1, 1997), p. 79.
11. Haakon Vennemo, Miljøkostnader Knyttet til Ulike Typer Avfall (Environmental Costs Associated with Different Types of Waste) (Oslo, Norway: ECON Energi, 1995).
12. Brenda Platt and Kelly Lease, Institute for Local Self-Reliance, Cutting the Waste Stream In Half: Community Record-Setters Show How, EPA530-R-99-013 (Washington, DC: U.S. EPA, June 1999).
13. In the 1996 presidential elections, 96.5 million Americans voted. (See Citizen’s for True Democracy Web site at <www.truedemocracy.org>, browsed August 1999.) Curbside recycling programs serve about 135.5 million Americans (see Jim Glenn, “The State of Garbage in America,” BioCycle, April 1999), and millions more are served by drop-off programs and/or
GRRN - 63

have access to recycling through workplaces. Jerry Powell, editor of Resource Recycling, who originated the quote that “More Americans recycle than vote, thus recycling is more popular than democracy,” points to the fact that participants in deposit-law systems alone represent 29% of Americans, and additional curbside efforts in non-deposit states probably account for another 30% of Americans. In contrast, the portion of eligible voters who voted in the 1996 presidential elections was 49%. Jerry Powell (Editor, Resource Recycling, Portland, Oregon), personal communication, September 7, 1999.
The State of Wasting
1. Jim Glenn, “The State of Garbage in America,” BioCycle (April 1992), pp. 46-55.
2. U.S. EPA, Characterization of Municipal Solid Waste in The United States: 1998 Update EPA530-R-99-021 (Washington, DC: U.S. EPA, September 1999), p. 5.
3. David Morris (Institute for Local Self-Reliance, Minneapolis, Minnesota), personal communication, July 1999.
4. David Morris (Institute for Local Self-Reliance, Minneapolis, Minnesota), personal communication, July 1999.
5. Based on data reported in David R. Berg and Grant Ferrier, Meeting the Challenge: U.S. Industry Faces the 21st Century/The U.S. Environmental Industry (Washington, DC: Office of Technology Policy, U.S. Department of Commerce, September 1988), p. 20. 1996 revenues for the solid waste industry in the United States totalled $57.4 billion. Excluding the $13.9 billion for resource recovery, revenues for trash collection and disposal were $43.5 billion: $33.9 billion for solid waste hauling and disposal, $100 million for analytical services, $110 million for consulting and engineering, and $8.4 billion for waste management equipment.
6. U.S. EPA, Characterization of Municipal Solid Waste in The United States: 1998 Update, p. 5.
7. Ibid.
8. Ibid.; Marge Franklin (McLaren/Hart, Inc., Prairie Village, Kansas), personal communication, July 1999; and United States Census Bureau, Historical National Population Estimates: July 1, 1900 to July 1, 1998 (Census Bureau Web page <http://www.census.gov/>, browsed August 1999).
9. David Smith (Georgia Department of Community Affairs, Atlanta, Georgia), personal communication, July 1999; Michelle Cole, The Oregonian (Portland, Oregon), Tuesday, October 12, 1999; MN Office of Environmental Assistance, SCORE survey data from counties (1999) and MN State Demographer’s Office (1999); and Washington State Department of Ecology Solid Waste and Financial Assistance Program, Solid Waste in Washington State: Seventh Annual Status Report Publication No. 98-504 (Olympia, Washington: December 1998), pp. 75-6. In Georgia, for example, pounds of discards generated per capita per day have grown from 7.35 in FY97 to 7.7 in FY98. Total tonnage discarded has increased from 9.9 million tons in FY97 to 10.75 million tons in FY98. In Oregon, recent data from the Oregon Department of Environmental Quality indicate that for the seventh consecutive year, the amount of garbage per person has increased (7.2. pounds per person per day in 1998, up from 7.0 pounds in 1997 and 5.7 pounds in 1992). In Minnesota, 1.1 million tons of municipal discards were landfilled in
GRRN - 64

1998 (0.232 tons per capita), up from 719,243 tons in 1995 (0.157 tons per capita). In Washington state, tonnage disposed in landfills/incinerators has increased from about 6 million tons in 1991 to nearly 8 million tons in 1997. During the same time period, the per capita wasting rate has increased one fifth from 4.7 pounds per day to 5.6 pounds per day. Note: state per capita wasting rates are not necessarily comparable to national averages or to each other as state data may be tracked differently and may include some industrial, agricultural, and construction and demolition materials, which are excluded from EPA data.
10. U.S. EPA, Characterization of Municipal Solid Waste in The United States: 1998 Update, p. 5.
11. See Jim Glenn, “The State of Garbage in America,” BioCycle (April 1999), p. 63.
12. James E. McCarthy, Interstate Shipment of Municipal Solid Waste: 1998 Update, CRS Report to Congress (Washington, DC: Congressional Research Service, The Library of Congress, August 6, 1998).
13. Ibid.
14. “Truck Inspections Uncover More Than A Hundred Violations Around the State,” The PROPonent (Harrisburg, Pennsylvania: Public Recycling Officials of Pennsylvania, October 1998), p. 7.
15. U.S. EPA, Characterization of Municipal Solid Waste in The United States: 1998 Update, p. 61.
16. Ibid., p. 61.
17. Ibid., pp. 61-62.
18. Ibid., pp. 67, 69, 70.
19. City of Los Angeles Resolution [on the Miller plastic beer bottle], January 22, 1999; and “The Potential Impacts of Plastic Beer Bottles on Plastics Recycling — A Working Paper” (available on the GRRN Web site <http://www.grrn.org>), The Plastics Redesign Project (608-231-1100), January 1999.
20. U.S. EPA, Characterization of Municipal Solid Waste in The United States: 1998 Update, p. 70; and “Aluminum can recycling rate drops to ten-year low,” Container and Packaging Update Vol. IX No. 1 (Arlington, Virginia: The Container Recycling Institute, Spring 1999), p. 6.
21. U.S. EPA, Characterization of Municipal Solid Waste in The United States: 1998 Update, p. 10.
22. Ibid., p. 70; Marge Franklin (McLaren/Hart Inc., Prairie Village, Kansas), personal communication, October 13, 1999; “Americans Continue to Recycle More Than One in Three Glass Containers,” press release (Washington, DC: Glass Packaging Institute, October 27, 1999); and Joe Cattaneo (Glass Packaging Institute, Washington, DC), personal communication, October 12, 1999. The 1998 glass recovery rate (including refillables) dropped to 34.8% as compared to 35.2% in 1997.
23. U.S. EPA, Characterization of Municipal Solid Waste in The United States: 1998 Update, p. 10.
GRRN - 65

24. Ibid., p. 75; and 1998 Report on Post Consumer PET Container Recycling Activity (Charlotte, North Carolina: National Association for PET Container Resources, September 1999), available on the Web at <http://www.napcor.com/process/recycling_rate98.html>.
25. U.S. EPA, Characterization of Municipal Solid Waste in The United States: 1998 Update, pp. 62, 70; “Americans Continue to Recycle More Than One in Three Glass Containers,” press release (Washington, DC: Glass Packaging Institute, October 27, 1999); and Joe Cattaneo (Glass Packaging Institute, Washington, DC), personal communication, October 12, 1999.
26. Ibid., p. 70.
27. Ibid., pp. 67, 69. Also see “Why the California Legislature Should ‘Take Another Look at Plastics’,” Californians Against Waste, Sacramento, California, 1999.
28. U.S. EPA, Characterization of Municipal Solid Waste in The United States: 1998 Update, p. 70.
29. Ibid., pp. 58, 60, 61, 63, 67, 71.
30. Ibid, p. 5.
31. Office of Technology Assessment, Managing Industrial Solid Wastes from manufacturing, mining, oil, and gas production, and utility coal combustion (OTA-BP-O-82), February 1992, pp. 7, 10. The 11 billion ton figure includes wastewater.
32. U.S. EPA, Characterization of Municipal Solid Waste in The United States: 1998 Update, p. 5.
33. Office of Technology Assessment, Managing Industrial Solid Wastes from manufacturing, mining, oil, and gas production, and utility coal combustion, p. 92.
34. Ibid.
35. David Morris (Institute for Local Self-Reliance, Minneapolis, Minnesota), personal communication, July 1999.
36. A. Adriaanse et al., Resource Flows: The Material Basis of Industrial Economies, a joint publication of the World Resources Institute (WRI); the Wuppertal Institute; the Netherlands Ministry of Housing, Spatial Planning, and the Environment; and the National Institute for Environmental Studies (Washington, DC: World Resources Institute, 1997), p. 23.
37. Rebecca Katers (Executive Director, Clean Water Action Council of Wisconsin, Green Bay, Wisconsin), personal communication, July 1999; and Clean Water Action Council of Wisconsin Newsletter Vol. 2, No. 7, July 1998.
38. See Anne Claire Broughton and Neil Seldman, “Cost-Cutting Through Dross Recycling,” Recycling Today Vol. 30 No. 11 (November 1992).
39. John F. Ruston and Richard A. Dennison, “Advantage Recycle: Assessing the Full Costs and Benefits of Curbside Recycling” (Washington, DC: Environmental Defense Fund, 1995).
40. U.S. EPA, Office of Solid Waste and Emergency Response (OSWER), Report to Congress: Wastes from the Extraction and Beneficiation of Metallic Ores, Phosphate Rock, Asbestos, Overburden from Uranium Mining, and Oil Shale (Washington, DC: U.S. Government Printing Office, 1985) as cited in John E. Young, Discarding the Throwaway
GRRN - 66

Society, Worldwatch Paper 101 (Washington, DC: Worldwatch Institute, January 1991), pp. 9-10.
41. Edmund Piasecki, Adding Insult to Injury (Mining Policy Center Web page <http://www.mineralpolicy.org/insult2injury.html>, browsed July 1999).
42. John E. Young, Discarding the Throwaway Society, p. 10.
43. Cathy Carlson, Mine of the Month (National Wildlife Federation Web page <http://www.nwf.org/lands/news/ mine.html>, browsed July 1999).
44. Hormones are chemical messengers that travel in the blood stream, turning on and off critical bodily functions to maintain health and well being. Hormones control growth, development, and behavior in birds, fish, reptiles, amphibians, and mammals, including humans. In humans, 100 different hormones have been identified. Taken together, the tissues and organs that produce, and respond to, hormones are called the endocrine system. “Chemicals in the Brain, Part 1,” Rachel’s Environment & Health Weekly #499 (June 20, 1996).
45. “Chemicals in the Brain, Part 1,” Rachel’s Environment & Health Weekly #499 (June 20, 1996).
46. U.S. EPA, Office of Pollution Prevention and Toxics (OPPT), 1997 Toxics Release Inventory Public Data Release (Washington, DC: April 1999) p. 4-7, available on the Web at: <http://www.epa.gov/opptintr/tri/tri97/drhome.htm>.
47. World Resources 1998-99, a joint publication by The World Resources Institute, The United National Environment Programme, The United Nations Development Programme, and The World Bank (New York: Oxford University Press, 1998), p. 164; and U.S. EPA, Office of Pollution Prevention and Toxics (OPPT), 1997 Toxics Release Inventory Public Data Release, p. 4-7.
48. John E. Young and Aaron Sachs, The Next Efficiency Revolution: Creating a Sustainable Materials Economy (Washington, DC: Worldwatch Institute, September 1994), p. 13.
49. U.S. EPA, “Solid Waste Disposal Facility Criteria; Proposed Rule,” Federal Register 53(168), 40 CFR Parts 257 and 258 (Washington, DC: U.S. EPA, August 30, 1988), pp. 33314-33422.
50. U.S. EPA, “Criteria for Municipal Solid Waste Landfills,” U.S. EPA, Washington, DC, July 1988.
51. G. Fred Lee, Ph.D, P.E., D.E.E., and Anne Jones-Lee, Ph.D., Three R’s Managed Garbage Protects Groundwater Quality (El Macero, California: G. Fred Lee & Associates, May 1997).
52. Ibid.
53. Recycling... for the future: Consider the benefits, prepared by the White House Task Force on Recycling (Washington, DC: Office of the Federal Environmental Executive, 1998).
54. “Landfills are Dangerous,” Rachel’s Environment & Health Weekly #617 (September 24, 1998), available on the Web at: <http://www.monitor.net/rachel/rehw-index.html>.
GRRN - 67

55. Lynton Baker, Renne Capouya, Carole Cenci, Renaldo Crooks, and Roland Hwang, The Landfill Testing Program: Data Analysis and Evaluation Guidelines (Sacramento, California: California Air Resources Board, September 1990) as cited in “Landfills are Dangerous,” Rachel’s Environment & Health Weekly.
56. State of New York Department of Health, Investigation of Cancer Incidence and Residence Near 38 Landfills with Soil Gas Migration Conditions, New York State, 1980-1989 (Atlanta, Georgia: Agency for Toxic Substances and Disease Registry, June 1998) as cited in “Landfills are Dangerous,” Rachel’s Environment & Health Weekly #617 (September 24, 1998). The New York landfills were tested for VOCs in the escaping gases. Dry cleaning fluid (tetrachloroethylene or PERC), trichloroethylene (TCE), toluene, l,l,l-trichloroethane, benzene, vinyl chloride, 1,2-dichloroethylene, and chloroform were found.
57. M.S. Goldberg and others, “Incidence of cancer among persons living near a municipal solid waste landfill site in Montreal, Quebec,” Archives of Environmental Health Vol. 50, No. 6 (November 1995), pp. 416-424 as cited in “Landfills are Dangerous,” Rachel’s Environment & Health Weekly.
58. J. Griffith and others, “Cancer mortality in U.S. counties with hazardous waste sites and ground water pollution,” Archives of Environmental Health Vol. 48, No. 2 (March 1989), pp. 69-74 as cited in “Landfills are Dangerous,” Rachel’s Environment & Health Weekly.
59. Dioxin and Furan Inventories: National and Regional Emissions of PCDD/PCDF (Geneva, Switzerland: U.N. Environment Programme (May 1999).
60. U.S. EPA, Characterization of Products Containing Lead and Cadmium in MSW in the U.S., 1970-2000, EPA-530-SW-89-015A (Washington, DC: U.S. EPA, January 1989), pp. 31, 35.
61. See, for example, Neil Seldman, An Environmental Review of Incineration Technologies (Washington, DC: Institute for Local Self-Reliance, October 1986); The Rush to Burn (New York: NY Public Interest Research Group, 1987); Tanya Lipshutz-Levy, The False Panacea (Santa Rosa, California: The Santa Rosa Community Recycling Center, 1977); the newsletter, Waste Not, Canton, New York (archived issues available on the Web site <http://www.ecologia.nier.org/english/level1/wastenots>; and the newsletter, Rachel’s Environment & Health Weekly (archived issues available on the Web site <http://www.monitor.net/rachel/rehw-index.html>.
62. Jeffrey Morris and Diana Canzoneri, Recycling Versus Incineration: An Energy Conservation Analysis (Seattle: Sound Resource Management Group, 1992).
63. Brenda Platt and David Morris, The Economic Benefits of Recycling (Washington, DC: Institute for Local Self-Reliance, February 1993), pp. 6-8.
64. Brenda Platt, A Non-Incineration Alternative for Mercer County, New Jersey (Washington, DC: Institute for Local Self-Reliance, October 1996), p. 10.
65. Robert Bryce, “Court Clears Way for N.J. Counties to Charge Fees,” Waste News (May 31, 1999), p. 5; and Megan Fleming, “N.J. Passes $153 Million Bailout,” Waste News (November 9, 1998), p. 2.
66. Bill Wood, Going Up in Smoke: The Incineration of Highly Recyclable Materials in Florida (Tallahassee: The Florida Public Interest Research Education Fund, November 1992).
GRRN - 68

67. Chris Skaggs and JoAnn Strack, “Authority Staff and Member Counties Visit Ash Recycling Plant,” WasteWatch Vol. 9, No. 3 (Baltimore, Maryland: Northeast Maryland Waste Disposal Authority, Fall 1998), pp. 1, 6. Also see Marc J. Rogoff, “Does Ash Recycling Make Good Sense?” Solid Waste Technologies (October 1999), pp. 21-24. The author of this latter article projects “that over the next three to five years, many more communities will look to ash recycling as a means to optimize the performance and reduce costs of their waste-to-energy program. How fast this program can emerge will depend on how creative the ash recycling industry is able to develop new markets for recycled ash products.”
68. Douglas Koplow and Kevin Dietly, Federal Disincentives: A Study of Federal Tax Subsidies and Other Programs Affecting Virgin Industries and Recycling, Temple, Barker & Sloane, Inc. (Washington, DC: U.S. EPA, 1994).
69. Welfare for Waste: How Federal Taxpayer Subsidies Waste Resources and Discourage Recycling (Atlanta, Georgia: GrassRoots Recycling Network, April 1999), p. vii.
70. Welfare for Waste: How Federal Taxpayer Subsidies Waste Resources and Discourage Recycling, p. 5.
71. The Tellus Institute, California’s Incentives for Production of Virgin and Secondary Materials, 503-93-002 (Sacramento, California: California Integrated Waste Management Board, 1993).
72. Welfare for Waste: How Federal Taxpayer Subsidies Waste Resources and Discourage Recycling, p. vi.
73. Frank Ackerman, Paul Ligon, Lori Segall, and Brian Zuckerman, "Lifecycle Analysis and Legislation for Packaging Materials in Mexico" (Boston: Tellus Institute, 1994).
74. John Schall, Does the Solid Waste Management Hierarchy Make Sense? A Technical, Economic and Environmental Justification for the Priority of Source Reduction and Recycling (New Haven, Connecticut: School of Forestry and Environmental Studies, Yale University, October 1992), p. 60.
75. Based on data reported in David R. Berg and Grant Ferrier, Meeting the Challenge: U.S. Industry Faces the 21st Century/The U.S. Environmental Industry (Washington, DC: Office of Technology Policy, U.S. Department of Commerce, September 1988), p. 20. 1996 revenues for the solid waste industry in the United States totalled $57.4 billion: $33.9 billion for solid waste hauling and disposal, $100 million for analytical services, $110 million for consulting and engineering, $8.4 billion for waste management equipment, and $13.9 billion for resource recovery. Excluding resource recovery, revenues totaled $43.5 billion in 1996.
76. Haakon Vennemo, Miljøkostnader Knyttet til Ulike Typer Avfall (Environmental Costs Associated with Different Types of Waste) (Oslo, Norway: ECON Energi, 1995); Externalities from Landfill and Incineration, A Study by CSERGE Warren Spring Laboratory and ERTEC (London: Warren Spring Laboratory, December 1993); John Reindl (Recycling Manager, Dane County Department of Public Works, Madison, Wisconsin), personal communication, August 1999 (on his return from Europe); and Ofira Ayalon (Technion, Israel Institute of Technology, Haifa, Israel), personal communication, January 19, 1998 and May 24, 1999.
77. John Schall, Does the Solid Waste Management Hierarchy Make Sense?, p. 66.
GRRN - 69

78. See, for instance, 2001 and Beyond: A Proposed Plan for Replacing The Fresh Kills Landfill (New York: Department of Sanitation, December 1998); and The New York City Council Preliminary Response to the Fresh Kills Task Force Report, Without Fresh Kills: A Blueprint for Solid Waste Management (New York: the New York City Council). The latter report states (pp. 21-22), “the Council is outraged that eight years after the passage of Local Law 19, after seven State Court decisions upholding the mandates of the recycling law, the development of the 1992 Comprehensive Solid Waste Management Plan, and 1996 Update and Modification, and countless Council oversight hearings on the City’s Recycling Program, that DOS [the Department of Sanitation] and the Mayor are essentially declaring that DOS does not possess in-house expertise to maximize participation and diversion.”
79. “Waste Management to Buy East Coast Hauler,” Wall Street Journal, 18 August, 1998.
80. Bob Brown, “WMI Raises Tip Fees,” Waste News (March 1, 1999).
81. “Diversion Rate Plunges 27%,” Big Apple Garbage Sentinel Vol. 1 No. 11 (Friday, July 23, 1999). See Web site: <http://pratt.edu/~jmccrory/bags/v1n11_SR1.html>.
82. David R. Berg and Grant Ferrier, Meeting the Challenge: U.S. Industry Faces the 21st Century/The U.S. Environmental Industry (Washington, DC: Office of Technology Policy, U.S. Department of Commerce, September 1998), p. 44.
83. When USA Waste purchased WMX, WMX had 12% of its assets in recycling facilities, but USA Waste had only 2 to 3%. State Recycling Law Update Year-End Edition 1998, p. 16.
84. Mari Bari, The Solid Waste Industry (New York: Deutsche Morgan Grenfell, October 1, 1997), p. 79. Also see Neil Seldman and David Morris, “Who’s Behind the Attack on Recycling?” Greenpeace Quarterly Vol. 1 No. 3 (Winter 1996), p. 20.
85. State Recycling Law Update Year-End Edition 1998 (College Park, Maryland: Raymond Communications, Inc., 1998), p. 16
86. Welfare for Waste: How Federal Taxpayer Subsidies Waste Resources and Discourage Recycling, pp. 31-32.
The State of Recycling
1. Jim Glenn, “The State of Garbage in America,” BioCycle (April 1999), p. 63; and U.S. EPA, Characterization of Municipal Solid Waste in The United States: 1998 Update, EPA530-R-99-021 (Washington, DC: U.S. EPA, September 1999), p. 5.
2. U.S. EPA, Characterization of Municipal Solid Waste in The United States: 1998 Update, p. 5; and Marge Franklin (McLaren/Hart, Inc., Prairie Village, Kansas), personal communication, July 1999. 1994 marked the first of a three-year trend in which the increase in the tonnage recycled outpaced the increase in the tonnage landfilled/incinerated as compared to the previous year. The tonnage recycled in 1994 was 10.35 million tons more than the tonnage recycled in 1993. In contrast, the tonnage landfilled/incinerated decreased by 9 million tons from 1993 to 1994.
3. Ibid.
GRRN - 70

4. Recycling for the future... Consider the benefits, prepared by the White House Task Force on Recycling (Washington, DC: Office of the Environmental Executive, 1998).
5. Jeffrey Morris, "Recycling versus Incineration: an Energy Conservation Analysis," Journal of Hazardous Materials 47 (1996), pp. 277-293.
6. “750 Billion Aluminum Beverage Cans Landfilled Since First Earth Day in 1970,” Container and Packaging Update Vol. IX No. 1 (Arlington, Virginia: The Container Recycling Institute, Spring 1999), table, p. 1.
7. Jeffrey Morris, "Recycling versus Incineration: an Energy Conservation Analysis."
8. 1998 National Post-Consumer Plastics Recycling Rate Study (Washington, DC: American Plastics Council, 1999).
9. Recycling for the future... Consider the benefits.
10. U.S. EPA, Greenhouse Gas Emissions from Management of Selected Materials in Municipal Solid Waste, EPA530-R-98-013 (Washington, DC: U.S. EPA, September 1998), pp. ES-1, ES-2; and Houghton, J.T., et al., eds., Intergovernmental Panel on Climate Change, Climate Change 1995: The Science of Climate Change (Cambridge, England: Cambridge University Press, 1996), pp. 3-5.
11. U.S. EPA, Greenhouse Gas Emissions from Management of Selected Materials Municipal Solid Waste, p. ES-3.
12. Recycling for the future... Consider the benefits.
13. U.S. EPA, Reducing Solid Waste Can Help Stop Global Climate Change (U.S. EPA Web page <http://www.epa.gov/mswclimate>, browsed May 1999).
14. U.S. EPA, Climate Change and Municipal Solid Waste: Two Environmental Issues with an Important Underlying Link (U.S. EPA Web page <http://www.epa.gov/payt/public.htm>, browsed May 1999); and Bureau of Census 1990 demographic data on Los Angeles.
15. U.S. EPA Web site on full-cost accounting: <http://www.epa.gov/fullcost>, browsed September 1999. For more information on full-cost accounting techniques see U.S. Environmental Protection Agency, Full Cost Accounting for Municipal Solid Waste Management: A Handbook EPA, 530-R-95-041 (Washington, DC: U.S. EPA, September 1997).
16. U.S. EPA Fourth Year WasteWise Progress Report, EPA530-R-98-016 (Washington, DC: U.S. EPA, September 1998), p. 2.
17. Brenda Platt and Kelly Lease, Institute for Local Self-Reliance, Cutting the Waste Stream in Half: Community Record-Setters Show How, EPA530-R-99-013 (Washington, DC: U.S. EPA, June 1999), pp. 32-41. Programs were considered cost-effective if per household waste management costs decreased or stayed the same following implementation of waste reduction programs (9 communities), or if per household waste management costs increased, the increases can wholly be accounted for by increases in trash disposal tip fees (4 communities).
18. See, for example, North Carolina Department of Environment, Health, and Natural Resources; Division of Pollution Prevention and Environmental Assistance, Analysis of the Full Costs of Solid Waste Management for North Carolina Local Governments (Raleigh, NC:
GRRN - 71

DPPEA-97-09, February 1997). This study, which evaluated North Carolina communities, found that cost-effectiveness of recycling as compared to trash collection and disposal is positively correlated to higher recovery levels.
19. See, for example, Brenda Platt and Kelly Lease, Institute for Local Self-Reliance, Cutting the Waste Stream in Half, pp. 34, 38. In this study, compost processing costs ranged from $2 to $22 per ton (median value, $10 per ton), while landfill disposal tip fees in these same communities ranged from $10 to $112 per ton (median value, $45 per ton).
20. Peter Anderson, George Dreckmann, and John Reindl, “Debunking the Two-Fleet Myth,” Waste Age (October 1995), pp 53-60. The 32% reduction in trash routes takes into account population growth and is based on per-capita data.
21. Brenda Platt and Kelly Lease, Institute for Local Self-Reliance, Cutting the Waste Stream in Half, p. 87; and Kelly Lease (Institute for Local Self-Reliance, Washington, DC), personal communication, August 1999).
22. Brenda A. Platt and David Morris, The Economic Benefits of Recycling (Washington, DC: Institute for Local Self-Reliance, February 1993), p. 9.
23. Michael Lewis, Recycling Economic Development through Scrap-Based Manufacturing (Washington, DC: Institute for Local Self-Reliance, 1994).
24. Michael Shore, The Impact of Recycling on Jobs in North Carolina, for the NC Recycling Business Assistance Center (Raleigh, North Carolina: July 1995) p. 1.
25. Roy F. Weston, Value Added to Recyclable Materials in the Northeast, C-096-94 (Brattleboro, Vermont: The Northeast Recycling Council, May 1994).
26. Deirdre Grace, “Recycling is Working,” The ReMarketable News (Seattle: Clean Washington Center, November 1992), p. 1; and Deirdre Grace (Clean Washington Center, Seattle, Washington), personal communication, December 1, 1992.
27. Robin F. Ingenthron, Value Added by Recycling Industries in Massachusetts (Boston: Department of Environmental Protection, July 1992).
28. California Recycling Means Business California Jobs: A Library of Facts (Sacramento, California: Californians Against Waste Foundation, October 1994); and A Market Development Plan for California (Sacramento, California: the California Integrated Waste Management Board, 1993).
29. Recycling... for the future: Consider the benefits, prepared by the White House Task Force on Recycling (Washington, DC: Office of the Environmental Executive, 1998).
30. Mary Lou Van Deventer and Dan Knapp (Urban Ore, Berkeley, California), personal communication, September 1999.
31. Kivi Leroux and Neil Seldman, Deconstruction: Salvaging Yesterday’s Buildings for Tomorrow’s Sustainable Communities (Washington, DC: Institute for Local Self-Reliance, 1999), p. 23
32. In the 1996 presidential elections, 96.5 million Americans voted. (See Citizen’s for True Democracy Web site at <www.truedemocracy.org>, browsed August 1999.) Curbside recycling programs serve about 135.5 million Americans (see Jim Glenn, “The State of Garbage in
GRRN - 72

America,” BioCycle, April 1999), and millions more are served by drop-off programs and/or have access to recycling through workplaces. Jerry Powell, editor of Resource Recycling, who originated the quote that “More Americans recycle than vote, thus recycling is more popular than democracy,” points to the fact that participants in deposit-law systems alone represent 29% of Americans, and additional curbside efforts in non-deposit states probably account for another 30% of Americans. In contrast, the portion of eligible voters who voted in the 1996 presidential elections was 49%. Jerry Powell, (Editor, Resource Recycling, Portland, Oregon), personal communication, September 7, 1999.
33. U.S. EPA, Characterization of Municipal Solid Waste in The United States: 1998 Update, p. 5.
34. Jim Glenn, “The State of Garbage in America,” BioCycle (April 1999), p. 63. BioCycle surveys each state and aggregates data to develop a national recycling rate; the U.S. EPA uses a “materials flows methodology,” which is based on production data (by weight) for materials and products in the discard stream, with adjustments for imports, exports, and product life-times. Some argue that neither the EPA nor the BioCycle measures fairly estimate the actual recycling level since many legitimate recycling industries (such as auto salvage or the reuse industry in its myriad forms) are left out of the counting.
35. Institute for Local Self-Reliance, Waste Reduction Record-Setters Project (Washington, DC, 1997-1999). For more information on this project, see ILSR’s Web site: <http://www.ilsr.org/recycling>.
36. Brenda Platt and Kelly Lease, Institute for Local Self-Reliance, Cutting the Waste Stream In Half: Community Record-Setters Show How, EPA530-R-99-013 (Washington, DC: U.S. EPA, June 1999), pp. 12, 29.
37. On the Path to Sustainability (Seattle: Seattle Public Utilities, August 1998), p. 46.
38. Gary Liss, What Is Zero Waste? (Loomis, California: Gary Liss & Associates, 1999).
39. Warren Snow (Director, Tindall Foundation, Auckland, New Zealand), personal communication, November 15, 1999.
40. Gary Liss, What Is Zero Waste?
41. Jim Glenn, “The State of Garbage in America,” BioCycle (April 1999), p. 60.
42. Brenda Platt and Kelly Lease, Institute for Local Self-Reliance, Cutting the Waste Stream In Half: Community Record-Setters Show How, EPA530-R-99-013 (Washington, DC: U.S. EPA, June 1999) p. 14. These composting levels exclude unknown amounts composted or “left on the lawn” at home.
43. Brenda Platt, Creating Wealth from Everyday Items (Washington, DC: Institute for Local Self-Reliance, 1997).
44. Brenda Platt and Kelly Lease, Institute for Local Self-Reliance, Cutting the Waste Stream in Half, p. 13.
45. U.S. EPA, Characterization of Building-Related Construction and Demolition Debris in the United States, EPA530-R-98-010 (Washington, DC: U.S. EPA, June 1998), pp. 2-6, 7.
GRRN - 73

46. Kivi Leroux and Neil Seldman, Deconstruction: Salvaging Yesterday’s Buildings for Tomorrow’s Sustainable Communities (Washington, DC: Institute for Local Self-Reliance, 1999), p. 23; and Deconstruction — Building Disassembly and Material Salvage: The Riverdale Case Study, for the U.S. EPA (Upper Marlboro, Maryland: National Association of Home Builders Research Center Inc., 1997).
47. Kivi Leroux and Neil Seldman, Deconstruction: Salvaging Yesterday’s Buildings for Tomorrow’s Sustainable Communities.
48. U.S. EPA, Unit-Based Pricing in the United States: A Tally of Communities (U.S. EPA PAYT Web page <http://www.epa.gov/epaoswer/non-hw/payt/index.htm>, browsed June 1999).
49. Robin R. Jenkins, The Economics of Waste Reduction (Brookfield, Vermont: Edward Elgar Publishing Company, 1993); and Marie Lynn Miranda, et. al., “Market-Based Incentives and Residential Municipal Solid Waste,” Journal of Policy Analysis and Management Vol. 13 (1994), pp. 681-698.
50. Lisa A. Skumatz, Ph.D., Nationwide Diversion Rate Study: Quantitative Effects of Program Choices on Recycling and Green Waste Diversion (Los Angeles: Reason Foundation, 1996), pp. 12-3.
51. Brenda Platt and Kelly Lease, Cutting the Waste Stream In Half, pp. 81-2.
52. Jim Glenn, “The State of Garbage in America, Part II,” BioCycle (May 1998), p. 49.
53. United States Census Bureau, State Population Estimates and Demographic Components of Population Change: July 1, 1997 to July 1, 1998. (Census Bureau Web page <http://www.census.gov/>, browsed June 1999); and Jim Glenn, “The State of Garbage in America,” BioCycle (April 1999), p. 64.
54. State Recycling Laws Update Year-End Edition 1998 (College Park, Maryland: Raymond Communications, Inc., 1998), p. 29.
55. Pat Franklin (Executive Director, Container Recycling Institute, Arlington, Virginia), personal communication, November 1999.
56. Container Recycling Institute, The Ten-Cent Incentive to Recycle (Washington, DC: CRI, February 1997) p. 2; and Pat Franklin (Executive Director, Container Recycling Institute, Arlington, Virginia), personal communication, August 1999.
57. California law, for example, allows the state to fine local jurisdictions up to $10,000 a day for failure to plan to meet the state goal. Connecticut’s law allows the state to evaluate each municipal program and issue a notice of “recycling program deficiency.” If the municipality fails to correct a deficiency, the state may take further enforcement action. Wisconsin law prevents communities and their businesses from using state landfills unless there is an “effective recycling program.” See Jim Glenn, “The State of Garbage in America,” BioCycle (April 1998), pp. 65-6, 71; and Connecticut State Library, Connecticut General Statutes, Revised to 1997 (Connecticut State Library Web page at <http://www.cslib.org/>, browsed June 1999).
58. New Jersey Department of Environmental Protection, New Jersey Solid Waste Database Trends Analysis (1985 through 1996), (New Jersey DEP Web page <http://www.state.nj.us/dep/>, browsed July 1999).
GRRN - 74

59. Wisconsin Department of Natural Resources, Waste Management Program Highlights of Wisconsin Recycling (Wisconsin DNR Web page <http://www.dnr.state.wi.us>, browsed July 1999).
60. Pennsylvania Department of Environmental Protection, 1996-97 Act 101 Annual Report to the General Assembly of Pennsylvania (Harrisburg, Pennsylvania: PA Department of Environmental Protection, September 26, 1997), Appendices E and G.
61. Waste Prevention, Recycling, and Composting Options: Lessons from 30 U.S. Communities, EPA530-R-92-015 (Washington, DC: U.S. Environmental Protection Agency, February 1994), p. 63.
62. It took a dozen years for the U.S. EPA to implement recycled-content product procurement guidelines mandated by the Resource Recovery and Conservation Act (RCRA) in 1976.
63. Eric Nelson (Procurement Specialist, King County, Washington), personal communication, January 1999.
64. Richard Keller (Chief of Recycling for the Maryland Environmental Service, Annapolis, Maryland), personal communication, January 1999.
65. Eric Friedman (Environmental Purchasing Coordinator, Massachusetts’ Operational Services Division), personal communication, January 1999.
66. California Integrated Waste Management Board, Recycled-Content Newsprint Program (Public Resources Code Sections 42750-42791). (California Integrated Waste Management Board Web page at <http://www.ciwmb.ca.gov>, browsed June 1999).
67. California Integrated Waste Management Board, January 29, 1998 News Release: Waste Board Fines Printing Service.
68. “Facts About Newspapers 1997: Newsprint Recovery Continues to Climb,” Web site <http://www.naa.org/info/facts97/13.html> (Vienna, Virginia: Newspaper Association of America), browsed August 1999.
69. State Recycling Laws Update Year-End Edition 1998 (College Park, Maryland: Raymond Communications, Inc., 1998), pp. 19, 21; and Rick Best (Californians Against Waste, Sacramento, California), personal communication, November 23, 1999.
70. Tom Kacandes (Empire State Development Environmental Management Investment Group, Albany, New York), personal communication, July 16, 1999.
71. National Recycling Coalition 1998 Market Development Directory: A Guide to State and Regional Market Development Programs Version 3.0 (Alexandria, Virginia: National Recycling Coalition, 1998).
72. Pennsylvania Department of Environmental Protection, 1996-97 Act 101 Annual Report to the General Assembly of Pennsylvania, (Harrisburg, Pennsylvania: PA Department of Environmental Protection, September 26, 1997), unnumbered pages “Message from the Governor” and “Message from the Secretary.”
73. Randy Coburn (Environmental Management Investment Group, Empire State Development, Albany New York), personal communication, July 16, 1999. To date the
GRRN - 75

program has awarded $23.7 million in grants to 260 projects. The total costs for these projects is expected to total $43.3 million. Job figures and tonnage capacity retained or installed is based on the 125 completed projects to date.
74. Dave Block, “Government Financing and Expertise Boost Recycling Businesses,” BioCycle (February 1999), p. 45.
75. California Integrated Waste Management Board, Recycling Market Development Zone Program Frequently Asked Questions, (CIWMB Web page <http://www.ciwmb.ca.gov/RMDZ/ faq.htm>, browsed July 1999).
76. U.S. Environmental Protection Agency, Office of Solid Waste and Emergency Response, “Building the Economy With JTR Resources,” Reusable News, EPA530-N-98-008 (Washington, DC: Fall 1998), p. 1.
77. The Fund finances recycling, manufacturing, environmental and other companies that (1) require equity or subordinating debt capital to fuel profitable growth, and (2) create quality jobs for low-income citizens or locate in economically distressed regions of the eastern United States. For more information see the Sustainable Jobs Fund Web site: <http://www.sjfund.com>.
78. U.S. Environmental Protection Agency, Office of Solid Waste and Emergency Response, “Investing in the Future,” Reusable News, EPA530-N-99-001 (Washington, DC: Winter 1999), p. 2.
79. Gary Liss, What Is Zero Waste? (Loomis, California: Gary Liss & Associates, 1999).
80. A. Adriaanse et al., Resource Flows: The Material Basis of Industrial Economies, a joint publication of the World Resources Institute (WRI); the Wuppertal Institute; the Netherlands Ministry of Housing, Spatial Planning, and the Environment; and the National Institute for Environmental Studies (Washington, DC: World Resources Institute, 1997), pp. 11, 17.
81. Peter Anderson, “Industry Retreat from Recycling” (Madison, Wisconsin: RecycleWorlds, 1997).
82. Percentage figures from “Facts About Newspapers 1997: Newsprint Recovery Continues to Climb,” Web site <http://www.naa.org/info/facts97/13.html> (Vienna, Virginia: Newspaper Association of America), browsed August 1999.
83. Peter Anderson, “Industry Retreat from Recycling” (Madison, Wisconsin: RecycleWorlds, 1997).
84. U.S. EPA, Characterization of Municipal Solid Waste in The United States: 1998 Update, p. 63.
85. Jerry Powell, Editor-in-Chief, Resource Recycling, panel presentation, Recycling: Looking Toward the Next Century, Final Workshop Summary, White House Conference Center, Washington, DC, May 19-21, 1998.
86. “National Packaging Protocol,” Canadian Council of Ministers of the Environment, March 20, 1990.
87. In 1988, 5.41 million tons were landfilled, compared to only 2.64 million tons in 1996. State Recycling Laws Update: Year-End Edition 1998 (College Park, Maryland: Raymond Communications Inc., 1998), p. 53.
GRRN - 76

88. Robert Steuteville, “The State of Garbage in America: Part II,” BioCycle (May 1999), p. 34.
89. Robert Steuteville, “The State of Garbage in America: Part II,” BioCycle (May 1996), p. 36.
90. Jim Glenn, “The State of Garbage in America: Part II,” BioCycle (May 1998), p. 52.
91. Anne Claire Broughton, “Who’s Responsible for Recycling?” vol. 11 no. 1 Rword (Carolina Recycling Association, Spring 1999), p. 14.
92. Jim Glenn, “The State of Garbage in America: Part II,” BioCycle (May 1998), pp. 51-52.
93. However, the Senate did not agree and instead wanted not only the bans kept, but also additional state funding to assist local programs. In the conference committee, the two houses agreed to keep the bans and impose both a landfill tipping fee and a business income tax surcharge to provide for state cost-sharing of local recycling programs. As of mid October 1999, the state budget bill was awaiting the Governor’s signature. John Reindl (Recycling Coordinator, Dane County, Wisconsin), personal communication, October 12, 1999.
94. State Recycling Laws Update: Year-End Edition 1998 (College Park, Maryland: Raymond Communications Inc., 1998), p. 8.
95. Jim Glenn, “The State of Garbage in America: Part II,” BioCycle (May 1998), pp. 51-52.
Agenda for Action
1. U.S. EPA, Characterization of Municipal Solid Waste in the United State: 1998 Update, p. 70.
2. The Massachusetts Recycling Initiative (H. 5202), which citizens failed to pass in a November 1992 ballot initiative, may be an interesting model for U.S. states. The initiative would have required all packaging in Massachusetts to meet one of three standards by 1996: (1) reusable five or more times, (2) made of 50% recycled material, or (3) made of materials that are actually being recycled (35% by 1996 and 50% by 2001).
3. See Beverly Thorpe and Iza Kruszewska, "Strategies to Promote Clean Production – Extended Producer Responsibility" (Montreal: Clean Production Action, January 1999).
4. See Resolution No. 10/98-99, A Resolution Relating to Management of Waste from Manufactured Products and Packaging. The resolution is available on the GrassRoots Recycling Network’s Web site: <http://www.grrn.org/Carrboroepr.htm>.
5. See David Morris et. al, Getting the Most from Our Materials: Making New Jersey the State of the Art (Washington, DC: Institute for Local Self-Reliance, June 1991).
6. See Ed Boisson, "Can Recycling Advocates Transcend Integrated Waste Management?" Resource Recycling (September 1999).
7. Arsen Darnay and William Franklin, Salvage Markets for Materials in Solid Wastes (Washington, DC: U.S. Environmental Protection Agency, 1972).
8. Alameda County, California’s $6 per ton surcharge supports one of the nation’s most successful waste diversion programs.
GRRN - 77
9. The Natural Step is one. Contact The Natural Step at The Presidio Thoreau Center for Sustainability, P.O. Box 29372, San Francisco, California 94129-0372, (415) 561-3344 and visit its Web site at: http://www.naturalstep.org.
GRRN - 78