waste-to-plastics: process alternativess3.amazonaws.com/zanran_storage/ · waste-to-plastics:...
TRANSCRIPT

i

ii
Waste-to-plastics: process alternatives
SELIM NOURI a KRISTIN KAGGERUDb
a Department of Energy and Environment, Environmental Systems Analysis Division (ESA)
CHALMERS UNIVERSITY OF TECHNOLOGY
b Energy and Process Engineering department, Faculty of Engineering Science and Technology
NORWEGIAN UNIVERSITY OF SCIENCE AND TECHNOLOGY
Göteborg, Sweden 2006

iii
Waste-to-plastics: process alternatives
SELIM NOURI KRISTIN KAGGERUD
ESA-report 2006:17 ISSN 1404-8167
Department of Energy and Environment, Environmental Systems Analysis Division (ESA) CHALMERS UNIVERSITY OF TECHNOLOGY SE-412 96 GÖTEBORG Sweden 2006
http://www.chalmers.se/ee/SV/forskning/forskargrupper/miljosystemanalys
CPM-report 2006:10 ISSN 1403-2694
CPM – Centre for Environmental Assessment of Product and Material Systems CHALMERS UNIVERSITY OF TECHNOLOGY SE-412 96 GÖTEBORG Sweden 2006
www.cpm.chalmers.se
Frontpage photos: Biomass Gasification Methanol Synthesis. Photo: AIST; Methanol to Olefins demo plant. Photo: ExxonMobil.
Chalmers reproservice Göteborg, Sweden 2006


iii
Abstract
In this report, processes for converting woody biomass to plastics (BTP) and waste plastics into plastics (PTP) are examined. The technologies evaluated are thermochemical conversion of the raw material into polyethylene (PE) and polypropylene (PP). The core strategy is to take the biomass or plastic waste through gasification, water gas shift (WGS), methanol production, methanol to olefins (MTO) and finally plastic production. The environmental attractiveness of these emerging technologies is evaluated using a combination of process modelling and life cycle assessment (LCA) methodology. Several tools and simulation softwares have been combined to carry out the study, including Aspen’s HYSYS, LCAiT and Excel.
Important factors have been identified and evaluated, like climate change mitigation, feedstock availability, recycling loops and technological improvements. Various improvements of the processes are evaluated with respect to green house gases emissions potential for the system. The most important outcomes of the study include:
1. Production of plastic waste from biomass and plastic waste seems possible using the BTP and PTP processes, respectively.
2. As a plastic production system, the BTP seems more advantageous than PTP regarding green house gases emissions.
3. The gasification unit, with the air separation unit to produce oxygen, is the main contributors to CO2 emissions. A case with an improved gasifier for plastic waste shows significant improvements.
4. To use hydrogen surplus from a chemical plant as a hydrogen fuel cells feedstock is not the only option available. Hydrogen surplus could be use to greatly improve the BTP and PTP routes - or similar processes - as shown in this report.
5. The method, which combines LCA and process modelling, enables an effective early-design phase evaluation.
The main numerical findings are summarised in the table A below.

iv
Table A: Summary of kg CO2-equivalent (CO2-eqv) and waste per functional unit for the various scenarios.
Waste per functional unit Scenario Renewable CO2-eqv
Non-renewable CO2-eqv
Dry As received
BTP 5.8 1.4 4.7 9.4 Base case
PTP 5.8 2.2 3.6 3.6
Improved gasifier PTP 4.4 1.4 2.8 2.8 (1.4)1
BTP 3.5 1.1 3.4 6.7 H2 added
PTP 3.5 1.7 2.7 2.7
150 % oil slurry in the treated material; 1.4 kg of waste plastics and 1.4 kg of oil per functional unit. Functional unit: 1 kg of plastic produced
Keywords: Methanol-to-Olefins (MTO); synthesis gas; gasification; Life Cycle Assessment; process modelling; renewable plastics.

v
Preface
We would like to express our warmest gratitude to all people that in one way or another have contributed to the completion of this report.
We highly appreciated the participation and collaboration from all correspondents in the CPM network, as well as all engineers – especially from Norsk Hydro and Borealis - who helped us. Their supportive and kind efforts to enhance the content of our report with real industrial expertise are priceless and exclusive of their time, knowledge, experience and input, this report could not have been concluded. Finally, we would like to thank our Norwegian colleague, Kristin Kaggerud, for her participation, insightful comments, constructive criticism and encouraging words throughout the entire process of creating this report.
Göteborg, June 2006
Selim Nouri
vi
Nomenclature
ASU: Air separation unit. Process that separate the air into its main compounds: oxygen, nitrogen, argon and rare gases if necessary.
Biomass: material that are biological in origin, such as grasses, trees, municipal solid waste, etc.
BDP: barrel per day.
BTP: biomass to polymer.
CH4: methane.
CO: carbon monoxide.
CO2: carbon dioxide.
CO2eq: carbon dioxide equivalent; the amount of carbon dioxide by weight emitted into the atmosphere that would produce the equivalent radiative forcing as a given weight of another greenhouse gas. Carbon dioxide equivalents are the product of the weight of gas being considered and its global warming potential.
DME: dimethyl ether (CH3-O-CH3) is the simplest of all ether; DME is currently manufactured from methanol by dehydration.
GHG: green house gases.
GTL: gas to liquid, process that transform natural gas into a more transportable liquid fuel.
HDPE: high density polyethylene
HHV: high heating value
LCA: life cycle assessment
LCI: Life Cycle Inventory

7
LDPE: Low density polyethylene
LNG: liquefied natural gas. LNG process liquefies natural gas for easier transportation using cryogenic process
MeOH: methanol
MeOH/DME: methanol/dimethyl-ether. Since DME is the “dehydrated version” of MeOH (2MeOH => DME +H2O) and that it is not still clear (studies are performed and industries are working on it) to assess whether it is better or not to produce directly one or the other. We will not judge this issue and will consider MeOH and DME as almost the same product at first. It is not that important for our first study of the BTP route since the MTO can be fed either with MeOH or DME.
MJ: megajoule [106 J]
MM: million [106]
MMBtu: million British thermal units
MTBE: methyl tertiary butyl ether
MTD: metric ton per day
MTO: methanol to olefins
MTP: methanol to propylene
NREL: US national renewable energy laboratory
PE: polyethylene
PLA: Polylactic acid, degradable polyester commercially available
PP: polypropylene
PTP: plastics to plastics
WTT study: well-to-tank study

8
Table of contents
Abstract...............................................................................................................................iii
Preface ................................................................................................................................. v
Nomenclature....................................................................................................................... 6
Table of contents ................................................................................................................. 8
1 INTRODUCTION..................................................................................................... 12
2 METHODOLOGY .................................................................................................... 12
3 GOAL AND SCOPE................................................................................................. 13
3.1 Options to model ..........................................................................13
3.2 Initial flowchart ............................................................................13
3.3 Functional unit..............................................................................14
3.4 Environmental impact categories .................................................14
3.5 Type of LCA approach.................................................................14
3.6 System boundaries........................................................................15
3.7 Geographical boundaries ..............................................................15
3.8 Time horizon ................................................................................15
3.9 Cut-off criteria ..............................................................................15
3.10 Boundaries in relation to other process/product life cycles and allocation ..................................................................................................16
3.11 System subdivisions .....................................................................16

9
3.12 Data quality requirements ............................................................16
3.13 Assumptions and limitations ........................................................16
4 PROCESS DESCRIPTIONS .................................................................................... 17
4.1 Gasification ..................................................................................18
4.2 Water gas shift (WGS) .................................................................20
4.3 Sulferox – removal of sulphur......................................................21
4.4 CO2 removal unit..........................................................................21
4.5 Methanol production ....................................................................22
4.6 Air separation unit (ASU) ............................................................23
4.7 Methanol to olefins (MTO) ..........................................................23
4.8 Borealis Borstar process for production of HDPE and PP...........25
5 SCENARIOS............................................................................................................. 26
5.1 Base case scenario........................................................................27
5.1.1 Gasification to clean syngas ..................................................................... 27
5.1.2 Methanol to plastics .................................................................................. 31
5.1.3 Transportation........................................................................................... 32
5.2 Technological improvement of the gasifier .................................33
5.3 Addition of hydrogen ...................................................................34
5.4 Change in electricity and transport systems.................................35
5.5 Models..........................................................................................36
6 RESULTS.................................................................................................................. 38
6.1 Base case scenario........................................................................39

10
6.1.1 methanol island as one unit ....................................................................... 39
6.1.2 methanol island shown as separate units .................................................. 42
6.2 Technological improvement .........................................................44
6.2.1 THEORETICAL maximum ........................................................................ 44
6.2.2 wood waste and technology improvement ................................................. 44
6.2.3 plastic waste and technology improvement ............................................... 45
6.3 Addition of hydrogen ...................................................................47
6.4 Transport system ..........................................................................49
6.5 Electricity mix ..............................................................................50
7 DISCUSSION............................................................................................................ 52
8 CONCLUSION ......................................................................................................... 61
9 REFERENCES .......................................................................................................... 63
Appendix 1: waste recovery potential ............................................................................... 67
Appendix 2 : Waste availability, ethylene network in EU, etc.......................................... 68
Appendix 3: Detailled process unit flowsheets: ................................................................ 70
Appendix 3: Detailled process unit flowsheets: ................................................................ 71
Appendix 4: EU El-mix..................................................................................................... 76
Appendix 5: waste feedstock composition ........................................................................ 77
Appendix 6: models........................................................................................................... 79
Appendix 7: assignment of CO2 emission......................................................................... 82
Appendix 8: impact categories .......................................................................................... 84
Appendix 9: oil and emissions .......................................................................................... 89

11
Appendix 10: Hydrogen sources ....................................................................................... 90
Appendix 11 : Hydrogen production environmental impact............................................. 92
Appendix 12: Lock-hopper feeding system .................................................................... 102
Appendix 13: Theoretical maximum............................................................................... 104
Appendix 14: HDPE and PP Borstar processes commercial analysis and technology review (Nexant 2002)...................................................................................................... 107
Appendix 15: Different Methanol to Olefin concepts..................................................... 110

12
1 INTRODUCTION
In these times of high energy demand, waste monetization strategies are highly appreciated. Wood wastes from forest and pulp-and-paper industries, as well as plastic wastes represent interesting feedstocks for syngas based processes that can lead to numerous products, including plastics production. Those processes could help to monetize waste thus reducing the amount of waste while saving fossil fuels (cf. appendix 1) and mitigating climate change. However, the concept of waste-to-plastics and more particularly the plastics-to-plastics (PTP) route needs to be modelled in terms of environmental impact and chemical engineering. Indeed, previous studies (Nouri, Tillman 2005, Kaggerud et al 2003) have shown the potential for syngas based process to olefins and plastics as an alternative to oil and gas feedstocks. The purpose of the research presented here is to evaluate the environmental impact of the different process configurations that may suit plastics production from wood or plastic wastes.
2 METHODOLOGY
To evaluate the environmental performance of the plastic production process from alternative feedstocks (wood waste and waste plastics), we have combined several technical and environmental methodologies and simulation softwares. Among them are process modeling softwares and LCA softwares, the combination of which gave the results presented and discussed in this paper.
Process modelling softwares are tools for managers and engineers to find the optimum process design and link business objectives with process design. They allow simulation of different process designs, specification of process equipment, evaluation of the effects of changes (feed, equipment etc) on the process and the assessment of process deficiencies. They also offer modules where the financial outcome of the process may be projected. Environmental issues, however, are assessed by these softwares only in a very limited way. Energy use and other resource consumption such as feed-stock are modelled, but they do not allow for modelling of emissions to the natural environment, and hence not environmental impact. They do thus not support modelling of what-if-scenarios with respect to environmental aspects. This is rather surprising, given the strong development of life cycle assessment (LCA) approaches during the last decade and the chemical engineering roots of life cycle assessment.

13
In this project LCA and process modelling were linked. Aspen HYSYS was used to simulate a waste to plastics process via syngas and methanol, which is then converted into light olefins. Two different base cases were investigated, using wood waste and plastic waste, respectively, as feed-stock. The results from the Aspen HYSYS model were then exported and integrated in an LCA model to calculate the environmental impacts of the process. Variations of the base cases were then simulated – changes of energy systems, logistics, plant configurations…etc... – in a series of sensitivity analyses.
3 GOAL AND SCOPE
The goal of the study is to model the production of plastics from waste and to see the pros and cons of different process configurations. The reason for carrying out the study is to evaluate different design alternatives at an early design phase for production of plastics from waste. And more generally; does it even make sense, from an environmental point of view, to produce plastics from waste plastics or wood waste?
3.1 Options to model
Different ways to produce polyolefins from waste using syngas technologies will be modelled and evaluated with respect to environmental performance. The results will be used to identify the best option for production of polyolefins from waste plastics and wood waste by modifying process options like technology, plant configuration and location. In addition to identifying the best options for each of the waste sources, it is interesting to look at the differences and similarities of the two options, a comparative study. The different composition and nature of the two feedstocks require different configurations and to a certain extent different technology. One example is the chlorine content in the plastic waste, which is not present in biomass at all. Special attention will also be given to the distinction between CO2 which originate from the waste and CO2 from other sources, like electricity production and fuel for transport.
3.2 Initial flowchart
The initial flowchart includes 6 main steps (cf. figure 1): the gasifier, the gas cleaning section, the water gas shift, the methanol synthesis, the methanol-to-olefins unit and the polyolefin unit.

14
Figure 1: Block diagram for production of plastic from biomass (wood waste) and plastic waste, the system boundary is shown as the dotted line.
3.3 Functional unit
The functional unit (FU) is production of 1 kg polymer, of which 0.68 kg is HDPE and 0.32 kg is PP. Please note that the data used for both mass and energy balances are valid only for the given capacity of the process as the performance of chemical processes is dependent on scale. The assumed capacity of each process is given in Section 4.
3.4 Environmental impact categories
Different configurations for production of polyolefins from waste are evaluated with respect to Global warming potential (GWP), energy use and acidification. Global warming potential and energy will be used as main indicators to select the best way to process waste to polymer.
3.5 Type of LCA approach
Since the configuration changes have direct impact on green house gases emissions, it is important to account for carbon that come from the feedstock (wood or waste plastics) separately from that of green house gases emanating from energy systems or logistics. For

15
practical , but not entirely so, reasons, we have in this study used the term renewable carbon emissions for all carbon originating from the feedstock, irrespective of whether it is plastic wastes or wood waste. Of course carbon dioxide emanating from recycled plastics today is really fossil in origin, but the terminology chosen allows for making what-if scenarios in a change-oriented LCA perspective: what if the plastics are originally renewable?...
3.6 System boundaries
For the methodology used (process modelling and LCA) a cradle to gate perspective was used. The technical system takes into account the consequences of the different process configuration to produce polyolefins, from the waste collection to the output of the polyolefin unit. Production and use of plastics are not included. Neither are the forestry that produces wood waste as a by-product nor the use phase of PE and PP plastics. Some waste management systems literature data were used in this report to compare processes with existing systems.
3.7 Geographical boundaries
Many process and market parameters are closely linked to choice of location (electricity production, product demand, waste availability, transport, etc.). The modelled process train will be located in Western Europe using an E.U electricity mix. It is an advantage for the process to be located close to a hydrogen source; hence it will be located near a chlorine plant, a refinery, a methanol or ammonia plant (Lasher et al 2005). In addition to the Western European location a localisation in Poland will also be studied in the sensitivity analysis also be carried out. Appendix 2 maps outline the waste availability, transport, H2 availability…etc…of potential sites in Poland and Western Europe.
3.8 Time horizon
The technologies included in this study are processes that can be built within 5 years. The study is based on a technology screening that identified syngas based processes able to produce polymers using existing technology (pilot plant scale or demo plant scale minimum). As a consequence of choosing only available technologies, or close to available, future developments - like electricity generation via fuel cells - are not considered. However, an advantage is that data availability is better and more consistent.
3.9 Cut-off criteria
Production of capital goods, transport means and buildings are not considered in this study.

16
3.10 Boundaries in relation to other process/product life cycles and allocation
We try to avoid allocation when possible (cf. FU). H2 from Cl2-production and refineries is seen as excess by-product production; hence the production is not allocated to plastic production.
3.11 System subdivisions
Since we are using a change oriented LCA approach subdivision of the systems into a foreground and a background could be appropriate. The foreground system will be the main 6 steps described in 3.2 and the background system will be the other units (H2 production, steam island…), electricity production and transports. The difference between background and foreground systems is mainly due to which part of the system is under direct influence of the decision maker (here the future manager of the plant for instance). The foreground system is directly influence by measures taken and the background indirectly.
3.12 Data quality requirements
As mentioned in Section 3.8, processes which can be commercialised within 5 years have been chosen for this study. Data are taken from technical reports and published papers.
3.13 Assumptions and limitations
It is assumed, in accordance with most of the studies performed in this field, that syngas processes have a great potential regarding variation in waste feedstock and that pressurized oxygen blown gasification is the most robust way to make syngas from waste (Drift, A. van der (Bram) 2005). One of the main limitations is the data availability.

17
4 PROCESS DESCRIPTIONS
In this section the processes for production of plastic from biomass (wood waste) and plastic waste are presented and described. The only technological difference between the two scenarios is the gasification unit, where different gasifiers are used to produce syngas suitable for methanol production. The remaining units in the process train are similar, however, with some adjustment for the different composition of the syngas biomass and waste plastic, respectively.
The Plastic waste to plastic (PTP) concept is developed by Norsk Hydro and offers a closed-loop system for a large scale recycling of mixed plastic waste back to plastic. The concept envisages combining existing technologies for waste treatment and production of valuable chemicals. The concept is outlined in Figure 1. The core strategy is taking plastic waste back to plastic. The mixed plastic waste is collected and pre-treated making it usable in a gasification process. The plastic waste is broken down to the chemical components, CO and H2, in the gasifier. In order to produce new plastic material, the CO and H2 are converted to methanol which is further reacted over a catalyst to produce olefins by use of the patented UOP/Hydro Methanol to Olefins process (MTO). Olefins are the feedstock in the production of plastic; e.g. PVC, PE, PP and PET. The mixed plastic waste also contains metals and other inorganics, which will be separated from the synthesis gas in the gasifier and recovered. The metals can replace virgin metals and the other inorganics are recovered as a glazed slag, known as frit and usable e.g. in roadbeds or in cement production. All carbonaceous material is a potential feedstock in the concept; here we look at biomass and waste plastic material.
Two operating processes worldwide have produced chemicals from plastics waste, one in Germany and one in Japan. SVZ in Germany has produced methanol from mixed waste (Malkow, 2004) and Ebara in Japan produces ammonia from plastic waste (Parkinson, 2002), they are both gasifying the plastics waste. About biomass as a feedstock, there are many on-going projects to produce fuels and chemicals from biomass (Kwant, 2004), and for the promising pressurized oxygen blown technology, 2 pilots plant have been identified as leading projects: the Choren GmbH owned BtL plant in Freiburg, Germany which produces FT-diesel from biomass, and the MHI ltd Biomass Gasification Methanol

18
Synthesis System constructed in the Kawagoe Power Station of Chubu EPCO (Japan) which produces methanol from biomass.
Based on a previous technology screening (Nouri & Tillman 2005), process information for the different process units has been collected. The main sources for the process descriptions are Ekbom et al (BioMeeT and BioMeeT II reports), Future Energy (2003), Hamelinck and Faaij (2001) and Nirula (1994). The block diagram given in Figure 1 is the basis for the process description given here. All technologies are at a technological status where they are either commercially available or close to marketing. All process units are explained with a block diagram, for more detailed flowsheets see Appendix 3.
4.1 Gasification
In the gasification unit carbonaceous waste reacts with oxygen in a partial oxidation producing synthesis gas. Synthesis gas consists mainly of CO, H2, CO2 and H2O, where CO and H2 are the most desirable components when the syngas is to be used in production of methanol. Pure O2 is chosen as the oxygen source in this concept to assure a high calorific syngas; hence the following overall, strongly exothermic, reaction will take place in the gasifier. In the equation (4-0) the subscript p is used to indicate that this is a reaction with various polymers, which consists of different monomers (CxHy).
( ) ( ) 22 22HpyCOpxOpxHC
pyx ⎟⎠⎞
⎜⎝⎛ ⋅
+⋅→⋅
+ (4-0)
Two different gasification technologies have been chosen for gasification of biomass and plastic waste, respectively, they are shown in Figure 2 and 3.
19
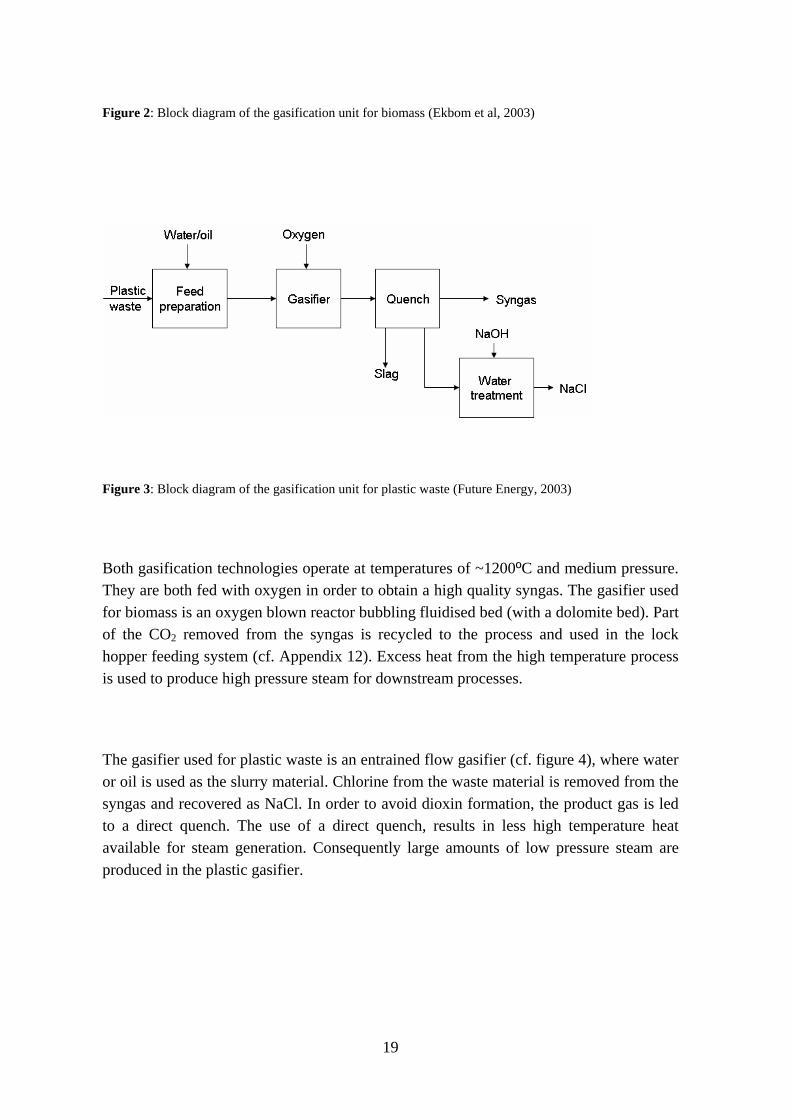
Figure 2: Block diagram of the gasification unit for biomass (Ekbom et al, 2003)
Figure 3: Block diagram of the gasification unit for plastic waste (Future Energy, 2003)
Both gasification technologies operate at temperatures of ~1200ºC and medium pressure. They are both fed with oxygen in order to obtain a high quality syngas. The gasifier used for biomass is an oxygen blown reactor bubbling fluidised bed (with a dolomite bed). Part of the CO2 removed from the syngas is recycled to the process and used in the lock hopper feeding system (cf. Appendix 12). Excess heat from the high temperature process is used to produce high pressure steam for downstream processes.
The gasifier used for plastic waste is an entrained flow gasifier (cf. figure 4), where water or oil is used as the slurry material. Chlorine from the waste material is removed from the syngas and recovered as NaCl. In order to avoid dioxin formation, the product gas is led to a direct quench. The use of a direct quench, results in less high temperature heat available for steam generation. Consequently large amounts of low pressure steam are produced in the plastic gasifier.

20
Figure 4: Different types of gasifiers (Bain, 2004)
4.2 Water gas shift (WGS)
The syngas leaving the gasifiers does not contain enough hydrogen for a high yield in the methanol production unit; hence the gas is led to the shift reactor where the hydrogen content is adjusted. In the water gas shift unit CO and H2O are shifted towards CO2 and H2 over a catalyst. The reaction is slightly exothermic and is given in Equation 4-1.
222 HCOOHCO +↔+ 4-1
The reaction is used to adjust the H2/CO-ratio to better suit the requirements in the methanol production unit. As the reaction is exothermic, a high yield of hydrogen is favoured by a low temperature. The WGS unit is modelled as two Gibbs reactors in Aspen HYSYS, the first at high temperature (350ºC) to utilise the kinetics for a fast reaction at high temperatures, the second at low temperature (260ºC) to shift the exothermic reaction 4-1 to the right at the more preferable low temperature. Temperatures were taken from Hamelinck et al. (2001). The block diagram is shown in Figure 5.

21
Figure 5: Block diagram of the water gas shift reactor system
4.3 Sulferox – removal of sulphur
The Sulferox process treats the syngas and removes the sulphur from the stream. The treated gas is sent to the CO2-removal unit, whereas the stream that contains sulphur is treated further in the Sulferox unit to produce solid sulphur. The process is shown in Figure 6.
Figure 6: Block diagram for Sulferox, removal of sulphur from the syngas (Ekbom et al, 2000).
4.4 CO2 removal unit
CO2 is removed from the syngas before it enters the methanol production unit. The block diagram showing the CO2 removal unit is given in Figure 7. CO2 is removed by use of amine absorption, where CO2 reacts with the amine in the absorber, the treated gas is then released with a low CO2 content. The amine is then regenerated by adding steam in the stripper, which release CO2 to vent.

22
Figure 7: Block diagram for the process of CO2 removal from the syngas (BioMeeT, 2000).
4.5 Methanol production
The next step in the concept is the production of methanol from syngas, which is achieved by a conventional methanol process (Liquid Phase methanol reactor). The main reactions are given below, both are exothermic reactions. In order to obtain maximum catalyst activity, 5% of the feed should be CO2 (Moulijn, 2003).
OHCHHCO 322 →+ (3)
OHOHCHHCO 2322 3 +→+ (4)
The conversion in the methanol reactor is low; hence a high recycling rate of the unreacted syngas is necessary. Part of the recycle gas is taken out as a purge gas in order to avoid build up of inert in the system. The purge gas is used as an energy source for steam generation. The methanol process given in Figure 8 differs from plants converting natural gas into methanol, since the MTO plant tolerates crude methanol as input. This means that the separation of methanol and water in distillation columns is avoided.

23
Figure 8: Block diagram for methanol production from the gasifier (BioMeeT, 2000).
4.6 Air separation unit (ASU)
Both gasification technologies are operated with 95% purity oxygen as the oxidation agent. Production of O2 is done in an air separation unit. Air is compressed and cooled, and then separated in a cryogenic distillation column. The block diagram is given in Figure 9.
Figure 9: Block diagram showing production of oxygen from air by use of cryogenic distillation
4.7 Methanol to olefins (MTO)
In the MTO process methanol is converted to olefins (mainly ethylene and propylene) over a catalyst. The principal reaction is given as Equation 4-2 (Kvisle et al., 2002).
OHHCHCCHCHCHOHCH 232223 55 ++→ 4-2
The block diagram of the MTO unit is given in Figure 10. The process consists of two parts; the circulating fluidised bed reactor and the separation sequence. The MTO plant is flexible wit regard to the C2/C3-ratio, and typically the ratio can be modified within a

24
range of 0.75-1.5 by adjusting the operating severity, with higher temperature leading to higher C2/C3-ratio (Kvisle et al., 2002).
Part of the reactant forms coke on the surface of the catalyst, which is beneficial as it increases the catalyst activity. Around 5% coking is suitable (Kvisle 2005), however large build-up of coke will hinder the products to be formed, and consequently the catalyst has to be regenerated. The catalyst is regenerated by burning off the coke by air in the second of the two reactors in the fluidised reactor system. The regeneration process emits CO2 to air as shown in figure 10.
Figure 10: Block diagram for the MTO unit (Kvisle et al., 2002).
Based on extensive tests in the demonstration plant, the MTO process is to be scaled up to a single train unit with capacity of up to one million tonnes of light olefins per year (Kvisle et al., 2002). Basic engineering of the first planned commercial MTO plant based on stranded natural gas, has been carried out. The plant will be part of a petrochemical complex in Nigeria, and is scheduled to come on stream in 2009, putting ahead of the projected 2007 date for a rival Egyptian MTO project. The plant will convert 2.5 million tonnes methanol into 400,000 tonnes of ethylene and 400,000 tonnes of propylene (Chementator, 2003). There are actually around the world 5 different MTO concept units on-going pilot projects: the MTO process demonstration unit (PDU) from UOP/HYDRO in Porsgrunn (Norway), the Lurgi Methanol To Propylene (MTP) PDU in Tjelbergodden (Norway), the ExxonMobil MTO PDU in Baytown, Texas (USA), the Total

25
Petrochemicals Olefin Cracking Process integrated with UOP/Hydro MTO (starting expected in 2007) in Feluy (Belgium) and the JGC Corp dimethyl ether to propylene (DTP) pilot (expected for 2007) in Japan. More details about the different MTO concepts are available in Appendix 15. No MTO plants is planned before 2009.
4.8 Borealis Borstar process for production of HDPE and PP
The block diagrams for production of HDPE and PP by use of the Borealis’s Borstar technology are shown in Figure 11 and 12, respectively. More details are given in Appendix 14.
Figure 11: Block diagram of Borealis’s Borstar technology for production of HDPE from ethylene
Figure 12: Block diagram of Borealis’s Borstar technology for production of PP from propylene

26
5 SCENARIOS In this section the different scenarios are outlined with assumptions, mass and energy balances. The base case scenario is discussed in detail, whereas for the other scenarios (Table 1) only the differences from the base case scenario are discussed. Each change is compared to the base case scenario in order to identify the most important factors for change in the system.
Table 1: Different scenarios modelled.
Wood waste feedstock Waste plastics feedstock
Base case*
Base case with coal electricity
Base case with hydropower electricity
Transport of feedstock from another country
Transport of methanol to the MTO
Gasifier improvement
H2 addition
* In establishing the base case scenario the main data sources – apart from plastics gasification process - were the BioMeeT and BioMeeT II reports (Ekbom et al 2000, 2003).The BioMeeT II is based on the BioMeeT report. In this study we have used the process

27
descriptions in BioMeeT, and the new mass and energy flows given in BioMeeT II. It was not possible to use one single source for data input to the study, as each of them have a specific context; the BioMeeT report contains data about a possible methanol production combined with energy production, the BioMeeT II is focusing on maximizing the methanol production and its feasibility in term of cost and market situation. In order to maximize the production of plastic material a high methanol production is desirable, hence the mass and energy balances in the BioMeeT II report suits our requirements the best. The process descriptions are however not included in the second report, hence the BioMeeT report was used for the process descriptions. We adapted the different process information given in the reports, and based on the detailed information given in the BioMeeT report, a simple model for Water Gas Shift (WGS), gas cleaning and methanol production was built in Aspen HYSYS.
5.1 Base case scenario 5.1.1 GASIFICATION TO CLEAN SYNGAS
As mentioned in Section 4.1, gasification requires different technological solutions for treatment of biomass and plastic waste. The gasifier used for biomass feedstock is based on the BioMeeT and BioMeeT II reports. The gasification is done in a 1-step reactor, technology by Carbona Oy engineers in 1999 (Ekbom et al, 2000). Gasification technologies using a two steps reactor, where the biomass is first pyrolysed with subsequent gasification has also been proposed (Van der Drift, 2005). The BioMeeT II report which aim to maximise the methanol output, has added a catalytic reformer at the output of the gasifier to decrease the higher hydrocarbons in the syngas (including tars) and increase the yield of H2 and CO. A high H2 content is suitable for methanol production.
For gasification of waste plastic, data were taken from a feasibility study made by Future Energy for Hydro Polymers in 2003 (Future Energy, 2003). The feasibility study evaluates the possibility of gasifying plastic waste in an entrained flow gasifier based on Noell technology. The aim of the study is to produce synthesis gas with high calorific value, which can be further processes to methanol. The feasibility study looked at gasification of 1 million tons of plastic waste per year, which was broken down to 3 process trains for practical reasons. In the base case scenario the option with water slurry is chosen, a higher quality syngas is, however, obtained by use of oil slurry in the gasifier. This is discussed later.
The composition of the raw syngas from the gasifier, for both biomass and plastic waste is given in Table 2. Without tar cracking, the syngas quality of biomass is close to the syngas from plastic waste. The composition of the waste material is given in Appendix 5.

28
Table 2: Composition of synthesis gas out of the gasifier
Biomass
(Ekbom, 2003)
Plastic waste
(Future Energy, 2003) Component
Raw gas
[vol%]
Dry basis
[vol%]
Raw gas
[vol%]
Dry basis
[vol%]
CO 25.83 32.68 20.61 37.19
CO2 15.81 20.0 12.2 22.01
H2 33.53 42.42 21.3 38.43
H2O 20.97 0 44.58 0
CH4 0.17 0.22 0 0
N2 3.65 4.62 0.75 1.35
HCl 0 0 0.54 0.97
H2S 0.0147 0.0186 0.02 0.04
COS 0.001 0.0013 0 0
NH3+HCN 0.0279 0.0353 0 0
H2/(CO+CO2) 0.81 0.81 0.65 0.65
Data for energy consumption in the Air Separation Unit (ASU) are taken from the BioMeeT II report for both biomass and plastic waste gasification, and adjusted for the higher oxygen use in the plastic waste gasifier.
The raw product gas from the gasifier reacts with steam in the WGS to increase the H2
content in the syngas. The data taken from the BioMeeT II report is used for both plastic waste and biomass. All numbers, mass and energy balance, are adjusted to the new mass

29
flow and composition by use of the Aspen HYSYS model. The H2/CO-ratio at the outlet of the gasifier is the same for the syngas based on plastic and biomass, the mass flow, however, differs.
After the WGS reactor, sulphur and CO2 is removed before the syngas can be transformed to methanol. The gas cleaning section (sulphur and CO2 removal) is also modelled in HYSYS by using a component splitter to establish the mass flows. The component split fraction is taken from BioMeeT and used for both plastic waste and biomass.
The energy use in production of methanol from biomass is taken from the BioMeeT II report. For plastic waste, the energy use for the gasifier is taken from the Future Energy study (2003), whereas the energy use in WGS, gas cleaning and methanol production is scaled by use of a linear correlation between mass and energy balances in the BioMeeT II report.
The methanol process is given in Figure 8. The off gas from the methanol plant is combusted to generate steam. The methanol production given in Figure 8 differs from plants converting natural gas into methanol, since it does not include steam reforming of natural gas and in addition the MTO plant tolerate crude methanol as input, which means that the separation of methanol and water in distillation columns is avoided. The energy consumption given in the BioMeeT II (Table 3) report includes separation of methanol and water. Since pure methanol is not needed in the MTO process, crude methanol with about 20-30% water will be used (Kvisle 2004). The energy consumed is reduced to 2/3 of the total energy consumption given in the BioMeeT II report. The energy reduction is calculated by using a HYSYS model for methanol production, which shows that approximately 1/3 of the energy (steam and electricity) is used in separation (Rahul et al., 2004).

30
Table 3: Biomass to Liquid (BtL) energy and mass balance (Ekbom 2003)
Energy (MJ) Material flows (MJ) Process Unit
Electricity Steam Input Output
Gasification island
3.3 32.68 229 176.2
SulFerox + Shift Island
15.81 11.1 176.2 174.2
CO2 Removal
Island
1.3 8.9 174.2 173.3
Methanol
Island
5.1 7.6 173.3 142.6
The energy consumption in the waste to methanol is based on the Sankey diagram given in the BioMeeT II report. The energy need for each unit is then calculated based on the given energy flows. The BioMeeT II report assumes that the processes involved in waste to methanol are integrated through a steam island. The gasifier has excess energy used to produce steam directly, whereas the off gases in the methanol reactor are burned in a heat recovery steam generator (HRSG) to produce steam. It is not clear whether this integration is the optimum, but the recovery of off gases and high temperature processes show at least some process integration.
The electricity consumed in the production is assumed to be E.U average including 9 % grid loss. Life Cycle Inventory (LCI) data come from the LCAiT “Energy & transport database” (2004). The composition of the E.U mix is given in Appendix 4. Changes in the electricity mix are discussed in Section 6.5.

31
5.1.2 METHANOL TO PLASTICS
The MTO unit, converting methanol to olefins, is the UOP/Hydro patented MTO process. Mass and energy balances are based on information provided by Norsk Hydro and a SRI report (Nirula, 1994). Crude methanol is used in the MTO reactor, giving a product distribution as shown in Table 4. Ethylene and propylene are products used as feedstock in production of PP and HDPE, whereas butene is sold as a by-product. The remaining products, Fuel gas, are burned to provide energy for the process. This is in accordance with the MATTER report (Joosten 2003).
Table 4: Product distribution from the MTO process (Nirula, 1994)
Component Product gas [wt%]
Products Ethylene
Propylene
Butene
55.2
27.0
7.8
Flue gas CO
H2
CH4
C2H6
C2H4
C3H8
C4H10
C5+
0.32
0.26
1.7
1.7
0.28
1.5
1.4
3.0
Using the product distribution from Table 4, per kg of ethylene produced the following are required: 3.74 kg methanol, 3.08 kg steam at 100 bars and 0.034 kWh electricity (Nirula, 1994).

32
Plastic production is done by use of the Borstar technology and the data are taken from Nexant and its study on Borealis Borstar processes for PP and HDPE (Paulik 2005). The production of polyolefins is very clean, where emissions originate in the electricity production mainly. The efficiency of ethylene to HDPE and propylene to PP is 100 % and 98.7 %, respectively.
The MTO and plastic production is not integrated with the waste-to-methanol island. It is assumed that there is enough steam for all process steps when the off gases from methanol and MTO are burned.
5.1.3 TRANSPORTATION
Transport of waste and intermediate products are included in the assessment.
Figure 13: Base case transport system with collection of waste by trucks
For our base case, only feedstock logistics have been modelled with transport of woody biomass and waste plastics by trucks to the plant (cf. figure 13). LCI data for transport of biomass - collection by heavy truck, 123 km distance, and new truck engines emissions - are taken from the BioMeeT II report and relevant sources (c.f. LCAiT paper bag case study for the 123 km distance to the plant). For plastic waste, transport by truck for 200 km with empty return is used. This transport distance is chosen based on previous work published by Björklund et al. (2005). The LCI data for the transport of plastics are taken from Baumann and Tillman (2004). The fuel used in transportation is based on fossil resources.

33
5.2 Technological improvement of the gasifier
The gasification technology applied in the base case for plastic wastes uses water slurry. The quality of the syngas from gasification of plastic waste can be improved by using oil slurry instead. The disadvantage is that oil has to be bought for the slurry. In some cases the slurry can be based on used oil. Used oil is not allowed on landfill and one treatment method is to gasify it for energy or material purposes. When oil slurry is used, the calorific value of the feed to the gasifier increases, resulting in a higher quality syngas. Higher quality means less CO2 and more CO and H2 compared to the base case with water slurry.
The assumptions used in the calculations are:
1. Production and transport of the used oil is not included as the overall impact of the transport is very low
2. The energy use for each process step is scaled with respect to the change in mass flows
For biomass gasification an improved technology is already used in the base case scenario when the tar cracker is included. Katofsky (1993) and Williams et al. (1995) have evaluated technologies for production of methanol from biomass that are likely to be commercial on the short term. They have shown that methanol can be produced from biomass with a net high heating value (HHV) energy efficiency between 54 and 58 %. The scale of production was fixed at 400 MWth. Hamelinck and Faaij (2001) have modelled various process routes from biomass to methanol by use of the Aspen+ software. The objective of their study was to identify concepts for biomass to methanol and hydrogen that may lead to higher overall energy efficiencies and lower costs on longer term. They have found that methanol can be produced from biomass with a HHV efficiency of 52-59%.
The corresponding HHV efficiency for the base case system described in Section 5.1, is 53.8%. This implies that the technology improvement potential is limited with the technologies that exist today.

34
Addition of coal: the addition of coal in a biomass based feedstock has not been mentioned – as far as we know – however co-gasification of coal and biomass is a classic option for making greener coal based power or fuels (by adding biomass into a coal feedstock stream). Efficiencies have been simulated for biomass-coal co-gasification systems up to a coal-biomass ratio of one (Chmielnak et al 2002).
5.3 Addition of hydrogen
Another way to improve the system is to avoid the shift reactor by addition of hydrogen to the system. Hydrogen is added to the syngas prior to the methanol reactor in order to adjust the H2/CO-ratio in favour of the methanol production unit.
Hydrogen is produced as a main product and a valuable by-product in industrial processes (Steinberg and Cheng, 1989). The most widely used production route for hydrogen production is catalytic steam reforming of natural gas. When this technology is used, 50% of the hydrogen produced comes from water (steam) and 50% from the methane used as feed (Steinberg and Cheng, 1989). Another production route for hydrogen is gasification of coal with downstream water gas shift of the carbon-rich synthesis gas. Hydrogen is also produced by electrolysis of water. This process requires large amounts of electricity, whereas all the hydrogen produced comes from the renewable resource water.
Hydrogen is also an important by-product in a number of chemical processes. These processes include production of chlorine from the electrolytic chlor-alkali process, hydrogen produced from crude oil refinery processes, in the production of coke from coal in the coke oven gases and in chemical dehydrogenation processes, e.g. ethylene plant purge gases, ammonia dissociation and hydrodealkylation (Steinberg and Cheng, 1989). In this study we concentrate on by-product hydrogen from chlor-alkali and refinery processes even if other sources of potential cheap available hydrogen are available (Lasher et al 2005). Again, none of the emissions from chlor-alkali or refinery processes are allocated to the hydrogen added, as it is seen as a by-product which is regardless of the need for hydrogen elsewhere. More details are given in Appendix 10.
Compared to the base case scenario, the WGS reactor is removed. Hydrogen is added to the syngas until the same H2/CO-ratio as in the base case is obtained. All downstream units are adjusted linearly to the new mass flow.

35
5.4 Change in electricity and transport systems
The electricity mix used in the base case scenario is the E.U electricity mix, which is an average for electricity production in E.U. Other electricity mixes can however be found, for example hydropower in Norway and coal based in some Eastern European countries. The change in overall CO2 emissions with change in electricity mix is shown in Section 6.5.
Transport of feedstock, intermediates and products influence the overall global warming potential of the system. In the base case scenario only transport of the waste material is included in the results as the processes are assumed to be located in the same place. In order to look at the influence transport distances have on the overall impact, increased transport distance for the waste material and transport of the intermediate product methanol is introduced (cf. figure 14). The transport distance for feedstock is increased from 200 km by truck for plastic waste (123 km for wood wastes) to transport from Norway to Poland. The following transport is modelled; 123 km for wood wastes and 200 km for plastics, by truck in Norway, followed by 780 km by boat from Norway to Poland and finally 300 km by truck in Poland, empty return. The intermediate product, methanol is liquid at room temperature with a boiling point at 65ºC, hence transport of methanol can be done by boat. The transport distance is set to 10000 km, which is a relevant number for methanol shipping. Indeed it represents the distance between a methanol plant based on natural gas (in Chile for instance) and the end market (California, for instance, with MTBE production, even if MTBE will be phased out in this state in 2007 due to water contamination). Santiago-San Francisco is about 9548 km, if one wants a today’s situation example. For our model those 10000 km represent the distance between the waste-to-methanol plant and the methanol-to-plastic plant. It is the distance between the region where the feedstock is available and where the waste handling facilities and infrastructures are not that developed and/or greatly needed (for instance south-east Asia or India), and Europe where the olefins conversion and high quality plastic facilities exist near the market (the distance between Singapore and Oslo is about 17000 km).

36
Wastecollection
Transport (road)
MethanolPlant
MTOPlant
Polyolefinunit
Plastics
Wastecollection
Transport (road/boat)
MethanolPlant
MTOPlant
Polyolefinunit
Plastics
changes
Wastecollection
Transport (road)
MethanolPlant
Transport to MTO
CentralisedMTO Plant
Polyolefinunit
Plastics
Transport of feedstock Transport of methanolBase case
Figure 14: Changes in transport system
5.5 Models HYSYS was used to simulate a waste-to-plastics route via syngas and methanol, which is then converted into light olefins. Two different cases were investigated, using wood waste and plastic waste, respectively, as feed-stock. Based on literature/industrial data (cf. 1 Figure 15), we built a HYSYS model. The model takes the raw syngas from the gasifier as an input and treats it all the way to methanol. The steps in the HYSYS model are the following:
- Water removal from the syngas, done by component splitter (Figure 15). - Water gas shift (WGS) as a two stage process with addition of water to obtain a
H2/CO-ratio of 2 after the WGS (Figure 15). - Removal of sulphur done by a component splitter using the same split fraction for
all scenarios (Figure 15). - Removal of CO2 done by two component splitters, where the first one is “recycle
gas” to the biomass gasifier, and the second is flue gas. For plastic waste the output from the first and second splitter are classified as flues gas as no recycle gas is needed in the gasifier (Figure 15).
- Reaction of cleaned syngas to methanol, at conversion of 92% (Ekbom, 2003). The reactor is followed by a component split of methanol, water and non-reacted syngas. The unreacted syngas is used as fuel gas in the steam island.

37
- The CO2 emissions from the steam island are calculated by combustion of the flue gas from the methanol reactor.
Syngas from
gasifier
Waterremoval
Water gas shift
Sulphurremoval
CO2 removal
Methanol synthesis
Unreactedsyngas split
Methanol
Wastecollection
Transport (road)
MethanolPlant
MTOPlant
Polyolefinunit
Plastics
Wastecollection
Transport (road/boat)
MethanolPlant
Transport to MTO
CentralisedMTO Plant
Polyolefinunit
Plastics
HYSYS model Excel LCA model
ExcelFor resultpresentation
LCAiT LCA model
1 2 3 4
Figure 15: LCA-process modelling integration for the waste-to-plastics case study
The results from the HYSYS model were then exported (cf. 2 Figure 15) to an Excel LCA model which includes input, output and emissions for each process step, normalised to the functional unit (1 kg of plastics). The process units Methanol To Olefin (MTO), Air Separation Unit (ASU), transport and plastic production were not modelled in HYSYS and these process data were taken directly into the Excel model. The Excel model was used to calculate the CO2 emissions from the system, both renewable and non-renewable. The mass flows were then exported to the LCAiT software (cf. 3 Figure 15) to calculate the environmental impacts of the process and what-if scenarios using LCAiT databases. Finally the impact assessments graphs together with the Life Cycle Inventories were exported to Excel files for LCA results presentation (cf. 4 Figure 15).
Following are some indications about the models:
Data for the ASU is taken from the BioMeeT report, adjusting the energy use linearly with mass flow for the different scenarios.

38
MTO is based on the SRI report, with mass flows and energy use as given in Section 5.1.2. The CO2 emissions from combustion of the flue gases are calculated by complete combustion in HYSYS, whereas the CO2 emissions from regeneration of the catalyst are adjusted linearly by the amount of methanol treated.
Transport of the waste material is modelled as given in Section 5.1.3.
Production of plastic material is modelled by use of material and energy balances given in the Borealis Borstar technology.
References to the models are given in Appendix 6.
6 RESULTS The results given in this section (cf. table 5) are based on the combined Hysys, Excel and LCAiT models described in Section 5.5. The base case scenario for wood and plastic waste is presented first, followed by closer look at the most important factors influencing the total performance of the system. The factors that are tested for the sensitivity in the system are technological improvement of the gasifier, additional H2 to the system, change in transport system and variation of electricity mix. The focus in this section is on global warming potential, given in CO2-equivalents, and energy use.
Table 5: Results summary of CO2-eqv and waste per functional unit for the various scenarios.
Waste per functional unitScenario Renewable CO2
Non-renewable CO2
Dry As received
Wood 5.8 1.4 4.7 9.4 Base case
Plastic 5.8 2.2 3.6 3.6
Improved gasifier Plastic 4.4 1.4 2.8 2.8 (1.4)1
Wood 3.5 1.1 3.4 6.7 H2 added
Plastic 3.5 1.7 2.7 2.7

39
150 % oil slurry in the treated material; 1.4 kg of waste plastics per functional unit and 1.4 kg of oil per functional unit.
6.1 Base case scenario
The results for the base case scenario are presented in two steps. First the methanol island, which consists of gasification, ASU, sulphur removal, CO2 removal, steam generation and methanol production, is treated as one unit, and then the methanol island is broken down into its separate units. This is explained in more detail in Section 6.1.2.
6.1.1 METHANOL ISLAND AS ONE UNIT
The results presented here include the entire system producing new plastic from wood waste and plastic waste, respectively. All numbers are given per functional unit, 0.68 kg HDPE and 0.32 kg PP. The CO2-equivalents are divided into renewable and non-renewable. Non-renewable comes from combustion of fossil fuels, e.g. electricity production and fuels, whereas CO2 formed by carbon in the waste material is formed renewable. It can be argued that CO2 from oxidation of plastic waste is not renewable, and should have been given a different name. The discussion will not be outlined here, but it is chosen to represent the CO2 emitted from the waste as renewable. The reason for keeping renewable and non-renewable CO2 separate is the added knowledge that can be achieved by this method.

40
0
1
2
3
4
5
6
7
8
9
Woo
d
Pla
stic
Woo
d
Pla
stic
Woo
d
Pla
stic
Woo
d
Pla
stic
Woo
d
Pla
stic
Woo
d
Pla
stic
Woo
d
Pla
stic
MeOH MTO HDPE PP Transport Preparation Total
CO2
eqv
[kg]
Non-renewable CO2Renewable CO2
Figure 16: Global warming potential for each process step per f.u., kg polymer. The clear columns represent “renewable” CO2, whereas the dark columns represent non-renewable CO2.
From Figure 16 it can be seen that production of methanol from waste is dominating the CO2 emissions for both wood and plastic waste. The columns named MeOH in the figure include gasification, WGS, gas cleaning, ASU and methanol production. Further the CO2 emitted from the waste material (here: Renewable CO2) dominate over CO2 emitted from other sources. Other sources include production of electricity and emissions during transport. The main difference between wood and plastic waste is the higher non-renewable CO2 emissions in gasification of plastic waste. The reason is the higher oxygen consumption in the gasifier, resulting in a higher electricity consumption in the energy intensive ASU. The last two columns in Figure 16 show the total contribution from wood and plastic waste, respectively, and it can bee seen that production from plastic waste has a higher global warming potential than wood. The main difference is the electricity consumption.

41
The renewable CO2 emitted in the MTO comes from combustion of the flue gases as given in Table 4. The energy released in the combustion is used in steam production for the MTO process. Transport of waste material has a minor impact on the total emissions.
A closer look at the non-renewable CO2 emissions are given in Figure 17a and b, showing that the waste to methanol still dominates the picture, but production of HDPE is also contributing. The reason that HDPE contribute more than PP is the higher production of HDPE defined in the functional unit and the higher power demand for HDPE unit (Paulik 2005). For wood waste, see Figure 17a, the contribution is more diverse than for plastic waste; this is due to the higher contribution from methanol in the plastic waste case, which consequently dominates the other categories. In addition, preparation of the waste is included in MeOH for plastic waste, which is given as a separate category or wood waste. Emissions from transport of the waste are negligible compared to the total CO2 emission from the system.
PP
Transport
Preparation
MTO
HDPE
MeOH
MTO
HDPE
MeOH
PP Transport
Figure 17a: Contribution to non-renewable CO2 by unit in production of plastic from wood waste.
Figure 17b: Contribution to non-renewable CO2 by unit in production of plastic from plastic waste

42
6.1.2 METHANOL ISLAND SHOWN AS SEPARATE UNITS
Since the main contributor is production of methanol from waste, it interesting to take a closer look at the units included; gasification, WGS, gas cleaning and methanol production. There are several reasons for treating the methanol island as one unit; the most important is that allocation problems are avoided. Problems with allocation arise when the emissions are to be allocated to the various units in the methanol island. However, in order to look at specific improvement factors for the methanol island, it is necessary to look into the details. Various ways of allocating the CO2 emissions are outlined in Appendix 7.
The results can be represented in two ways; based on where CO2 is emitted or where it is formed. The first approach allocates most of the environmental burden on the CO2 removal unit; whereas the second approach allocate the emissions to the gasifier and the shift reactor. The latter of the two approaches is chosen here, as it seems to represent the impact in such a way that it can be used in system evaluation and improvement.
0
1
2
3
4
5
6
7
8
Woo
d
Pla
stic
Woo
d
Pla
stic
Woo
d
Pla
stic
Woo
d
Pla
stic
Woo
d
Pla
stic
Woo
d
Pla
stic
Woo
d
Pla
stic
Woo
d
Pla
stic
Gasifier ASU Shift Sulferox CO2removal
Methanol Steam Total
CO2 e
qv [k
g]
Non-renewable CO2Renewable CO2

43
Figure 18: Global warming potential for each process step in production of methanol from waste per f.u, kg polymer. The clear columns represent “renewable” CO2, whereas the dark columns represent non-renewable CO2.
In Figure 18 the global warming potential are given for each unit in the methanol island. The picture is similar for both plastic and wood waste, with the gasifier and shift units as the main contributors.
The CO2 emissions from this system can be divided into three categories:
• CO2 as a result of the technology chosen • CO2 from “system restrictions” • Renewable and non-renewable CO2
An example of technology restrictions is the CO2 emitted from the gasifier. This can be decreased by better performance of the gasifier [Technology]. Second, the CO2 formed in the shift reactor is due to the need for a higher H2/CO-ratio in the methanol production. These emissions can not be decreased by improved technology in each unit, only by improving the system [System restrictions]. The third entry is the difference between renewable and non-renewable CO2. Part of the CO2 released comes from the treated material, part from transport and energy use [renewable/non-renewable].
The potential for technology improvement is primarily in the gasifier, where large amounts of renewable CO2 are emitted. Technology improvement of the gasifier is discussed in Section 6.2. In addition to the gasifier itself, the production of oxygen is energy intensive, which contributes to a large part of the non-renewable CO2 emissions. Any decrease in oxygen use per functional unit is beneficial in addition to improved technology for production of oxygen. Use of alternatives O2-production technologies – separation membranes, electrolysis, etc… - are not studied here, but the use of membranes is probably one of the most interesting alternatives. The cryogenic process route is the preferred one today, whereas advanced concepts for heat integration can favour the use of membranes or chemical separation in the future (Smith and Klosek, 2001).

44
The CO2 allocated to the shift reactor shows the potential for improvement of the system. In the WGS, CO is shifted to H2 to increase the methanol yield, resulting in formation of CO2. The system can be improved by increasing the H2/CO-ratio in the syngas to avoid shifting of CO. One way to increase the ratio, is to add hydrogen to the stream, this is shown in Section 6.3.
6.2 Technological improvement
Technological improvement of the units is one way of improving the performance of the system. In this section focus is on improvement of the gasifier, as it is identified as one potential improvement factor. The section starts with a look at the theoretical maximum yield in the gasifier, followed by an approach to increase the syngas quality for wood waste and plastic waste.
6.2.1 THEORETICAL MAXIMUM
In order to identify the theoretical maximum yield for the gasifier, the method of minimisation of Gibbs energy is used by modelling a Gibbs reactor in Hysys. The details are given in Appendix 13. The energy released in the exothermic reaction with oxygen is used to break down the plastic waste in the pyrolysis zone. If the energy required for the endothermic pyrolysis reaction is higher than the energy released in gasification zone, more oxygen has to be used in order to support the more exothermic reaction to complete combustion. The results from the Hysys model shows that there is a surplus of energy released in the gasification zone compared to the heat required in the pyrolysis zone, which means that theoretically it is possible to reduce the CO2 emissions close to 0. The excess heat results in a rise in temperature.
6.2.2 WOOD WASTE AND TECHNOLOGY IMPROVEMENT
As mentioned in section 5.2, Katofsky (1993) and Williams et al. (1995) have found that methanol can be produced from biomass with a HHV efficiency of 52-59%. The corresponding HHV efficiency for the base case system shown in Section 5.1, is 53.8%. This implies that the technology improvement potential is limited with the technologies that exist today.
The addition* of coal in a biomass based feedstock is not commonly used - as far as we know - but improving coal based gasifiers by adding some biomass in the input is a classic strategy.
* By addition, we mean that the main stream is biomass and that some coal is added but do not represent an important part of the energy flowrate.

45
6.2.3 PLASTIC WASTE AND TECHNOLOGY IMPROVEMENT
The results from gasification technology using oil slurry are presented in this section. We remind the reader some of the assumptions made for this derivation:
1. The slurry is based on used oil. 2. Production and transport of the used oil is not included as the overall impact of the
transport is very low 3. The energy use for each process step is scaled with respect to the change in mass
flows
In Figure 20 and 21 the total CO2 emissions from the system are given. The total CO2-eqvivalents are reduced from 8 kg in the base case to 5.8 kg in this improved case.
0
1
2
3
4
5
6
MeOH MTO HDPE PP Transport
CO
2 eqv
[kg]
Non-renew able CO2
Renew able CO2
Figure 20: Global warming potential for each process step per f.u., kg polymer from waste plastics. The clear columns represent “renewable” CO2, whereas the dark columns represent non-renewable CO2
As in Section 6.1.2 the methanol island represents waste treatment, gasification and production of methanol. In Figure 21 the methanol island is broken down to show where the CO2 equivalents are produced, again in accordance with the representation in Section 6.1.2.

46
0
0,5
1
1,5
2
2,5
Gasifier ASU Shift Sulferox CO2removal
Methanol Steam
CO
2 eqv
[kg]
Non-renewable CO2Renewable CO2
Figure 21: Global warming potential for each process step in the methanol island - MeOH figure 20 - per f.u., kg polymer from waste plastics. The clear columns represent “renewable” CO2, whereas the dark columns represent non-renewable CO2
Table 6: Summary of renewable and non-renewable CO2-eqv for plastic waste in base case and the case with technology improvements improved case.
Base case [kg CO2 eqv] Technology improvement [kg CO2 eqv] Unit
Renewable CO2 Non-renewable CO2 Renewable CO2 Non-renewable CO2
Gasifier 3.23 0.50 1.11 0.19
ASU 0 1.15 0 0.73
Shift 1.58 0 2.34 0
Sulferox 0 0 0 0
CO2 removal 0 0.065 0 0.045
Methanol 0 0.17 0 0.16
Steam 0.50 0 0.47 0

47
MTO 0.52 0.012 0.52 0.013
HDPE 0 0.19 0 0.19
PP 0 0.063 0 0.063
Transport 0 0.034 0 0.013
Total 5.83 2.18 4.44 1.40
The summary of renewable and non-renewable CO2 equivalents in the improved case compared to the base case is given in Table 6. The change in non-renewable CO2 is larger than the corresponding change in renewable CO2. The reason for the large reduction in non-renewable CO2 is mainly lower need for oxygen per unit of syngas produced in the gasifier and less natural gas used in the improved gasifier. These two reductions refer to the entry “ASU” and “Gasifier” respectively.
For renewable CO2 the reduction in emissions is also significant for the technological improvement. The syngas from the gasifier has a lower CO2 content, but also a smaller H2/CO-ratio than the base case, hence more H2 has to be produced in the shift reactor. When more CO is shifted in the WGS it results in a higher CO2 emission from the shift reactor. In total, however, the CO2 emissions from the gasifier and the shift reactor are lower for the improved technology.
6.3 Addition of hydrogen
In Table 7 and 8 the results are summarised for plastic waste and wood, respectively. Compared with the base case, additional hydrogen improves the overall performance of both systems. Instead of shifting part of the CO to hydrogen, hydrogen is added to the high CO-content stream resulting in a higher plastic production. Higher plastic production means less electricity needed per functional unit, resulting in lower non-renewable CO2 emitted from the ASU. Renewable CO2 is also reduced with this approach; the avoided shift reaction is the main reason for the improvement.
Table 7: Summary of CO2-eqv for plastic waste in base case and the case with added H2 per f.u., kg polymer.

48
Base case [kg CO2 eqv] Hydrogen added [kg CO2 eqv] Unit
Renewable CO2 Non-renewable CO2 Renewable CO2 Non-renewable CO2
Gasifier 3.23 0.50 2.43 0.37
ASU 0 1.15 0 0.86
Shift 1.58 0 0 0
Sulferox 0 0 0 0
CO2 removal 0 0.065 0 0.049
Methanol 0 0.17 0 0.13
Steam 0.50 0 0.48 0
MTO 0.52 0.012 0.52 0.013
HDPE 0 0.19 0 0.19
PP 0 0.063 0 0.063
Transport 0 0.034 0 0.026
Total 5.83 2.18 3.50 1.70
Table 8: Summary of CO2-eqv for wood waste in base case and the case with added H2 per f.u., kg polymer.
Base case [kg CO2 eqv] Hydrogen added [kg CO2 eqv] Unit
Renewable CO2 Non-renewable CO2 Renewable CO2 Non-renewable CO2
Gasifier 3.51 0.20 2.50 0.14
ASU 0 0.49 0 0.35
Shift 1.15 0 0 0
Sulferox 0 0 0 0
CO2 removal 0 0.079 0 0.056
Methanol 0 0.31 0 0.22

49
Steam 0.61 0 0.52 0
MTO 0.52 0.013 0.52 0.013
HDPE 0 0.19 0 0.19
PP 0 0.042 0 0.063
Transport 0 0.047 0 0.033
Total 5.79 1.37 3.54 1.07
6.4 Transport system
In this section, the impact of transport system changes described in section 5.4 will be described. Transport of feedstock, intermediates and products contribute to the overall environmental impact of the system. In Section 5.1 it is shown that in the base case, where only the feedstock is transported by truck over a distance of 200 km, transport is a negligible part of the overall GWP of the systems. In this Section the transport distance for feedstock is increased and long-distance transport of methanol is introduced.
The transport distance for feedstock is increased to transport the feedstock from Norway to Poland. We remind the reader that the following transport is modelled: 200 km and 123 km by truck for plastics and wood respectively in Norway, 600 km by boat from Norway to Poland and finally 200 km by truck in Poland, empty return. We choose Norway since plastic waste is already shipped from Norway to Germany and transformed to methanol via gasification (SVZ 2004) and that transport distance from Norway could be extrapolated to Sweden or Finland for wood waste feedstock.
For methanol transport, the transport distance is set to 10000 km, which represent the distance between the methanol plant and the end market region.
Change in transport only change the non-renewable CO2 eqv, the renewable emissions are kept constant. Consequently, only the non-renewable CO2 eqv are presented here. In Figure 22 the results from the increase in transport distance for methanol and feedstock

50
are given, respectively. In the base case, transport is a small contributor of the total GWP, whereas for increased transport distances the transport is naturally more important. The transport distance for methanol is longer than for the feedstock, which explains the larger impact for transport of methanol. It is important to note, however, that only the non-renewable CO2 are shown in Figure 22. From the base case it is known that the non-renewable CO2 accounts for only 20-30% of the total CO2 equivalents emitted from the system. The relative increase in the total GWP is hence lower than shown in Figure 16.
0
0,5
1
1,5
2
2,5
3
Base case Transport ofMeOH
Transport offeedstock
Base case Transport ofMeOH
Transport offeedstock
Wood Plastic
CO
2 eqv
[kg]
CO2 totalTransport
Figure 22: Change in non-renewable CO2-eqv with increasing transport distances for methanol and feedstock, respectively per f.u., kg polymer.
6.5 Electricity mix
The total global warming potential of the system is dependent on the electricity mix used in the evaluation. In this section the choice of the electricity mix is evaluated, comparing the total GWP of the system with use of E.U electricity mix, electricity based on coal and on hydropower. E.U electricity mix is used in the base case scenario. Composition of the various electricity mixes are given in Appendix 4. As for transport, only the non-renewable emissions are given because the renewable CO2 eqv will stay unchanged when the electricity mix is changed.

51
In Table 9, the changes in non-renewable CO2 emissions with electricity mix are summarised. In the first two columns the electricity related CO2 equivalents is shown, whereas the total non-renewable CO2 emissions are given in the last two columns. Coal based electricity emits approximately 70 % more CO2 equivalents than the E.U mix. For both coal and the E.U mix, electricity is the main contributor to the total non-renewable emissions. Hydropower is produced form water, and the CO2 emissions related to production are very low, as shown in the first two columns in Table 9. In addition to CO2 emissions from electricity, emissions from transport also contribute to the total non-renewable CO2 emissions. With the low contribution from electricity production, transport becomes more important for the case with hydropower, with the consequence that wood comes out with a higher GWP than plastic. Transport of wood is more intensive than transport of plastic, mainly because more wood has to be transported per functional unit.
Table 9: Change in total and electricity related non-renewable CO2 equivalents with varying electricity mix, per f.u., kg polymer.
Electricity CO2-eqv [kg] Total CO2-eqv [kg] Electricity mix
Wood Plastic Wood Plastic
E.U mix (base case) 1.1 2.0 1.3 2.1
Coal based 2.1 3.6 2.3 3.7
Hydropower 0.002 0.003 0.13 0.07
It is evident that the choice of electricity mix influences the overall renewable house gas emissions from the systems that are evaluated. The conclusions will, however, not be changed as long as the same electricity mix is used in the comparison.

52
7 DISCUSSION This report focuses on the global warming potential and to a certain extent also on the energy use in the system (like most of the polymers LCA studies cf. Patel 2001). The other impact categories are, however, also calculated and the results are given in Appendix 8.
The results of the scenarios that are presented in the previous section all have one thing in common; the renewable CO2 equivalents are dominating. The renewable CO2 is defined as CO2 from the waste material; plastic waste or wood waste. The non-renewable CO2 comes from production of electricity and use of fossil fuels for transport.
The main difference between the “wood waste to plastic” and “plastic waste to plastic”, is the large oxygen use in the plastic gasifier compared to the one used for biomass. There are two reasons for this, the first and most important is the higher oxygen content in the biomass than in plastic waste (38.6 wt% compared with 7.1 wt%) which means that less added oxygen is needed for biomass. The second reason is the higher quality of the syngas from the biomass gasifier (lower CO2 content) which means that less oxygen is needed to produce the unwanted CO2 and H2O. It is important to note, however, that in the base case scenario the biomass gasifier has a tar cracking unit added to the gasifier which increases the quality of the syngas, the plastic waste gasifier does not have this, and it is possible that this unit would have been beneficial also for the plastic waste gasifier. Moreover, to avoid dioxin formation, the product gas out of the plastics gasifier is led to a direct quench, resulting in less high temperature heat available for steam generation.
The need for more oxygen in the plastic waste gasifier means more oxygen has to be produced in the energy intensive air separation unit, this results in larger non-renewable CO2 emissions. The other general trends that can be seen from the base case scenario are that electricity production dominates the non-renewable CO2 emissions, and the methanol
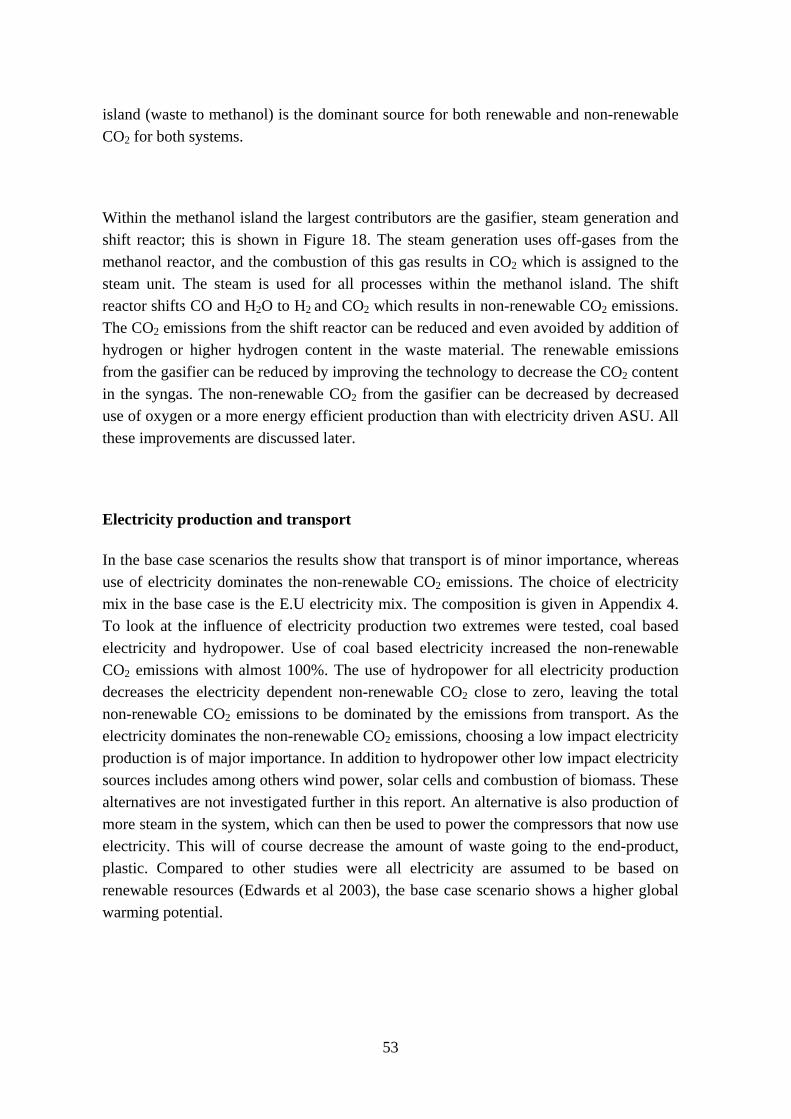
53
island (waste to methanol) is the dominant source for both renewable and non-renewable CO2 for both systems.
Within the methanol island the largest contributors are the gasifier, steam generation and shift reactor; this is shown in Figure 18. The steam generation uses off-gases from the methanol reactor, and the combustion of this gas results in CO2 which is assigned to the steam unit. The steam is used for all processes within the methanol island. The shift reactor shifts CO and H2O to H2 and CO2 which results in non-renewable CO2 emissions. The CO2 emissions from the shift reactor can be reduced and even avoided by addition of hydrogen or higher hydrogen content in the waste material. The renewable emissions from the gasifier can be reduced by improving the technology to decrease the CO2 content in the syngas. The non-renewable CO2 from the gasifier can be decreased by decreased use of oxygen or a more energy efficient production than with electricity driven ASU. All these improvements are discussed later.
Electricity production and transport
In the base case scenarios the results show that transport is of minor importance, whereas use of electricity dominates the non-renewable CO2 emissions. The choice of electricity mix in the base case is the E.U electricity mix. The composition is given in Appendix 4. To look at the influence of electricity production two extremes were tested, coal based electricity and hydropower. Use of coal based electricity increased the non-renewable CO2 emissions with almost 100%. The use of hydropower for all electricity production decreases the electricity dependent non-renewable CO2 close to zero, leaving the total non-renewable CO2 emissions to be dominated by the emissions from transport. As the electricity dominates the non-renewable CO2 emissions, choosing a low impact electricity production is of major importance. In addition to hydropower other low impact electricity sources includes among others wind power, solar cells and combustion of biomass. These alternatives are not investigated further in this report. An alternative is also production of more steam in the system, which can then be used to power the compressors that now use electricity. This will of course decrease the amount of waste going to the end-product, plastic. Compared to other studies were all electricity are assumed to be based on renewable resources (Edwards et al 2003), the base case scenario shows a higher global warming potential.

54
For transport of feedstock, intermediates and products only feedstock were included in the base case. The base(s) case(s) with transport of the waste(s) by truck (123 km for wood wastes and 200 km for plastics) shows that transport is negligible compared to the overall non-renewable CO2 emissions. The transport distance used for the base case is short - compared to oil logistics for instance - and two scenarios were undertaken to look at the impact of increasing the transport distances. First the transport distance for feedstock was increased to transport from Norway to Poland (Oslo-Gdansk 781 km). The following transport was modelled; 123 km for wood waste and 200 km by truck in Norway, 781 km by boat from Norway to Poland and finally 300 km by truck in Poland, empty return. Second transport of the intermediate product methanol was introduced, modelled as transport by boat at a transport distance of 10000 km. This is approximately the distance from Europe to Asia by boat.
By increasing the transport distances, the impact transport have on the overall non-renewable CO2 is of course increasing. The transport distance for methanol is longer than for the feedstock, which explains the larger impact for transport of methanol. The transport related non-renewable CO2 for the case with increased waste transport is approximately 4 times larger than the base case. When transport of methanol is introduced, the transport related non-renewable CO2 is 15 times higher than the base case. However, since transport has a low contribution to the total non-renewable CO2, the increase in total non-renewable CO2 is 10 % and 30 % for transport of waste and methanol, respectively. It is important to note that from the base case it is known that the non-renewable CO2 accounts for only 20-30% of the total CO2 equivalents emitted from the system. The relative increase in the total GWP is hence even lower than the increase in non-renewable CO2 with 8 % and 7 %, respectively. The findings are in agreement with other studies which conclude that transport is of minor importance in waste handling compared to the overall system (Ross et al., 2003; Eriksson 2005; Björklund et al 2005).
Improvement of gasifier
The biomass gasifier has a tar cracker at the outlet of the reactor in order to increase the yield. The plastic waste gasifier uses another technology, but a tar cracker could possibly be useful for this configuration as well, this is not discussed here due to lack of information. Another disadvantage with the plastic waste gasifier is the high oxygen use compared to the biomass case. An improvement of the gasifier is shown in Section 6.2.3. By use of oil slurry instead of the water slurry, the syngas quality is increased and the use of oxygen decrease. The result is less feedstock needed for production of the functional

55
unit, which gives lower non-renewable and renewable CO2 emissions from the system. The decrease is 25 % and 35 % for renewable and non-renewable CO2, respectively. The large decrease in the non-renewable CO2 equivalents is due to less oxygen needed, whereas the decrease in the renewable CO2 equivalents is because of the higher quality of the syngas out of the gasifier. The high O2 use in the gasifier increases the non-renewable CO2 emissions, which means that any decrease in oxygen use is beneficial as it will reduce the electricity use and the total oxidation of carbon in the gasifier (higher quality of syngas).
Transport, production and use of the oil are not included in the calculations above. In Appendix 9 the CO2 emissions from production of crude oil are given, showing that the impact is much smaller than the emissions from the plastic waste system. For transport of the oil, the numbers will be close to the ones given for transport of waste. It is shown that the total GWP is not influenced largely by transport.
System restrictions
The CO2 assigned to the shift reactor results from the shifting of CO to H2 in order to increase the H2/CO-ratio to what is required in the methanol reactor. In one scenario hydrogen was added to the system to avoid the shift reactor, and thereby reduce the CO2 emitted from the system. The added hydrogen was taken as a by-product from chlorine production, refineries or similar and consequently no environmental burdens were allocated to the hydrogen. When this approach was taken the reduction in renewable CO2 was 40 % and non-renewable 22 % for both plastic and wood waste.
As shown in Section 6.3 hydrogen can be produced from fossil fuels, water or renewable fuels like biomass. If a dedicated hydrogen production is used to produce the required hydrogen to the system the environmental burden should be assigned to the system. In Appendix 11 the global warming potential of various production routes are given, showing that production of hydrogen from biomass gasification is the process route with lowest non-renewable CO2 emissions. It is not a solution to have an additional gasifier for production of hydrogen to the system to avoid the shift. It is possible to add a natural gas steam reformer to produce hydrogen rich syngas, where both the CO and H2 in the syngas are utilized, the details of this approach is not discussed here. Based on the results given in Appendix 11, it is not a good solution to choose a dedicated hydrogen production unit

56
for the system. However, if hydrogen is available as a by-product from other processes, the improvement of the system is evident. Moreover our simulation shows that the hydrogen excess at Perstorp Oxo in Stenungsund perfectly match this BTP or PTP hydrogen need, thus allowing a future mapping of similar hydrogen excess sources that can be dedicated to those gasification based processes.
“Wood to plastics” and “plastics to plastics”
The most obvious difference between the system with wood and plastic waste is that the PTP process is a recycling system, whereas the BTP is an alternative production route to green plastics. This difference does not affect the technical performance of the system, but external conditions like legislation, availability and marketing for the products. These external conditions will in turn affect the technological choices for the system. An example is the question about addition of hydrogen, which might not make sense for biomass, unless hydrogen comes from a renewable resource. For plastic waste, addition of hydrogen from a fossil resource is probably more interesting since plastic waste is also based on fossil resources.
Assignment of the CO2 emissions
As discussed, the CO2 emissions from this system can be divided into three categories:
• CO2 as a result of the technology chosen • CO2 from “system restrictions” • Renewable and non-renewable CO2
(All renewable CO2 comes from one of the two previous categories)

57
To assure that the CO2 emissions are assigned to the unit where the emissions are formed, the following assignment has been used for renewable CO2:
Gasifier = All CO2 out of gasification reactor
Shift = All CO2 out of WGS reactor – Gasifier
Steam = All CO2 from combustion of flue-gas from methanol reactor
MTO = All CO2 from reactor (regeneration of catalyst) +
Combustion of off-gases (C5+, H2 and CO)
The traditional LCA approach, with assignment to the unit where the emissions occur, does not provide information of were the emissions originate. With the approach shown above, the CO2 is assigned to the unit where it is formed and consequently the results can be used to identify needs for improvement.
Uncertainties:
Like all results from process modelling, the results presented here present some inherent uncertainties. These uncertainties can come from:
- The models themselves (cf. uncertainties in Hysys models) - The use of energy streams from the BioMeeT report converted to the plastic waste
case. - The choice of technology (possible improvements for the ASU, methanol
unit…etc…) - Process integration (the optimum configuration of the mass and energy streams is
not studied here)

58
Waste monetization strategies and impact on the models
Raw woody biomass waste has high water content (~50%), so larger amounts of material – compare to waste plastics, coal, etc… - are needed for the same amount of methanol. Transport is of minor importance, but for long transport distances the large amounts of water that is transported can be a disadvantage. Indeed, drying or even pirolysis before transportation could be an option. A decentralised-centralised model (cf. figure 23) with a biomass/waste refining step between the collection and handling and the fuel production step could be interesting to study in the case of bigger feedstock amount use. This has not been studied here but could be easily added to our models.

59
Figure 23. Refining step between collection and fuel production (Choren 2001)
Environmental impact, positioning
For the Biomass to Plastics (BTP) process, the GHGs emissions - cradle to factory gate - are about 1.2 kg CO2-eqv/kg plastic produced. Compared to production of various other polymers (Vink et al 2003), this leads to the positioning given in Figure 24.
Cradle to factory gate GHGs emissions
0
20
40
60
80
Nyl
on 6
6
Nyl
on 6
Pol
ycar
bona
te
Hig
h im
pact
poly
styr
ene
Cel
loph
ane
Gen
eral
purp
ose
poly
styr
ene
Low
den
sity
poly
ethy
lene
Hig
h de
nsity
poly
ethy
lene
Pol
yeth
ylen
ete
reph
tala
teso
lid s
tate
Pol
ypro
pyle
ne
Pol
yeth
ylen
ete
reph
tala
team
orph
ous
Pol
ylac
tide
BtP
pla
stic
s
GHG emiss. X 10 [kgCO2eq./kg]
Figure 24: Comparison of plastic production from BTP with virgin production of various products.
The PTP process, from a waste management perspective is an alternative to mechanical plastic recycling or plastics incineration (cf. Table 10). Indeed, it produces plastic from plastics and does not require a too specific sorting out step.

60
Table 10: PTP and plastic waste handling options
Direction
Incineration
(thermal energy plant)*
Incineration
Thermal energy
and electricity**
PTP Recycling
”mechanical”
Input 1 kg PE 1 kg PE 1 kg plastics 1 kg PE
Input 3.8 MJe 2.98 MJe
Output 3.14 kg CO2eq 2.44 kg CO2eq 2.2 kg CO2eq 0.15 kg PE
residue
Output 43 MJth 25.3 MJth
11.5 MJe
0.27 kg plastics
68% HDPE
32% PP
0.85 kg PE
* spine@cpm database 2006 (MJe = MJ electricity and MJth = MJ thermic)
** Tillman, Baumann 2004
The discussion regarding the specific pros and cons of the PTP compared to other waste management systems will be done in further reports.
The other impact categories that are investigated include eutrophication, aquatic ecotoxicity, ozone depletion and acidification. The results are not discussed here, as the greenhouse potential is the most important of the categories for the discussion in this report. In order to give the total picture, the results are given in Appendix 8.

61
8 CONCLUSION
Production of plastic waste from biomass and plastic waste is possible by use of the BTP and PTP processes, respectively. The base case scenarios show an advantage for the biomass case, with respect to the non-renewable CO2-equivivalents. The main reason for the lower CO2 emissions in the biomass process is the lower oxygen use in that case. The main source for non-renewable CO2-equivivalents in both the base case scenario is the gasifier with the oxygen production. Various improvements for both cases are investigated. Improvement of the plastic waste gasifier by use of oil slurry instead of water slurry reduces the total CO2 emissions for the system by almost 40 %.
NB: The comparison between BTP and PTP is a little bit awkward, since those processes are more complementary that competitors. Indeed, the BTP process is a way to produce plastics from biomass thus being an alternative to other plastics production process, whether they are based on biomass or fossil fuels (cf. figure 24), whereas the PTP is an alternative to waste management of plastic wastes and recycling systems - regardless of bio-origin of those plastic wastes - and could therefore be used to handle the plastics produced via the BTP at their end-of-life. The so called “renewable” CO2 for the PTP is in this perspective very meaningful.
If hydrogen is available as a by-product close to the PTP/BTP plant, addition of hydrogen to avoid the need for a water gas shift reactor to increase the H2/CO-ratio prior to the methanol production unit is beneficial for the CO2 emissions. Please note that the emissions from production of hydrogen are not included in the calculations as hydrogen is only looked at as an option when it is available as a by-product. When this approach was taken the reduction in renewable CO2 was 40 % and non-renewable 22 % for both plastic and wood waste. When hydrogen is produced on purpose to increase the H2/CO-ratio, depending on the production system (cf. Appendix 10), this conclusion could vary a lot.
Sensitivity analyses are carried out with respect to transport systems and the electricity mix. The electricity mix used in all calculations is the E.U electricity mix given in
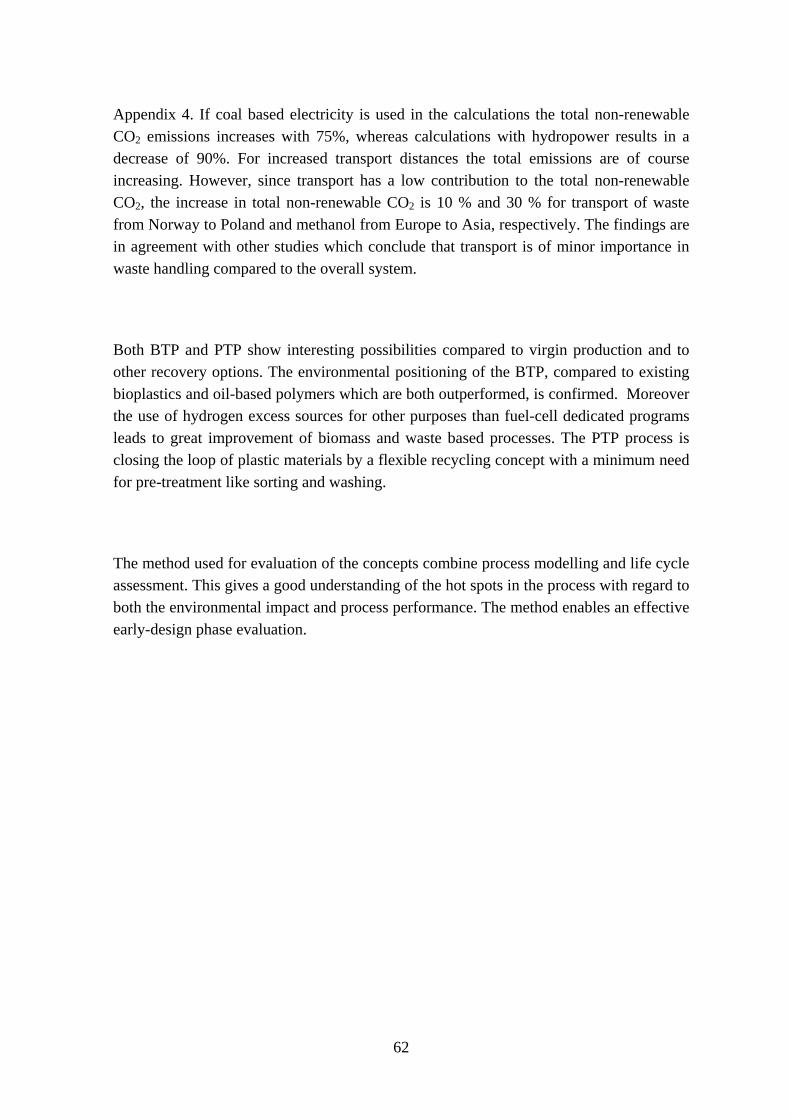
62
Appendix 4. If coal based electricity is used in the calculations the total non-renewable CO2 emissions increases with 75%, whereas calculations with hydropower results in a decrease of 90%. For increased transport distances the total emissions are of course increasing. However, since transport has a low contribution to the total non-renewable CO2, the increase in total non-renewable CO2 is 10 % and 30 % for transport of waste from Norway to Poland and methanol from Europe to Asia, respectively. The findings are in agreement with other studies which conclude that transport is of minor importance in waste handling compared to the overall system.
Both BTP and PTP show interesting possibilities compared to virgin production and to other recovery options. The environmental positioning of the BTP, compared to existing bioplastics and oil-based polymers which are both outperformed, is confirmed. Moreover the use of hydrogen excess sources for other purposes than fuel-cell dedicated programs leads to great improvement of biomass and waste based processes. The PTP process is closing the loop of plastic materials by a flexible recycling concept with a minimum need for pre-treatment like sorting and washing.
The method used for evaluation of the concepts combine process modelling and life cycle assessment. This gives a good understanding of the hot spots in the process with regard to both the environmental impact and process performance. The method enables an effective early-design phase evaluation.

63
9 REFERENCES
Andersen Jim, Bakas S, Foley T, Gregor J,Vora B, Kvisle S, Reier Nilsen H, Fuglerud T, Grønvold A (2003). MTO: MEETING THE NEEDS FOR ETHYLENE AND PROPYLENE PRODUCTION. ERTC Petrochemical Conference, Paris, France, UOP, HYDRO.
Bain, R. L. (2004). Biomass gasification overview. US. DOE. Battelle, NREL.
Baumann, H. and Tillmann, A., “The Hitch Hiker’s Guide to LCA”, Studentlitteratur, Gothenburg, 2004.
Björklund, A. and Finnveden, G. (2005): Recycling revisited – life cycle comparisons of waste management strategies. Resources, Conservation and Recycling, 44, 309-317.
Chementator, Methanol-to-olefins project moves forward. Chemical Engineering 2003;110(3): 21.
Chmielniak, T., Sciazko, M., Co-gasification of biomass and coal for methanol synthesis. Applied Energy 74 (2003) 393–403
Choren GmbH. www.choren.de
Culligan, M., ConocoPhillips Director, Business Development - Qatar GTL Project. GTL: New Technology for a New Industry. 2005 Doha Gas Conference. March 1, 2005
Drift, A. van der (Bram) 2005, ECN, personal communication.
Edwards, R., J.-C. Griesemann, J.-F. Larivé and V. Mahieu (2003). Well-to-wheels analysis of future automotive fuels and powertrains in the European context, EUCAR, CONCAWE, JRC.
European Environmental Agency. EEA Signals 2004. A European Environmental Agency update on selected issues. ISBN 92-9167-669-1

64
Ekbom, T., Brandberg, Å., Hjerpe, C-J., Hjortsberg, H., Landälv, I., Sävbark, B., BioMeeT Planning of Biomass based Methanol energy combine – Trollhättan region. Altener, 2000. Contract No. XVII/4.1030/Z/98-368
Ekbom, T., H. Boding, et al. (2003). BioMeetII Stakeholders for Biomass based Methanol/DME/Power/Heat energy combine Final Report Altener Project AL/2000/367. N. S. Ecotraffic. Trollhättan Municipality, Altener.
Eriksson, O., Carlsson Reich, M., Frostell, B., Bjorklund, A., Assefa, G., Sundqvist, J.-O., Granath, J., Baky, A., Thyselius, L., Municipal solid waste management from a systems perspective. Journal of Cleaner Production 13 (2005) 241–252
ExxonMobil 2005. GTO: a breakthrough in the petrochemical industry. http://www.exxonmobil.com/Corporate/Newsroom/Publications/TheLamp_3_2005/story4.asp
Future-Energy GmbH www.future-energy.de
Goldmann, D., EZ/R Recycling. Volkswagen AG, 2005. Personal communication.
Hamelinck, C. N. and A. P. C. Faaij (2001). Future prospects for production of methanol and hydrogen from biomass, Universiteit Utrecht, Copernicus Institute, Science Technology society.
Hurst, K., Facing our future combining idealism with realism. Onyx September 2002
Institut Français du Pétrole. Ifp: http://www.ifp.fr/IFP/fr/decouvertes/gds_debats/avenir/demande/index.htm
JGC corporation 2005. http://www.jgc.co.jp/en/04tech/01gas/dme.html
Joosten, L.A.J., Process Data Descriptions for the production of synthetic organic materials. Input data for the MATTER study. Utrecht, 2003.
Kaggerud, K., Sandberg P., Musdalslien, I, U., Nilsen, R, H., Leadbitter, J. A new concept for waste plastic recycling. NTNU 2003
Katofsky RE, 1993, The production of fluid fuels from biomass, Center for Energy and Environmental Studies/Princeton University, Princeton.
Krinke, S., Comparative Life-Cycle Assessment of SunDiesel and Conventional Diesel Life Cycle Thinking in Business & Industry, Volkswagen AG.

65
Kvisle, S., Nilsen, H.R., Fuglerud, T., Grønvold, A., Vora, B.V., Pujado, P.R., Barger, P.T. and Andersen, J.M., Methanol to Olefins: State of the Art and Perspectives, Erdöl Erdgas Kohle, 2002; 118 (7/8): 361-364
Kwant, W. K, Knoef, H., Satus of biomass gasification in countries participating in the IEA bioenergy task 33 biomass gasification and EU gasnet, October 2004.
Lasher et al , DOE Hydrogen Program, FY 2005 Progress Report, III.7 Fuel Choice for Fuel Cell Vehicles: Hydrogen Infrastructure Costs
Lurgi 2002. Lurgi Methanol-to-Propylene Lurgi Methanol-to-Propylene -MTP®. The most economic solution to produce on-purpose propylene. www.lurgi.com
Moulijn, J.A., Makkee, M. and van Diepen, A., Chemical Process Technology. 2 Ed, England: John Wiley & Sons, 2003.
Malkow, T., Novel and innovative pyrolysis and gasification technologies for energy efficient and environmentally sound MSW disposal, Waste Management, 2004; 24 (1) 53-79
Nexant Inc. www.nexant.com
Nirula SC. Ethylene from methane. Menlo Park: SRI international, Report No. 208; 1994.
Nouri, S., Syngas Integration, Integration of an ASU with a syngas process. Airliquide R&D Center/Group: Chemicals and Refining. 2003
Nouri, S., Tillman, A-M., Evaluating synthesis gas based biomass to plastics (BTP) technologies. Chalmers 2005.
Parkinson, G., Plastic wastes will be the new raw material for ammonia production, Chemical Engineering, 2002; 109 (13): 13
Patel, M., Lessons to be learnt from LCAs for biodegradable polymers Review of Life Cycle Assessments for Bioplastics, Utrecht University, 2001.
Paulik, C., Borealisgroup personal communication, 2005.
Ross, S., Evans, D., The environmental effect of reusing and recycling a plastic-based packaging system Journal of Cleaner Production 11 (2003) 561–571
Salo, K., Carbona OY, personal communication, 2005.
66
Smith, A.R., Klosek, J., A review of air separation technologies and their integration with energy conversion processes. Air Products and Chemicals, Inc., Allentown, PA 18195, USA. Fuel Processing Technology 70 (2001).115–134
spine@cpm database http://cpmdb.imi.chalmers.se/SpineAtCPM/database/cover.htm
Steinberg, M. and H.C. Cheng. 1989. “Modern and Prospective Technologies for Hydrogen Production from Fossil Fuels,” Int. J. Hydrogen Energy, 14, 797-820.
SVZ GmbH 2004 www.svz-gmbh.de
UOP www.uop.com and http://www.uop.com/objects/26%20MTO%20process.pdf
Vink, E.T.H, Rabago, R.K., Glassner, A.D., Gruber, R.P., Applications of life cycle assessment to NatureWorks polylactide (PLA) production. Polymer degradation and stability, 80 (2003) 403-419
Williams RH, Larson ED, Katofsky RE and Chen J, 1995, Methanol and hydrogen from biomass for transportation, with comparisons to methanol and hydrogen from natural gas and coal, PU/CEES Report 292, Center for Energy and Environmental Studies/Princeton University, Princeton, 47 pp.

67
Appendix 1: waste recovery potential
A very short and approximate but illustrative calculation of the waste recovery potential has been made:
The OECD consumption is about 18 barrels of oil per year and per capita (Ifp 2005). The amount of house hold waste generated each year is about 500 kg per capita (in the UK, Hurst 2002). The composition of waste – which greatly varies between winter and summer (Hurst 2002) – is for about 66% composed of biomass waste (paper, green waste, food…). This represents about 330 kg of biomass waste. A BtL process (with an efficiency of about 50%) transforms this amount of waste into about 1.8 MMBtu or about 0.3 barrel of oil equivalent. Waste biomass monetization from household waste only, represents thus a saving of about 1.66 % of our total consumption of oil. For comparison, GTL production outlook will reach 1 million BPD by 2020 – less than 3% of the world markets for diesel and naphtha (Culligan 2005).

68
Appendix 2 : Waste availability, ethylene network in EU, etc.
Poland an Eastern Europe represent an attractive place for the implementation of a first waste to plastic plant and this for many reasons. First the non existence of an effective and largely apply recycling systems (around 20% of packaging waste is recycled in Poland compared to 63% in Sweden, EEA Signals 2004) let the door open to new recycling strategies like the waste to plastic route. Secondly the well establish gas network Map.1 (which can lead to cheap hydrogen sources; hydrogen comes from natural gas today) and the different refineries location as well as ethylene pipelines Map.2 show a well integrated petrochemical industry. Moreover some big harbours (like Gdansk for Poland) near Scandinavian wood resources reinforce its attractiveness for Biomass to plastic process implementation.

69
Map.1 EU oil and gas transportation system
http://www.inogate.org/inogate/en/resources/maps

70
Map.2 Refineries, Pipelines and Crackers in Europe, Appe – Association of petrochemicals producers in Europe, 2004
http://www.petrochemistry.net/ftp/pressroom/map_europe2004.pdf

71
Appendix 3: Detailled process unit flowsheets:
The main mass flows within the BTP and PTP concepts flowsheets are depicted below:
1. the gasification island (Ekbom et al 2000)

72
2. the gas cleaning section: sulferox for biomass (Ekbom et al 2000) and chlorine removal for plastic waste.
3. the CO2 removal unit (Ekbom et al 2000)

73
4. the methanol island (Ekbom et al 2000)
5. the Air Separation Unit (Air Liquide’s Aspen HYSYS model, Nouri 2003)
Heat
exchangersDistillation
columns
AIR
O2
N2

74
6. The methanol to olefins unit
MTO flowsheet, Andersen et al 2003.
7. The Borealis Borstar process (HDPE and PP)
Borstar PE process, Borealis (2005)

75
Borstar PP process, Borealis (2005)

76
Appendix 4: EU El-mix
In the EU electricity is produced via a great number of different routes like coal, gas, nuclear, hydro, oil etc. The combination, which actually do not correspond to a single pathway is called EU mix and is used in this report to represent a typical electricity supply. The shares of the different primary energy sources for electricity production are shown in table 11.
Table 11: EU electricity mix (Edward et al 2003)
Source Share %
Nuclear 37.5
Coal 22.4
Oil 9.6
Gas 15.5
Hydro 12.4
Wind 0.4
Waste 1.8
Other renewables 0.3

77
Appendix 5: waste feedstock composition
Biomass composition, like oil and gas (one has to remember that oil and gas - when referencing to biogenic theory for oil formation - are mainly the products of compression and heating of ancient vegetation) greatly vary depending on the type of biomass we are looking at. A representative biomass and coal property table is shown below (cf. table 12).
Table 12: Biomass and coal properties, Bain 2004
Plastic waste composition varies also depending on the different sorts of plastics used (PE, PP, PET, PVC…etc). For the PTP process a low chlorine content feedstock is used to minimise the risk of corrosion and the cost of chlorine separation. Many strategies exist to achieve a low-chlorine content feedstock and one has been developed by Volkswagen for plastic recycling in cars (Goldmann 2005). Their approach to generate a low chlorine plastics fraction out of shredder-residues works as follows. In a first step, they are able to separate a so called sand-fraction (fines), a fibre fraction (light) and granulate fraction as well as some metal fractions. Due to the composition and shape of the Cl-carrying

78
substances (basically PVC) they are able, to concentrate most of the PVC in the coarse plastic-fraction. This granulate called plastic-fraction is then treated in a wet density separation step, where polyolefines and most of ABS end up in the light fraction whereas PVC is concentrated in a heavy fraction. The PVC-depleted fraction is limited in Cl-content to max. of 1.2 % which is sufficiently low. Lower chlorine content level could also be achieve but at a higher price.

79
Appendix 6: models
Models:
The Hysys models are available as .hsc files:
- syngas from biomass gasification to methanol
http://www.esa.chalmers.se/Staff/bottomn_files/selim_files/MEOH34.ZIP
- syngas from plastic waste gasification to methanol
http://www.esa.chalmers.se/Staff/bottomn_files/selim_files/MEOH_PLASTIC.ZIP
The Excel models are available (with their derivations) as .xls files:
- Biomass to plastics (base case model)
http://www.esa.chalmers.se/Staff/bottomn_files/selim_files/LCA%20BTP_wood2.xls
- Biomass to plastics (hydrogen addition case model)
http://www.esa.chalmers.se/Staff/bottomn_files/selim_files/LCA%20BTP_wood_h2.xls
- Biomass to plastics (LCAiT base case)
http://www.esa.chalmers.se/Staff/bottomn_files/selim_files/Inventory%20results%20BTP%20base%20case.xls
- Biomass to plastics (LCAiT electricity from hydropower scenario)
http://www.esa.chalmers.se/Staff/bottomn_files/selim_files/Invemtory%20results%20BTP%20derivation%20Hydro%20El.xls
- Biomass to plastics (LCAiT electricity from coal scenario)
http://www.esa.chalmers.se/Staff/bottomn_files/selim_files/Inventory%20results%20BTP%20derivation%20coal%20el.xls
- Biomass to plastics (LCAiT hydrogen addition scenario)

80
http://www.esa.chalmers.se/Staff/bottomn_files/selim_files/Inventory%20results%20BTP%20base%20case%20derived%20H2%20imported.xls
- Biomass to liquid, liquid transport and liquid to plastics (LCAiT transport system scenario)
http://www.esa.chalmers.se/Staff/bottomn_files/selim_files/Inventory%20results%20BTP%20derivation%20BtL%20MtP%2010000km.xls
- Biomass to plastics with biomass logistics (transport by truck/boat)
http://www.esa.chalmers.se/Staff/bottomn_files/selim_files/Invetory%20result%20BtP%20derivation%20Oslo%20gdansk%20biomass%20transport.xls
- Plastics to plastics (base case model)
http://www.esa.chalmers.se/Staff/bottomn_files/selim_files/LCA%20BTP_plastic.xls
- Plastics to plastics (hydrogen addition case model)
http://www.esa.chalmers.se/Staff/bottomn_files/selim_files/LCA%20BTP_plastic_h2.xls
- Plastics to plastics (waste oil fed gasifier case model)
http://www.esa.chalmers.se/Staff/bottomn_files/selim_files/LCA%20BTP_plastic_oilsl.xls
- Plastics to plastics (LCAiT base case)
http://www.esa.chalmers.se/Staff/bottomn_files/selim_files/Inventory%20PTP%20base%20case.xls
- Plastics to plastics (LCAiT electricity from hydropower scenario)
http://www.esa.chalmers.se/Staff/bottomn_files/selim_files/Inventory%20results%20PTP%20derived%20hydro%20el.xls
- Plastics to plastics (LCAiT waste oil import scenario)
http://www.esa.chalmers.se/Staff/bottomn_files/selim_files/Inventory%20results%20PTP%20oil%20and%20plastic%20derivation.xls
- Plastics to plastics (LCAiT electricity from coal scenario)

81
http://www.esa.chalmers.se/Staff/bottomn_files/selim_files/Inventory%20results%20PTP%20derivation%20coal%20el.xls
- Plastics to plastics (LCAiT hydrogen addition scenario)
http://www.esa.chalmers.se/Staff/bottomn_files/selim_files/Inventory%20PTP%20H2%20import.xls
- Plastics to liquid, liquid transport and liquid to plastics (LCAiT transport system scenario)
http://www.esa.chalmers.se/Staff/bottomn_files/selim_files/Inventory%20results%20PTP%20derivation%20PtM%20MTP%2010000%20km.xls
- Plastics to plastics with waste plastics logistics (transport by truck/boat)
http://www.esa.chalmers.se/Staff/bottomn_files/selim_files/Inventory%20result%20PtP%20derivation%20Oslo%20gdansk%20waste%20logistics.xls

82
Appendix 7: assignment of CO2 emission
Assignment of the CO2 emissions
Three categories:
1. CO2 as a result of the technology chosen 2. CO2 from “system restrictions” 3. Renewable and non-renewable CO2
(All renewable CO2 comes from one of the two previous categories)
1. Ex: can be decreased by better performance of the gasifier [Technology]. 2. Ex: the CO2 formed in the shift reactor are due to the need for a higher H2/CO-
ratio in the methanol production. These emissions can not be decreased by improved technology in each unit, only by improving the system [System restrictions].
3. The third entry is the difference between renewable and non renewable CO2. Part of the CO2 released comes from the treated material, part from transport and energy use [Renewable/non renewable]
To assure that the CO2 emissions are assigned to the unit where the emissions are formed, the following assignment has been used for renewable CO2:
Gasifier = All CO2 out of gasification reactor
Shift = All CO2 out of WGS reactor – Gasifier
Steam = All CO2 from combustion of flue-gas from methanol reactor
MTO = All CO2 from reactor (regeneration of catalyst) +
Combustion of off-gases (C5+, H2 and CO)

83
The traditional LCA approach, with assignment to the unit where the emissions occur, does not provide information of were the emissions originate. With the approach shown above, the CO2 is assigned to the unit where it is formed and consequently the results can be used to identify need for improvement.

84
Appendix 8: impact categories
Other impact categories results are available as Excel documents with their corresponding LCI
The environmental impact assessment categories of the BTP and PTP routes derivation calculated from LCAiT (/per kg of polymer produced) are summarized in the following table (table 13).
Table 13: BTP and PTP environmental impact characterisation indicators.
Fossil Energy use (not total primary energy)
“renewable CO2” kg CO2 eq
Non renewable CO2 kg CO2 equivalent
Eutrophication kg Nox equivalent
Acidification kg SO2 equivalent
Ecotoxicity aquatic 1000 m3 polluted water
BTP route 0.33 kWh 4.724 1,39 4,39e-3 1,24e-2 5,64e-3
BTP H2 enriched
0,23 kWh 3,031 1,05 3,27e-3 9,35e-3 4,2e-3
BtMeOH + MtP
4,724 1,94 1,55e-2 2,72e-2 1,43e-2
BTP biomass tanker
4,724 1,58 7,08e-3 1,58e-2 8,53e-3
BTP hydro El
4,724 0,126 1,09e-3 8,37e-4 1,43e-3
BTP coal El
4,724 2,42 6,49e-3 8,16e-3 1,65e-3
PTP route 0,465 MJ 4,86 2,07 5,51e-3 1,85e-2 7,19e-3
PTP & H2 0,35 MJ 2,72 1,64 4,36e-3 1,46e-2 5,68e-3

85
PtMeOH + MtP
4,86 2,62 1,67e-2 3,33e-2 1,58e-2
PTP plastic tanker
4,86 2,2 7,57e-3 2,1e-2 9,41e-3
PTP hydro El
4,86 6,94e-2 3,12e-4 2,51e-4 5,79e-4
PTP coal El
4,86 3,68 8,81e-3 1,18e-2 9,23e-4
PTP oil mix
3,63 1,32 3,43e-3 1,17e-2 4,43e-3
Examples for BTP base case are:

86

87
Examples for the PTP base case:

88

89
Appendix 9: oil and emissions
For oil use in the case of plastic waste feedstock feed-in improvement, the impact of producing the oil could also be taken into account. From the WTT study we have some estimation for GHGs emissions and energy consumption for crude oil production and transportation to the market. The figures are about 0.025 MJ/MJ energy consumption and 3.3 g CO2eq/MJ GHG emission for crude production, and 10 MJ/MJ energy consumption and 0.8 g CO2eq/MJ emissions for transportation to the market (WTT Report). With an energy density of about 45 MJ/kg for crude oil (Brown, Lemay, Bursten. Chemistry: The Central Science. 5th ed) it represents a total of 451.125 MJ/kg and 184.5 g CO2eq/kg oil, or 631.6 MJ/kg plastic and 258.3 g CO2eq/kg plastic produced.
The GHG emissions for the PTP route with oil blend as feedstock are 1.4 kg CO2eq/kg of plastic produce, thus the oil production share in the environmental burden of plastic production via this option is quite negligible.
Crude oil emissions: the GHG emissions for extracting crude oil are about 55.92 g CO2/ kg oil equivalent (Baumann, Tillman 2004).
More details are given in the EUCAR’s wtt report (Edwards et al 2003):
Table 14. Crude Oil emissions (Edwards et al 2003)

90
Appendix 10: Hydrogen sources.
Hydrogen available sources could be divided into 2 categories:
- Hydrogen as a by product of an actual process or revamped unit. - Hydrogen as a main product or intermediate (like syngas).
Since we do not want to allocate the hydrogen production, we will focus on the first category for our case study. Moreover, the hydrogen import we are looking at to improve the efficiency of our process is not sufficient enough to legitimate a real hydrogen production train.
The particular case of Perstorp Oxo in Stenungsund (Sweden), which have switched from oil to natural gas for some units and thus have an available hydrogen excess of about 1 ton per hour, is the practical example we will use in our model.
However it could be interesting to have more information about the other potential available hydrogen sources when looking at a bigger biomass based process with hydrogen adding. A list of hydrogen excess facilities has been produced for the US DOE hydrogen program:

91
Table 15. Excess hydrogen sources (Lasher et al 2005)

92
Appendix 11 : Hydrogen production environmental impact.
Numerous LCAs are available about the impact of hydrogen production on the environment. Whereas we focused on hydrogen as a by-product, and thus having a negligible environmental impact, when the mass flow of hydrogen become important, we have to be able to assess the impact of such a stream.
Depending on the way to produce hydrogen, the environmental impact greatly varies. For instance when looking at CO2 emissions, well to tank studies show a great variation depending on the feedstocks and the process (cf. Table 16)
Table 16. Hydrogen production routes GHGs emissions and energy expended.
Net GHG emitted (kg CO2eq/kg H2) Energy expended Mjex/kg H2
Compressed-H2, Natural gas EU-mix, On-site reforming 12,54983 101,304
COMPRESSED-H2, NATURAL GAS 7000 km, On-site reforming 14,81149 132,996
COMPRESSED-H2, NATURAL GAS 4000 km, On-site reforming 13,4004 114,24
COMPRESSED-H2: 7000 km, Central reforming, Pipe
13,31963 101,148
COMPRESSED-H2: NATURAL GAS 4000 km, Central reforming,
Pipe 11,93195 82,704

93
COMPRESSED-H2: NAT GAS 4000 km, Central reforming, Road
12,04319 83,004
COMPRESSED-H2: NATURAL GAS 4000 km, Central reforming,
Liquifaction, Road, Vap/comp. 16,14597 155,172
COMPRESSED-H2: LNG, On-site reforming 14,33297 134,304
COMPRESSED-H2: LNG, Central reforming, Pipe 12,85226 102,432
COMPRESSED-H2: Remote NATURAL GAS, methanol, On-
site reforming 14,22578 135,732
COMPRESSED-H2: Coal EU-mix, central reforming, Pipe
23,01384 140,34
COMPRESSED-H2: Wood waste, On-site gasification 1,279597 146,28
COMPRESSED-H2: Wood waste, Central gasification. Pipe 1,430397 116,364
COMPRESSED-H2: Wood Farmed, On-site gasification 1,81834 149,22
COMPRESSED-H2: Wood Farmed, Central gasification, pipe
1,695153 116,28
COMPRESSED-H2: NATURAL GAS 7000 km, CCGT, On-site
Electrolyser 27,35251 327,12
COMPRESSED-H2: NATURAL GAS 4000 km, CCGT, On-site
Electrolyser 24,45679 288,624
COMPRESSED-H2: NATURAL GAS 4000 km, CCGT, Central
Electrolyser, Pipe 24,4591 294,66

94
COMPRESSED-H2: LNG, On-site Electrolyser 26,38938 329,736
COMP H2: Farmed Wood, 200 MW gasif, CCGT, On-site Electrolyser 1,49725 312,096
COMPRESSED-H2: Farmed Wood, Conv power, On-site Electrolyser 3,68862 530,844
COMPRESSED-H2: Electricity EU-mix, On-site Electrolyser 24,97642 434,628
COMPRESSED-H2: Electricity coal EU-mix, On-site Electrolyser
50,8118 380,544
COMPRESSED-H2: Wind, Central Electrolyser, Pipe
1,091337 94,392
LIQUIFIED-H2:NATURAL GAS 7000 km, Central reforming,
Liquifaction, Road 17,17308 161,892
LIQUIFIED-H2: NATURAL GAS 4000 km, Central reforming,
Liquifaction, Road 15,36622 137,856
LIQUIFIED-H2: Remote Ref, Liquifaction, Sea, Road
16,74774 172,416
LIQUIFIED-H2: LNG, Central reforming, Liquifaction, Road
16,52778 162,36
LIQUIFIED-H2: Wood Farmed, Central gasification, Liquifaction, Road 0,961017 179,628
LIQUIFIED-H2: NATURAL GAS 4000 km, CCGT, Central
Electrolyser, Liquifaction, Road 27,83097 343,944
LIQUIFIED-H2: Electricity EU-mix, Central Electrolyser,
Liquifaction, Road 28,30873 506,88

95
Thus using those data one can have an idea of the impact of producing and using hydrogen when the flowrate of hydrogen used is not anymore characteristic of a by-product or waste stream.
In case of the BTP base case, the hydrogen flowrate is 1612 kg/h or 0.1256 kg/kg plastic produced thus, the environmental impact to take into account depending on the way to produce the hydrogen could be calculated by adding the following numbers (cf. table 17) to the already calculated GWP and energy use:
Table 17. BTP GHGs emissions and energy expended depending on hydrogen sources.
Net GHG emitted (kg CO2eq/kg plastic) BTP with H2
Energy expended Mjex/kg Plastic BTP with H2
Compressed-H2, Natural gas EU-mix, On-site reforming
1,58 12,72
COMPRESSED-H2, NATURAL GAS 7000 km, On-site reforming
1,86 16,70
COMPRESSED-H2, NATURAL GAS 4000 km, On-site reforming
1,68 14,35
COMPRESSED-H2: 7000 km, Central reforming, Pipe
1,67 12,70
COMPRESSED-H2: NATURAL GAS 4000 km, Central
reforming, Pipe
1,50 10,39
COMPRESSED-H2: NATURAL GAS 4000 km, Central
reforming, Road
1,51 10,43
COMPRESSED-H2: NATURAL GAS 4000 km, Central
reforming, Liquifaction, Road, Vap/comp.
2,03 19,49

96
COMPRESSED-H2: LNG, On-site reforming
1,80 16,87
COMPRESSED-H2: LNG, Central reforming, Pipe
1,61 12,87
COMPRESSED-H2: Remote NATURAL GAS, methanol, On-
site reforming
1,79 17,05
COMPRESSED-H2: Coal EU-mix, central reforming, Pipe
2,89 17,63
COMPRESSED-H2: Wood waste, On-site gasification
0,16 18,37
COMPRESSED-H2: Wood waste, Central gasification. Pipe
0,18 14,62
COMPRESSED-H2: Wood Farmed, On-site gasification
0,23 18,74
COMPRESSED-H2: Wood Farmed, Central gasification, pipe
0,21 14,60
COMPRESSED-H2: NATURAL GAS 7000 km, CCGT, On-site
Electrolyser
3,44 41,09
COMPRESSED-H2: NATURAL GAS 4000 km, CCGT, On-site
Electrolyser
3,07 36,25
COMPRESSED-H2: NATURAL GAS 4000 km, CCGT, Central
Electrolyser, Pipe
3,07 37,01
COMPRESSED-H2: LNG, On-site Electrolyser
3,31 41,41
COMPRESSED-H2: Farmed Wood, 200 MW gasif, CCGT,
On-site Electrolyser
0,19 39,20

97
COMPRESSED-H2: Farmed Wood, Conv power, On-site
Electrolyser
0,46 66,67
COMPRESSED-H2: Electricity EU-mix, On-site Electrolyser
3,14 54,59
COMPRESSED-H2: Electricity coal EU-mix, On-site Electrolyser
6,38 47,80
COMPRESSED-H2: Wind, Central Electrolyser, Pipe
0,14 11,86
LIQUIFIED-H2:NATURAL GAS 7000 km, Central
reforming, Liquifaction, Road
2,16 20,33
LIQUIFIED-H2: NATURAL GAS 4000 km, Central
reforming, Liquifaction, Road
1,93 17,31
LIQUIFIED-H2: Remote Ref, Liquifaction, Sea, Road
2,10 21,66
LIQUIFIED-H2: LNG, Central reforming, Liquifaction, Road
2,08 20,39
LIQUIFIED-H2: Wood Farmed, Central gasification, Liquifaction, Road
0,12 22,56
LIQUIFIED-H2: NATURAL GAS 4000 km, CCGT, Central Electrolyser, Liquifaction, Road
3,50 43,20
LIQUIFIED-H2: Electricity EU-mix, Central Electrolyser,
Liquifaction, Road
3,56 63,66
The results we found from our model for the BTP route with H2 import were, in terms of GHGs emissions, about 1.09 kg of non renewable CO2eq emitted per kg of plastic

98
produced. The environmental impact, in terms of GHGs emissions is not that big if hydrogen comes from wood gasification, but quite important regarding the total impact of plastic production if from natural gas reforming for instance.
For the PTP case with hydrogen import, the flowrate is about 2016 kg/h or 0.14 kg/kg of plastic produced, thus the additional environmental impact of producing H2 in terms of GHGs and energy consumption depending on how is produced the hydrogen is summarized in the following table (table 18):
Table 18. GHGs emissions and energy expended for the PTP process depending on the hydrogen source.
Net GHG emitted (kg CO2eq/kg plastic) PTP with H2
Energy expended Mjex/kg Plastic PTP with H2
Compressed-H2, Natural gas EU-mix, On-site reforming
1,76 14,18
COMPRESSED-H2, NATURAL GAS 7000 km, On-site reforming
2,07 18,62
COMPRESSED-H2, NATURAL GAS 4000 km, On-site reforming
1,88 15,99
COMPRESSED-H2: 7000 km, Central reforming, Pipe
1,86 14,16
COMPRESSED-H2: NATURAL GAS 4000 km, Central reforming,
Pipe 1,67 11,58
COMPRESSED-H2: NATURAL GAS 4000 km, Central reforming,
Road 1,69 11,62
COMPRESSED-H2: NATURAL GAS 4000 km, Central reforming,
Liquifaction, Road, Vap/comp. 2,26 21,72

99
COMPRESSED-H2: LNG, On-site reforming
2,01 18,80
COMPRESSED-H2: LNG, Central reforming, Pipe
1,80 14,34
COMPRESSED-H2: Remote NATURAL GAS, methanol, On-
site reforming 1,99 19,00
COMPRESSED-H2: Coal EU-mix, central reforming, Pipe
3,22 19,65
COMPRESSED-H2: Wood waste, On-site gasification
0,18 20,48
COMPRESSED-H2: Wood waste, Central gasification. Pipe
0,20 16,29
COMPRESSED-H2: Wood Farmed, On-site gasification
0,25 20,89
COMPRESSED-H2: Wood Farmed, Central gasification, pipe
0,24 16,28
COMPRESSED-H2: NATURAL GAS 7000 km, CCGT, On-site
Electrolyser 3,83 45,80
COMPRESSED-H2: NATURAL GAS 4000 km, CCGT, On-site
Electrolyser 3,42 40,41
COMPRESSED-H2: NATURAL GAS 4000 km, CCGT, Central
Electrolyser, Pipe 3,42 41,25
COMPRESSED-H2: LNG, On-site Electrolyser
3,69 46,16
COMPRESSED-H2: Farmed Wood, 200 MW gasif, CCGT, On-
site Electrolyser 0,21 43,69
COMP-H2: Farmed Wood, Conv power, On-site Electrolyser
0,52 74,32

100
COMPRESSED-H2: Electricity EU-mix, On-site Electrolyser
3,50 60,85
COMPRESSED-H2: Electricity coal EU-mix, On-site Electrolyser
7,11 53,28
COMPRESSED-H2: Wind, Central Electrolyser, Pipe
0,15 13,21
LIQUIFIED-H2:NATURAL GAS 7000 km, Central reforming,
Liquifaction, Road 2,40 22,66
LIQUIFIED-H2: NATURAL GAS 4000 km, Central reforming,
Liquifaction, Road 2,15 19,30
LIQUIFIED-H2: Remote Ref, Liquifaction, Sea, Road
2,34 24,14
LIQUIFIED-H2: LNG, Central reforming, Liquifaction, Road
2,31 22,73
LIQUIFIED-H2: Wood Farmed, Central gasification, Liquifaction, Road
0,13 25,15
LIQUIFIED-H2: NATURAL GAS 4000 km, CCGT, Central
Electrolyser, Liquifaction, Road 3,90 48,15
LIQUIFIED-H2: Electricity EU-mix, Central Electrolyser,
Liquifaction, Road 3,96 70,96
Again with emissions of 1.7 kg of CO2eq per kg of plastic produced, the addition of hydrogen has a low impact if the hydrogen comes from renewables like wind or wood waste, but is not negligible if H2 comes from natural gas for instance.
This kind of discussion about the impact or importance of H2 addition is only “virtual” and here to give an idea of the magnitude of hydrogen production compared to plastic production from biomass, in terms of GHGs emissions. Indeed, we kindly remind the reader that the option of adding hydrogen has been considered only to increase the H2/CO

101
ratio at the output of the gasifier and thus try to reduce the waste of renewable carbon released along the process. It would be completely absurd to dedicate a full H2 production unit - based on the same gasification technology – to fulfil this task, since the same problem of renewable CO2 waste would arise in the aforementioned unit.

102
Appendix 12: Lock-hopper feeding system

103
This feeder is used in the 20 MWth biomass pressurised gasification - Carbona Oy gasifier - pilot plant in Tampere (Finland).

104
APPENDIX 13: THEORETICAL MAXIMUM
In order to identify the theoretical maximum yield for the gasifier, the method of minimisation of Gibbs energy is used.
The global gasification reaction can be written as follows:
2452423221222 76.376.3 mNCHxOHxCOxCOxHxmNmOOwHOCH zy +++++=+++
A Gibbs reactor was modelled in Hysys in order to look at the product gas composition with varying reaction temperature and oxygen fed to the reactor. The results are shown in the Figures below (figure 25, 26 and 27). The amount of oxygen is given as molar flow at the x-axis, the amount of pyrolysis product fed to the reactor is held constant at 100 kmol/h.
00,050,1
0,150,2
0,250,3
0,350,4
0,450,5
20 30 40 50 60
Oxygen [kmol/h]
Mol
ar fr
actio
n
CH4
O2
H2
CO
CO2
H2O
Figure 25: Product composition with increasing amount of oxygen, at T=900°C

105
00,050,1
0,150,2
0,250,3
0,350,4
0,450,5
20 30 40 50 60
Oxygen [kmol/h]
Mol
ar fr
actio
n
CH4
O2
H2
CO
CO2
H2O
Figure 26: Product composition with increasing amount of oxygen, at T=1000°C
00,050,1
0,150,2
0,250,3
0,350,4
0,450,5
20 30 40 50 60
Oxygen [kmol/h]
Mol
ar fr
actio
n
CH4
O2
H2
CO
CO2
H2O
Figure 27: Product composition with increasing amount of oxygen, at T=1200°C
The CO and H2 yield compared to CH4, H2O and CO2 increases with increasing temperature, hence a high operating temperature is desirable. For an operating temperature at 1200°C, the highest yield is at 25 kmol/h of oxygen (1/4 of the pyrolysis product), which is the stochiometric amount of oxygen in the net reaction:
222)( HCOOHsC +↔++
However, as the less exothermic reaction to CO2 and H2O is less important at high temperature, the available heat from the reaction system is less. This heat is used in the

106
pyrolysis part of the process. For the given optimum point, the heat released is kJ61096.3 ⋅ .
Menges et al (1992) gives the following energy of reaction
kJHHCOOCH rx 9221)( 222 −=Δ+↔+−−
With ΔfH(H2) = 0, ΔfH(O2) = 0, and ΔfH(CO) = -111kJ, the corresponding value for plastic, -CH2-, is -19kJ. The energy needed for the pyrolysis and heating of the substances to the inlet temperature of the gasifier is then:
1. Pyrolysis:
kJinletkmolproductkmolproductkmolkmol
molmol
kJ 95005.010010019 =⋅⋅⋅
2. Heating from 25°C to 480°C:
kJCTQ o 610005.1)48025( ⋅=→=Δ
Total heat required = kJ6101.1 ⋅
This shows that there is a surplus of energy released in the gasification zone compared to the heat required in the pyrolysis zone. The excess heat results in a rise in temperature.

107
Appendix 14: HDPE and PP Borstar processes commercial analysis and technology review (Nexant 2002)

108

109

110
Appendix 15: Different Methanol to Olefin concepts
ExxonMobil MTO Baytown (USA, TX)
Status: PDU from methanol to olefins (80 times larger than competition) optimized for commercialization. MTO linked with polyolefin unit. no commercial project expected until 2014, cf.: “Exxon pursues only projects that will turn a profit even in the leanest years” (Rex Tillerson, head of Exxon Mobil)
Propylene/ethylene ratio is 1
~ 40% high olefinic gasoline as co-product
Figure 28: MTO PDU picture and environmental performance graph (ExxonMobil 2005)

111
Lurgi MTP Tjeldbergodden (Norway)
Status: pilot plant and PDU (PDU > 5000 hours ) optimized for commercialization, not expected untill 2008 (signed Iranian project at a standstill)
High propylene selectivity
Süd-Chemie AG (Munich, Germany) commercial catalyst
Figure 29: Lurgi MTP PDU picture in Norway (Lurgi 2002)
Figure 30: Lurgi MTP process flow chart (Lurgi 2002)

112
UOP/Hydro MTO Porsgrunn (Norway) (technology data used in this report)
Status: PDU (up to 1 ton/day methanol since 1995) optimized for commercialization, not expected untill 2008 (Nigeria, Egypt)
Propylene/ethylene ratio is flexible
Only 0.2 tons C4+ co-products per ton of light olefins
Figure 31: UOP/Hydro MTO picture, in Norway and carbon yield graph (UOP/Hydro 2003)
JGC Corp DTO, Dimethyl ether To Olefins (Japan)
Status: 1 ton/day pilot plant
DME to propylene with higher yield than Lurgi MTP
Figure 32: JGC Corp DTP process flowchart (JGC Corp 2005)

113
UOP/Total MTO/OC Feluy (Belgium)
Status: PDU (2006) optimized for commercialization, MTO followed by polyolefin unit.
MTO/OC methanol to light olefins carbon yield is ~ 90%
Figure 33: MTO/OCP coupling flowchart (UOP 2002)
Figure 34: Co-products production of MTO/OCP coupling positioned within other olefin production processes (UOP 2003)