waste-to-energy: solutions for solid waste problems for ...infohouse.p2ric.org/ref/09/08624.pdf ·...
TRANSCRIPT

Waste-to-Energy: Solutions for Solid Waste Problems
for the 21st Century
Brent M Voelker
89

Waste-to-Energy: Solutions to Solid Waste Problems
for the 2Ist Century
Introduction
Human beings have been burning their refuse for centuries. Early in the industrial revolution, mass incineration. of both manufacturing and residential waste became common place. Anyone who attended primary or secondary school as late as the 1970’s remembers large stacks that originated deep in the basements of their schools, issuing forth black smoke from the combustion of their homework, failed laboratory experiments, and school lunch leftovers. Almost no effort was made to control emissions, both airborne and solid, from waste incinerators. But as public awareness of the environmental impact of man’s activities came to the fore, concern about the products of waste combustion brought uncontrolled burning to an end.
Today’s waste-to-energy (WE) electric power plants are far removed from the low-tech burners of yesterday. Rugged marvels of engineering, they can be tailored to burn anything from industrial, agricultural, and lumber by-products, to the waste we generate in our homes, to ancient waste buried in landfills decades old. Modem WTE plants have been well analyzed for environmental impact. They are equipped with the latest in combustion and pollution control technologies to keep emissions and toxins not only below those that increase risks to public health, but below those detectable by the most sensitive tests in use. Waste combustion provides integrated solutions to the problems of the modem era: by recovering otherwise lost energy and metals, thereby reducing our use of precious natural resources; by cutting down our emissions of greenhouse gases; and by both saving valuable land that would otherwise be destined to become landfill and recovering land once sacrificed to the products of consumerism.
In this paper, we will examine the risks and problems associated with WTE combustion. We will discuss the major pollutants they generate, how they are formed, what paths they take into the environment, and the effects they have on living organisms. Next we will explore the design of a typical municipal solid waste combustion plant and hint at some of the solutions to these problems as we go. Once the reader has a firm understanding of the processes involved, we will explore in detail methods for minimizing the risks associated with waste combustion, including current technologies and those presently under investigation. We will. also compare these risks to those associated with other waste management strategies. .Finally, we will discuss economic feasibility, and close with a plan for solid waste management in the next century.
Waste-to-energy provides the fourth “R” in a comprehensive solid waste management program: reduction, reuse, recycling, and energy recovery.
91

The Hazards of Waste Combustion: Sources and Effects
The major pollutants associated with solid waste combustion can travel two main paths into the environment, via stack emissions and ash discharge. Many of the products of waste energy recovery are common to all combustion processes, particularly oil and coal and in some cases even natural gas.
Acids such as hydrochloric acid (HCl) and their precursors such as sulfur dioxide (Sa), which gives rise to sulfuric acid (H2SO4), result from burning of waste, coal, and to some extent, oil. Heavy metals found in solid waste can be liberated during combustion. These also form a component of coal combustion products. Nitrogen oxides (NOX) are produced in all high temperature combustion processes, regardless of fuel type. Greenhouse gases which include NO, and carbon dioxide (CO2) are also of concern, as is the asphyxiant carbon monoxide (CO).
Contrary to commonly raised arguments against implementing WTE combustion, the primary source of nitrogen contributing to NO, formation is not fuel, but air.[2] Some nitrogen bound to organic radicals in the fuel can combine with oxygen to form NO,. This is called Fuel NO,. Prompt NO, is formed in the presence of hydrocarbons. But these mechanisms are more important at lower temperatures. The formation of thermal NO, dominates when temperatures reach 2000°F at which efficient power plants operate. In this process, thermal energy is high enough to cause nitrogen in the air to combine with oxygen directly. Figure 1 shows these reactions.
Figure 1: NOX Formation Reactions
1. Fuel: R3N + O2 > NO, NO2 ,CO2 ,H2O
2. Prompt: CH4 + O2 + N2 > NO, NO2, CO2, H2O
3. Thermal: N2 + O2 > NO, NO2
Metals enter the incinerator not only in the form of large materials which can be later sifted out, but also in trace amounts as components in products such as paper and its print, plastics, organic waste, and batteries.[l3] It is these trace metals that present the largest problem, since they can become airborne upon combustion. Mercury is of primary concern. It has the greatest potential of all the metals commonly found in waste to vaporize and pass to the environment as a stack emission.
Some pollutants are unique to solid waste combustion. These include polychlorinated dibenzodioxins and polychlorinated dibenzofurans (commonly termed PCDD and PCDF, or dioxins and furans, respectively) which are formed from the chlorine and chloride compounds found in household and industrial waste. Organic compounds like benzene
92
—
—
—

or polychlorinated biphenyls (PCB) are exclusive to the burning of solid waste. In addition to fine particulate ash, these gaseous and volatile compounds comprise the major potential airborne pollutants in WTE stack emissions. Table 1 gives a summary of the compounds of concern, their sources, and the hazards associated with each.
Many of these pollutants, however, actually have a greater potential to enter the environment as components of ash. Ash can be divided into two categories, fly ash and bottom ash. Bottom ash comprises between 80% and 99% of all ash discharged.[4] This is the ash made of unburned materials that remain in the furnace after combustion.
Table 1 : Primary Hazardous Constituents of WTE Stack Emissions
Pollutant
SO2
HCl
CO
Dioxins and Furans
organic Compounds
Heavy Metals (Pb, Hg, Ni, Be,
As, Cd, Cr)
Source
Sulfur in refuse combines with oxygen at high temperature
Chlorine in fuel combines with hydrogen at high temperature
Two main processes: Thermal NOX, Prompt NOX, and Fuel NOx
Formed from incomplete combustion of hydrocarbons
Chloride and chlorine from household cleaners, food, and industrial chemical processes
Benzene and PCB’s formed from household and industrial chemicals at high temperature
High temperatures cause trace metals to go airborne
Associated Hazards
Acid rain, by forming H2SO4
in the atmosphere
Acid rain
Greenhouse gas, Major component in urban smog, Eye, throat, and nose irritant
Combines with read blood cells to preclude oxygen adsorption
Carcinogens
Carcinogens
Lead and mercury poisoning, Adverse neurological effects when accumulated in the body
93
NOX

Although most metals remain in the bottom ash, their concentration there is relatively low in comparison to fly ash. Following passage through several heat exchangers, the flue gas enters a treatment stage which includes an atomized lime spray to remove acids from the stream. This spray cools the gas, causing volatile compounds and metals to condense. Since the fly ash is very fine, it provides a large surface area for the adsorption of these metals and compounds. And since the total quantity of fly ash is relatively low, the resultant concentration of these adsorbed pollutants within it can be very high.[4]
Ash discharged from WTE plants must undergo tests designed by the Environmental Protection Agency (EPA) to determine the toxicity of leachate to which they might give rise if disposed of in landfills or utilized in constuction materials. Fly ash, though smaller in quantity, is typically much closer to EPA limits. If the limits of these tests are exceeded, the material must be considered hazardous waste.[4] Mixing fly ash with bottom ash can reduce the overall concentration of pollutants. But then the relatively benign and sometimes useful bottom ash is sent to a landfill rather than being put to use. The ash-handling problem presents many engineering trade off.
A Typical Waste-to-Energy Power Plant
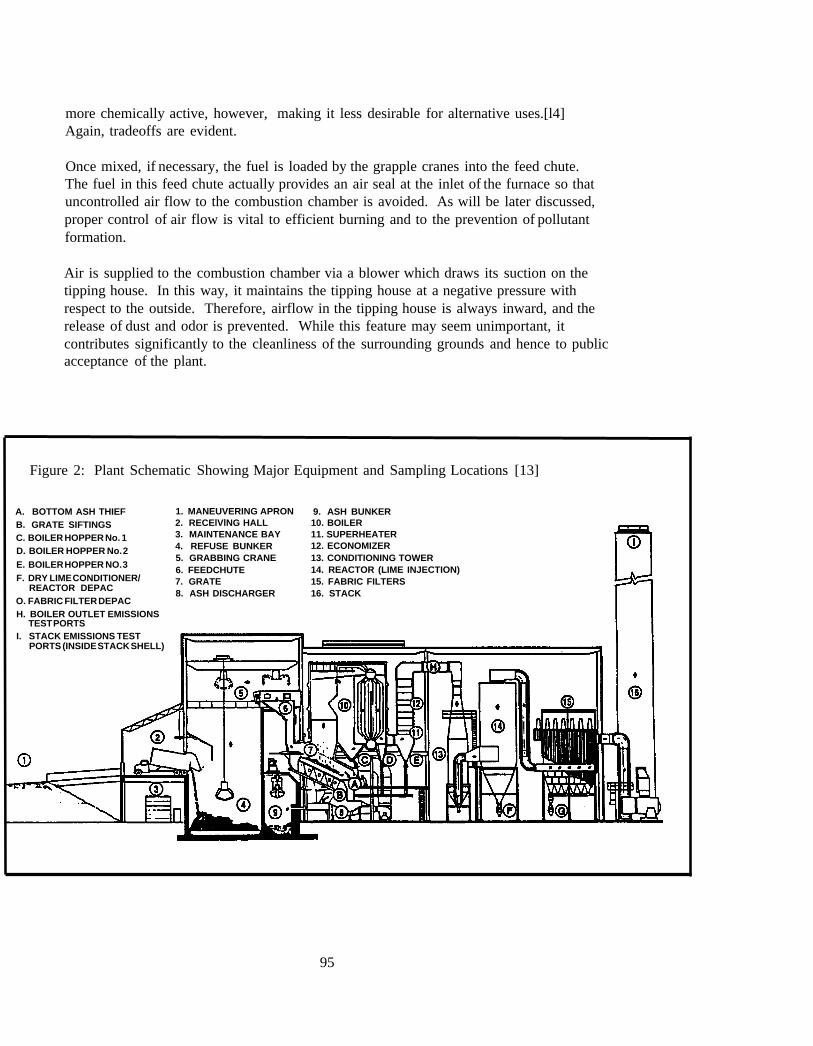
A cross-sectional view of a typical WTE plant is given in Figure 2. The process begins with fuel delivery to the tipping house. There are two major types of fuel in use today: Mass Burn Fuel and Refuse-Derived Fuel (RDF).[6]
Mass bum plants make direct use of waste in an "as is" condition. The refuse is delivered either directly from the hauler or from solid waste transfer stations. Normally, the transfer station is relied upon to provide a clean stream of waste, free of materials prohibited from combustion by law. If prohibited materials are present, they will be detected through flue gas analysis during combustion. Transfer stations deposit their refuse directly into the bunker. Individual haulers, however, are required to dump their cargo on the tipping floor where it is inspected and sorted prior to depositing it in the bunker.
Once in the bunker, the fuel is thoroughly mixed by grapple cranes to ensure an acceptably uniform product is input to the furnace. Plastics will burn at higher temperatures, while yard wastes with their high moisture content will reduce flame temperature. Consistent temperature is important for efficient combustion.
Refuse Derived Fuels are pre-processed at a separate facility. Trash is ground into fine particles. Metals and other non-combustibles are removed. The fuel is then packed into cigar-sized pellets. Although this process quires further energy and monetary input, it results in a more consistent fuel and, therefore, in less temperature fluctuation in the furnace. Additives to this fuel can be used to reduce the formation of some of the pollutants described above. The ash resulting from RDF tends to be finer and somewhat
94
more chemically active, however, making it less desirable for alternative uses.[l4] Again, tradeoffs are evident.
Once mixed, if necessary, the fuel is loaded by the grapple cranes into the feed chute. The fuel in this feed chute actually provides an air seal at the inlet of the furnace so that uncontrolled air flow to the combustion chamber is avoided. As will be later discussed, proper control of air flow is vital to efficient burning and to the prevention of pollutant formation.
Air is supplied to the combustion chamber via a blower which draws its suction on the tipping house. In this way, it maintains the tipping house at a negative pressure with respect to the outside. Therefore, airflow in the tipping house is always inward, and the release of dust and odor is prevented. While this feature may seem unimportant, it contributes significantly to the cleanliness of the surrounding grounds and hence to public acceptance of the plant.
Figure 2: Plant Schematic Showing Major Equipment and Sampling Locations [13]
A. BOTTOM ASH THIEF B. GRATE SIFTINGS C. BOILER HOPPER No. 1 D. BOILER HOPPER No. 2 E. BOILER HOPPER NO. 3 F. DRY LIME CONDITIONER/
O. FABRIC FILTER DEPAC H. BOILER OUTLET EMISSIONS
I. STACK EMISSIONS TEST
REACTOR DEPAC
TEST PORTS
PORTS (INSIDE STACK SHELL)
1. MANEUVERING APRON 2. RECElVlNG HALL 3. MAINTENANCE BAY 4. REFUSE BUNKER 5. GRABBING CRANE 6. FEEDCHUTE 7. GRATE 8. ASH DISCHARGER
9. ASH BUNKER 10. BOILER 11. SUPERHEATER 12. ECONOMIZER 13. CONDITIONING TOWER 14. REACTOR (LIME INJECTION) 15. FABRIC FILTERS 16. STACK
95

Flue gases rise from the combustion zone through the boiler where water inside the tubes of a heat exchanger is converted to saturated steam. Both steam and flue gas are then routed through a superheater, where the gas gives up more of its thermal energy to the steam. The superheated steam at 850 psig and 850°F is routed to the turbine generator. A typical plant has just one turbine generator with a capacity of between 15 and 40 MWe, 3 to 4 MWe of which are used within the plant to operate its equipment. The remainder is normally sold to the local electric company, who is mandated to purchase the power under the Public Utility Regulatory Policies Act of 1978.[1]
A separate cooling loop condenses the steam and transports waste heat to cooling towers. In the cooling tower, this water is sprayed through an air stream. Some of the water is lost to the atmosphere as vapor, while the rest is recycled back to the condenser.
As the flue gas leaves the boiler area, it passes through a final heat exchanger. The economizer preheats the incoming boiler feed water and cools the flue gas so that it can be analyzed for hazardous emissions and undergo pollutant removal processes. This equipment typically includes electrostatic precipitators to remove particulate, a lime slurry reactor to remove acids and metals, and a filter bag house to capture the remaining fly ash. The resultant stack emissions are 99% oxygen, nitrogen, carbon dioxide, and water. Various techniques used to achieve this figure will be discussed in later sections.
Meanwhile, the bottom ash is quenched with water as it is discharged from the combustion chamber. A conveyor transports it to a sifter and magnet for the removal of metals. A 1200 ton per day (TPD) plant can recover from 40 to 70 tons of recyclable metals each week. These are metals that would otherwise have gone to landfill. Some plants then mix fly ash recovered from the filter house with the bottom ash. Others handle the two separately.
Also interesting from an engineering standpoint is the management of water at a WTE facility. A plant can require up to 700,000 gallons of water per day to make up for steam leaks and losses from the cooling loop as well as for bottom ash quenching water. This water is frequently supplied by the effluent from a local sewage treatment facility. Rainwater is also collected in a reservoir to supply the fire fighting system which is used in the event that a fire is started from mixing chemicals in the refuse bunker. Excess rainwater is tested for leachate toxicity before it is released to the environment. Finally, groundwater is monitored for the presence of leachate through a series of wells at the perimeter of the property. One of these wells normally supplies potable water to the facility.
Now that the reader is familiar with the WTE process and the pollutants it generates, the current technologies in used to reduce the risks can be discussed.
96
Saving Fossil Fuels, Reducing Emissions, and Eliminating Landfills
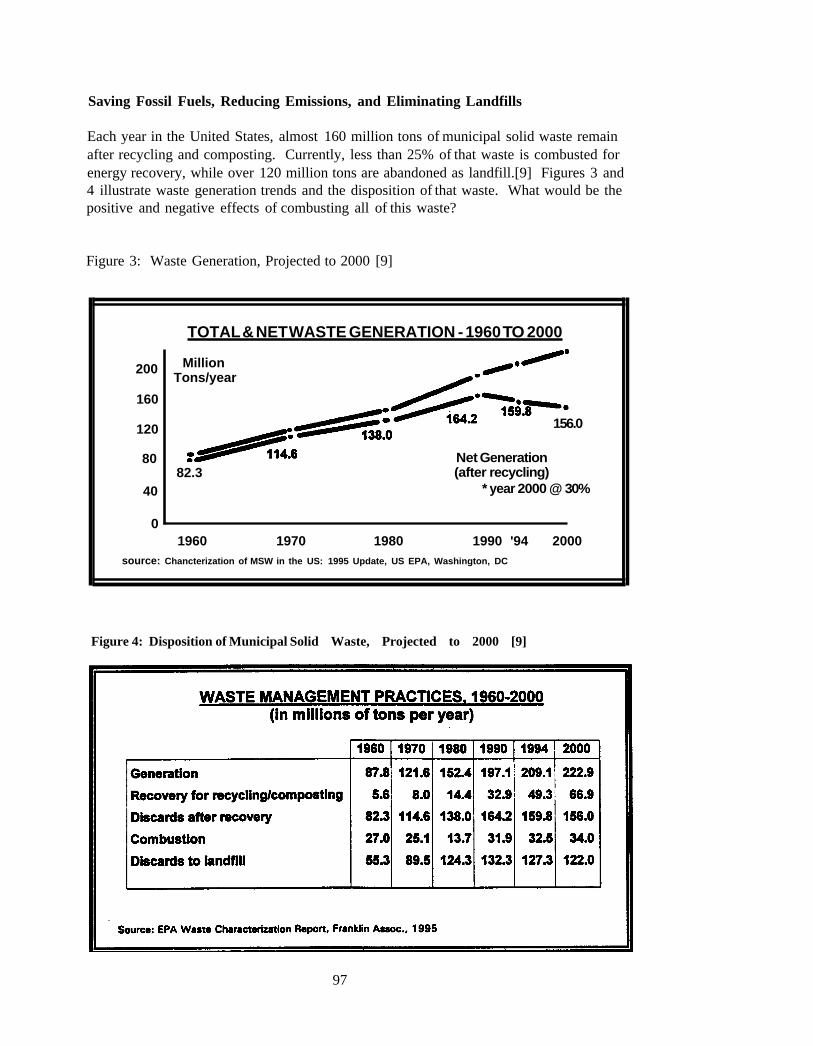
Each year in the United States, almost 160 million tons of municipal solid waste remain after recycling and composting. Currently, less than 25% of that waste is combusted for energy recovery, while over 120 million tons are abandoned as landfill.[9] Figures 3 and 4 illustrate waste generation trends and the disposition of that waste. What would be the positive and negative effects of combusting all of this waste?
Figure 3: Waste Generation, Projected to 2000 [9]
200
160
120
80
40
0
TOTAL & NET WASTE GENERATION - 1960 TO 2000
Million Tons/year
156.0
Net Generation 82.3 (after recycling)
* year 2000 @ 30%
1960 1970 1980 1990 '94 2000 source: Chancterization of MSW in the US: 1995 Update, US EPA, Washington, DC
Figure 4: Disposition of Municipal Solid Waste, Projected to 2000 [9]
97

Coal is the major fuel source for electric power plants in the U.S. The energy contained in a fuel is often termed the “heating value” and is reported in Btu per pound. The heating value for typical coal is about 13,000 Btu/lb. The heating value for mixed municipal waste is approximately 4,800 Btu/lb. Many of the constituents of mixed waste have heating values on the order 6,000 to 8,000 Btu/lb. Plastics and tires have heating values even higher than that of coal. Table 2 shows a comparison of heating values for several fuels and materials.
Table 2: Heating Values (in Btu/lb.) of Various Fuels and Components of Municipal Solid Waste [9]
Fuel Heating Heating Fuel Heating Value Value Value
Anthracite Coal 13,500 Mixed Paper 6,800 Polystyrene 16,419 Bituminus Coal 14,000 Newsprint 7,950 Mixed Plastic 14,100 Peat 3,600 Cardboard 7,043 Tires 13,800 No.2 Oil 18,000 Junk Mail 6,088 Leaves 5,000 Natural Gas 24,000 Magazines 5,250 Grass 2,690 Mixed MSW 4,800 Polyethylene 18,687 Green Wood 2,100
Encouraging composting of yard and food wastes would reduce the low-heating value constituents and improve the energy density of refuse fuel. If the technology is applied to industrial processes, a clean, energy dense fuel may be readily available on site, eliminating financial and energy expenditures associated with the with the recovery and acquisition of coal. Two examples of industrial WTE will be mentioned later.
But even without waste stream homogenization, a quick calculation demonstrates significant fossil fuel savings gained by combusting rather than throwing away waste. About 3 lb. waste must be burned to obtain the energy in a pound of coal. Burning 160 million tons of waste could displace 57 million tons of coal each year.
It is true that some emissions from solid waste combustion are higher that those from coal, particularly carbon monoxide and non-methane organic hydrocarbons (NMOC). Solid waste combustion produces 100 times more CO per ton than does coal and 45 times more NMOC.[5] But is necessary to compare the emissions from burning refuse to the alternative disposal methods.
Methane is a potent greenhouse gas. It traps three times the thermal energy in the atmosphere than does carbon dioxide. This gas is emitted in large quantities from landfill
98
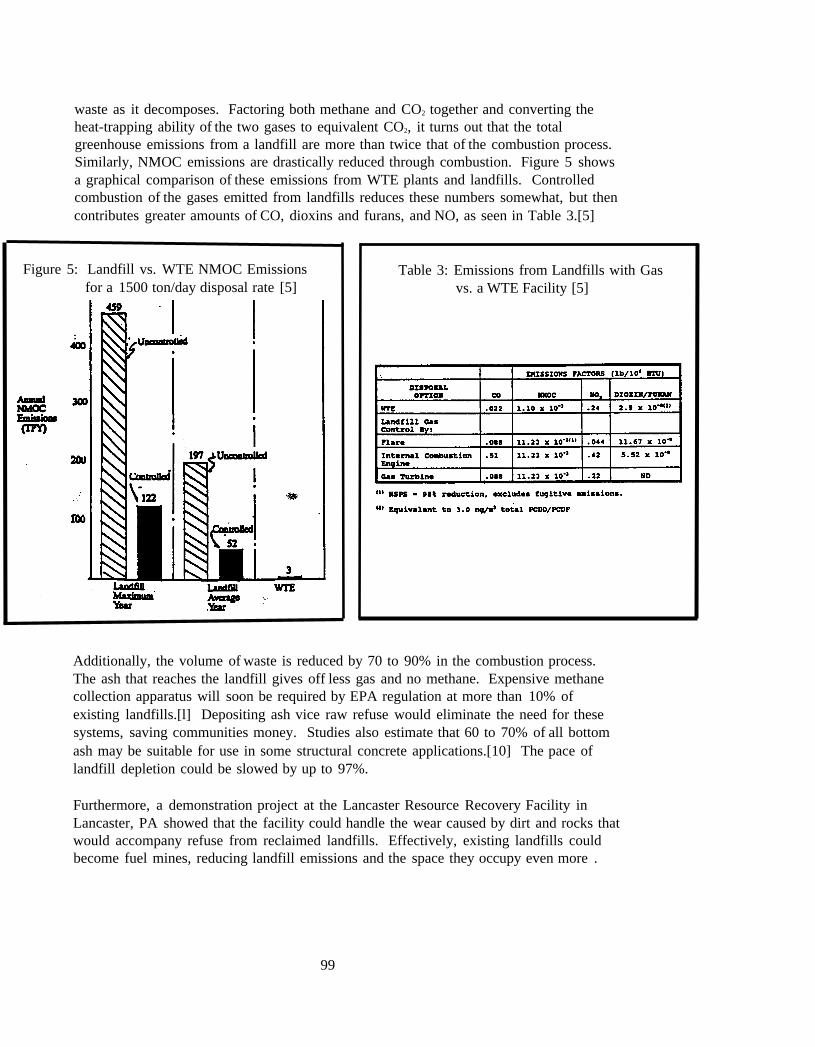
waste as it decomposes. Factoring both methane and CO2 together and converting the heat-trapping ability of the two gases to equivalent CO2, it turns out that the total greenhouse emissions from a landfill are more than twice that of the combustion process. Similarly, NMOC emissions are drastically reduced through combustion. Figure 5 shows a graphical comparison of these emissions from WTE plants and landfills. Controlled combustion of the gases emitted from landfills reduces these numbers somewhat, but then contributes greater amounts of CO, dioxins and furans, and NO, as seen in Table 3.[5]
Figure 5: Landfill vs. WTE NMOC Emissions for a 1500 ton/day disposal rate [5]
Table 3: Emissions from Landfills with Gas vs. a WTE Facility [5]
Additionally, the volume of waste is reduced by 70 to 90% in the combustion process. The ash that reaches the landfill gives off less gas and no methane. Expensive methane collection apparatus will soon be required by EPA regulation at more than 10% of existing landfills.[l] Depositing ash vice raw refuse would eliminate the need for these systems, saving communities money. Studies also estimate that 60 to 70% of all bottom ash may be suitable for use in some structural concrete applications.[10] The pace of landfill depletion could be slowed by up to 97%.
Furthermore, a demonstration project at the Lancaster Resource Recovery Facility in Lancaster, PA showed that the facility could handle the wear caused by dirt and rocks that would accompany refuse from reclaimed landfills. Effectively, existing landfills could become fuel mines, reducing landfill emissions and the space they occupy even more .
99

Cleaning Up the Act
A great deal of work has been to develop techniques which reduce harmful emissions from WTE plants. Some of the techniques target specific pollutants, while others tackle a variety of problems at once. But as in all engineering work, one must be aware that most solutions carry with them some drawbacks or hidden disadvantages. It is important to analyze an entire process before deciding if a new system offers a net gain or loss. A few solutions are discussed below.
Reducing Acids. Chloride. and Organic Compounds
Chlorine and the compounds to which it contributes pose problems not only for airborne and ash emissions, but within the plant as well. Hydrochloric acid and other chloride compounds create an environment favorable to Cl– corrosion of boiler tubes at high temperatures. It is difficult to remove these species prior to flue gas entry into the boiler section. One solution is to keep combustion temperatures below 570°F where materials become susceptible to Cl– corrosion.[6] But this alternative greatly reduces the thermal efficiency of the steam cycle.
RDF Additives
Another approach is to introduce lime (in the form of CaO or Ca(OH)2) directly into refuse derived fuel[6] The calcium reacts with chloride ions to preferentially form CaCl2, a particulate that can be removed. A recent study in Japan has shown this technique to reduce the formation of HCl and dioxins to nearly zero.
By this method, chloride compounds are eliminated at the source, prior to flue gas contact with the boiler tubes, so that the temperatures required for maximum efficiency can be attained without establishing the conditions for this type of corrosion. Stack emissions of acids and the toxicity of fly ash are consequently reduced as well.. Another advantage of this method is that it can be implemented with no capital investment in plant equipment modifications. The trade off include increased energy expenditure and cost to process the fuel, and an ash that is less suited for use in other materials as will be discussed later.[12,14]
Over-fire air
The use of well placed overfire air jets can also reduce dioxin and furan production.[8] Air injected in a specific pattern above the combustion zone forms a blanket which keeps particulate from rising into the flue gas stream. The air streams cause the flue gas to circulate back into the combustion zone. The amount of time that dioxins and furans reside in the high temperature zone increases, giving them more time to participate in reactions and therefore reducing their concentration.
100

Detailed studies have been done to determine the optimum jet configuration for some newer plants. Computer modeling and performance testing to determine the optimum location and orientation of the injection nozzles is the most expensive part of planning and installing an effective system in existing furnaces. This technique can be easily and cost effectively included in new plants, but retrofitting existing may be for difficult and cost prohibitive.
The Sorbalit System
Sorbalit is a compound comprised of a mixture of lime, activated carbon, and sulfur. It can be introduced in three different forms and in two different locations in the plant. It cannot be injected into flue gas prior to the boiler, so its primary benefit is to reduce acid and chloride compound emissions. Sorbalit can be injected into flue gas as a dry powder, as a conditioned dry sorbant downstream of a water spray, or in a liquid slurry as a substitute for pure lime normally injected in the slurry reactor.[7]
Activated carbon is highly porous, and so presents a large surface area for the adsorption of gaseous species. Tests have shown concentrations of carbon as low as 3% in the lime slurry to be effective in removing between 95.6 and 100% of dioxin and furans in the flue gas streams of two German WTE plants. The results of those tests are shown in Figure 6.
Figure 6: Reduction of Dioxins in Two German WTE Plants [7l
Using Conditioned Spray - Dry Sorbalit is injected downstream of a water spray.
Using Wet Spray Injection in a Standard Lime Slurry Reactor.
101

In the same study, hydrated lime in the Sorbalit was shown to remove in excess of 88% of HCl and SO2 by the following two reactions:
Ca(OH)2 + SO2 + CaSO3 + H2O
Ca(OH)2 + 2 HCl + CaCl2 + 2 H2O
Table 4 shows the details of the test results, while Table 5 shows that Sorbalit reduced PCB's to below detectable levels.
Table 4: Acid Gas Removal Capability of Sorbalit [7]
Table 5: PCB Reduction by Sorbalit[7]
102
Reducing NOX Emission
There are two ways to tackle the NO, problem: prevent its formation or chemically remove it after it is produced. One of each is described here, both of which have clear tradeoffs.
Combustion in an Oxygen-rich Environment
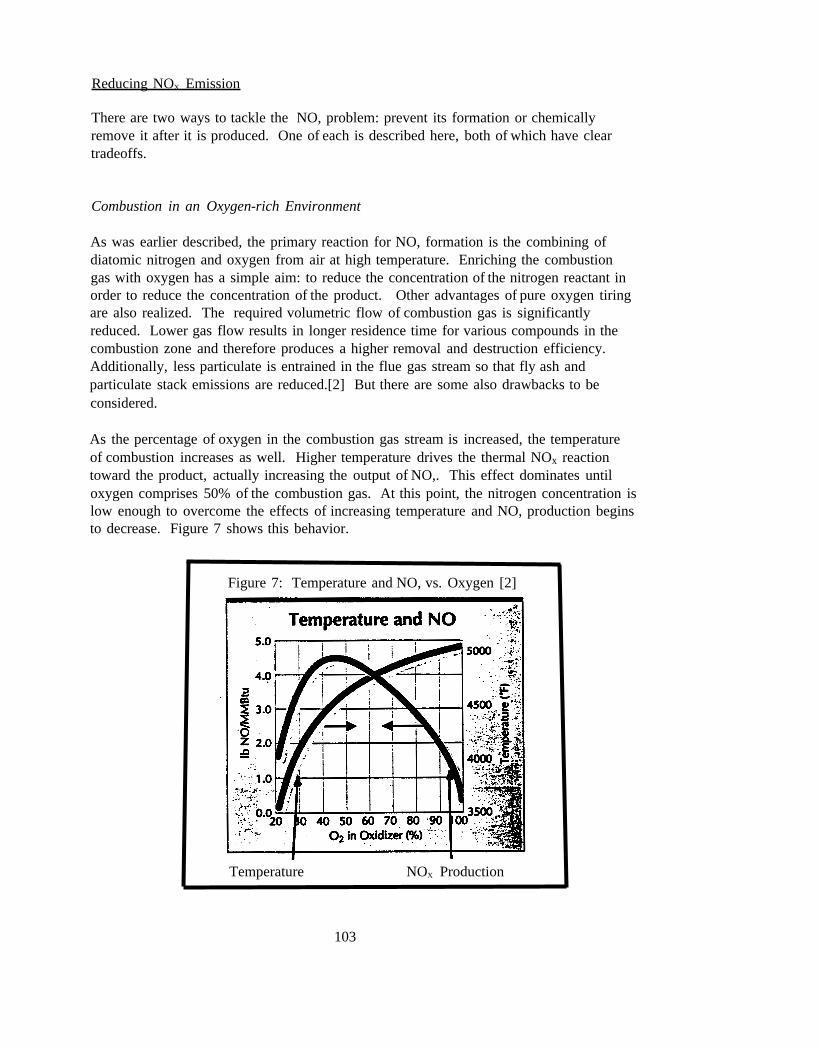
As was earlier described, the primary reaction for NO, formation is the combining of diatomic nitrogen and oxygen from air at high temperature. Enriching the combustion gas with oxygen has a simple aim: to reduce the concentration of the nitrogen reactant in order to reduce the concentration of the product. Other advantages of pure oxygen tiring are also realized. The required volumetric flow of combustion gas is significantly reduced. Lower gas flow results in longer residence time for various compounds in the combustion zone and therefore produces a higher removal and destruction efficiency. Additionally, less particulate is entrained in the flue gas stream so that fly ash and particulate stack emissions are reduced.[2] But there are some also drawbacks to be considered.
As the percentage of oxygen in the combustion gas stream is increased, the temperature of combustion increases as well. Higher temperature drives the thermal NOx reaction toward the product, actually increasing the output of NO,. This effect dominates until oxygen comprises 50% of the combustion gas. At this point, the nitrogen concentration is low enough to overcome the effects of increasing temperature and NO, production begins to decrease. Figure 7 shows this behavior.
Figure 7: Temperature and NO, vs. Oxygen [2]
Temperature NOX Production
103

Hence, a large percentage of the combustion gas must be oxygen to realize the benefits of this technique. One must examine the energy input required to collect and distribute the pure oxygen, as well as economic and safety considerations, to decide if this modification poses a net gain.
Selective Non-catalytic and Catalytic Reduction
Selective Non-catalytic Reduction (SNCR) removes NO, through direct chemical reaction with a reagent.[11,16] Compounds used in this process include ammonia and urea. A problem with this process is called “ammonia slip,” which is a measure of the amount of ammonia that fails to react. Since it does not react with lime in the slurry reactor and is a volatile chemical, ammonia will pass through the flue gas purification system and exit as a stack emission. Ammonia also has the potential to combine with HCl to form an ammonium chloride plume as it exits the stack. Ammonia slip tends to be more difficult to minimize when ammonia itself is used as the reagent.
Therefore, urea (commercially named NOxOUT) has become the reagent of choice. It removes NO, through the following reaction:
CO(NH2)2 + 2NO + ½ O2 > 2N2 + CO2 + H2O
NOxOUT is most effective at high temperature, and is therefore injected directly above the combustion zone. NOxOUT typically has a removal efficiency of between 50 and 75%, but in some cases has removed up to 90%. Some ammonia slip has been observed, but Figure 8 illustrates how removal efficiency increases while ammonia slip decreases as temperature rises. At typical operating temperatures, ammonia slip is less that 5%. The system can be fairly economically installed and operated.
Figure 8: NO, and Reduction and Ammonia Slip as a Function of Temperature [11]
NSR = 2, NOxl - 200 ppm. NOxOUT Kinetic Model Residence Time = 1 Sec,, Equilibrium CO
Temperatur (F) NOx NH3
–
104
____ ........

Selective Catalytic Reduction (SCR) removes NO, by injecting ammonia over a metal oxide catalyst bed. The efficiency of this process is optimized between 550 and 1000 °F and consistently exceeds 80% removal. However, the drawbacks are many. The metal oxide bed cannot be located at the point in the flue gas stream where the temperature is optimal, since this occurs prior to the removal of many contaminants that can poison the bed. Therefore, the SCR system must be placed just prior to the stack, and requires the 200 °F flue gas to be reheated at high electrical cost. Additionally, installation of the bed and system involve high capital expenditure.[11] Most facilities choose SNCR over SCR.
Reducing Particulate Emission
Combustion in Oxygen and the Use of Ovefire Air
As previously discussed, enriching the combustion gas with oxygen reduces the volumetric flow required. Lower velocity flue gas entrains fewer fine particles and fly ash and emissions are subsequently reduced. Proper orientation of the jet nozzles which inject overfire air form a blanket which impedes the passage of particulate. Additionally, overfire air creates flow patterns which recirculate unburned airborne particles back into the combustion zone, increasing their residence time, and improving their chances for complete combustion.[2,8]
Removing Metals
Sorbalit is once again useful in metal reduction. Porous activated carbon provides a large area for surface adsorption of mercury, the metal of primary concern. The sulfur compounds included in Sorbalit serve two functions. By some process not fully understood, the sulfur appears to maintain the carbon in an activated state, keeping the pours from closing. Its second function is to capture monatomic mercury and combine it to from a mercury sulfate. This compound is more readily adsorbed by the carbon. [13]
Another method makes use of high temperature adsorbents included in the sand used in fluidized bed furnaces. In these furnaces, the fuel is suspended in air among a bed of noncombustible particles such as sand. Commingled with the sand are materials which, like carbon, adsorb metals. These must be periodically filtered out and replaces. Most WTE plants do not make use of fluidized bed combustion.
105

Evaluating the Options
Many of these techniques offer promising solutions to the dilemmas of WTE combustion. But as earlier discussed, a complete life cycle analysis should be performed prior to deciding whether any one should be implemented. What are the additional energy and financial expenditures required? What risks are being obviated? Do the risk reduction gains outweigh the higher input costs?
Peter Valberg and associates present an excellent discussion of WTE risk assessment.[l5] There are five major steps in such an assessment.
1. Determination of stack emissions of potentially toxic chemicals.
2. Modeling of atmospheric dispersion and resulting exposure point concentrations.
3. Development of scenarios by which humans or other organisms may become exposed.
4. Determination of functions relating dose to effects. These are called dose-response functions.
5. Derive the total probability impact on public and environmental health.
In a risk analysis case study of a WTE plant in Rutland, VT, Valberg and coworkers found that low stack emissions were widely dispersed so that concentrations of some toxic substances and heavy metals would be so low as to be undetectable. Regardless, then, of exposure scenarios and dose-response functions, the final probability of impact on public and environmental health would be near zero. Soil samples validated this prediction. This result begs the question, can the removal of some elements such as mercury from the flue gas stream and the concentration of the metal in a substance like Sorbalit do more harm than good? These are the questions that green engineers must answer to make intelligent design choices.
Using the Ash
Many studies have investigated the use of ash as a filler in concrete, masonry block, and road pavement.[10,l2,14] The results are mixed. Careful consideration of the application and requirements must be given before choosing ash as a filler. But studies almost invariably include tests for leachate toxicity. These require the material to be pulverized after it has set into specific size particles and immersed in an alkaline bath. After a specified time period, the bath is analyzed for the presence of metals and toxic chemicals.[4] On this point, all studies reach the same conclusion: used in concrete,
106

solid waste ash exhibits leachate well below EPA limits. In the case of many chemicals, their presence in leachate from concrete is below detectable levels.
Bottom ash from both mass burn and RDF plants were tested as filler for concrete, mortar, and masonry block.[l2] RDF ash performance was not promising. Gas evolution, possibly hydrogen formed from reaction of aluminum in the ash with alkalis, caused cracking and sample elongation in concrete and mortar. The compression strength of concrete filled with RDF ash was only 10% of the control sample which utilized sand as a filler. Mass burn ash faired better, but was still not considered acceptable in concrete and mortar. Washing the ash in lime to remove some reactive chemicals both reduced gassing and improved strength. Figure 9 compares the strengths of the various mixes.
with Various Fillers [12]
Age, Days
M - Mass Burn Ash W - Washed in Lime R - RDF Ash U - Unwashed
Table 6: Compression Strengths of Masonry with Various Fillers [12]
Compressiv Strength (psi)e
Seven-Day (21)
Control M-U-100 R89-U-100 R7-U-100 M-W-100 R89-W-100 R7-W-100 M-W-50 R89-W-50 R7-W-50 M-W-25 R89-W-25
See Key in Figure 9.
28-Day (3)
1340 1310
610 870
1360 770 570
2,900 1,460 1,080 2333 1,700
Because masonry block is porous by design, gassing and elongation were damaging. In fact, Table 6 shows that washed mass burn ash outperformed the control concrete in compressive strength tests. Some odor was detectable, however.
A two mile stretch of road in Laconia, NH served as a testing ground for a bottom ash paving demonstration. The ash-filled concrete was used in a very specific application, not in the top layer called the Wearing Course, but in the middle layer, termed the Binder Course. Figure 10 gives a cross-sectional view of the pavement.
107

Figure 10: Cross-sectional View of New Hampshire Paving Project [10]
As discussed earlier, fly ash is high in chloride-containing compounds. It therefore has been shown to have adverse effects on the pavement.[l2,14] The study concluded, however, that if bottom ash is collected separately, 60 to 70% of it may be suitable for use in the binder course of roadways.
Throwing the Ash Away
If an adequate market cannot be built to make use of all ash, some will have to be sent to the landfill. Some ash, particularly fly ash, may never be suitable for other uses. In what ways can ash be further compacted to minimize the space it will occupy when finally at rest? Moisture reduction is one answer.
Blaisdell and others noted that following quenching, 50% of bottom ash by weight is moisture.[4] After considering four options for moisture reduction, they found an electric drying method which reduces moisture content to 20% can lead to significant economic savings. High moisture content also slowed production of asphalt in the New Hampshire project by 30%.[10] Economic benefits of ash drying could be realized there as well. As an example of the type of analysis such decisions require, a demonstration of the calculated savings from Blaisdell’s report is included in Table 7.
108

Table 7: Cost Analysis of Electric Bottom Ash Drying [4]
Analysis for 500 tpd MSW Incinerator
For Ash Moisture Content of 50% Dry ash produced 52.5 (tpd) Water in quenched ash (@ 50% moisture) 52.5 (tpd) Total ash 105 (tpd) Disposal and transport costs per day assuming
nonhazardous waste (@ $125/ton) $13,125 ($/d)
Dry ash produced 52.5 (tpd) For Ash Moisture Content of 20%
Water in quenched ash (@ 20% moisture) 13.13 (tpd) Total ash 65.63 (tpd) Disposal and transport costs per day assuming ($/d)
Net savings in disposal cost per day $4,922 ($/d) nonhazardous waste (@ $125/ton) $8,203
What is the Cost of Reducing Moisture lo 20%? Assume the following:
1. Electric resistance heating of wet ash. 2. Latent heat of vaporization = 970.13 Btu/lb (at 14.7 psia, 212 F). 3. Constant heat transfer efficiency = 70%. 4. 3,412 Btu/kwh and 2,000 lb/ton. 5. Electricity cost $0.05 kwh.
Moisture to be evaporated in tpd Moisture to be evaporated in lb/day Btus required kwhs per day required Electricity costs
Daily Net Benefit Savings in disposal cost per day Electricity cost for moisture reduction/day
Net Savings per Day Approximate Net Savings/Year
39.37 (tpd) 78,740 (lb/d)
31,980 (kWh/d) 1.091E+08 (Btu/d)
$1.599 ($/d)
109
$4,922 ($/d) $1,599 ($/d)
$3,323 ($/d) $1,213,000 ($/yr)

Plan for the Future
The benefits of full-scale implementation of energy recovery as a final step in waste management are evident: conservation of natural resources and fossil fuels, drastic landfill reduction, and lower greenhouse emissions. The economic benefits of pooling the resources of several municipalities are being demonstrated in Montgomery County, Maryland.[1] The county and surrounding communities are locating transfer stations along a railway which allows them to ship their waste in greater bulk (by 70 ton rail cars) at lower cost to a large resource recovery facility. Economies of scale are realized in this 1800 TPD plant.
Eight communities in southeastern Connecticut are demonstrating that it is possible to overcome political obstacles to movement of trash across municipal lines.[1] These facilities cover operations and management costs by tipping fees alone, which are lower than those of landfills in their regions. The capital investment was raised through the sale of bonds whose interest is paid using the profits of electricity and scrap metal sales.
But municipal solid waste is a small part of the problem. Manufacturing and agriculture account of the overwhelming majority of solid waste generation. WTE plants can be applied to much of that problem as well. The furnace designs are simple and efficient, and can accept a wide variety of fuels. The logging industry is one in which WTE plants show great promise. Two plants, one in Kettle Falls, Washington and the other in central Michigan are solving two problems at once: they are reducing wood waste from lumber yards that had begun to pile up, and are supplying power to industries whose equipment are necessarily in remote locations.[1]
Existing projects have already demonstrated WTE to be both economically viable and environmentally friendly. Armed with the knowledge gained from past successes and mindful of the tradeoffs solutions like these face, green engineers with vision can make the fourth R more than just an alternative. We can make it a way of life.
110

References
1. Anson, Susan, et.al. Profiles in Renewable Energy, U.S. Department of Energy Report NO. DOE/CH10093-206, 1993.
2. Baukal, Charles E. and Romano, Francis J. “Reducing NOx and Particulate,” Pollution Engineering, Vol. 24, No. 15, 1992.
3. Bayer, Randolph, et.al. “Montgomery County Resource Recovery Facility,’’ Proceedings of the 1994 national Waste Processing Conference. 1994.
4. Blaisdell, Mark L. and Daesoo-Baetz, Brian. ‘‘Economic Feasibility of Drying Municipal Solid Waste Combustion Residue,” Journal of Energy Engineering, Vol. 116,
”
No. 2, 1990.
5. Hahn, Jeffery L. and Jones, Kay H. “Waste-to-Energy: The Next Step in the Hierarchy after the Three R's,” Proceedings of the 1994 national Waste Processing Conference. 1994.
6. Haneda, H. “Efficiency Improvement Options For Municipal Waste-fired Power Generation - Recent Development Activities in Japan,” Journal of Power and Energy, Vol. 209, No. 2,1995.
7. Licatata, Anthony, et.al. “Acid Gases, Mercury, and Dioxin from MWC’s,’’ Proceedings of the 1994 national Waste Processing Conference. 1994.
8. Nasseerzadeh, V., et.al. "Effect of High Speed Secondary Air Jets on the Overall Performance a Large MSW Incinerator with a Vertical Shaft,” Combustion Science and Technology Vol. 92, No. 46,1993.
9. Municipal Solid Waste Factbook, Office of Solid Waste, U.S. Environmental Protection Agency Publication, 1996.
10. Musselman, Craig N., et.al. “The New Hampshire Bottom Ash Paving Demonstration,” Proceedinas of the 1994 national Waste Processing Conference. 1994.
11. Pickens, Richie. “Add-on Control Techniques for Nitrogen Oxide Emissions During Municipal Solid Waste Combustion,” Journal of Hazardous Materials, Vol. 47, 1996.
12. Rashid, Rosmadi A. and Frantz, Gregory C. “MSW Ash as an Aggregate in Concrete and Masonry,” Journal of Materials in Civil Engineering, Vol. 4, No. 4,1992.
111