waste reduction in food retail case study report: people's
TRANSCRIPT

Waste Reduction in Food Retail
Case Study Report: People's Food Cooperative's Packard Store
prepared by the:
Solid Waste Research Group School of Natural Resources
University of Michigan Ann Arbor, Michigan 48109
April 1991
prepared for the:
Office of Waste Reduction Services State of Michigan Departments of Commerce and Natural Resources
Lansing, Michigan
funded by the:
1989/1990 Solid Waste Alternatives Program Grant State of Michigan Department of Natural Resources


PREFACE
PROJECT DESCRIPTION
Overall Project Objectives
This study of solid waste reduction practices at the People's Food Cooperative's Packard store in Ann Arbor is part of a project comprising five case studies. The objective of the project was to analyze and document successful waste reduction programs implemented by commercial and industrial fmns in the state of Michigan so the identified waste reduction practices can be transferred effectively to other firms. The information presented in these reports may also serve to suggest ideas for waste reduction which could be implemented in other industries beyond those selected for the five case studies.
The primary focus of each case study is a change or innovation in a product or process that resulted in source reduction of nonhazardous solid waste. Process, economic, and organizational/motivational analyses are performed in each study. The process analysis includes a description of the product and process changes and the amount of waste reduction achieved. The economic analysis evaluates the costs and revenues to the firm that result from the waste reduction activity. Baseline economic data, including fixed and variable costs and revenues before the intervention, are compared with the after-intervention data. An organizational/behavioral study then examines the decision-making process, incentives and organizational support, company policy, and employee attitudes related to the initiation of the waste reduction activity.
The overall benefits of waste reduction measures also depend on the reduction of societal and environmental impacts associated with the life cycle of the goods provided or services rendered. External social and environmental factors relating to each program are identified and discussed where possible.
Some of the waste reduction programs documented in this report can be implemented relatively easily, whereas others may require significant capital investment, employee training, or operational changes. Each case study attempts to identify key elements of the model waste reduction program that are necessary for its successful implementation.
Case Study Firms
The case study firms were selected according to the following criteria: a priority of source reduction over recycling and other waste management strategies; the transferability of the waste reduction practices to other firms; information availability and accessibility; the potential amount of solid waste reduction achieved if other firms adopt the model waste reduction practices; and a diversity of businesses in terms of their SIC Code, size, organizational structure, and geographic location.
The five firms studied were:
l. Hudson's department stores in Michigan; retail department stores 2. Gretchen's House III in Ann Arbor; child day care facility 3. McPherson Hospital in Howell; cafeteria, patient food service 4. People's Food Cooperative's Packard store in Ann Arbor; grocery store 5. Steelcase in Grand Rapids and Kentwood; office furniture manufacturer

Project Publications
The following documents are available through the Office of Waste Reduction Services:
1. Fact Sheets - two page document summarizing waste reduction efforts of each case study firm. 2. Detailed Case Study Report - a comprehensive guide to assist firms with the actual
implementation of waste reduction efforts. 3. Final Project Report- description of the methodology, major findings, and recommendations
covering all five case studies.
A Fact Sheet and Detailed Case Study Report are published for each of the five case studies. Documents may be obtained from:
Office of Waste Reduction Services Michigan Departments of Commerce and Natural Resources POBox30004 Lansing, MI 48909 Phone: (517)-335-1178
FUNDING
A 1989/1990 Solid Waste Alternatives Program Grant under the Waste Reduction Research and Demonstration category supported this project. Funds for the grant were provided by the Quality of Life Bond and administered by the State of Michigan Department of Natural Resources.
ACKNOWLEDGEMENTS
Solid Waste Research Group, School of Natural Resources, University of Michigan
The Solid Waste Research Group was responsible for selecting the case study firms, conducting the on-site data collection and analysis, documenting the waste reduction activities, evaluating the potential impacts of these activities on the waste stream if they are adopted by other firms throughout Michigan, and preparing the case study reports. The following members of the Solid Waste Research Group participated in this project:
Jonathan Bulkley,Project Director, Professor of Civil Engineering and Natural Resources Gregory Keoleian, Principal Investigator, Research Fellow in Natural Resources Raymond DeYoung, Participating Investigator, Research Scientist Andy Duncan, Research Assistant Elise McLaughlin, Research Assistant Dan Menerey, Research Assistant Martha Monroe, Research Assistant Thomas Swenson, Research Assistant
State of Michigan Departments of Commerce and Natural Resources
The Office of Waste Reduction Services of the State of Michigan Departments of Commerce and Natural Resources provided assistance in the selection of case study firms and in reviewing the final report. Ms. Myra Grant served as project manager and administered the grant for the Resource Recovery Section, Waste Management Division, State of Michigan Department of Natural Resources.
n

The information presented in this report is the sole responsibility of the Solid Waste Research Group, School of Natural Resources, University of Michigan.
People's Food Cooperative, Packard Store
The staff members at the People's Food Cooperative's Packard location in Ann Arbor contributed greatly to this project by assisting with a two week waste stream assessment. Special appreciation is given to the following individuals for sharing information on the waste reduction activities for which they are responsible: Paul Orrin-Brown (store manager); Dave Blackburn (accountant); Liz Glynn (dairy); Reggie Gorham (produce); Mary Ann Guidotti (herbs and spices; health care); Jack Laurent (produce); Beth Lay bum (recycling); Geoff Kroeppel (bulk foods); Adrianne Neff (prepack items); and Loren Heider (office staff).
iii


Table of Contents
1. SUMMARY ................................................................................... ! 2. IN1RODUCTION ............................................................................ 2
THE PROBLEM OF NONHAZARDOUS SOLID WASTE IN THE FOOD RETAIL SECTOR ....................................................................... 2 WASTE REDUCTION IN FOOD RETAIL .......................................... 2 SELECTION OF PEOPLE'S FOOD COOPERATIVE'S PACKARD STORE .. 2 DESCRIPTION OF THE PACKARD CO-OP ....................................... 3 CONTENT AND ORGANIZATION .................................................. 3
3. DETAILED CASE STUDY BULK VS. PREPACKAGED GOODS ............................................... 4 PROCESS ANALYSIS ................................................................. 4
Methodology ..................................................................... 4 Results ............................................................................ 4
Eden Cold Pressed Olive Oil .......................................... 8 Nature's Gate Herbal Shampoo ...................................... 9 Eden or Spectrum Safflower Oil... ................................... 11
Discussion of Process Analysis ............................................... 11 COST ANALYSIS ....................................................................... 12
Methodology ..................................................................... 12 Results of Cost Analysis ....................................................... 13
Eden Cold Pressed Olive Oil .......................................... 13 Nature's Gate Herbal Shampoo ...................................... 13
Discussion of Cost Analysis ................................................... 14 4. ADDITIONAL WASTE REDUCTION ACTIVITIES ................................... 16
SUMMARYOFWASTEREDUCTION AUDIT .................................... 16 DESCRIPTION OF PRACTICES ..................................................... 18
Source Reduction ................................................................ 18 Bulk Dispensers ........................................................ 18 Food Gatherers Program .............................................. 18 Store Meals .............................................................. 19 Cloth Hand Towels .................................................... 19 Items Reused for Their Original Purpose ............................ 19
Milk Bottles .................................................... 19 Egg Cartons .................................................... 19 Plastic Crates ................................................... 19 Grocery Bags .................................................. 19 Reusable Consumer Containers for Bulk Products ....... 19 Reusable Bulk Containers for the Store .................... 19
Items Reused for a Different Purpose ................................ 19 Produce Crates ................................................. 20 Empty Bulk Food Containers ................................ 20
Recycling ......................................................................... 20 Compo sting ...................................................................... 20 Additional Waste Reduction Programs ....................................... 20
5. ORGANIZATIONAL AND MOTIVATIONAL ANALYSIS ........................... 21 ORIGIN AND IMPLEMENTATION OF WASTE REDUCTION ACTIVITIES .............................................................................. 21 BUYING POLICY ....................................................................... 21 SUMMARY OF ORGANIZATIONAL ASPECTS .................................. 22
lV

6. IMP ACT AND TRANSFERABILITY ..................................................... 22 IMPACT ON THE SOLID WASTE STREAM ....................................... 22 TRANSFERABILITY ................................................................... 23
Factors Enhancing Transfer of the Packard PFC's Waste Reduction Measures ......................................................................... 24 Impediments to Transfer of the Packard PFC's Waste Reduction
Measures ......................................................................... 24 7. CONCLUSIONS AND RECOMMENDATIONS ........................................ 25
CONCLUSIONS ......................................................................... 25 RECOMMENDATIONS ................................................................ 26
APPENDIX A ..................................................................................... A 1 APPENDIX B ..................................................................................... B 1
List of Figures
Figure 1. Material Flow Diagram for Bulk Items ............................................. 6 Figure 2. Material Flow Diagram for Prepackaged Items .................................... ? Figure 3. Costs of Selling Bulk and Prepack Olive Oil ...................................... 15 Figure 4. Costs of Selling Bulk and Prepack Shampoo ...................................... 15 Figure 5. Waste Reduction Methods at Packard People's Food Co-op .................... 18
List of Tables
Table 1. Process Analysis of Bulk and Prepackaged Olive Oil ............................. 8 Table 2. Process Analysis of Bulk and Prepackaged Shampoo ............................. 10 Table 3. Cost Analysis of Bulk And Prepackaged Olive Oil ................................ 13 Table 4. Cost Analysis of Bulk and Prepackaged Shampoo ................................ 14 Table 5. Waste Reduction Audit. ............................................................... 17
v
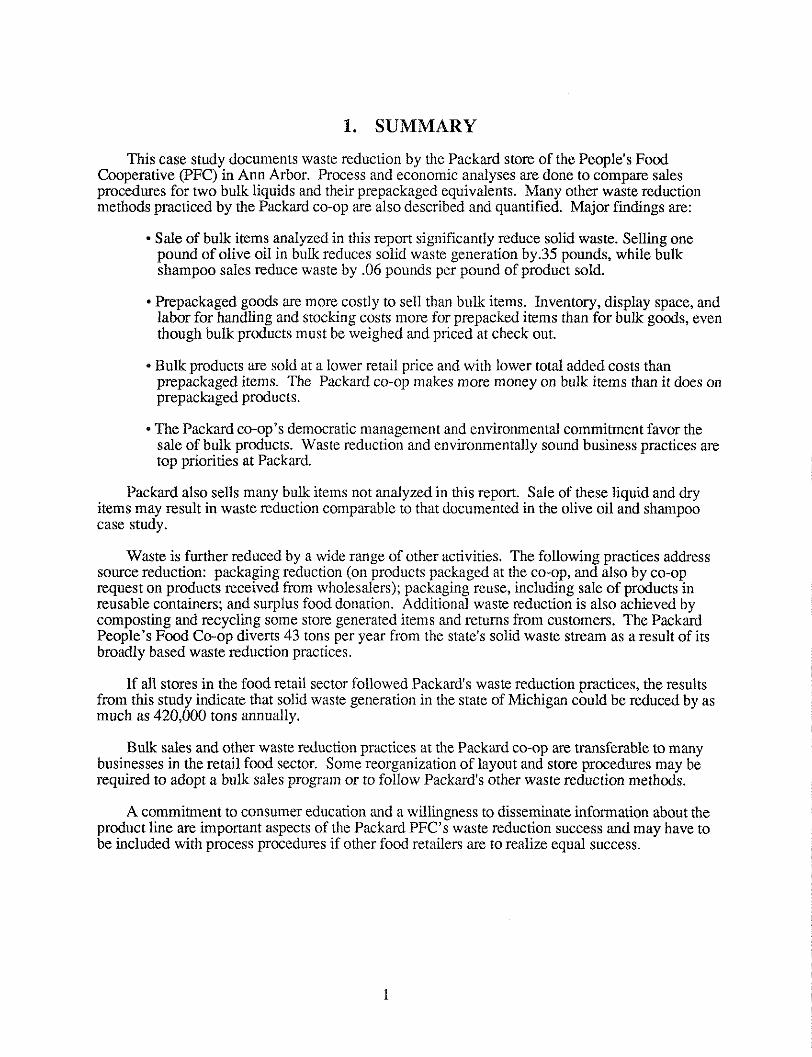
1. SUMMARY
This case study documents waste reduction by the Packard store of the People's Food Cooperative (PFC) in Ann Arbor. Process and economic analyses are done to compare sales procedures for two bulk liquids and their prepackaged equivalents. Many other waste reduction methods practiced by the Packard co-op are also described and quantified. Major findings are:
• Sale of bulk items analyzed in this report significantly reduce solid waste. Selling one pound of olive oil in bulk reduces solid waste generation by.35 pounds, while bulk shampoo sales reduce waste by .06 pounds per pound of product sold.
• Prepackaged goods are more costly to sell than bulk items. Inventory, display space, and labor for handling and stocking costs more for prepacked items than for bulk goods, even though bulk products must be weighed and priced at check out.
• Bulk products are sold at a lower retail price and with lower total added costs than prepackaged items. The Packard co-op makes more money on bulk items than it does on prepackaged products.
• The Packard co-op's democratic management and environmental commitment favor the sale of bulk products. Waste reduction and environmentally sound business practices are top priori ties at Packard.
Packard also sells many bulk items not analyzed in this report. Sale of these liquid and dry items may result in waste reduction comparable to that documented in the olive oil and shampoo case study.
Waste is further reduced by a wide range of other activities. The following practices address source reduction: packaging reduction (on products packaged at the co-op, and also by co-op request on products received from wholesalers); packaging reuse, including sale of products in reusable containers; and surplus food donation. Additional waste reduction is also achieved by composting and recycling some store generated items and returns from customers. The Packard People's Food Co-op diverts 43 tons per year from the state's solid waste stream as a result of its broadly based waste reduction practices.
If all stores in the food retail sector followed Packard's waste reduction practices, the results from this study indicate that solid waste generation in the state of Michigan could be reduced by as much as 420,000 tons annually.
Bulk sales and other waste reduction practices at the Packard co-op are transferable to many businesses in the retail food sector. Some reorganization of layout and store procedures may be required to adopt a bulk sales program or to follow Packard's other waste reduction methods.
A commitment to consumer education and a willingness to disseminate information about the product line are important aspects of the Packard PFC's waste reduction success and may have to be included with process procedures if other food retailers are to realize equal success.
1

2. INTRODUCTION
THE PROBLEM OF NONHAZARDOUS SOLID WASTE IN THE FOOD RETAIL SECTOR
The Bureau of Census reported 7385 food retail establishments in the State of Michigan for 1987, which includes supermarkets, warehouse stores, medium size grocers, and speciality grocers. A significant fraction of the products distributed through these stores, along with shipping containers and packaging, enter the nonhazardous solid waste stream. Waste stream constituents generated by a grocery store include containers made from corrugated board and other materials, spoiled produce, register receipts, office paper, and plastic wrap. Typical postconsumer wastes are discarded food and packaging made from plastic, glass, aluminum, steel, and paper. Packaging accounts for an estimated 30 percent of solid waste and is the major type of waste discarded by stores and consumers.
WASTE REDUCTION IN FOOD RET AIL
Food retailers can reduce waste discards by three methods: source reduction, com posting, and recycling. Source reduction includes the elimination or reduction of packaging waste through the sale of bulk food instead of prepackaged food, and the reuse of shipping containers and other packaging. Waste reduction requires not only the participation of store management and staff, but also the cooperation of farmers, bakers, food processors, shoppers, food wholesalers, recycling services, haulers, and others. The retailer is in a central position to facilitate waste reduction activities in the food distribution system. Retail stores can strongly influence the market through buying policies, pricing, product labeling, advertising, and consumer education.
SELECTION OF PEOPLE'S FOOD COOPERATIVE'S PACKARD STORE
The People's Food Cooperative (PFC) was selected as a model food retail store for several reasons: it successfully eliminates packaging from the solid waste stream through bulk merchandising and other waste reduction activities such as com posting and recycling, PFC's waste reduction practices are transferable to other stores, information was readily available and accessible, and a substantial amount of solid waste reduction can be achieved if other stores adopt these waste reduction practices. The Packard co-op is one of two stores operated in Ann Arbor by the PFC.
The Product Line Guidelines of the People's Food Cooperative reflect its commitment to waste reduction, the environment, and health:
"1) Top priority is given to natural foods, meaning products free of any artificial ingredients; 2) To further insure the quality of our foods, we look for: whole foods, those with a minimum of processing and refining; organic foods, those grown in accordance with accepted standards; and best value, items of the highest quality at the best price; and 3) Preference is given to products that are: locally produced, produced and/or distributed by cooperatives, produced with the least human, animal and environmental exploitation, and have minimal and ecologically-sound packaging."
2

DESCRIPTION OF THE PACKARD CO-OP
The People's Food Cooperative is a member-owned consumer cooperative in Ann Arbor, Michigan. It has been in continuous operation since 1971 and has operated two stores for over 15 years. The People's Food Cooperative is operated in a democratic fashion with an elected Board responding to the membership and directing the staff. The PFC has a total membership of 2400. Approximately 40% of its sales are to non-members.
The Packard store is located at 7 40 Packard A venue, near the University of Michigan campus. Staff at Packard consists of 6 full-time employees. Sales from mid 1989 to mid 1990 at the Packard PFC were $1,167,000. The People's Food Co-operative maintains a 30.1% sales margin (sales margins are (sales- cost of goods) I sales) for both stores. Its labor costs are approximately 18.0% of sales.
Consumer education, social responsibility, and environmental issues, in addition to nutrition and health matters, rank as important considerations in store policy at the Packard PFC.
CONTENT AND ORGANIZATION
Source reduction through bulk merchandising is the primary focus of a detailed case study. Other waste reduction practices at the Packard PFC are also described. This report contains the following main sections:
• A detailed case study consisting of process and economic analyses of merchandising two liquid bulk items and their prepackaged equivalents.
• Description of other successful waste reduction activities. • Discussion of organizational and motivational factors related to waste reduction practices. • Discussion of the transferability of documented waste reduction activities and the
potential impact on the waste stream if they are adopted by other firms throughout Michigan.
• Conclusions and recommendations.
Although this case study report presents several successful waste reduction practices, it is not presented as a comprehensive guide to waste reduction for the food retail sector. In addition to this report, there are several other resources at the state (Office of Waste Reduction Service- Michigan Departments of Natural Resources and Commerce) and federal (U.S. Environmental Protection Agency) levels that are available to assist firms in identifying opportunities and strategies for waste reduction.!
1Manual for Waste Minimization Opportunity Assessments; U.S. EPA Hazardous Waste Emergency Research Lab, Aprill988 (EPA/600/2-88-025); and
Waste Minimization Manual; Developed by University of Michigan School of Natural Resources for U.S. EPA; Draft, July 1990.
3
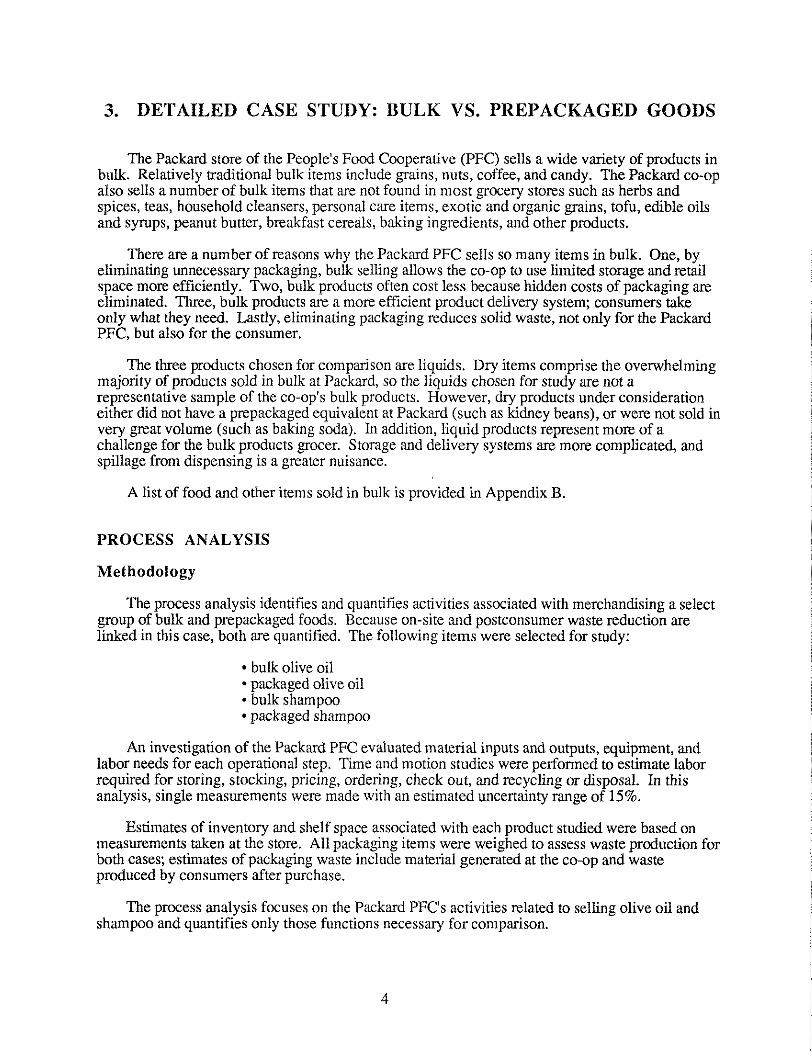
3. DETAILED CASE STUDY: BULK VS. PREPACKAGED GOODS
The Packard store of the People's Food Cooperative (PFC) sells a wide variety of products in bulk. Relatively traditional bulk items include grains, nuts, coffee, and candy. The Packard co-op also sells a number of bulk items that are not found in most grocery stores such as herbs and spices, teas, household cleansers, personal care items, exotic and organic grains, tofu, edible oils and syrups, peanut butter, breakfast cereals, baking ingredients, and other products.
There are a number of reasons why the Packard PFC sells so many items in bulk. One, by eliminating unnecessary packaging, bulk selling allows the co-op to use limited storage and retail space more efficiently. Two, bulk products often cost less because hidden costs of packaging are eliminated. Three, bulk products are a more efficient product delivery system; consumers take only what they need. Lastly, eliminating packaging reduces solid waste, not only for the Packard PFC, but also for the consumer.
The three products chosen for comparison are liquids. Dry items comprise the overwhelming majority of products sold in bulk at Packard, so the liquids chosen for study are not a representative sample of the co-op's bulk products. However, dry products under consideration either did not have a prepackaged equivalent at Packard (such as kidney beans), or were not sold in very great volume (such as baking soda). In addition, liquid products represent more of a challenge for the bulk products grocer. Storage and delivery systems are more complicated, and spillage from dispensing is a greater nuisance.
A list of food and other items sold in bulk is provided in Appendix B.
PROCESS ANALYSIS
Methodology
The process analysis identifies and quantifies activities associated with merchandising a select group of bulk and prepackaged foods. Because on-site and postconsumer waste reduction are linked in this case, both are quantified. The following items were selected for study:
• bulk olive oil • packaged olive oil • bulk shampoo • packaged shampoo
An investigation of the Packard PFC evaluated material inputs and outputs, equipment, and labor needs for each operational step. Time and motion studies were performed to estimate labor required for storing, stocking, pricing, ordering, check out, and recycling or disposal. In this analysis, single measurements were made with an estimated uncertainty range of 15%.
Estimates of inventory and shelf space associated with each product studied were based on measurements taken at the store. All packaging items were weighed to assess waste production for both cases; estimates of packaging waste include material generated at the co--op and waste produced by consumers after purchase.
The process analysis focuses on the Packard PFC's activities related to selling olive oil and shampoo and quantifies only those functions necessary for comparison.
4

Results
Flow diagrams in a process analysis help to categorize the various steps in the process. Figure 1 shows the material flows for prepacked items. Activities not performed by the Packard PFC, such as packaging disposal, are represented by smaller boxes and are shown outside the dashed line. After prepacked items are received, they are transferred to a storage area.
An inventory of prepacked items is taken once a day and restocking is done as needed. Merchandise taken from storage is priced and shelved. Empty shipping containers, primarily corrugated cardboard boxes, are either recycled, reused, or disposed in a landfill. The Packard PFC reuses as many shipping containers as possible. After prepacked items are purchased, product packaging, which in conjunction with wholesale packaging accounts for an estimated 30% of total municipal solid waste, is also reused, recycled, or discarded by customers.
Figure 2 shows material flows for bulk items. The Packard PFC places bulk items in storage after they are delivered. When bulk dispensing containers are nearly empty, they are refilled. Bulk shipping containers (e.g. kraft paper sacks, plastic tubs, crates, boxes) are reused or recycled by the co-op or by shoppers when feasible, but in some instances containers are discarded. As in Figure 1, activities performed by the co-op are placed inside the dashed line, and external activities are depicted outside the dashed line.
Shoppers must weigh new or reused containers before filling them with bulk products. This activity generally applies only to liquids, because dry bulk items are typically purchased in bags that contribute little to total weight and are thus included in final calculations of price. At check out, bulk purchases are weighed and the weight of containers other than lightweight bags is subtracted to arrive at merchandise weight. Most bulk items have a price code which expedites pricing. After products are consumed, containers are washed and reused; recycled, particularly if broken; or discarded in landfills.
The process of selling prepacked goods requires more input from the co-op than selling bulk items, although the flow diagram for prepack appears simpler. Production, processing, and wholesaling steps for prepack are also more resource intensive and can be more complex than those required for bulk, despite the reduced external activity suggested by the flow charts.
5

0\
~------------------------
Production, Processing, and
Wholesale Distribution 1
of Food and Non-Food Items I
Order Receive/Store
Co-op Internal Activities
Price Items Stock Check Out
1,-------.., I ; ·1,..--------,1 ·I I ·I 1-----~ shipping container
Reuse
-----------------~
Landfill
Figure 1. Material Flow Diagram for Prepacked Products Through People's Food Co-op
-I
I External Activities
Consume
primary packaging

....,
1-Co-op Internal Activities
Production, Processing, and I
Wholesale Distribution Order Receive/Store Stock
of Foo~t=~~ Non-Food : I I I I I I ~~- · ~- ------+
I I !
surplus food I I bulk packaging ,----
-~-------------
. I new conta.mer
I
Check Out
hot water detergent
Figure 2. Material Flow Diagram for Bulk Products Through People's Food Co-op
External Activities
Measure Container Tare Weight
Fill Container used container

Eden Cold Pressed Olive Oil
Process analysis data for olive oil sales are summarized in Table 1. A complete collection of the data is in Table AI, in Appendix A.
Table 1. Process Analysis of Bulk and Prepackaged Olive Oil
1 Unit being measured 2 Number of Units per Quarter 3 Weight of Product (lbs.) 4 Weight of Packaging (lbs.)t 5 Volume of Product (fl, oz.'s) 6 Volume of Shipping Container (cu. in.) 7 Cu. In. Shipping Container/Pint Product 8 Shipping Container Recycle Rate 9 Consumer Packaging Recycle Rate, Case 1
10 Consumer Packaging Recycle Rate, Case 2 11 Average No. Trips of Consumer Bulk
Container 12 Gross Lbs. Packaging/Lb. Product 13 Post Consumer Lbs. Pckg./Lb. Product 14 Net Lbs. Packaging/Lb. Product, Case 1 15 Net Lbs. Packaging/Lb. Product, Case 2
Bulk Olive Oil Pckg. Olive Oil
"cubi-tainer" 4
37.6 lb. 2.8 lb.
640. oz. 1,730. in.3 43.3 in.3
0% 15% 50% 5.0
0.07 lb. 0.12 lb. 0.17 lb. 0.13 lb.
case of 12 5
11.3 lb. 7.5 lb.
192. oz. 840. in.3 70.0 in.3
67% 15% 50% n/a
0.66 lb. 0.58 lb. 0.52 lb. 0.32 lb.
t includes shipping container and product packaging
Bulk olive oil is received in a five gallon, 12" corrugated cardboard cube with a plastic liner called a "cubi-tainer". The cubi-tainer also serves as a dispenser for the oil after a reusable spigot is attached to the pour hole by staff at Packard. The cubi-tainer is neither reusable nor recyclable. Five gallons of olive oil weigh about 37.6 pounds, while the container weighs 2.8 pounds which includes a negligible amount of undrained oil. The shipping container thus weighs 0.073 pounds per pound of product.
Bottles used by the bulk customers eventually enter the waste stream. For this analysis, it is assumed that each customer-provided bottle has a 1 pint capacity and holds about one pound of oil. It is further assumed that each bottle makes an average of five trips before it is discarded or recycled.
The Glass Packaging Institute estimates that 20-30% of all glass containers used in the United States are recycled. 2 A Franklin Resources study states that 10% of all glass containers will be recycled by the end of 1990.3 Allen, et. al. found that communities with comprehensive recycling
2 Chaz Miller. Glass Packaging Institute, personal communication. May 1990. 3 Franklin Associates. Characterization of Municipal Solid Waste in the Unites States
1960-2000, U.S. E.P.A. Office of Solid Waste and Emergency Response (WH-565E) Update, April 1988.
8

programs (e.g. mandatory curbside pickup, collected weekly) can achieve a 50% recycling rate.4 Individual items are difficult to isolate from more general data, but it appears that a roughly proportional recovery rate is achieved for specific materials.
In Ann Arbor, the Washtenaw County Solid Waste Management Plan envisions recycling rates for packaging materials of between 25% and 60% in the next five years, with continual increases thereafter. 5
To address the changing nature of recycling, two different scenarios for packaging recycling are included in Table 1. Case 1, on line 9 and 14 of Table 1, conservatively assumes a 15% recycling rate for glass olive oil bottles. The actual recycling rate in Ann Arbor may already exceed this figure. Case 2, on line 10 and 15 of Table 1, assumes a 50% glass recycling rate. The study by Allen, et. a!. and Washtenaw County's Solid Waste Management Plan suggest that a 50% glass container recycling rate is achievable, particularly in communities with comprehensive recycling ordinances such as Ann Arbor.
Under the conditions stated for Case 1, bulk olive oil generates 0.17 pounds (shipping container plus prorated bottle weight) of solid waste per pound of oil sold.
Eden Olive Oil is also available in pint glass jars. A unit quantity is a case of 12 jars packaged in a corrugated container with paperboard slats between the individual bottles . A case contains 11.3 pounds of oil and 7.5 pounds of packaging. Glass jars account for the majority of packaging weight. Most of the packaging materials, including the box and glass bottles, are recyclable if not reused. However, 33% by weight of the shipping container is paperboard slats that are not collected by Recycle Ann Arbor. The reuse/recycling rate for the box at the co-op is about 100%. Under Case 1 conditions, net packaging waste generated by prepack olive oil sales is 0.52 pounds per pound of oil sold.
The net packaging waste generated by olive oil sales was calculated a second time. Case 2 in the table assumes a recycling rate of 50 % for both customer and prepack glass bottles. Under these conditions, the sale of bulk oil would generate 0.13 pounds of waste per pound of product sold; the sale of prepacked oil would generate 0.32 pounds.
Nature's Gate Herbal Shampoo
Table 2 contains process analysis results for shampoo sales. Comprehensive data are in Table A2, in Appendix A.
Both the bulk and prepackaged forms of Nature's Gate Herbal Shampoo are shipped to the Packard PFC in high-density polyethylene (HDPE) bottles, multi-packed in corrugated containers without slats. Prepackaged bottles differ from bulk bottles only in size. Bulk shampoo is packed in a case of four !-gallon containers, while prepackaged shampoo is packed in a case of one dozen 18-fluid ounce containers.
4 Allen, Theresa; Platt, Brenda; Morris, David. Beyond 25%-Material Recovery Comes of Age. Institute for Local Self Reliance, 1989.
5 Washtenaw County Solid Waste Management Plan, Update June 1990.
9

Table 2. Process Analysis of Bulk and Prepackaged Shampoo
1 Unit being measured 2 Number of Units per Quarter 3 Weight of Product (lbs.) 4 Weight of Packaging (lbs.)t 5 Volume of Product (fl. oz.'s) 6 Volume of Shipping Container (cu. in.) 7 Cu. In. Shipping Container/Pint Product 8 Shipping Container Recycle Rate 9 Consumer Packaging Recycle Rate, Case 1
10 Consumer Packaging Recycle Rate, Case 2 11 Average No. Trips of Consumer Bulk
Container 12 Gross Lbs. Packaging/Lb. Product 13 Post Consumer Lbs. Pckg./Lb. Product 14 Net Lbs. Packaging/Lb. Product, Case 1 15 Net Lbs. Packaging/Lb. Product, Case 2
Bulk Shampoo
gallon 4-pack 6
34.9 lb. 2.4 lb.
512. oz. 1,950. in.3 60.9 in.3
100% 0%
50% 5.0
0.070 lb. 0.014 lb. 0.014 lb. 0.007 lb.
t includes shipping container and product packaging
Pckg. Shampoo case of 12
3 14.8 lb. 1.7 lb.
216. oz. 1,040. in.3 77.0 in.3
100% 0%
50% n/a
0.114 lb. 0.072lb. 0.072 lb. 0.036lb.
Clear HDPE bulk bottles are now recycled by the Packard PFC, as are the corrugated containers used for shipping both types of shampoo. Plastic recycling is currently difficult and not well-established at the residentiallevel.6 Factors such as resin incompatibility and the very large volume to weight ratio of plastic will provide a continuing challenge to recyclers.? A Franklin Associates (1988) study states that only 2.4% of all plastic containers will be recycled by the end of 1990.
Two different scenarios are presented in Table 2 to address the uncertainties of plastic container recycling. In Case 1 on line 9, table 2, zero percent postconsumer recycling is assumed. The trippage rate of bottles used for bulk purchases is assumed to be five trips. The previously cited studies suggest that a 50% consumer recycling rate for HDPE containers will not be achieved soon, but Case 2 in Table 2 is presented as the most optimistic recycling rate foreseeable in the relatively near term future.
Bulk shampoo is delivered with 2.4 pounds of packaging for 34.9 pounds of product; in the prepacked case, 1.7 pounds of packaging is used for 14.8 pounds of shampoo. Both shampoos are shipped in recyclable corrugated containers so net packaging weights are dramatically lower than in the olive oil analysis outlined in Table 1. Packaging to product ratios are 1.4% for bulk and 7.2% for prepack shampoos.
Under Case 2 conditions, the net weight of waste generated by bulk sales is less than 1% of the weight of the shampoo; solid waste generated by prepackaged sales is 3.5% of the weight of the product.
6 Watson, Tom. Mixed Rigid Plastic Containers, Resources Recycling, 1990. 9 (5) p 22.
7 Lamb, Jennifer. Plastics Collection. Biocycle, April 1990.
10

Eden or Spectrum Safflower Oil
The process of selling bulk safflower oil at Packard was not analyzed in detail, but is included in this section as an example of a different liquid bulk dispensing method. Rather than receiving safflower oil in a packaged container, five gallon cans are taken to the local cooperative food warehouse and filled from a 55 gallon drum. Thus, from the perspective of the Packard PFC, there is virtually no waste; containers can be reused many times.
The safflower oil delivery system within the co-op is similar to a carbonated soft drink delivery system. Safflower and three other types of oil are stored in a dispensing apparatus located beneath the display area. Although there have been some problems with various components, a well maintained and regularly cleaned pressurized nitrogen gas system can conveniently pump oils upstairs while stocks remain in inventory.
Discussion of Process Analysis
At an assumed recycling rate of 15% for glass bottles, net reduction in solid waste generation through bulk sale of olive oil is 0.35 pounds per pound of oil sold.
Waste generated by one pound prepack oil: Waste generated by one pound bulk oil: Net reduction in solid waste:
0.52lb 0.17 lb 0.35 lb
If a 50% recycling rate for glass bottles can be achieved, then the net reduction would be 0.19 pounds. Recycling clearly reduces solid waste generation, but recycling still requires material handling and transportation. Furthermore, recycling cannot proceed without markets, which can become saturated. Collecting, processing, and transporting secondary materials for recycling also produces environmental impacts. Source reduction therefore appears to be the best method for achieving overall solid waste reduction.
Bulk shampoo sales do not lower waste generation as dramatically; only about 0.06 pounds per pound of product. Nevertheless, lightweight plastic shampoo bottles occupy disproportional volume in landfills.
Prepacked items require more labor to sell. Stocking labor in this category outweighs the increased check out labor for bulk items. Much of the labor input necessary to purchase bulk items is provided by customers. This benefits the store, but may be viewed as an impediment by some shoppers.
Bulk items occupy less display space per unit volume than prepack items, an advantage to any store considering a bulk sales program. However, shelves, bins, and other display areas for bulk items may require more frequent cleaning than similar display areas for prepack items due to spillage and other activities associated with individual dispensing. Cleaning and maintenance of display areas was not quantified for either case in this report.
11

COST ANALYSIS
Methodology
Factors contributing to Packard's cost of selling olive oil and shampoo are identified and discussed. Costs included in this analysis are restricted to internal business costs of the Packard PFC. No external costs, such as those incurred by the customer or manufacturer, are considered.
Added costs are costs incurred by Packard after wholesale purchase. Not all added costs are quantified and discussed here; only those added costs necessary for a comparative evaluation of bulk and prepacked sales are analyzed. Thus, subtracting wholesale and added costs from the retail price does not provide an accurate estimate of margins for the analyzed items.
Labor costs included in this study are calculated from a single set of time/motion estimates made in the process analysis. Labor includes ordering, storing, stocking, check out, and recycling or disposal. Labor costs were derived by multiplying labor requirements by wages, benefits, and payroll taxes associated with each unit of labor. All full-time staff members of the Packard PFC receive health benefits and paid vacation time.
Display and inventory costs were based on area measurements compiled in the process analysis and assigned proportional value based on rent.
The Packard PFC sells bulk merchandise by weight, but most prepackaged items are sold by volume. Storage and shelf costs are also determined mainly by volume. In the following tables and discussions, costs and prices are generally reported by weight.
The following cost categories are analyzed:
Wholesale Cost The average wholesale cost of each product is calculated from invoices of the last complete fiscal quarter (April, May, and June 1990) before the study was conducted.
Ordering Ordering products from distributors takes a certain amount of time per unit of product per quarter. One minute per unit is assumed for each order placed. This time includes checking the products on the shelf, checking the inventory shelves, and placing the order on the telephone. Ordering labor cost per unit is derived by multiplying ordering time by the hourly wage.
Storage Total storage costs for bulk and prepackaged products include the labor involved in carrying the products to storage and the inventory space occupied.
Stocking Stocking costs include the labor time required for moving products up from the storage area and putting them on shelves, the frequency of stocking, labor needed to break down the associated packaging and place it in the appropriate location (recycling area or dumpster), and the cost of the shelf space required for each product. Time required for a daily inventory of bulk and prepackaged items is not included in this study.
Recycling and Disposal Residual materials associated with each product are either recycled or discarded. The cost of these activities is measured in terms of labor time, recycling costs, and municipal waste disposal costs (determined by the weight of the material).
12
Results of Cost Analysis
Eden Cold Pressed Olive Oil
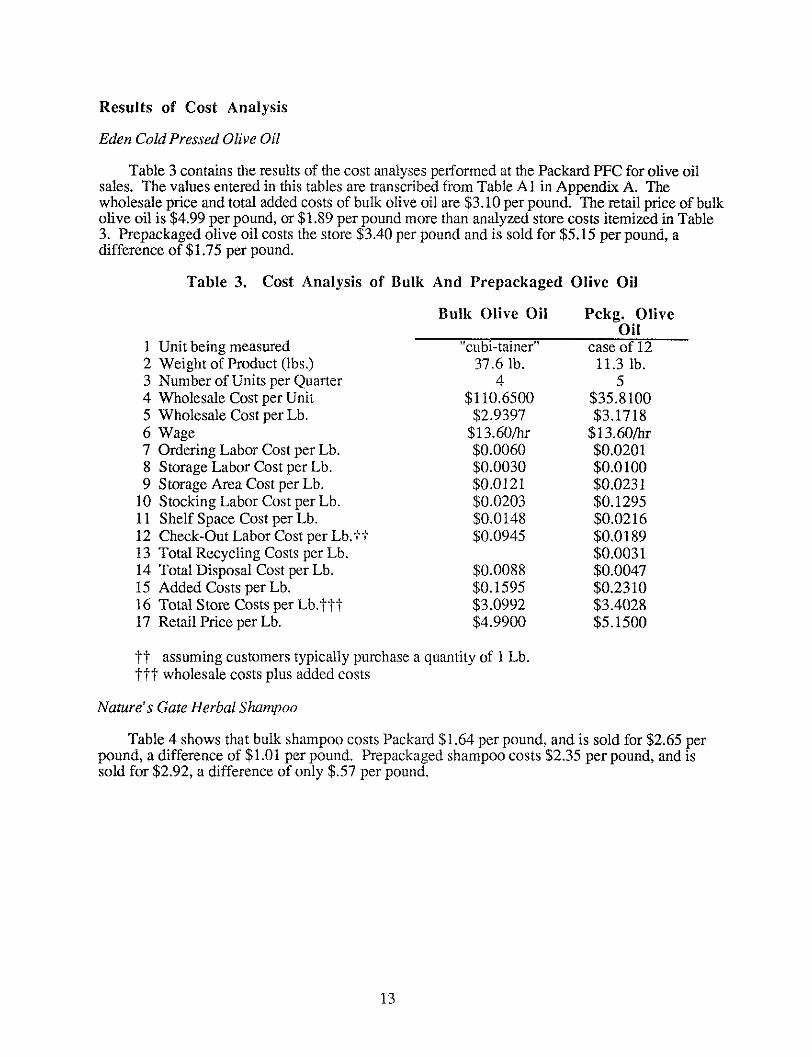
Table 3 contains the results of the cost analyses performed at the Packard PFC for olive oil sales. The values entered in this tables are transcribed from Table A 1 in Appendix A. The wholesale price and total added costs of bulk olive oil are $3.10 per pound. The retail price of bulk olive oil is $4.99 per pound, or $1.89 per pound more than analyzed store costs itemized in Table 3. Prepackaged olive oil costs the store $3.40 per pound and is sold for $5.15 per pound, a difference of $1.75 per pound.
Table 3. Cost Analysis of Bulk And Prepackaged Olive Oil
1 Unit being measured 2 Weight of Product (lbs.) 3 Number of Units per Quarter 4 Wholesale Cost per Unit 5 Wholesale Cost per Lb. 6 Wage 7 Ordering Labor Cost per Lb. 8 Storage Labor Cost per Lb. 9 Storage Area Cost per Lb.
10 Stocking Labor Cost per Lb. 11 Shelf Space Cost per Lb. 12 Check-Out Labor Cost per Lb.tt 13 Total Recycling Costs per Lb. 14 Total Disposal Cost per Lb. 15 Added Costs per Lb. 16 Total Store Costs per Lb. tH 17 Retail Price per Lb.
Bulk Olive Oil
l'cub1-tainer" 37.6 lb.
4 $110.6500
$2.9397 $13.60/hr $0.0060 $0.0030 $0.0121 $0.0203 $0.0148 $0.0945
$0.0088 $0.1595 $3.0992 $4.9900
i"t assuming customers typically purchase a quantity of 1 Lb. ttt wholesale costs plus added costs
Nature's Gate Herbal Shampoo
Pckg. Olive Oil
case of 12 11.3 lb.
5 $35.8100 $3.1718
$13.60/hr $0.0201 $0.0100 $0.0231 $0.1295 $0.0216 $0.0189 $0.0031 $0.0047 $0.2310 $3.4028 $5.1500
Table 4 shows that bulk shampoo costs Packard $1.64 per pound, and is sold for $2.65 per pound, a difference of $1.01 per pound. Prepackaged shampoo costs $2.35 per pound, and is sold for $2.92, a difference of only $.57 per pound.
13

Table 4. Cost Analysis of Bulk and Prepackaged Shampoo
1 Unit being measured 2 Weight of Product (lbs.) 3 Number of Units per Quarter 4 Wholesale Cost perU nit 5 Wholesale Cost per Lb. 6 Wage 7 Ordering Labor Cost per Lb. 8 Storage Labor Cost per Lb. 9 Storage Area Cost per Lb.
10 Stocking Labor Cost per Lb. 11 Shelf Space Cost per Lb. 12 Check-Out Labor Cost per Lb.tt 13 Total Recycling Costs per Lb. 14 Total Disposal Cost per Lb. 15 Added Costs per Lb. 16 Total Store Costs per Lb.ttt 17 Retail Price per Lb.
Bulk Shampoo
gallon 4-pack 34.9 lb.
6 $50.4800 $1.4456
$13.60/hr $0.0065 $0.0054 $0.0101 $0.0684 $0.0028 $0.0945 $0.0070
$0.1946 $1.6402 $2.6500
tt assuming customers typically purchase a quantity of 1 Lb. ttt wholesale costs plus added costs
Discussion of Cost Analysis
Pckg. Shampoo case of 12
14.8 lb. 3
$31.6800 $2.1474
$13.60/hr $0.0154 $0.0065 $0.0429 $0.0960 $0.0158 $0.0189 $0.0025
$0.1979 $2.3452 $2.9200
A review of the data in Tables 3 and 4 reveals that the added costs analyzed in this study of the two bulk products are less than the added costs of the corresponding prepackaged products. The total calculated cost of selling a pound of bulk oil is about $0.30 less than a pound of bottled oil. The total calculated cost of selling a pound of bulk shampoo is about $0.70 less than bottled shampoo. This allows the store to sell bulk products at a lower price and at a greater profit margin than equivalent, prepackaged items.
The lower wholesale cost of bulk merchandise is the main reason for the cost difference between bulk and prepack products. Figures 3 and 4 show costs for olive oil and shampoo at Packard. Estimated margins in the figures are the result of subtracting wholesale and added costs from the retail price. Because all added costs are not quantified in this analysis, actual margins will be significantly less than these figures suggest. Costs not included in this analysis (e.g., overhead costs, floor cleaning, and light bulbs) are a significant portion of total store costs. Nevertheless, it is assumed that they would be assigned equally to bulk and packaged products. Therefore, the results of a more comprehensive cost analyses would not be qualitatively different. Labor for daily inventories is also not evaluated here; prepackaged products are likely to require more frequent shelf inventories and thus be more costly to sell.
The substantial savings Packard realizes by purchasing bulk olive oil and shampoo allow substantially greater margins while preserving the retail cost advantage of these bulk products.
14

c 0
s t
c
Cost Per Pound of Bulk and Prepack Olive Oil
$6.00 $4.99 $5.15
$5.00
$4.00 $2.94 $3.17
$3.00
$2.00
$1.00 $0.16 $0.23
$0.00
wholesale retail margin
Category
Bulk • 0 Prepack
Figure 3. Costs of Selling Bulk and Prepack Olive Oil margin= retail- (added+ wholesale) Actual margins are much less because not all added costs are quantified.
Cost Per Pound of Bulk and Prepackaged Shampoo
$3.00
$2.50 $2.15
0 $2.00
s $1.50
t $1.00
$0.50
$0.00 wholesale
$0.19 $0.20
retail margin
Category
Bulk • 0 Prepack
Figure 4. Costs of Selling Bulk and Prepack Shampoo margin= retail- (added+ wholesale) Actual margins are much less because not all added costs are quantified.
15

Bulk goods require lower total added costs because they generally occupy less storage and shelf space, and require less stocking labor. On the other hand, extra labor required to weigh and price bulk items at check out adds about ten cents per pound to the product cost.
4. ADDITIONAL WASTE REDUCTION ACTIVITIES
The Packard PFC employs numerous measures to reduce the amount of solid waste generated at its store. Containers and packaging are reused, other materials are recycled, and virtually no food waste is discarded.
Co-op staff do not want to contribute anything to the waste stream if at all possible. As a result, the Packard PFC has instituted a comprehensive program of waste reduction.
SUMMARY OF WASTE REDUCTION AUDIT
An audit of various waste reduction activities was made during a two week period in July 1990. The results are extrapolated to estimate an annual reduction in municipal solid waste.
Data from the audit are entered in Table 5. Estimates of waste reduction are based entirely on in-store activities; no postconsumer waste reduction is included. Because Packard acts as a conduit for much potential waste, bulk merchandising may make a substantial additional contribution to overall waste reduction.
Packard diverts 86% of waste generated at the co-op from landf1lls, or about 43 tons of material annually.
16

Table 5. Waste Reduction Audit Two weeks:
SOURCE REDUCTION Glass Milk Bottles Egg Cartons Edible Surplus Produce and Food Reused Grocery Bags Prepack Plastic Boxes Other Reused Boxes and Containers
SUBTOTAL
COMPOSTING Compostable Surplus Produce
RECYCLING Aluminum Deposit Cans PET Plastic Deposit Bottles Clear Glass Deposit Bottles Amber Glass Deposit Bottles Green Glass Deposit Bottles Clear HDPE Plastic Tin-plate Containers Unlined Grain Bags Corrugated Cardboard Newsprint Wrapping Material White Ledger Paper
SUBTOTAL
REFUSE Mixed Store Refuse Non-Recyclable Boxes & Crates Rotten Produce
SUBTOTAL TOTAL MATERIALS
Waste Reduction Rate
Recycling and Composting Only Rate Waste Reduction Rate w/o OCC
t extrapolation based on annual sales
17
July 16- 30
(Pounds) 21.8 28.8
815.8 784.0
4.8 129.9
1785.1
501.8
74.0 47.7 31.0 4.5 2.5 1.7 2.0
46.5 793.0
14.5 5.0
1524.2
321.5 157.2 67.5
546.2 3855.5
85.8%
39.5% 65.3%
Straight extrapolation to one yeart
(Pounds) 568 749
21,258 20,429
125 3,385
46,515
13,076
1,928 1,244
808 117 65 44 52
1,211 20,664
378 130
39,718
8,378 4,096 1,759
14,233 100,466
85.8%
39.5% 65.3%

DESCRIPTION OF PRACTICES
Waste management practices of the Packard PFC are divided into four categories:
1. Source reduction, including reuse 2. Recycling 3. Composting 4. Refuse discards
Figure 5. illustrates how each component of waste reduction contributes to Packard PFC's success in diverting 85.6% percent of all the waste produced at the store from landiills.
Source
Reduction
46.30%
Figure 5. Waste Reduction Methods at Packard People's Food Co-op
This graph clearly illustrates the importance of source reduction in the overall waste reduction program at Packard. Composting also makes a significant contribution to waste reduction, accounting for nearly as much total weight as all material discarded by the co-op. The following sections discuss each waste reduction category in more detail.
Source Reduction
Bulk Dispensers
Bulk merchandising substantially reduces packaging and thus avoids many of the additional steps necessary to process recovered materials. A detailed comparison of bulk and prepackaged merchandising is presented in section 3.
Food Gatherers Program Waste reduction per year- 21,300 pounds
Old or damaged produce that is not fit for sale but is still fit for consumption is placed in a "10¢ Bin" near the check-out counter. Significantly more produce is given away to the Food Gatherers program, a local service that picks up surplus produce and other foods and delivers these materials to homeless shelters and similar programs. An estimated 21,300 pounds of food from the Packard PFC are delivered to those in need annually rather than discarded in a landfill.
18

Store Meals
Staff members frequently use produce that cannot be sold, but is still wholesome, for in-store meals. Outdated bakery products, expired dairy items, and food in damaged containers are also consumed by the staff whenever possible rather than discarded.
Cloth Hand Towels
Packard uses two rolled, washable cloth hand towels instead of paper towels. Cloth rags are kept handy for various clean-up jobs.
Items Reused for Their Original Purpose
Milk Bottles Waste reduction per year - 570 pounds Packard PFC is one of few grocers still selling milk in reusable glass containers. A local dairy supplies several types of milk in one-quart and two-quart containers. A 50¢ deposit is charged for each container. By purchasing milk in glass bottles, customers divert about 568 pounds of paperboard and plastic containers from the solid waste stream annually.
E!,C!.( Cartons Waste reduction per year- 750 pounds Customers return egg cartons for reuse by poultry farms. An estimated 467 pounds of egg cartons (25 lbs EPS, 442lbs paper) and 283 pounds of corrugated containers are collected annually at Packard and returned to farmers. Egg cartons are returned in the same delivery trucks that bring the eggs to the co-op, so no additional energy inputs are necessary for this reuse system. No deposit is charged for egg cartons nor is a discount given for those who bring back cartons.
Plastic Crates Waste reduction per year- 125 pounds Some deliveries come in reusable plastic crates or boxes instead of corrugated containers. The Packard PFC's food suppliers will also pack and deliver items that are "repacks" of less than a case in a plastic box. The boxes, which are either foldable or stackable, measure approximately 9" by 21 n by 15" tall.
Grocery Bags Waste reduction per year- 20,430 pounds The Packard PFC rarely, if ever, needs to purchase large paper or plastic grocery bags. Many customers return paper grocery bags from either the co-op or other grocery stores. By selecting used rather than new bags, customers divert about 20,430 pounds of material from the municipal solid waste stream per year. Recycle Ann Arbor, Ann Arbor's non-profit recycling service, also donates paper bags to the co-op that have been used to bundle newspapers for recycling. Seven grocery bags weigh about one pound.
Reusable Consumer Containers for Bulk Products "Save the Earth's Resources. Use This Container Again and Again" is emblazoned on the top of pint-size reusable plastic tubs the Packard PFC sells for 25¢ each. The price for tubs is high to encourage their reuse. Packard makes a donation to the Ann Arbor Ecology Center for each container sold. Many customers bring their own containers in sizes and styles suiting their needs. PFC shoppers can purchase dry bulk products in paper bags which are provided at no cost.
Reusable Bulk Containers for the Store Waste reduction per year - 3,380 pounds Waxed (actually plastic coated) corrugated containers, some other corrugated containers made of low quality fibers, and various wooden crates are returned to local farmers for repeated reuse. Amish farmers in Indiana pack all their produce for the Packard PFC in reused containers, as do a number of local growers.
19

Items Reused for a Different Purpose
Produce Crates Some fruit and vegetable crates are made from waxed corrugated cardboard, wood, or wood and corrugated cardboard. None of these are easily recyclable. Excess boxes that are not reused by farmers or the co-op are placed in a designated area and offered to the public at no charge. When boxes accumulate, they are discarded.
Empty Bulk Food Containers Heavy duty five gallon plastic buckets with lids may cost $5.00 or more new, so Packard sells them for $1.00 each. Large metal syrup containers are offered to the public periodically. They have proven to be a popular item, thus removing them from the co-op's waste stream. People sometimes take large grain bags for reuse. Plastic bags used for bulk tortilla chip shipments are reused as refuse bags.
Recycling Waste reduction per year- 39,700 pounds
The Packard People's Food Co-op recycles a large variety of materials. Old corrugated containers (OCC) are flattened and saved for recycling. Many products are packaged in cardboard boxes, so OCC is the most prevelant material recycled at Packard. OCC recycling is now a common practice for most food retailers. Large kraft paper food bags such as 20 pound grain sacks are also recycled
Most suppliers have stopped sending products packed in expanded polystyrene "peanuts". Instead of plastic peanuts, suppliers now pack fragile products in shredded newsprint that is recycled at Packard with old newspapers.
Other materials recycled at Packard include: ledger paper; glass, plastic, and aluminum beverage containers (broken containers or nonretumables are recycled; ail others are returned to the distributor in accordance with deposit procedures); tin-plated steel containers; and clear highdensity polyethylene (HDPE) containers.
Com posting Waste Reduction per year - 13,000 pounds
Produce trimmings and other items not fit for consumption are offered to farmers and gardeners for their compost piles. Some produce in this category is not picked up and must be discarded.
Additional Waste Reduction Programs
Use of items with recycled content is necessary to provide markets for collected material. Although not technically a waste reduction activity, without sufficient demand, recycling programs will not be sustainable. The Packard PFC sells toilet tissue, facial tissue, and paper towels that contain recycled material. Other products such as boxed cereals and grains are packaged in recycled paperboard.
20

5. ORGANIZATIONAL AND MOTIVATIONAL ANALYSIS
The Packard PFC's array of waste reduction activities is based on its philosophical commitment to environmentally friendly business practices and shaped by its small, democratically managed organization.
ORIGIN AND IMPLEMENTATION OF WASTE REDUCTION ACTIVITIES
Ideas for waste reduction arise as suggestions from shoppers, members, or staff. Ideas are discussed by the full-time staff during its biweekly meetings. If an idea is accepted, staff members develop and plan its implementation.
A recent example of this process is the decision to recycle plastic. A staff member reported that the local recycling center would now accept plastic. The staff agreed to collect and recycle plastic generated by the store and also accept customer returns of plastic containers sold by the coop on a trial basis.
Once a plan has been adopted, the staff member responsible for its implementation generally has freedom to make minor changes when necessary. If a significant concern arises, the issue is discussed informally among staff or is returned to the staff meeting for further discussion.
Some waste reduction measures encounter impediments that can be facilitated by continued discussion. As an example, Packard staff decided not to purchase frozen chicken packaged on expanded polystyrene trays. However, frozen chicken packaged on foam was subsequently delivered, so staff decided to accept the shipment then call the supplier and explain their position. Discussion of this issue at the next meeting resulted in the following decision: if chicken appeared on expanded polystyrene a second time within 3-4 months, it would be rejected and the supplier reminded of the Packard PFC's policy regarding foam packaging.
This style of decision making works as well as the group functions. There has been consistent support in the PFC for the consensus style of management, yet the membership has also agreed to a store manager system that is, at least in theory, not purely democratic. Despite occasional disagreements, PFC staff believes the consensus system produces superior decisions.
BUYING POLICY
One result of consensus decision making and democratic involvement of the membership is the Product Guidelines, which reflect the Values Statement of the People's Food CooperativeS:
1. Top priority is given to natural foods, meaning products free of any artificial ingredients.
2. To further insure the quality of our foods, we look for: whole foods, those with a minimum of processing and refining; organic foods, those grown in accordance with accepted standards; and best value, items of the highest quality at the best price.
3. Finally, preference is given to products that are: locally produced, produced and/or distributed by cooperatives, produced with the least human, animal, and environmental exploitation, have minimal and ecologically sound packaging.
8 Product Line Guidelines, People's Food Cooperative Policy Notebook.
21

Other aspects of product line decisions include: the amount of space available in the store for new items, the relative cost of the item, its selling potential, and the politics associated with its production or distribution.
Members and shoppers are informally polled for their opinions. For example, California organic grapes are occasionally sold despite a PFC guideline supporting the UFW table grape boycott, because polling revealed that members are either willing to purchase California organic grapes or do not mind that the PFC carries them.
A formal annual survey of the membership concerning product line decisions and general PFC functions helps assure that staff judgments reflect customer preferences. Also, shoppers and members can voice opinions about a product or request new items by talking to a staff member or calling the office. The Guidelines can also be changed by the board of directors or by membership referendum at the Annual Meeting.
In the end, customer purchases determine whether or not the product line is viable.
SUMMARY OF ORGANIZATIONAL ASPECTS
Several significant elements help make waste reduction at the Packard People's Food Co-op possible:
• A policy to purchase foods with minimal packaging • Nearly universal staff commitment to reduce waste in the store operations • A general willingness to consider new ideas and to implement innovations • The entire staff openly exchanges opinions and discusses the merits of new ideas • The staff is small (6) and committed the ideal of cooperative decision-making • Co-op shoppers are knowledgeable and cooperative
6. IMP ACT AND TRANSFERABILITY
IMPACT ON THE SOLID WASTE STREAM
Based on the process analyses presented in Section 3, bulk olive oil sales reduce waste generation by 0.35 pounds per pound of olive oil sold; bulk shampoo sales reduce waste by 0.06 pounds per pound of shampoo sold.
Although no analysis of the other bulk liquids sold at the Packard PFC was attempted, it is reasonable to assume that levels of waste reduction comparable to those demonstrated for olive oil and shampoo are achieved by other bulk sales.
In addition to bulk liquids, the Packard PFC sells a large variety of dry foods in bulk. Special dispensers are used for most dry bulk items, unlike the olive oil and shampoo cases studied. No estimate of the total waste reduction from selling dry items in bulk compared to prepack was done, but the purchase of dry items in bulk can be expected to contribute to waste reduction, particularly if consumers employ reusable containers.
The Packard PFC practices a wide range of other waste reduction measures. The estimates given in Table 5 do not include any waste reduction produced by bulk sales; all figures in this table are derived from in-store practices outside the area of bulk sales. If waste reduction achieved at Packard is extrapolated statewide, 420,000 tons of material could be diverted annually from the
22

solid waste stream by the food retail sector. This extrapolation assumes waste production is proportional to sales in the retail food sector.
Estimates of the Packard store's proportion of state sales were derived from total retail food sales data for 19879 and 199010. Total Michigan retail food sales for 1987 were divided by total U.S. retail food sales for 1987 to determine Michigan's percentage of U.S. food sales (.0324). This figure was used to estimate retail food sales in Michigan for mid 1989 to mid 1990 from total U.S. data that was not apportioned among the states. Sales at the Packard store were provided from mid 1989 to mid 1990, allowing Packard's relative proportion of Michigan retail food sales to be estimated (Total Michigan sales are 9,925 times greater than sales at the PFC's Packard store). Finally, this figure was multiplied by Packard's annual waste reduction totals presented in Table 5, and an estimate of total statewide waste reduction obtained.
TRANSFERABILITY
The Packard PFC is a relatively small community store managed by a philosophically motivated staff that serves a loyal, informed, socially-conscious customer base. Despite Packard's unusual position within the retail food sector, other grocery stores should find that bulk food sales reduce solid waste, increase profit margins, and reduce consumer prices.
Transferability of the bulk sales system presented in this report is influenced by interdependent factors. Bulk merchandising may make shopping more time consuming and complicated for customers new to the system. Shoppers might also have to be supervised to minimize intentional and accidental contamination of bulk products. Some large supermarkets are currently not organized for such boutique-style service. Also, some shoppers might find that they save money but are required to spend more time purchasing food, thus making bulk purchasing less attractive.
Differences in scale could affect transferability of bulk merchandising programs. Large retailers selling liquids in bulk might do so via a pneumatic feed system, in which the liquid being dispensed is not on display in the retail area but is kept in inventory and delivered to spigots in the display area. The economics of such a system might differ, positively or negatively, from the systems studied here.
Smaller, owner-managed food stores could experiment with merchandising bulk foods without major operational changes or financial risk. Large supermarkets and convenience store owners might have to reorganize buying, stocking, and employee training procedures, while also instituting consumer education programs.
Volume and cost of bulk bins also need to be considered by retailers interested in selling dry bulk items. Storage conditions, particularly for perishable items, may require changes in the inventory area, or different procedures than those employed for selling prepackaged products.
Some waste reduction measures practiced by the Packard PFC, such as encouraging customers to reuse paper sacks or to bring their own tote bags for purchases, are currently being adopted by Kroger, Meijer, and other large retailers. Corrugated container recycling is becoming standard practice among food retailers.
9 Census of Retail Trade. Bureau of Census, U.S. Dept. of Commerce, 1987.
10 Monthly Census of Retail Trade. Bureau of Census, U.S. Dept. of Commerce, May 1990.
23

Other Packard PFC waste reduction practices not being followed by most retailers are also transferable. These practices include:
• Donating edible, but unsalable food to community organizations • Selling products in reusable containers (e.g., milk) • Reusing containers and packaging whenever possible, and buying from suppliers who reuse
their containers (e.g., plastic crates returned to vendors). • Composting spoiled food
The Packard PFC's policy of buying from local growers could be adopted by other food retailers, depending on their size and organizational structure. Buying from local producers provides opportunities for reusing containers that would otherwise be discarded and also decreases energy use and transportation costs.
Contact with local growers and food gatherers enhances the transferability of food donation and composting practices. Frequent pickups of donated food and compost help assure that storage requirements are minimal. Reliable collection of surplus food also reduces the likelihood of excessive spoilage or infestation, keeping storage areas clean and reducing MSW discards.
Factors Enhancing Transfer of the Packard PFC's Waste Reduction Measures
• Bulk merchandise reduces solid waste generation, storage and shelf space, and total store costs.
• In many instances, converting to bulk sales requires little capital or equipment and can be effected with minor changes in retail operations.
• Bulk food can be sold at a lower retail price, but with greater margins than prepacked items.
• Through bulk buying, the consumer has control of quantity and is also likely to generate less postconsumer solid waste.
• Other Packard PFC waste reduction practices divert significant amounts of material from landfills and can be instituted without substantial cost or change in store operations.
Impediments to Transfer of the Packard PFC's Waste Reduction Measures
• Contamination is a greater risk in bulk sales.
• Savings realized through bulk sales are, in part, derived from the transfer of labor to the customer. The additional time and effort required by customers to obtain their goods might impede acceptance.
• Organizational changes and employee training may be necessary.
• A commitment to information and consumer education is essential.
• Adoption of waste reduction measures not directly related to bulk sales depends on the availability of recycling, composting, and food gathering programs. Also, contact with local growers or food gatherers greatly assists composting and food donating programs. Differences in scale between the Packard PFC and other retailers may impede such contacts.
24

7. CONCLUSIONS AND RECOMMENDATIONS
CONCLUSIONS
• The bulk sales program analyzed in this case study significantly reduces solid waste. Selling one pound of olive oil in bulk lowers solid waste generation by .35 pounds, while the sale of bulk shampoo reduces waste by .06 pounds per pound of shampoo sold.
• Bulk sales reduce waste at the source. In addition, reusing containers for bulk purchases is more efficient, from a resource management perspective, than recycling prepackaged containers and can significantly lower postconsumer waste generation.
• Bulk products are sold at a lower retail price with higher margins than equivalent prepacked items. Lower wholesale prices are the main reason for the lower total costs of bulk products. Analyzed co-op costs for bulk olive oil are $.30 less per pound than for prepack but bulk olive oil is sold for only .$16less per pound. Shampoo costs Packard $.70 less per pound in bulk but is sold for only $.27 less per pound than prepacked shampoo.
• A wide range of other activities at Packard significantly reduce solid waste generation. Through source reduction, which includes food donations and packaging reuse; composting; and recycling the co-op diverts 43 tons of material per year from the solid waste stream. This figure does not include any waste reduction resulting from bulk sales.
• The Packard PFCs democratic management and environmental commitment favor bulk sales and a comprehensive waste reduction program. Environmentally sound business practices are as important to the PFC as economic concerns.
• Consumer education and staff involvement are important elements of any successful waste reduction program in the retail food sector. Bulk products will not necessarily reduce postconsumer waste generation unless containers for bulk purchases are reused.
• If all stores in the retail food sector followed the waste reduction practices of the Packard PFC, not including bulk sales, solid waste in Michigan could be reduced by as much as 420,000 tons annually.
• Bulk sales and other waste reduction practices of the Packard PFC are transferable to many stores in the retail food sector. Some reorganization of procedures may be required to adopt all methods discussed in this report. Successful implementation of other measures will depend on local availability of recycling, com posting, and other specialized programs.
25

RECOMMENDATIONS
Many of the Packard PFC's waste reduction methods are transferable to other food retailers. The following recommendations are designed to facilitate the transfer process.
• Review the many different ways the Packard PFC reduces solid waste.
• Conduct process and cost analyses similar to those performed in this study to identify appropriate waste reduction procedures and estimate costs of implementing a waste reduction plan.
• Appeal to employees to generate ideas and to participate in the development and implementation of waste reduction programs.
• Decide to do it. Make it a company policy to reduce waste.
• Start small. Start with one product line or one department.
• Make a commitment to consumer education by providing information on ways to save money while purchasing environmentally sound products.
• Standardize containers store-wide and industry-wide in order to facilitate weighing and pricing of bulk items.
26

APPENDIX A.
3 4 i 5 6 IWeloht of 7 IWeioht of 8
1 4 1 5
I 1 s
Volume of Volume of
i i
A
(lbs.
(fl. oz.'s! i r fctTn
BLI
I 1 7 IGross Lbs. Product I 1 8 IPost .bs. Pcko./Lb. Product I 1 9 I Net Lbs I . Product, caio 1 I 2 0 I Net Lbs. i . Product Case
2 1 ;cu ln. i lng
I 22 23 IWage 2 4 c;;tUniiS per ouarier
125 126
ffi~ I per Unit t per Lb. :per Pint
I 29 3 0 Orderino Time per Unit fminl
I 3 1 Orderino · Cost per LJnit I 3 2 Drderlno Labor Cost per Lb. I 3 3 Ordering Cost per Pint I 34 I 3 5 IStoraoe Time Unit (min I 3 6 IStoraoe Labor r per Unit
3 7 IStoraoe Labor t per Lb. I 3 a lstoraoe LabOr · per Pint
3 9 IStoraoe Area Unit (ft21 1 4 o ;storage ·Areacost per Quarter ! 41 IStoraoe Area C : per Lb. I 42 !Storage Cost r Pint
143 I 4 4 Time Unit (min I 4 5 1 Labofi : per Unit I 4 6 i Labor t oer Lb. I 4 7 1 Labor : per Pint I 4 8 I Shelf Space Area per Unit (ft2)
4 9 I Shelf Space per Quarter
52 i3 54 ;s ;6
I Shelf Space Col! per Lb f Soace .. Cc t per Pint
Time · ' per Lb.tt i I Cost per Lb.
Cost per Pint
57 ITo tal t per Unit 58 Total I 'per L 59 I DlsoosaiCOst per l!nlt 6 0 !Total Disoosal C t per Lb. 51 ; 2 I Added Costs oer i 3 I Added Costs · Pint
Total Store~ per Lb.ttt i
I Per
B D E I Bulk ·oiivo- Oil I Pcko Olive Oil ~ I Pcka.
i " case of 12 ~ 4·oack ~
37.6 it I 14.815: 2.8 It 2.4 It ;fib
640. a:. 192. oz. 512. oz. ~ 1730 84( 1950 --;o;;:n
0.07 lb. 0 1ili>. fG71b. 0.13 lb. ~
$13.60/hl
' $ 1 0.650(
$2.766,
.0(
•oY?s
>o .DOE
0.5( &0.113
1 ,0,
$1M58 $0. 12'
$0.
3.3 '0 .763\
. 19 ,0,
$0. •14( $0:013>
0.4' $O:il94E $0.0889
$o.:l3oi $0.0081
$0. i59E $0.15(
6C
*:~ 0.52 lb 0.32 lb.
J.O
$13.60/h 5
$35.810( $3. 71
1.00 10.226
~~~~~ l.5t
$0. 132 $0. 100 &0.0094
1.7 $1.306' $0.023 $0.0211
6.4! $1.462(
$( 1218 0.56
.220E l.021E
>o.0203
0.08 $0.0189 $0.0178
>o.0348 ),004
$0.23(( $0.215<
$5.150(
1
0.)70 lb 0.014 lb. 0.014 lb.
. 0( lb. 60.
$13.60/r 6
$50.480( $1.44561 $1.5
1 .0( 10.226'
60.00
0.8 $0.188 $0.005•
t.OE
$1.9332 $0.010'
),0
>.SC
1.25
10.003
1.42
$0 103'
$0.244
$0.1946 $0.2124
100°/. 0''1<
soo;.
nii
0~ Tb. 0.0 lb.
0:0 To. J.03 lb .
77.(
$1 3.60/hl
3
$31.680(
·~ I.OC
$0. '26' to. 'i5i tO. 16E
J.4: ~ $0. ){ifii $0. 1071
-,-oF
.8974 >fi429
$0.2162
I Retail Price oer $4 7000 $3 100r ~ ~. includes shipping .~,h~.and pradu~t packaging
tJ't ~~t · ~' olus ~dded cn.~s quantity of 1
Lb.
Al

A
7 (Weight of (lbs.)t 8 9 !Volume of Product (fl. oz.'s)
!Volume of Shlpplno (cu. ln.
i i Cons, 1 1
1 Cons. I Recycle late, ~ase 2 I 1 5 've. Ips of Cons. Bulk I 116 11 7 !Gross Lbs.
1 8 (Post Lbs. 1 9 (Net Lbs. I
I 20 INet Lbs. I 21 Cu. ln. Shipping
I 22 23 (Wage
Lb. Product . Product
Product, case Product, Case 2
I Product
I 2 4 !Number of Units per Quarter 25
126 127
28 129
30 ; 31 32
;33 • 34
I I • Cost per Unit I I Cost per Lb. I I · Cost per Pint
Time per Unit (min) , Labor Cost per Unit
Labor Cost per Lb. ' Labor cost per Pint
3 5 Storage Time per Unit (min) 3 6 Storace Labor Cost per Unit 3 · Storage Labor Cost per Lb. 3 8 Storage Labor Cost per Pint 3 9 Storage Area per Unit (ft21 4 0 Storage Area Cost per Cluarter 41 Storage Area Cost per Lb. 4 2 Storage Cost per Pint 43 4 4 I Time per Unit (mini 4 5 I Labor Cost per Unit 4 6 I Labor cost per Lb. 4 · I Labor Cost per Pint 4 8 Shelf Space Area per Unit (ft2) 4 9 Shell Space Cost per Quarter ~ ~Space Cost per Lb. 51 Shelf Space Cost per Pint 52 53 Check-Out Time (min) per L •.tj 54 Check-Out Labor Cost per Lb. 55 : Labor Cost per Pint 56 57 r eta! • Cost per Unit 58 eta! I Costs per Lb. 59 !Total Disposal Cost per Unit 6 0 fetal Disposal ~est per Lb.
I 61 I 6 2 (Added Costs per Lb. 1 6 3 (Added Costs per Pint
I (Total
l8ulk Olive Oil l"cubl-talner"
.75
34• 730
1.5
:87)1:86) :o.5< '4015)1(86
8
:B7+ 1.549"401• "(1-613))j.(66; :87- 1.549'4015)'11-814nJ,(66; l1 o· 6169
13.6
110.65 -626186
HI 16
-631166 -(1
•.5
16 02
1.37
'=844'823160
16 02
18
'624))'16
.417 =853'823160 =854'86' '6189
=87'0.12
I 6 8 I Retail Price per Lb. 1.99 I Retail Price per Pint . 7 It Includes shipping · and product In of1lli I tn ' costs plus added costs
A2

c D 3 Pckg. Olive OH Bulk Shampoo 4 case of 12 al!on 4-pack 5 6 11.29 34.92 7 -0.549*12+0.87 - 0.27*4 +1.36 8 9 192 512
1 0 840 1950 11 1 2 0.6667 1 1 3 0.15 0 1 4 0.5 0.5 1 5 n/a 5 1 6 1 7 - C7)/(C6) -(07)/(06) 1 8 - 0.549*12)/CS - 0.0886*28.444/5)/(06) 1 9 - (0.87*(1-C12)}+{(0.549*12)*(1-C13)))1C6 0.0886*28.444/5. 1-013))/(06) 20 ((0.87' 1-C12))+((0.549'12' 1-C14)))/C6 -{(0.0886*28.444/5)*{1-014)}/ 06 21 =C10"16/C9 010*16/09 22 23 13.6 13.6 24 5 5.5 25 26 35.61 50.48 27 =C26/C6 -026/06 28 (C26/C9 •1s (026/09)*16 29 30 1 1 31 -C30*C23/60 -030*023/60 32 -C31/C6 =031/06 33 =(C31/C9)*16 =(031109)'16 34 35 0.5 0.83 36 .. C35*C23/60 .. Q35*023/60 37 =C36/C6 -036/06 38 (C36/C9)"16 =(036/09)"16 39 0.73 1.08 40 C39*1.79 -039*1.79 41 =C40/ C6*C24) -040/(06*024) 42 -{C401 C9*C24))*16 -(040/(09'024 )'16 43 44 6.45 10.53 45 =C44*C23/60 -044'023/60 46 -C45/C6 =045/06 47 =(C45/C9)'16 = 045/09)'16 48 0.56 0.25 49 =C48*2.18 =048*2.18 50 -C49/(CS*C24) -049/(06*024 51 -(C49/(C9'C24))'16 -(049/(09'024))'16 52 53 0.0833 0.417 54 -C53*C23/60 =053*023/60
55 =C54*C6*16/C9 =054*06*16/09 56 57 =(C23*1 + 1 0)*0.58/(79312) -(023*1 +1 0)*(1 .36/(793/2))+{023*0 .0833+ 1 0*0.05)/1 0 58 -C57/C6 057/06 59 -0.29*0.12
60 -C59/C7 61 62 -C41 +C50+C32+C37+C46+C54+C58+C60 =041+050+032+037+046+054+058+060 63 -C42+C51 +C33+C38+C4 7 +C55+(C57 +C59)/(C9/16) -042+051 +033+038+047 +055+(057 +059)/(09/16) 64 65 -C27+C62 =027+062 66 -C28+C63 028+063 67 68 5.15 2.65
69 4.85 2.89
~ rH-72
A3

of
14 1,5 I1Sin/a
16
18 H• .0886' 19 1·E1
1·E14))/E6 ·E10'11
113.6
125 26 .68 27 ·E26/E6
. 281·(1 !9
i·E31/E! CE311 16
34 '3510.42 36
.37
~ 16
14 .25 15 46 4
~16 • 4 7 I•( 4810. 49 '2.18 50 51 1'16 52 53 •.0833 54 1=E53'E23/60 55 ·E54'E6'16/E9 56 57 (E23'1 +1 0)'0 .62/(793/2) 58 59
~37+!
~ 19
fit A4

APPENDIX B
Liquids
Cider
Mirin (cooking wine)
Oils
Soy sauce
Dry Items
Beans
Grains
Nuts
Seeds
Flour
Flakes
Pasta
Nut and Seed Butters
List of Bulk Products Sold at the Packard PFC
Sweeteners
Vanilla
Vinegars
Hair conditioner
Shampoo
Soaps
Massage oil
Baking products (salt, yeast, baking powder, chips, etc.)
Granola and other prepared cereals
Candy
Snacks
Prepared food and mixes
Miso, Tofu
Dog biscuits
Bl