waste minimization methods for treating analytical .../67531/metadc625866/m2/1/high... ·...
TRANSCRIPT

Waste Minimization Methods for Treating Analytical Instrumentation Effluents at the Source
by T. R. Policke Westinghouse Savannah River Company Savannah River Site Aiken, South Carolina 29808 WSRC Contact: Dr. C. Banncchie, 7-7744
J. A. Ritter Chemical Engineering Dept., USC SC USA
C. Barnhart Chemical Engineering Dept., USC
A document prepared for EMERGING TECHNOLOGIES IN HAZARDOUS WASTE MANAGEMENT VI1 at Atlanta from 09/17/95 - 09/20/95.
DOE Contract No. DE-AC09-89SR18035
This paper was prepared in connection with work done under the above contract number with the U. S. Department of Energy. By acceptance of this paper, the publisher and/or recipient acknowledges the U. S. Government's right to retain a nonexclusive, royalty-free license in and to any copyright covering this paper, along with the right to reproduce and to authorize others to reproduce all or part of the copyrighted paper.
Disclaimer
This report was prepared as an account of work sponsored by an agency of the United States Government. Neither the United States Government nor any agency thereof, nor any of their employees, makes any warranty, express or implied, or assumes any legal liability or responsibility for the accuracy, completeness, or usefulness of any information, apparatus, product, or process disclosed, or represents that its use would not infringe privately owed rights. Reference herein to any specific commercial product, process, or service by trade name, trademark, manufacturer, or otherwise does not necessarily constitute or imply its endorsement, recommendation, or favoring by the United States Government or any agency thereof. The views and opinions of authors expressed herein do not necessarily state or reflect those of the United States Government or any agency thereof.

DISCLAIMER
Portions of this document may be illegible in electronic image products. Images are produced from the best available original document.
PREPRINT EXTENDED ABSTRACT Presented at the I&EC Special Symposium
American Chemical Society Atlanta, GA, September 17-20, 1995
WASTE MINIMIZATION METHODS FOR TREATING ANALYTICAL INSTRUMENTATION EFFLUENTS AT THE SOURCE
James A. Ritter and Christine Barnhart Chemical Engineering Department, University of South Carolina, Columbia, SC 29208
Timothy A. Policke Westinghouse, Savannah River Technology Center, Aiken, SC 29808
INTRODUCTION
Recently there has been increasing interest in minimizing analytical laboratory wastes (Lunn and Sansone, 1994). The driving forces behind this interest are the ever increasing costs and liabilities associated with waste disposal. Thus, many analytical laboratories, like the Defense Waste Processing Technology-Analytical Laboratory (DWPT-AL), located at the Savannah River Site (SRS), are looking into treating their own wastes. The DWPT-AL operates four laboratory modules that produce hazardous liquid effluents from the analytical instrumentation: Spectroscopy, Chromatography I, Chromatography 11, and Wet Chemistry. The hazardous waste from these modules is being sent to SRS Waste Management at a cost of approximately $13,000 per drum, which corresponds to approximately $325,000 to $520,000 per year. If the hazardous characteristics of and the hazardous components in the analytical instrument effluents or sample preparation wastes can be altered and/or reduced in such a way as to render the stream non-hazardous, the large volume of non-hazardous waste can be disposed of via process drains.
Therefore, the primary goal of this project was to reduce the amount of hazardous waste being generated by the DWPT-AL, thereby substantially reducing the costs associated with its disposal. A secondary goal was to develop in-line methods using primarily adsorptiodion exchange columns that can be used to treat the liquid effluent as it emerges from the analytical instrument as a slow, dripping flow. This second goal allows the treatment method to become part of the operating procedure associated with the instrument; thus, the effluent would not be considered a waste until it emerges from the in-line column.
A detailed characterization study was performed on twelve of the liquid effluent streams that were generated within the modules of the DWPT-AL. Samples from the streams that were found to contain hazardous components (primarily high benzene and mercury levels) were collected and treated to attempt to render them non-hazardous. Treatment methods were based on well established adsorption methods for removing selected metals and organics from waste water (e.g., see Ritter and Bibler, 1992; Ying et al., 1990; Blum et al., 1993). Initial results from both the characterization study and the in-line treatability study are presented below.
CHARACTERIZATION OF DWPT-AL LIQUID EFFLUENTS
Twelve analytical instrument effluent or sample preparation streams from the four modules were characterized in terms of their hazardous characteristics and components. The total effluent from each instrumenthource was collected in large carboys over a period of one month and sampled for analysis. On two randomly chosen days, two weeks apart, the effluent from each instrumenthource was collected in separate carboys and also sampled for analysis. In this way, the characterization was done on the total effluent collected over a period of one month (the composite sample), and on the total effluent collected over a period of one day. As far as hazardous componentskharacteristics were concerned, the analyses obtained from the two daily samples were essentially the same as those obtained from the composite sample. Table I displays the module, stream and instrument identification, and general results of the analytical instrument effluent characterization study, based on the composite sample collected over one month. Table I1 presents the stream traits and RCRA limits, and detailed results of the analytical instrument effluent characterization study, also based on the composite sample.
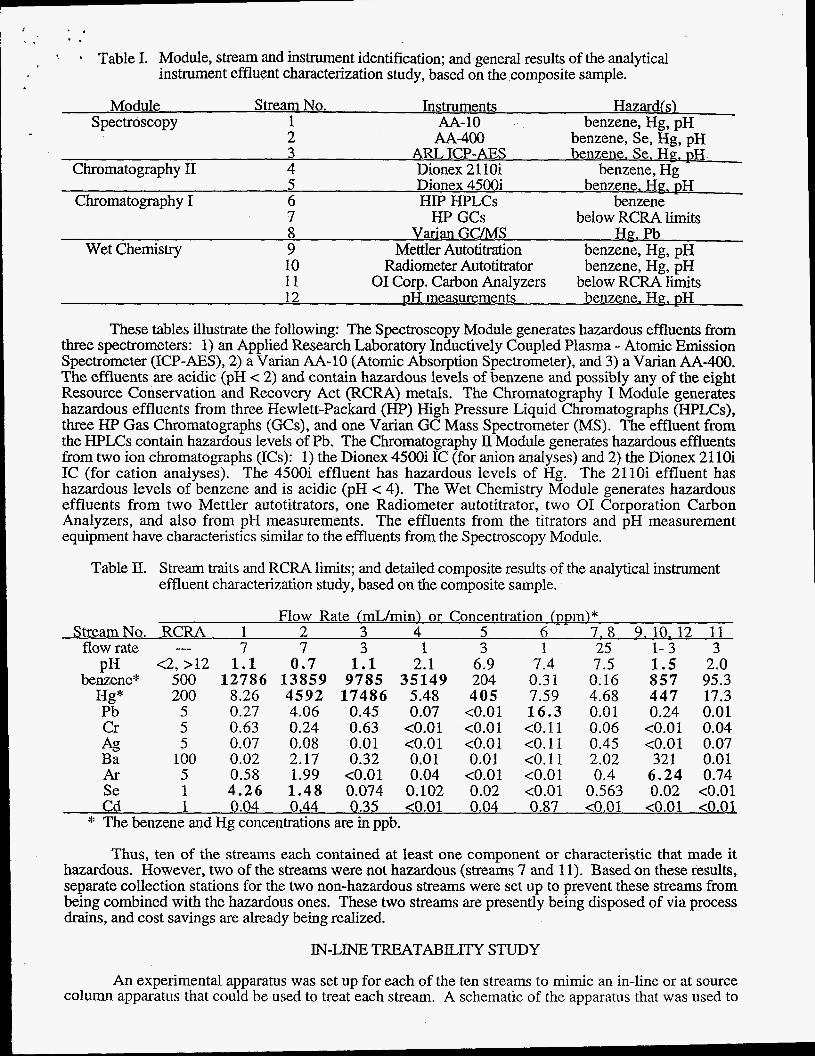
- * . . a Table I. Module, stream and instrument identification; and general results of the analytical
instrument effluent characterization study, based on the composite sample.
Module Stream No. Instruments Hazard(s) Spectroscopy 1 AA-10 benzene, Hg, pH
2 AA-400 benzene, Se, Hg, pH 3 ARL ICP-AES benzene. Se. Ha. DH
Chromatography I1 4 Dionex 2 1 10i benzene, H i - 5 Dionex 4500i benzene, HE. DH
Chromatography I 6 HIP HPLCs benzene 7 HP GCs below RCRA limits 8 Varian G C M S Hg. Pb
Wet Chemistry 9 Mettler Autotitration benzene, Hg, pH 10 Radiometer Auto titrator benzene, Hg, pH 11 01 COT. Carbon Analyzers below RCRA limits 12 pH measurements benzene. Hg, pH
These tables illustrate the following: The Spectroscopy Module generates hazardous effluents from three spectrometers: 1) an Applied Research Laboratory Inductively Coupled Plasma - Atomic Emission Spectrometer (ICP-AES), 2) a Varian AA-10 (Atomic Absorption Spectrometer), and 3) a Varian AA-400. The effluents are acidic (pH < 2) and contain hazardous levels of benzene and possibly any of the eight Resource Conservation and Recovery Act (RCRA) metals. The Chromatography I Module generates hazardous effluents from three Hewlett-Packard (HP) High Pressure Liquid Chromatographs (HPLCs), three HP Gas Chromatographs (GCs), and one Varian GC Mass Spectrometer (MS). The effluent from the HPLCs contain hazardous levels of Pb. The Chromatography II Module generates hazardous effluents from two ion chromatographs (ICs): 1) the Dionex 4500i IC (for anion analyses) and 2) the Dionex 21 1Oi IC (for cation analyses). The 4500i effluent has hazardous levels of Hg. The 2110i effluent has hazardous levels of benzene and is acidic (pH < 4). The Wet Chemistry Module generates hazardous effluents from two Mettler autotitrators, one Radiometer autotitrator, two 01 Corporation Carbon Analyzers, and also from pH measurements. The effluents from the titrators and pH measurement equipment have characteristics similar to the effluents from the Spectroscopy Module.
Table II. Stream traits and RCRA limits; and detailed composite results of the analytical instrument effluent characterization study, based on the composite sample.
Flow Rate (mumin) or Concentration (ppm)* Stream No. RCRA 1 2 3 4 5 6 7.8 9, 10.12 11
flow rate --- 7 7 3 1 3 1 25 1- 3 3 pH c2,>12 1.1 0 .7 1.1 2.1 6.9 7.4 7.5 1.5 2.0
benzene* 500 12786 13859 9785 35149 204 0.31 0.16 857 95.3 200 8.26 4592 17486 5.48 405 7.59 4.68 447 17.3 5 0.27 4.06 0.45 0.07 <0.01 16.3 0.01 0.24 0.01
Hg* Pb Cr 5 0.63 0.24 0.63 ~ 0 . 0 1 ~ 0 . 0 1 ~ 0 . 1 1 0.06 ~ 0 . 0 1 0.04
5 0.07 0.08 0.01 ~ 0 . 0 1 <0.01 ~ 0 . 1 1 0.45 <0.01 0.07 100 0.02 2.17 0.32 0.01 0.01 ~ 0 . 1 1 2.02 321 0.01
Ag Ba Ar 5 0.58 1.99 <0.01 0.04 <0.01 ~ 0 . 0 1 0.4 6.24 0.74 Se 1 4.26 1.48 0.074 0.102 0.02 <0.01 0.563 0.02 <0.01 Cd 1 0.04 0.44 0.35 <0.01 0.04 0.87 ~ 0 . 0 1 <0.01 <0.01
* The benzene and Hg concentrations are in ppb.
Thus, ten of the streams each contained at least one component or characteristic that made it hazardous. However, two of the streams were not hazardous (streams 7 and 11). Based on these results, separate collection stations for the two non-hazardous streams were set up to prevent these streams from being combined with the hazardous ones. These two streams are presently being disposed of via process drains, and cost savings are already being realized.
LN-LINE TREATABILITY STUDY
An experimental apparatus was set up for each of the ten streams to mimic an in-line or at source column apparatus that could be used to treat each stream. A schematic of the apparatus that was used to

' e
1 .
+treat dne'of the streams is shown in Figure 1. Each apparatus consisted of a pyistaltic pump, a glass chromatographic column, and sample delivery and collection vessels. Viton tubing W a s used with the peristaltic pump to minimize the effects of benzene on the tubing. One of the unique features of this system was the use of a layered adsorbent bed. The first layer consisted of activated carbon (Cdgon DSR-
~ C) to remove the benzene and other organic compounds (Ying et al., 1990; Blum et aL, 1993), and the second layer consisted of Duolitem GT-73 ion exchange resin to remove mercury and other soluble metal species (Ritter and Bibler, 1992).
Kontes Chromatography Column with fritted disc (adsorption bed) U p\
Treated Sample
114" Glass Tubw
:+-,SS Glass-to-Tube Fitting
Won Tubing
untreated Sample
Figure 1. A schematic of one of the experimental column apparatuses used in this study.
Within each glass chromatography column (Kontes Model 250-12), a 0.25 in layer of fiberglass was first added to serve as a barrier between the resin and the fritted disc. Next, approximately 2 in of the GT-73 ion exchange resin was added. A 0.25 in layer of fiber glass was added on top of the resin to serve as a barrier between the resin and the activated carbon. Approximately 2 in of the activated carbon was added; and finally a 0.25 in layer of fiberglass was added on top. This final layer of fiberglass filtered out any large particles that may have been present in the samples. It should be noted that the volume of GT-73 resin and activated carbon used in these columns was estimated, based on the known capacities of these adsorbents for benzene and mercury, coupled with the expected benzene and mercury concentrations and stream flow rates of the ten streams. The columns were packed, based on the worst case scenario, with the resin expected to last approximately one month or more.
Each column was flushed with 100 to 150 mL of deionized water to remove fines, etc. prior to exposing it to the effluent samples. The effluent samples were passed through the columns at their specified flow rates (see Table n) in a down (trickle) flow mode, and collected in Nalgene bottles. These treated samples were then analyzed at the DWPT-AL.

I ' * * += Tables 111 and IV respectively present some of the results obtained for the Spectroscopy Module
* (stream no. 3), and the Wet Chemistry Module (combined streams 9, 10, and 12). Note that the initial concentrations correspond to a sample obtained from the effluent stream just before the other samples were collected from the same effluent stream, but in different individual bottles. Thus, these initial concentrations may not be representative of the initial concentrations in the individual samples. This was done to avoid overloading the DWPT-AL with samples to analyze.
Table III. Results for the Spectroscopy Module: Stream No. 3."
Concentration (mm)** Initial RCRA
Component Conc. Limit SamDle 1 Sample 2 Sample 3 Samule 4 Sample 5 SamDle 6 benzene" 76 500 39 105 47 2.7 14 13
75100 200 18300 19900 18200 0.87 c0.5 58.1 <0.20 5 2.45 0.21 c0.20 0.26 0.20 <0.20
Hg* Pb Cr 0.37 5 0.7 1 5.2 0.47 0.3 1 0.84 0.55
0.04 5 0.29 0.05 <0.02 <0.02 0.03 0.02 0.30 100 9.72 0.02 <o.o 1 3.6 0.10 0.22
Ag Ba Ar 0.16 5 1.6 0.37 0.1 1 0.26 0.27 0.16 Se 0.10 1 1.00 0.48 0.15 0.32 0.33 0.15 Cd 0.01 1 0.09 0.10 0.08 0.12 0.21 0.25
* Samples 4 to 6 were treated in a different column than 1 to 3. ** The benzene and Hg conc. are in ppb.
Table IV. Results for the Wet Chemistry Module: Combined Streams 9, 10, and 12.
Component benzene"
Hg* Pb Cr Ag Ba Ar Se
Initial Conc. 4250
26400 2.01 0.33 0.18 5.2 1.2
0.05
Concentration (DDm)* RCRA Limit Sample 1 Sample 2 Sample 3 Sample 4
500 4.9 7.5 ** ** 200 < O S COS <0.5 < O S
5 0.27 <0.20 ** ** 5 0.43 0.46 5 c0.02 c0.02 ** **
100 1.43 1.45 ** ** 5 0.24 0.08 ** ** 1 0.37 0.14 ** **
** **
Cd 0.03 1 0.13 0.13 ** ** * The benzene and Hg conc. are in ppb. ** The DWPT-AL could not analyze due to high organic levels.
The results show that the initial concentrations for these streams were similar in nature to those shown in Table 11, i.e., the hazardous characteristics were similar. The results also show that this column technique did not work on the first three samples (about 460 mL) that were passed through the column set up for stream 3, but worked well on the next three samples (about 640 d). Note that samples 4 to 6 were treated in a different column. It was determined that an unusual form of Hg was present in the f is t three samples. Table IV shows a similar result for combined streams 9, 10 and 12. The first two samples that were treated were rendered non-hazardous, but the last two samples (treated in the same column) contained organics that prevented analysis. It was determined that acetylnitrile was present. Results from treating other streams were much better, but the initial concentrations of Hg and benzene were much lower (see Table II). Clearly, the characteristics of these streams changed compared to the initial characterization study; thus, continual, in-depth stream characterization is the key to making this kind of project successful.
REFERENCES
Lunn, G. and Sansone, E. B., Destruction of Hazardous Chemicals in the Laboratory, 2nd Ed., Wiley-
Ritter, J. A. and Bibler, J. P., "Removal of Mercury from Waste Water: Large-Scale Performance of an
Ying, W. C., Dietz, E. A. and Woehr, G. C., "Adsorptive Capacities of Activated Carbon for Organic
Blum, D. J. W., Suffet, I. H. and Duguet, J. P., "Estimating the Activated Carbon Adsorption of Organic
Interscience, New York (1994).
Ion Exchange Process", Wat. Sci. Tech., 25, 165 (1992).
Constituents of Wastewater", Environ. Prog. , 9, 1 (1990).
Chemicals in Water'', Crit. Rev. Environ. Sci. Tech., 23, 121 (1993).