washington metropolitan area transit authority board … with information and analysisof annual...
TRANSCRIPT
TITLE:
MTPD 2012 Security Report
PRESENTATION SUMMARY:
The Metro Transit Police security report ensures crime information is publicly communicated to enhance the security of our customers and the protection of Metro employees. This security report will compare crime data from CY2012 to CY2011.
PURPOSE:
The purpose of the MTPD security presentation is to provide WMATA Board Members with information and analysisof annual crime events in the Metro system.
DESCRIPTION:
Crime reduction is a performance measure included in Metro’s Strategic Plan. This report provides an accounting of Part I Crime for bus, rail and parkling lots in CY2012 and a comparison to crime statistics of CY2011.
Key Highlights:
The rate of Part I Crime in the Metrorail system for CY2012 is 6.2 crimes per million riders.
Part I Crime decreased by 3.3% from 2011 to 2012, when suppression team arrests are removed from the crime data. When the 149 suppression team arrest are included in the data, an increase of 4.5% is shown between CY2011 and CY2012.
Most of the Part I Crime increase is attributable to a 30% increase in snatches of small electronic devices and pickpockets.
Parking lot crime reached a ten-year low in 2012. Bus crime remains low overall, but is increasing due to snatches and
assaults.
Washington Metropolitan Area Transit Authority
Board Action/Information Summary
Action Information MEAD Number:103243
Resolution: Yes No
Page 5 of 26
As a general comparison, last year in CY2011, crime on the Metro System accounted for about 1.5% of all Part I Crime in the National Capital Region.
Background and History: In CY2012, Part I Crime in the Metro System was 6.2 crimes per million riders. Although regional crime numbers for 2012 are not yet available, the average Part I Crime rate in CY2011 was 25.022 per 1000 people in the National Capitol Region accoring to the Metropolitan Washington Council of Governments (MWCOG). Part I Crime in the Metro System last year was driven by an increase in snatches of small electronic devices and pickpockets that increased 30%. Additionally, in January and February of 2012, MTPD conducted suppression team activity which accounted for 149 Part I arrests in early 2012. When suppression team arrests are removed from the crime data, Part I Crime decreased by 3.3% from 2011 to 2012. Parking lot crime was low in 2012. In February of 2012, we recorded the lowest Part I Crime rate, 0.78 crimes per million riders, in the parking lots since our best records prior to 1999. Motor vehicle thefts are at a ten (10) year low. The Metrobus crime rate is low compared to Metrorail Part I Crime, however, even as the crime rate remains at about one (1) crime per million riders, concerns have arisen from bus passengers and operators of an increase in crimes against persons, such as robbery and aggravated assaults. Snatches of electronic devices and pickpockets also increased in 2012.
Discussion:
Metro Part I Crime rate in each of the location modes, bus, rail and parking lots, had no significant increases. The main exception to that assessment is the increase of snatches of electronic devices in both Metrorail and on Metrobus. Theft of cell phones is not a crime that is limited to our Metro system. This crime trend has made both national and international news. The MTPD utilized different strategies to combat the theft of cell phone which averages between one (1) or two (2) thefts a day in the Metro system. We have worked extensively with WMATA Media Relations to get the crime prevention message out to our customers. During the last two years, when manpower allows, we have established Crime Suppression Teams to make arrests utilizing undercover teams. Chief Michael Taborn worked with Metropolitan Police Chief Cathy Lanier to pass legislation to disable stolen cell phones by the cellular service providers. We have partnered with MPDC to identify suspects in areas surrounding our
Page 6 of 26

stations. The MTPD now uses digital videos extensively to help in the identification of suspects in snatches and other crimes in our system. The MTPD has used a variety of strategies to drive down crime overall:
Using data to identify parking garages/lots crime hot spots and deploy resources accordingly.
Increasing police presence by partnering with local jurisdictions to patrol Metro lots.
Utilizing equipment and technology to support crime prevention, such as Gator patrol vehicles, observation towers, variable message signs, public outreach activities, distribution of crime prevention literature, and direct mail to customers.
In 2012, the MTPD began an aggressive recruitment campaign to hire officers to fulfill positions approved by the WMATA Board last July, including 32 officers for Metrobus security and 26 additional officers to meet staffing requirements for the Silver Line. The recruitment efforts resulted in the hiring of 52 sworn police officers. It is expected that these officers will be available for patrol in late 2013 after completion of training. Last year, and continuing into 2013, resources were dedicated to increasing security on Metrobus by implementing the following programs:
High Intensity Targeted Enforcement (HITEs) Surge Deployments Mobile Patrol Checks More uniformed officer presence on buses
In 2012, we initiated a platform to record complaints of sexual harassment in the Metro system. Ninety-nine complaints were recorded, with 22 complaints resulting in formal police reports for criminal behavior. Fourteen on-view arrests were made by MTPD in 2012 for Simple Assault (sexual) and/or Indecent Exposure, Proposal or Act. One arrest was made in direct connection with a sexual harrasment complaint recorded through the email reporting system.
FUNDING IMPACT:
Define current or potential funding impact, including source of reimbursable funds.
Project Manager: Insert manager`s name Project
Department/Office: Insert responsible department/office
Page 7 of 26
TIMELINE:
Previous Actions
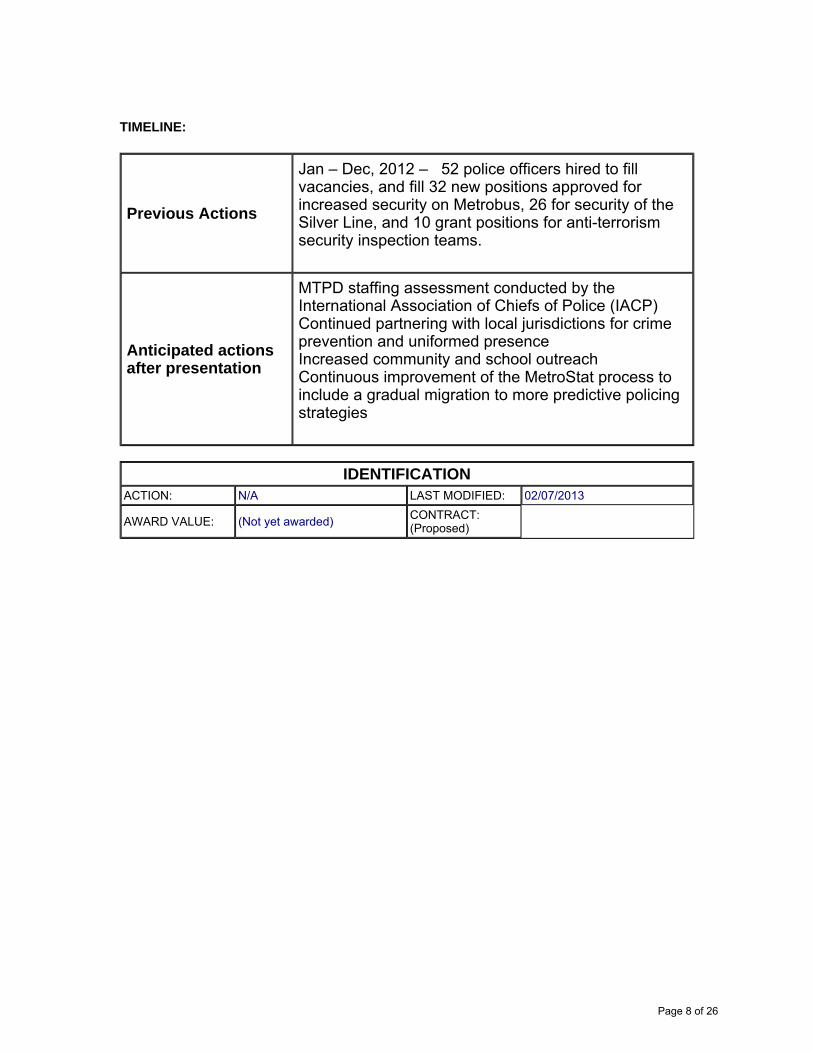
Jan – Dec, 2012 – 52 police officers hired to fill vacancies, and fill 32 new positions approved for increased security on Metrobus, 26 for security of the Silver Line, and 10 grant positions for anti-terrorism security inspection teams.
Anticipated actions after presentation
MTPD staffing assessment conducted by the International Association of Chiefs of Police (IACP) Continued partnering with local jurisdictions for crime prevention and uniformed presence Increased community and school outreach Continuous improvement of the MetroStat process to include a gradual migration to more predictive policing strategies
IDENTIFICATIONACTION: N/A LAST MODIFIED: 02/07/2013
AWARD VALUE: (Not yet awarded) CONTRACT: (Proposed)
Page 8 of 26

Security Report Safety and Security Committee February 14, 2013
Washington Metropolitan Area Transit Authority
Page 9 of 26

Part I Crime Against Persons
Crimes Against Person Type 2011 2012 Trend
Robbery Force & Violence 216 218
Armed 100 97
Fear 33 22 Aggravated Assault 108 105
Rape 1 0
Homicide* *1 *5
*In October 2011, a homicide occurred on a Metrobus. Per DC law, the crime was reported to the FBI by the DC Police Department. Video provided by Metro clearly identified two individuals as “persons of interest” who were subsequently arrested.
Crimes against persons
decreased by 3.4%
Page 10 of 26

Part I Crimes Against Property
Crimes Against Property Type 2011 2012 Trend
Larceny Snatch 438 491
Pickpocket 82 180
From Auto 346 288
Bicycle 283 330
From Building 7 8
Other 141 126 Auto Theft/Attempts 126 118 Burglary 1 0 Arson 0 1
Subtract 149
crime suppression team arrests
to show a 2.2% decrease
Page 11 of 26

Snatches Drive Increase in Rail Crime
Why?
- Snatches/pickpockets in trains/stations increased 30%
- Robberies and aggravated assaults were down
-
2
4
6
8
10
Jan
Feb
Mar
Apr
May Jun
Jul
Aug Se
p
Oct
Nov
Dec
Metrorail Crime Rate
CY 2011 CY 2012
Actions in 2012:
- Crime suppression teams targeted would-be snatch thieves
- Used data to focus on “hot spots”
- Advocacy with FCC so customers can remotely disable stolen phones
Cri
mes
per
mil
lio
n r
ider
s
Page 12 of 26
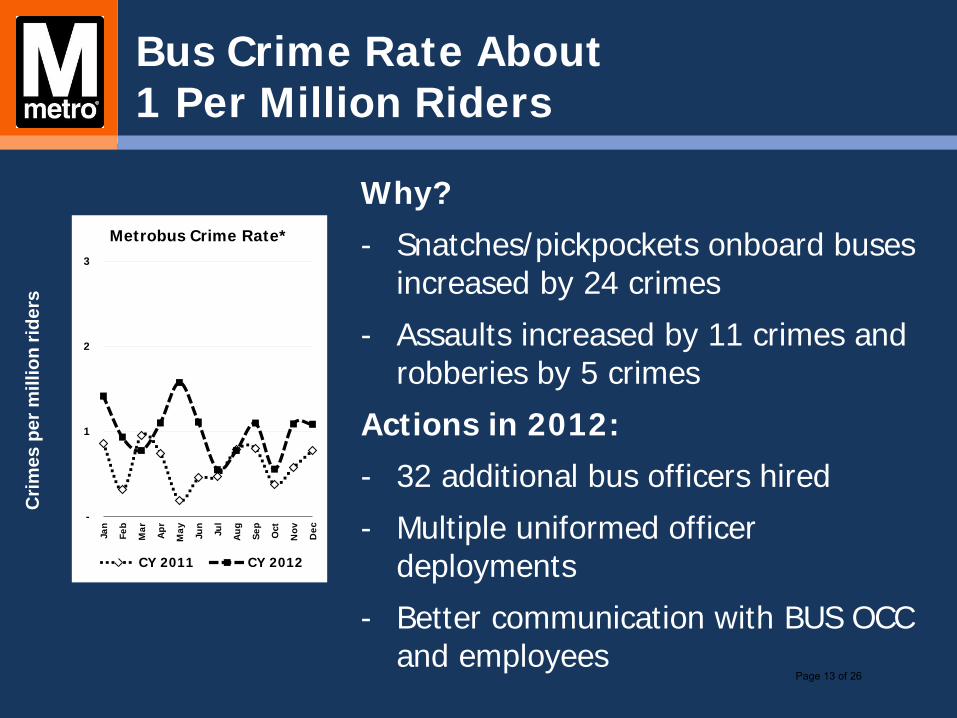
Bus Crime Rate About 1 Per Million Riders
Why?
- Snatches/pickpockets onboard buses increased by 24 crimes
- Assaults increased by 11 crimes and robberies by 5 crimes
Actions in 2012:
- 32 additional bus officers hired
- Multiple uniformed officer deployments
- Better communication with BUS OCC and employees
Cri
mes
per
mil
lio
n r
ider
s
-
1
2
3
Jan
Feb
Mar
Apr
May Jun
Jul
Aug Se
p
Oct
Nov
Dec
Metrobus Crime Rate*
CY 2011 CY 2012
Page 13 of 26

Parking Crime Hit Unprecedented Low
Why?
- Thefts from autos down 16%
- Auto thefts down 17%
Actions in 2012:
- Patrol tactics drive down crime
- Arrests of individuals suspected in multiple crimes
- Proactive crime prevention
Cri
mes
per
mil
lio
n r
ider
s
-
2
4
6
Jan
Feb
Mar
Apr
May Jun
Jul
Aug Se
p
Oct
Nov
Dec
Parking Crime Rate
CY 2011 CY 2012
Page 14 of 26

Sexual Harassment Reporting
Criminal = 52
Criminal (Non-sexual) = 9
Harassment = 38
Page 15 of 26
Presidential Inauguration Security
150 Police Officers 15 Agencies Represented
Page 16 of 26

Appendix
Page 17 of 26
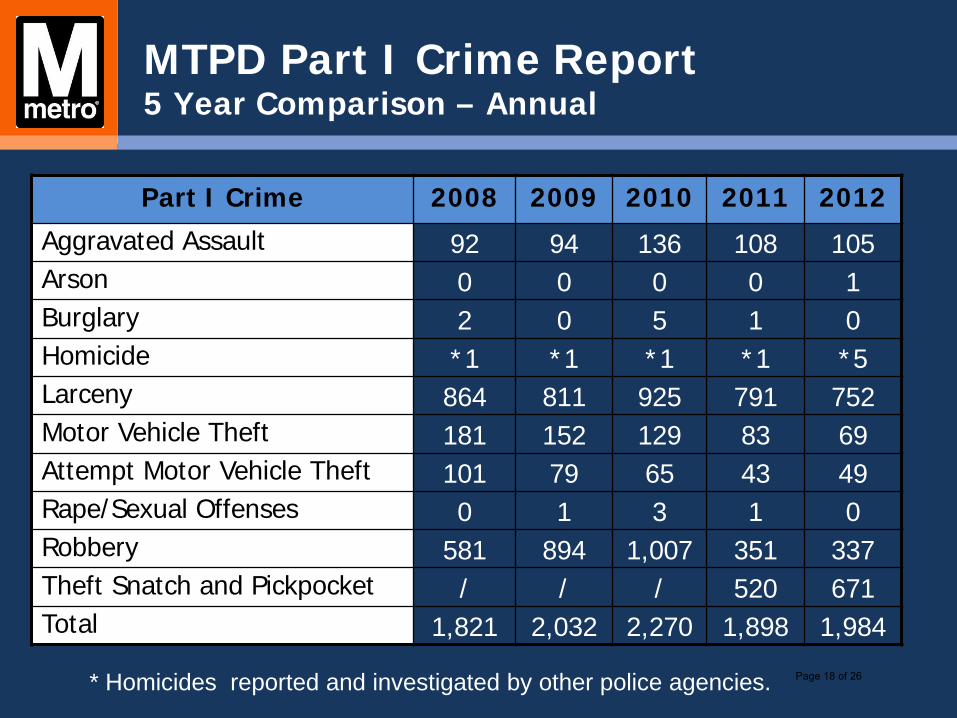
MTPD Part I Crime Report 5 Year Comparison – Annual
Part I Crime 2008 2009 2010 2011 2012
Aggravated Assault 92 94 136 108 105 Arson 0 0 0 0 1 Burglary 2 0 5 1 0 Homicide *1 *1 *1 *1 *5 Larceny 864 811 925 791 752 Motor Vehicle Theft 181 152 129 83 69 Attempt Motor Vehicle Theft 101 79 65 43 49 Rape/Sexual Offenses 0 1 3 1 0 Robbery 581 894 1,007 351 337 Theft Snatch and Pickpocket / / / 520 671 Total 1,821 2,032 2,270 1,898 1,984
* Homicides reported and investigated by other police agencies. Page 18 of 26

Top Ten Metrorail Stations - System Wide 2012 Part I Crime
Metrorail Station Total
Part I Crime Part I
Arrests
1. Anacostia 119 40 2. College Park 67 5 3. L’Enfant Plaza 59 21 4. Gallery Place 58 14 5. West Hyattsville 53 13 6. New Carrollton 52 6 7. Rhode Island Avenue 52 24 8. Largo Town Center 50 3 9. Minnesota Avenue 48 9 10.Metro Center 48 8
Page 19 of 26

Top Ten Metrorail Stations – District of Columbia 2012 Part I Crime
Metrorail Station Total Part I Crime
Part I Arrests
1. Anacostia 119 40 2. L’Enfant Plaza 59 21 3. Gallery Place 58 14 4. Rhode Island Avenue 52 24 5. Minnesota Avenue 48 9 6. Metro Center 48 8 7. Deanwood 43 2 8. Benning Road 41 23 9. Congress Heights 38 15 10. Takoma 34 9
Page 20 of 26

Top Ten Metrorail Stations - Maryland 2012 Part I Crime
Metrorail Station Total
Part I Crime Part I
Arrests
1. College Park 67 5 2. West Hyattsville 53 13 3. New Carrollton 52 6 4. Largo Town Center 50 3 5. Capitol Heights 40 4 6. Suitland 36 6 7. Addison Road 35 8 8. Prince George’s Plaza 35 2 9. Grosvenor 34 0 10. Southern Avenue 30 3 Page 21 of 26
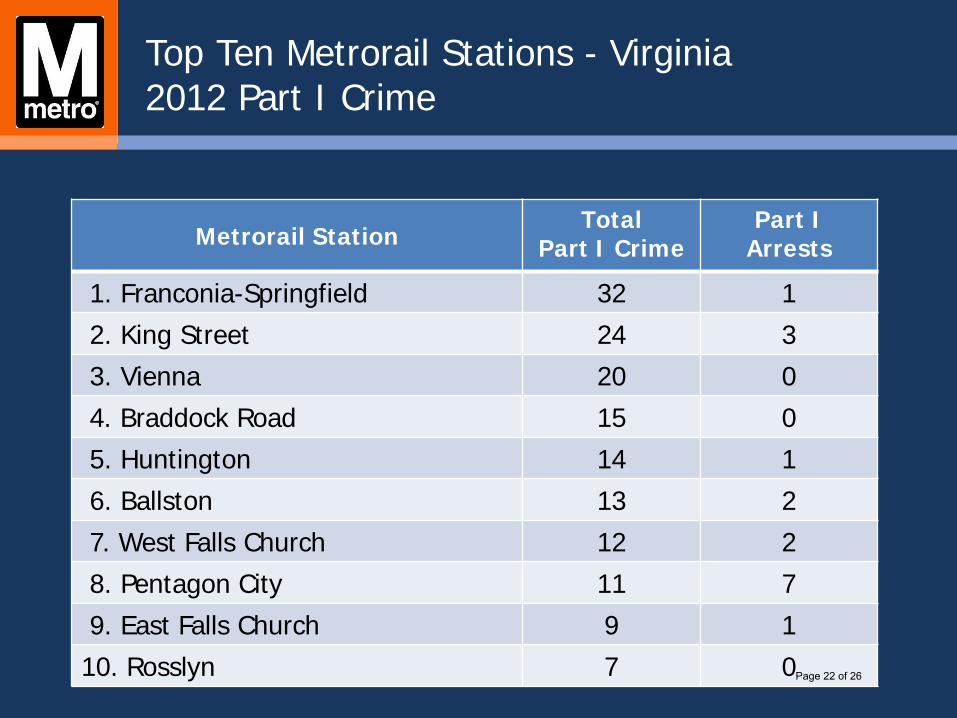
Top Ten Metrorail Stations - Virginia 2012 Part I Crime
Metrorail Station Total
Part I Crime Part I
Arrests
1. Franconia-Springfield 32 1 2. King Street 24 3 3. Vienna 20 0 4. Braddock Road 15 0 5. Huntington 14 1 6. Ballston 13 2 7. West Falls Church 12 2 8. Pentagon City 11 7 9. East Falls Church 9 1 10. Rosslyn 7 0 Page 22 of 26