washington, dc 20549 securities and … consolidated balance sheets as ... the rules and regulations...
TRANSCRIPT

UNITED STATESSECURITIES AND EXCHANGE COMMISSION
Washington, DC 20549
FORM 10-Q (Mark One) (X)Quarterly report pursuant to Section 13 or 15(d) of the Securities Exchange Act of 1934
For the quarterly period ended September 30, 2017 ( ) For the transition period from __________ to __________ Commission file number: 0-22773
NETSOL TECHNOLOGIES, INC.(Exact name of Registrant as specified in its charter)
NEVADA 95-4627685
(State or other Jurisdiction ofIncorporation or Organization)
(I.R.S. Employer NO.)
24025 Park Sorrento, Suite 410, Calabasas, CA 91302
(Address of principal executive offices) (Zip Code)
(818) 222-9195 / (818) 222-9197(Issuer’s telephone/facsimile numbers, including area code)
Indicate by check mark whether the issuer: (1) has filed all reports required to be filed by Section 13 or 15(d) of the Securities ExchangeAct of 1934 during the preceding 12 months (or for such shorter period that the issuer was required to file such reports), and (2) has beensubject to such filing requirements for the past 90 days.Yes [X] No [ ] Indicate by a check mark whether the registrant is a large accelerated filer, an accelerated filer, or a non-accelerated filer. See definition of“accelerated filer and large accelerated filer” in Rule 12b-2 of the Exchange Act. (Check One): Large Accelerated Filer [ ] Accelerated Filer [ ]Non-Accelerated Filer [ ] Small Reporting Company [X] Indicate by check mark whether the registrant is a shell company (as defined in Rule 12b-2 of the Exchange Act) Yes [ ] No [X] The issuer had 11,333,129 shares of its $.01 par value Common Stock and no Preferred Stock issued and outstanding as of November 6,2017.

NETSOL TECHNOLOGIES, INC. Page No.PART I. FINANCIAL INFORMATION Item 1. Financial Statements (Unaudited) 3
Condensed Consolidated Balance Sheets as of September 30, 2017 and June 30, 2017 3Condensed Consolidated Statements of Operations for the Three Months Ended September 30, 2017 and 2016 4Condensed Consolidated Statements of Comprehensive Income (Loss) for the Three Months Ended September 30, 2017 and2016
5
Condensed Consolidated Statements of Cash Flows for the Three Months Ended September 30, 2017 and 2016 6Notes to the Condensed Consolidated Financial Statements 8
Item 2. Management’s Discussion and Analysis of Financial Condition and Results of Operations 28Item 3. Quantitative and Qualitative Disclosures about Market Risk 39Item 4. Controls and Procedures 39 PART II. OTHER INFORMATION Item 1. Legal Proceedings 40Item 1A Risk Factors 40Item 2. Unregistered Sales of Equity and Use of Proceeds 40Item 3. Defaults Upon Senior Securities 40Item 4. Mine Safety Disclosures 40Item 5. Other Information 40Item 6. Exhibits 40 Page 2

PART I. FINANCIAL INFORMATIONItem 1. Financial Statements (Unaudited)
NETSOL TECHNOLOGIES, INC. AND SUBSIDIARIESCONDENSED CONSOLIDATED BALANCE SHEETS
(UNAUDITED)
As of September 30, As of June 30, 2017 2017
ASSETS Current assets:
Cash and cash equivalents $ 8,554,815 $ 14,172,954 Accounts receivable, net of allowance of $361,416 and $571,511 7,469,888 6,583,199 Accounts receivable, net - related party 2,611,562 1,644,942 Revenues in excess of billings 22,104,283 19,126,389 Revenues in excess of billings - related party 80,057 80,705 Convertible note receivable - related party 700,000 200,000 Other current assets 2,940,599 2,463,886
Total current assets 44,461,204 44,272,075 Restricted cash 90,000 90,000 Revenues in excess of billings, net - long term 5,225,260 5,173,538 Property and equipment, net 19,646,592 20,370,703 Other assets 3,400,418 3,211,295 Intangible assets, net 16,139,921 17,043,151 Goodwill 9,516,568 9,516,568
Total assets $ 98,479,963 $ 99,677,330
LIABILITIES AND STOCKHOLDERS’ EQUITY Current liabilities:
Accounts payable and accrued expenses $ 7,123,148 $ 6,880,194 Current portion of loans and obligations under capitalized leases 10,016,697 10,222,795 Unearned revenues 3,656,591 3,925,702 Common stock to be issued 88,324 88,324
Total current liabilities 20,884,760 21,117,015 Loans and obligations under capitalized leases; less current maturities 307,629 366,762
Total liabilities 21,192,389 21,483,777 Commitments and contingencies Stockholders’ equity:
Preferred stock, $.01 par value; 500,000 shares authorized; - - Common stock, $.01 par value; 14,500,000 shares authorized; 11,333,129 sharesissued and 11,186,570 outstanding as of September 30, 2017 and 11,225,385shares issued and 11,190,606 outstanding as of June 30, 2017 113,331 112,254 Additional paid-in-capital 124,987,029 124,409,998 Treasury stock (At cost, 146,559 shares and 34,779 shares as of September 30,2017 and June 30, 2017, respectively) (954,973) (454,310)Accumulated deficit (42,670,888) (42,301,390)Stock subscription receivable (273,926) (297,511)Other comprehensive loss (18,663,149) (18,074,570)
Total NetSol stockholders’ equity 62,537,424 63,394,471 Non-controlling interest 14,750,150 14,799,082
Total stockholders’ equity 77,287,574 78,193,553 Total liabilities and stockholders’ equity $ 98,479,963 $ 99,677,330
The accompanying notes are an integral part of these unaudited condensed consolidated financial statements.
Page 3

NETSOL TECHNOLOGIES, INC. AND SUBSIDIARIESCONDENSED CONSOLIDATED STATEMENTS OF OPERATIONS
(UNAUDITED) For the Three Months
Ended September 30, 2017 2016 Restated Net Revenues:
License fees $ 326,066 $ 5,453,795 Maintenance fees 3,473,725 3,523,797 Services 7,017,737 5,556,135 License fees - related party 44,408 246,957 Maintenance fees - related party 102,963 130,631 Services - related party 1,853,877 2,165,154
Total net revenues 12,818,776 17,076,469 Cost of revenues:
Salaries and consultants 5,464,160 5,893,349 Travel 513,112 711,895 Depreciation and amortization 1,173,113 1,330,872 Other 856,582 972,338
Total cost of revenues 8,006,967 8,908,454 Gross profit 4,811,809 8,168,015 Operating expenses:
Selling and marketing 1,711,296 2,344,038 Depreciation and amortization 245,873 269,097 General and administrative 3,787,558 4,619,196 Research and development cost 185,085 92,932
Total operating expenses 5,929,812 7,325,263 Income (loss) from operations (1,118,003) 842,752 Other income and (expenses)
Gain (loss) on sale of assets (7,130) (2,403)Interest expense (118,071) (54,475)Interest income 136,911 30,440 Gain (loss) on foreign currency exchange transactions 1,016,362 (414,896)Share of net loss from equity investment (67,562) - Other income (expense) 1,099 21,560
Total other income (expenses) 961,609 (419,774) Net income (loss) before income taxes (156,394) 422,978 Income tax provision (24,871) (39,875)Net income (loss) (181,265) 383,103
Non-controlling interest (188,233) (769,214)Net loss attributable to NetSol $ (369,498) $ (386,111) Net income (loss) per share:
Net loss per common share Basic $ (0.03) $ (0.04)Diluted $ (0.03) $ (0.04)
Weighted average number of shares outstanding
Basic 11,099,113 10,697,425 Diluted 11,099,113 10,697,425
The accompanying notes are an integral part of these unaudited condensed consolidated financial statements.
Page 4

NETSOL TECHNOLOGIES, INC. AND SUBSIDIARIESCONDENSED CONSOLIDATED STATEMENTS OF COMPREHENSIVE INCOME (LOSS)
(UNAUDITED)
For the Three Months Ended September 30, 2017 2016 Restated Net income (loss) $ (369,498) $ (386,111)Other comprehensive income (loss):
Translation adjustment (825,744) 1,094,074 Translation adjustment attributable to non-controlling interest 237,165 (323,713)Net translation adjustment (588,579) 770,361
Comprehensive income (loss) attributable to NetSol $ (958,077) $ 384,250
The accompanying notes are an integral part of these unaudited condensed consolidated financial statements.
Page 5

NETSOL TECHNOLOGIES, INC. AND SUBSIDIARIESCONDENSED CONSOLIDATED STATEMENTS OF CASH FLOWS
(UNAUDITED)
For the Three Months Ended September 30, 2017 2016 Restated Cash flows from operating activities:
Net income (loss) $ (181,265) $ 383,103 Adjustments to reconcile net income (loss) to net cash used in operating activities: Depreciation and amortization 1,418,986 1,599,969 Share of net loss from investment under equity method 67,562 - Loss on sale of assets 7,130 2,403 Stock issued for services 427,809 865,456 Fair market value of warrants and stock options granted - 21,804 Changes in operating assets and liabilities:
Accounts receivable (903,730) 2,336,894 Accounts receivable - related party (1,251,994) 121,800 Revenues in excess of billing (3,230,619) (4,821,828)Revenues in excess of billing - related party (130) 93,208 Other current assets (478,390) 306,339 Accounts payable and accrued expenses 243,144 (780,569)Unearned revenue (270,743) (346,108)
Net cash used in operating activities (4,152,240) (217,529)
Cash flows from investing activities:
Purchases of property and equipment (328,163) (554,873)Sales of property and equipment 116,023 151,818 Convertible note receivable - related party (500,000) - Investment in WRLD3D - (555,555)Net cash used in investing activities (712,140) (958,610)
Cash flows from financing activities:
Proceeds from the exercise of stock options and warrants 162,385 276,861 Proceeds from exercise of subsidiary options - 14,013 Purchase of treasury stock (500,663) - Payments on capital lease obligations and loans - net (148,707) (49,117)Net cash provided by (used in) financing activities (486,985) 241,757
Effect of exchange rate changes (266,774) 533,292 Net decrease in cash and cash equivalents (5,618,139) (401,090)Cash and cash equivalents, beginning of the period 14,172,954 11,557,527 Cash and cash equivalents, end of period $ 8,554,815 $ 11,156,437
The accompanying notes are an integral part of these unaudited condensed consolidated financial statements.
Page 6

NETSOL TECHNOLOGIES, INC. AND SUBSIDIARIESCONDENSED CONSOLIDATED STATEMENTS OF CASH FLOWS (CONTINUED)
(UNAUDITED)
For the Three Months Ended September 30,
2017 2016 SUPPLEMENTAL DISCLOSURES:
Cash paid during the period for: Interest $ 97,547 $ 83,672 Taxes $ 20,961 $ 17,351
NON-CASH INVESTING AND FINANCING ACTIVITIES:
Provided services for investment in WRLD3D $ 268,300 $ 248,658 Assets acquired under capital lease $ 41,695 $ -
The accompanying notes are an integral part of these unaudited condensed consolidated financial statements.
Page 7

NETSOL TECHNOLOGIES, INC.NOTES TO CONDENSED CONSOLIDATED FINANCIAL STATEMENTS
SEPTEMBER 30, 2017(UNAUDITED)
NOTE 1 - BASIS OF PRESENTATION AND PRINCIPLES OF CONSOLIDATION The Company designs, develops, markets, and exports proprietary software products to customers in the automobile financing and leasing,banking, and financial services industries worldwide. The Company also provides system integration, consulting, and IT products andservices in exchange for fees from customers. The consolidated condensed interim financial statements included herein have been prepared by the Company, without audit, pursuant tothe rules and regulations of the Securities and Exchange Commission. Certain information and footnote disclosures normally included infinancial statements prepared in accordance with generally accepted accounting principles have been condensed or omitted pursuant tosuch rules and regulations, although the Company believes that the disclosures are adequate to make the information presented notmisleading. The year-end condensed consolidated balance sheet data was derived from audited financial statements, but does not includeall disclosures required by accounting principles generally accepted in the United States of America. These statements reflect all adjustments, consisting of normal recurring adjustments, which, in the opinion of management, are necessaryfor fair presentation of the information contained therein. It is suggested that these condensed consolidated financial statements be read inconjunction with the financial statements and notes thereto included in the Company’s annual report on Form 10-K for the year ended June30, 2017. The Company follows the same accounting policies in preparation of interim reports. Results of operations for the interimperiods are not indicative of annual results. The accompanying condensed consolidated financial statements include the accounts of NetSol Technologies, Inc. and subsidiaries(collectively, the “Company”) as follows:
Wholly owned Subsidiaries NetSol Technologies Americas, Inc. (“NTA”) NetSol Connect (Private), Ltd. (“Connect”) NetSol Technologies Australia Pty Ltd. (“Australia”) NetSol Technologies Europe Limited (“NTE”) NTPK (Thailand) Co. Limited (“NTPK Thailand”) NetSol Technologies (Beijing) Co. Ltd. (“NetSol Beijing”) NetSol Technologies (GmbH) (“NTG”) Majority-owned Subsidiaries NetSol Technologies, Ltd. (“NetSol PK”) NetSol Innovation (Private) Limited (“NetSol Innovation”) NetSol Technologies Thailand Limited (“NetSol Thai”) Virtual Lease Services Holdings Limited (“VLSH”) Virtual Lease Services Limited (“VLS”) Virtual Lease Services (Ireland) Limited (“VLSIL”)
For comparative purposes, prior year’s condensed consolidated financial statements have been reclassified to conform to reportclassifications of the current period. Below is the table of reclassified amounts: Page 8

NETSOL TECHNOLOGIES, INC.NOTES TO CONDENSED CONSOLIDATED FINANCIAL STATEMENTS
SEPTEMBER 30, 2017(UNAUDITED)
For the Three Months
Ended September, 30 2016 Originally reported Reclassified
Net Revenues:
Services $ 5,806,717 $ 5,556,135 Services - related party 1,914,572 2,165,154
$ 7,721,289 $ 7,721,289 Operating expenses:
Selling and marketing $ 2,411,136 $ 2,344,038 General and administrative 4,552,098 4,619,196
$ 6,963,234 $ 6,963,234 OPERATING SEGMENTS Net income (loss) after taxes and before non-controlling interest:
Corporate headquarters $ (1,562,419) $ (1,629,517)Asia - Pacific 1,777,918 1,845,016
$ 215,499 $ 215,499 NOTE 2 – ACCOUNTING POLICIES Use of Estimates The preparation of consolidated financial statements in conformity with accounting principles generally accepted in the United States ofAmerica requires management to make estimates and assumptions that affect the reported amounts of assets and liabilities and disclosure ofcontingent assets and liabilities at the date of the financial statements and the reported amounts of revenues and expenses during thereporting period. The areas requiring significant estimates are provision for doubtful accounts, provision for taxation, useful life ofdepreciable assets, useful life of intangible assets, contingencies, and estimated contract costs. The estimates and underlying assumptionsare reviewed on an ongoing basis. Actual results could differ from those estimates. Concentration of Credit Risk Cash includes cash on hand and demand deposits in accounts maintained within the United States as well as in foreign countries. Certainfinancial instruments, which subject the Company to concentration of credit risk, consist of cash and restricted cash. The Companymaintains balances at financial institutions which, from time to time, may exceed Federal Deposit Insurance Corporation insured limits forthe banks located in the United States. Balances at financial institutions within certain foreign countries are not covered by insurance. As ofSeptember 30, 2017, and June 30, 2017, the Company had uninsured deposits related to cash deposits in accounts maintained within foreignentities of approximately $6,768,138 and $11,564,343, respectively. The Company has not experienced any losses in such accounts. The Company’s operations are carried out globally. Accordingly, the Company’s business, financial condition and results of operationsmay be influenced by the political, economic and legal environments of each country and by the general state of the country’s economy.The Company’s operations in each foreign country are subject to specific considerations and significant risks not typically associated withcompanies in economically developed nations. These include risks associated with, among others, the political, economic and legalenvironments and foreign currency exchange. The Company’s results may be adversely affected by changes in governmental policies withrespect to laws and regulations, anti-inflationary measures, currency conversion and remittance abroad, and rates and methods of taxation,among other things. Page 9

NETSOL TECHNOLOGIES, INC.NOTES TO CONDENSED CONSOLIDATED FINANCIAL STATEMENTS
SEPTEMBER 30, 2017(UNAUDITED)
Fair Value of Financial Instruments The Company applies the provisions of ASC 820-10, “Fair Value Measurements and Disclosures.” ASC 820-10 defines fair value, andestablishes a three-level valuation hierarchy for disclosures of fair value measurement that enhances disclosure requirements for fair valuemeasures. For certain financial instruments, including cash and cash equivalents, restricted cash, accounts receivable, accounts payable andshort-term debt, the carrying amounts approximate fair value due to their relatively short maturities. The carrying amounts of the long-termdebt approximate their fair values based on current interest rates for instruments with similar characteristics. The three levels of valuation hierarchy are defined as follows: Level 1: Valuations consist of unadjusted quoted prices in active markets for identical assets and liabilities and has the highest priority. Level 2: Valuations rely on quoted prices in markets that are not active or observable inputs over the full term of the asset or liability. Level 3: Valuations are based on prices or third party or internal valuation models that require inputs that are significant to the fair value
measurement and are less observable and thus have the lowest priority. The Company’s financial assets that are measured at fair value on a recurring basis as of September 30, 2017, are as follows: Level 1 Level 2 Level 3 Total Assets Revenue in excess of billing - long term $ - $ - $ 5,225,260 $ 5,225,260
Total $ - $ - $ 5,225,260 $ 5,225,260 The Company’s financial assets that were measured at fair value on a recurring basis as of June 30, 2017, were as follows: Level 1 Level 2 Level 3 Total Assets Revenue in excess of billing - long term $ - $ - $ 5,173,538 $ 5,173,538
Total $ - $ - $ 5,173,538 $ 5,173,538 The reconciliation from June 30, 2017 to September 30, 2017 is as follows:
Revenue in excess
of billing - long term Fair valuediscount Total
Balance at June 30, 2017 $ 5,483,869 $ (310,331) $ 5,173,538 Amortization during the period - 51,722 51,722 Balance at September 30, 2017 $ 5,483,869 $ (258,609) $ 5,225,260 The Company applied the discounted cash flow method to calculate the fair value and used NetSol PK’s weighted average borrowing rate,which was 3.96%. Management analyzes all financial instruments with features of both liabilities and equity under ASC 480, “Distinguishing Liabilities FromEquity” and ASC 815, “Derivatives and Hedging.” Derivative liabilities are adjusted to reflect fair value at each period end, with anyincrease or decrease in the fair value being recorded in results of operations as adjustments to fair value of derivatives. The effects ofinteractions between embedded derivatives are calculated and accounted for in arriving at the overall fair value of the financial instruments.In addition, the fair values of freestanding derivative instruments such as warrant and option derivatives are valued using the Black-Scholesmodel. Page 10

NETSOL TECHNOLOGIES, INC.NOTES TO CONDENSED CONSOLIDATED FINANCIAL STATEMENTS
SEPTEMBER 30, 2017(UNAUDITED)
New Accounting Pronouncements Recent Accounting Standards Adopted by the Company: In November 2015, the Financial Accounting Standards Board (FASB) issued ASU 2015-17, Balance Sheet Classification of DeferredTaxes (ASU 2015-17), which changes how deferred taxes are classified on the balance sheet and is effective for financial statements issuedfor annual periods beginning after December 15, 2016, with early adoption permitted. ASU 2015-17 requires all deferred tax assets andliabilities to be classified as non-current. The adoption of this guidance did not have a material impact on the Company’s results ofoperations, financial position or disclosures. In March 2016, the FASB issued ASU 2016-09, Improvements to Employee Share-Based Payment Accounting. The guidance simplifiesaccounting for share-based payments, most notably by requiring all excess tax benefits and tax deficiencies to be recorded as income taxbenefits or expense in the income statement and by allowing entities to recognize forfeitures of awards when they occur. This new guidanceis effective for annual reporting periods beginning after December 15, 2016 and may be adopted prospectively or retroactively. Theadoption of this guidance did not have a material impact on the Company’s results of operations, financial position or disclosures. Accounting Standards Recently Issued but Not Yet Adopted by the Company: In May 2014, the (“FASB”) issued Accounting Standards Update (“ASU”) 2014-09, Revenue from Contracts with Customers, whichprovides a single comprehensive model for entities to use in accounting for revenue arising from contracts with customers and willsupersede most current revenue recognition guidance. The standard’s core principle is that a company will recognize revenue when ittransfers promised goods or services to customers in an amount that reflects the consideration to which the company expects to be entitledin exchange for those goods or services. In August 2015, the FASB deferred the effective date of the new revenue standard by one year,which will make it effective for the Company in the first quarter of its fiscal year ending June 30, 2019. The Company is currently in theprocess of evaluating the impact of adoption of this ASU on its consolidated financial statements. In January 2016, the FASB issued ASU 2016-01, Recognition and Measurement of Financial Assets and Financial Liabilities (ASU 2016-01), which requires equity investments that are not accounted for under the equity method of accounting to be measured at fair value withchanges recognized in net income and updates certain presentation and disclosure requirements. ASU 2016-01 is effective beginning afterDecember 15, 2017. The adoption of this guidance is not expected to have a material impact on the Company’s results of operations,financial position or disclosures. In February 2016, the FASB issued ASU No. 2016-02, Leases, which requires lessees to recognize right-of-use assets and lease liabilities,for all leases, with the exception of short-term leases, at the commencement date of each lease. This ASU requires lessees to apply a dualapproach, classifying leases as either finance or operating leases based on the principle of whether or not the lease is effectively a financedpurchase by the lessee. This classification will determine whether lease expense is recognized based on an effective interest method or on astraight-line basis over the term of the lease. This ASU is effective for annual periods beginning after December 15, 2018 and interimperiods within those annual periods. Early adoption is permitted. The amendments of this update should be applied using a modifiedretrospective approach, which requires lessees and lessors to recognize and measure leases at the beginning of the earliest period presented.The Company is currently evaluating the impact of the adoption of this standard on its consolidated financial statements. In August 2016, the FASB issued ASU 2016-15, Clarification of Certain Cash Receipts and Cash Payments , which eliminates thediversity in practice related to the classification of certain cash receipts and payments in the statement of cash flows, by adding or clarifyingguidance on eight specific cash flow issues. This guidance is effective for fiscal years beginning after December 15, 2017, including interimperiods within those fiscal years, with early adoption permitted. The amendments in this update should be applied retrospectively to allperiods presented, unless deemed impracticable, in which case, prospective application is permitted. The adoption of this guidance is notexpected to have a material impact on the Company’s results of operations, financial position or disclosures. Page 11

NETSOL TECHNOLOGIES, INC.NOTES TO CONDENSED CONSOLIDATED FINANCIAL STATEMENTS
SEPTEMBER 30, 2017(UNAUDITED)
On November 17, 2016, the FASB issued Accounting Standards Update No. 2016-18, Statement of Cash Flows (Topic 230): RestrictedCash. It is intended to reduce diversity in the presentation of restricted cash and restricted cash equivalents in the statement of cash flows.The new standard requires that restricted cash and restricted cash equivalents be included as components of total cash and cash equivalentsas presented on the statement of cash flows. As a result, entities will no longer present transfers between cash and cash equivalents andrestricted cash and restricted cash equivalents in the statement of cash flows. ASU 2016-18 is effective for annual periods beginning afterDecember 15, 2017, including interim periods within those fiscal years. Earlier adoption is permitted. The Company maintains restrictedcash balances and will show restricted cash as part of cash and restricted cash equivalents in the statement of cash flows. In January 2017, the FASB issued ASU No. 2017-01, Clarifying the Definition of a Business, which clarifies and provides a more robustframework to use in determining when a set of assets and activities is a business. The amendments in this update should be appliedprospectively on or after the effective date. This update is effective for annual periods beginning after December 15, 2017, and interimperiods within those periods. Early adoption is permitted for acquisition or deconsolidation transactions occurring before the issuance dateor effective date and only when the transactions have not been reported in issued or made available for issuance financial statements. TheCompany does not expect the adoption to have any significant impact on its Consolidated Financial Statements. In January 2017, the FASB issued ASU No. 2017-04, Simplifying the Test for Goodwill Impairment . Under the new standard, goodwillimpairment would be measured as the amount by which a reporting unit’s carrying value exceeds its fair value, not to exceed the carryingvalue of goodwill. This ASU eliminates existing guidance that requires an entity to determine goodwill impairment by calculating theimplied fair value of goodwill by hypothetically assigning the fair value of a reporting unit to all of its assets and liabilities as if thatreporting unit had been acquired in a business combination. This update is effective for annual periods beginning after December 15, 2019,and interim periods within those periods. Early adoption is permitted for interim or annual goodwill impairment test performed on testingdates after January 1, 2017. The Company will apply this guidance to applicable impairment tests after the adoption date. In May 2017, the FASB issued ASU 2017-09, Compensation-Stock Compensation (Topic 718): Scope of Modification Accounting, whichclarifies when changes to the terms or conditions of a share-based payment award must be accounted for as modifications. The newguidance will reduce diversity in practice and result in fewer changes to the terms of an award being accounted for as a modification. Thestandard is effective for fiscal years beginning after December 15, 2017, including interim periods within those fiscal years. The newstandard will be effective prospectively for the Company for the fiscal year beginning July 1, 2018. Early adoption is permitted. TheCompany is currently evaluating the impact of the adoption of the new standard on its consolidated financial statements and relateddisclosures. In July 2017, the FASB issued ASU No. 2017-11, “Earnings Per Share (Topic 260); Distinguishing Liabilities from Equity (Topic 480);Derivatives and Hedging (Topic 815): (Part I) Accounting for Certain Financial Instruments with Down Round Features, (Part II)Replacement of the Indefinite Deferral for Mandatorily Redeemable Financial Instruments of Certain Nonpublic Entities and CertainMandatorily Redeemable Noncontrolling Interests with a Scope Exception”. The ASU was issued to address the complexity associatedwith applying generally accepted accounting principles (GAAP) for certain financial instruments with characteristics of liabilities andequity. The ASU, among other things, eliminates the need to consider the effects of down round features when analyzing convertible debt,warrants and other financing instruments. As a result, a freestanding equity-linked financial instrument (or embedded conversion option) nolonger would be accounted for as a derivative liability at fair value as a result of the existence of a down round feature. The amendmentsare effective for fiscal years beginning after December 15, 2018, and should be applied retrospectively. Early adoption is permitted,including adoption in an interim period. The Company does not expect the adoption to have any significant impact on its ConsolidatedFinancial Statements. The Company is currently in the process of evaluating the impact of the adoption of this standard on its consolidatedfinancial statements. All other newly issued accounting pronouncements not yet effective have been deemed either immaterial or not applicable. NOTE 3 – EARNINGS PER SHARE Basic earnings per share are computed based on the weighted average number of shares of common stock outstanding during the period.Diluted earnings per share is computed based on the weighted average number of shares of common stock plus the effect of dilutivepotential common shares outstanding during the period using the treasury stock method. Dilutive potential common shares includeoutstanding stock options, warrants, and stock awards. Page 12

NETSOL TECHNOLOGIES, INC.NOTES TO CONDENSED CONSOLIDATED FINANCIAL STATEMENTS
SEPTEMBER 30, 2017(UNAUDITED)
The following potential dilutive shares were excluded from the shares used to calculate diluted earnings per share as their inclusion wouldbe anti-dilutive. For the Three Months
Ended September 30, 2017 2016
Stock Options 438,360 610,133 Warrants - 11,075 Share Grants 348,228 670,346 786,588 1,291,554 NOTE 4 – OTHER COMPREHENSIVE INCOME AND FOREIGN CURRENCY: The accounts of NTE, VLSH and VLS use the British Pound; VLSIL and NTG use the Euro; NetSol PK, Connect, and NetSol Innovationuse the Pakistan Rupee; NTPK Thailand and NetSol Thai use the Thai Baht; Australia uses the Australian dollar; and NetSol Beijing usesthe Chinese Yuan as the functional currencies. NetSol Technologies, Inc., and its subsidiary, NTA, use the U.S. dollar as the functionalcurrency. Assets and liabilities are translated at the exchange rate on the balance sheet date, and operating results are translated at theaverage exchange rate throughout the period. Accumulated translation losses classified as an item of accumulated other comprehensive lossin the stockholders’ equity section of the consolidated balance sheet were $18,663,149 and $18,074,570 as of September 30, 2017 and June30, 2017, respectively. During the three months ended September 30, 2017 and 2016, comprehensive income (loss) in the consolidatedstatements of comprehensive income (loss) included a translation loss attributable to NetSol of $588,579 and translation income of$770,361, respectively. NOTE 5 – RELATED PARTY TRANSACTIONS NetSol-Innovation In November 2004, the Company entered into a joint venture with 1insurer, formerly Innovation Group, called NetSol-Innovation. NetSol-Innovation provides support services to 1insurer. During the three months ended September 30, 2017 and 2016, NetSol Innovation providedservices of $1,131,756 and $1,555,475, respectively. Accounts receivable at September 30, 2017 and June 30, 2017 were $2,212,132 and$1,462,078, respectively. Investec Asset Finance In October 2011, NTE entered into an agreement with Investec Asset Finance to acquire VLS. NTE and VLS provide support services toInvestec. During the three months ended September 30, 2017 and 2016, NTE and VLS provided license, maintenance and services of$601,192 and $736,685, respectively. Accounts receivable at September 30, 2017 and June 30, 2017 were $350,310 and $133,218,respectively. WRLD3D On May 31, 2017, Faizaan Ghauri, son of CEO Najeeb Ghauri, and an employee of the Company was appointed CEO of WRLD3D, Inc.(“WRLD3D”) a non-public company. On March 2, 2016, the Company purchased a 4.9% interest in WRLD3D for $1,111,111 and theCompany’s subsidiary NetSol PK purchased a 12.2% investment in WRLD3D for $2,777,778 which will be earned over future periods byproviding IT and enterprise software solutions. See Note 7 and Note 11. Page 13

NETSOL TECHNOLOGIES, INC.NOTES TO CONDENSED CONSOLIDATED FINANCIAL STATEMENTS
SEPTEMBER 30, 2017(UNAUDITED)
G-FORCE, Najeeb Ghauri, CEO and Chairman of the Board, and Naeem Ghauri, Director, have a financial interest in G-Force, LLC, which purchaseda 4.9% investment in WRLD3D, Inc. for $1,111,111. See Note 11 “Other Long-Term Assets” NOTE 6 – MAJOR CUSTOMERS The Company is a strategic business partner for Daimler Financial Services (which consists of a group of many companies in differentcountries), which accounts for approximately 32.98% and 41.11% of revenue, and 1insurer accounts for approximately 8.83% and 9.11% ofrevenue for the three months ended September 30, 2017 and 2016, respectively. The revenue from these two customers is shown in theAsia – Pacific segment. Accounts receivable at September 30, 2017 for these customers were $1,682,073 and $2,212,132, respectively.Accounts receivable at June 30, 2017 for these customers were $1,620,717 and $1,462,078, respectively. Revenue in excess of billing atSeptember 30, 2017 for these customers was $22,290,975 and $nil, respectively, which included $5,225,260 shown as long term. Revenuein excess of billing at June 30, 2017 for these customers was $18,579,540 and $nil, respectively, which included $5,173,538 shown as longterm. On December 21, 2015, the Company entered into a 10-year contract with Daimler Financial Services to provide license, maintenance andservices for 12 countries in the Asia Pacific Region. The implementation phase is expected to be over a five-year period with maintenanceand support over 10 years. The contract is a fixed fee arrangement with total license and maintenance fees of approximately €71,000,000(approximately $83,529,000) with services to be separately agreed upon and billed as they are performed. The customer will make fixedannual payments of €5,850,000 (approximately $6,882,000) for years 1-5 and €8,350,000 (approximately $9,824,000) for years 6-10. Underthe terms of the contract, the customer has the right to withdraw from certain modules and terminate the agreement as to certain countriesbased on good cause or business reasons prior to the beginning of implementation. NOTE 7 – CONVERTIBLE NOTE RECEIVABLE – RELATED PARTY The Company entered into an agreement with WRLD3D, whereby the Company was issued a Convertible Promissory Note (the“Convertible Note”) which was fully executed on May 25, 2017. The maximum principal amount of the Convertible Note is $750,000, andas of September 30, 2017, the Company had disbursed $700,000. The Convertible Note bears interest at 5% per annum and all unpaidinterest and principal is due and payable upon the Company’s request on or after February 1, 2018. The Convertible Note is convertible intoSeries BB Preferred shares at the lesser of (i) the price paid per share for the equity security by the investors in the qualified financing and(ii) $0.6788 per share (adjusted for any stock dividends, combinations, splits, recapitalizations or the like with respect to WRLD3D’s SeriesBB Preferred Stock after the date of the Convertible Note). The Convertible Note is convertible upon the occurrence of the followingevents: 1. Upon a qualified financing which is an equity financing of at least $2,000,000. 2. Optionally, upon an equity financing less than $2,000,000. 3. Optionally after the maturity date. 4. Upon a change of control. Subsequent to September 30, 2017, the Company loaned an additional $50,000 to WRLD3D pursuant to the Convertible Promissory Noteagreement. NOTE 8 - OTHER CURRENT ASSETS Other current assets consisted of the following: Page 14

NETSOL TECHNOLOGIES, INC.NOTES TO CONDENSED CONSOLIDATED FINANCIAL STATEMENTS
SEPTEMBER 30, 2017(UNAUDITED)
As of September 30, As of June 30,
2017 2017 Prepaid Expenses $ 725,959 $ 597,687 Advance Income Tax 1,101,323 1,052,935 Employee Advances 153,456 128,100 Security Deposits 88,173 103,255 Other Receivables 515,197 252,590 Other Assets 356,491 329,319
Total $ 2,940,599 $ 2,463,886 NOTE 9 – REVENUE IN EXCESS OF BILLINGS – LONG TERM Revenue in excess of billings, net consisted of the following: As of September 30, As of June 30,
2017 2017 Revenue in excess of billing - long term $ 5,483,869 $ 5,483,869 Present value discount (258,609) (310,331)
Net Balance $ 5,225,260 $ 5,173,538 Pursuant to revenue recognition for contract accounting, the Company has recorded revenue in excess of billings long-term for amountsbillable after one year. During the three months ended September 30, 2017, the Company accreted $51,722 which is recorded in interestincome for the period. The Company used the discounted cash flow method with an interest rate of 3.96%. NOTE 10 - PROPERTY AND EQUIPMENT Property and equipment consisted of the following: As of September 30, As of June 30,
2017 2017 Office Furniture and Equipment $ 3,882,351 $ 3,755,710 Computer Equipment 26,647,891 26,693,730 Assets Under Capital Leases 1,577,465 1,965,650 Building 9,164,885 9,243,866 Land 2,397,930 2,428,626 Autos 1,483,206 1,270,339 Improvements 587,033 592,652
Subtotal 45,740,761 45,950,573 Accumulated Depreciation (26,094,169) (25,579,870)Property and Equipment, Net $ 19,646,592 $ 20,370,703 For the three months ended September 30, 2017 and 2016, depreciation expense totaled $728,659 and $899,303, respectively. Of theseamounts, $482,786 and $630,206, respectively, are reflected in cost of revenues. Following is a summary of fixed assets held under capital leases as of September 30, 2017 and June 30, 2017: Page 15

NETSOL TECHNOLOGIES, INC.NOTES TO CONDENSED CONSOLIDATED FINANCIAL STATEMENTS
SEPTEMBER 30, 2017(UNAUDITED)
As of September 30, As of June 30,
2017 2017 Computers and Other Equipment $ 232,497 $ 309,863 Furniture and Fixtures 145,258 227,914 Vehicles 1,199,710 1,427,873
Total 1,577,465 1,965,650 Less: Accumulated Depreciation - Net (549,043) (711,622) $ 1,028,422 $ 1,254,028 NOTE 11 – OTHER LONG TERM ASSETS As of September 30, As of June 30,
2017 2017 Investment (1) $ 3,257,759 $ 3,057,020 Long Term Security Deposits 142,659 154,275
Total $ 3,400,418 $ 3,211,295
(1) Investment in WRLD3D On March 2, 2016, the Company purchased a 4.9% interest in WRLD3D, a non-public company, for $1,111,111. The Company paid$555,556 at the initial closing and $555,555 on September 1, 2016. NetSol PK, the subsidiary of the Company, purchased a 12.2%investment in WRLD3D, for $2,777,778 which will be earned over future periods by providing IT and enterprise software solutions. Per theagreement, NetSol PK is to provide a minimum of $200,000 of services in each three-month period and the entire balance is required to beprovided within three years of the date of the agreement. If NetSol PK fails to provide the future services, it may be required to forfeit theshares back to WRLD3D. As of September 30, the investment earned by NetSol PK is $2,214,209. In connection with the investment, the Company and NetSol PK received a warrant to purchase preferred stock of WRLD3D whichincluded the following key terms and features:
● The warrants are exercisable into shares of the “Next Round Preferred”, only if and when the Next Round Preferred is issued by
WRLD3D in a “Qualified Financing”. ● The warrants expire on March 2, 2020. ● “Next Round Preferred” is defined as occurring if WRLD3D’s preferred stock (or securities convertible into preferred stock) are
issued in a Qualified Financing that occurs after March 2, 2016. ● “Qualified Financing” is defined as financing with total proceeds of at least $2 million. ● The total number of common stock shares to be issued is equal to $1,250,000 divided by the per share price of the Next Round
Preferred. ● The exercise price of the warrants is equal to the greater of a) 70% of the per share price of the Next Round Preferred sold in a Qualified Financing, or b) 25,000,000 divided by the total number of shares of common stock outstanding immediately prior to the Qualified
Financing (on a fully-diluted basis, excluding the number of common stock shares issuable upon the exercise of anygiven warrant).
The Company had originally accounted for the investment under the cost method. On May 31, 2017, the Company determined that it metthe significant influence criteria since the newly appointed CEO of WRLD3D is the son of the CEO, Najeeb Ghauri, and also an employeeof the Company; therefore, the Company changed the accounting treatment from the cost method to the equity method. Page 16

NETSOL TECHNOLOGIES, INC.NOTES TO CONDENSED CONSOLIDATED FINANCIAL STATEMENTS
SEPTEMBER 30, 2017(UNAUDITED)
During the three months ended September 30, 2017 and 2016, NetSol PK provided services valued at $268,300 and $250,582, respectively,which is recorded as services-related party. These services are recorded as accounts receivable until approved by WRLD3D after which theshares are released from restriction. Accounts receivable at September 30, 2017 and June 30, 2017 were $49,120 and $49,646, respectively.Revenue in excess of billing at September 30, 2017 and June 30, 2017 were $80,057 and $80,705, respectively. During the three monthsended September 30, 2017 and 2016, NetSol PK services valued at $268,300 and $248,658, respectively, were released from restriction. NOTE 12 - INTANGIBLE ASSETS Intangible assets consisted of the following: As of September 30, As of June 30,
2017 2017 Product Licenses - Cost $ 47,244,997 $ 47,244,997 Effect of Translation Adjustment (3,501,449) (3,134,488)Accumulated Amortization (27,603,627) (27,067,358)
Net Balance $ 16,139,921 $ 17,043,151 (A) Product Licenses Product licenses include internally developed original license issues, renewals, enhancements, copyrights, trademarks, and trade names.Product licenses are amortized on a straight-line basis over their respective lives, and the unamortized amount of $16,139,921 will beamortized over the next 5.75 years. Amortization expense for the three months ended September 30, 2017 and 2016 was $690,327 and$700,666, respectively. (B) Future Amortization Estimated amortization expense of intangible assets over the next five years is as follows: Year ended: September 30, 2018 $ 2,743,467 September 30, 2019 2,743,467 September 30, 2020 2,743,467 September 30, 2021 2,743,467 September 30, 2022 2,743,467 Thereafter 2,422,586 $ 16,139,921 NOTE 13 - ACCOUNTS PAYABLE AND ACCRUED EXPENSES Accounts payable and accrued expenses consisted of the following: Page 17

NETSOL TECHNOLOGIES, INC.NOTES TO CONDENSED CONSOLIDATED FINANCIAL STATEMENTS
SEPTEMBER 30, 2017(UNAUDITED)
As of September 30, As of June 30,
2017 2017 Accounts Payable $ 1,466,806 $ 1,466,265 Accrued Liabilities 4,865,906 4,498,958 Accrued Payroll & Taxes 447,549 520,719 Taxes Payable 176,619 174,485 Other Payable 166,268 219,767
Total $ 7,123,148 $ 6,880,194 NOTE 14 – DEBTS Notes payable and capital leases consisted of the following:
As of September 30, 2017 Current Long-Term
Name Total Maturities Maturities
D&O Insurance (1) $ 31,153 $ 31,153 $ - Bank Overdraft Facility (2) 216,442 216,442 - Loan Payable Bank - Export Refinance (3) 4,716,090 4,716,090 - Loan Payable Bank - Export Refinance II (4) 3,301,265 3,301,265 - Loan Payable Bank - Running Finance (5) 1,414,827 1,414,827 - 9,679,777 9,679,777 - Subsidiary Capital Leases (6) 644,549 336,920 307,629
$ 10,324,326 $ 10,016,697 $ 307,629
As of June 30, 2017 Current Long-Term
Name Total Maturities Maturities
D&O Insurance (1) $ 87,485 $ 87,485 $ - Bank Overdraft Facility (2) 221,379 221,379 - Loan Payable Bank - Export Refinance (3) 4,776,461 4,776,461 - Loan Payable Bank - Export Refinance II (4) 1,910,585 1,910,585 - Loan Payable Bank - Running Finance (5) 2,865,877 2,865,877 - 9,861,787 9,861,787 - Subsidiary Capital Leases (6) 727,770 361,008 366,762
$ 10,589,557 $ 10,222,795 $ 366,762 (1) The Company finances Directors’ and Officers’ (“D&O”) liability insurance, Errors and Omissions (“E&O”) liability insurance andsome account payables, for which the D&O and E&O balances are renewed on an annual basis and, as such, are recorded in currentmaturities. The interest rate on these financings were ranging from 4.8% to 7.69% as of September 30, 2017 and June 30, 2017. (2) The Company’s subsidiary, NTE, has an overdraft facility with HSBC Bank plc whereby the bank would cover any overdrafts up to£300,000, or approximately $400,000. The annual interest rate was 4.75% as of September 30, 2017. Total outstanding balance as ofSeptember 30, 2017 was £162,332 or approximately $216,442. Interest expense for three months ended September 30, 2017 and 2016, was$2,054 and $Nil, respectively. Page 18
NETSOL TECHNOLOGIES, INC.NOTES TO CONDENSED CONSOLIDATED FINANCIAL STATEMENTS
SEPTEMBER 30, 2017(UNAUDITED)
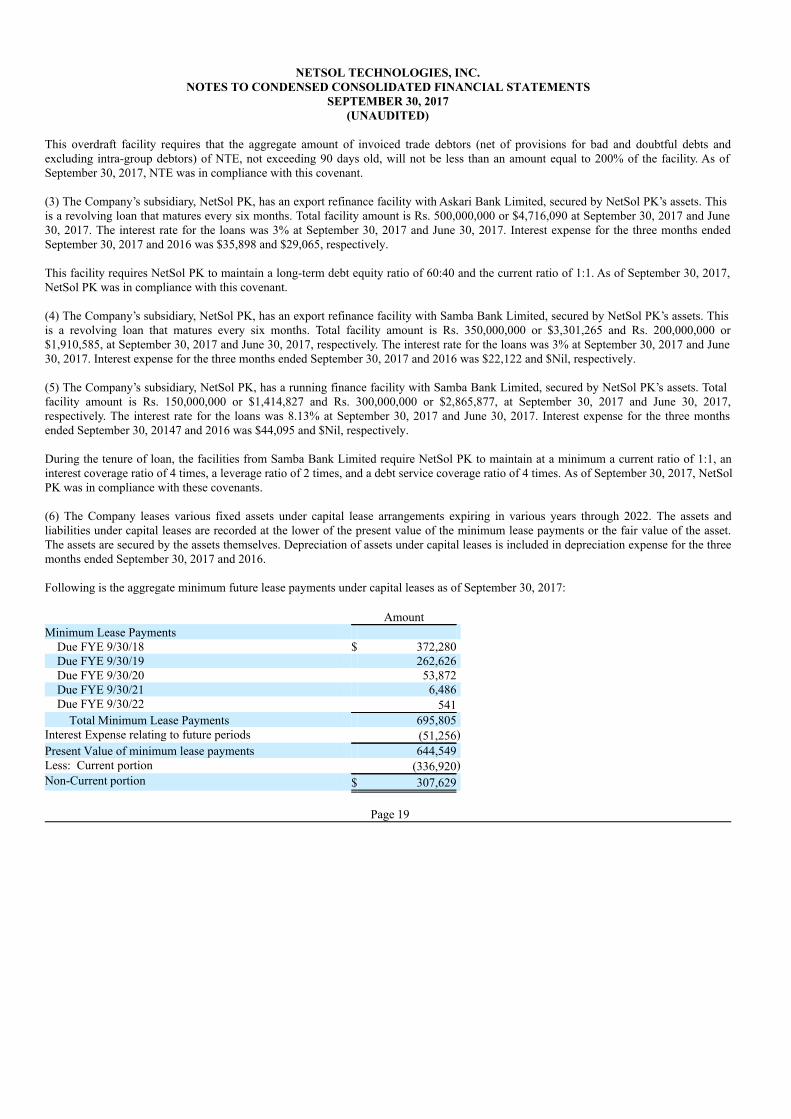
This overdraft facility requires that the aggregate amount of invoiced trade debtors (net of provisions for bad and doubtful debts andexcluding intra-group debtors) of NTE, not exceeding 90 days old, will not be less than an amount equal to 200% of the facility. As ofSeptember 30, 2017, NTE was in compliance with this covenant. (3) The Company’s subsidiary, NetSol PK, has an export refinance facility with Askari Bank Limited, secured by NetSol PK’s assets. Thisis a revolving loan that matures every six months. Total facility amount is Rs. 500,000,000 or $4,716,090 at September 30, 2017 and June30, 2017. The interest rate for the loans was 3% at September 30, 2017 and June 30, 2017. Interest expense for the three months endedSeptember 30, 2017 and 2016 was $35,898 and $29,065, respectively. This facility requires NetSol PK to maintain a long-term debt equity ratio of 60:40 and the current ratio of 1:1. As of September 30, 2017,NetSol PK was in compliance with this covenant. (4) The Company’s subsidiary, NetSol PK, has an export refinance facility with Samba Bank Limited, secured by NetSol PK’s assets. Thisis a revolving loan that matures every six months. Total facility amount is Rs. 350,000,000 or $3,301,265 and Rs. 200,000,000 or$1,910,585, at September 30, 2017 and June 30, 2017, respectively. The interest rate for the loans was 3% at September 30, 2017 and June30, 2017. Interest expense for the three months ended September 30, 2017 and 2016 was $22,122 and $Nil, respectively. (5) The Company’s subsidiary, NetSol PK, has a running finance facility with Samba Bank Limited, secured by NetSol PK’s assets. Totalfacility amount is Rs. 150,000,000 or $1,414,827 and Rs. 300,000,000 or $2,865,877, at September 30, 2017 and June 30, 2017,respectively. The interest rate for the loans was 8.13% at September 30, 2017 and June 30, 2017. Interest expense for the three monthsended September 30, 20147 and 2016 was $44,095 and $Nil, respectively. During the tenure of loan, the facilities from Samba Bank Limited require NetSol PK to maintain at a minimum a current ratio of 1:1, aninterest coverage ratio of 4 times, a leverage ratio of 2 times, and a debt service coverage ratio of 4 times. As of September 30, 2017, NetSolPK was in compliance with these covenants. (6) The Company leases various fixed assets under capital lease arrangements expiring in various years through 2022. The assets andliabilities under capital leases are recorded at the lower of the present value of the minimum lease payments or the fair value of the asset.The assets are secured by the assets themselves. Depreciation of assets under capital leases is included in depreciation expense for the threemonths ended September 30, 2017 and 2016. Following is the aggregate minimum future lease payments under capital leases as of September 30, 2017: Amount Minimum Lease Payments
Due FYE 9/30/18 $ 372,280 Due FYE 9/30/19 262,626 Due FYE 9/30/20 53,872 Due FYE 9/30/21 6,486 Due FYE 9/30/22 541
Total Minimum Lease Payments 695,805 Interest Expense relating to future periods (51,256)Present Value of minimum lease payments 644,549 Less: Current portion (336,920)Non-Current portion $ 307,629 Page 19

NETSOL TECHNOLOGIES, INC.NOTES TO CONDENSED CONSOLIDATED FINANCIAL STATEMENTS
SEPTEMBER 30, 2017(UNAUDITED)
NOTE 15 - STOCKHOLDERS’ EQUITY During the three months ended September 30, 2017, the Company issued 13,068 shares of common stock for services rendered by officersof the Company. These shares were valued at the fair market value of $81,675. During the three months ended September 30, 2017, the Company issued 9,699 shares of common stock for services rendered by theindependent members of the Board of Directors as part of their board compensation. These shares were valued at the fair market value of$55,080. During the three months ended September 30, 2017, the Company issued 49,204 shares of its common stock to employees pursuant to theterms of their employment agreements valued at $302,553. During the three months ended September 30, 2017, the Company collected subscription receivable of $23,585 related to the exercise ofstock options in previous years. During the three months ended September 30, 2017, the Company received $138,800 pursuant to a stock option agreement for the exerciseof 35,773 shares of common stock at price of $3.88 per share. During the three months ended September 30, 2017, the Company purchased 111,780 of shares of its common stock from open market atan average price of $4.48 per share. NOTE 16 - INCENTIVE AND NON-STATUTORY STOCK OPTION PLAN Common stock purchase options and warrants consisted of the following: OPTIONS:
# of shares Weighted Ave Exercise Price
WeightedAverage
RemainingContractual
Life (in years) Aggregated
Intrinsic Value Outstanding and exercisable, June 30, 2016 610,133 $ 4.90 0.99 $ 799,030
Granted 79,838 $ 4.53 Exercised (84,838) $ 4.49 Expired / Cancelled (130,000) $ 7.50
Outstanding and exercisable, June 30, 2017 475,133 $ 4.20 1.05 $ 8,413 Granted - - Exercised (35,773) $ 3.88 Expired / Cancelled (1,000) $ 16.00
Outstanding and exercisable, September 30, 2017 438,360 $ 4.20 0.81 $ - The following table summarizes information about stock options and warrants outstanding and exercisable at September 30, 2017. Page 20

NETSOL TECHNOLOGIES, INC.NOTES TO CONDENSED CONSOLIDATED FINANCIAL STATEMENTS
SEPTEMBER 30, 2017(UNAUDITED)
Exercise Price
NumberOutstanding and
Exercisable
WeightedAverage
RemainingContractual Life
WeightedAve Exercise
Price OPTIONS:
$ 3.88 384,898 0.74 $ 3.88 $ 6.50 53,462 1.35 $ 6.50 Totals 438,360 0.81 $ 4.20 The following table summarizes stock grants awarded as compensation:
# of shares
WeightedAverage Grant
Date Fair Value($)
Unvested, June 30, 2016 630,228 $ 6.07
Granted 222,146 $ 5.92 Forfeited / Cancelled (5,000) $ 5.55 Vested (427,175) $ 5.90
Unvested, June 30, 2017 420,199 $ 6.07 Vested (71,971) $ 5.90
Unvested, September 30, 2017 348,228 $ 6.16 For the three months ended September 30, 2017 and 2016, the Company recorded compensation expense of $427,809 and $865,456,respectively. The compensation expense related to the unvested stock grants as of September 30, 2017 was $2,137,629 which will berecognized during the fiscal years 2018 through 2022. NOTE 17 – CONTINGENCIES On April 7, 2017, Conister Bank Limited filed a complaint in the High Court of Justice Chancery Division, as claim no. HC-2017-001045against our subsidiary, Virtual Lease Services Limited (“VLS”). The complaint alleges that VLS was in willful default of their agreementswith Conister Bank Limited by failing to fulfill its obligations under the agreements with Conister. The complaint alleges damages in excessof £200,000 (approximately $266,667). VLS has responded to the complaint and its expenses are currently covered by available insurance.VLS denies all claims and intends to vigorously defend the action. NOTE 18 – OPERATING SEGMENTS The Company has identified three segments for its products and services; North America, Europe and Asia-Pacific. Our reportablesegments are business units located in different global regions. Each business unit provides similar products and services; license fees forleasing and asset-based software, related maintenance fees, and implementation and IT consulting services. Separate management of eachsegment is required because each business unit is subject to different operational issues and strategies due to their particular regionallocation. The Company accounts for intra-company sales and expenses as if the sales or expenses were to third parties and eliminates themin the consolidation. Page 21

NETSOL TECHNOLOGIES, INC.NOTES TO CONDENSED CONSOLIDATED FINANCIAL STATEMENTS
SEPTEMBER 30, 2017(UNAUDITED)
The following table presents a summary of identifiable assets as of September 30, 2017 and June 30, 2017:
As of September 30, As of June 30, 2017 2017
Identifiable assets: Corporate headquarters $ 3,398,876 $ 2,922,514 North America 5,736,535 6,717,366 Europe 5,922,323 6,056,514 Asia - Pacific 83,422,229 83,980,936 Consolidated $ 98,479,963 $ 99,677,330
The following table presents a summary of investment under equity method as of September 30, 2017 and June 30, 2017:
As of September 30, As of June 30, 2017 2017
Investment in WRLD3D: Corporate headquarters $ 1,091,752 $ 1,111,111 Asia - Pacific 2,166,007 1,945,909
Consolidated $ 3,257,759 $ 3,057,020 The following table presents a summary of operating information for the three months ended September 30:
For the Three Months Ended September 30, 2017 2016 Restated
Revenues from unaffiliated customers: North America $ 848,072 $ 1,841,431 Europe 1,447,824 1,206,049 Asia - Pacific 8,789,932 11,736,829
11,085,828 14,784,309 Revenue from affiliated customers
Europe 601,192 736,685 Asia - Pacific 1,131,756 1,555,475
1,732,948 2,292,160 Consolidated $ 12,818,776 $ 17,076,469
Intercompany revenue
Europe $ 102,475 $ 136,127 Asia - Pacific 376,937 459,951
Eliminated $ 479,412 $ 596,078 Net income (loss) after taxes and before non-controlling interest:
Corporate headquarters $ (1,037,924) $ (1,629,517)North America (295,646) 267,892 Europe 99,390 (100,288)Asia - Pacific 1,052,915 1,845,016
Consolidated $ (181,265) $ 383,103 Page 22

NETSOL TECHNOLOGIES, INC.NOTES TO CONDENSED CONSOLIDATED FINANCIAL STATEMENTS
SEPTEMBER 30, 2017(UNAUDITED)
The following table presents a summary of capital expenditures for the three months ended September 30:
For the Three Months Ended September 30, 2017 2016
Capital expenditures: North America $ - $ 4,103 Europe 76,809 195,180 Asia - Pacific 251,354 355,590
Consolidated $ 328,163 $ 554,873 NOTE 19 – NON-CONTROLLING INTEREST IN SUBSIDIARY The Company had non-controlling interests in several of its subsidiaries. The balance of non-controlling interest was as follows:
SUBSIDIARY Non-Controlling
Interest %
Non-ControllingInterest at
September 30, 2017 NetSol PK 33.80% $ 12,708,487 NetSol-Innovation 49.90% 1,734,427 VLS, VLSH & VLSIL Combined 49.00% 307,320 NetSol Thai 0.006% (84)Total $ 14,750,150
SUBSIDIARY Non-Controlling
Interest %
Non-ControllingInterest at
June 30, 2017 NetSol PK 33.80% $ 12,887,938 NetSol-Innovation 49.90% 1,599,734 VLS, VLHS & VLSIL Combined 49.00% 311,502 NetSol Thai 0.006% (92)Total $ 14,799,082 NOTE 20 – RESTATEMENT OF PREVIOUSLY ISSUED FINANCIAL STATEMENTS During the preparation of the Company’s Form 10-Q for the nine months ended March 31, 2017, misstatements were identified in theprevious financial statements relating to the recording of revenue in the proper period. The restated financial statements for the periodsaffected were disclosed in Note 19 of the Notes to Condensed Consolidated Financial Statement contained in the Company’s Form 10-Qfor the nine months ended March 31, 2017. On December 21, 2015, the Company signed a 10-year contract for a 12-country installation of its NFS Ascent product which included aperpetual license, continued maintenance on the existing product and then maintenance on NFS Ascent upon installation. The Company didnot appropriately apply the percentage-of-completion method for this arrangement in accordance with ASC 605-35. As a result, for quarterended September 30, 2016, license revenue was understated by $1,953,935 and for the quarter ended December 31, 2016, license revenuewas overstated by $1,580,529. Page 23

NETSOL TECHNOLOGIES, INC.NOTES TO CONDENSED CONSOLIDATED FINANCIAL STATEMENTS
SEPTEMBER 30, 2017(UNAUDITED)
The Company charges maintenance revenue on the license value plus any additional customization that the customer may require. For onecustomer, the Company did not increase the maintenance fee for the additional customization that was performed during the year. Thisresulted in an understatement of maintenance revenue of $120,976 for the quarter ended September 30, 2016 and an overstatement ofmaintenance revenue of $198,797 for the quarter ended December 31, 2016. The following tables present the restated financial statements for the quarter ended September 30, 2016.
Balance Sheet
As of September 30, 2016
As Originally
Presented Amount of Restatement As Restated ASSETS
Current assets: Cash and cash equivalents $ 11,156,437 $ 11,156,437 Accounts receivable, net of allowance of $500,853 and $492,498 7,142,255 7,142,255 Accounts receivable, net - related party 5,384,573 5,384,573 Revenues in excess of billings 13,358,858 2,074,911 15,433,769 Revenues in excess of billings - related party 682,049 682,049 Other current assets 3,192,425 3,192,425
Total current assets 40,916,597 2,074,911 42,991,508 Restricted cash 90,000 90,000 Property and equipment, net 22,612,752 22,612,752 Other assets 1,604,731 1,604,731 Intangible assets, net 19,326,259 19,326,259 Goodwill 9,516,568 9,516,568
Total assets $ 94,066,907 $ 2,074,911 $ 96,141,818
LIABILITIES AND STOCKHOLDERS’ EQUITY Current liabilities:
Accounts payable and accrued expenses $ 6,389,128 $ 6,389,128 Current portion of loans and obligations under capitalized leases 4,408,173 4,408,173 Unearned revenues 4,419,692 4,419,692 Common stock to be issued 88,324 88,324
Total current liabilities 15,305,317 - 15,305,317 Long term loans and obligations under capitalized leases; lesscurrent maturities 539,859 539,859
Total liabilities 15,845,176 - 15,845,176 Commitments and contingencies Stockholders’ equity:
Preferred stock, $.01 par value; 500,000 shares authorized; - - - Common stock, $.01 par value; 14,500,000 shares authorized;10,882,281 shares issued and 10,855,002 outstanding as ofSeptember 30, 2016 and 10,713,372 shares issued and 10,686,093outstanding as of June 30, 2016 108,823 108,823 Additional paid-in-capital 122,367,231 122,367,231 Treasury stock (27,279 shares) (415,425) (415,425)Accumulated deficit (39,089,079) 1,379,608 (37,709,471)Stock subscription receivable (602,811) (602,811)Other comprehensive loss (17,960,133) (17,960,133)
Total NetSol stockholders’ equity 64,408,606 1,379,608 65,788,214 Non-controlling interest 13,813,125 695,303 14,508,428
Total stockholders’ equity 78,221,731 2,074,911 80,296,642 Total liabilities and stockholders’ equity $ 94,066,907 $ 2,074,911 $ 96,141,818
Page 24

NETSOL TECHNOLOGIES, INC.NOTES TO CONDENSED CONSOLIDATED FINANCIAL STATEMENTS
SEPTEMBER 30, 2017(UNAUDITED)
For the Three Months Ended September 30, 2016 As Originally Amount of Presented Restatement As Restated
Net Revenues: License fees $ 3,499,860 $ 1,953,935 $ 5,453,795 Maintenance fees 3,402,821 120,976 3,523,797 Services 5,806,717 5,806,717 License fees - related party 246,957 246,957 Maintenance fees - related party 130,631 130,631 Services - related party 1,914,572 1,914,572
Total net revenues 15,001,558 2,074,911 17,076,469 Cost of revenues:
Salaries and consultants 5,893,349 5,893,349 Travel 711,895 711,895 Depreciation and amortization 1,330,872 1,330,872 Other 972,338 972,338
Total cost of revenues 8,908,454 - 8,908,454 Gross profit 6,093,104 2,074,911 8,168,015 Operating expenses:
Selling and marketing 2,411,136 2,411,136 Depreciation and amortization 269,097 269,097 General and administrative 4,552,098 4,552,098 Research and development cost 92,932 92,932
Total operating expenses 7,325,263 - 7,325,263 Income (loss) from operations (1,232,159) 2,074,911 842,752 Other income and (expenses)
Loss on sale of assets (2,403) (2,403)Interest expense (54,475) (54,475)Interest income 30,440 30,440 Loss on foreign currency exchange transactions (414,896) (414,896)Other income 21,560 21,560
Total other income (expenses) (419,774) - (419,774) Net income (loss) before income taxes (1,651,933) 2,074,911 422,978 Income tax provision (39,875) (39,875)Net income (loss) (1,691,808) 2,074,911 383,103
Non-controlling interest (73,911) (695,303) (769,214)Net income (loss) attributable to NetSol $ (1,765,719) $ 1,379,608 $ (386,111) Net Income (loss) per share:
Net income (loss) per common share Basic $ (0.17) $ 0.14 $ (0.04)Diluted $ (0.17) $ 0.14 $ (0.04)
Weighted average number of shares outstanding
Basic 10,697,425 10,697,425 10,697,425 Diluted 10,697,425 10,697,425 10,697,425
Page 25

NETSOL TECHNOLOGIES, INC.NOTES TO CONDENSED CONSOLIDATED FINANCIAL STATEMENTS
SEPTEMBER 30, 2017(UNAUDITED)
For the Three Months Ended September 30, 2016 As Originally Amount of Presented Restatement As Restated
Net income (loss) $ (1,765,719) $ 1,379,608 $ (386,111)Other comprehensive income (loss):
Translation adjustment 1,094,074 - 1,094,074 Comprehensive income (loss) (671,645) 1,379,608 707,963
Comprehensive income (loss) attributable to non-controllinginterest 323,713 - 323,713
Comprehensive income (loss) attributable to NetSol $ (995,358) $ 1,379,608 $ 384,250 Page 26

NETSOL TECHNOLOGIES, INC.NOTES TO CONDENSED CONSOLIDATED FINANCIAL STATEMENTS
SEPTEMBER 30, 2017(UNAUDITED)
For the Three Months Ended September 30, 2016 As Originally Amount of Presented Restatement As Restated Cash flows from operating activities:
Net income (loss) $ (1,691,808) $ 2,074,911 $ 383,103 Adjustments to reconcile net income (loss) to net cash used in operatingactivities: Depreciation and amortization 1,599,969 1,599,969 Loss on sale of assets 2,403 2,403 Stock issued for services 865,456 865,456 Fair market value of warrants and stock options granted 21,804 21,804 Changes in operating assets and liabilities:
Accounts receivable 2,336,894 2,336,894 Accounts receivable - related party 121,800 121,800 Revenues in excess of billing (2,746,917) (2,074,911) (4,821,828)Revenues in excess of billing - related party 93,208 93,208 Other current assets 306,339 306,339 Accounts payable and accrued expenses (780,569) (780,569)Unearned revenue (346,108) (346,108)
Net cash used in operating activities (217,529) - (217,529) Cash flows from investing activities:
Purchases of property and equipment (554,873) (554,873)Sales of property and equipment 151,818 151,818 Investment (555,555) (555,555)Net cash used in investing activities (958,610) - (958,610)
Cash flows from financing activities:
Proceeds from the exercise of stock options and warrants 276,861 276,861 Proceeds from exercise of subsidiary options 14,013 14,013 Payments on capital lease obligations and loans - net (49,117) (49,117)Net cash provided by financing activities 241,757 - 241,757
Effect of exchange rate changes 533,292 533,292 Net decrease in cash and cash equivalents (401,090) - (401,090)Cash and cash equivalents, beginning of the period 11,557,527 11,557,527 Cash and cash equivalents, end of period $ 11,156,437 $ - $ 11,156,437 NOTE 21 - SUBSEQUENT EVENTS Subsequent to September 30, 2017, the Company loaned an additional $50,000 to WRLD3D pursuant to the Convertible Promissory Noteagreement. (See Note 7) Pursuant to the Company’s stock buyback plan, the Company repurchased 27,495 shares of our common stock from the open market at anaverage price of $3.65 per share. Total shares purchased on this buyback plan to date is 139,275 at an average price of $4.30 per share. Page 27

Item 2. Management’s Discussion and Analysis of Financial Condition and Results of Operations The following discussion is intended to assist in an understanding of the Company’s financial position and results of operations for thethree months ended September 30, 2017. The following discussion should be read in conjunction with the information included within ourAnnual Report on Form 10-K for the year ended June 30, 2017, and the Condensed Consolidated Financial Statements and notes theretoincluded elsewhere in this Quarterly Report on Form 10-Q. Forward-Looking Information This report contains certain forward-looking statements and information relating to the Company that is based on the beliefs of itsmanagement as well as assumptions made by and information currently available to its management. When used in this report, the words“anticipate”, “believe”, “estimate”, “expect”, “intend”, “plan”, and similar expressions as they relate to the Company or itsmanagement, are intended to identify forward-looking statements. These statements reflect management’s current view of the Companywith respect to future events and are subject to certain risks, uncertainties and assumptions. Should any of these risks or uncertaintiesmaterialize, or should underlying assumptions prove incorrect, actual results may vary materially from those described in this report asanticipated, estimated or expected. The Company’s realization of its business aims could be materially and adversely affected by anytechnical or other problems in, or difficulties with, planned funding and technologies, third party technologies which render theCompany’s technologies obsolete, the unavailability of required third party technology licenses on commercially reasonable terms, the lossof key research and development personnel, the inability or failure to recruit and retain qualified research and development personnel, orthe adoption of technology standards which are different from technologies around which the Company’s business ultimately is built. TheCompany does not intend to update these forward-looking statements. Business Overview NetSol Technologies, Inc. (NasdaqCM: NTWK) is a worldwide provider of IT and enterprise software solutions. We believe that oursolutions constitute mission critical applications for clients, as they encapsulate end-to-end business processes, facilitating faster processingand increased transactions. The Company’s primary source of revenue is the licensing, customization, enhancement and maintenance of its suite of financialapplications under the brand name NFS™ (NetSol Financial Suite) and NFS AscentTM for leading businesses in the global lease andfinance industry. NetSol’s clients include Dow-Jones 30 Industrials and Fortune 500 manufacturers and financial institutions, global vehicle manufacturers,and enterprise technology providers, all of which are serviced by NetSol delivery locations around the globe. Founded in 1997, NetSol is headquartered in Calabasas, California. While the Company follows a global strategy for sales and delivery ofits portfolio of solutions and services, it continues to maintain regional offices in the following locations: ● North America Los Angeles Area ● Europe London Metropolitan area ● Asia Pacific Lahore, Karachi, Bangkok, Beijing, Jakarta and
Sydney The Company continues to maintain services, solutions and/or sales specific offices in the USA, England, Pakistan, Thailand, China,Indonesia and Australia. NetSol’s offerings include its flagship global solution, NFS™. A robust suite of five software applications, it is an end-to-end solution forthe lease and finance industry covering the complete leasing and financing cycle, starting from quotation origination through end of contracttransactions. The five software applications under NFS™ have been designed and developed for a highly flexible setting and are capable ofdealing with multinational, multi-company, multi-asset, multi-lingual, multi-distributor and multi-manufacturer environments. Eachapplication is a complete system in itself and can be used independently to address specific sub-domains of the leasing/financing cycle.When used together, they fully automate the entire leasing/financing cycle for any size company, including those with multi-billion dollarportfolios. Page 28

NFS Ascent™ NFS Ascent™ is the Company’s next-generation platform, offering a technologically advanced solution for the auto and equipment financeand leasing industry. NFS Ascent’s™ architecture and user interfaces were designed based on the Company’s collective experience withglobal Fortune 500 companies over the past 30 years. The platform’s framework allows auto captive and asset finance companies to rapidlytransform legacy driven technology into a state-of-the-art IT and business process environment. At the core of the NFS Ascent™ platformis a lease accounting and contract processing engine, which allows for an array of interest calculation methods, as well as robust accountingof multibillion dollar lease portfolios under various generally accepted accounting principles (GAAP), as well as international financialreporting standards (IFRS). NFS Ascent™, with its distributed and clustered deployment across parallel application and high-volume dataservers, enables finance companies to process voluminous data in a hyper speed environment. NFS Ascent™ has been developed using thelatest tools and technologies and its n-tier SOA architecture allows the system to greatly improve a myriad of areas including, but notlimited to, scalability, performance, fault tolerance and security. NFS Digital NetSol launched NFS digital in 2014. It enables a sales force for the finance and leasing company across different channels such as point ofsale, field investigation and auditing, and allows end customers to access their contract details through a self-service mobile application.NFS digital includes mAccount, mPOS, mDealer, mAuditor, and Mobile Field Investigator (mFI). LeasePak In North America, NTA has and continues to develop the LeasePak CMS product. LeasePak streamlines the lease management lifecycle,enabling superior lease and loan portfolio management, flexible financial products (lease or loan terms) and sophisticated financial analysisand management to reducing operating costs and improve profits. It is scalable from a basic offering to a collection of highly specializedadd on modules for systems, portfolios and accrual methods for virtually all sizes and varying complexity of operations. It is part of thevehicle leasing infrastructure at leading Fortune 500 banks and manufacturers, as well as for some of the industry’s leading independentlessors. It handles every aspect of the lease or loan lifecycle, including credit application origination, credit adjudication, pricing,documentation, booking, payments, customer service, collections, midterm adjustments, and end-of-term options and asset disposition. It isalso integrated with important partners in the asset-finance ecosystem, such as Vertex Series O.
LeasePak-SaaS NTA also offers the LeasePak Software-as-a-Service (“SaaS”) business line, which provides high performance with a reduced total cost ofownership. SaaS offers a proven deployment option whereby customers only require access to the internet to use the software. With anelastic cloud price, revenue stream predictability and improved return on investment for customers, management believes that its SaaScustomers will experience the performance, the reliability and the speed usually associated with a highly scalable private cloud. LeasePak-SaaS targets small and mid-sized leasing and finance companies. LeaseSoft In addition to offering NFS Ascent™ to the European market, NTE has some regional offerings, including LeaseSoft and LoanSoft.LeaseSoft is a full lifecycle lease and finance system aimed predominantly at the UK funder market, including modules to support webportals and an electronic data interchange manager to facilitate integration between funders and introducers. LoanSoft is similar toLeaseSoft, but optimized for the consumer loan market. Highlights Listed below are a few of NetSol’s major successes achieved in the three months ended September 30, 2017: ● We amended the 12 county NFS Ascent™ contract securing 7.7 million Euros (approximately $9.06 million) in future revenues in
addition to what was previously projected from the customer. The revenue will be recognized over the contract term as the supportservices are performed.
● Pursuant to the 12 country NFS Ascent™ contract, we successfully implemented the Loan Origination System and the WholesaleFinancial System in Thailand and Korea, respectively.
● Pursuant to the 12 country NFS Ascent™ contract, we delivered the first major release of NFS Ascent™ to China. Page 29

● An increase in software modification requests from some of our existing customers spread across the various regions contributed
reasonably to the revenues for the quarter. A trend which is believed will be continued in the following quarters. ● We signed a chargeable proof of concept agreement with one of the oldest and largest banks in Australia. The proof of concept
project will add to our revenues and assist us in making further progress in the selection process for our NFS Ascent™ product. ● Mizhou Balimore, a Japanese bank in Indonesia, went live with the first phase of its NFS Ascent™ digital solution. ● Our existing customer, an auto finance company of a leading bank in Indonesia, kicked off its leasing project. We believe that this
is likely to help increase revenues in the following quarters of the current fiscal year. This kick off has further strengthened ourrelationship with this Indonesian business partner paving the way for further success in the market. Additionally, all the branchesof the same business partner successfully went live with NFS Ascent™ during the first quarter of the current fiscal yearculminating into a maturing and long-standing delivery commitment.
● NFS Ascent™ and Ascent Digital continue to generate interest across all major regions and industries as some significant newprospects have come through the pipeline, further strengthening projections and forecasts. Revenue will also be boosted ascustomization requests grow in addition to new business volume.
Our success, in the near term, will depend, in large part, on the Company’s ability to continue to grow revenues and improve profits,adequately capitalize for growth in various markets and verticals, make progress in the North American and European markets and,continue to streamline sales and marketing efforts in every market we operate. However, management’s outlook for the continuingoperations, which has been consolidated and has been streamlined, remains optimistic. Management has identified the following material trends affecting NetSol. Positive trends: ● Improving U.S. economy generally, and particularly auto and banking markets. ● Robust Chinese markets as asset based leasing and finance sector are far from maturity levels. ● Latin American markets, primarily in Mexico, remain largely untapped. ● Pakistan economy growth in gross domestic product reached 4.7% in 2016, according to the Pakistan Bureau of Statistics; and
improved credit ratings by Bloomberg, S&P, Moody’s and Forbes Pakistan security and geopolitical environment has improved. ● China investment or CPEC (China Pakistan Economic Corridor) has exceeded $50 billion from originally $46 billion in Pakistan on
energy and infrastructure projects. ● Continuous strong U.S. auto sales in excess of 17 million units in 2016 according to Autonews.com. ● New emerging markets and IT destinations in Thailand, Malaysia, Indonesia, China and Australia. ● Continued interest from Fortune 500 multinational auto captives and global companies in NetSol Ascent™. ● Growing interest from existing clients in the NFS™ legacy systems in emerging and developing markets. ● Growing demand and traction for upgrading to NFS Ascent™ by existing tier one auto captive clients. Negative trends:
● Growing Global terrorism and extremism threats in European countries. ● Geopolitical unrest in the Middle East and potential terrorism and the disruption risk it creates. ● Restricted liquidity and financial burden due to tighter internal processes and limited budgets might cause delays in the receivables
from some clients. ● The threats of conflict between in the Middle Eastern countries could potentially create volatility in oil prices, causing
readjustments of corporate budgets and consumer spending slowing global auto sales.
CHANGES IN FINANCIAL CONDITION Quarter Ended September 30, 2017 compared to September 30, 2016 The following table sets forth the items in our unaudited condensed consolidated statement of operations for the quarter ended September30, 2017 and 2016 as a percentage of revenues. Page 30

For the Three Months Ended September 30, 2017 % 2016 % Restated
Net Revenues: License fees $ 326,066 2.54% $ 5,453,795 31.94%Maintenance fees 3,473,725 27.10% 3,523,797 20.64%Services 7,017,737 54.75% 5,556,135 32.54%License fees - related party 44,408 0.35% 246,957 1.45%Maintenance fees - related party 102,963 0.80% 130,631 0.76%Services - related party 1,853,877 14.46% 2,165,154 12.68%
Total net revenues 12,818,776 100.00% 17,076,469 100.00% Cost of revenues: Salaries and consultants 5,464,160 42.63% 5,893,349 34.51%Travel 513,112 4.00% 711,895 4.17%Depreciation and amortization 1,173,113 9.15% 1,330,872 7.79%Other 856,582 6.68% 972,338 5.69%Total cost of revenues 8,006,967 62.46% 8,908,454 52.17% Gross profit 4,811,809 37.54% 8,168,015 47.83%Operating expenses: Selling and marketing 1,711,296 13.35% 2,344,038 13.73%Depreciation and amortization 245,873 1.92% 269,097 1.58%General and administrative 3,787,558 29.55% 4,619,196 27.05%Research and development cost 185,085 1.44% 92,932 0.54%Total operating expenses 5,929,812 46.26% 7,325,263 42.90% Income (loss) from operations (1,118,003) -8.72% 842,752 4.94%Other income and (expenses) Gain (loss) on sale of assets (7,130) -0.06% (2,403) -0.01%Interest expense (118,071) -0.92% (54,475) -0.32%Interest income 136,911 1.07% 30,440 0.18%Gain (loss) on foreign currency exchange transactions 1,016,362 7.93% (414,896) -2.43%Share of net loss from equity investment (67,562) -0.53% - 0.00%Other income (expense) 1,099 0.01% 21,560 0.13%Total other income (expenses)
961,609 7.50% (419,774) -2.46% Net income (loss) before income taxes (156,394) -1.22% 422,978 2.48%Income tax provision (24,871) -0.19% (39,875) -0.23%Net income (loss) (181,265) -1.41% 383,103 2.24%Non-controlling interest (188,233) -1.47% (769,214) -4.50%Net income (loss) attributable to NetSol $ (369,498) -2.88% $ (386,111) -2.26% Page 31

A significant portion of our business is conducted in currencies other than the U.S. dollar. We operate in several geographical regions asdescribed in Note 18 “Operating Segments” within the Notes to the Condensed Consolidated Financial Statements. Weakening of the valueof the U.S. dollar compared to foreign currency exchange rates generally has the effect of increasing our revenues but also increasing ourexpenses denominated in currencies other than the U.S. dollar. Similarly, strengthening of the U.S. dollar compared to foreign currencyexchange rates generally has the effect of reducing our revenues but also reducing our expenses denominated in currencies other than theU.S. dollar. We plan our business accordingly by deploying additional resources to areas of expansion, while continuing to monitor ouroverall expenditures given the economic uncertainties of our target markets. In order to provide a framework for assessing how ourunderlying businesses performed excluding the effect of foreign currency fluctuations, we compare the changes in results from one periodto another period using constant currency. In order to calculate our constant currency results, we apply the current period results to the priorperiod foreign currency exchange rates. In the table below, we present the change based on actual results in reported currency and inconstant currency.
Favorable Favorable Total For the Three Months (Unfavorable) (Unfavorable) Favorable Ended September 30, Change in Change due to (Unfavorable) 2017 % 2016 % Constant Currency Change as Restated Currency Fluctuation Reported
Net Revenues: $12,818,776 100.00% $17,076,469 100.00% $ (4,146,789) $ (110,904) $ (4,257,693) - Cost of revenues: 8,006,967 62.46% 8,908,454 52.17% 796,528 104,959 901,487- - Gross profit 4,811,809 37.54% 8,168,015 47.83% (3,350,261) (5,945) (3,356,206) - Operating expenses: 5,929,812 46.26% 7,325,263 42.90% 1,367,030 28,421 1,395,451- - Income (loss) from operations $ (1,118,003) -8.72% $ 842,752 4.94% $ (1,983,231) $ 22,476 $ (1,960,755) Net revenues for the quarter ended September 30, 2017 and 2016 are broken out among the segments as follows:
2017 2016
Revenue % RevenueRestated %
North America $ 848,072 6.62% $ 1,841,431 10.78%Europe 2,049,016 15.98% 1,942,734 11.38%Asia-Pacific 9,921,688 77.40% 13,292,304 77.84%
Total $ 12,818,776 100.00% $ 17,076,469 100.00% Revenues License fees License fees for the three months ended September 30, 2017 were $326,066 compared to $5,453,795 for the three months ended September30, 2016 reflecting a decrease of $5,127,729 with a change in constant currency of $5,127,729. The decrease in license revenue for thefiscal three months ended September 30, 2017 compared to 2016 is primarily due to the decrease of license revenue recognized for the 12country NFS Ascent™ contract. During the current quarter, we had license revenues through sales of our regional offerings in the U.S. andthe U.K. Page 32

License fees – related party License fees from related party for the three months ended September 30, 2017 were $44,408 compared to $246,957 for the three monthsended September 30, 2016 reflecting a decrease of $202,549 with a change in constant currency of $202,549. Maintenance fees Maintenance fees for the three months ended September 30, 2017 were $3,473,725 compared to $3,523,797 for the three months endedSeptember 30, 2016 reflecting a slight decrease of $50,072 with a change in constant currency of $54,733. Maintenance fees begin once acustomer has “gone live” with our product. The decrease was due to some customers not renewing their maintenance agreements forcertain legacy products. We anticipate maintenance fees to gradually increase as we implement both our NFS legacy product and NFSAscent™. Maintenance fees – related party Maintenance fees from related party for the three months ended September 30, 2017 were $102,963 compared to $130,631 for the threemonths ended September 30, 2016 reflecting a decrease of $27,668 with a change in constant currency of $27,668. The decrease was due tothe fluctuation in usage of active users. Services Services income for the three months ended September 30, 2017 was $7,017,737 compared to $5,556,135 for the three months endedSeptember 30, 2016 reflecting an increase of $1,461,602 with a change in constant currency of $1,459,197. The services revenue increasewas due to an increase in services revenue associated with new implementations and change requests. Services revenue is derived fromservices provided to both current customers as well as services provided to new customers as part of the implementation process. Services – related party Services income from related party for the three months ended September 30, 2017 was $1,853,877 compared to $2,165,154 for the threemonths ended September 30, 2016 reflecting a decrease of $311,277 with a change in constant currency of $294,483. The decrease inrelated party service revenue is due to a decrease in revenue from our joint venture with 1insurer of approximately $423,000 off set by anincrease of approximately $94,000 and $17,000 in service revenue related to services performed for Investec and WRLD3D, respectively. Gross Profit The gross profit was $4,811,809, for the three months ended September 30, 2017 as compared with $8,168,015 for the three months endedSeptember 30, 2016. This is a decrease of $3,356,206 with a decrease in constant currency of $3,451,437. The gross profit percentage forthe three months ended September 30, 2017 also decreased to 37.5% from 47.8% for the three months ended September 30, 2016. The costof sales was $8,006,967 for the three months ended September 30, 2017 compared to $8,908,454 for the three months ended September 30,2016 for a decrease of $901,487 and on a constant currency basis a decrease of $796,528. As a percentage of sales, cost of sales increasedfrom 52.2% for the three months ended September 30, 2016 to 62.5% for the three months ended September 30, 2017. Salaries and consultant fees decreased by $429,189 from $5,893,349 for the three months ended September 30, 2016 to $5,465,160 for thethree months ended September 30, 2017 and on a constant currency basis decreased $342,313. The decrease in salaries and consultant feesis due to the right sizing of technical employees at key locations including Pakistan, Thailand, China, UK and North America. As apercentage of sales, salaries and consultant expense increased from 34.5% for the three months ended September 30, 2016 to 42.6% for thethree months ended September 30, 2017. Depreciation and amortization expense decreased to $1,173,113 compared to $1,330,872 for the three months ended September 30, 2016 ora decrease of $157,759 and on a constant currency basis a decrease of $140,344. Depreciation and amortization expense decreased as someproducts became fully amortized. Page 33

Operating Expenses Operating expenses were $5,929,812 for the three months ended September 30, 2017 compared to $7,325,263, for the three months endedSeptember 30, 2016 for a decrease of 19.0% or $1,395,451 and on a constant currency basis a decrease of 18.7% or $1,365,992. As apercentage of sales, it increased from 42.9% to 46.3%. The decrease in operating expenses was primarily due to decreases in selling andmarketing expenses, salaries and wages, depreciation, and professional services. Selling and marketing expenses decreased $632,742 or 27.0% and on a constant currency basis a decrease of $629,080 or 26.8%. Thedecrease in selling and marketing expenses is due to reduction in staff, decrease in our salaries and commissions, travel expenses, andbusiness development costs to market and sell NFS Ascent™ globally. General and administrative expenses were $3,787,558 for the three months ended September 30, 2017 compared to $4,619,196 atSeptember 30, 2016 or a decrease of $831,638 or 18.0% and on a constant currency basis a decrease of $811,277 or 17.56%. During thethree months ended September 30, 2017, salaries decreased by approximately $896,956 or $869,131 on a constant currency basis due to thedecrease in the number of employees, minimal annual raises, less share grants and options, offset by an increase in other general andadministrative expenses of approximately $72,971 or $65,634 on a constant currency basis. Income/Loss from Operations Loss from operations was $1,118,003 for the three months ended September 30, 2017 compared to income of $842,752 for the threemonths ended September 30, 2016. This represents a decrease of $1,960,755 with a decrease of 1,983,231 on a constant currency basis forthe three months ended September 30, 2017 compared with the three months ended September 30, 2016. As a percentage of sales, loss fromoperations was 8.7% for the three months ended September 30, 2017 compared to income of 4.9% for the three months ended September30, 2016. Net Loss Net loss was $369,498 for the three months ended September 30, 2017 compared to $386,111 for the three months ended September 30,2016. This is a decrease of $16,613 with an increase of $2,719 on a constant currency basis, compared to the prior year. For the threemonths ended September 30, 2017, net loss per share was $0.03 for basic and diluted shares compared to $0.04 for basic and diluted sharesfor the three months ended September 30, 2016. Non-GAAP Financial Measures Regulation S-K Item 10(e), “Use of Non-GAAP Financial Measures in Commission Filings,” defines and prescribes the conditions for useof non-GAAP financial information. Our measures of adjusted EBITDA and adjusted EBITDA per basic and diluted share meet thedefinition of a non-GAAP financial measure. We define the non-GAAP measures as follows:
● EBITDA is GAAP net income or loss before net interest expense, income tax expense, depreciation and amortization. ● Non-GAAP adjusted EBITDA is EBITDA less stock-based compensation expense. ● Adjusted EBITDA per basic and diluted share – Adjusted EBITDA allocated to common stock divided by the weighted average
shares outstanding and diluted shares outstanding. We use non-GAAP measures internally to evaluate the business and believe that presenting non-GAAP measures provides usefulinformation to investors regarding the underlying business trends and performance of our ongoing operations as well as useful metrics formonitoring our performance and evaluating it against industry peers. The non-GAAP financial measures presented should be used inaddition to, and in conjunction with, results presented in accordance with GAAP, and should not be relied upon to the exclusion of GAAPfinancial measures. Management strongly encourages investors to review our consolidated financial statements in their entirety and not torely on any single financial measure in evaluating the Company. The non-GAAP measures reflect adjustments based on the following items: EBITDA: We report EBITDA as a non-GAAP metric by excluding the effect of net interest expense, income tax expense, depreciation andamortization from net income or loss because doing so makes internal comparisons to our historical operating results more consistent. Inaddition, we believe providing an EBITDA calculation is a more useful comparison of our operating results to the operating results of ourpeers. Stock-based compensation expense: We have excluded the effect of stock-based compensation expense from the non-GAAP adjustedEBITDA and non-GAAP adjusted EBITDA per basic and diluted share calculations. Although stock-based compensation expense iscalculated in accordance with current GAAP and constitutes an ongoing and recurring expense, such expense is excluded from non-GAAPresults because it is not an expense which generally requires cash settlement by NetSol, and therefore is not used by us to assess theprofitability of our operations. We also believe the exclusion of stock-based compensation expense provides a more useful comparison ofour operating results to the operating results of our peers. Page 34

Non-controlling interest: We add back the non-controlling interest in calculating gross adjusted EBITDA and then subtract out the incometaxes, depreciation and amortization and net interest expense attributable to the non-controlling interest to arrive at a net adjusted EBITDA. Our reconciliation of the non-GAAP financial measures of adjusted EBITDA and non-GAAP earnings per basic and diluted share to themost comparable GAAP measures for the three months ended September 30, 2017 and 2016 are as follows:
Three Months Three Months Ended
Ended
September 30, 2017 September 30, 2016
Restated
Net Income (loss) before preferred dividend, per GAAP $ (369,498) $ (386,111)Non-controlling interest 188,233 769,214 Income taxes 24,871 39,875 Depreciation and amortization 1,418,986 1,599,969 Interest expense 118,071 54,475 Interest (income) (136,911) (30,440)
EBITDA $ 1,243,752 $ 2,046,982 Add back:
Non-cash stock-based compensation 427,809 865,456 Adjusted EBITDA, gross $ 1,671,561 $ 2,912,438 Less non-controlling interest (a) (701,864) (1,633,243)Adjusted EBITDA, net $ 969,697 $ 1,279,195
Weighted Average number of shares outstanding Basic 11,099,113 10,697,425 Diluted 11,130,824 10,861,290
Basic adjusted EBITDA $ 0.09 $ 0.12 Diluted adjusted EBITDA $ 0.09 $ 0.12
(a)The reconciliation of adjusted EBITDA of non-controlling interest to net income attributable to non-controlling interest is as follows
Net Income attributable to non-controlling interest
$ 188,233 $ 769,214 Income Taxes 10,478 13,874 Depreciation and amortization 467,182 825,866 Interest expense 39,072 18,342 Interest (income) (45,157) (16,450)
EBITDA $ 659,808 $ 1,610,846 Add back:
Non-cash stock-based compensation 42,056 22,397 Adjusted EBITDA of non-controlling interest $ 701,864 $ 1,633,243 Page 35

LIQUIDITY AND CAPITAL RESOURCES Our cash position was $8,554,815 at September 30, 2017, compared to $14,172,954 at June 30, 2017. Net cash used in operating activities was $4,152,240 for the three months ended September 30, 2017 compared to $217,529 for the threemonths ended September 30, 2016. At September 30, 2017, we had current assets of $44,461,204 and current liabilities of $20,884,760. Wehad accounts receivable of $10,081,450 at September 30, 2017 compared to $8,228,141 at June 30, 2017. We had revenues in excess ofbillings of $27,409,600 at September 30, 2017 compared to $24,380,632 at June 30, 2017 of which $5,225,260 and $5,173,538 is shown aslong term as of September 30, 2017 and June 30, 2017, respectively. The long-term portion is discounted by $258,609 and $310,331 atSeptember 30, 2017 and June 30, 2017, respectively, using the discounted cash flow method with an interest rate of 3.96% which is NetSolPK’s weighted average borrowing rate at June 30, 2017. During the three months ended September 30, 2017, our revenues in excess ofbillings were reclassified to accounts receivable pursuant to billing requirements detailed in each contract. The combined totals for accountsreceivable and revenues in excess of billings increased by $4,882,277 from $32,608,773 at June 30, 2017 to $37,491,050 at September 30,2017. The increase is due to recognition of revenue according to progress of contracts. Accounts payable and accrued expenses, and currentportions of loans and lease obligations amounted to $7,123,148 and $10,016,697, respectively at September 30, 2017. The average days sales outstanding for the three months ended September 30, 2017 and 2016 were 251 and 145 days, respectively, for eachperiod. The days sales outstanding have been calculated by taking into consideration the average combined balances of accounts receivableand revenue in excess of billings. Net cash used in investing activities was $712,140 for the three months ended September 30, 2017, compared to $958,610 for the threemonths ended September 30, 2016. We had purchases of property and equipment of $328,163 compared to $554,873 for the comparableperiod last fiscal year. For the three months ended September 30, 2017, we invested $500,000 in a short-term convertible note receivablefrom WRLD3D. For the three months ended September 30, 2017, we invested $nil in WRLD3D compared to $555,555 for the threemonths ended September 30, 2016. Net cash used in financing activities was $486,985, compared to net cash provided by financing activities $241,757 for the three monthsended September 30, 2017, and 2016, respectively. The three months ended September 30, 2017 included the cash inflow of $162,385 fromthe exercising of stock options and warrants compared to $276,861 for the same period last year. We purchased 111,780 of our commonstock from the open market at an average price of $4.48 per share. During the three months ended September 30, 2017, we had netpayments for bank loans and capital leases of $148,707 compared to $49,117 for the three months ended September 30, 2016. We areoperating in various geographical regions of the world through its various subsidiaries. Those subsidiaries have financial arrangements fromvarious financial institutions to meet both their short and long term funding requirements. These loans will become due at different maturitydates as described in Note 14 of the financial statements. We are in compliance with the covenants of the financial arrangements and thereis no default, which may lead to early payment of these obligations. We anticipate paying back all these obligations on their respective duedates from its own sources. We typically fund the cash requirements for our operations in the U.S. through our license, services, and maintenance agreements,intercompany charges for corporate services, and through the exercise of options and warrants. As of September 30, 2017, we hadapproximately $8.55 million of cash, cash equivalents and marketable securities of which approximately $6.77 million is held by ourforeign subsidiaries. As of June 30, 2017, we had approximately $14.17 million of cash, cash equivalents and marketable securities ofwhich approximately $11.56 million is held by our foreign subsidiaries. We intend to permanently reinvest these funds outside the U.S.,and therefore, we do not anticipate repatriating undistributed earnings from our non-U.S. operations. If funds from foreign operations arerequired to fund U.S. operations in the future, and if U.S. tax has not previously been provided, we would be required to accrue and payadditional U.S. taxes to repatriate these funds. We remain open to strategic relationships that would provide value added benefits. The focus will remain on continuously improving cashreserves internally and reduced reliance on external capital raise. As a growing company, we have on-going capital expenditure needs based on our short term and long term business plans. Although ourrequirements for capital expenses vary from time to time, for the next 12 months, we anticipate needing $2 million for APAC, U.S. andEurope new business development activities and infrastructure enhancements, which we expect to provide from current operations. While there is no guarantee that any of these methods will result in raising sufficient funds to meet our capital needs or that even ifavailable will be on terms acceptable to us, we will be very cautious and prudent about any new capital raise given the global marketuncertainties. However, we are very conscious of the dilutive effect and price pressures in raising equity-based capital. Page 36

Financial Covenants Our UK based subsidiary, NTE, has an approved overdraft facility of £300,000 ($400,000) which requires that the aggregate amount ofinvoiced trade debtors (net of provisions for bad and doubtful debts and excluding intra-group debtors) of NTE, not exceeding 90 days old,will not be less than an amount equal to 200% of the facility. The Pakistani subsidiary, NetSol PK has an approved facility for exportrefinance from Askari Bank Limited amounting to Rupees 500 million ($4,716,090) which requires NetSol PK to maintain a long-term debtequity ratio of 60:40 and the current ratio of 1:1. NetSol PK also has an approved export refinance facility of Rs. 350 million ($3,301,265)and a running finance facility of Rs. 150 million ($1,414,827) from Samba Bank Limited. During the tenure of loan, these two facilitiesrequire NetSol PK to maintain at a minimum a current ratio of 1:1, an interest coverage ratio of 4 times, a leverage ratio of 2 times, and adebt service coverage ratio of 4 times. As of the date of this report, we are in compliance with the financial covenants associated with our borrowings. The maturity dates of theborrowings of respective subsidiaries may accelerate if they do not comply with these covenants. In case of any change in control insubsidiaries, they may have to repay their respective credit facilities. CRITICAL ACCOUNTING POLICIES Our financial statements and accompanying notes are prepared in accordance with accounting principles generally accepted in the UnitedStates (“U.S. GAAP”). Preparing financial statements requires management to make estimates and assumptions that affect the reportedamounts of assets, liabilities, revenue, and expenses. These estimates and assumptions are affected by management’s application ofaccounting policies. Critical accounting policies for us include revenue recognition and multiple element arrangements, intangible assets,software development costs, and goodwill. REVENUE RECOGNITION The Company derives revenues from the following sources: (1) software licenses, (2) services, which include implementation andconsulting services, and (3) maintenance, which includes post contract support. The Company recognizes revenue from license contracts without major customization when a non-cancelable, non-contingent licenseagreement has been signed, delivery of the software has occurred, the fee is fixed or determinable, and collectability is probable. Deliveryis considered to have occurred upon electronic transfer of the license key that provides immediate availability of the product to thepurchaser. Determining whether and when some of these criteria have been satisfied often involves assumptions and judgments that canhave a significant impact on the timing and amount of revenue the Company reports. If an arrangement does not qualify for separate accounting of the software license and consulting transactions, then new software licenserevenue is generally recognized together with the consulting services based on contract accounting using either the percentage-of-completion or completed contract method. Contract accounting is applied to any arrangements: (1) that include milestones or customerspecific acceptance criteria that may affect collection of the software license fees; (2) where services include significant modification orcustomization of the software; (3) where significant consulting services are provided for in the software license contract without additionalcharge or are substantially discounted; or (4) where the software license payment is tied to the performance of consulting services. Revenue from consulting services is recognized as the services are performed for time-and-materials contracts. Revenue from training anddevelopment services is recognized as the services are performed. Revenue from maintenance agreements is recognized ratably over the term of the maintenance agreement, typically one year. Multiple Element Arrangements The Company may enter into multiple element revenue arrangements in which a customer may purchase a number of differentcombinations of software licenses, consulting services, maintenance and support, as well as training and development. Vendor specific objective evidence (“VSOE”) of fair value for each element is based on the price for which the element is sold separately.The Company determines the VSOE of fair value of each element based on historical evidence of the Company’s stand-alone sales of theseelements to third-parties or from the stated renewal rate for the elements contained in the initial software license arrangement. When VSOEof fair value does not exist for any undelivered element, revenue is deferred until the earlier of the point at which such VSOE of fair valueexists or until all elements of the arrangement have been delivered. The only exception to this guidance is when the only undeliveredelement is maintenance and support or other services, then the entire arrangement fee is recognized ratably over the performance period. Page 37

INTANGIBLE ASSETS Intangible assets consist of product licenses, renewals, enhancements, copyrights, trademarks, trade names, and customer lists. Intangibleassets with finite lives are amortized over the estimated useful life and are evaluated for impairment at least on an annual basis andwhenever events or changes in circumstances indicate that the carrying value may not be recoverable. We assess recoverability bydetermining whether the carrying value of such assets will be recovered through the undiscounted expected future cash flows. If the futureundiscounted cash flows are less than the carrying amount of these assets, we recognize an impairment loss based on the excess of thecarrying amount over the fair value of the assets. SOFTWARE DEVELOPMENT COSTS Costs incurred to internally develop computer software products or to enhance an existing product are recorded as research anddevelopment costs and expensed when incurred until technological feasibility for the respective product is established. Thereafter, allsoftware development costs are capitalized and reported at the lower of unamortized cost or net realizable value. Capitalization ceaseswhen the product or enhancement is available for general release to customers. The Company makes on-going evaluations of the recoverability of its capitalized software projects by comparing the amount capitalizedfor each product to the estimated net realizable value of the product. If such evaluations indicate that the unamortized softwaredevelopment costs exceed the net realizable value, the Company writes off the amount which the unamortized software development costsexceed net realizable value. Capitalized and purchased computer software development costs are being amortized ratably based on theprojected revenue associated with the related software or on a straight-line basis. STOCK-BASED COMPENSATION Our stock-based compensation expense is estimated at the grant date based on the award’s fair value as calculated by the Black-Scholes-Merton (BSM) option pricing model and is recognized as expense over the requisite service period. The BSM model requires varioushighly judgmental assumptions including expected volatility and expected term. If any of the assumptions used in the BSM model changessignificantly, stock-based compensation expense may differ materially in the future from that recorded in the current period. In addition,we are required to estimate the expected forfeiture rate and only recognize expense for those shares expected to vest. We estimate theforfeiture rate based on historical experience and our expectations regarding future pre-vesting termination behavior of employees. To theextent our actual forfeiture rate is different from our estimate; stock-based compensation expense is adjusted accordingly. GOODWILL Goodwill represents the excess of the aggregate purchase price over the fair value of the net assets acquired in a purchase businessescombination. Goodwill is reviewed for impairment on an annual basis, or more frequently if events or changes in circumstances indicatethat the carrying amount of goodwill may be impaired. The goodwill impairment test is a two-step test. Under the first step, the fair valueof the reporting unit is compared with its carrying value (including goodwill). If the fair value of the reporting unit is less than its carryingvalue, an indication of goodwill impairment exists for the reporting unit and the enterprise must perform step two of the impairment test(measurement). Under step two, an impairment loss is recognized for any excess of the carrying amount of the reporting unit’s goodwillover the implied fair value of that goodwill. The implied fair value of goodwill is determined by allocating the fair value of the reportingunit in a manner similar to a purchase price allocation. The residual fair value after this allocation is the implied fair value of the reportingunit goodwill. Fair value of the reporting unit is determined using a discounted cash flow analysis. If the fair value of the reporting unitexceeds its carrying value, step two does not need to be performed. RECENT ACCOUNTING PRONOUNCEMENTS For information with respect to recent accounting pronouncements and the impact of these pronouncements on our consolidated financialstatements, see Note 2 of Notes to Condensed Consolidated Financial Statements included elsewhere in this Quarterly Report. Page 38

Item 3. Quantitative and Qualitative Disclosures about Market Risks. None. Item 4. Controls and Procedures Evaluation of Disclosure Controls and Procedures Our management, with the participation of our Chief Executive Officer and Chief Financial Officer, evaluated the effectiveness of ourdisclosure controls and procedures pursuant to Rule 13a-15 under the Exchange Act, as of the end of the period covered by this QuarterlyReport on Form 10-Q. Based upon that evaluation, the Chief Financial Officer and Chief Executive Officer concluded that our disclosurecontrols and procedures were ineffective. The material weakness relates to the lack of qualified Internal Audit resources dedicated to documenting and testing legacy accountingsystems and Corporate functions. The Company is in the process of remediating the material weakness, including, but not limited to, by continuing the implementation of aleading cloud-based global ERP system, as approved by the Company’s Board in fiscal year 2016, which is already live in certain locations,and is expected to be completed by June 30, 2018. Further, the Company engaged an internal audit consulting firm to advise and assist withthe remediation and internal control improvements, including to assist with the expansion and training of the Company’s internal auditfunction, and to augment corporate oversight and internal audit coverage. Changes in Internal Control over Financial Reporting Except for progress made in the remediation actions described above, there were no changes in our internal controls over financialreporting during the three months ended September 30, 2017, that have materially affected, or are reasonably likely to materially affect, theCompany’s internal control over financial reporting (as defined in Exchange Act Rules 13a – 15(f) and 15d – 15(f)). Page 39

PART II OTHER INFORMATION Item 1. Legal Proceedings On April 7, 2017, Conister Bank Limited filed a complaint in the High Court of Justice Chancery Division, as claim no. HC-2017-001045against our subsidiary, Virtual Lease Services Limited (“VLS”). The complaint alleges that VLS was in willful default of their agreementswith Conister Bank Limited by failing to fulfill its obligations under the agreements with Conister. The complaint alleges damages in excessof £200,000 (approximately $266,667). VLS has responded to the complaint and its expenses are currently covered by available insurance.VLS denies all claims and intends to vigorously defend the action. Item 1A. Risk Factors None. Item 2. Unregistered Sales of Equity Securities and Use of Proceeds The repurchases provided in the table below were made during the quarter ended September 30, 2017:
Issuer Purchases of Equity Securities (1)
Month Total Number ofShares Purchased
Average PricePaid Per Share
Total Number ofShares Purchased
as Part ofPublicly
Announced Plansor Programs
MaximumNumber of
Shares that maybe Purchased
Under the Plansor Programs
Jul-17 20,247 $ 4.32 20,247 - Aug-17 91,533 $ 4.51 111,780 - Sep-17 - $ - - - Total 111,780 $ 4.48 111,780 1,000,000
On July 18, 2017, the Company announced that it had authorized a stock repurchase program permitting the Company to repurchase up to1,000,000 of its shares of common stock through December 15, 2017. The shares are to be repurchased from time to time in open markettransactions or privately negotiated transactions in the Company’s discretion. Item 3. Defaults Upon Senior Securities None. Item 4. Mine Safety Disclosures Not applicable. Item 5. Other Information None. Item 6. Exhibits 31.1 Certification pursuant to Section 302 of the Sarbanes-Oxley Act of 2002 (CEO)31.2 Certification pursuant to Section 302 of the Sarbanes-Oxley Act of 2002 (CFO)32.1 Certification pursuant to 18 U.S.C. Section 1350, as adopted pursuant to Section 906 of the Sarbanes-Oxley Act of 2002 (CEO)32.2 Certification pursuant to 18 U.S.C. Section 1350, as adopted pursuant to Section 906 of the Sarbanes-Oxley Act of 2002 (CFO) Page 40

SIGNATURES In accordance with the requirements of the Exchange Act, the registrant caused this report to be signed on its behalf by the undersigned,thereunto duly authorized. NETSOL TECHNOLOGIES, INC. Date: November 9, 2017 /s/ Najeeb U. Ghauri NAJEEB U. GHAURI Chief Executive Officer Date: November 9, 2017 /s/Roger K. Almond ROGER K. ALMOND Chief Financial Officer Principal Accounting Officer Page 41


Certification Pursuant to 18 U.S.C. Section 1350
As Adopted Pursuant toSection 302 of the Sarbanes-Oxley Act of 2002
I, Najeeb Ghauri, certify that: (1) I have reviewed this annual report on Form 10-Q for the quarter ended September 30, 2017, of NetSol Technologies, Inc.,(“Registrant”). (2) Based on my knowledge, this report does not contain any untrue statement of a material fact or omit to state a material fact necessary tomake the statements made, in light of the circumstances under which such statements were made, not misleading with respect to the periodcovered by this annual report; (3) Based on my knowledge, the financial statements and other financial information included in this report, fairly present in all materialrespects the financial condition, results of operations and cash flows of the registrant as of, and for, the periods presented in this report;
(4) The registrant’s other certifying officers and I are responsible for establishing and maintaining disclosure controls and procedures (asdefined in Exchange Act Rules 13a-15(e) and 15d-15(e)) and internal control over financial reporting (as defined in Exchange Act Rules13a-15(f) and 15d-15(f)) for the registrant and have:
(a) designed such disclosure controls and procedure, or caused such disclosure controls and procedures to be designed under oursupervision, to ensure that material information relating to the registrant, including its consolidated subsidiaries, is made known to us byothers within those entities, particularly during the period in which this report is being prepared;
(b) designed such internal control over financial reporting, or caused such internal control over financial reporting to be designedunder our supervision, to provide reasonable assurance regarding the reliability of financial reporting and the preparation of financialstatements for external purposes in accordance with generally accepted accounting principles;
(c) evaluated the effectiveness of the registrant’s disclosure controls and procedures and presented in this report our conclusionsabout the effectiveness of the disclosure controls and procedures, as of the end of the period covered by this report based on suchevaluation; and
(d) disclosed in this report any changes in the registrant’s internal control over financial reporting that occurred during theregistrant’s most recent fiscal quarter (the registrant’s fourth fiscal quarter in the case of an annual report) that has materially affected, or isreasonably likely to materially affect, the registrant’s internal control over financial reporting; and; (5) The registrant’s other certifying officer(s) and I have disclosed, based on our most recent evaluation of the internal control overfinancial reporting, to the registrant’s auditors and the audit committee of registrant’s board of directors (or persons performing theequivalent functions):
(a) all significant deficiencies and material weaknesses in the design or operation of internal control over financial reporting which
are reasonably likely to adversely affect the registrant’s ability to record, process, summarize and report financial information; and
(b) any fraud, whether or not material, that involves management or other employees who have a significant role in the registrant’sinternal control over financial reporting. Date: November 9, 2017 /s/ Najeeb Ghauri Najeeb Ghauri, Chief Executive Officer Principal Executive Officer


Certification Pursuant to 18 U.S.C. Section 1350
As Adopted Pursuant toSection 302 of the Sarbanes-Oxley Act of 2002
I, Roger K. Almond, certify that: (1) I have reviewed this annual report on Form 10-Q for the quarter ended September 30, 2017, of NetSol Technologies, Inc.,(“Registrant”). (2) Based on my knowledge, this report does not contain any untrue statement of a material fact or omit to state a material fact necessary tomake the statements made, in light of the circumstances under which such statements were made, not misleading with respect to the periodcovered by this annual report; (3) Based on my knowledge, the financial statements and other financial information included in this report, fairly present in all materialrespects the financial condition, results of operations and cash flows of the registrant as of, and for, the periods presented in this report;
(4) The registrant’s other certifying officers and I are responsible for establishing and maintaining disclosure controls and procedures (asdefined in Exchange Act Rules 13a-15(e) and 15d-15(e)) and internal control over financial reporting (as defined in Exchange Act Rules13a-15(f) and 15d-15(f)) for the registrant and have:
(a) designed such disclosure controls and procedure, or caused such disclosure controls and procedures to be designed under oursupervision, to ensure that material information relating to the registrant, including its consolidated subsidiaries, is made known to us byothers within those entities, particularly during the period in which this report is being prepared;
(b) designed such internal control over financial reporting, or caused such internal control over financial reporting to be designedunder our supervision, to provide reasonable assurance regarding the reliability of financial reporting and the preparation of financialstatements for external purposes in accordance with generally accepted accounting principles;
(c) evaluated the effectiveness of the registrant’s disclosure controls and procedures and presented in this report our conclusionsabout the effectiveness of the disclosure controls and procedures, as of the end of the period covered by this report based on suchevaluation; and
(c) disclosed in this report any changes in the registrant’s internal control over financial reporting that occurred during theregistrant’s most recent fiscal quarter (the registrant’s fourth fiscal quarter in the case of an annual report) that has materially affected, or isreasonably likely to materially affect, the registrant’s internal control over financial reporting; and; (5) The registrant’s other certifying officer(s) and I have disclosed, based on our most recent evaluation of the internal control overfinancial reporting, to the registrant’s auditors and the audit committee of registrant’s board of directors (or persons performing theequivalent functions):
(a) all significant deficiencies and material weaknesses in the design or operation of internal control over financial reporting which
are reasonably likely to adversely affect the registrant’s ability to record, process, summarize and report financial information; and
(b) any fraud, whether or not material, that involves management or other employees who have a significant role in the registrant’sinternal control over financial reporting.
Date: November 9, 2017 /s/ Roger K. Almond Roger K. Almond Chief Financial Officer Principal Accounting Officer


CERTIFICATION PURSUANT TO 18 U.S.C. SECTION 1350,
AS ADOPTED PURSUANT BY SECTION 906 OF THE SARBANES-OXLEY ACT OF 2002
In connection with the Annual Report of NetSol Technologies, Inc. on Form 10-Q for the period ending September 30, 2017, as filed withthe Securities and Exchange Commission on the date hereof (the “Report”), the undersigned, Najeeb Ghauri, Chief Executive Officer ofthe Company, certifies, pursuant to 18 U.S.C. Section 1350, as adopted pursuant to ss. 906 of the Sarbanes-Oxley Act of 2002, that: (1) The Report fully complies with the requirements of section 13 (a) or 15 (d) of the Securities Exchange Act of 1934; and, (2) The information contained in the Report fairly presents, in all material respects, the financial condition and result of operations of theCompany. Date: November 9, 2017 /s/ Najeeb Ghauri Najeeb Ghauri, Chief Executive Officer Principal Executive Officer


CERTIFICATION PURSUANT TO 18 U.S.C. SECTION 1350,
AS ADOPTED PURSUANT BY SECTION 906 OF THE SARBANES-OXLEY ACT OF 2002 In connection with the Annual Report of NetSol Technologies, Inc. on Form 10-Q for the period ending September 30, 2017, as filed withthe Securities and Exchange Commission on the date hereof (the “Report”), the undersigned, Roger K. Almond, Chief Financial Officer,and Principal Accounting Officer of the Company, certifies, pursuant to 18 U.S.C. Section 1350, as adopted pursuant to ss. 906 of theSarbanes-Oxley Act of 2002, that: (1) The Report fully complies with the requirements of section 13 (a) or 15 (d) of the Securities Exchange Act of 1934; and, (2) The information contained in the Report fairly presents, in all material respects, the financial condition and result of operations of theCompany. Date: November 9, 2017 /s/ Roger K. Almond Roger K. Almond Chief Financial Officer Principal Accounting Officer
