was approved by the auscr steering committee
TRANSCRIPT

This publication was produced on behalf of the Australian Stroke Clinical Registry (AuSCR) Consortium partners and
was approved by the AuSCR Steering Committee.
Suggested citation:
Breen S, Cadilhac DA, Lannin NA, Kim J, Dalli L, Anderson CS, Kilkenny M, Faux S, Dewey H, Hill K, Donnan G, Grimley R,
Campbell B, Mitchell P, Middleton S on behalf of the AuSCR Consortium. The Australian Stroke Clinical Registry Annual
Report 2019 Volume 2: Patient Outcomes. The Florey Institute of Neuroscience and Mental Health; July 2021, Report
No. 12, 22 pages.
Any enquires about, or comments on, this publication should be directed to:
Administration
Australian Stroke Clinical Registry Office
The Florey Institute of Neuroscience and Mental Health
245 Burgundy Street
Heidelberg, Victoria 3084, Australia
Ph: +61 3 9035 7264
Fax: +61 3 9035 7304
Email: [email protected]
Website: www.auscr.com.au
@AustStrokeReg
July 2021
Report No. 12
Consortium partners:

CONTENTS EXECUTIVE SUMMARY ................................................................................................................................................ 4
INTRODUCTION .......................................................................................................................................................... 5
Overview of post-discharge outcomes data analysEs ................................................................................................. 6
POST-DISCHARGE HEALTH OUTCOME INFORMATION ................................................................................................ 8
Response rates ............................................................................................................................................................ 8
Follow-up data ............................................................................................................................................................ 9
Disability – modified Rankin Scale ............................................................................................................................ 10
Health-related quality of life ..................................................................................................................................... 13
Survival ..................................................................................................................................................................... 16
Risk-adjusted mortality ............................................................................................................................................. 17
Participation in research ........................................................................................................................................... 18
Unmet information needs ......................................................................................................................................... 18
DISCUSSION ...............................................................................................................................................................19
Follow-up data collection .......................................................................................................................................... 19
Patient outcomes ...................................................................................................................................................... 19
Conclusion ................................................................................................................................................................. 20
REFERENCES ..............................................................................................................................................................21
APPENDIX A: ABBREVIATIONS ...................................................................................................................................22
LIST OF TABLES
Table 1: Characteristics of patients with and without post discharge information ........................................................... 9
Table 2: Recurrent strokes, readmissions and living arrangements ................................................................................. 10
Table 3: modified Rankin Scale scores .............................................................................................................................. 11
Table 4: Quality of life assessment among survey respondents, stratified by stroke type .............................................. 14
LIST OF FIGURES
Figure 1: Follow-up of acute events in 2019 (excluding paediatric events) ....................................................................... 8
Figure 2: Unadjusted modified Rankin Scale score by stroke type at follow-up .............................................................. 12
Figure 3: Unadjusted modified Rankin Scale score for patients receiving endovascular clot retrieval at follow-up ....... 12
Figure 4: Unadjusted proportion of patients reporting problems with the EQ-5D-3L .................................................... 13
Figure 5: Health-related quality of life scores according to the adjusted VAS at follow-up, by hospital ......................... 15
Figure 6: Cumulative hazard of death, by treatment in a stroke unit (ischaemic stroke) ................................................ 16
Figure 7: Cumulative hazard of death, by treatment in a stroke unit (intracerebral haemorrhage) ............................... 16
Figure 8: 30 day Risk-adjusted mortality for ischaemic stroke (excluding transfers) ....................................................... 17
Figure 9: 30-day Risk-adjusted mortality for intracerebral haemorrhage (excluding transfers)..……………………………….…17
Figure 10: 30 day Risk-adjusted mortality for ischaemic stroke (including transfers) ...................................................... 18
Figure 11: 30-day Risk-adjusted mortality for intracerebral haemorrhage (including transfers)..…….……………………….…18
EXECUTIVE SUMMARY
The Australian Stroke Clinical Registry (AuSCR) provides a standardised approach for
hospitals to monitor, review and improve stroke care in compliance with national
acute stroke care standards. This report outlines the patient outcomes for 2019
stroke and transient ischaemic attack (TIA) admissions and is intended to be read in
conjunction with the AuSCR 2019 Annual Report Volume 1: Acute Care Provision.
AuSCR participation in 2019 and the collection of patient-reported outcomes • In 2019, 72 hospitals contributed data to the AuSCR (40% from Victoria, 29% from Queensland, 19% from New
South Wales, 4% each from Tasmania and South Australia and 3% from the Australian Capital Territory).
• This report is intended to be read alongside the AuSCR 2019 Annual Report Volume 1: Acute Care Provision
(https://auscr.com.au/about/annual-reports/).
• At 90-180 days after admission, collection of patient-reported outcomes was completed for 10,413 people who
experienced a stroke or transient ischaemic attack (TIA) aged over 18 years. This represented 71% of all eligible
episodes for 2019.
• Responders: were predominantly male (57%), had a median age of 72 years and had a median time to follow-up
survey completion of 145 days following admission for stroke or TIA.
Patient-reported outcomes obtained 90-180 days following admission • Most patients were living at home (85%). Compared to patients with ischaemic stroke, patients with intracerebral
haemorrhage were less likely to report living at home (OR: 0.57; 95% CI: 0.48-0.69), while patients with TIA were
more likely to report living at home (OR: 1.67; 95% CI: 1.37-2.04).
• Approximately 5% of patients had experienced a recurrent stroke, and 23% reported hospital readmissions.
• Almost half of respondents had a score of 0 (25%; representing no disability or symptoms) or 1 (22%; representing
no significant disability despite symptoms) on the modified Rankin Scale. Fewer patients with intracerebral
haemorrhage (ICH) reported no symptoms at follow up (13%) in contrast to ischaemic stroke (22%), undetermined
stroke type (28%) or TIA (45%).
• Health-related quality of life as measured by the EuroQol Five Dimensions Three Levels (EQ-5D-3L) survey
indicated that: 48% of patients reported problems with mobility; 31% with self-care; 57% with completion of usual
activities; 47% had pain/discomfort; and 46% had anxiety or depression. Patients with ICH reported more
problems on all of the five dimensions of quality of life than patients with other types of stroke or TIA.
• Self-reported overall health: The mean Visual Analogue Scale (VAS) score, which represents worst (0) and best
(100) imaginable health, was 69 compared to the reported population norm of 83. Mean VAS scores were lowest
for ICH (mean 63) and greatest in patients with undetermined stroke (mean 73).
• The overall minimum and maximum adjusted mean VAS scores differed between hospitals by almost 23 points
highlighting variation in outcomes depending on which hospital a patient was treated in.
Survival outcomes • Of the total acute stroke events recorded in 2019, 9% resulted in death prior to hospital discharge, 6% within 90
days of admission, and 2% between 90 and 180 days of admission.
• Treatment in a stroke unit was associated with a lower hazard of death at 180 days after admission than treatment
in an alternate ward for patients with either ICH or ischaemic stroke.
Other
• Almost half (49%) of respondents requested more information about stroke at 90-180 days after admission.
• 62% of respondents agreed to be contacted for future research study opportunities.

INTRODUCTION The Australian Stroke Clinical Registry (AuSCR) is a collaborative national effort to
monitor and support improvements to the quality of acute care for patients who
have a stroke and transient ischaemic attack (TIA). Since 2009, the AuSCR has
facilitated the collection of national data on consecutive patients admitted to
hospital with acute stroke or TIA, which has been used to inform improvements to
the health system.1
The AuSCR adheres to the national guidelines for best-
practice in clinical quality registries,2 and can be used
by both public and private hospitals. Adult and
paediatric cases are included. All participating
hospitals are required to have ethics and hospital-
specific governance approvals. As recommended for
national registries, an ‘opt-out’ model for patient
inclusion is used,3 in addition to a waiver of consent
for people who die while in hospital.
In the AuSCR, data are collected on the provision of
evidence-based therapies, supplemented with clinical
and demographic patient information, to provide an
indication of the quality of acute stroke care received.
Data are collected in the Australian Stroke Data Tool
(AuSDaT) which is a harmonised online platform
enabling standardised and systematic collection for
multiple national stroke data collection programs.
AuSCR data collection programs facilitate the
collection of data for patients with stroke/TIA who are
admitted to participating hospitals, and also patients
presenting to Emergency Departments (ED) prior to
transfer for continued acute care at another hospital.
The combination of programs enables the AuSCR to
fully document the acute care treatment pathway for
patients with stroke or TIA. These programs also
enable the collection of the original national minimum
processes of care dataset for assessing quality of care.2
For more information on acute data collection in the
AuSCR, and acute care provision in 2019, please refer
to the 2019 Annual Report Volume 1: Acute Care
Provision (https://auscr.com.au/about/annual-
reports/).
Patient-reported outcomes data are obtained via a
standardised survey administered at 90-180 days after
admission (also referred to as patient follow-up). In
addition to objective outcomes, including subsequent
stroke, hospital readmissions and current living
arrangements, subjective outcomes including self-
reported functional disability and health-related
quality of life are collected, namely the modified
Rankin Scale (mRS)4 and the EuroQol Quality of Life
measure (EQ-5D-3L).5 Function and health-related
quality of life is also collected from paediatric patients.
Paediatric patients use the Pediatric Quality of Life
(PedsQL)6 Inventory Measurement Model which is a
modular approach to measuring health-related quality
of life in children and adolescents.
The AuSCR office staff are responsible for following up
registrants who have not: been reported as deceased;
previously refused follow-up; or opted out of the
registry. Patient-reported outcomes data are collected
via a paper survey or telephone. A postal survey with a
reply paid envelope is mailed to each patient to collect
post-discharge information. If the surveys are not
returned within six weeks, another set of surveys are
posted to the patient and/or next of kin. After another
six-week period, a comprehensive telephone attempt
to the patient (and next of kin) is conducted. Patient
data collected via mail or telephone are entered into
the AuSDaT.
If all forms of contact are unsuccessful, then the
patient is deemed lost to follow-up, if survivor status is
not verified. Survival status is determined via annual
data linkage with the National Death Index (NDI) made
available by the Australian Institute of Health and
Welfare.
In 2019, we received follow-up data for 10,413
admitted episodes of patient care representing 18,733
individual patients from 72 Australian hospitals. The
data presented in this report provide insights into the
health outcomes of the 2019 registrants in AuSCR.
This report is intended to be read in conjunction with
the AuSCR 2019 Annual Report Volume 1: Acute Care
Provision (https://auscr.com.au/about/annual-
reports/).

6
OVERVIEW OF POST-DISCHARGE OUTCOMES DATA ANALYSES
Unless otherwise stipulated, patient data collected at
90-180 days post admission (ie follow-up data), were
analysed using descriptive statistics and multivariable
logistic regression, with adjustment for patient case
mix using age, sex, stroke type, ability to walk on
admission (stroke severity), in-hospital stroke, and
patient transfer from another hospital, as appropriate.
All episodes were eligible for follow-up except:
• where acute care data were not entered by
the hospital within 180 days post-admission;
or
• patients who were reported as deceased
prior to the 90-180 day follow-up.
In the case where there was a second admission
within 180 days of the first admission, follow-up was
only completed for the first admission.
Where comparisons are presented with large sample sizes, the reader should consider that the clinical relevance related to proportional differences may be more important than the statistical significance.
Functional disability is measured using the modified
Rankin Scale (mRS) which is a standardised instrument
used to categorise deficits after stroke.4 It provides a
simple descriptive profile across six levels including: 0
(no symptoms at all); 1 (no significant disability
despite symptoms; 2 (slight disability); 3 (moderate
disability); 4 (moderately severe disability) and 5
(severe disability). The mRS analyses in this report do
not include values of 6 (to signify death) for patients
who were deceased at the time of follow-up.
Registrants were asked to rate their level of functional
disability on the day of completion of the follow-up
survey.
Multivariable ordinal analysis of mRS data was
performed using partial proportional odds models to
assess changes across the scores between 0 to 5. As
recommended by the European Stroke Organisation
(https://eso-stroke.org/outcome-measures-stroke-
modified-rankin-scale-ordinal-logistic-regression/),
these analyses were adjusted for patient case mix
differences, clustering by hospitals, and presented as
common odds ratios. Common odds ratios can be
interpreted as the odds of a patient shifting to a higher
(or more severe) category of the mRS. For example, a
common odds ratio of 0.80 for a treatment would
mean that for a patient with an mRS of 4, the
treatment would increase a patients chance of
reporting a mRS score of 0 to 3 by 20%.
Health-related quality of life (HRQoL) is measured in
the AuSCR using the European Quality of Life measure
of health status (EQ-5D™)5, specifically the three-level
version of the instrument EQ-5D-3L. The EQ-5D-3L is a
standardised survey instrument used as a generic
measure of health outcome (see
http://www.euroqol.org/). It provides a simple
descriptive profile across five dimensions: mobility,
self-care, usual activities, pain and discomfort, and
anxiety and depression. Each dimension is divided into
three levels: no problems (1), some or moderate
problems (2) and extreme problems (3). Responses to
the EQ-5D-3L were dichotomised and reported based
on whether registrants had ‘any’ (ie moderate or
extreme) versus ‘no’ problems with each dimension.
Additionally, the EQ-5D-3L includes a self-rated
summary score of overall health using a Visual
Analogue Scale (VAS). The VAS responses range from
zero (worst imaginable health state) to 100 (the best
imaginable health state). Responses to the VAS were
described using the mean (and standard deviation) to
facilitate comparisons with published estimates for
the normative population. For hospital comparisons,
mean VAS scores were standardised to adjust for
differences in case mix using methodology similar to
that described below for mortality. Where possible,
reference to the median (and interquartile range) was
also made to assist in the interpretation of results.
Other patient-reported outcomes such as subsequent
stroke(s), hospital readmissions, current living
arrangements, need for stroke information and
interest in future research participation are captured
with single item standalone questions.
Case mix adjusted survival is measured using data
obtained from linkage to the NDI. Analysis of deaths
up to 180 days following admission was performed for
those who had experienced an episode of care in
2019. Cox proportional hazards regression analysis
was also performed on survival status for those who
received stroke unit care, compared with those who
did not. The survival analysis was adjusted for age, sex,
stroke type, in-hospital stroke, transfer from another
hospital and ability to walk on admission.
7
Risk-adjusted mortality rate (RAMR) was calculated
for each hospital based on admitted patients who had
died within 30 days of their admission. Separate RAMR
were calculated for patients with ischaemic stroke and
intracerebral haemorrhage (ICH). To ensure reliable
estimates, analyses were conducted for individual
hospitals that provided at least 200 episodes for cases
of ischaemic stroke, and at least 50 episodes for ICH in
2019. For hospitals with fewer episodes, data from
2018 and 2019 were pooled and used to derive
mortality estimates if the minimum number of
episodes was achieved across both years (i.e. at least
200 episodes for cases of ischaemic stroke, and at
least 50 episodes for ICH).
RAMR analyses were completed using two different
methods. The first method excluded patients who
were transferred from another hospital, in-hospital
strokes and patients with TIA. This method is
consistent with previous AuSCR Annual Reports
whereby deaths are summarised for patients treated
at only one hospital and are fully attributed to that
hospital.
The second RAMR method included patients who were
managed by more than one hospital for their episode
of stroke care (ie included all patients treated at an
individual hospital irrespective of whether they
presented directly or were transferred). In this
analysis, multiple episodes related to the same acute
stroke event were included, and mortality was
attributed equally to all hospitals involved in the
provision of patient care for that stroke event. RAMR
were calculated by dividing the risk-adjusted hospital
specific mortality by the risk-adjusted average hospital
mortality, and then multiplying by the unadjusted
proportion of deaths in the whole sample. Hospitals
with risk-adjusted mortality outside the three
standard deviation threshold limits are considered to
have ‘special cause variation’. All analyses were
performed using STATA/SE 16.0 (College Station, USA,
2019).
All RAMR models were adjusted for age, sex, country
of birth, Indigenous status, socioeconomic position,
stroke type, ability to walk on admission and previous
history of stroke. Socioeconomic position was based
on the Index of Relative Socioeconomic Advantage and
Disadvantage, an area-based measure of social and
economic circumstances published by the Australian
Bureau of Statistics. This measure of socioeconomic
position was determined for each patient using the
postcode of residence recorded in the AuSCR for the
acute episode.
8
POST-DISCHARGE HEALTH OUTCOME INFORMATION
RESPONSE RATES
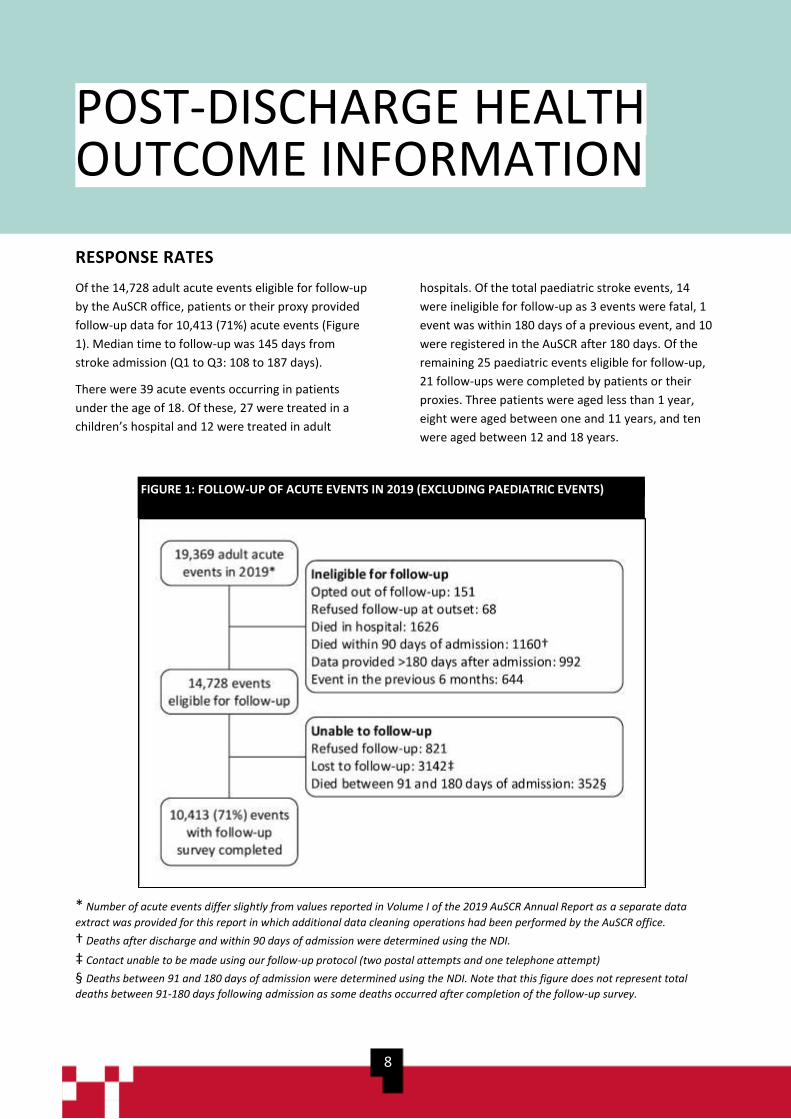
Of the 14,728 adult acute events eligible for follow-up
by the AuSCR office, patients or their proxy provided
follow-up data for 10,413 (71%) acute events (Figure
1). Median time to follow-up was 145 days from
stroke admission (Q1 to Q3: 108 to 187 days).
There were 39 acute events occurring in patients
under the age of 18. Of these, 27 were treated in a
children’s hospital and 12 were treated in adult
hospitals. Of the total paediatric stroke events, 14
were ineligible for follow-up as 3 events were fatal, 1
event was within 180 days of a previous event, and 10
were registered in the AuSCR after 180 days. Of the
remaining 25 paediatric events eligible for follow-up,
21 follow-ups were completed by patients or their
proxies. Three patients were aged less than 1 year,
eight were aged between one and 11 years, and ten
were aged between 12 and 18 years.
* Number of acute events differ slightly from values reported in Volume I of the 2019 AuSCR Annual Report as a separate data
extract was provided for this report in which additional data cleaning operations had been performed by the AuSCR office.
† Deaths after discharge and within 90 days of admission were determined using the NDI.
‡ Contact unable to be made using our follow-up protocol (two postal attempts and one telephone attempt)
§ Deaths between 91 and 180 days of admission were determined using the NDI. Note that this figure does not represent total
deaths between 91-180 days following admission as some deaths occurred after completion of the follow-up survey.
FIGURE 1: FOLLOW-UP OF ACUTE EVENTS IN 2019 (EXCLUDING PAEDIATRIC EVENTS)
FIGURE 2: FOLLOW-UP OF ACUTE EVENTS IN 2019 (EXCLUDING PAEDIATRIC EVENTS)
9
FOLLOW-UP DATA
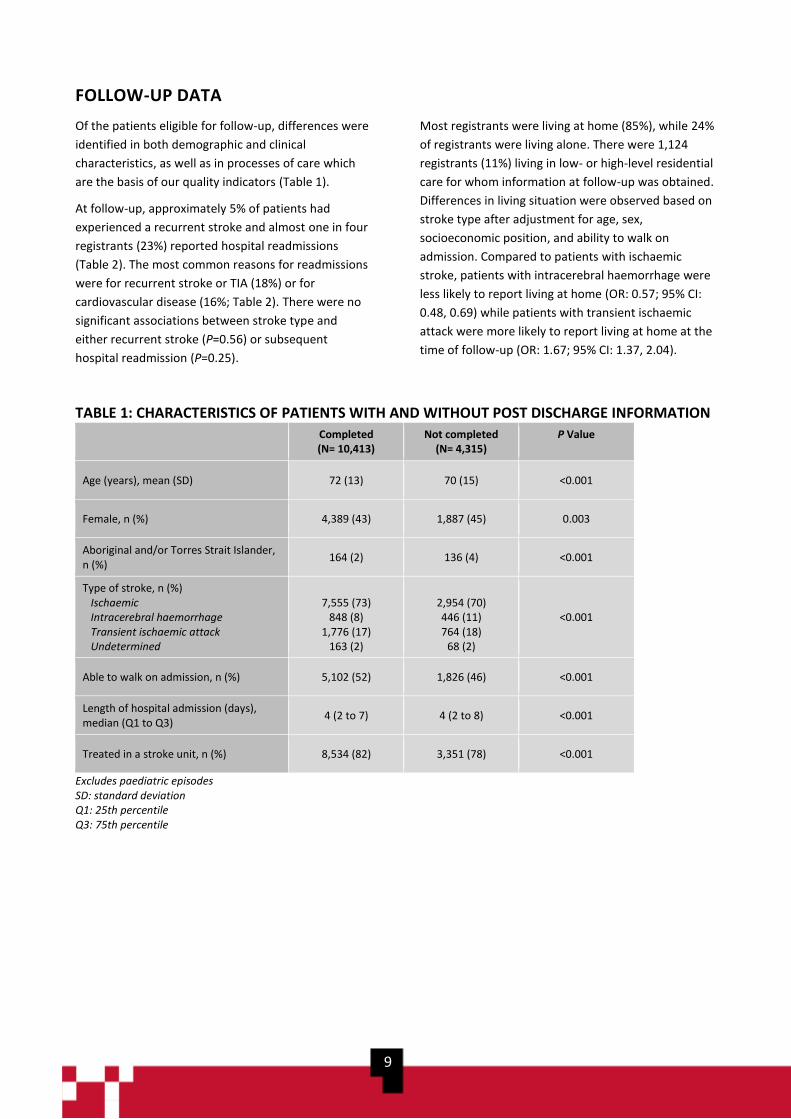
Of the patients eligible for follow-up, differences were
identified in both demographic and clinical
characteristics, as well as in processes of care which
are the basis of our quality indicators (Table 1).
At follow-up, approximately 5% of patients had
experienced a recurrent stroke and almost one in four
registrants (23%) reported hospital readmissions
(Table 2). The most common reasons for readmissions
were for recurrent stroke or TIA (18%) or for
cardiovascular disease (16%; Table 2). There were no
significant associations between stroke type and
either recurrent stroke (P=0.56) or subsequent
hospital readmission (P=0.25).
Most registrants were living at home (85%), while 24%
of registrants were living alone. There were 1,124
registrants (11%) living in low- or high-level residential
care for whom information at follow-up was obtained.
Differences in living situation were observed based on
stroke type after adjustment for age, sex,
socioeconomic position, and ability to walk on
admission. Compared to patients with ischaemic
stroke, patients with intracerebral haemorrhage were
less likely to report living at home (OR: 0.57; 95% CI:
0.48, 0.69) while patients with transient ischaemic
attack were more likely to report living at home at the
time of follow-up (OR: 1.67; 95% CI: 1.37, 2.04).
TABLE 1: CHARACTERISTICS OF PATIENTS WITH AND WITHOUT POST DISCHARGE INFORMATION
Completed (N= 10,413)
Not completed (N= 4,315)
P Value
Age (years), mean (SD) 72 (13) 70 (15) <0.001
Female, n (%) 4,389 (43) 1,887 (45) 0.003
Aboriginal and/or Torres Strait Islander, n (%)
164 (2) 136 (4) <0.001
Type of stroke, n (%) Ischaemic Intracerebral haemorrhage Transient ischaemic attack Undetermined
7,555 (73)
848 (8) 1,776 (17)
163 (2)
2,954 (70) 446 (11) 764 (18)
68 (2)
<0.001
Able to walk on admission, n (%) 5,102 (52) 1,826 (46) <0.001
Length of hospital admission (days), median (Q1 to Q3)
4 (2 to 7) 4 (2 to 8) <0.001
Treated in a stroke unit, n (%) 8,534 (82) 3,351 (78) <0.001
Excludes paediatric episodes SD: standard deviation Q1: 25th percentile Q3: 75th percentile

10
TABLE 2: RECURRENT STROKES, READMISSIONS AND LIVING ARRANGEMENTS
N= 10,413
n (%)
Had a recurrent stroke 525 (5%)
Readmitted to hospital 2,331 (23%)
Time to readmission (days), median (Q1, Q3) 81 (42, 126)
Reason for readmission N= 2,321
Stroke or transient ischaemic attack 428 (18%)
Cardiovascular disease 364 (16%)
Elective surgery 243 (10%)
Injury 228 (10%)
Other neurological condition 163 (7%)
Infection 151 (7%)
Respiratory disease 132 (6%)
Gastrointestinal disease 112 (5%)
Other 500 (22%)
Location at time of follow-up interview N= 10,404
Home 8,840 (85%)
Living alone
Living with others
2,150 (24%)
6,636 (76%)
With care support
Without care support
4,262 (48%)
4,578 (52%)
Institutional care or other setting 1,497 (15%)
In hospital
Transitional care services
Low level care (hostel care)
High level care (nursing home)
Inpatient rehabilitation
Other
108 (7%)
97 (6%)
97 (6%)
1,027 (69%)
103 (7%)
65 (4%)
Missing data not included in denominators Excludes paediatric episodes
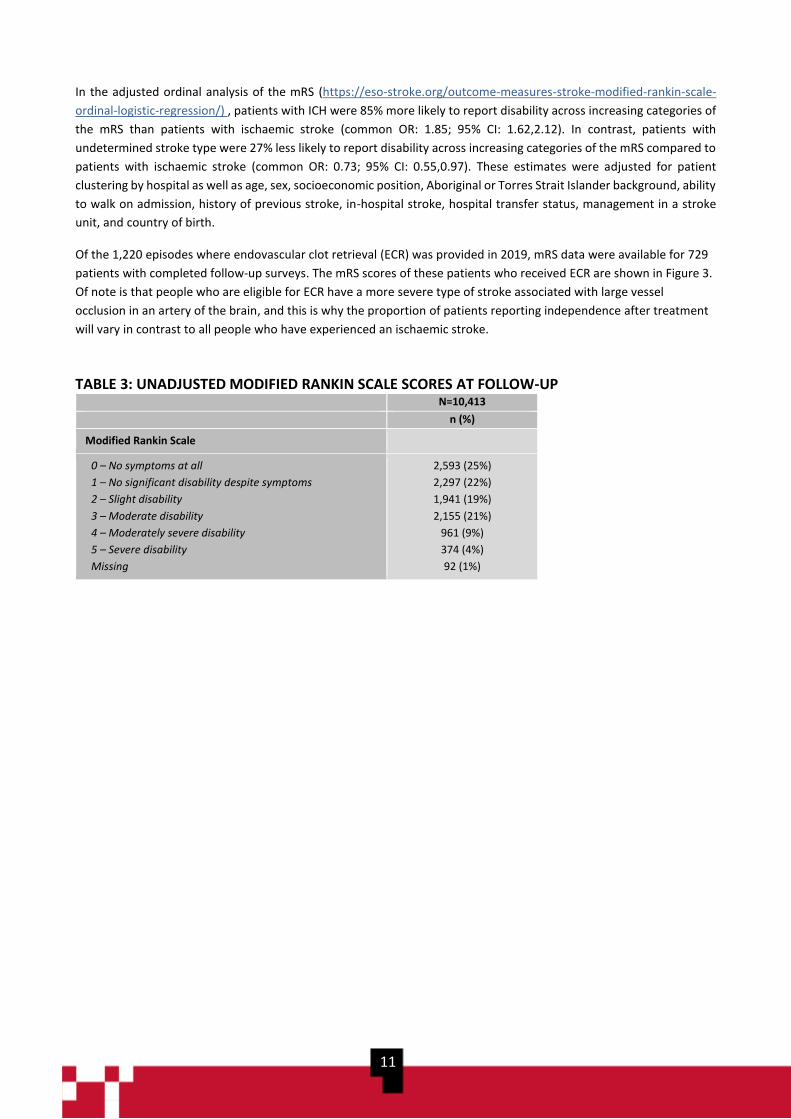
DISABILITY – MODIFIED RANKIN SCALE
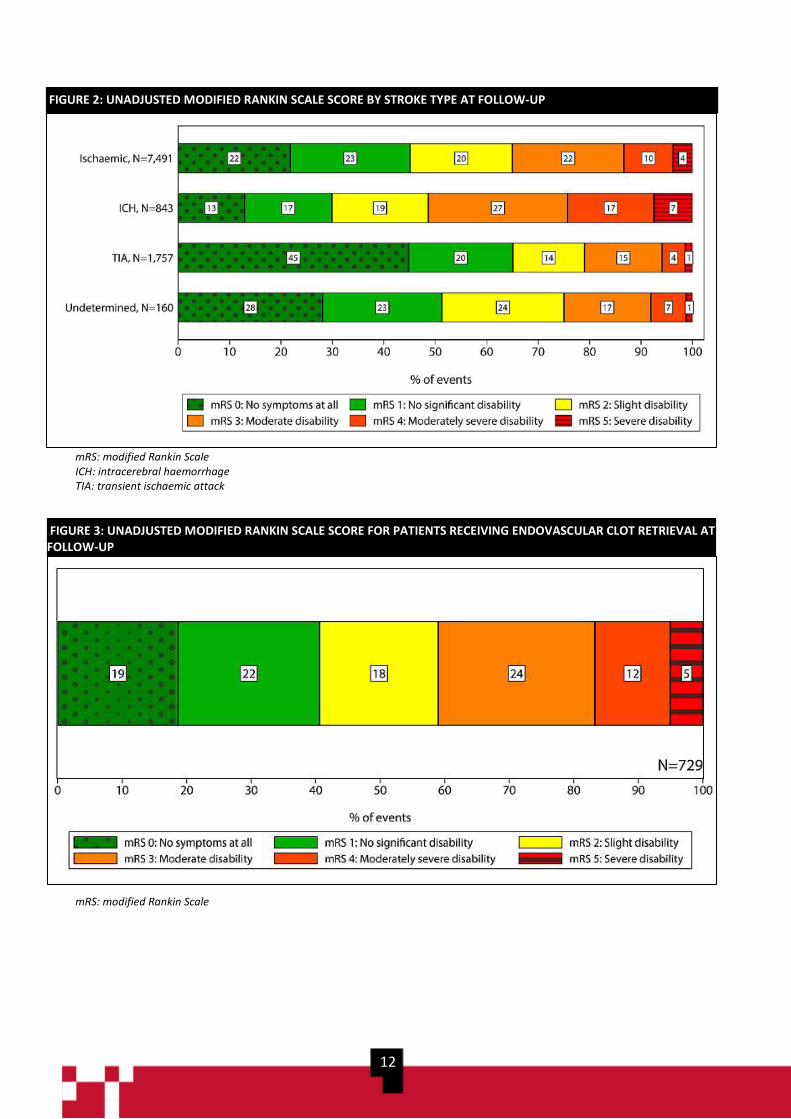
The mRS is widely used in stroke studies to describe person-centred global disability outcomes in terms of the degree
of disability, or dependence, in daily activities with reference to pre-stroke activities. At follow-up, 25 percent of
registrants reported they were free from disability (mRS score = 0) and 22 percent had no significant disability despite
symptoms (mRS score = 1; Table 3).
The unadjusted median mRS score reported by patients with ICH was 3 (ie moderate disability), compared to a median
mRS score of 2 (ie slight disability, but can manage own affairs without assistance) for patients with ischaemic stroke,
and 1 (i.e. no significant disability despite symptoms) for patients with undetermined stroke or TIA (Figure 2).
11
In the adjusted ordinal analysis of the mRS (https://eso-stroke.org/outcome-measures-stroke-modified-rankin-scale-
ordinal-logistic-regression/) , patients with ICH were 85% more likely to report disability across increasing categories of
the mRS than patients with ischaemic stroke (common OR: 1.85; 95% CI: 1.62,2.12). In contrast, patients with
undetermined stroke type were 27% less likely to report disability across increasing categories of the mRS compared to
patients with ischaemic stroke (common OR: 0.73; 95% CI: 0.55,0.97). These estimates were adjusted for patient
clustering by hospital as well as age, sex, socioeconomic position, Aboriginal or Torres Strait Islander background, ability
to walk on admission, history of previous stroke, in-hospital stroke, hospital transfer status, management in a stroke
unit, and country of birth.
Of the 1,220 episodes where endovascular clot retrieval (ECR) was provided in 2019, mRS data were available for 729
patients with completed follow-up surveys. The mRS scores of these patients who received ECR are shown in Figure 3.
Of note is that people who are eligible for ECR have a more severe type of stroke associated with large vessel
occlusion in an artery of the brain, and this is why the proportion of patients reporting independence after treatment
will vary in contrast to all people who have experienced an ischaemic stroke.
TABLE 3: UNADJUSTED MODIFIED RANKIN SCALE SCORES AT FOLLOW-UP N=10,413
n (%)
Modified Rankin Scale
0 – No symptoms at all
1 – No significant disability despite symptoms
2 – Slight disability
3 – Moderate disability
4 – Moderately severe disability
5 – Severe disability
Missing
2,593 (25%)
2,297 (22%)
1,941 (19%)
2,155 (21%)
961 (9%)
374 (4%)
92 (1%)
12
mRS: modified Rankin Scale ICH: intracerebral haemorrhage TIA: transient ischaemic attack
mRS: modified Rankin Scale
FIGURE 2: UNADJUSTED MODIFIED RANKIN SCALE SCORE BY STROKE TYPE AT FOLLOW-UP
FIGURE 3: UNADJUSTED MODIFIED RANKIN SCALE SCORE FOR PATIENTS RECEIVING ENDOVASCULAR CLOT RETRIEVAL AT FOLLOW-UP

13
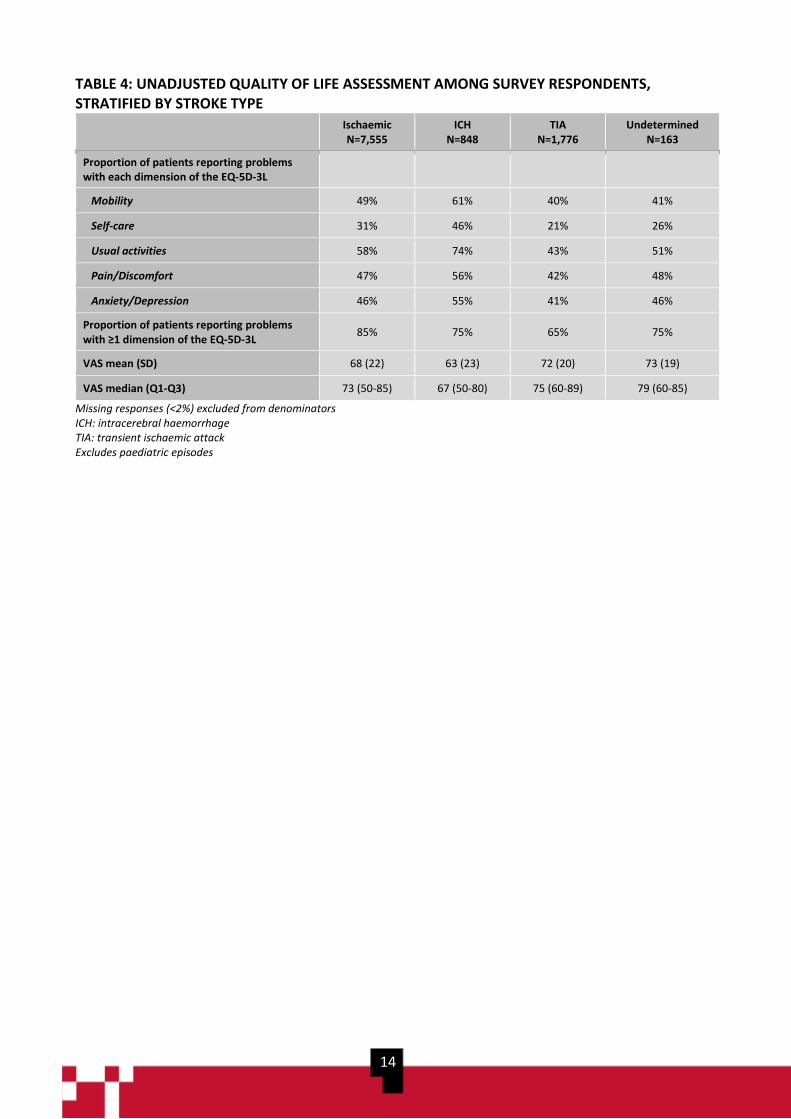
HEALTH-RELATED QUALITY OF LIFE
With respect to health-related quality of life, problems
were most frequently reported with completion of
usual activities (Figure 4). This was consistent across
all stroke types (Table 4). Patients with ICH reported
problems in all dimensions of the EQ-5D-3L more
commonly than the other diagnoses. Overall, 74% of
respondents reported problems with at least one
dimension of the EQ-5D-3L with this proportion being
greatest for those diagnosed with ischaemic stroke
(85%; Table 4).
The mean Visual Analogue Scale (VAS) score, which
represents a registrants’ self-reported overall health,
was 69 (median: 73; min-max: 0-100). Differences in
VAS scores were observed by stroke type, whereby
registrants with ICH had the lowest aggregate VAS
scores (mean: 63; median 67; Table 4) and registrants
with undetermined stroke had the greatest VAS scores
(mean: 73; median 79).
The VAS scores reported by AuSCR registrants should
be considered in relation to a mean of 83 reported for
the normative population of adults in the United
Kingdom.7 Compared to this reference population, the
VAS scores of AuSCR registrants were >10 points
worse after stratifying by age and sex (Table 4). As
these differences exceed 8 points, they represent a
clinically meaningful difference.8
The overall minimum and maximum adjusted mean
VAS scores differed between participating hospitals by
almost 23 points after adjustment for differences in
patient and clinical characteristics (Figure 5).
FIGURE 4: UNADJUSTED PROPORTION OF PATIENTS REPORTING PROBLEMS WITH THE EQ-5D-3L
14
TABLE 4: UNADJUSTED QUALITY OF LIFE ASSESSMENT AMONG SURVEY RESPONDENTS, STRATIFIED BY STROKE TYPE
Ischaemic N=7,555
ICH N=848
TIA N=1,776
Undetermined N=163
Proportion of patients reporting problems with each dimension of the EQ-5D-3L
Mobility 49% 61% 40% 41%
Self-care 31% 46% 21% 26%
Usual activities 58% 74% 43% 51%
Pain/Discomfort 47% 56% 42% 48%
Anxiety/Depression 46% 55% 41% 46%
Proportion of patients reporting problems with ≥1 dimension of the EQ-5D-3L
85% 75% 65% 75%
VAS mean (SD) 68 (22) 63 (23) 72 (20) 73 (19)
VAS median (Q1-Q3) 73 (50-85) 67 (50-80) 75 (60-89) 79 (60-85)
Missing responses (<2%) excluded from denominators ICH: intracerebral haemorrhage TIA: transient ischaemic attack Excludes paediatric episodes

15
Adjusted for differences in patient age, sex, socioeconomic position, country of birth, Indigenous status, type of stroke, in-hospital stroke, history
of previous stroke, and ability to walk on admission.
Mean of 83 for the normative adult population was obtained from the United Kingdom.7
The median number of responders to the VAS survey per hospital was 119 (min-max: 1-666).
FIGURE 6: HEALTH-RELATED QUALITY OF LIFE SCORES ACCORDING TO THE ADJUSTED VISUAL ANALOGUE SCALE AT FOLLOW-UP, BY HOSPITAL FIGURE 5: HEALTH-RELATED QUALITY OF LIFE SCORES ACCORDING TO THE ADJUSTED VAS AT FOLLOW-UP, BY HOSPITAL
16
SURVIVAL
Survival status was ascertained for the entire
AuSCR cohort using data linkage with the
National Death Index. Of the total acute
stroke events recorded in 2019, 9% of events
resulted in death prior to hospital discharge,
6% between discharge and 90 days of
admission, and 2% between 91 and 180 days
of admission. For patients with ischaemic
stroke, treatment in a stroke unit was
associated with a 50% lower hazard of death
at 180 days after admission than treatment
on an alternate ward (hazard ratio 0.50, 95%
confidence interval 0.45,0.55, p<0.001,
Figure 6). A larger effect of a 64% lower
hazard of death, was found for patients with
ICH (hazard ratio 0.36, 95% confidence
interval 0.31,0.41, p<0.001, Figure 7). These
analyses were adjusted for age, sex, ability to
walk on admission, in-hospital stroke and
transfer from another hospital.
FIGURE 6: CUMULATIVE HAZARD OF DEATH, BY TREATMENT IN A STROKE UNIT (ISCHAEMIC STROKE)
FIGURE 7: CUMULATIVE HAZARD OF DEATH, BY TREATMENT IN A STROKE UNIT (INTRACEREBRAL HAEMORRHAGE)
17
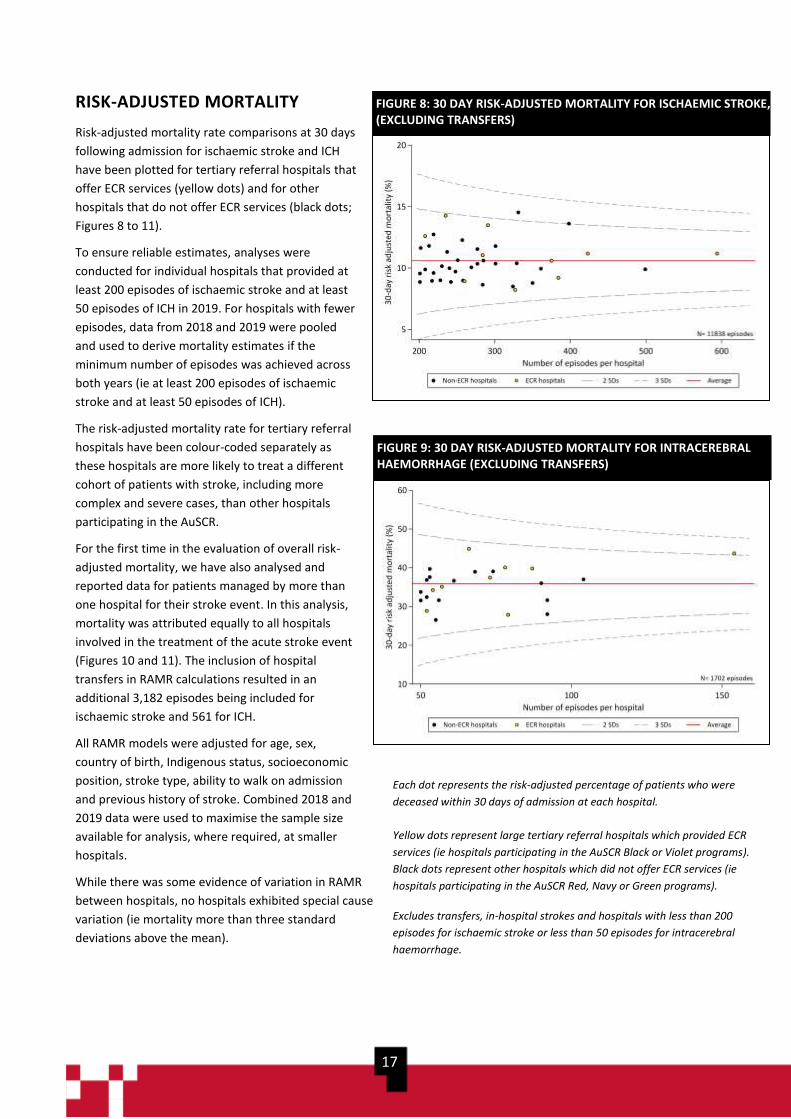
RISK-ADJUSTED MORTALITY
Risk-adjusted mortality rate comparisons at 30 days
following admission for ischaemic stroke and ICH
have been plotted for tertiary referral hospitals that
offer ECR services (yellow dots) and for other
hospitals that do not offer ECR services (black dots;
Figures 8 to 11).
To ensure reliable estimates, analyses were
conducted for individual hospitals that provided at
least 200 episodes of ischaemic stroke and at least
50 episodes of ICH in 2019. For hospitals with fewer
episodes, data from 2018 and 2019 were pooled
and used to derive mortality estimates if the
minimum number of episodes was achieved across
both years (ie at least 200 episodes of ischaemic
stroke and at least 50 episodes of ICH).
The risk-adjusted mortality rate for tertiary referral
hospitals have been colour-coded separately as
these hospitals are more likely to treat a different
cohort of patients with stroke, including more
complex and severe cases, than other hospitals
participating in the AuSCR.
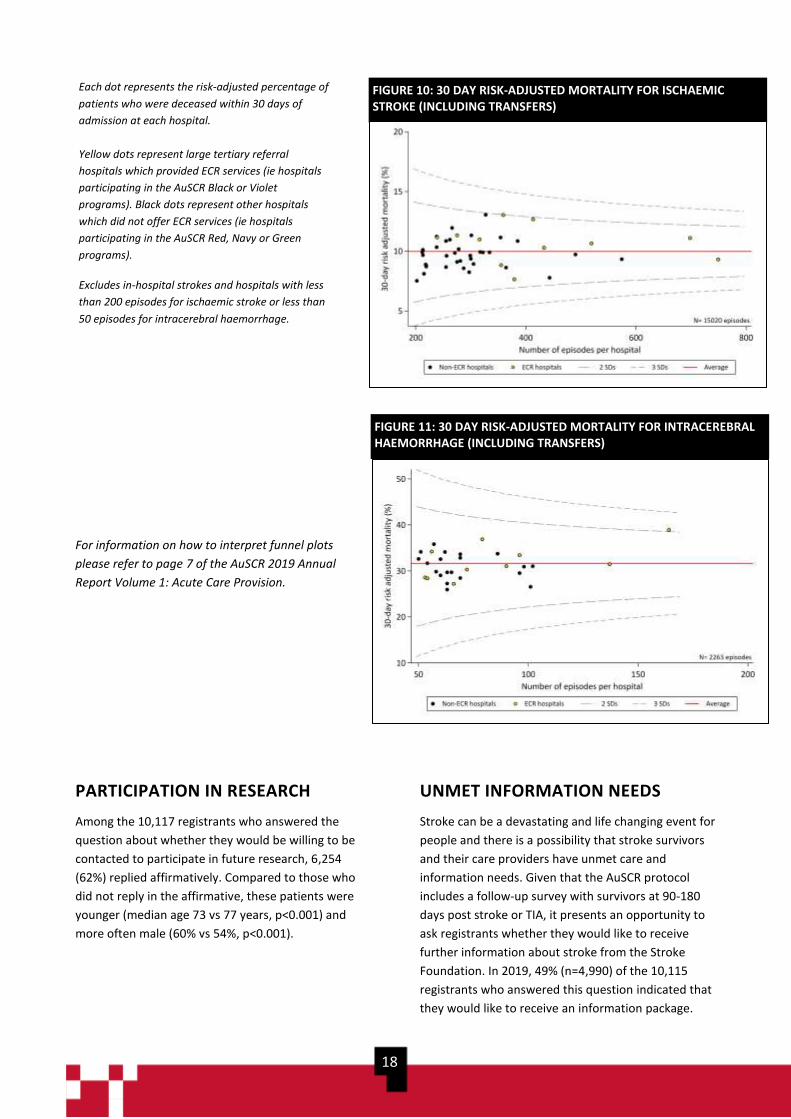
For the first time in the evaluation of overall risk-
adjusted mortality, we have also analysed and
reported data for patients managed by more than
one hospital for their stroke event. In this analysis,
mortality was attributed equally to all hospitals
involved in the treatment of the acute stroke event
(Figures 10 and 11). The inclusion of hospital
transfers in RAMR calculations resulted in an
additional 3,182 episodes being included for
ischaemic stroke and 561 for ICH.
All RAMR models were adjusted for age, sex,
country of birth, Indigenous status, socioeconomic
position, stroke type, ability to walk on admission
and previous history of stroke. Combined 2018 and
2019 data were used to maximise the sample size
available for analysis, where required, at smaller
hospitals.
While there was some evidence of variation in RAMR
between hospitals, no hospitals exhibited special cause
variation (ie mortality more than three standard
deviations above the mean).
FIGURE 8: 30 DAY RISK-ADJUSTED MORTALITY FOR ISCHAEMIC STROKE, (EXCLUDING TRANSFERS)
FIGURE 9: 30 DAY RISK-ADJUSTED MORTALITY FOR INTRACEREBRAL HAEMORRHAGE (EXCLUDING TRANSFERS)
Each dot represents the risk-adjusted percentage of patients who were
deceased within 30 days of admission at each hospital.
Yellow dots represent large tertiary referral hospitals which provided ECR
services (ie hospitals participating in the AuSCR Black or Violet programs).
Black dots represent other hospitals which did not offer ECR services (ie
hospitals participating in the AuSCR Red, Navy or Green programs).
Excludes transfers, in-hospital strokes and hospitals with less than 200
episodes for ischaemic stroke or less than 50 episodes for intracerebral
haemorrhage.
18
For information on how to interpret funnel plots
please refer to page 7 of the AuSCR 2019 Annual
Report Volume 1: Acute Care Provision.
PARTICIPATION IN RESEARCH
Among the 10,117 registrants who answered the
question about whether they would be willing to be
contacted to participate in future research, 6,254
(62%) replied affirmatively. Compared to those who
did not reply in the affirmative, these patients were
younger (median age 73 vs 77 years, p<0.001) and
more often male (60% vs 54%, p<0.001).
UNMET INFORMATION NEEDS
Stroke can be a devastating and life changing event for
people and there is a possibility that stroke survivors
and their care providers have unmet care and
information needs. Given that the AuSCR protocol
includes a follow-up survey with survivors at 90-180
days post stroke or TIA, it presents an opportunity to
ask registrants whether they would like to receive
further information about stroke from the Stroke
Foundation. In 2019, 49% (n=4,990) of the 10,115
registrants who answered this question indicated that
they would like to receive an information package.
FIGURE 10: 30 DAY RISK-ADJUSTED MORTALITY FOR ISCHAEMIC STROKE (INCLUDING TRANSFERS)
FIGURE 11: 30 DAY RISK-ADJUSTED MORTALITY FOR INTRACEREBRAL HAEMORRHAGE (INCLUDING TRANSFERS)
Each dot represents the risk-adjusted percentage of
patients who were deceased within 30 days of
admission at each hospital.
Yellow dots represent large tertiary referral
hospitals which provided ECR services (ie hospitals
participating in the AuSCR Black or Violet
programs). Black dots represent other hospitals
which did not offer ECR services (ie hospitals
participating in the AuSCR Red, Navy or Green
programs).
Excludes in-hospital strokes and hospitals with less
than 200 episodes for ischaemic stroke or less than
50 episodes for intracerebral haemorrhage.

19
DISCUSSION This report outlines the patient outcomes for 2019 stroke and TIA admissions and is
intended to be read in conjunction with the AuSCR 2019 Annual Report Volume 1:
Acute Care Provision.
Follow-up data collection The overall rate of follow-up completion for eligible
registrants increased to 71% in 2019, from 69% in 2018
and 65% in 2017. This represents a very high rate of
completion when compared to other international
stroke registries such as SSNAP, which complete patient
follow-up on 30% of eligible patients.9 The trend of
increased rates of follow-up completion is a testament
to the hard work and refined protocols of the AuSCR
office. Ongoing training and support for hospital staff
are provided by the AuSCR office, with an increased
emphasis on timely data entry to enable follow-up
completion at 90-180 days post admission since 2017.
Patient outcomes This findings in this report illustrate high levels of
patients reporting difficulty across all five dimensions of
the EQ-5D-3L ranging from 31% for self-care to 57% for
difficulties in completing the usual activities of daily
living. The overall mean VAS score of 69 as a measure of
overall health (when compared to the normative
population mean value of 83) is also indicative of
ongoing health problems. Twenty-three percent of
patients documented readmissions at 90-180 days after
admission (with 18% of these for recurrent stroke or
TIA), and almost half (49%) of patients requested more
information about stroke. To address these findings,
there is a pressing need to consider improved models of
care and support for patients with stroke following
hospital discharge. National Registries, such as the
AuSCR, are ideally placed to play an important role in
the development and monitoring of such models of
care, where routinely collected follow-up data could be
used to identify patients with high levels of health
needs, or those at risk of poor outcomes (eg
readmissions). Summaries of individual patient data
could then be fed back to participating hospitals and
this information could prompt an outpatient review of
those most in need and or at risk of poor outcomes. In
the year ahead, the AuSCR will aim to build upon
previous experience with summarising patient-reported
outcome data7 to develop and test the effectiveness of
new models of care to improve patient outcomes after
stroke.
Significant variation in case mix adjusted analyses of the
EQ-5D-3L VAS was identified between hospitals in the
2019 dataset. The difference in mean VAS scores
between the best and worst performing hospital was 23
points. The clinically meaningful difference in VAS
scores for patients with stroke has been reported by
previous authors as eight points7 and further analysis to
explore the factors contributing to these variations is
required. The results reported using the AuSCR 2019
dataset also suggest that the VAS data may play an
important role in ongoing hospital quality improvement
initiatives such as the, StrokeLink and Tasmanian
Community of Practice programs.
The proportion of registrants who received
endovascular clot retrieval and reported an unadjusted
mRS scores of 0 to 2 was 59%. This is an encouraging
finding when compared to the Highly Effective
Reperfusion Using Multiple Endovascular Devices
(HERMES) collaboration finding 46% (291/633) of
patients with a mRS score between 0 to 2 using pooled
data reported from multiple ECR interventional
studies.12 In the adjusted ordinal analysis of mRS data,
patients with ICH were more likely to report disability
across increasing categories of the mRS than the other
stroke types or TIA. These observations align with the
unadjusted mRS scores by stroke type reported using
AuSCR data previously
(https://auscr.com.au/about/annual-reports/).
For the first time in the AuSCR Annual Report series, the
risk-adjusted mortality analyses were presented using
different methods to analyse the 2019 data. This
included delineation of tertiary referral hospitals and
non-tertiary referral hospitals; and by reporting
statistical models that both excluded and included
patients who had been treated for their acute event by
more than one hospital. Our analytical team and
supporting Management and Steering Committee
20
representatives believe the delineation of tertiary
referral hospitals in this report enabled clearer
comparisons of mortality rates for hospitals that are
likely to have a greater number of complex and severe
patients. If we did not enhance the reporting of RAMR
calculations, we may not have been able to account for
all differences in our statistical models of case mix
adjustment.
The inclusion of patients who were managed in more
than one hospital (ie irrespective of whether they
presented directly to a hospital or were transferred for
care) for the RAMR analyses enabled a more realistic
assessment of RAMR for hospitals with high rates of
patient transfers. Large tertiary hospitals therefore have
a complete overview of mortality for their patient
cohort when compared with models that exclude
patient transfers. In general, the exclusion or inclusion
of transferred patients receiving care at more than one
hospital made very little difference to RAMR.
While it is reassuring to report that no hospitals
exhibited special cause variation in RAMR, it must be
acknowledged that there may be other confounding
factors which contribute to mortality rates (eg patient
co-morbidities, size of the infarct or occlusion) and that
the RAMR completed by the AuSCR can only adjust for
routinely collected variables. The NIHSS is commonly
used for case mix adjustment in the field of stroke.10
However, while the completion rate of the NIHSS
variable has improved significantly since 2016 (with only
2% missing data in 2019), 42% of baseline NIHSS scores
are still documented as ‘unknown’ (see AuSCR 2019
Data Quality Report). We are therefore unable to adjust
RAMR reliably using the NIHSS, and continue to use the
ability to walk on admission as a proxy for stroke
severity.11 The AuSCR will continue to work with
hospitals to improve the rate of NIHSS documentation,
and to identify barriers to completion of this
measurement in clinical practice. Improvements in the
methods for case mix adjustment for RAMR are also
being explored, so that fairer comparisons between
hospitals with similar patient cohorts can be included in
future reports.
Patient outcomes presented in this report may also
have been influenced by patient discharge destination,
with the authors of previous studies reporting
differences in patient outcomes for those discharged to
inpatient rehabilitation, versus those who were
discharge home or to a residential aged care facility.13
Associations between discharge destination and patient
outcomes such as mortality, subsequent readmissions,
and Health-related Quality of Life (HRQoL) will be
further explored in future AuSCR Annual Reports.
Conclusion Patient outcomes for AuSCR registrations in 2019 were
similar to those observed using 2018 data. The
continued levels of unmet health needs reported by
patients with stroke, and the demand for more
information about stroke following hospital admission,
support the development and testing of new post-
discharge models of patient care. The collection of
standardised patient-reported outcomes data at 90-180
days in the AuSCR, means this leading national registry
is in an ideal position to facilitate the identification of
patients with high levels of health needs, or those at risk
of poor outcomes, for further support by treating
hospitals. Future work will be undertaken to develop
and test novel models of post-discharge support for
patients with stroke.
21
REFERENCES
1. Cadilhac DA, Lannin NA, Anderson CS, et al. Protocol and pilot data for establishing the Australian Stroke Clinical
Registry. International Journal of Stroke. 2010;5:217-226.
2. Australian Commission on Safety and Quality in Health Care. Operating Principles and Technical Standards for
Australian Clinical Quality Registries. Sydney: ACSQHC, 2008 November
3. Evans SM, Loff B, Cameron PA. Clinical registries: the urgent need to address ethical hurdles. MJA. 2013;198:134-
135.
4. van Swieten JC, Koudstaal PJ, Visser MC, Schouten HJA, van Gijn J. Interobserver agreement for the assessment of
handicap in stroke patients. Stroke. 1988;19:604-607
5. The EuroQol Group. EuroQol-a new facility for the measurement of health-related quality of life. Health Policy.
1990;16:199-208
6. Varni JW, Seid M, Rode CA. The PedsQL: measurement model for the pediatric quality of life inventory. Med Care.
1999;37:126-139
7. Kind P, Dolan P, Gudex C, Williams A. Variations in population health status: results from a United Kingdom
national questionnaire survey. BMJ. 1998;316:736-741.
8. Kim SK, Kim SH, Jo MW, Lee SI. Estimation of minimally important differences in the EQ-5D and SF-6D indices and their utility in stroke. Health Qual Life Outcomes. 2015;13:32.
9. Sentinel Stroke National Audit Program, 2019, School of Population Health and Environmental Sciences, King’s
College London on behalf of the Intercollegiate Stroke Working Party, SSNAP Annual Public Report 2018. Available
athttps://www.hqip.org.uk/wp-content/uploads/2019/06/Ref-142-SSNAP-Annual-Report-FINAL.pdf
10. Fonarow GC, Pan w, Saver JL et al. Comparison of 30-day mortality models for profiling hospital performance in
acute ischaemic stroke with vs without adjustment for stroke severity. JAMA. 308 (3); 257-264
11. Counsell C, Dennis M, McDowall M, Warlow C. Predicting outcome after stroke and subacute stroke: development
and validation of new prognostic models. Stroke. 2002; 33 :1041-1047.
12. Goyal M, Menon BK, Van Zwam WH et al. Endovascular thrombectomy after large-vessel ischaemic stroke: a meta-
analysis of individual patient data from five randomised trials. Lancet. 2016; 3877:1723-1731.
13. Lynch EA, Labberton AS, Kim J et al. Out of sight, out of mind: long-term outcomes for people discharged home, to
inpatient rehabilitation and to residential aged care after stroke. Disability and Rehabilitation. 2020; DOI:
10.1080/09638288.2020.1852616
22
APPENDIX A: ABBREVIATIONS
AuSCR Australian Stroke Clinical Registry
AuSDaT Australian Stroke Data Tool
ECR Endovascular clot retrieval
ED Emergency Department
EQ-5D-3LTM European Quality of Life - five dimension three level instrument
ECR Endovascular clot retrieval
HRQoL Health-related quality of life
ICH Intracerebral haemorrhage
mRS Modified Rankin Scale
NDI National Death Index
NIHSS National Institutes of Health Stroke Scale
Q1/Q3 25th percentile/75th percentile
PROMs Patient-reported outcome measures
RAMR Risk-adjusted mortality rate
SD Standard deviation
SSNAP Sentinel Stroke National Audit Program
STELAR Shared Team Efforts Leading to Adherence Results
TIA Transient ischaemic attack
VAS Visual Analogue Scale