wartenberg pendulum test: objective quantification of...
TRANSCRIPT

LUND UNIVERSITY
PO Box 117221 00 Lund+46 46-222 00 00
Wartenberg pendulum test: objective quantification of muscle tone in children withspastic diplegia undergoing selective dorsal rhizotomy.
Nordmark, Eva A-K; Andersson, Gert
Published in:Developmental Medicine & Child Neurology
DOI:10.1111/j.1469-8749.2002.tb00255.x
Published: 2002-01-01
Link to publication
Citation for published version (APA):Nordmark, E., & Andersson, G. (2002). Wartenberg pendulum test: objective quantification of muscle tone inchildren with spastic diplegia undergoing selective dorsal rhizotomy. Developmental Medicine & ChildNeurology, 44(1), 26-33. DOI: 10.1111/j.1469-8749.2002.tb00255.x
General rightsCopyright and moral rights for the publications made accessible in the public portal are retained by the authorsand/or other copyright owners and it is a condition of accessing publications that users recognise and abide by thelegal requirements associated with these rights.
• Users may download and print one copy of any publication from the public portal for the purpose of privatestudy or research. • You may not further distribute the material or use it for any profit-making activity or commercial gain • You may freely distribute the URL identifying the publication in the public portal

Take down policyIf you believe that this document breaches copyright please contact us providing details, and we will removeaccess to the work immediately and investigate your claim.
Download date: 10. Jul. 2018

Wartenberg pendulum
test: objective
quantification of
muscle tone in children
with spastic diplegia
undergoing selective
dorsal rhizotomy
Eva Nordmark* MD PhD RPT, Department of Physical Therapy;
Gert Andersson MD PhD, Department of Clinical
Neurophysiology, Lund University, Sweden.
*Correspondence to first author at Department of Physical
Therapy, Institute of Musculoskeletal Disorders, Lund
University, SE-221 85 Lund, Sweden.
E-mail: [email protected]
The aim of this study was to investigate the reliability and
sensitivity of the Wartenberg pendulum test for quantification
of muscle tone in young children with spastic diplegia
undergoing selective dorsal rhizotomy (SDR). Fourteen non-
disabled children (mean age of 5.5 years, age range 2.3 to 8.8
years, one female and one male in each year) were tested
twice. Twenty children with spastic diplegia (12 males, eight
females; mean age of 4.3 years, age range 2.5 to 6.3 years)
consecutively selected for SDR, were assessed before and 6
months after SDR. Parameters of the pendulum test: R2, R1,
maximal velocity, and swing time were correlated with clinical
assessments for spasticity (modified Ashworth scale,
quadriceps reflex) and measurements of gross motor function:
the Gross Motor Function Classification System and the Gross
Motor Function Measure. The Wartenberg pendulum test was
found to be an objective and sensitive method for quantifying
spasticity in knee extensor muscles in children as young as 2.5
years old. The method was responsive to changes after SDR.
The only correlation with clinical measurements of spasticity
was between the R2 ratio and the quadriceps reflex. Swing
time was the most reliable and sensitive variable; it showed a
weak correlation with measurements for gross motor function.
Spasticity is a common motor impairment in children with
cerebral palsy (CP). It is the result of an insult to the developing
brain that produces a disorder of movement and posture that is
permanent but not unchanging (Rang et al. 1989). Spasticity is
characterized by a velocity-dependent increase in tonic stretch
reflexes with exaggerated tendon reflexes resulting from
hyperexcitability of the stretch reflex as one component of the
upper motor neuron syndrome (Lance 1980). It is a disabling
impairment, which interferes with the maintenance of posture
and coordinated voluntary movements and may lead to con-
tractures, deformities, and pain. It disrupts activities in daily liv-
ing and limits the efficacy of physical therapy (Davies 1977).
Most knowledge about spasticity is based on studies of adults
with stroke, spinal cord injury, and multiple sclerosis (MS).
Less is known about spasticity in children with CP.
The measurement of spasticity is a difficult and unresolved
problem, partly due to its complex and multifactorial nature
(Katz et al. 1992). Clinical, electrophysiological, and biome-
chanical techniques have been used in its assessment (Sehgal
and McGuire 1998). In the clinical setting, spasticity is most
often assessed subjectively by quantifying the muscle tendon
reflexes and by the original Ashworth scale which grades resis-
tance to passive movement across a relaxed joint on an ordinal
scale of 0 to 4 (Ashworth 1964). This scale suffers from a clus-
tering effect with most patients grouped in the middle grades,
therefore modifications of the scale have been created by
adding an intermediate grade (Katz and Rymer 1989). The
modified Ashworth scale (Bohannon and Smith 1987) has
been shown to have a high interrater reliability in adult patients
with hemiplegia when testing elbow flexors. It is, however,
unreliable for measuring tone in the plantar flexors (Lee et al.
1989, Sloan et al. 1992). Another reported disadvantage of the
Ashworth scale, original as well as modified, is its inability to
differentiate the components of muscle tone (viscoelastic
properties versus reflex activation of the contractile elements).
In addition, the testing can be performed at different velocities
by different investigators which might affect the result (Sehgal
and McGuire 1998). Reliability and validity of the Ashworth
scale have never been studied in children with CP.
The assessment and management of spasticity in children
with CP is a challenging task for clinicians as well as for
researchers. New techniques to treat spasticity in children with
CP, such as selective dorsal rhizotomy (SDR), botulinum toxin
injections, intrathecal baclofen infusion, and peroral drug
therapy require assessment tools to monitor their effectiveness
(Hinderer and Gupta 1996, Forssberg and Tedroff 1997, Hesse
and Mauritz 1997). In order to quantify spasticity in children
with CP subjective quantification of muscle tendon reflexes
and modifications of the Ashworth scale have been used
(Peacock and Staudt 1991, Staudt et al. 1995, Steinbok et al.
1997, McLaughlin et al. 1998, Wright et al. 1998). A hand-held
force transducer or myometer has been used to quantify resis-
tance to passive motion (Staudt et al. 1995). Biomechanical
measurements, such as the spasticity measurement system
(SMS; Lehmann et al. 1989) have been used for quantification
of the plantar flexors (Price et al.1991). The Kin-com dynamo-
meter has been used for quantification of spasticity in ham-
strings, dorsiflexors, and plantar flexors in children with CP
(Engsberg et al. 1996, 1998, 1999). However, the authors com-
mented that children who were not large enough to fit com-
fortably in the test equipment and who could not presumably
cooperate had to be excluded (Engsberg et al. 1998).
26 Developmental Medicine & Child Neurology 2002, 44: 26–33
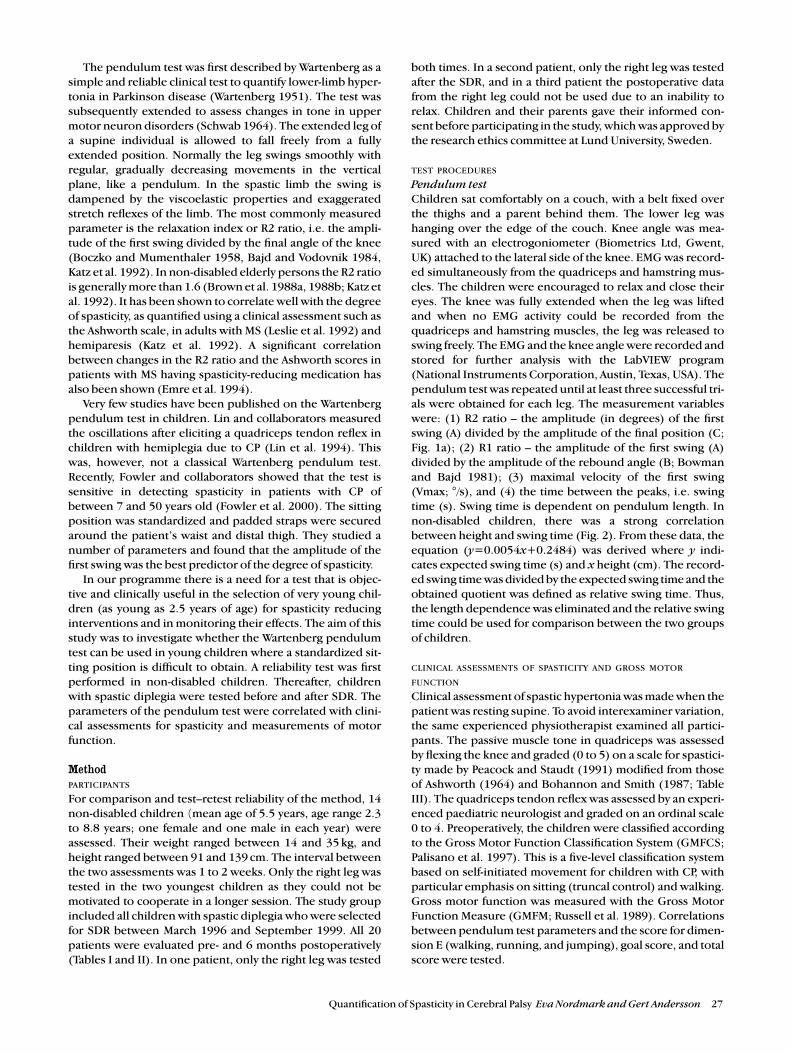
The pendulum test was first described by Wartenberg as a
simple and reliable clinical test to quantify lower-limb hyper-
tonia in Parkinson disease (Wartenberg 1951). The test was
subsequently extended to assess changes in tone in upper
motor neuron disorders (Schwab 1964). The extended leg of
a supine individual is allowed to fall freely from a fully
extended position. Normally the leg swings smoothly with
regular, gradually decreasing movements in the vertical
plane, like a pendulum. In the spastic limb the swing is
dampened by the viscoelastic properties and exaggerated
stretch reflexes of the limb. The most commonly measured
parameter is the relaxation index or R2 ratio, i.e. the ampli-
tude of the first swing divided by the final angle of the knee
(Boczko and Mumenthaler 1958, Bajd and Vodovnik 1984,
Katz et al. 1992). In non-disabled elderly persons the R2 ratio
is generally more than 1.6 (Brown et al. 1988a, 1988b; Katz et
al. 1992). It has been shown to correlate well with the degree
of spasticity, as quantified using a clinical assessment such as
the Ashworth scale, in adults with MS (Leslie et al. 1992) and
hemiparesis (Katz et al. 1992). A significant correlation
between changes in the R2 ratio and the Ashworth scores in
patients with MS having spasticity-reducing medication has
also been shown (Emre et al. 1994).
Very few studies have been published on the Wartenberg
pendulum test in children. Lin and collaborators measured
the oscillations after eliciting a quadriceps tendon reflex in
children with hemiplegia due to CP (Lin et al. 1994). This
was, however, not a classical Wartenberg pendulum test.
Recently, Fowler and collaborators showed that the test is
sensitive in detecting spasticity in patients with CP of
between 7 and 50 years old (Fowler et al. 2000). The sitting
position was standardized and padded straps were secured
around the patient’s waist and distal thigh. They studied a
number of parameters and found that the amplitude of the
first swing was the best predictor of the degree of spasticity.
In our programme there is a need for a test that is objec-
tive and clinically useful in the selection of very young chil-
dren (as young as 2.5 years of age) for spasticity reducing
interventions and in monitoring their effects. The aim of this
study was to investigate whether the Wartenberg pendulum
test can be used in young children where a standardized sit-
ting position is difficult to obtain. A reliability test was first
performed in non-disabled children. Thereafter, children
with spastic diplegia were tested before and after SDR. The
parameters of the pendulum test were correlated with clini-
cal assessments for spasticity and measurements of motor
function.
Method
PARTICIPANTS
For comparison and test–retest reliability of the method, 14
non-disabled children (mean age of 5.5 years, age range 2.3
to 8.8 years; one female and one male in each year) were
assessed. Their weight ranged between 14 and 35 kg, and
height ranged between 91 and 139 cm. The interval between
the two assessments was 1 to 2 weeks. Only the right leg was
tested in the two youngest children as they could not be
motivated to cooperate in a longer session. The study group
included all children with spastic diplegia who were selected
for SDR between March 1996 and September 1999. All 20
patients were evaluated pre- and 6 months postoperatively
(Tables I and II). In one patient, only the right leg was tested
both times. In a second patient, only the right leg was tested
after the SDR, and in a third patient the postoperative data
from the right leg could not be used due to an inability to
relax. Children and their parents gave their informed con-
sent before participating in the study, which was approved by
the research ethics committee at Lund University, Sweden.
TEST PROCEDURES
Pendulum testChildren sat comfortably on a couch, with a belt fixed over
the thighs and a parent behind them. The lower leg was
hanging over the edge of the couch. Knee angle was mea-
sured with an electrogoniometer (Biometrics Ltd, Gwent,
UK) attached to the lateral side of the knee. EMG was record-
ed simultaneously from the quadriceps and hamstring mus-
cles. The children were encouraged to relax and close their
eyes. The knee was fully extended when the leg was lifted
and when no EMG activity could be recorded from the
quadriceps and hamstring muscles, the leg was released to
swing freely. The EMG and the knee angle were recorded and
stored for further analysis with the LabVIEW program
(National Instruments Corporation, Austin, Texas, USA). The
pendulum test was repeated until at least three successful tri-
als were obtained for each leg. The measurement variables
were: (1) R2 ratio – the amplitude (in degrees) of the first
swing (A) divided by the amplitude of the final position (C;
Fig. 1a); (2) R1 ratio – the amplitude of the first swing (A)
divided by the amplitude of the rebound angle (B; Bowman
and Bajd 1981); (3) maximal velocity of the first swing
(Vmax; °/s), and (4) the time between the peaks, i.e. swing
time (s). Swing time is dependent on pendulum length. In
non-disabled children, there was a strong correlation
between height and swing time (Fig. 2). From these data, the
equation (y=0.0054x+0.2484) was derived where y indi-
cates expected swing time (s) and x height (cm). The record-
ed swing time was divided by the expected swing time and the
obtained quotient was defined as relative swing time. Thus,
the length dependence was eliminated and the relative swing
time could be used for comparison between the two groups
of children.
CLINICAL ASSESSMENTS OF SPASTICITY AND GROSS MOTOR
FUNCTION
Clinical assessment of spastic hypertonia was made when the
patient was resting supine. To avoid interexaminer variation,
the same experienced physiotherapist examined all partici-
pants. The passive muscle tone in quadriceps was assessed
by flexing the knee and graded (0 to 5) on a scale for spastici-
ty made by Peacock and Staudt (1991) modified from those
of Ashworth (1964) and Bohannon and Smith (1987; Table
III). The quadriceps tendon reflex was assessed by an experi-
enced paediatric neurologist and graded on an ordinal scale
0 to 4. Preoperatively, the children were classified according
to the Gross Motor Function Classification System (GMFCS;
Palisano et al. 1997). This is a five-level classification system
based on self-initiated movement for children with CP, with
particular emphasis on sitting (truncal control) and walking.
Gross motor function was measured with the Gross Motor
Function Measure (GMFM; Russell et al. 1989). Correlations
between pendulum test parameters and the score for dimen-
sion E (walking, running, and jumping), goal score, and total
score were tested.
Quantification of Spasticity in Cerebral Palsy Eva Nordmark and Gert Andersson 27

STATISTICAL ANALYSIS
Mean values of the different parameters from the right and left
leg were calculated separately as they cannot be considered as
independent variables. However, for the correlations with
functional tests a mean of the right and left leg was used.
When testing reliability the results of the second test were
expressed as percentage of the first test and then the coeffi-
cient of variation was calculated. Differences between pre- and
postoperative values were calculated with a paired, two-tailed
Student t-test. Differences between preoperative values in
28 Developmental Medicine & Child Neurology 2002, 44: 26–33
Table I: Preoperative parameters in children with CP
Participant Age Sex Height GMFCS GMFM t GMFM e Right legnr (y) (cm) Quadriceps Modified R1 R2 Vmax Relative
reflex Ashworth (˚/s) swingscale time (s)
1 2.5 M 85 4 29 0 3 3 1.36 0.78 144 0.44
2 2.8 F 97 4 27 0 3 2 1.55 1.12 325 0.52
3 3.3 M 92 4 40 0 2 3 1.06 1.49 285 0.21
4 3.3 F 92 3 51 17 3 1 1.61 1.13 303 0.42
5 3.3 M 100 3 57 6 2.5 2 1.83 0.86 223 0.44
6 3.4 F 92 5 19 0 3 4 1.34 1.22 235 0.30
7 3.4 M 104 4 42 0 3 3 1.27 1.05 280 0.41
8 3.5 F 98 1 80 65 3 1 1.53 1.19 307 0.76
9 3.8 M 92 4 36 4 3 2 1.32 1.40 242 0.59
10 3.7 M 93 4 36 4 3.5 2 1.43 0.66 92 0.45
11 4 M 100 4 20 0 3 4 1.88 1.14 223 0.52
12 4.9 M 97 4 27 0 3 2 1.68 0.75 232 0.39
13 4.9 F 101 2 80 57 3 2 1.75 0.95 233 0.72
14 5.2 F 96 4 21 1 3.5 2 1.28 0.71 262 0.59
15 5.2 F 103 3 68 18 3.5 2 1.26 0.78 270 0.43
16 5.2 M 102 2 76 38 3 1 1.28 0.94 178 0.55
17 5.3 M 104 3 63 14 3 2 1.66 1.15 189 0.29
18 5.6 F 104 4 62 17 3.5 3 1.59 0.71 297 0.53
19 6 M 113 2 88 82 2.5 1 1.57 1.17 273 0.67
20 6.3 M 104 2 84 57 3 2 1.94 1.32 282 0.87
Mean 4.3 – – 3 50 19 3 2.2 1.51 1.03 244 0.50
SD 1.1 – – – – – – – 0.24 0.25 58 0.16
Median – – – 4 47 5 3 2 1.54 1.09 252 0.48
In participant 8, left leg was not investigated. GMFCS, Gross Motor Function Classification System; GMFM t, Gross Motor Function Measure
total score; GMFM e, Gross Motor Function Measure, dimension E (walking, running, and jumping); R1, amplitude of first swing divided by
amplitude of rebound angle; R2, amplitude of first swing divided by final angle of knee; Vmax, maximal velocity.
Table II: Measurements at first test for control children, and pre- and postoperatively for children with CP
Variables Control children (n=14) CP preop (n=20) CP preop–controln Mean SD Range n Mean SD Range % pa
R2 ratio
Right 14 1.86 0.26 (1.37–2.24) 20 1.03 0.25 (0.66–1.49) 55 <0.001
Left 12 1.82 0.22 (1.35–2.13) 19 1.10 0.26 (0.72–1.54) 60 <0.001
R1 ratio
Right 14 4.01 1.40 (1.83–6.95) 20 1.51 0.24 (1.06–1.94) 38 <0.001
Left 12 3.78 1.24 (1.93–6.11) 19 1.88 0.50 (1.15–3.17) 50 <0.001
Vmax (˚/s)
Right 14 388 77.5 (277–492) 20 244 58.0 (92–325) 63 <0.001
Left 12 392 39.8 (329–459) 19 260 60.0 (142–366) 66 <0.001
Relative swing time (s)
Right 14 1.00 0.03 (0.96–1.07) 20 0.50 0.16 (0.20–0.79) 50 <0.001
Left 12 1.00 0.05 (0.90–1.06) 19 0.59 0.17 (0.30–0.85) 59 <0.001
%, mean preoperative values as a percentage of control group; ns=p>0.1.a Differences between values of CP group preoperatively and control group, calculated with unpaired Student t-test, two-tailed p value.b Differences between pre- and postoperative values calculated with paired Student t-test, two-tailed p value. R2, amplitude of first swing divided
by final angle of knee; R1 ratio, amplitude of first swing divided by amplitude of rebound angle; Vmax, maximal velocity.

those with CP and unaffected children were calculated with
unpaired, two-tailed Student t-test. The results from the pen-
dulum test were compared with the clinical assessments for
spasticity and function using non-parametric statistics,
Spearman’s rank correlation coefficient (rS). The results from
the pendulum test were correlated with age using parametric
statistics, Pearson’s correlation coefficient (rP). Statistical sig-
nificance was set at p<0.01
Results
PENDULUM TEST IN NON-DISABLED CHILDREN
An example of a typical pendulum test response in a non-dis-
abled 5-year-old female is illustrated in Fig. 1a. The leg move-
ment was characterized by a smooth swing with a low
damping factor. The amplitude of the first swing (A) was
much larger than that of the final position (C). The R2 ratio
was 1.71, R1 3.11, Vmax 381 /̊s, and swing time 0.88 sec-
onds. The expected swing time was 0.84 seconds. Hence the
relative swing time was 1.04. The mean values of 14 right and
12 left legs in the non-disabled children are illustrated in
Figures 3a to 3d and Table II. The two lowest R2 values were
obtained in two of the youngest children. However, for the
whole group, there was no correlation between R2 and age.
Neither did R1 or maximal velocity show any correlation with
age. The swing time, on the other hand, showed a strong cor-
relation with age and height (see Fig. 2), which is to be
expected as it is dependent on pendulum length. When cor-
rected for this, by calculating the relative swing time, the age
dependence was eliminated in order to facilitate the compar-
ison between groups.
TEST–RETEST RELIABILITY IN NON-DISABLED CHILDREN
In order to test the reliability of the pendulum test, the mean
values of the four parameters for each leg were calculated.
The results from the second test were expressed as a percent-
age of the results from the first test and plotted against age in
Figures 4a to 4d. No correlation with age was found. The reli-
ability was expressed as the coefficient of variation (CV), i.e.
the standard deviation as a percentage of the mean. The rela-
tive swing time displayed the lowest CV (4% and 3% in the
right and left legs, respectively).
PENDULUM TEST IN CHILDREN WITH CP
A typical pendulum test in a 5-year-old female with spastic
diplegia before SDR is illustrated in Fig 1b. EMG recordings
from the quadriceps and hamstring muscles are also present-
ed. The diagram differs from that for a normally developing
child in a number of aspects. First, when the leg was
Quantification of Spasticity in Cerebral Palsy Eva Nordmark and Gert Andersson 29
Table I continued
Left legQuadriceps Ashworth R1 R2 Vmax Relative
reflex scale (˚/s) swingtime (s)
3 2 1.94 1.14 185 0.48
3 2 1.34 0.93 241 0.53
2 3 2.5 1.34 239 0.49
2.5 2 2.07 1.42 346 0.85
2.5 3 1.87 1.12 248 0.49
3 4 1.33 1.02 264 0.35
3 2 1.74 1.11 366 0.47
– – – – – –
3 2 2.33 1.54 264 0.89
3.5 2 1.35 0.93 178 0.48
3 4 1.79 1.08 223 0.54
3.5 2 1.94 0.8 292 0.59
3 2 1.93 1.04 299 0.73
3.5 2 1.41 0.69 242 0.50
3 2 1.15 0.85 238 0.34
3 1 1.85 1.27 220 0.70
3.5 2 2.08 1.5 339 0.62
3.5 2 3.17 0.72 298 0.50
3 1 1.43 0.93 142 0.68
2 2.5 2.43 1.41 325 0.89
3 2.2 1.88 1.10 260 0.58
– – 0.50 0.26 60 0.17
3 2 1.87 1.08 248 0.53
Table II continued
CP postop (n=20) CP post–pre CP postop-NDn Mean SD Range pb p a
19 1.76 0.24 (1.50–2.35) <0.001 ns
18 1.85 0.24 (1.62–2.52) <0.001 ns
19 3.35 1.27 (1.26–6.41) <0.001 ns
18 4.00 1.78 (2.42–9.85) <0.001 ns
19 364 63.0 (243–456) <0.001 ns
18 385 84.0 (247–544) <0.001 ns
19 0.93 0.07 (0.76–1.03) <0.001 <0.001
18 0.93 0.07 (0.78–1.07) <0.001 <0.01
Table III: Scale for grading spasticity modified from those of
Ashworth (1964) and Bohannon and Smith (1987) by
Peacock and Staudt (1991)
Score Definition
0 Hypotonic: less than normal muscle tone, floppy
1 Normal: no increase in muscle tone
2 Mild: slight increase in tone, ‘catch’ in limb movement or
minimal resistance to movement through less than half of
the range
3 Moderate: more marked increase in tone through most of
the range of the motion but affected part is easily moved
4 Severe: considerable increase in tone, passive movement
difficult
5 Extreme: affected part rigid in flexion or extension

stretched, there was an extension deficit of 20 degrees, and a
tonic stretch reflex was observed in the hamstrings. Second,
when the leg was released the amplitude of the first swing was
only 40 degrees, i.e. less than the final (vertical) position. As
seen in the EMG recording, the quadriceps muscle was acti-
vated during flexion. This stretch reflex was strong enough to
produce an extension before the lower leg had reached a ver-
tical position, explaining the low R2 ratio (0.74). Also, during
the second and third flexion movements, stretch reflexes
were elicited in the quadriceps. At the end of the pendular
movement when the knee was flexed, a tonic stretch reflex
was observed in the quadriceps. Third, the peak velocity and
swing time were low. In this leg the mean R1 ratio was 1.46,
Vmax 270˚/s, and swing time 0.40 s. The expected swing time
was 0.85 s. Hence, the relative swing time was 0.46 s. This low
value can be explained by the stretch reflexes in both quadri-
ceps and hamstring muscles. All these values were consider-
ably lower than in the control participant (see Fig. 1a). As
seen in Figures 3a to 3d and Table II, there was a highly signif-
icant difference (p<0.001) between the group of normally
developing children and those with spasticity, preoperatively.
Mean values in the patient group were between 38 and 66%
of those of the control group.
RESPONSIVENESS TO CHANGE
Six months after SDR, all parameters of the pendulum test
were significantly improved (p<0.001) compared with preop-
erative values (Figs 1c and 3a to 3d). They were now similar to
those of the control children. Only the relative swing time was
still significantly lower (right leg, p=0.001 and left leg,
p=0.01). EMG recordings revealed no reflexes postoperatively
(not shown in Fig. 1c as in this patient, there was a large move-
ment artifact during the initial part of the pendulum test).
CORRELATION WITH CLINICAL TESTS
For the children with diplegia, the preoperative R2 ratio
showed a statistically significant correlation with the quadri-
ceps reflex for the right leg, rS=–0.626 (p=0.003) and nearly
significant for the left leg, rS=–0.566 (p=0.014). There was
no significant correlation between the R2 ratio and Ashworth
scale for either leg. For the variables R1, Vmax, and relative
swing time there was no significant correlation with either of
the clinical tests for spasticity.
No significant correlations were found between the R2,
R1, and Vmax and the GMFCS and GMFM. However, statisti-
cally significant correlations were found between the relative
swing time and these tests. The correlation between the rela-
tive swing time and the GMFCS was (rS)=–0.584 (p=0.007).
The correlation between the relative swing time and the
GMFM dimension E, was (rS)=0.614 (p=0.004).
Discussion
In the present study, the pendulum test variables could differ-
entiate between the unaffected group and the group with
spasticity and they responded to the decreased spasticity after
SDR. The relative swing time was the most reliable parameter.
The pendulum test has been evaluated in non-disabled
adults, and adults with either rigidity or spasticity. It has been
demonstrated to be a practical and reproducible measure of
spastic tone (Wartenberg 1951; Boczko and Mumenthaler
1958; Schwab 1964; Bajd and Bowman 1982; Brown et al.
1988a, b; Jamshidi and Smith 1996). There is only one report
30 Developmental Medicine & Child Neurology 2002, 44: 26–33
Figure 1: Knee angle during pendulum test. Zero indicatesfull extension and positive values flexion. (a) non-disabled5-year-old female; (b) five-year-old female with CPpreoperatively. EMG recordings from the quadriceps andhamstring muscles; (c) same child 6 months after SDR.
Figure 2: Correlation between height (cm) and swing time (s)of both right and left legs in non-disabled children.Correlation coefficients were rp=0.96 (right leg) and rp=0.89(left leg). In the two youngest children measurements wereobtained from the right leg only.
0 1 2 3 4 5
Kne
e an
gle
(°)
Kne
e an
gle
(°)
Kne
e an
gle
(°)
120
80
40
0
120
80
40
0
a
Non-disabled 5 year-old female
CP preop. 5 year-old female
b
Quadriceps
Hamstring
CP postop 5.5 year-old female
70 80 90 100 110 120 130 140 150
1.2
1
0.8
0.6
0.4
Sw
ing
time
(s)
Time (s)
Height (cm)
c120
80
40
00 1 2 3 4 5
A B C

Quantification of Spasticity in Cerebral Palsy Eva Nordmark and Gert Andersson 31
R2
ratio
(%
)R
1 ra
tio (
%)
140
120
100
80
60
40
20
0
300
250
200
150
100
50
0
0 2 4 6 8 10
0 2 4 6 8 10
Age (y)
a
Figure 3: Comparison of individual values and mean of right (■ ) and left (▲) legs in non-disabled children (14 right and 12left legs), with children before (20 right and 19 left legs) and after SDR 9 right and 18 left legs). ns=p>0.1, ap<0.001. (a) R2 ratio, (b) R1 ratio, (c) Maximal velocity (˚/s), (d) Relative swing time (s).
3
2.5
2
1.5
1
0.5
0
600
500
400
300
200
100
0
1.2
1
0.8
0.6
0.4
0.2
0
12
10
8
6
4
2
0
R2
ratio
R1
ratio
Non-disabled Non-disabled
Non-disabled Non-disabled
Preop CP Preop CP
Preop CP Preop CP
Postop CP Postop CP
Postop CP Postop CP
b
a c
Max
imum
vel
ocity
(°/
s)R
elat
ive
swin
g tim
e (s
)
d
a a
b
140
120
10080604020
0
c
Age (y)
140
120
100806040200
Sw
ing
time
(%)
Figure 4: Reliability of pendulum test parameters in control group. Results from second test are expressed as a percentage ofthose from first test and plotted versus age for right (■ ) and left (▲) legs. CV, coefficient of variation, expressed as standarddeviation in percentage of mean. (a) R2 ratio, CV right leg 17% and left leg 13%; (b) R1 ratio, CV right leg 37% and left leg47%; (c) Maximal velocity, Vmax (˚/s), CV right leg 18% and left leg 14%; (d) Swing time (s), CV right leg 4%, and left leg 3%.
Max
imum
vel
ocity
(°/
s)
d
Age (y)
Age (y)
ns
a a
ns
a a
a
a
a
0 2 4 6 8 10
0 2 4 6 8 10
ns

on the sensitivity of the pendulum test in children with CP
(Fowler et al. 2000). The authors concluded that it is a valid
tool for assessing spasticity in persons with CP. However, the
youngest children were 7 years old and the material includes
patients up to 50 years old. The purpose of the present study
was to determine if the Wartenberg pendulum test was
applicable and useful in quantifying spasticity in children as
young as 2.5 years.
In order to avoid the lower leg hitting the couch, the chil-
dren had to sit so far forward that the distal part of the thigh
had no support. As a consequence, the thigh was leaning
down during the test and in the final position of the lower
leg, the knee flexion was less than 90˚(approximately 70 ,̊
see Fig. 1). This explains how the R2 ratio could attain values
of 2 or more, which is impossible with a horizontal thigh and
a final vertical position of 90 .̊
Our goal was to perform repeated measurements on all
children, even the very young ones and children with
impaired cognitive function. As the test relies on the partici-
pants being relaxed and not assisting or resisting the pendular
movements, we chose a test position where the child was sit-
ting relaxed and safely with one parent close behind. The
advantage of this test position was that the children were com-
fortable and tolerated the test very well. The disadvantage was
that the position was not quite standardized. This could have
affected the results. However, in the choice between a stan-
dardized position and a relaxed child, we preferred the latter.
It is most likely that the test results would have been more
affected by inability to relax than by rather small differences in
the sitting position. In addition, it would not have been possi-
ble to perform repeated measurements if the patients had felt
uncomfortable. To minimize the error from voluntary activa-
tion of the investigated muscle we used EMG recordings to
ensure that the children were relaxed when the test started.
Different test positions have been studied in adults: lying
supine (Jamshidi and Smith 1996), semi-supine (Vodovnik et
al. 1984, Leslie et al. 1992,) and sitting up (Katz et al. 1992).
Brown and collaborators studied the importance of the test
position in non-disabled elderly individuals and found that
the position contributed very little to the total variability
(Brown et al. 1988a). In a small group of non-disabled young
adults this contribution was even smaller. In a recent study
on non-disabled elderly individuals and those with hemiple-
gia, Fowler and collaborators (1998) tested the influence of
quadriceps muscle length on the pendulum test. They
reported that the angle of reversal was influenced by muscle
length such that there was no difference between patients
and non-disabled individuals when the difference in muscle
length was taken into account. However, the peak velocity
was much lower in the patients and this could not be
explained by muscle-length difference. In the present study,
all parameters were reduced to about the same extent in the
patients (see Table II). Thus, variation in muscle length does
not seem to have influenced the results. However, as there is
no study on the influence of sitting position in children with
CP, we cannot entirely exclude the possibility that some vari-
ation is due to this.
CORRELATION WITH CLINICAL TESTS OF SPASTICITY AND MOTOR
FUNCTION MEASUREMENTS
Preoperatively, there was a negative correlation between the
R2 ratio and the quadriceps reflex. As seen in Figure 1b, a
stretch reflex was elicited in the quadriceps muscle during
the flexion of the knee reducing the amplitude of the first
swing, which leads to a low R2 ratio. Thus, such a correlation
is expected to occur.
The lack of correlation between any of the pendulum test
parameters and the modified Ashworth scale (Peacock and
Staudt 1991) is not in accordance with previous studies that
have shown a significant correlation between R2 and the
Ashworth scale in adult patients (Katz et al.1992, Leslie et al.
1992). This might be explained partly by the clustering effect
on the 6-point ordinal scale, with 14 of 20 patients grouped
in grades 2 to 3 (see Table I). Other reasons that might have
influenced our results could be the small sample size and the
fact that the tests were performed in different positions and
at different times on a given day. It should also be kept in
mind that the validity and reliability of the Ashworth scale
have not been tested in children with CP. Therefore, a lack of
correlation between the pendulum test parameters and this
method is rather non-informative.
There are few reports concerning the relation between
spasticity and motor function. In the present study, swing
time was the only variable which showed a significant corre-
lation with GMFCS and the GMFM. The correlation was
weak, which is to be expected as motor function is depen-
dent on many factors of which spasticity is only one. It must
also be kept in mind that the pendulum test can only mea-
sure the properties of one muscle group (i.e. the quadriceps)
under passive conditions. Nevertheless, it has been shown
that gross motor function is also improved after SDR and
physical therapy (Steinbok et al. 1997, McLaughlin et al.
1998, Wright et al. 1998).
The finding that the different pendulum parameters cor-
relate with different tests suggest that they reflect different
aspects of the spastic muscle’s resistance to passive move-
ments. Further studies to elucidate the mechanisms affecting
different variables will be necessary. Little attention has been
paid, for example, to the potential effect of viscoelastic prop-
erties of the knee extensor muscles on the result of the pen-
dulum test. The present observation that relative swing time
was different between the non-disabled and the postopera-
tive group, in whom there was no residual spasticity in the
quadriceps, indicates that this parameter could also be sensi-
tive to differences in viscoelastic properties.
New treatments of spasticity have been introduced in phys-
iotherapy, pharmacology, and surgery. For future research it
will be important to identify the mechanisms behind the
motor impairment in patients with CP, such as spasticity,
cocontraction, and weakness. To this end, there is need for
reliable and sensitive tests to be developed that can deter-
mine the relative importance of these mechanisms in any
patient. Only then can the optimal therapeutic intervention
be chosen and its effects be assessed.
Conclusions
The Wartenberg pendulum test combined with EMG is an
objective and sensitive method for quantifying spasticity in
knee extensor muscles in children as young as 2.5 years. The
method is responsive to changes after SDR. The only correla-
tion with clinical measurements of spasticity was between the
R2 ratio and the quadriceps reflex. Swing time was the most
reliable and sensitive variable, which showed a weak correla-
tion with measurements for gross motor function. Limitations
32 Developmental Medicine & Child Neurology 2002, 44: 26–33

of the test are mainly that it can be used only for one muscle
group (quadriceps) and that it measures the properties under
passive conditions.
Accepted for publication 26th June 2001.
AcknowledgementThis work was in part financially supported by the Swedish NationalHealth Board, Josef and Linnea Carlssons Foundation, the LekandeBarnen Foundation, and the Folke Bernadotte Foundation. Theauthors thank the children and families who participated in thestudy and Dr Jan Lagergren who took part in the clinicalassessments. The authors thank Dr Gösta Blennow and ProfessorUlrich Moritz for support and useful discussions.
References
Ashworth B. (1964) Preliminary trial of carisoprodol in multiplesclerosis. Practioner 192: 540–2.
Bajd T, Vodovnik L. (1984) Pendulum testing of spasticity. Journalof Biomedical Engineering 6: 9–16.
Boczko M, Mumenthaler M. (1958) Modified pendulousness test toassess tonus of thigh muscles in spasticity. Neurology 8: 846–51.
Bohannon RW, Smith MB. (1987) Interrater reliability of a modifiedAshworth scale of muscle spasticity. Physical Therapy 67: 206–7.
Bowman B, Bajd T. (1981) Influence of electrical stimulation onskeletal muscle spasticity. In: Popovic D, editor. Proceedings ofthe Seventh International Symposium on External Control ofHuman Extremities. Belgrade, Yugoslavia: Committee forElectronics and Automation. p 567–76.
Brown RA, Lawson DA, Leslie GC, Part NJ. (1988a) Observation onthe applicability of the Wartenberg pendulum test to healthy,elderly subjects. Journal of Neurology, Neurosurgery, andPsychiatry 51: 1171–7.
— Lawson DA, Leslie GC, MacArthur A, MacLennan WJ, MacMurdoMET, Mutch WJ, Part NJ. (1988b) Does the Wartenbergpendulum test differentiate quantitatively between spasticityand rigidity? A study in elderly stroke and Parkinsonian patients.Journal of Neurology, Neurosurgery, and Psychiatry51: 1178–86.
Davies PA, Drillien CM, Foley J, Bryant KM, Nash MI, Egan JM.(1977) Cerebral palsy. In: Drillian DC, Drummond MB, editors.Neurodevelopmental Problems in Early Childhood. Oxford:Blackwell Scientific.
Emre M, Leslie GC, Muir C, Part NJ, Pokorny R, Roberts RC. (1994)Correlations between dose, plasma concentrations, andantispastic action of tizanidine (Sirdalude). Journal ofNeurology, Neurosurgery, and Psychiatry 57: 1355–9.
Engsberg J, Olree KS, Ross SA, Park TS.(1998) Spasticity andstrength changes as a function of selective dorsal rhizotomy.Journal of Neurosurgery 88: 1020–6.
— Ross SA, Park TS. (1999) Changes in ankle spasticity andstrength following selective dorsal rhizotomy and physicaltherapy for spastic cerebral palsy. Journal of Neurosurgery91: 727–32.
Engsberg JR, Olree KS, Ross SA, Park TS. (1996) Quantitativeclinical measure of spasticity in children with cerebral palsy.Archives of Physical Medicine and Rehabilitation 77: 594–9.
Forssberg H, Tedroff K. (1997) Botulinum toxin treatment incerebral palsy: intervention with poor evaluation?Developmental Medicine & Child Neurology 39: 635–40.
Fowler E, Nwigwe AI, Wong Ho T. (2000) Sensitivity of the pendulumtest for assessing spasticity in persons with cerebral palsy.Developmental Medicine & Child Neurology 42: 182–9.
Fowler V, Canning CG, Carr JH, Shepherd RB. (1998) Muscle lengtheffect on the pendulum test. Archives of Physical Medicine andRehabilitation 79: 169–71.
Hesse S, Mauritz KH. (1997) Management of spasticity. CurrentOpinion of Neurology 10: 498–501.
Hinderer SR, Gupta S. (1996) Functional outcome measures to assessinterventions for spasticity. Archives of Physical Medicine andRehabilitation 77: 1083–5.
Jamshidi M, Smith AW. (1996) Clinical measurement of spasticityusing the pendulum test: comparison of electrogoniometric andvideotape analyses. Archives of Physical Medicine andRehabilitation 77: 1129–32.
Katz RT, Rymer WZ. (1989) Spastic hypertonia: mechanism andmeasurement. Archives of Physical Medicine and Rehabilitation70: 144–55.
— Rovai GP, Brait C, Rymer WZ. (1992) Objective quantification ofspastic hypertonia: correlation with clinical findings. Archives ofPhysical Medicine and Rehabilitation 73: 339–47.
Lance JW. (1980) Symposium synopsis. In: Feldman RG, Young RR,Koella WP, editors. Spasticity: disordered motor control. Chicago:Year Book Publications. p 45.
Lee KC, Carsin L, Kinnin E, Patterson V. (1989) The Ashworth scale: areliable and reproducible method of measuring spasticity. Journalof Neurology and Rehabilitation 3: 205–9.
Lehmann JF, Price R, de Lateur BJ, Hinderer S, Traynor C. (1989)Spasticity: quantitative measurements as a basis for assessing theeffectiveness of therapeutic intervention. Archives of PhysicalMedicine and Rehabilitation 70: 6–15.
Leslie GC, Muir C, Part NJ, Roberts RC. (1992) A comparison of theassessment of spasticity by the Wartenberg pendulum test and theAshworth grading scale in patients with multiple sclerosis. ClinicalRehabilitation 6: 41–8.
Lin J-P, Brown JK, Brotherstone R. (1994) Assessment of spasticity inhemiplegic cerebral palsy I: Proximal lower limb reflex excitability.Developmental Medicine & Child Neurology 36: 116–29.
McLaughlin JF, Bjornson KF, Astley SJ, Graubert C, Hays RM, RobertsTS, Price R, Temkin N. (1998) Selective dorsal rhizotomy: efficacyand safety in an investigator-masked randomized clinical trial.Developmental Medicine & Child Neurology 40: 220–32.
Palisano R, Rosenbaum P, Walter S, Russell D, Wood E, Galuppi B.(1997) Development and reliability of a system to classify grossmotor function in children with cerebral palsy. DevelopmentalMedicine & Child Neurology 39: 214–23.
Peacock WJ, Staudt LA. (1991) Functional outcomes followingselective posterior rhizotomy in children with cerebral palsy.Journal of Neurosurgery 74: 380–5.
Price R, Bjornson KF, Lehmann JF, McLaughlin, Hays RM. (1991)Quantitative measurement of spasticity in children with cerebralpalsy. Developmental Medicine & Child Neurology 33: 585–95.
Rang M, Silver R, Ganza J. (1989) Cerebral Palsy. In: Lovell WW, WinterRB, editors. Pediatric Orthopedics, Philadelphia: JB Lippincott.
Russell DJ, Rosenbaum PL, Cadman DT, Gowland C, Hardy S, Jarvis S.(1989) The gross motor function measure: a means to evaluate theeffects of physical therapy. Developmental Medicine & ChildNeurology 31: 341–52.
Schwab RS. (1964) Problems in the clinical estimation of rigidity(hypertonia). Clinical Pharmacological Therapy 5: 942–6.
Sehgal N, McGuire JR. (1998) Beyond Ashworth, electrophysiologicquantification of spasticity. Physical Medicine and RehabilitationClinics of North America 9: 949–79.
Sloan RL, Sinclair E, Thompson S, Taylor S, Pentland E. (1992)Interrater reliability of the modified Ashworth scale for spasticity inhemiplegic patients. International Journal of RehabilitationResearch 15: 158–61.
Staudt L, Nuwer MR, Peacock WJ. (1995) Intraoperative monitoringduring selective posterior rhizotomy: technique and patientoutcome. Electroencephalography and Clinical Neurophysiology97: 296–309.
Steinbok P, Reiner AM, Beauchamp R, Armstrong RW, Cochrane DD.(1997) A randomized clinical trial to compare selective posteriorrhizotomy plus physiotherapy with physiotherapy alone inchildren with spastic diplegic cerebral palsy. DevelopmentalMedicine & Child Neurology 39: 178–84.
Vodovnik L, Bowman BR, Hufford P. (1984) Effects of electricalstimulation on spinal spasticity. Scandinavian Journal ofRehabilitation Medicine 16: 29–34.
Wartenberg R. (1951) Pendulousness of the legs as a diagnostic test.Neurology 1: 18–24.
Wright V, Sheil E, Drake J,Wedges J, Naumann S. (1998) Evaluationof selective dorsal rhizotomy for the reduction of spasticity incerebral palsy: a randomized controlled trial. DevelopmentalMedicine & Child Neurology 40: 239–47.
Quantification of Spasticity in Cerebral Palsy Eva Nordmark and Gert Andersson 33