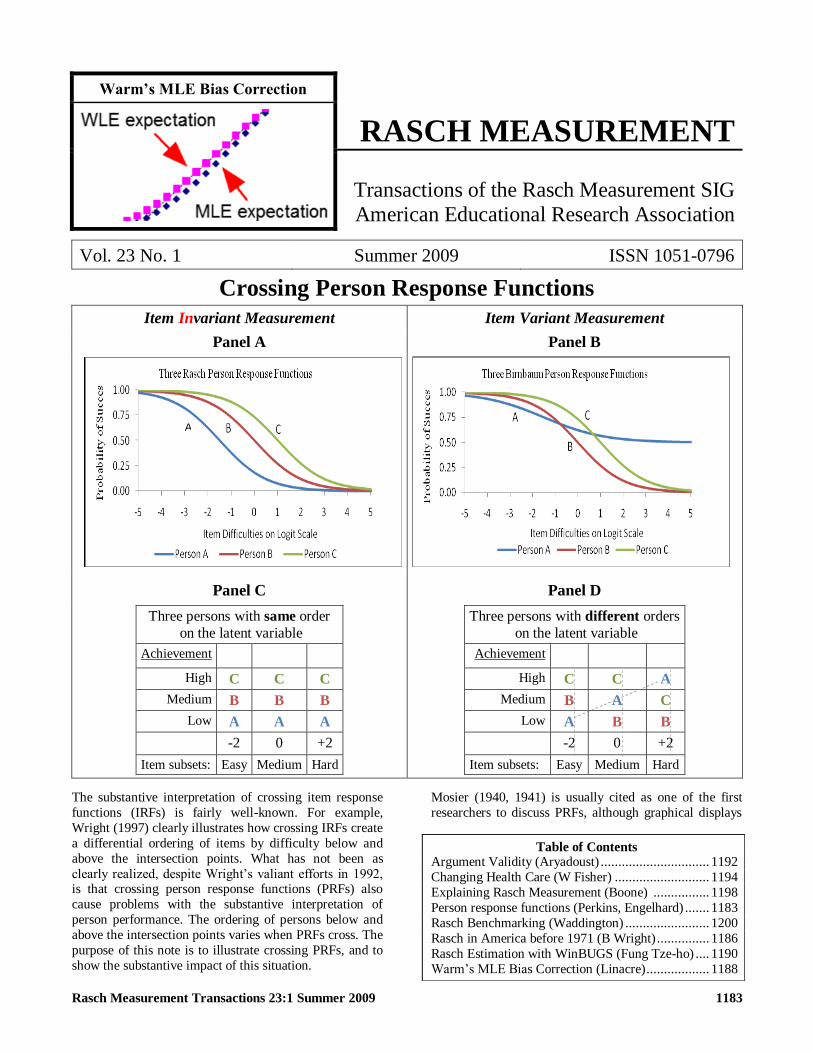
warm’s mle bias correction rasch measurement
TRANSCRIPT
Rasch Measurement Transactions 231 Summer 2009 1183
Warmrsquos MLE Bias Correction
RASCH MEASUREMENT
Transactions of the Rasch Measurement SIG
American Educational Research Association
Vol 23 No 1 Summer 2009 ISSN 1051-0796
Crossing Person Response Functions
Item Invariant Measurement Item Variant Measurement
Panel A Panel B
Panel C Panel D
Three persons with same order
on the latent variable
Achievement
High C C C
Medium B B B
Low A A A
-2 0 +2
Item subsets Easy Medium Hard
Three persons with different orders
on the latent variable
Achievement
High C C A
Medium B A C
Low A B B
-2 0 +2
Item subsets Easy Medium Hard
The substantive interpretation of crossing item response
functions (IRFs) is fairly well-known For example
Wright (1997) clearly illustrates how crossing IRFs create
a differential ordering of items by difficulty below and
above the intersection points What has not been as
clearly realized despite Wrightlsquos valiant efforts in 1992 is that crossing person response functions (PRFs) also
cause problems with the substantive interpretation of
person performance The ordering of persons below and
above the intersection points varies when PRFs cross The
purpose of this note is to illustrate crossing PRFs and to
show the substantive impact of this situation
Mosier (1940 1941) is usually cited as one of the first
researchers to discuss PRFs although graphical displays
Table of Contents Argument Validity (Aryadoust) 1192
Changing Health Care (W Fisher) 1194
Explaining Rasch Measurement (Boone) 1198
Person response functions (Perkins Engelhard) 1183
Rasch Benchmarking (Waddington) 1200
Rasch in America before 1971 (B Wright) 1186
Rasch Estimation with WinBUGS (Fung Tze-ho) 1190
Warmlsquos MLE Bias Correction (Linacre) 1188
A
1184 Rasch Measurement Transactions 231 Summer 2009
representing PRFs can also be found in the early work of
Thorndike Thurstone and several other 19th century
researchers working in the area of psychophysics
Operating characteristic functions for dichotomous
responses have been proposed by Rasch (19601980) and
Birnbaum (1968) The Rasch Model for dichotomous responses can be written as
exp( )
1 exp( )
n ini
n i
[1]
and the Birnbaum Model for dichotomous responses as exp( ( ))
(1 )1 exp( ( ))
i n ini i i
i n i
c c
[2]
where θ is a parameter specifying the location of person
on the latent variable δ is the difficulty or location of
item a is a discrimination parameter in the Birnbaum model and c is the lower asymptote of the function in the
Birnbaum model If we select a particular person such as
Person A then Equations 1 and 2 can be used to define
person response functions The Rasch PRF for Person A
is
exp( )
1 exp( )
A iAi
A i
[3]
while the Birnbaum PRF is
exp( ( )) (1 )
1 exp( ( ))
A A iAi A A
A A i
c c
[4]
It should be noted that cA is conceptually closer to a real
―guessing parameter in the Birnbaum PRFs and that αA
represents person sensitivity to a particular subset of
items
Engelhard (in progress) describes five requirements of invariant measurement that must be met to yield useful
inferences for measurement in the social behavioral and
health sciences These five requirements are
1 The measurement of persons must be independent of
the particular items that happen to be used for the
measuring Item-invariant measurement of persons
2 A more able person must always have a better chance
of success on an item than a less able person non-
crossing person response functions
3 The calibration of the items must be independent of
the particular persons used for calibration Person-
invariant calibration of test items
4 Any person must have a better chance of success on
an easy item than on a more difficult item non-crossing
item response functions
5 Items must be measuring a single underlying latent
variable unidimensionality
Requirements 1 and 2 address issues related to PRFs
The Figure illustrates the effects of crossing PRFs Three
PRFs were constructed for two situations Rasch PRFs
that do not cross (Panel A) and Birnbaum PRFs that do
cross (Panel B) As shown in Panel C non-crossing PRFs
yield comparable person locations over subsets of items
centered around easy items (-2 logits) to hard items (+2
logits) If PRFs do not cross then Persons A B and C are
ordered in the same way across item subsets In other
words item-invariant measurement is achieved with the Rasch model
Crossing PRFs based on the Birnbaum model (Panel D)
yield person ordering that varies as a function of the
difficulty of the item subsets For example Person A is
the lowest achieving person with the lowest probability of
success on the easy items while Person A is the highest
achieving person on the hard items Easy item subsets
yield persons ordered as A lt B lt C while hard item
subsets yield persons ordered B lt C lt A In other words
the ordering of persons is not invariant over item subsets
with the Birnbaum model
This note calls attention to the idea that model-data fit can be conceptualized in terms of both IRFs and PRFs
(Engelhard in press) Typically IRFs and differential item
functioning analyses are explored Our work suggests that
researchers should also begin to think more systematically
about differential person functioning It is important to
recognize the items may function differently over
different subgroups of persons (differential item
functioning) but it is also important to recognize that
persons may not function as intended in their interactions
with subsets of test items (differential person
functioning)
Aminah Perkins amp George Engelhard Jr
Emory University Division of Educational Studies
Birnbaum A (1968) Some latent trait models and their
use in inferring an examineelsquos ability Part 5 In FM
Lord and MR Novick (Eds) Statistical theories of
mental test scores Reading MA Addison-Wesley
Publishing Company Inc
Engelhard G (in progress) Invariant measurement
Rasch models in the social behavioral and health
sciences New York Routledge
Engelhard G (in press available online) Using item
response theory and model-data fit to conceptualize differential item and person functioning for students with
disabilities Educational and Psychological Measurement
Mosier CI (1940) Psychophysics and mental test
theory Fundamental postulates and elementary theorems
Psychological Review 47 355-366
Mosier CI (1941) Psychophysics and mental test
theory II The constant process Psychological Review
48 235-249
Wright BD (1992) IRT in the 1990s Which Models
Work Best Rasch Measurement Transactions 61 196-
200 wwwraschorgrmtrmt61ahtm
Wright BD (1997) A history of social science
measurement Educational Measurement Issues and
Practice Winter 33- 45 52
Rasch Measurement Transactions 231 Summer 2009 1185
The IEA Bruce H Choppin Memorial Award
IEA established the Bruce H Choppin Award as a
memorial to Dr Bruce H Choppin The award which
takes the form of a certificate and a prize of euro500 is given
annually to the author of a masterlsquos or doctoral thesis who
makes use of data from an IEA study and employs
empirical research methods in his or her work Two
awards one for the best submission at the masterlsquos level
and one at the doctoral level are available for each annual
competition In a given year IEAlsquos Awards Committee
may decide that no awards should be made
Bruce H Choppin 1940-1983
Bruce H Choppin studied mathematics at Cambridge University in England before attending the University of
Chicago where he earned his PhD in the area of
measurement evaluation and statistical analysis He was
closely connected with IEA from 1963 until his premature
death in 1983 His first work with IEA involved data
analysis for the English national report of the First IEA
Mathematics Study Along with Dr Alan Purves he later
undertook a small-scale exploratory study designed to
measure student understanding and appreciation of
literary prose and poetry Dr Choppin was involved in the
conceptualization instrument construction and data analysis phases of the IEA Six-Subject Survey He was
International Coordinator for the IEA Item Banking
project Chairman of the IEA Training Committee and
Head of the IEA Data Processing Center in New York
from 1969 to 1972
Dr Choppin was a proponent of the Rasch method of
scaling aptitude and achievement test scores (having
come under the influence of Benjamin Wright) He was at
the center of a debate about Rasch scaling at the time (the
1970s) when this method was still looked upon with
skepticism by those in the field of testing For IEA he
wrote a monograph entitled Correction for Guessing and with Neville Postlethwaite as co-editor he established the
journal Evaluation in Education which later became the
International Journal of Educational Research In addition
to his work with the New York Data Processing Center
Dr Choppin for several years worked at the National
Foundation for Educational Research in England and
Wales the Science Education Centre in Israel as well as
the University of California and Cornell University in the
United States
Bruce Choppin died in Chile having gone there to help
the countrylsquos National Research Coordinator for the IEA Study on Written Composition His ashes are buried in
London
Rules for Entry
For each yearlsquos competition the thesis submitted must
have been completed within the three years preceding the
entry date (31 March of that year)
from wwwieanlchoppin_awardhtml
AERA Proposal Deadline July 15 2009
We hope your summer is going well As you are
scheduling your time remember that the new deadline for
submission of proposals for the 2010 AERA meeting is
moved up to July 15 The online submission page is up
and ready for your submissions at wwwaeranet
Also just a reminder that the number of slots allocated to
Special Interest Groups (SIGs) is now a simple formula
based on the proportion of the number of proposals
submitted The more proposals we submit the more slots
will be available for faculty and graduate students to
present their work
Sincerely
Diana Wilmot Leigh Harrell
Rasch Measurement SIG Program Chairs
Estimados compantildeeros
Nos dirigimos a Uds Para informarles que se estaacute
organizando por el IUDE el IV WORKSHOP sobre
MODELOS DE RASCH EN ADMINISTRACIOacuteN DE
EMPRESAS para el 13 de noviembre de 2009
Los investigadores que deseen participar pueden enviar
sus trabajos en espantildeol o ingleacutes a la atencioacuten de la
Comisioacuten Cientiacutefica del Workshop en iude at ulles
antes del 15 de septiembre de 2009 indicando a queacute
sesioacuten se dirigen
Las sesiones previstas son Metodologiacutea Direccioacuten y Estrategias Empresariales Comercializacioacuten e
Investigacioacuten de Mercados Sistemas y Tecnologiacuteas de la
Informacioacuten Organizacioacuten de Empresas Cultura
Estrateacutegica y Recursos Humanos Sectores y Nuevos
Desarrollos
Los trabajos admitidos estaacute previsto sean publicados en
una monografiacutea por la Fundacioacuten Canaria para la
Formacioacuten y el Desarrollo Empresarial (FYDE
CajaCanarias) en su coleccioacuten de E-Books
La asistencia al Workshop es libre y sin gastos previa
inscripcioacuten en iude at ulles La informacioacuten relativa al IV Workshop estaraacute disponible en la paacutegina web del
IUDE wwwiudeulles concretamente a lo relativo a la
normativa aplicable a los trabajos mantenieacutendose en los
mismos teacuterminos de la edicioacuten anterior
La Laguna a 20 de abril de 2009
Jaime Febles Acosta
Presidente de la Comisioacuten Organizadora
Director del IUDE
Instituto Universitario De La Empresa
Universidad De La Laguna
Avda 25 De Julio 9 1ordf Planta
38004 Santa Cruz de Tenerife
1186 Rasch Measurement Transactions 231 Summer 2009
M E S A
PSYCHOMETRIC LABORATORY University of Chicago Department of Education
5835 Kimbark Avenue Chicago 60637
Phone 312 702 1596 FAX 312 702 0248
May 27 1993
Prof dr Eddy Roskam University of Nijmegen
Institute for Cognition and Information
Department of Mathematical Psychology PO Box 9104
6500 HE Nijmegen
The Netherlands
Dear Eddy
Thanks for your paper Great references
I must protest however against the one or two lines in your paper where you assert nothing happened in America
before 1971 On that topic you are seriously misinformed
Jimmie Savage and I brought Rasch to Chicago in March 1960 because of our already existing knowledge of and
interest in his work Rasch explained and reported on his work for three months in Chicago He and I worked daily on
the problem of how to analyze the bipolar rating scales used in the semantic differential - a problem to which I had been applying factor analysis with - as you know - ambiguous and sample-dependent results It was during those three
months that Rasch developed the m-dimensional model for rating scales with (m-1) categories which he discussed at
the Fourth Berkeley Symposium and published in 1961
In the next four years we organized a program on Rasch measurement in the MESA Special Field at the University of Chicago got students working wrote many FORTRAN programs to implement the least squaresLOG
pairwisePAIR and conditionalFCON algorithms described in Raschlsquos 1960 book and tested these programs on real
and simulated data to see how they worked The principals in this were Bruce Choppin Nargis Panchapakesan and myself
In the course of these investigations we added the unconditionalUCON (equivalent to what is now called
―marginal maximum likelihood) method of estimation We also attempted a program to estimate an item slope parameter the infamous item discrimination No matter what tricks we introduced some estimates always diverged
There was no unambiguous way to obtain finite values We consulted our best applied mathematicians to make sure
we hadnlsquot missed a trick and finally did the obvious algebra to prove that not only in practice but more decisive in
principle a second item parameter could NOT be estimated when the observation was a dichotomy
As you have noticed in the history of American IRT however our 1966 result did not deter the foolish adventures
by some Americans into two and three item parameter IRT models for dichotomous data When I showed our results
to Fred Lord and Darrell Bock at lunch in December 1967 they merely snickered arrogantly asserting they would easily within weeks have solutions to the problem which I and my students were incompetent to solve But Lordlsquos
three-parameter LOGIST program did not work in 1967 or in 1968 and the lengthy 1989 ETS report on the current
functioning of Lordlsquos LOGIST and Bock and Mislevylsquos BILOG reviews in thorough detail the continuation of the same old problems - failure to recover the generating parameters of data simulated to follow the 3-P model exactly
and failure to converge on any data even when the generating values are used to start the iterations
The 1989 report also explains how LOGIST falls back on a Rasch algorithm every second iteration to keep from
exploding and advises would-be users to confine themselves to as few iterations as possible preferably just four in order to escape divergence
Returning to the University of Chicago our experiences in 1964-1965 with our four ways to obtain Rasch
estimates convinced us that for all practical purposes it did not matter which method was used This conclusion and
Rasch Measurement Transactions 231 Summer 2009 1187
its parts we reported in a well-attended symposium at the September 1965 Annual Meeting of the Midwestern
Psychological Association I still have the program
Speakers were my students Bruce Choppin and Nargis Panchapakesan Washington U Professor Jane Loevinger
(who reviewed Rasch 1960 in 1965) Iowa State U Professor Paul Blommers two of his students Gary Ramsayer
and Richard Brooks who wrote dissertations testing the empirical invariance of Rasch estimates for educational test
data and Chicago Statistics Professor David Wallace
The professional attention these activities engendered led to a three year 1965-1968 grant from the National
Science Foundation to support Bruce and Nargis and pay for computing to continue our Rasch research
In 1966 Bruce and I programmed a fully conditional multidimensional pairwise algorithm BIGPAR which estimates an L by (m-1) matrix of item parameters from m category data and expresses this matrix in principal
components I have dated printouts of the FORTRAN coding and a few analyses if youlsquore interested
For the Likert rating scale data we analyzed we always got one dominant component specifying a sequence of category values matching the intended direction of the rating scale We usually also got a minor but distinct second
largest component that specified a Guttman 1950 ―intensity effect
However as UCON became versatile and we generalized its algorithm from dichotomies to one dimensional
rating scales it was easier to enter UCON first with linear scores like 123456 for direction second with quadratic scores like 321123 for intensity etc rather to bother with BIGPAR
As you might expect the value and salience of the quadratic form suffered the same fate as Guttmanlsquos intensity
component - it never mattered enough to bother with
To finish up here is a much marked on report I prepared for my Chairman in 1971 The two pages list my Rasch
activities during the 1960-1970 period particularly my explanations and demonstrations of Rasch measurement to the
Psychometric Society in June 1967 (Bock Lord Tucker Harris Angoff and many others were there) and to the enormous audience at the 1967 ETS Invitational Conference on Testing Problems in October 1967
The list also documents my continuing collaborations with Rasch in 1964 1965 1967 1968-1969 and his
participation in the first ever AERA Professional Training Session in February 1969 which was of all things on
Rasch Measurement
So you can hardly say with any conviction or a clear conscience that nothing happened in America in the 60lsquos
Indeed almost everything basic had happened in America by the dawn of 1971 What remained were ever widening
teaching training and practice bigger and better computer programs Andrichlsquos and Masterlsquos filling out and completing the rating scale and partial credit work that Georg and Bruce began and Mike Linacrelsquos derivation and
implementation of the many facet measurement model
I enjoyed being with you in Atlanta You are a marvelous talker and a fascinating thinker I believe you and I agree
on a great many important principles I also believe there are several basic things that you could teach me I hope you will come again to the New World You are constantly welcome in Chicago
Donlsquot forget to send me your next draft
Sincerely
Benjamin Drake Wright Professor of Education and Psychology
Director MESA Psychometric Laboratory
cc George Engelhard
The typeface has been changed from the original Courier
Prof Dr Eddy ECI Roskam of the Katholieke Universiteit of Nijmegen died on May 24th 1997
Letter courtesy of George Engelhard Jr Emory University
1188 Rasch Measurement Transactions 231 Summer 2009
The Efficacy of Warmrsquos MLE Bias Correction Thomas Warm (1989) reports that ―Lord (1983) found
that maximum likelihood estimates of θ [person ability] are biased outward and then he restates Lordlsquos
expression for the size of this bias
Bias (MLE(θ)) = -J 2 Isup2
where for dichotomous Rasch items I = test information
= Σ Pθi (1-Pθi ) and J = Σ Pθi (1-Pθi ) (1-2Pθi ) summed for
all items 1=1L in the test where Pθi is the Rasch-model
probability of success of ability θ on item i
How effective is this bias correction Warm uses a Monte
Carlo study to demonstrate its effectiveness but an exact
algebraic investigation can be conducted
Dichotomous Items
I posited a test of 25 items with its item difficulties uniformly spaced 02 logits apart Figure 1 shows the
locations (x-axis) of the items on the 25-item test The
item difficulties are centered on 0 logits
Applying the MLE method of Wright amp Douglas (1996)
for estimating θ from known item difficulties a Rasch
ability estimate M(s) is obtained for each possible raw
score s=0-25 on the test of 25 items Since the estimates
corresponding to s=0 and s=25 are infinite they are
substituted by estimates corresponding to s=03 and
s=247 score-points The MLE ability estimates are shown
in Figure 1
Warmlsquos bias correction is applied to each MLE estimate
M(s) to produce a Weighted Likelihood Estimation
(WLE) value W(s) See Figure 1 WLE estimates are
more central than the MLE estimates except for estimates
corresponding to scores of 03 and 247 where the MLE
estimates are used unchanged
Under Rasch model conditions each raw score s on a
given set of items corresponds to one estimated ability
θ(s) but each true (generating) ability corresponds to all
possible raw scores For 25 items there are 2^25 =
33554432 possible different response strings According
to the Rasch model each of these response strings has a finite probability of being observed for each generating
ability
Probability of response string n for ability θ
= Pnθ = Π exp( (xni (θ - di) ) (1 + exp(θ - di) )
for i = 1 to 25 where xni is the scored 01 response to item
i in response string n and di is the difficulty of item i
Response string n has a raw score of s = Σ xni for i = 1 to
25 Score s has an MLE estimate of Mn = M(s) and a
WLE estimate of Wn = W(s)
The expected values of the estimates corresponding to
each generating value can now be computed
Expectation (MLE(θ)) = Σ Pnθ Mn for n = 1 to 2^25
Expectation (WLE(θ)) = Σ Pnθ Wn for n = 1 to 2^25
θ
Figure 1 MLE and WLE for 25 dichotomous items
Figure 3 MLE and WLE for 12 4-category items
Figure 2 Detail of Figure 1 showing MLE bias
Rasch Measurement Transactions 231 Summer 2009 1189
These values are plotted in Figure 1 for θ in the range -6
logits to +6 logits The WLE ogive corresponds to the
identity line with the generating values for most of its
range The MLE ogive is slightly less central (as predicted
by Fred Lord) We can see that the WLE bias correction is
effective over the entire range of MLE estimates for non-extreme scores (-4 to +4 logits) The biggest bias
correction is 023 logits at a generating value of 36 logits
as shown in Figure 2 This is less than half the size of the
standard error of each estimate This is close to 05 logits
for most of the range We can also see that for ―true
generating abilities within 2 logits of the center of the test
the MLE bias is less than 01 logits and so negligible for
practical purposes
Similar investigations for tests of length 2 to 24 items
demonstrated that the WLE bias correction is effective for
tests of 7 dichotomous items or more
Polytomous Items
We can apply the same logic to polytomous items
Bias (MLE(θ)) = -J 2 Isup2
where I = Σ( (Σksup2Pθik ) - (ΣkPθik )sup2 ) and
J = Σ( (Σksup3Pθik ) - 3(Σksup2Pθik )(ΣkPθik ) + 2(ΣkPθik )sup3 )
for i=1 L and the polytomous categories k=0m where
Pθik is the Rasch-model probability of being observed in
category k
The results of this investigation are shown in Figure 3
with item 01 logits apart and thresholds 1 logit apart
The results are similar to the findings for dichotomous
items in Figure 1
Warmlsquos bias correction is seen to be efficacious for the
correction of MLE bias across the useful measurement
range of the items but that MLE bias is also seen to be
inconsequential for most practical purposes
John M Linacre
Lord F M (1983) Unbiased estimators of ability
parameters of their variance and of their parallel-forms
reliability Psychometrika 48 2 233-245
Warm TA (1989) ―Weighted Likelihood Estimation of
Ability in Item Response Theory Psychometrika 54
427-450
Wright BD Douglas GA (1996) Estimating measures with known dichotomous item difficulties Rasch
Measurement Transactions 102 499
Rasch Measurement Transactions PO Box 811322 Chicago IL 60681-1322
wwwraschorgrmt
Editor John Michael Linacre Copyright copy 2009 Rasch Measurement SIG
Permission to copy is granted
SIG Chair Ed Wolfe Secretary Timothy Muckle
Program Chairs Diana Wilmot and Leigh Harrell
SIG website wwwraschsigorg
Rasch-related Coming Events
July 15 2009 Proposal Deadline for April 30 -
May 4 2010 Fri-Tues AERA Annual
Meeting Denver CO USA wwwaeranet
July 20 - Nov 14 2009 Mon-Sat Introduction to
Rasch Measurement of Modern Test Theory
online course (D Andrich I Marais RUMM)
wwweducationuwaeduaupplcourses
July 28-30 2009 Tues-Thur PROMS HK 2009 Pacific Rim Objective Measurement
Symposium Hong Kong wwwpromshkorg
Aug 21 - Sept 18 2009 Fri-Fri Rasch - Further
Topics online course (M Linacre Winsteps)
wwwstatisticscomourcoursesraschfurther
Sept 6-11 2009 Sun-Fri IMEKO XIX World
Congress Fundamental and Applied
Metrology Portugal wwwimekoorg
Sept 8 2009 Tues Rasch Refresher workshop
Sept 9-11 2009 Wed-Fri Introduction to Rasch
Sept 14-16 2009 Mon-Wed Intermediate Rasch
Sept 17-18 2009 Thur-Fri Advanced Rasch (A Tennant RUMM) Leeds UK
wwwleedsacukmedicinerehabmedpsychometric
Sept 18 - Oct 16 2009 Fri-Fri Rasch
Applications in Clinical Assessment Survey
Research and Educational Measurement (W
Fisher Winsteps)
wwwstatisticscomourcoursesraschapps
Oct 19-20 2009 Mon-Tues Introductory Course
on Rasch Measurement Theory and
Application
Oct 21-22 2009 Wed-Thur Advanced Course on
Rasch Measurement Theory and Application
(Andrich Tognolini RUMM) Oxford UK University of Oxford
httpcpdcontedoxacukRaschdefaultasp
Oct 23 - Nov 21 2009 Fri-Fri Many-Facet
Rasch Measurement online course (M
Linacre Facets)
wwwstatisticscomourcoursesfacets
Nov 13 2009 Fri IV Workshop de Modelos de
Rasch en Administracioacuten de Empresas
(Spanish and English proposals by Sept 15)
Canary Islands wwwiudeulles
April 30 - May 4 2010 Fri-Tues AERA Annual
Meeting Denver CO USA wwwaeranet
June 14-15 2010 Mon-Wed International
Conference on Probabilistic Models for
Measurement Copenhagen Denmark
wwwrasch2010cbsdk
1190 Rasch Measurement Transactions 231 Summer 2009
Bayesian Estimation for the Rasch Model using WinBUGSIn this brief note we introduce a Bayesian approach to
estimating parameters for IRT using a freeware called
WinBUGS We use simple Rasch model below to
illustrate such an approach and summarize its benefits at
the end as compared with the use of proprietary software
(eg WINSTEPS and BILOG)
Simple Dichotomous Rasch Model
A student i will score 1 from answering an item k
correctly 0 otherwise Let yik be the score Using Simple
Rasch Model we have
yik ~ Bernoulli(pik)
logit(pik) = i ndash dk
where i is the ability of student i
dk is the difficulty of item k
Formulation of the Rasch Model in WinBUGS
The BUGS (Bayesian inference Using Gibbs Sampling)
project is concerned with flexible software for the
Bayesian analysis of complex statistical models using
Markov chain Monte Carlo (MCMC) methods
WinBUGS is a freeware which provides graphical
interface to access all these modeling utilities
The first step using WinBUGS is to specify the model
concerned and the prior distributions for the unknown
parameters For the simple Rasch model this is shown in
the box below
The posterior distribution of the unknown parameters can
then be obtained by running the model in WinBUGS with
the response data
Bayesian Graphical Modeling of the Rasch Model
In Bayesian graphical modeling the simple Rasch model
is represented in Figure 1
The known data response[ij] is represented in rectangular
form The unknown parameters ([i] d[j] τ) are
represented in circular form The dependency amongst the
data and parameters are shown using directed arrows
Such a graphical illustration can enhance understanding of
the model by others especially for a more complex
model
Empirical Results and Model Checking
We illustrate our approach using the classical example in
educational testing - the Law School Admission Test
(LSAT) data which is available in the R package called
ltm (Latent Trait Model) The data contain responses of
1000 individuals to five items which were designed to
WinBUGS specification of the Rasch dichotomous model
model Simple Rasch Model in WinBUGS
for (i in 1 N) Total number of students N
for (k in 1 T) Total number of items T
response[i k] ~ dbern(p[i k]) Response follows a Bernoulli distribution
logit(p[i k]) lt- theta[i] - d[k] The transformed prob equals to difference between
student ability and item difficulty
Prior distributions for unknown parameters
for (i in 1N) theta[i] ~ dnorm(0 tau) prior distribution for student abilities
for (k in 1T) d[k] ~ dnorm(0 0001) prior distribution for item difficulties
tau ~ dgamma(0001 0001) prior distribution for precision of student abilities
sigmalt-1sqrt(tau) calculate the standard derivation from precision
Figure 1 Bayesian Graph of the Rasch Model
Rasch Measurement Transactions 231 Summer 2009 1191
Figure 2 Observed and Expected Frequencies
measure a single latent ability Here are the results
obtained using WinBUGS ―ltm are the R statistics as
estimates for reference
Estimates of Item difficulty
Item mean sd 25 median 975 ltm
1 -274 013 -300 -274 -249 -287
2 -1 008 -115 -1 -084 -106
3 -024 007 -038 -024 -01 -026
4 -131 008 -147 -131 -114 -139
5 -21 011 -231 -21 -19 -222
We can see that the estimated values from WinBUGS are
close to the ones from ltm which uses a Marginal
Maximum Likelihood (MMLE) approach As the
observed data are discrete one common method of model
checking in Bayesian approach is to draw samples from
posterior predictive distribution and compare the
simulated frequencies of different possible outcomes with
the observed ones Here are the results of model checking
Obs
Freq
Expected Frequency
Score mean sd 25 median 975
0 3 24 16 0 2 6
1 21 206 51 11 20 31
2 87 882 97 70 88 107
3 240 2281 145 200 228 256
4 361 3660 171 333 366 399
5 303 2948 176 261 295 330
The model checking statistics are displayed in the graph
below The observed frequencies are shown by a dashed
line The expected frequencies are shown by vertical bars
We can conclude that the observed outcomes are very
close to the predicted ones
Flexibility in Enhancing the Model
WinBUGS allows a great flexibility in modeling For
example we could easily enhance the modeling of student
abilities θi with other covariates Xti if such information is
available One of the possible formulations could be
i ~ N(i 2)
where i = 0+ttXti and 2~IG(00010001)
The WinBUGS code above could be modified easily to
incorporate such an enhancement Parameter estimation in
the enhanced model could be automatically taken care by
WinBUGS
Summary
As compared with the proprietary software the
advantages of using the WinBUGS include the following
(1) the Rasch model can be displayed in a graphical
display to facilitate communication and understanding
(2) testing statistics for model checking could be tailored
for the problem at hand and
(3) a great flexibility in modeling is provided
Dr Fung Tze-ho
Manager-Assessment Technology amp Research
Hong Kong Examinations and Assessment Authority
wwwhkeaaeduhken
Journal of Applied Measurement
Volume 10 Number 2 Summer 2009
The Relationships Among Design Experiments Invariant
Measurement Scales and Domain Theories C Victor
Bunderson and Van A Newby 117-137
Considerations About Expected a Posteriori Estimation in
Adaptive Testing Adaptive a Priori Adaptive Correction
for Bias and Adaptive Integration Interval Gilles Raicircche
and Jean-Guy Blais 138-156
Local Independence and Residual Covariance A Study of
Olympic Figure Skating Ratings John M Linacre 157-
169
Constructing One Scale to Describe Two Statewide
Exams Insu Paek Deborah G Peres and Mark Wilson
170-184
Multidimensional Models in a Developmental Context
Yiyu Xie and Theo L Dawson 185-195
An Application of the Multidimensional Random
Coefficients Multinomial Logit Model to Evaluating
Cognitive Models of Reasoning in Genetics Edward W Wolfe Daniel T Hickey and Ann CH Kindfield 196-207
Understanding Rasch Measurement The ISR Intelligent
Student Reports Ronald Mead 208-224
Richard M Smith Editor
JAM web site wwwjampressorg
1192 Rasch Measurement Transactions 231 Summer 2009
Mapping Rasch-Based Measurement
onto the Argument-Based Validity FrameworkThis paper integrates the Rasch validity model (Wright amp
Stone 1988 1999) into the argument-based validity
framework (Kane 1992 2004) The Rasch validity
subsumes fit and order validity Order validity has two
subcategories meaning validity (originated from the
calibration of test variables) and utility validity (based on
the calibration of persons to implement criterion validity)
Fit validity concerns the consistency of response patterns
From 1) analysis of residuals ie the difference between
the Rasch model and the responses 2) analysis of item fit which can help revising the test and 3) analysis of person
fit which can help diagnosing the testees whose
performance do not fit our expectations we get response
item function and person performance validity
respectively
The evidence-based approach to validity was proposed by
Kane (1992) This framework has two phases interpretive
and validity argument Initially the interpretive argument
(IA) is proposed in the form of statements followed by the
validity argument (VA) to investigate the efficacy of the
IA Figure 1 displays a framework to use Rasch-based measurement to build VAlsquos Observation generalization
explanation and extrapolation are four major inferences
that help proceeding from one validation stage to the
consecutive stage Warrants comprise any data to back up
the postulated inferences Backings give legitimacy and
authority to warrants eg theoretical assumptions behind
the posited warrants
Warrants for the observation inference in a Rasch-based
study can include standardization of scoring process
converting raw scores into measured scores and ability
Standardization guarantees the unanimity of the scoring
procedure Converted raw scores to interval or measured
scores in the Rasch analysis is essential since the distance
between measured scores is real and item difficulty can be
directly compared with person ability or trait levels Rating Scales (Andrich Model) and (Masterslsquo) Partial
Credit Model help further investigating the efficacy of the
measurement scales To generalize the observed scores
into expected scores person and item reliability and
person and item separation indexes are proposed as
warrants and the theories behind them as backings
The explanation inference bears on the theoretical
construct under measurement Itemperson infit and outfit
analysis are first warrants Backings include theoretical
concepts of fit validity Investigating item and person fit
provides information about construct-irrelevant factors The Rasch Principal Component Analysis of Residuals
(PCAR) investigates construct irrelevancies in the
measure (Linacre 2005)
Figure 1 Supporting validity arguments using Rasch analysis
Observation Generalization Explanation Extrapolation
Observed
Scores
Expected
Scores
Construct
Target
Scores
1 Standardization 2 Measured scores
3 Measured ability 4 Rating scale model
5 Partial credit model
1 Person reliability 2 Item reliability
3 Person separation
4 Item separation
1Item infitoutfit in acceptable range
2 Person infitoutfit in acceptable range 3 PCAR no contrasts 5 Partial credit model
1No DIF 2 Sufficient criterion evidence 3 Sufficient content evidence
4 Correlations 5 Regressions 5 Partial credit model
Warran
ts B
ackin
g
1 Standardization 2 Meaning validity 3 Utility validity 4 Rating scale model
5 Partial credit model
1 Response validity 2 Item function validity 3 Person performance
validity
1 Person reliability 2 Item reliability 3 Person separation
4 Item separation
1 DIF
2 Criterion evidence
using meaning and utility
validity
3 Content evidence
4 Conventional criterion evidence
Grounds
Rasch Measurement Transactions 231 Summer 2009 1193
Then we can extrapolate the observation to the target
scores The extrapolation inference has an element of
subjectivity Kane Crooks and Cohen (1999) indicated
that content analysis in the generalization inference can
support extrapolation provided that the universe of
generalization corresponds to the target domain Kane (1992 2004) also proposed the use of criterion-referenced
evidence However even if this method is used it may
not yield sufficient support for extrapolation Utility and
meaning validity can come to aid again The confirmed
hierarchy of item difficulty is assessed against the criteria
we have set Observations which are not in conformity
with the theoretical expectations or criteria are possible to
be flawed By the same token we can anticipate how
persons with different characteristics will respond to a
particular question Differential item functioning (DIF) is
also useful DIF occurs when a group of examinees have
different probabilities to answer an item due to their background (sex age ethnicity etc) Background is the
major criterion because it concerns test takers directly In
this light background is internal to the assessment
In the current Rasch-based framework the Rasch analysis
is further supported by the theoretical background of the
test This implies that psychometric models should not
disassociate with the psychological and cognitive theories
underlying any testing device (Embretson amp Gorin 2001
Wright amp Stone 1999) It is certainly difficult and
expensive for academic institutes to carry out many
studies in support of the validity arguments of a device (see McNamara 2003) The Rasch-based validity
argument framework can provide reliable and efficient
evidence at the lowest expense compared with the
accumulation of evidence from different studies
S Vahid Aryadoust
NIE NTU
Singapore
Embretson S amp Gorin J (2001) Improving construct
validity with cognitive psychology principles Journal
of Educational Measurement 38(4) 343-368
Kane M (1992) An argument-based approach to
validity Psychological Bulletin 112 527ndash535
Kane M (2004) Certification testing as an illustration of
argument-based validation Measurement
Interdisciplinary Research and Perspectives 2 135ndash
170
Kane M Crooks T amp Cohen A (1999) Validating
measures of performance Educational Measurement
Issues and Practice 18(2) 5ndash17
Wright B D amp Stone M H (1988) Validity in Rasch
measurement University of Chicago Research
Memorandum No 55
Wright B D amp Stone M H (1999) Measurement essentials 2nd ed Wilmington Delaware Wide
Range Inc
Rasch-related Coming Events
July 15 2009 Proposal Deadline for April 30 - May 4
2010 Fri-Tues AERA Annual Meeting Denver
CO USA wwwaeranet
July 20 - Nov 14 2009 Mon-Sat Introduction to Rasch
Measurement of Modern Test Theory online course
(D Andrich I Marais RUMM)
wwweducationuwaeduaupplcourses
July 28-30 2009 Tues-Thur PROMS HK 2009 Pacific
Rim Objective Measurement Symposium Hong
Kong wwwpromshkorg
Aug 21 - Sept 18 2009 Fri-Fri Rasch - Further Topics
online course (M Linacre Winsteps)
wwwstatisticscomourcoursesraschfurther
Sept 6-11 2009 Sun-Fri IMEKO XIX World Congress
Fundamental and Applied Metrology Portugal
wwwimekoorg
Sept 8 2009 Tues Rasch Refresher workshop
Sept 9-11 2009 Wed-Fri Introduction to Rasch
Sept 14-16 2009 Mon-Wed Intermediate Rasch
Sept 17-18 2009 Thur-Fri Advanced Rasch
(A Tennant RUMM) Leeds UK
wwwleedsacukmedicinerehabmedpsychometric
Sept 18 - Oct 16 2009 Fri-Fri Rasch Applications in
Clinical Assessment Survey Research and
Educational Measurement (W Fisher Winsteps)
wwwstatisticscomourcoursesraschapps
Oct 19-20 2009 Mon-Tues Introductory Course on Rasch Measurement Theory and Application
Oct 21-22 2009 Wed-Thur Advanced Course on Rasch
Measurement Theory and Application
(Andrich Tognolini RUMM) Oxford UK
University of Oxford
httpcpdcontedoxacukRaschdefaultasp
Oct 23 - Nov 21 2009 Fri-Fri Many-Facet Rasch
Measurement online course (M Linacre Facets)
wwwstatisticscomourcoursesfacets
Nov 13 2009 Fri IV Workshop de Modelos de Rasch en
Administracioacuten de Empresas (Spanish and English
proposals by Sept 15) Canary Islands
wwwiudeulles
Jan 8 - Feb 5 2010 Fri-Fri Rasch - Core Topics online
course (M Linacre Winsteps)
wwwstatisticscomourcoursesrasch1
April 30 - May 4 2010 Fri-Tues AERA Annual Meeting Denver CO USA wwwaeranet
June 14-15 2010 Mon-Wed International Conference
on Probabilistic Models for Measurement
Copenhagen Denmark wwwrasch2010cbsdk
1194 Rasch Measurement Transactions 231 Summer 2009
Confirmatory factor analysis vs Rasch approaches
Differences and Measurement Implications
CFA Rasch
1 Fundamental and theoretical issues of measurement
Concept of
Measurement Based on classical test theory (CTT)
Numbers are assigned to respondentslsquo
attributes (Stevens 1946 1951)
The measure of a magnitude of a quantitative
attribute is its ratio to the unit of measurement the
unit of measurement is that magnitude of the
attribute whose measure is 1 (Michell 1999 p13)
Measurement is the process of discovering ratios
rather than assigning numbers
Rasch Model is in line with axiomatic framework
of measurement
Principle of specific objectivity
Model x = + + x hellip manifest item score
hellip item intercept parameter
factor loading of item i at factor j
factor score of factor j
hellip stochastic error term
For dichotomous data
P (a =1)= e - e -
a hellip response of person v to item i
hellip person location parameter
item location parameter (endorsability)
Relationship of
measure and
indicators (items)
Measure is directly and linearly related to
the indicators
Hence the weighted raw score is
considered to be a linear measure
Probability of a response is modeled as a logistic
function of two measures the person parameter
and the item location (endorsability)
Raw score is not considered to be a linear measure
transformation of raw scores into logits (Wright
1996 p10)
Independence of
samples and
parameters
Parameters are sample dependent
representative samples are important
Item parameters are independent of sample used
(subject to model fit and sufficient targeting)
2 Item selection and sampling (scale efficiency) issues
Item selection Items selected to maximize reliability leads
to items that are equivalent in terms of
endorsability which plays no explicit role in
CTT
Favors items that are similar to each other
(see bandwidth-fidelity problem Singh
2004)
Items are selected to cover a wide range of the
dimension (see bandwidthlsquo Singh 2004)
Endorsability of item plays a key role
Item
discrimination Discrimination varies from item to item but
is considered fixed within an item
Discrimination is equal for all items to retain a
common order of all items in terms of
endorsability for all respondents
Discrimination varies within an item (concept of
information which equals P (a =1) P (a =0) in
the dichotomous case) it reaches its maximum at
=
Targeting Items that are off-target may even increase
reliability and feign a small standard error which
can actually be quite large
Items that are off-target provide less information
standard errors will increase and the power of the test
of fit will decrease
Standard error of
measurement
Based on reliability assumed to be equal across
the whole range
Based on the information the items yield for a specific
person
Rasch Measurement Transactions 231 Summer 2009 1195
Sample size The required sample size mirrors
recommendations for structural equation
modeling (SEM) SEM is not appropriate for
sample sizes below 100 As a rule of thumb
sample sizes of greater than 200 are suggested
(Boomsma 1982 Marsh Balla and McDonald
1988) Bentler and Chou (1987) recommend a
minimum ratio of 51 between sample size and the number of free parameter to be estimated
In general the sample sizes used in structural equation
modeling are sufficient but insufficient targeting
increases the sample size needed According to
Linacre (1994) the minimum sample size ranges from
108 to 243 depending on the targeting with n=150
sufficient for most purposes (for item calibrations
stable within plusmn 05 logits and 99 confidence)
Distribution of
persons
Commonly assumed to be normal Irrelevant due to specific objectivity (subject to
sufficient targeting)
Missing data Problematic missing data has to be imputed
deleting persons may alter the standardizing
sample deleting items may alter the construct
pairwise deletion biases the factors (Wright
1996 p10)
Estimation of person and item parameters not affected
by missing data (except for larger standard errors)
Interpretation of
person measures
Usually in reference to sample mean In reference to the items defining the latent dimension
3 Dimensionality issues
Multi-
dimensionality
Multi-dimensionality easily accounted for A priori multi-dimensional constructs are split up into
separate dimensions
Directional
factors
Sensitivity to directional factors (Singh 2004) in
case of items worded in different directions
Low sensitivity to directional factors (Singh 2004)
4 Investigation of comparability of measures across groups
Assessment of
scale equivalence Multi-group analysis
Equivalence statements of parameters
estimated across groups
Differential item functioning analysis (DIF)
capitalizing on the principle of specific objectivity
Analysis of residuals in different groups
Incomplete
equivalence
Partial invariance (for group specific items
separate loadings andor intercepts are estimated)
Item split due to DIF (for group specific items separate
item locations are estimated)
Typical sequence
and principal
steps of analysis
Estimation of baseline model (group specific
estimates of loadings and item intercepts)
equality constraints imposed on loadings
(metric invariance)
equality constraints imposed on intercepts
(scalar invariance)
selected constraints lifted if necessary
(partial invariance)
estimation of model across groups
collapsing of categories if necessary
assessment of fit
assessment of DIF
items displaying DIF are split up if necessary
Etic (external)
versus emic
(internal)
In principle etic-oriented approach A
common set of invariant items is
indispensable
Concept of partial invariance allows for equal items functioning differently
Emic items ie items confined to one group
can be considered but technical set-up
complicated compared to Rasch analysis
In principle etic-oriented approach A common set
of invariant items is indispensable
Accounting for DIF by splitting the item allows for
equal items functioning differently
Emic items ie items confined to one group can
be considered very easily because handling of
missing data is unproblematic compared to CFA
Table 1 in Ewing Michael T Thomas Salzberger and Rudolf R Sinkovics (2005) ldquoAn Alternate Approach to Assessing
Cross-Cultural Measurement Equivalence in Advertising Researchrdquo Journal of Advertising 34 (1) 17-36
Courtesy of Rudolf Sinkovics with permission
1196 Rasch Measurement Transactions 231 Summer 2009
Sharing Ideas for Changing Health Care for All AmericansldquoShare your story and your ideas We want to hear what you think about health reform Send us your story
proposals and ideasrdquo -wwwhealthreformgov
Bad measurement stymies all health care reform efforts
that ignore it Health care reform will live or die on the
quality of measurement
The reason why health care reform efforts have failed has
largely to do with the poor quality of measurement
Though everyone recognizes how important measurement
is almost no one shows any awareness of the vitally
important features advanced measurement offers Health
care reform will succeed or fail depending on whether we
get the measures right
To live up to the full meaning of the term measures have
to do some very specific things To keep things simple all
we need to do is consider how we use measures in
something as everyday as shopping in the grocery store
The first thing we expect from measures are numbers that
stand for something that adds up the way they do The
second thing measures have to do is to stay the same no
matter where we go
Currently popular methods of measurement in health care
do not meet either of these expectations Ratings from
surveys and assessments counts of events and percentages of the time that something happens are
natural and intuitive places from which to begin
measurement but these numbers do not and cannot live
up to our expectations as to how measures behave To
look and act like real measures these kinds of raw data
must be evaluated and transformed in specific ways using
widely available and mathematically rigorous
methodologies
None of this is any news to researchers The scientific
literature is full of reports on the theory and practice of
advanced measurement The philosopher Charles Sanders
Peirce described the mathematics of rigorous measurement 140 years ago Louis Thurstone an
electrical engineer turned psychologist took major steps
towards a practical science of rigorous measurement in
the 1920s Health care admissions graduation and
professional licensure and certification examinations have
employed advanced measurement since the 1970s There
are a great many advantages that would be gained if the
technologies used in health carelsquos own educational
measurement systems were applied within health care
itself
Though we rarely stop to think about it we all know that fair measures are essential to efficient markets When
different instruments measure in different units market
transactions are encumbered by the additional steps that
must be taken to determine the value of what is being
bought and sold Health care is now so hobbled by its
myriad varieties of measures that common product
definitions seem beyond reach
And we have lately been alerted to the way in which innovation is more often a product of a collective
cognitive effort than it is of any one individuallsquos effort
For the wisdom of crowds to reach a critical mass at
which creativity and originality take hold we must have
in place a common currency for the exchange of value
ie a universal uniform metric calibrated so as to be
traceable to a reference standard shared by all
Since the publication of a seminal paper by Kenneth
Arrow in the early 1960s many economists have taken it
for granted that health care is one industry in which
common product definitions are impossible The success
of advanced measurement applications in health care research over the last 30 years contradicts that
assumption
Itlsquos already been 14 years since I myself published a
paper equating two different instruments for assessing
physical functioning in physical medicine and
rehabilitation Two years later I published another paper
showing that 10 different published articles reporting
calibrations of four different functional assessments all
showed the same calibration results for seven or eight
similar items included on each instrument
What many will find surprising about this research is that consensus on the results was obtained across different
samples of patients seen by different providers and rated
by different clinicians on different brands of instruments
What we have in this research is a basis for a generalized
functional assessment metric
Simply put in that research I showed how our two basic
grocery store assumptions about measurement could be
realized in the context of ratings assigned by clinicians to
patientslsquo performances of basic physical activities and
mobility skills With measures that really add up and are
as universally available as a measures we take for granted
in the grocery store we could have a system in which health care purchasers and consumers can make more
informed decisions about the relationship between price
and value With such a system quality improvement
efforts could be coordinated at the point of care on the
basis of observations expressed in a familiar language
Some years ago quality improvement researchers raised
the question as to why there are no health care providers
who have yet risen to the challenge and redefined the
industry relative to quality standards in the manner that
Toyota did for the automobile industry There have in
fact been many who tried both before and since that question was asked
Health care providers have failed in their efforts to
emulate Toyota in large part because the numbers taken
for measures in health care are not calibrated and
maintained the way the automobile industrylsquos metrics are
It is ironic that something as important as measurement
something that receives so much lip service should
Rasch Measurement Transactions 231 Summer 2009 1197
nonetheless be so widely skipped over and taken for
granted What we need is a joint effort on the part of the
National Institutes of Health and the National Institute of
Standards and Technology focused on the calibration and
maintenance of the metrics health care must have to get
costs under control
We need to put our money and resources where our
mouths are We will be very glad we did when we see the
kinds of returns on investment (40-400 and more) that
NIST reports for metrological improvement studies in
other industries
William P Fisher Jr PhD
wwwlivingcapitalmetricscom
Georg Rasch Factor Analysis and Scales
[Georg] Rasch was strongly against exploratory factor
analysis for two reasons Not only because it was based
on unrealistic assumptions like linearity and normality
but also because it was exploratory He therefore always
stressed that Rasch analysis is confirmatory That it does
require a theory of the construct and that the purpose of
the analysis was both to check the theory and to check the
items
And Rasch never talked about interval scales To Rasch
the constructs that we measure by Rasch models are
constructs on ratio scales with absolute zeros and arbitrary
units Taking the logarithm of a ratio scale measure [―for
practical purposes Rasch 1980 p80] creates something
similar to an interval scale since the arbitrary unit of the
ratio scale is transformed into an arbitrary origin of the
logit scale An arbitrary unit on the logit scale
corresponds to an arbitrary power transformation on the
ratio scale which is rarely taken to be part of the
definition of ratio scales
Svend Kreiner
Item Characteristic Curves Model and Empirical
Figure 3 in Rashid et al (2008) WSEAS Transactions on
Advance in Engineering Education 8 5 591-602
Infit Mean-squares Mean plusmn 2 SD ―There are no hard-and-fast rules for setting upper- and
lower-control limits for the infit statistics (ie infit mean-
square index) In general as Pollitt and Hutchinson
(1987) suggest any individual infit mean-square value
needs to be interpreted against the mean and standard
deviation of the set of infit-mean square values for the
facet concerned Using these criteria a value lower than the mean minus twice the standard deviation would
indicate too little variation lack of independence or
overfit A value greater than the mean plus twice the
standard deviation would indicate too much
unpredictability or misfit (Park 2004)
Comment This advice accords with an investigation into
―Do the data fit the model usefully The mean-squares
are geometric with a range of 0-1-infin which suggests that
the computation of mean and standard deviation should be
done using log(mean-squares) In general overfit (low
mean-square) is generally a much smaller threat to the
validity of the measures than excessive unpredictability (high mean-square)
Park T (2004) An investigation of an ESL placement test
using Many-Facet Rasch Measurement Teachers College
Columbia University Working Papers in TESOL and
Applied Linguistics 4 1 httpjournalstc-libraryorgindexphptesolarticleview4148
Pollitt A amp Hutchinson C (1987) Calibrated graded
assessment Rasch partial credit analysis of performance
in writing Language Testing 4 72-92
Call for Research Conference Proposals
As announced in the May issue of the Educational
Researcher this year AERA has launched a new program
of support for conferences in education research AERA
supports conferences intended to break new ground in
substantive areas of inquiry stimulate new lines of study
on issues that have been largely unexplored or develop innovative research methods or techniques that can
contribute more generally to education research Please
read the Call and consider bringing forth important
conference proposals that can advance the field Awards
may range from $25000-$50000 depending upon the
scope duration and the number of participants
anticipated
For detailed information on the call and guidelines for
proposals see wwwaeranetuploadedFilesConference-Guidelines_ER_Conferencespdf
The deadline for submission is September 1 2009
If you have any questions or comments please contact me
at flevine at aeranet
Felice J Levine PhD
Executive Director
American Educational Research Association
1198 Rasch Measurement Transactions 231 Summer 2009
Explaining Rasch Measurement in Different WaysLearning and teaching about Rasch measurement can be
exciting and challenging as one needs to help students think about measurement in new ways As a teacher of
measurement to both graduate and undergraduates I try
different techniques of presenting Rasch concepts In the
MESA program of the University of Chicago Ben Wright
would explain something and sometimes I would not
quite get it Then someone else would rephrase the issue
with different words and I would understand
In my classes I have found it to be quite helpful to ask
students to review the basic technical testing manuals
which many US States have produced to document State
testing procedures These manuals discuss Rasch in
different ways using different words and often the material is organized in a unique way by each State Often
the text is written at a level that is appropriate for an
almost non-technical reader
In the middle of the semester when we are toward the end
of our discussion concerning the Rasch analysis of testing data I ask my students to review the web-sites of 5 States
(Ohio Texas Pennsylvania California Illinois) Each of
these States use Rasch measurement for their high stakes
testing I ask students to write down what they better
understand as the result of these reports What was it
about report phrasing that helped them I also ask
students to tell me what they still do not understand
Finally I require them to write a short summer report of
their own in which they explain Rasch and testing to a
teacher exploring a State web site
Here are the URLs of those 5 states It takes some
digging for as one can imagine each state has technical reports in different parts of their web-site
William J Boone
Miami University of Ohio
State of Ohio K-12 Testing First go here for Ohio
wwwodestateohusGDTemplatesPagesODEODEPrimaryaspxPage=2ampTopicID=222ampTopicRelationID=285
Then select ―Statistical Summaries and Item Analysis Reports The URL for this part of the site is wwwodestateohusGDTemplatesPagesODEODEDetailaspxpage=3ampTopicRelationID=285ampContentID=9479ampContent=60228
Then select a technical report such as ―March 2008 OGT Statistical Summary
State of Texas K-12 Testing First go here for Texas wwwteastatetxusindex3aspxid=3320ampmenu_id3=793 - t
Then select ―Technical Digest which is this URL
wwwteastatetxusindex3aspxid=4326ampmenu_id3=793
Then select a date for instance ―Technical Digest 2007-2008 Then select a chapter such as 15
httpritterteastatetxusstudentassessmentresourcestechdigest2008chapter_15pdf
State of Pennsylvania K-12 Testing First go here for Pennsylvania
wwwpdestatepausa_and_tsitedefaultasp
Then for a sample State of Pennsylvania technical report select ―Technical Analysis
wwwpdestatepausa_and_tcwpviewaspa=108ampQ=108328ampa_and_tNav=|6395|ampa_and_tNav=|
Then select a technical report such as ―2008 Reading and Mathematics PSSA Technical Report
wwwpdestatepausa_and_tliba_and_t2008_Math_and_Reading_Technical_Reportpdf
State of California K-12 Testing First go here for California
wwwcdecagovtatgsrtechnicalrptsasp
Then go here for a sample State of California technical report select a sample report such as California Standards Tests CSTs
Technical Report Spring 2008 Administration
wwwcdecagovtatgsrdocumentscsttechrpt08pdf
State of Illinois K-12 Testing First go here in Illinois
wwwisbestateilusassessmentpsaehtm - ed
Then you can select a State of Illinois technical report such as Draft 2006 PSAE Technical Manual
wwwisbestateilusassessmentpdfs2006_PSAE_tech_manualpdf
Rasch Measurement Transactions 231 Summer 2009 1199
1200 Rasch Measurement Transactions 231 Summer 2009
Rasch BenchmarkingWhen a global 500 company was asked to assess whether
they were a ―Great Place to Work they went through a lengthy vendor selection process to find a research
organization that could conduct a benchmark study The
winning bid would take six months to complete at a cost
of just north of $100000 Then the economy went south
and the project was canceled but the need for the project
persisted so we conducted a stealth benchmark study
Herelsquos what we did
A top-down approach We put Business Week Vault and
Consulting Magazinersquos ranking of company prestige into
a matrix converted the rankings into a five-point scale
ran them through Rasched them and converted them to
percentiles
A bottom-up approach We went to Vaultcom where
employees give the inside scoop on the companies they
work for and coded who is good to work for and why For
example ―[Company Xlsquos] promotion policy is among the
best if not the best in the industry This is a major draw to
X for prospective hires and is truly one of the best
aspects of the firm This received a 1 under ―Career
Path while ―The company is certainly the opposite of a
meritocracy with advancement more dependent on who
you know rather than what you know received a 0 We
ended up with half a dozen categories that were consistent across all companies Compensation Career Path
Culture Diversity Work-life Balance Necessity of Face
Time and Training As before we put the data in a
matrix Rasched and converted into percentiles
A both approach We then graphed the results (see Figure
below) and were surprised to find A) that we stank and B) that a factor that distinguished whether a company was a
great place to work was whether they offered tuition
reimbursement The latter (at least) was surprising
surprising because economists consistently argue that
companies should not offer tuition reimbursement
because it increases employeeslsquo portable skills ―Thanks
for the degree Bye The great companies however are
not thinking economics They are thinking game theory
You win the war for talent by outflanking your opponent
―Sure you can steal my highly-educated people but I can
steal yours and we can all take from those who donlsquot
educate their people
Three interesting things came from this study First it
became part of a business case for us to create our own
legal and accredited graduate program which puts our
competitors in a pickle because it is too expensive to
offer tuition reimbursement and their own degree and
once youlsquove offered reimbursement employees will howl
if you take it away Second it raises a philosophical issue
all of the data is subjectivemdashprestige ratings and
employee commentsmdashbut since anybody can replicate the
study to get the same result the study is objective Third
we completed the study with no non-payroll cost in a week
Tad Waddington
wwwlastingcontributioncom
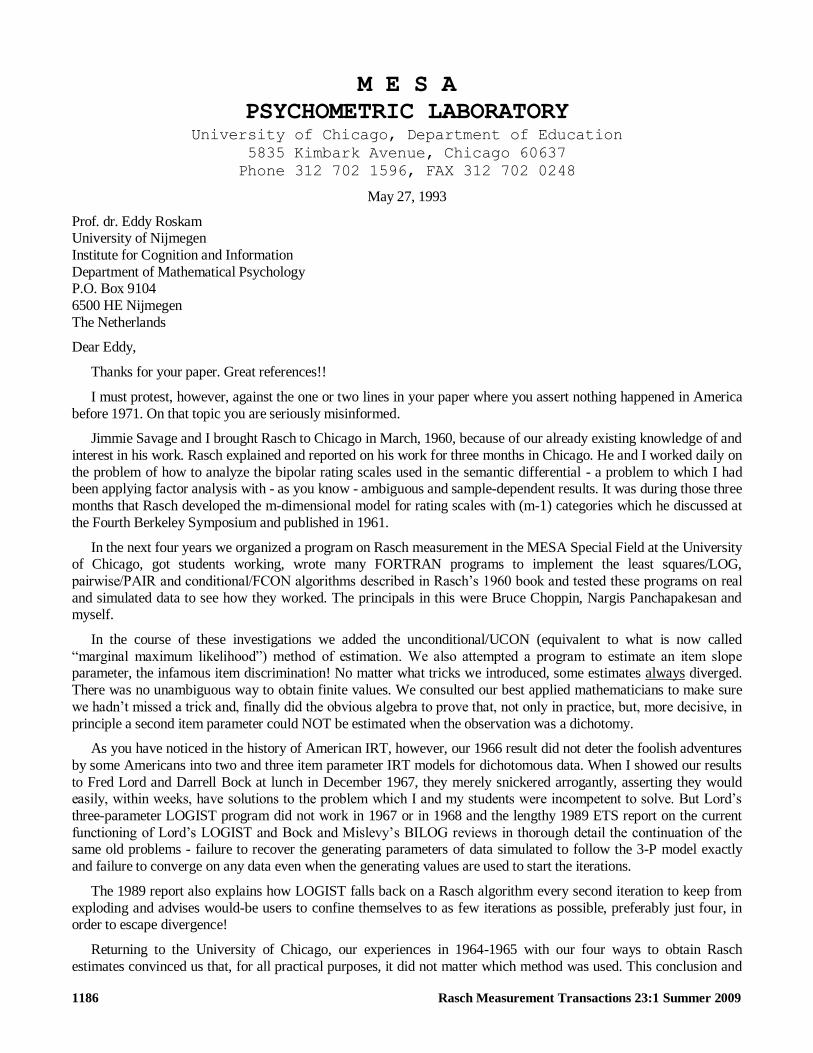
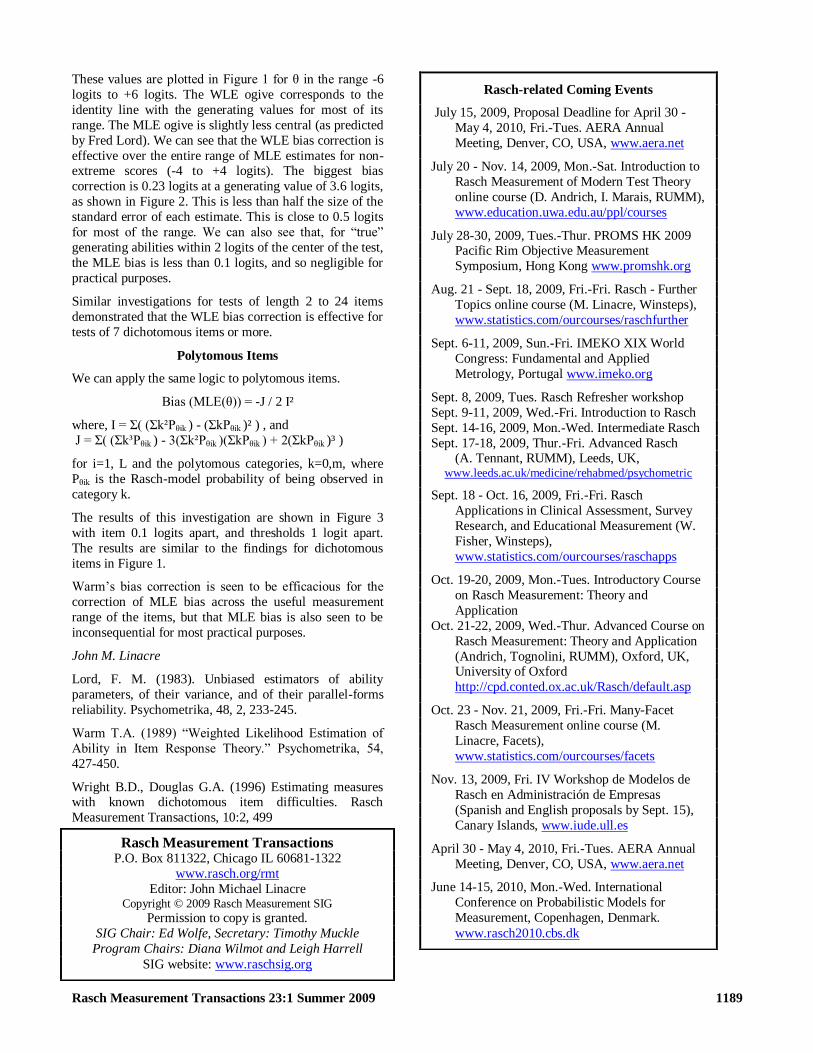
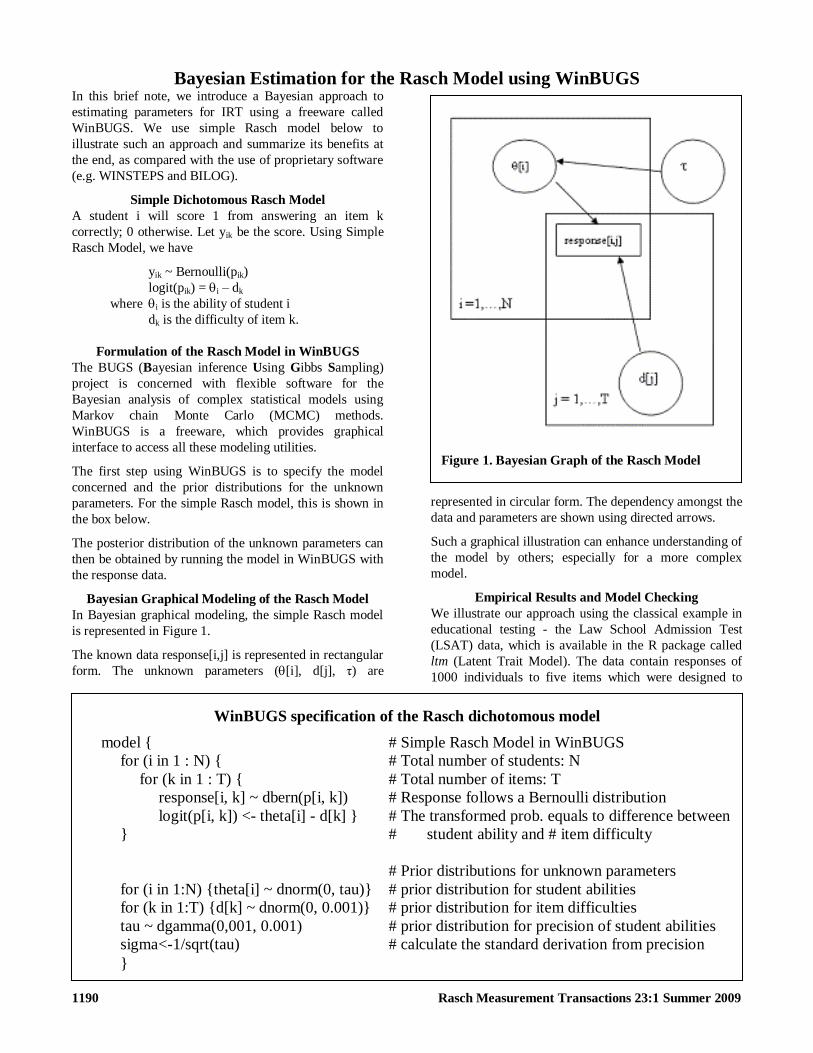
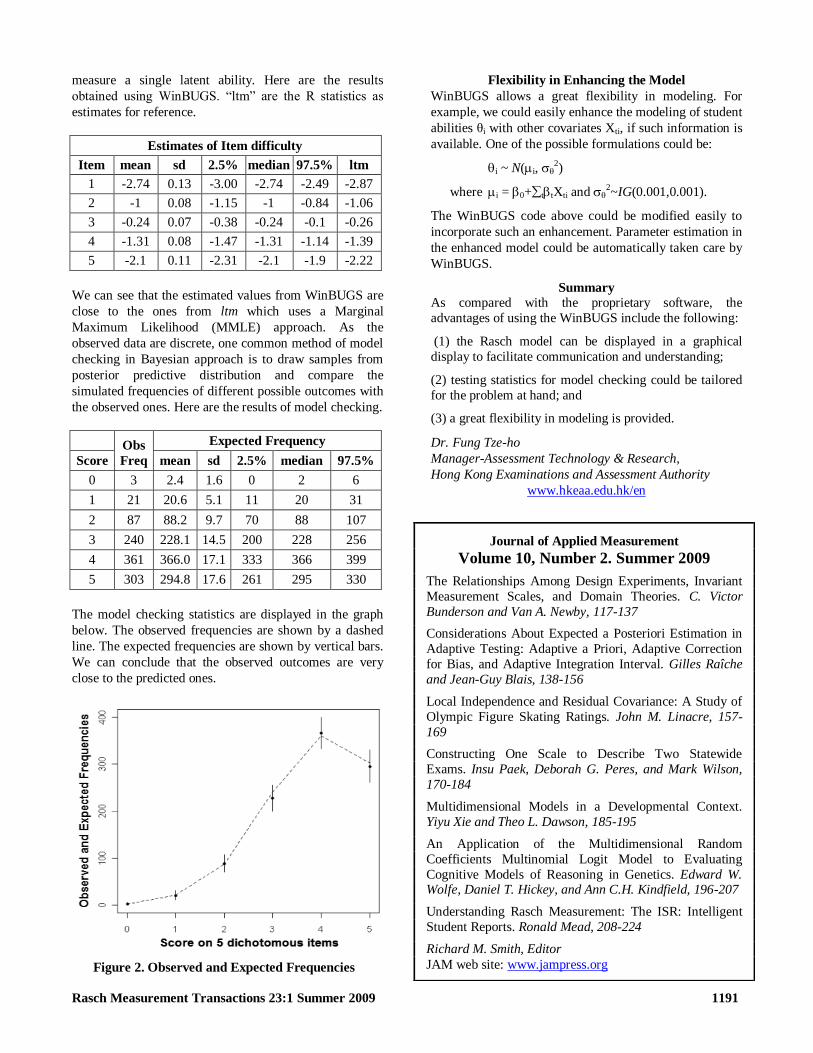
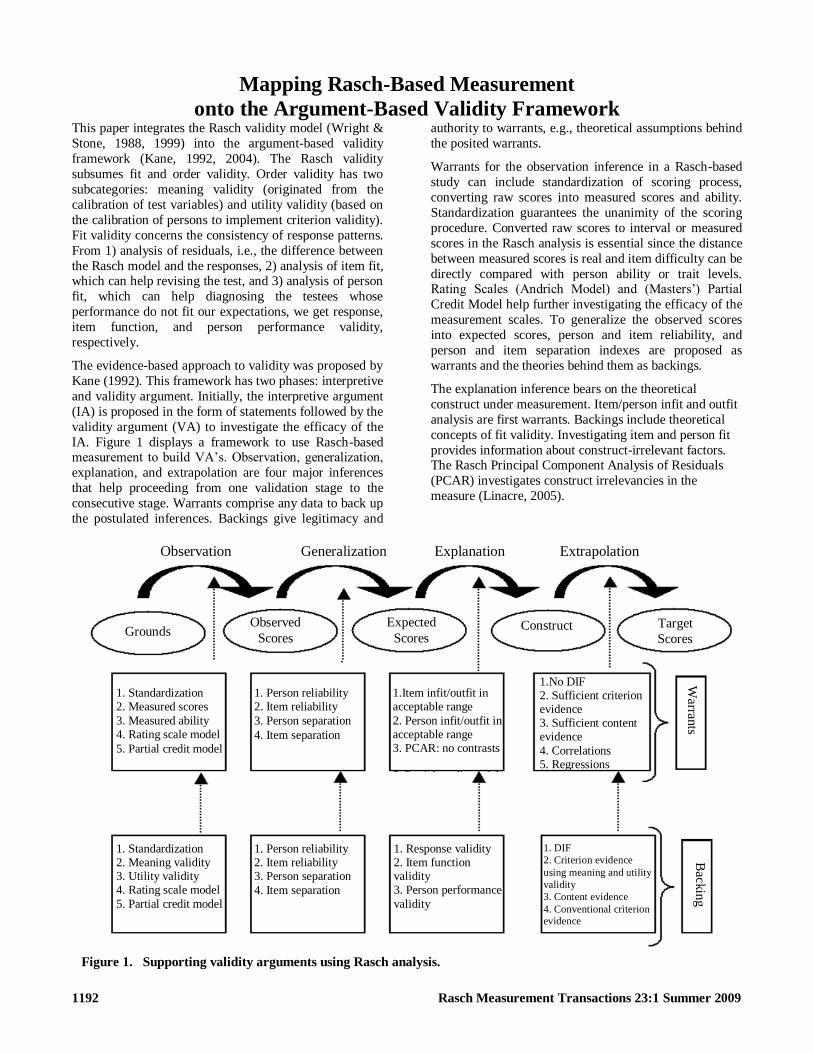
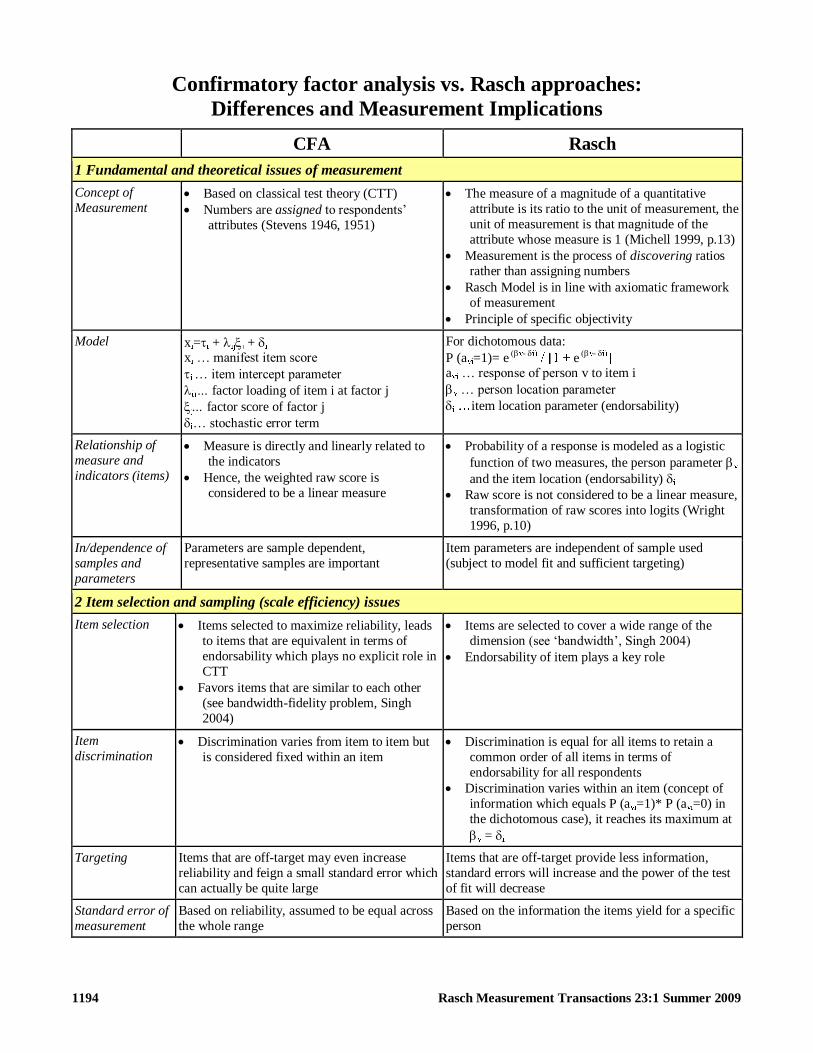
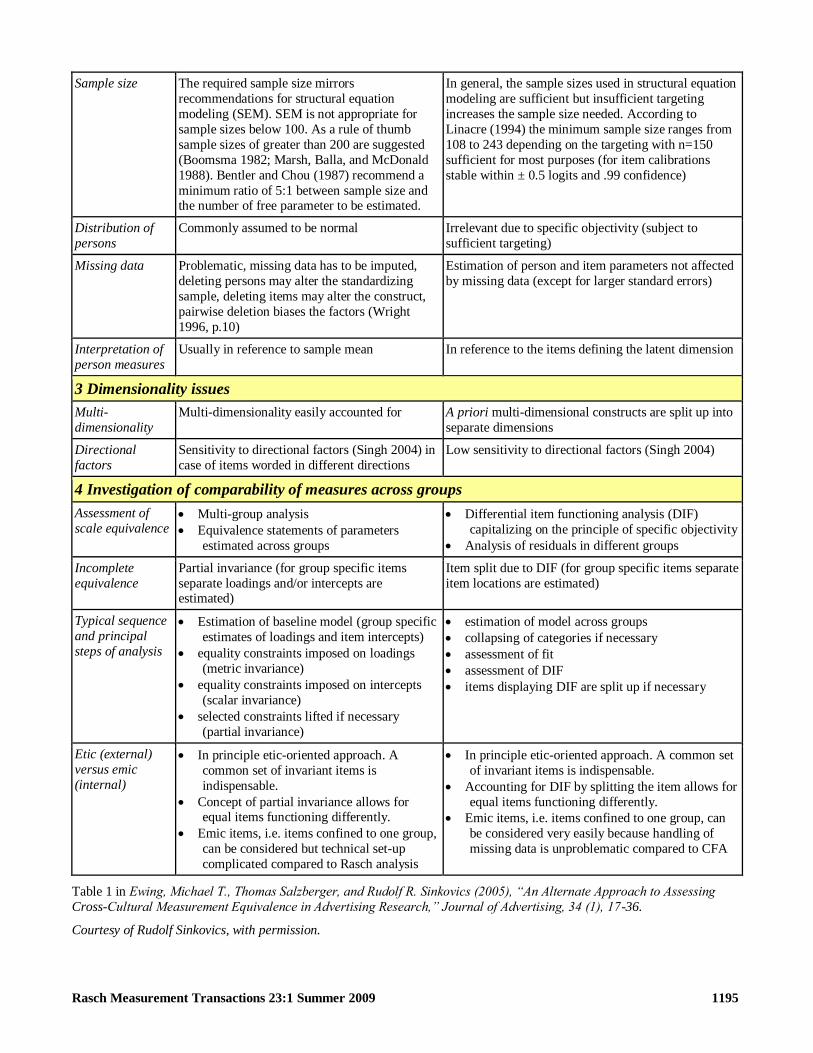
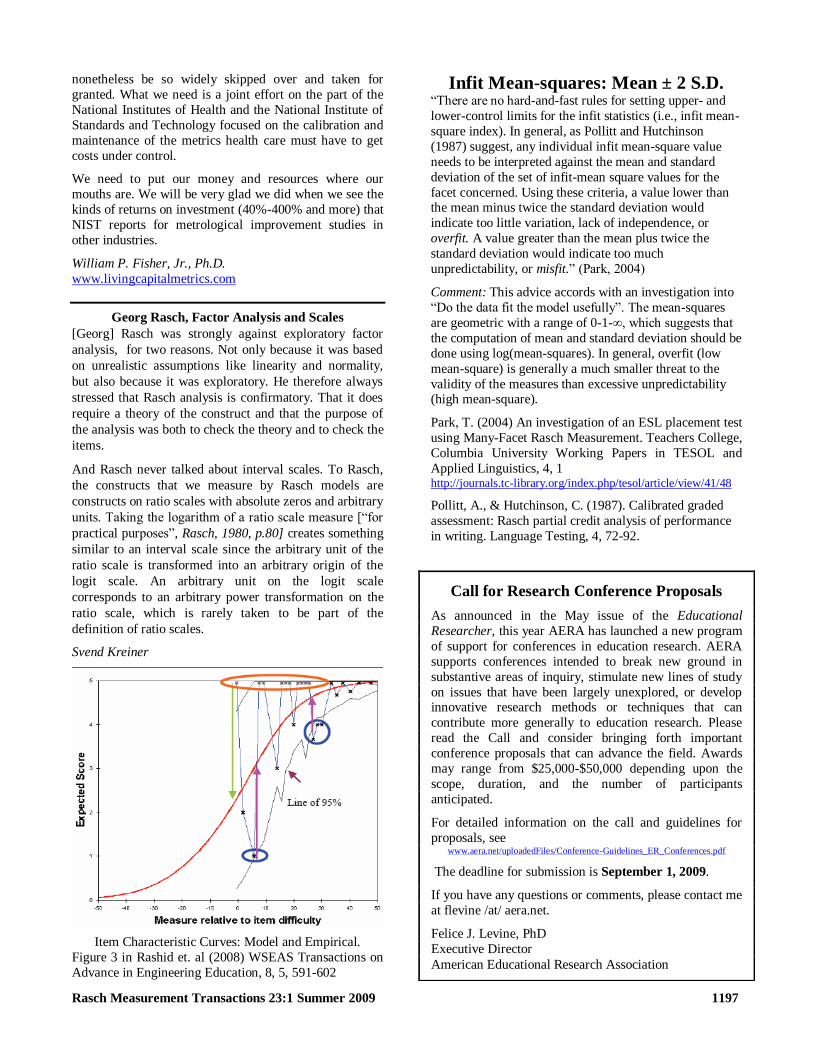