warm up 1)the product of a number and 9 increased by 4 is 58. find the number. 9x + 4 = 58 9x = 54 x...
TRANSCRIPT


Warm Up1) The product of a number and 9 increased by 4 is 58. Find the number.
9x + 4 = 589x = 54
x = 6
2) Solve for x2x + 80
3x5(x + 2)
5(x + 2) + 2x + 80 + 3x = 180
5x + 10 + 2x + 80 + 3x = 180
10x + 10 + 80 = 180
10x + 90 = 18010x = 90
x = 9
3) 9 – 4(2p – 1) = 45
9 – 8p + 4 = 45
13 – 8p = 45
-8p = 32
p = -4
4) 9x = 3(x – 2)
9x = 3x - 6
6x = -6
x = -1
CHAPTER 6

CHAPTER 6.6Measures of CenterMean, Median, Mode and Range
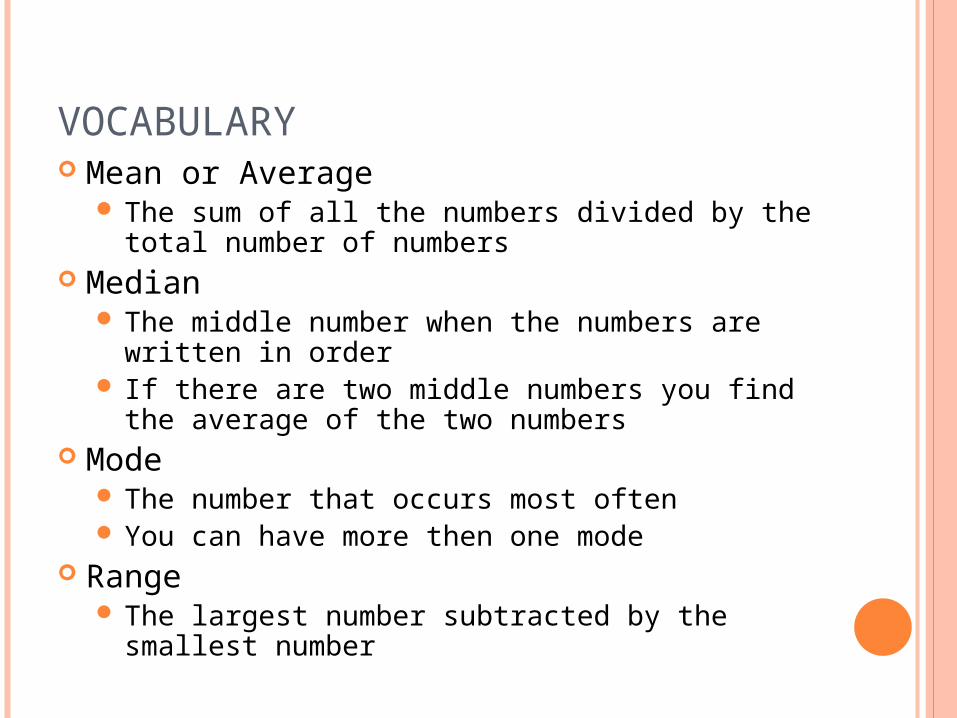
VOCABULARY Mean or Average
The sum of all the numbers divided by the total number of numbers
Median The middle number when the numbers are
written in order If there are two middle numbers you find the
average of the two numbers Mode
The number that occurs most often You can have more then one mode
Range The largest number subtracted by the smallest
number

FIND THE MEAN, MEDIAN, MODE AND RANGE
4, 2, 10, 6, 10, 7, 10First write the numbers in order from least to greatest
2, 4, 6, 7, 10, 10, 10Mean:
Median:
Mode:
Range:
7
1010107642
7
497
2, 4, 6, 7, 10, 10, 1010
10 – 2 =8
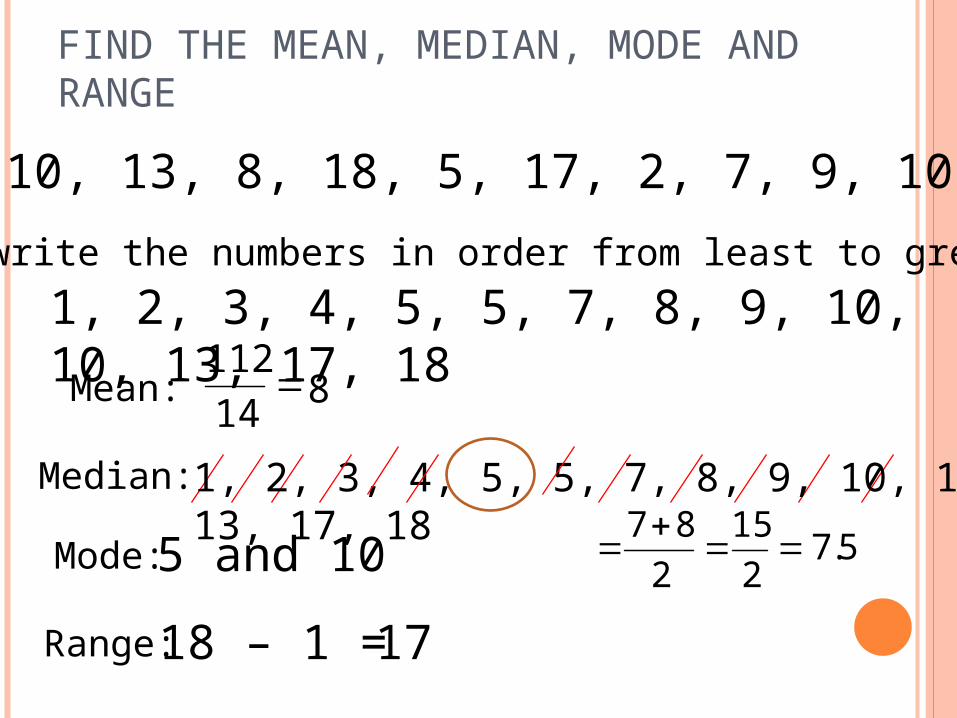
FIND THE MEAN, MEDIAN, MODE AND RANGE
5, 3, 10, 13, 8, 18, 5, 17, 2, 7, 9, 10, 4, 1
First write the numbers in order from least to greatest
Mean:
Median:
Mode:
Range:
14
1128
5 and 10
18 – 1 =17
1, 2, 3, 4, 5, 5, 7, 8, 9, 10, 10, 13, 17, 18
1, 2, 3, 4, 5, 5, 7, 8, 9, 10, 10, 13, 17, 18
2
87
2
155.7

WHAT DO YOU KNOW USING MEAN, MEDIAN, MODE AND RANGE?
Which is greater?Which is smaller?
Are any equal?
8, 5, 6, 5, 6, 6
Mean = 6
Median = 6
Mode = 6Range = 3
Mean, Median and Mode are all equal
Range is the smallest

WHAT DO YOU KNOW USING MEAN, MEDIAN, MODE AND RANGE?
Which is greater?Which is smaller?
Are any equal?161, 146, 158, 150, 156, 150,
146, 150, 150, 156, 158, 161Mean = 153.5
Median = 153
Mode = 150Range = 15
Mean, is the greatest
Range is the smallest
Mean > Median
Median > Mode
Mode < Mean
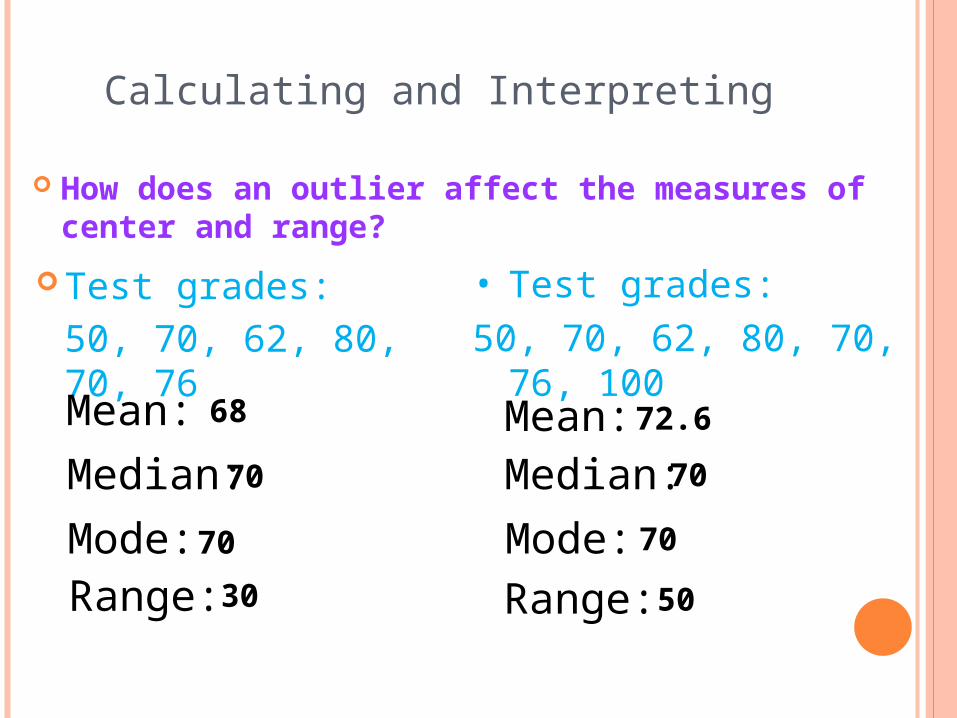
Calculating and Interpreting
How does an outlier affect the measures of center and range?
Test grades:
50, 70, 62, 80, 70, 76
Mean:
Median:
Mode:Range:
68
70
30
70
• Test grades:
50, 70, 62, 80, 70, 76, 100
Mean:Median:
Mode:
Range:
72.6
70
70
50

Calculating and Interpreting
How does an outlier affect the measures of center and range?
8, 5, 6, 5, 6, 6
Mean:
Median:
Mode:Range:
6
6
3
6
• 8, 5, 6, 5, 6, 6, 15
Mean:Median:
Mode:
Range:
6
6
10
7.3
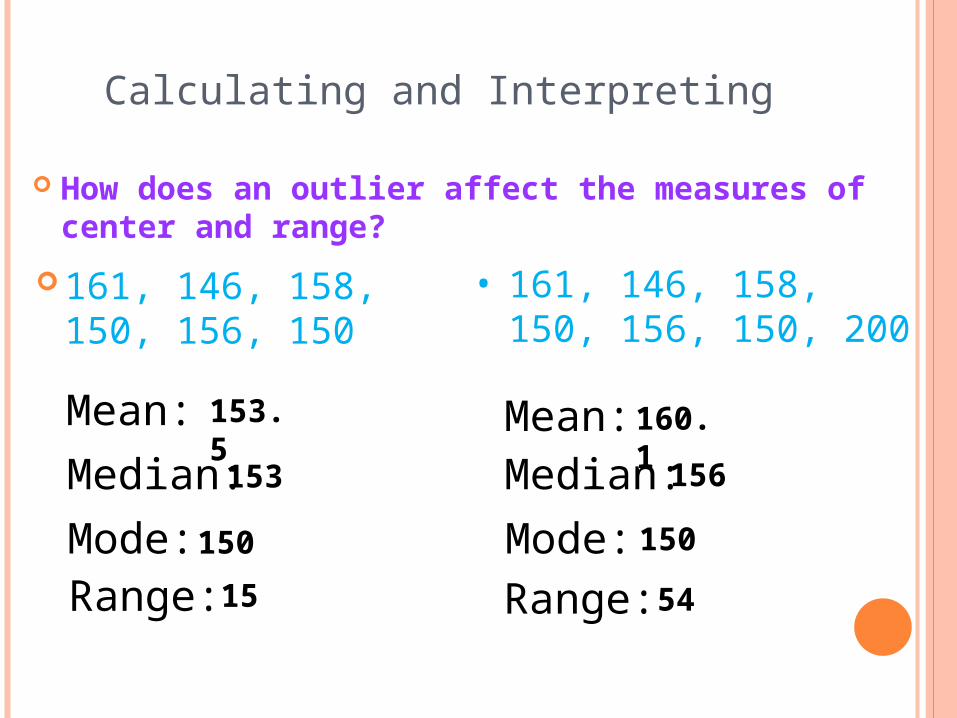
Calculating and Interpreting
How does an outlier affect the measures of center and range?
161, 146, 158, 150, 156, 150
Mean:
Median:
Mode:Range:
153.5
153
15
150
• 161, 146, 158, 150, 156, 150, 200
Mean:Median:
Mode:
Range:
160.1
156
150
54

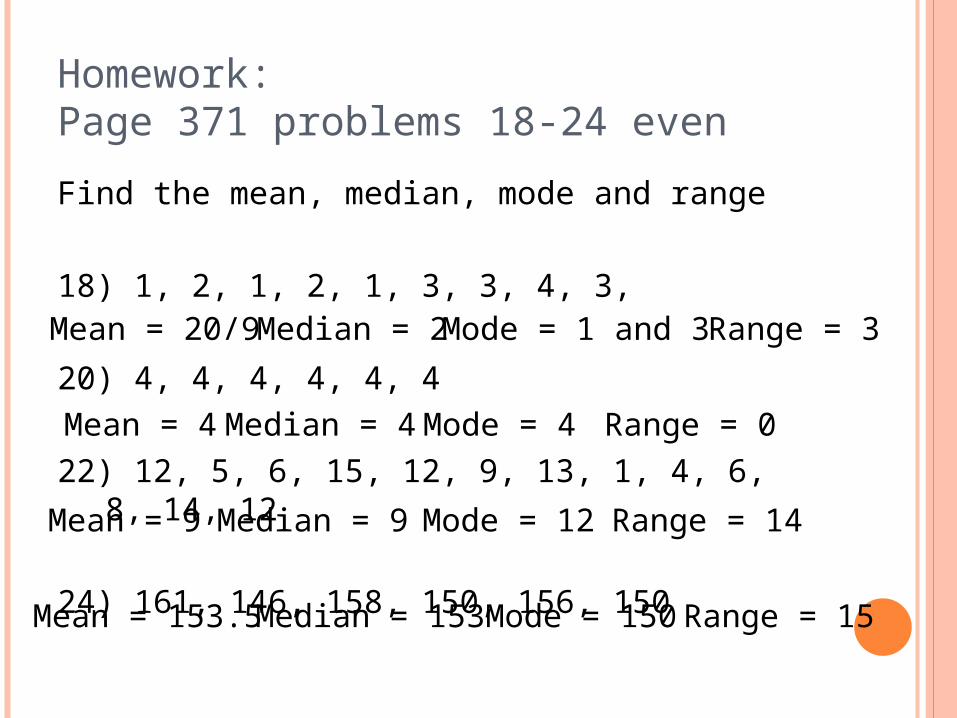
Homework: Page 371 problems 18-24 even
Find the mean, median, mode and range
18) 1, 2, 1, 2, 1, 3, 3, 4, 3,
20) 4, 4, 4, 4, 4, 4
22) 12, 5, 6, 15, 12, 9, 13, 1, 4, 6, 8, 14, 12
24) 161, 146, 158, 150, 156, 150

Warm Up
1. How do you find the mean?
2. How do you find the median?
3. How do you find the mode?
4. How do you find the range?
5. Find the mean, median, mode and range.4, 2, 10, 6, 10, 7, 10
Mean = 7 Median = 7 Mode = 10 Range = 8
Add up all the numbers then divide by how many numbers there are
Put the numbers in order and find the middle number
Find the number that occurs most often
Subtract the largest number and the smallest number
Homework: Page 371 problems 18-24 even
Find the mean, median, mode and range
18) 1, 2, 1, 2, 1, 3, 3, 4, 3,
20) 4, 4, 4, 4, 4, 4
22) 12, 5, 6, 15, 12, 9, 13, 1, 4, 6, 8, 14, 12
24) 161, 146, 158, 150, 156, 150
Mean = 20/9 Median = 2 Mode = 1 and 3 Range = 3
Mean = 4 Median = 4 Mode = 4 Range = 0
Mean = 9 Median = 9 Mode = 12 Range = 14
Mean = 153.5 Median = 153 Mode = 150 Range = 15
CHAPTER 6.6Stem-and-Leaf Plot

STEM-AND-LEAF PLOT
Arrangement of digits that is used to display and order numerical data

MAKING A STEM-AND-LEAF PLOT
60, 74, 75, 63, 78, 70, 50, 74, 52, 74, 65, 78, 54
567
0 2 4
0
0
3
4
5
4 4 5 8 8

PRACTICE ON YOUR OWN
4, 31, 22, 37, 39, 24, 2, 28, 1, 26, 28, 30, 28, 3, 20, 20, 5
0123
1 2 3 4 5
0 0 2 4 6 8 8 8
0 1 7 9

CHAPTER 6.7Box-and-Whisker Plots
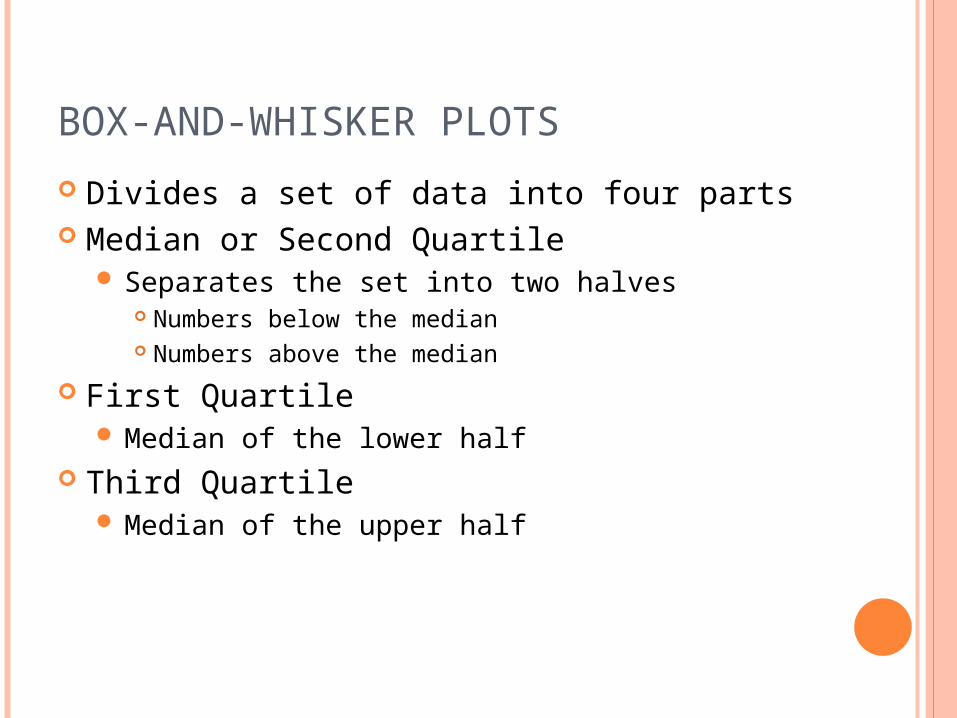
BOX-AND-WHISKER PLOTS
Divides a set of data into four parts Median or Second Quartile
Separates the set into two halves Numbers below the median Numbers above the median
First Quartile Median of the lower half
Third Quartile Median of the upper half
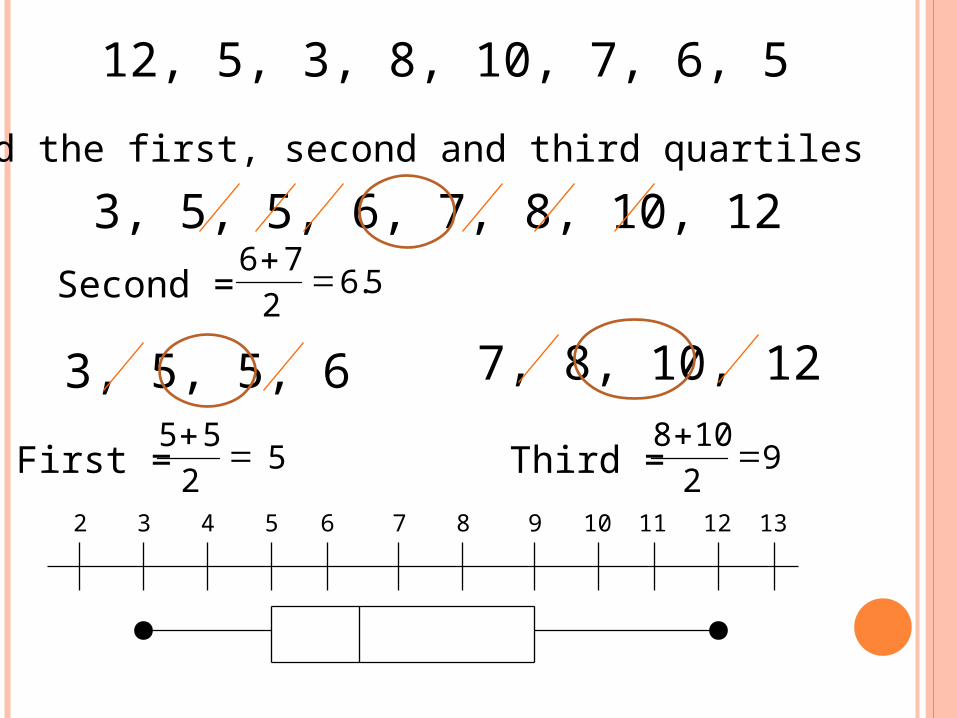
12, 5, 3, 8, 10, 7, 6, 5
Find the first, second and third quartiles
3, 5, 5, 6, 7, 8, 10, 12Second =
2
765.6
3, 5, 5, 6 7, 8, 10, 12
First = Third =2
555
2
1089
2 3 4 5 6 7 8 9 10 11 12 13
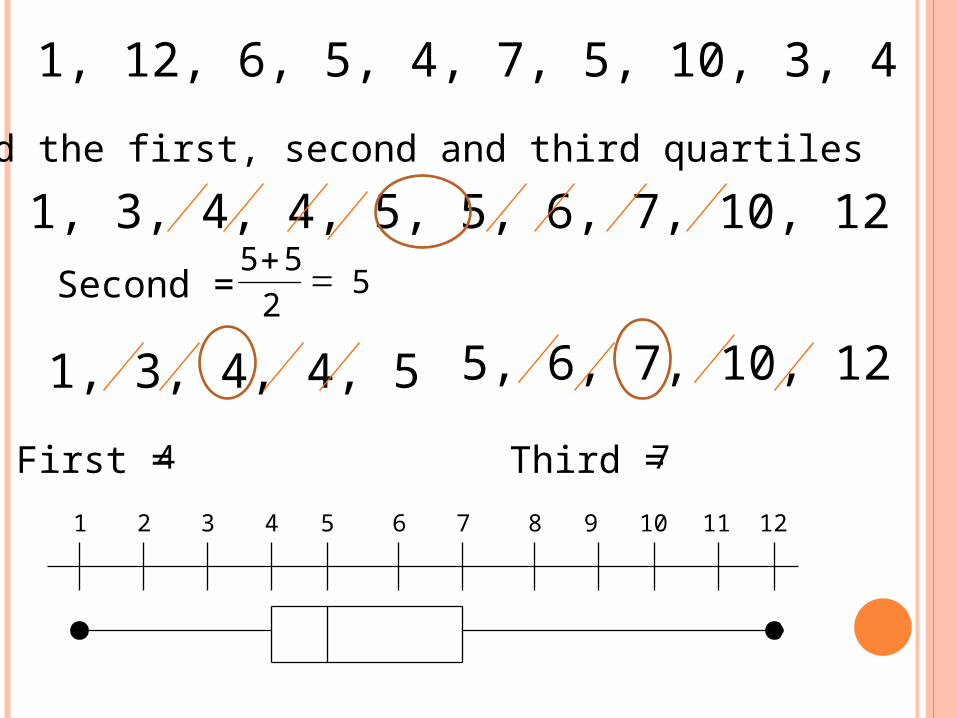
1, 12, 6, 5, 4, 7, 5, 10, 3, 4
Find the first, second and third quartiles
1, 3, 4, 4, 5, 5, 6, 7, 10, 12Second =
2
555
1, 3, 4, 4, 5 5, 6, 7, 10, 12
First = Third =4 7
1 2 3 4 5 6 7 8 9 10 11 12

6, 7, 10, 6, 2, 8, 7, 7, 8
Find the first, second and third quartiles
2, 6, 6, 7, 7, 7, 8, 8, 10Second =7
2, 6, 6, 7 7, 8, 8, 10
First = Third =6 8
1 2 3 4 5 6 7 8 9 10 11 12
2
66
2
88

PRACTICE
Answer the questions. Draw a Box-and-Whisker plot for each
question.
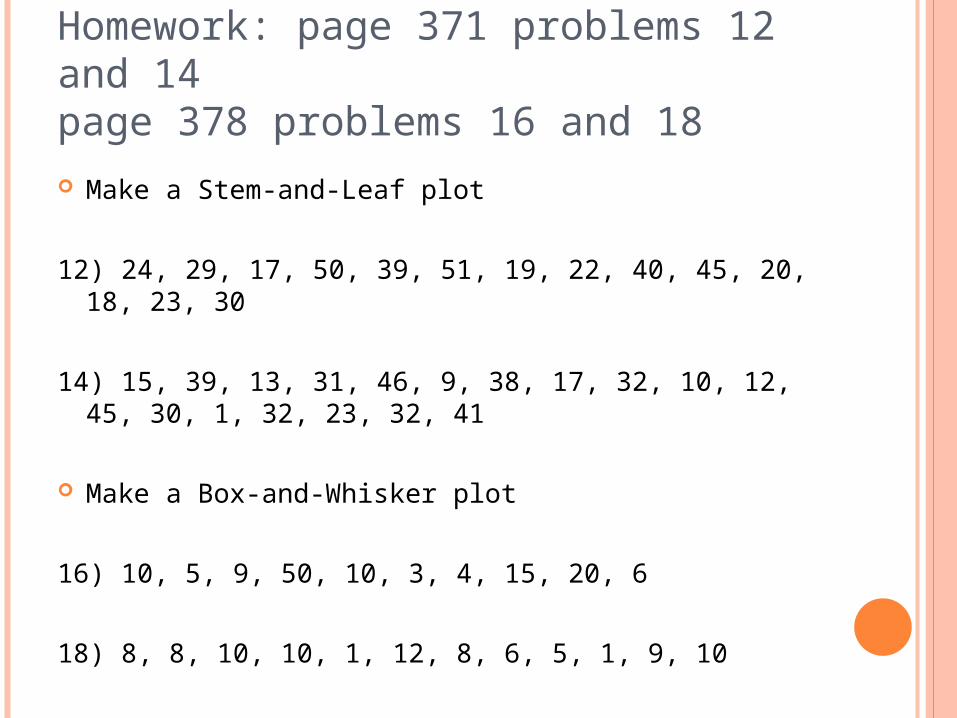
Homework: page 371 problems 12 and 14page 378 problems 16 and 18 Make a Stem-and-Leaf plot
12) 24, 29, 17, 50, 39, 51, 19, 22, 40, 45, 20, 18, 23, 30
14) 15, 39, 13, 31, 46, 9, 38, 17, 32, 10, 12, 45, 30, 1, 32, 23, 32, 41
Make a Box-and-Whisker plot
16) 10, 5, 9, 50, 10, 3, 4, 15, 20, 6
18) 8, 8, 10, 10, 1, 12, 8, 6, 5, 1, 9, 10

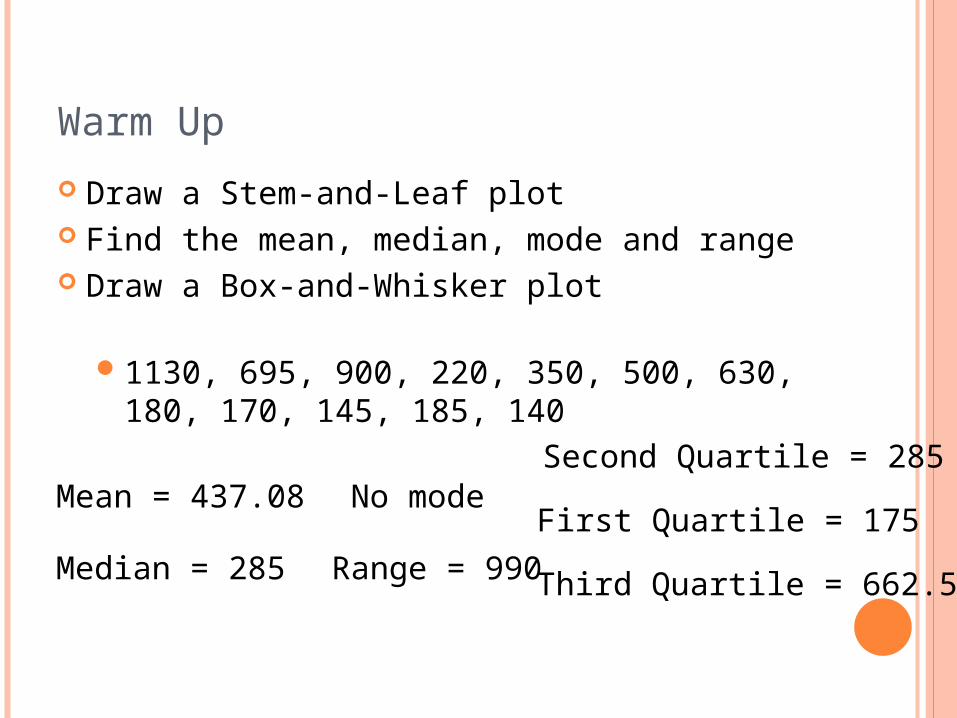
Warm Up
Draw a Stem-and-Leaf plot Find the mean, median, mode and range Draw a Box-and-Whisker plot
1130, 695, 900, 220, 350, 500, 630, 180, 170, 145, 185, 140
Mean = 437.08
Median = 285
No mode
Range = 990
Second Quartile = 285
First Quartile = 175
Third Quartile = 662.5

Homework: page 371 problems 12 and 14page 378 problems 16 and 18 Make a Stem-and-Leaf plot
12) 24, 29, 17, 50, 39, 51, 19, 22, 40, 45, 20, 18, 23, 30
14) 15, 39, 13, 31, 46, 9, 38, 17, 32, 10, 12, 45, 30, 1, 32, 23, 32, 41
Make a Box-and-Whisker plot
16) 10, 5, 9, 50, 10, 3, 4, 15, 20, 6
18) 8, 8, 10, 10, 1, 12, 8, 6, 5, 1, 9, 10

Chapter 6 Quiz Review

Find the mean, median, mode and range
4, 8, 10, 6, 12, 16, 10, 22
Mean = 11 Median = 10 Mode = 10 Range = 18
What can you tell from the data?

Draw a Stem-and-Leaf Plot
60, 74, 75, 63, 78, 70, 50, 74, 52, 74, 65, 78, 54
Draw a Box-and-Whisker Plot
12, 5, 3, 8, 10, 7, 6, 5
Second Quartile = 6.5 First Quartile = 5 Third Quartile = 9
QUIZ ON CHAPTER 6


STATISTICSBell Curve, Standard Deviation, Z-curve, etc.
What’s Normal?
Descriptive Statistics
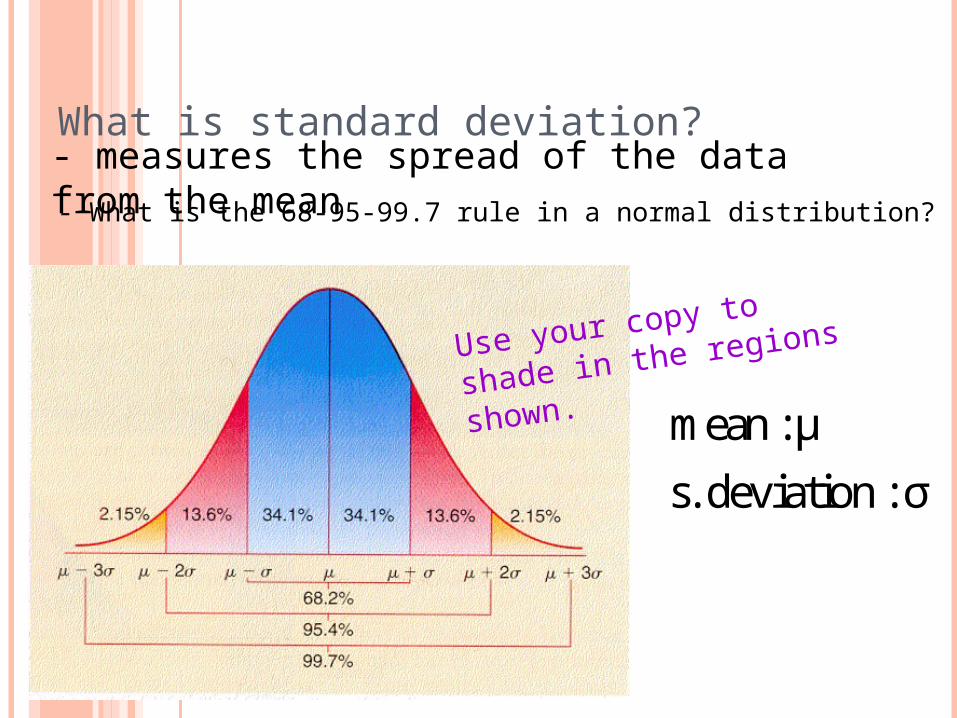
What is standard deviation?
- What is the 68-95-99.7 rule in a normal distribution?
- measures the spread of the data from the mean
mean :
s. deviation :
μ
σ
Use your copy to shade in
the regions shown.

The 68-95-99.7 RuleFor a normal distribution,
68% of the data generally falls within 1 standard deviation of the mean.
95% of the data generally falls within 2 standard deviations of the mean.
99.7% of the data generally falls within 3 standard deviations of the mean.

Notation
x
.x vs μSigma notation: sum of all the elements Average of a set
of data values
Read as x bar
sample
Read as mu
population
μ
8
i 1
i = 1 + 2 + 3 + 4 + 5 + 6 + 7 + 8
5
ii 1
x = x1 + x2 + x3 + x4 + x5
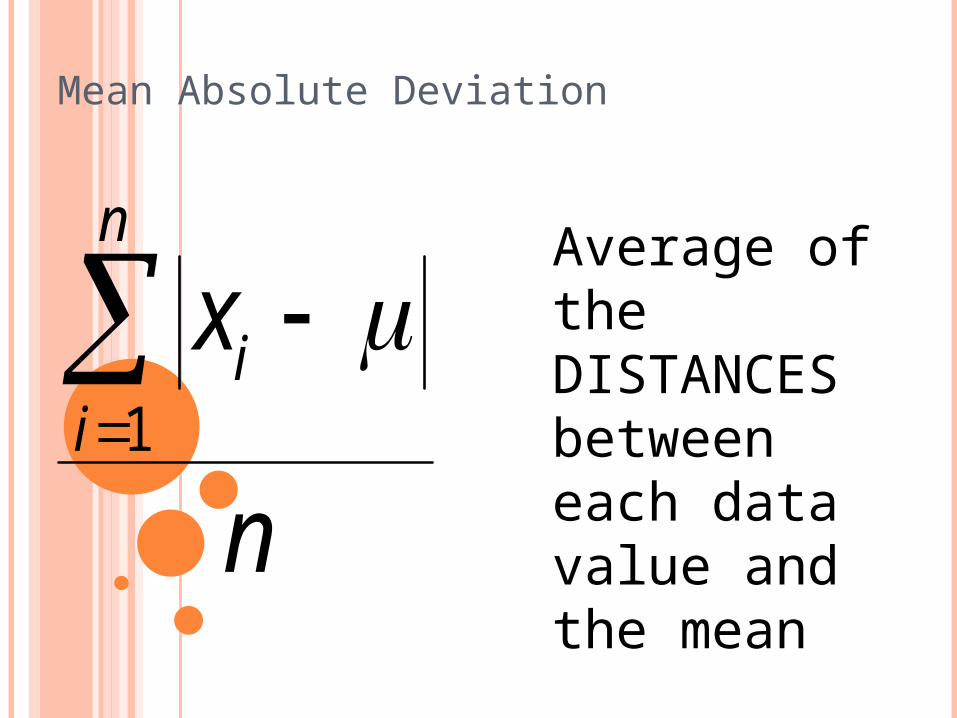
Mean Absolute Deviation
n
ii
x
n
1
Average of the DISTANCES between each data value and the mean

Variance
( )n
ii
x
n
2
1
Average of the squares of the differences between each data value and the mean

Standard Deviation
( )n
ii
x
n
2
1
Square root of the variance

Measures of Dispersion
• describes the average distance from the mean
• describes the spread of the data
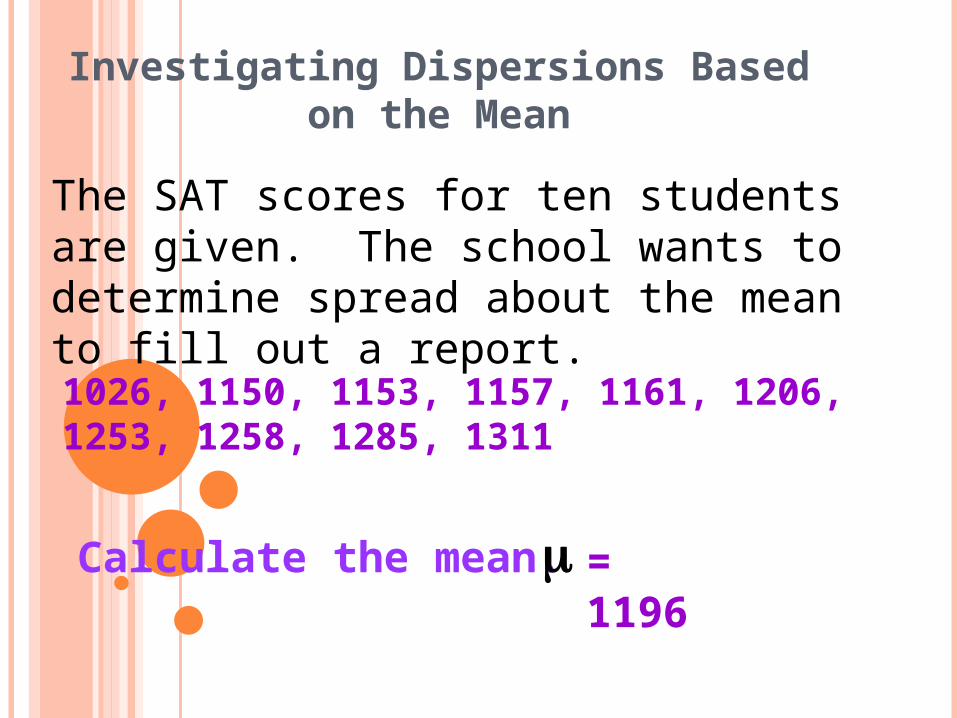
Investigating Dispersions Based on the Mean
The SAT scores for ten students are given. The school wants to determine spread about the mean to fill out a report.
1026, 1150, 1153, 1157, 1161, 1206, 1253, 1258, 1285, 1311
Calculate the mean. = 1196

Investigating Dispersions Based on the Mean
Create a chart of values for the SAT data set and determine the distance each data piece is from the mean.
x
1026
1150
1153
1157
1161
1206
1253
1258
1285
1311
x
-170
-46
-43
-39
-35
10
57
62
89
115
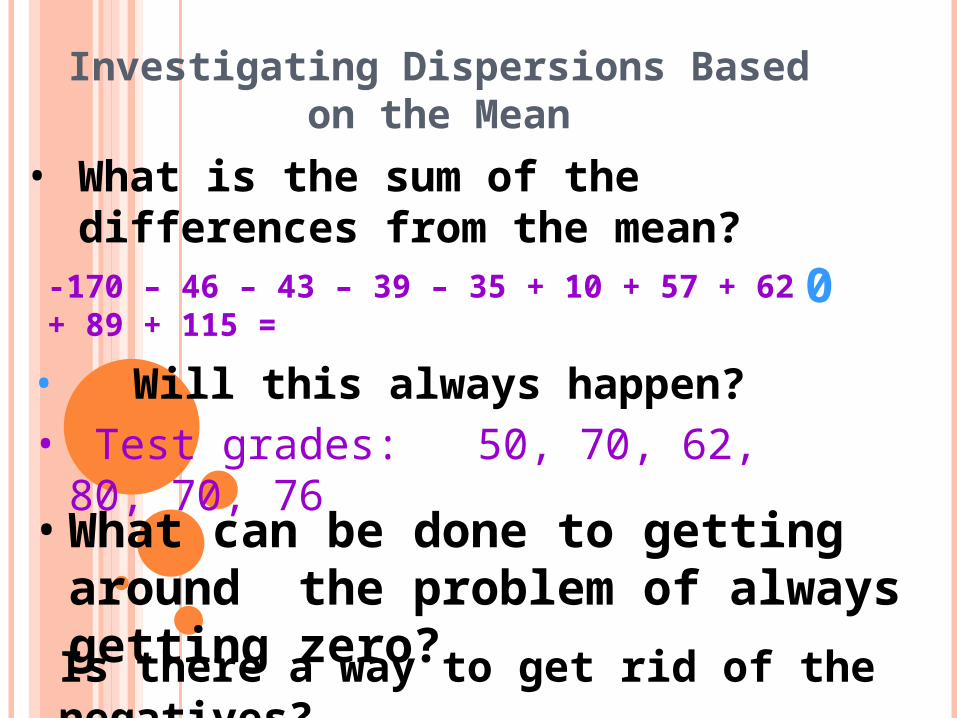
Investigating Dispersions Based on the Mean
• What is the sum of the differences from the mean?
-170 – 46 – 43 – 39 – 35 + 10 + 57 + 62 + 89 + 115 =0
• Will this always happen?
• What can be done to getting around the problem of always getting zero?
• Test grades: 50, 70, 62, 80, 70, 76
Is there a way to get rid of the negatives?
Investigating Dispersions Based on the Mean
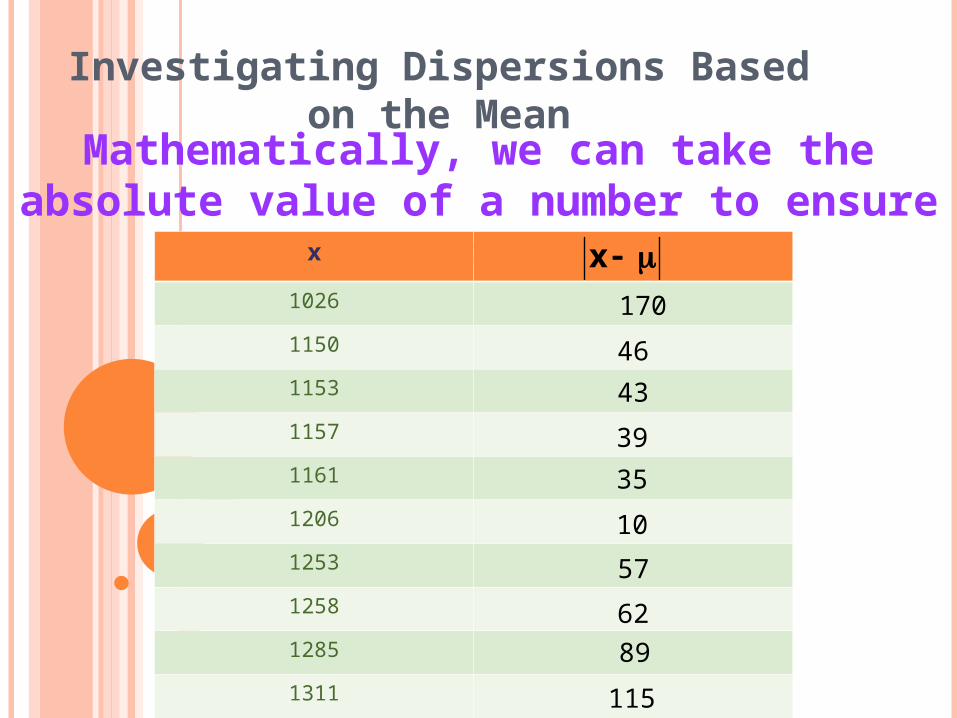
Mathematically, we can take the absolute value of a number to ensure that it is positive.
x
1026
1150
1153
1157
1161
1206
1253
1258
1285
1311
x
115
89
62
57
10
35
39
43
46
170
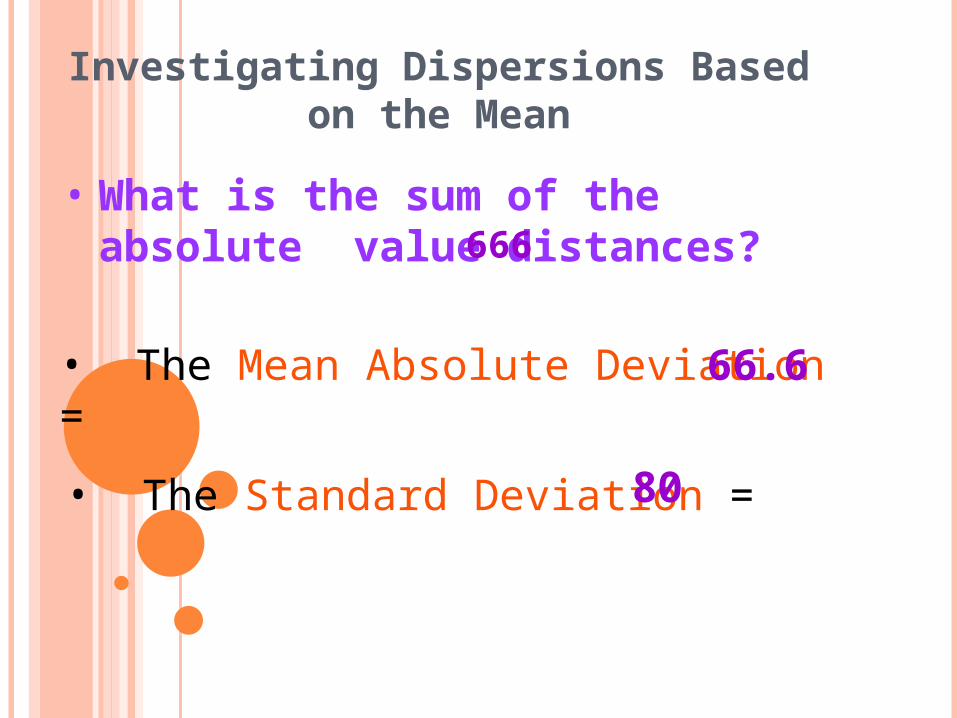
Investigating Dispersions Based on the Mean
• What is the sum of the absolute value distances? 666
• The Mean Absolute Deviation = 66.6
• The Standard Deviation = 80

The 68-95-99.7 Rule
SAT problem
956 1036 1116 1196 1276 1356 1436
How many SAT scores fall within one standard deviation from the mean?
What % of the data does this represent? 70%
7
Homework
How many texts do you send today?


Warm Up
1) 26 – 9p = -12) 6m – 3 = 10 - 6(2 – m)
-9p = -27
p = 3
6m – 3 = 10 – 12 + 6m
6m – 3 = -2 + 6m
-3 = -2
No solution3) S = 2πrh, solve for h
hr
S
2
4) Name the property(5 + x)6 = 6(5 + x)
Commutative
5) Name the property9 + 0 = 9 Identity

In a park that has several basketball courts a student samples the number of players playing basketball over a two week period and has the following data.
10 90 30 2050 30 60 4070 40 30 6080 20

What is the mean for the data?
10 90 30 2050 30 60 4070 40 30 6080 20
45

Distance from the mean
Mean = 45
2030
50
6070
8090
30
10
30
40 40
60
20

What if we find the average of the difference between each data value and the mean?
Mean = 45
2030
50
6070
8090
30
10
30
40 40
60
20
-35 -15
5
15 25
-15
3545
-25
-15-5 -5
15
-25
-35-15+5+15+25-15+35+45-25-15-5-5+15-25 = 0
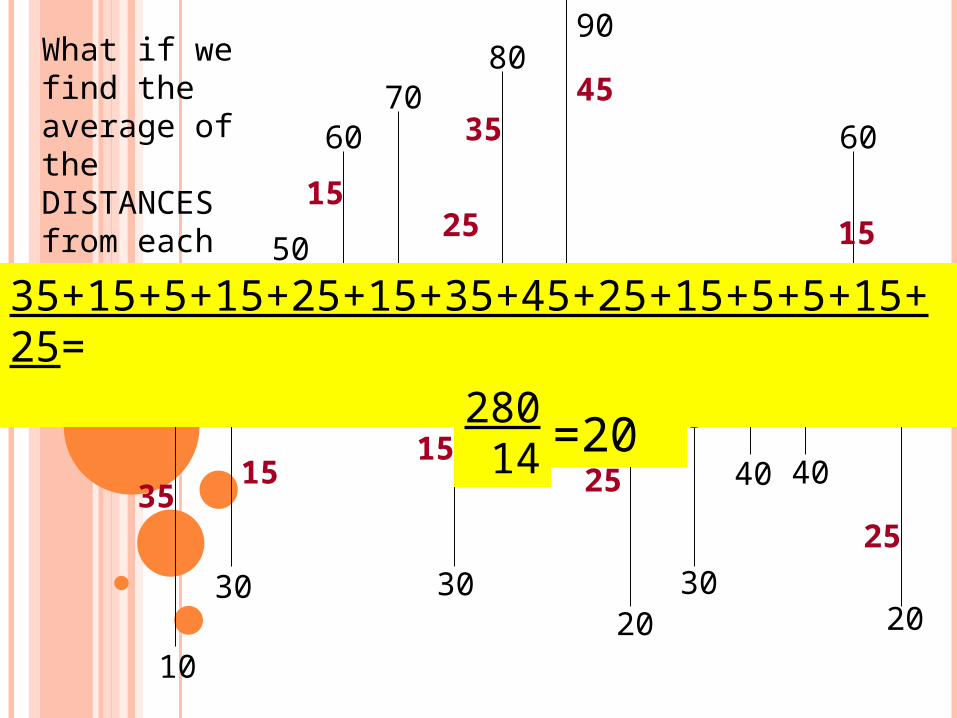
What if we find the average of the DISTANCES from each data value to the mean?
Mean = 45
2030
50
6070
8090
30
10
30
40 40
60
20
3515
5
15 25
3545
1525
15 5 5
15
25
35+15+5+15+25+15+35+45+25+15+5+5+15+25= 14
280 14 =20
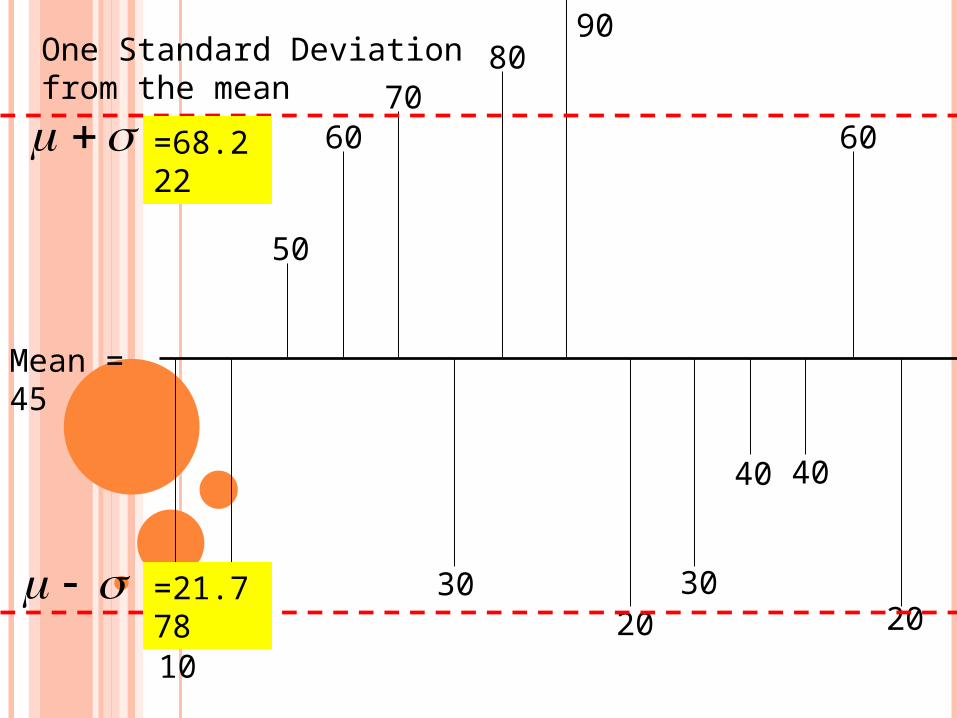
One Standard Deviation from the mean
Mean = 45
2030
50
6070
8090
30
10
30
40 40
60
20
=68.222
=21.778

Calculating Mean Absolute Deviation
How many texts did you send yesterday?
4
Calculate the mean absolute deviation for the data set.
Calculate the standard deviation for the data set.
Calculating Standard Deviation
How much time does it take for a dead cell phone battery to completely recharge?

Calculating Standard DeviationMr. Bolling’s homework assignment for his students was to determine how much time it takes for their dead cell phone battery to completely recharge. The results for the amount of time (to the nearest quarter hour) for 20 students are shown below.
3.75 3.25 4 4.5 4.75
3.75 4 3.5 4.25 5
4.25 4 3.75 4.5 2.5
4 4.5 3.5 4 4.25
Calculating Standard Deviation
What are the mean, mode, and median of the data?
mean: 4, mode: 4, median: 4

Calculating Standard DeviationCalculate 1-Var Stats
σx = 0.548
What does the standard deviation represent in this data?
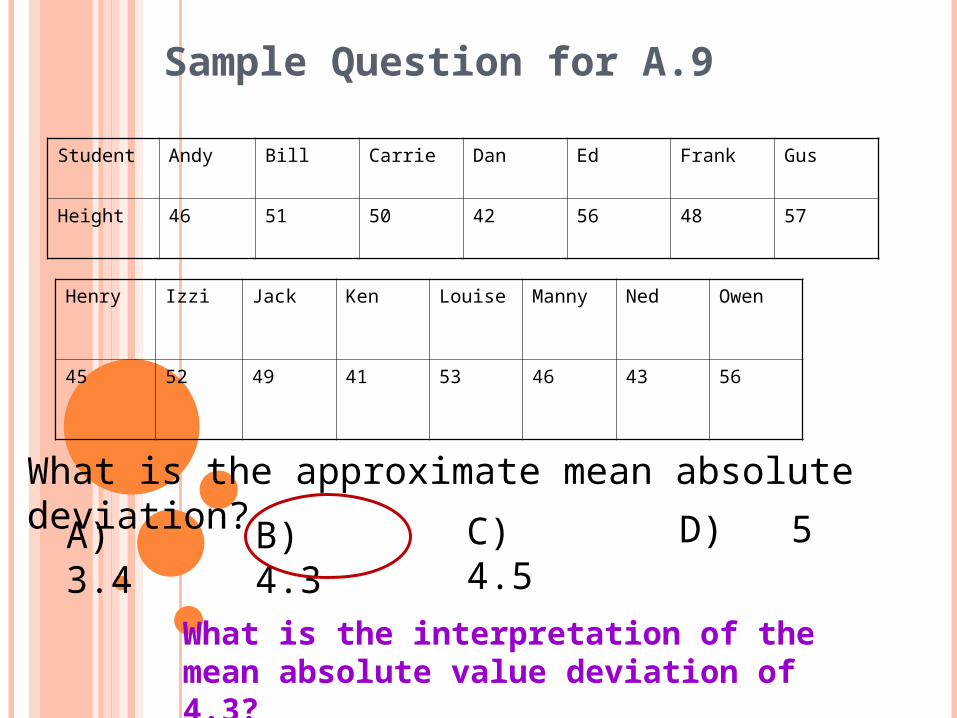
Sample Question for A.9
Student Andy Bill Carrie Dan Ed Frank Gus
Height 46 51 50 42 56 48 57
Henry Izzi Jack Ken Louise Manny Ned Owen
45 52 49 41 53 46 43 56
What is the approximate mean absolute deviation?
A) 3.4 B) 4.3 C) 4.5 D) 5
What is the interpretation of the mean absolute value deviation of 4.3?

Sample Question for A.9Student Andy Bill Carrie Dan Ed Frank Gus
Height 46 51 50 42 56 48 57
Henry Izzi Jack Ken Louise Manny Ned Owen
45 52 49 41 53 46 43 56
Use your calculator to find the mean and standard deviation of the data set to the nearest inch?
A) 49, 5 B) 50, 5.5 C) 49.5, 5.5 D) 50, 4.5

Warm Up
239
076
181
4
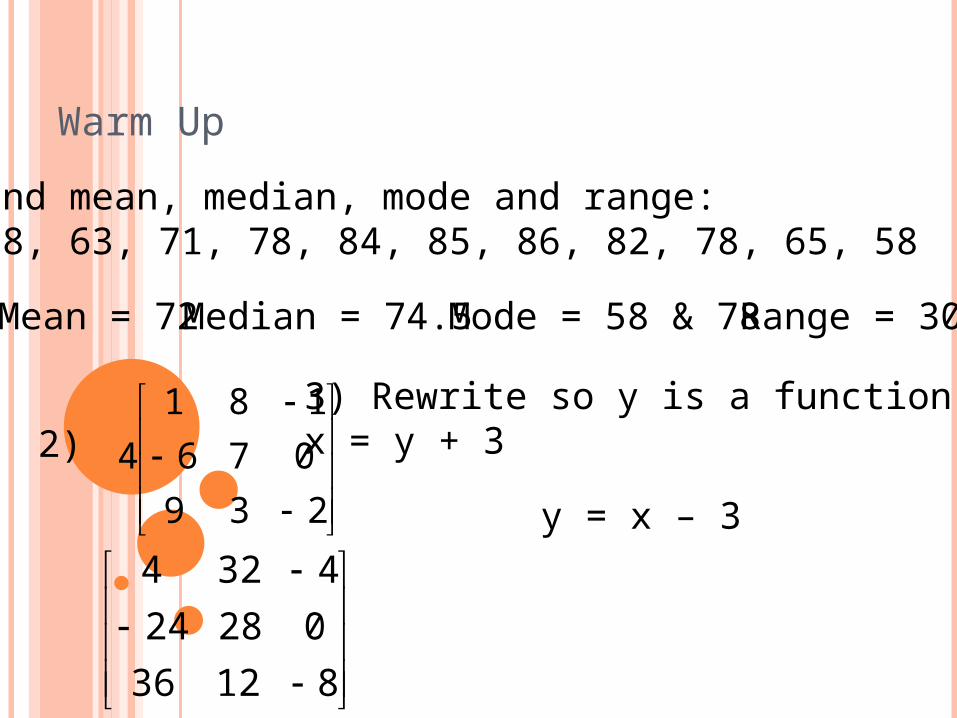
1) Find mean, median, mode and range:56, 58, 63, 71, 78, 84, 85, 86, 82, 78, 65, 58
Mean = 72 Median = 74.5 Mode = 58 & 78 Range = 30
2)
81236
02824
4324
3) Rewrite so y is a function of xx = y + 3
y = x – 3

Z-Scores for Algebra I
Descriptive Statistics

How Close is Close? Activity
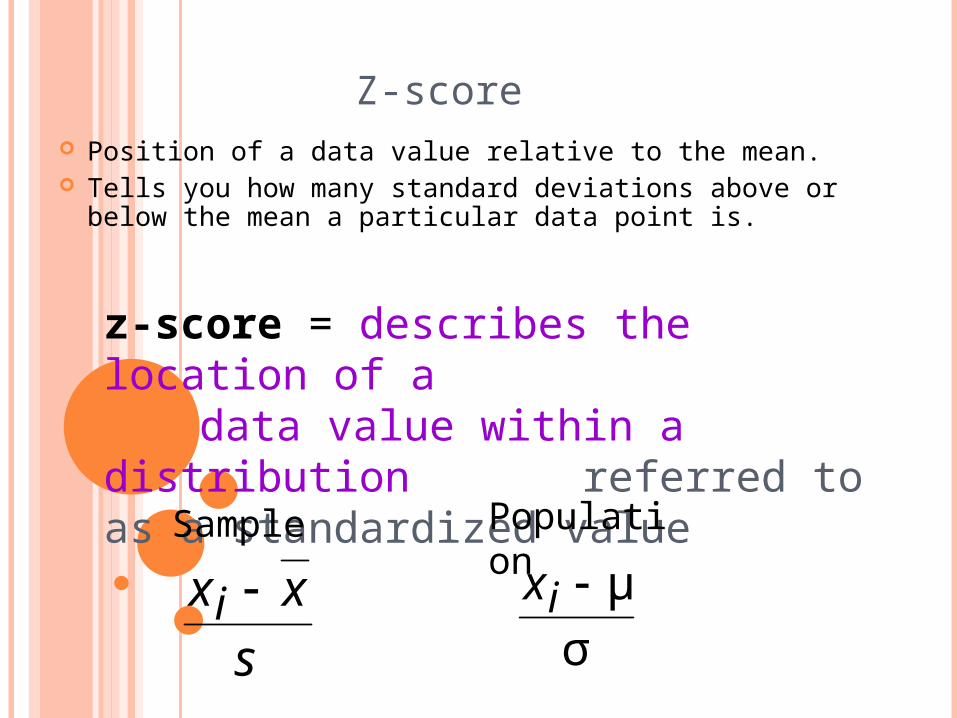
Z-score Position of a data value relative to the mean. Tells you how many standard deviations above or below the
mean a particular data point is.
ix x
s
z-score = describes the location of a data value within a distribution
referred to as a standardized value
μ
σ
ixSample Population

Z-score
In order to calculate a z-score you must know:
• a data value
• the mean
• the standard deviation
μ
σ
ix

Z-scores
What is the mean score?
What is the standard deviation?
Here are 23 test scores from Ms. Bienvenue’s stat class.
79 81 80 77 73 83 74 93 78 80 75 67 73
77 83 86 90 79 85 83 89 84 82
80.5
5.9

Z-scores
The bold score is Michele’s. How did she perform relative to her classmates?
Michele’s score is “above average”, but how much above average is it?
Here are 23 test scores from Ms. Bienvenue’s stat class.
79 81 80 77 73 83 74 93 78 80 75 67 73
77 83 86 90 79 85 83 89 84 82

Z-scores
If we convert Michele’s score to a standardized value, then we can determine how many standard
deviations her score is away from the mean.
What we need:
• Michele’s score
• mean of test scores
• standard deviation
86 80.3
6.1
z
86
80.5
5.9
= 0.93
Therefore, Michele’s standardized test score is 0.93. Nearly one standard deviation above the class mean.
μ
σ
ix

80.5
x x σ86.6
2x σ92.7
3x σ98.8
x σ74.4
2x σ68.3
3x σ
62.2
0 1 2 3-1-2-3
Michele’s Score = 86
Michele’s z-score = .93

Calculate a z-score
Consider this problem:
The mean salary for math teachers in Big State is $45,000 per year with a standard deviation of $5,000.
The mean salary of a Piggly-Wiggly bagger is $21,000 with a standard deviation of $2,000.

Calculate a z-score
Teacher : 63,000 Grocery Bagger: 30,000 or
Who has the better salary relative to the mean? A Big State teacher making 63,000 or a grocery bagger making 30,000?
63,000 45,0003.6
5000
30,000 21,0004.5
2000
What is the interpretation of the two z-scores?
Who has a better salary relative to the mean?


Warm Up
4510
308
145
372
515
676
1)
3) Name the propertyIf a = b and b =c, then a = c
Transitive Property
2) 5x – 2 = 8
5x = 10
x = 2
4) Rewrite so y is a function of x3(y – x) = 10 – 4x
3y – 3x = 10 – 4x
3y = 10 – x
3
10 xy
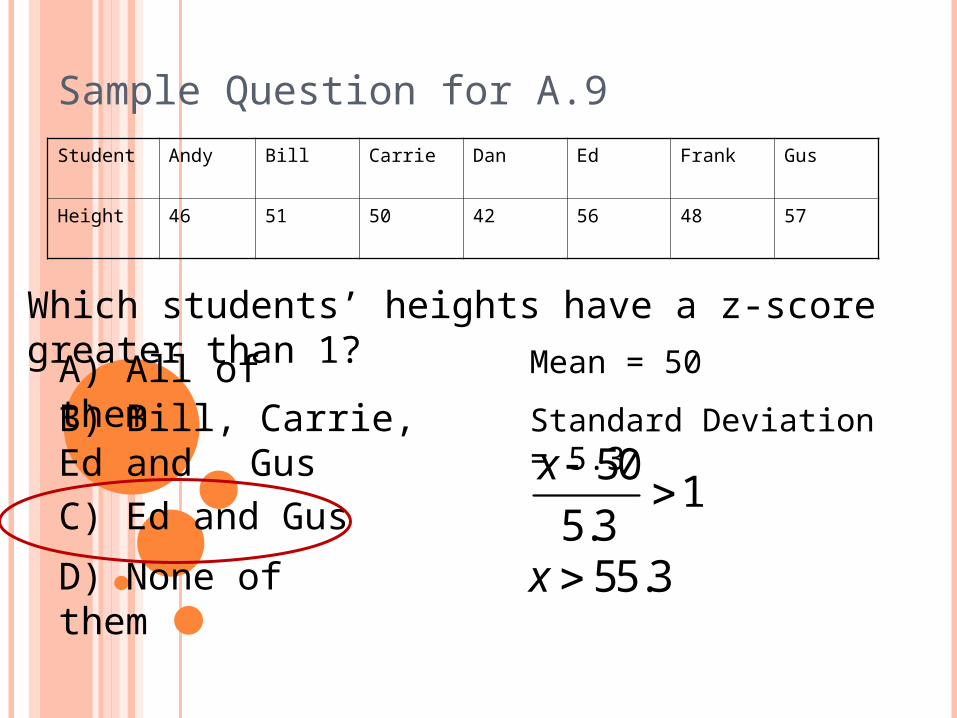
Sample Question for A.9Student Andy Bill Carrie Dan Ed Frank Gus
Height 46 51 50 42 56 48 57
Which students’ heights have a z-score greater than 1?
A) All of themB) Bill, Carrie, Ed and Gus
C) Ed and Gus
D) None of them
Mean = 50
Standard Deviation = 5.3
501
5.3
x
55.3x

Sample Question for A.9Student Andy Bill Carrie Dan Ed Frank Gus
Height 46 51 50 42 56 48 57
Which students have a z-score less than -2?
A) All of them
B) Dan and Andy
C) Only Dan
D) None of them
Mean = 50
Standard Deviation = 5.3
502
5.3
x
39.4x
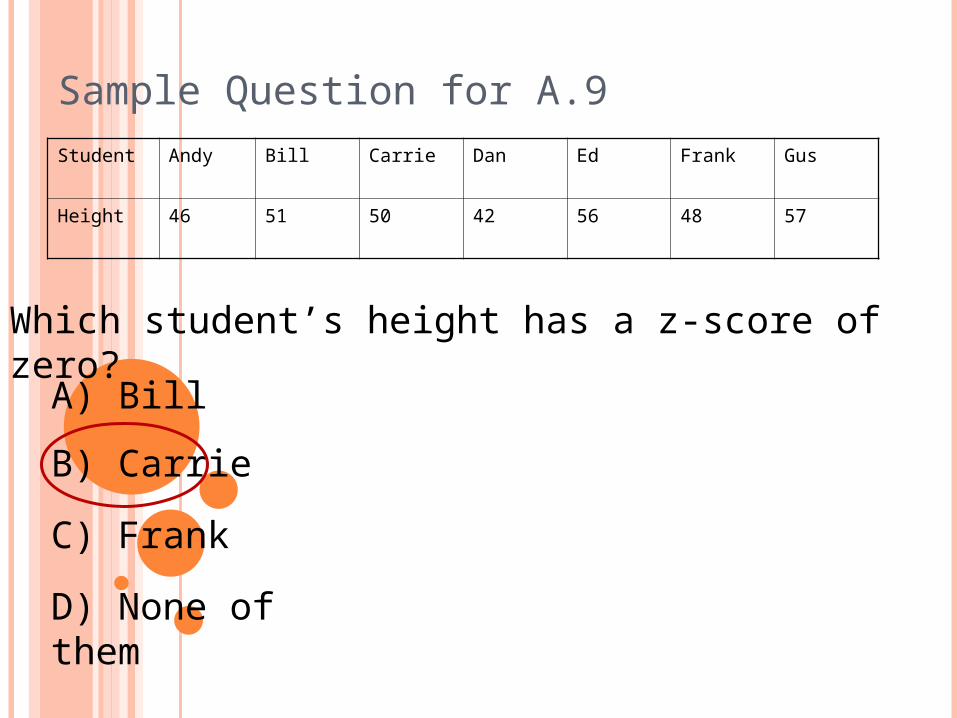
Sample Question for A.9Student Andy Bill Carrie Dan Ed Frank Gus
Height 46 51 50 42 56 48 57
Which student’s height has a z-score of zero?
A) Bill
B) Carrie
C) Frank
D) None of them
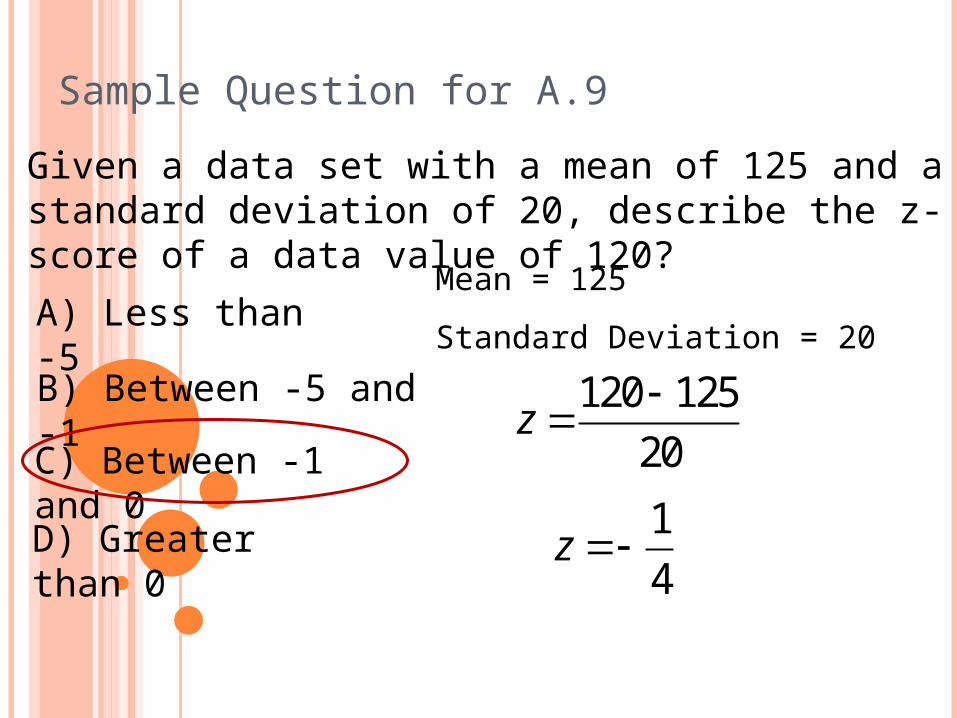
Sample Question for A.9
Given a data set with a mean of 125 and a standard deviation of 20, describe the z-score of a data value of 120?
A) Less than -5
B) Between -5 and -1
C) Between -1 and 0
D) Greater than 0
Mean = 125
Standard Deviation = 20
120 125
20
z
1
4z

Sample Question for A.9
Given a data set with a mean of 30 and a standard deviation of 2.5, find the data value associated with a z-score of 2?
A) 36
B) 35
C) 34.5
D) 32.5
Mean = 30
Standard Deviation = 2.5
302
2.5
x
35x
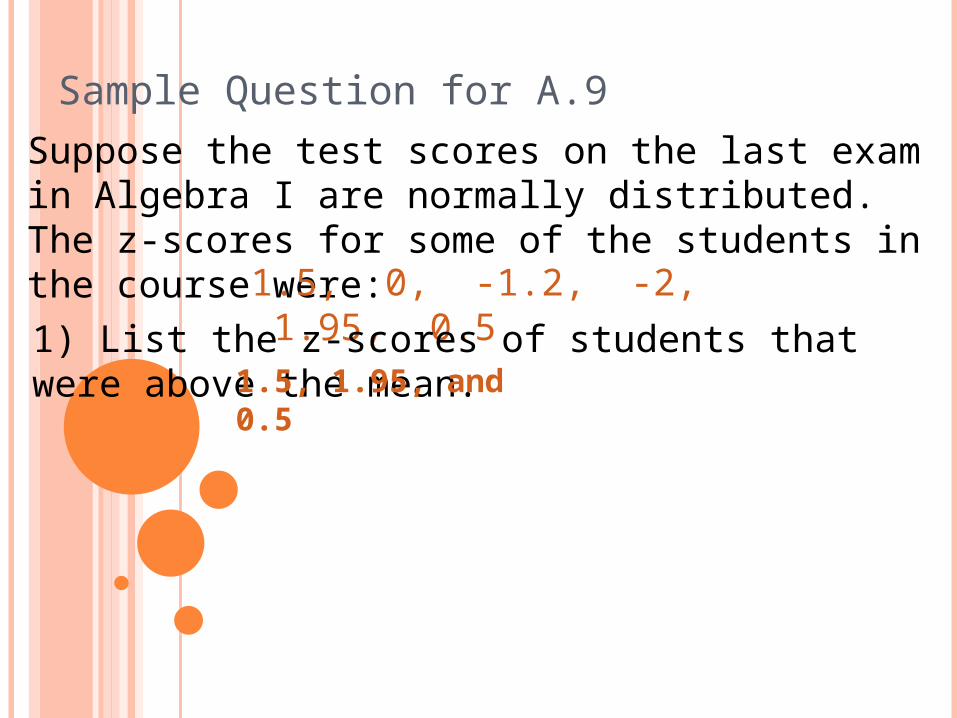
Sample Question for A.9
Suppose the test scores on the last exam in Algebra I are normally distributed. The z-scores for some of the students in the course were:
1.5, 0, -1.2, -2, 1.95, 0.5
1) List the z-scores of students that were above the mean. 1.5, 1.95, and 0.5

Sample Question for A.9
Suppose the test scores on the last exam in Algebra I are normally distributed. The z-scores for some of the students in the course were:
1.5, 0, -1.2, -2, 1.95, 0.5
2) If the mean of the exam is 80, did any of the students selected have an exam score of 80? Explain. One student with a z-score of 0.
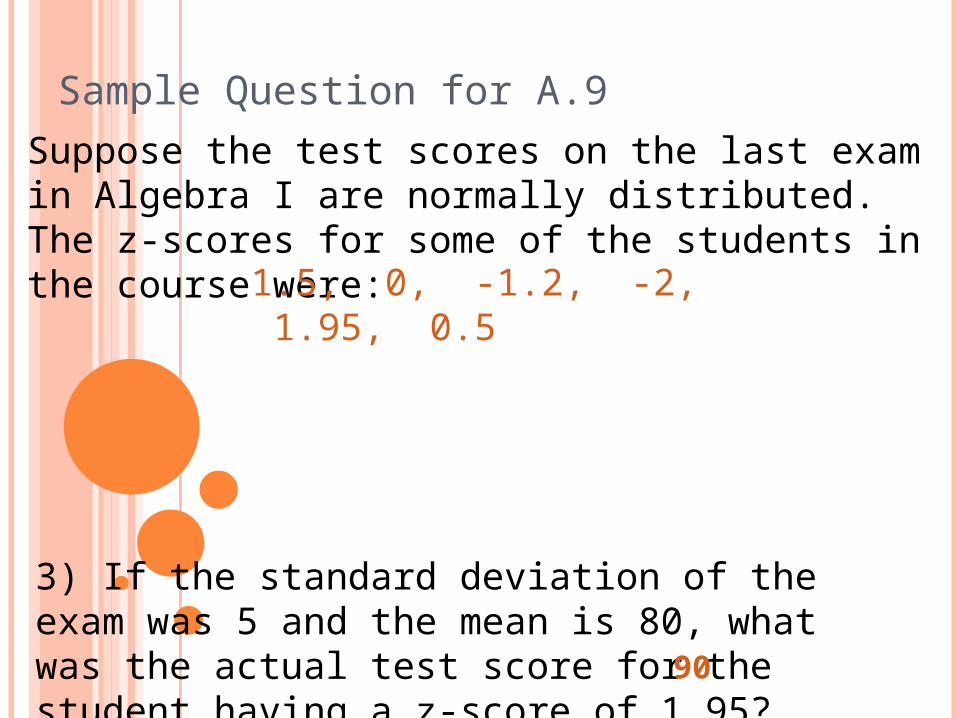
Sample Question for A.9
Suppose the test scores on the last exam in Algebra I are normally distributed. The z-scores for some of the students in the course were:
1.5, 0, -1.2, -2, 1.95, 0.5
3) If the standard deviation of the exam was 5 and the mean is 80, what was the actual test score for the student having a z-score of 1.95? 90

Quiz