warehousing supply and demand
TRANSCRIPT

Transportation leadership you can trust.
presented to
Southern California Association of Governments
presented byCambridge Systematics, Inc.John Husing (Economics & Politics)
October 13, 2009
Warehousing Supply and DemandTask 5 Progress Report and Next steps

1
Purpose of the Task
The goal of this task is to understand both the existing supply and demand for industrial/warehouse facility space and to forecast growth to determine whether land use allocated to warehousing needs will be sufficient in the Los Angeles basin. The focus of the analysis will be on international trade, where much of the growth in this sector is expected.

2
Overall Study Objectives
Match Future Supply with Future Demand- Determine Sufficiency of Land Use
- Develop Scenarios to Accommodate Deficiencies
Forecast Future Demand
Forecast Future Supply
DetermineCurrent Supply
Determine Current Demand
Match Future Supply with Future Demand- Determine Sufficiency of Land Use
- Develop Scenarios to Accommodate Deficiencies
Forecast Future Demand
Forecast Future Supply
DetermineCurrent Supply
Determine Current Demand

3
Deliverable Mapping
Match Future Supply with Future Demand- Determine Sufficiency of Land Use
- Develop Scenarios to Accommodate Deficiencies
Forecast Future Demand
Forecast Future Supply
DetermineCurrent Supply
Determine Current Demand
Match Future Supply with Future Demand- Determine Sufficiency of Land Use
- Develop Scenarios to Accommodate Deficiencies
Forecast Future Demand
Forecast Future Supply
DetermineCurrent Supply
Determine Current Demand
Deliverable #1 Deliverable #2
Deliverable #3

4
Status of the Work1) We have already completed a documentation of existing supply of warehouses in the LA basin as well as the supply of land suitable for future warehouse development. • COMPLETION DATE: August 31, 2009 (Existing supply of
warehouse facilities and undeveloped land.)
2) We have developed the survey methodology for a statistically valid sample of warehousing characteristics.• PROJECTED COMPLETION DATE: November 30, 2009
3) We will create a summary memo with reports and maps to match supply and demand. This will constitute the final deliverable for Task 5.• PROJECTED COMPLETION DATE: December 31, 2009

5
Deliverable 1: Data Sources
Longitude/Latitude
Valuation
Owner’s Address
Owner
0%100%0%99.4%0%99.3%Building Sq Ft.
91.8%100%80.2%90.0%93.5%98.6%Site Sq Ft.
Lot and Tract No.
City, Zip
Street Address
Use Code
Assessor Parcel Code
ImperialOrange*RiversideSan
BernardinoVenturaLos
Angeles
* Orange County provided all industrial buildings of 50,000 or more square feet, but did not specify whether they were manufacturing or warehousing facilities. It was assumed they were warehousing.

6
Deliverable 1 Findings: Total Occupied and Available Warehousing
Occupancy of Warehousing Facilities in the SCAG region (sq. ft.)
Occupied693,842,860
82.9%
Available142,771,748
17.1%

7
Deliverable 1 Findings: Total Occupied Warehousing Facilities

8
Deliverable 1 Findings: Total Available Warehousing Facilities

9
Deliverable 1 Findings: Existing Supply
Occupied Warehousing Facilities by County (Number)

10
Deliverable 1 Findings: Existing Supply
Occupied Warehousing Facilities by County (Sq. Ft.)

11
Deliverable 1 Findings: Existing Supply
Available Warehousing Facilities by County (Number)

12
Deliverable 1 Findings: Existing Supply
Available Warehousing Facilities by County (Sq. Ft.)
13
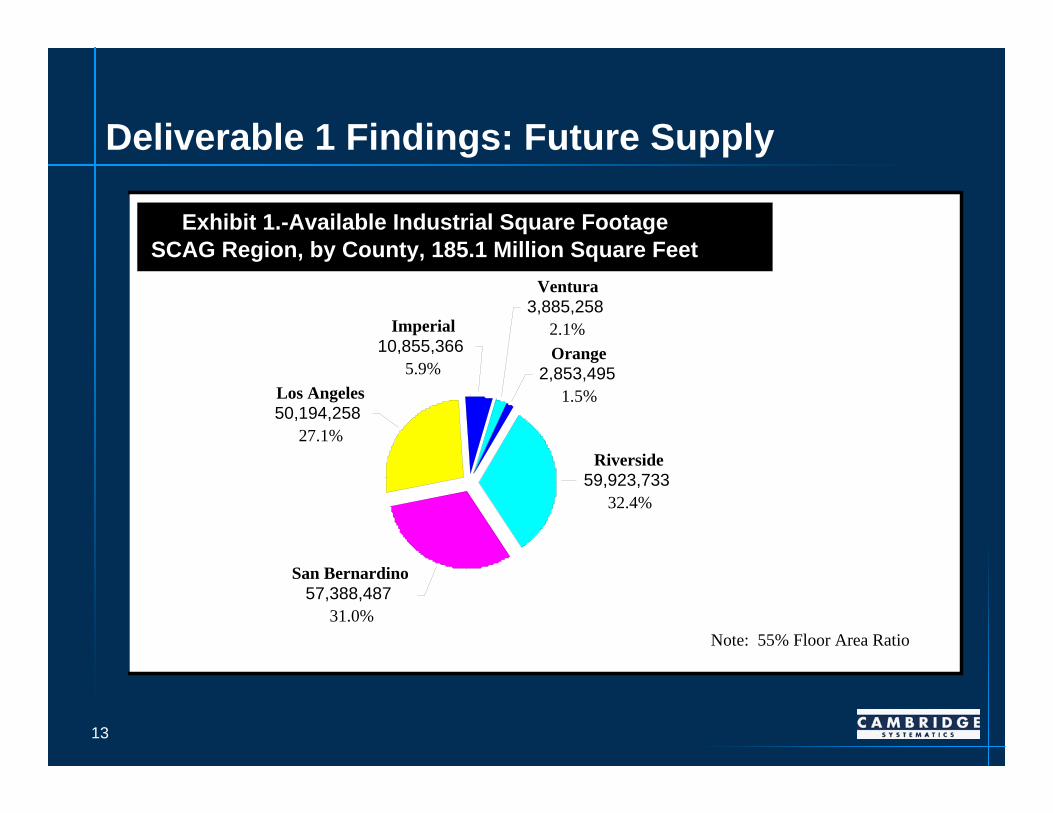
Deliverable 1 Findings: Future Supply
Riverside59,923,733
32.4%
San Bernardino57,388,487
31.0%
Los Angeles50,194,258
27.1%
Imperial10,855,366
5.9%
Ventura3,885,258
2.1%Orange
2,853,4951.5%
Note: 55% Floor Area Ratio
Exhibit 1.-Available Industrial Square FootageSCAG Region, by County, 185.1 Million Square Feet

14
Deliverable 1 Findings: Availability of Land Suitable for Warehousing Development

15
Deliverable 2 Next Steps: Existing Demand
A censusof warehousing operations for facilities with more than 200,000 sq. ft. is proposed. The results would provide a comprehensive understanding of warehousecharactersitics and operating practices.
The questions would be developed with a specialist in such work in conjunction with Cambridge Systematics and placed on-line. Lee & Associates would contact the appropriate executive to fill out the survey and request their cooperation. This process is helpful to Lee & Assoc. staff and they will do this for free. For facilities under 200,000 sq. ft., a random sample survey of owners and mangers is proposed.
16
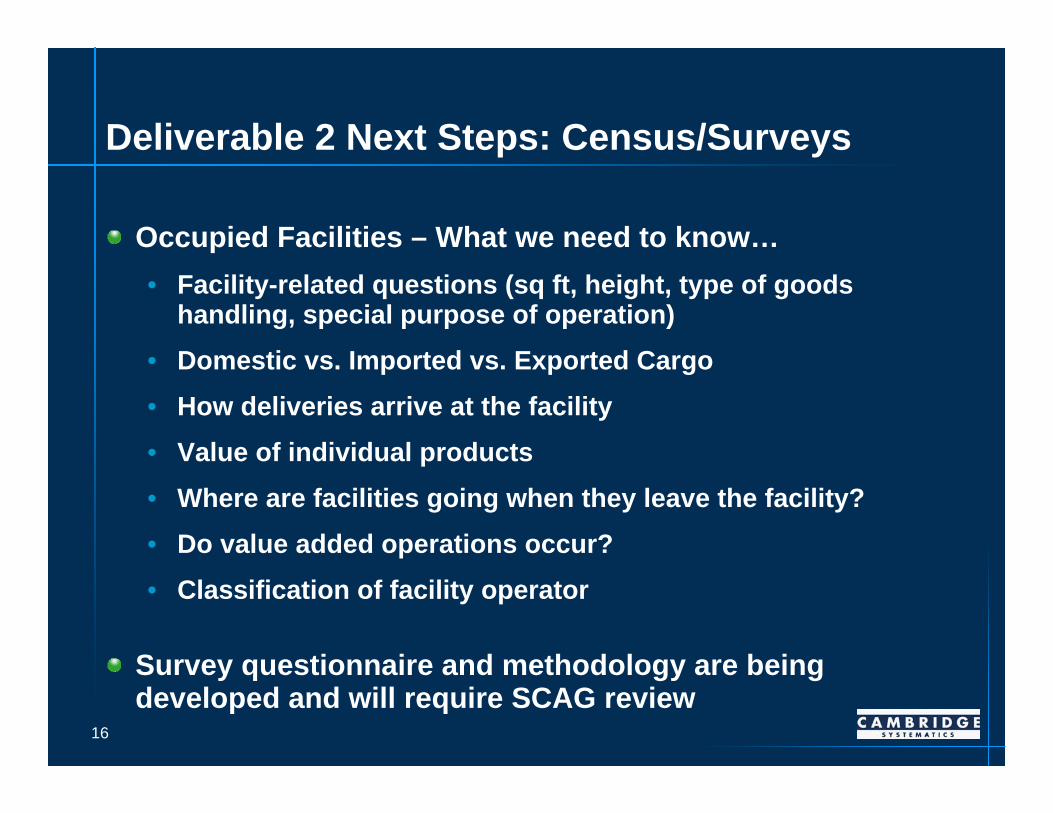
Deliverable 2 Next Steps: Census/Surveys
Occupied Facilities – What we need to know…• Facility-related questions (sq ft, height, type of goods
handling, special purpose of operation)• Domestic vs. Imported vs. Exported Cargo• How deliveries arrive at the facility• Value of individual products• Where are facilities going when they leave the facility?• Do value added operations occur?• Classification of facility operator
Survey questionnaire and methodology are being developed and will require SCAG review

17
Deliverable 2 Next Steps: Future Demand
Crosscheck will be conducted with census/survey data against the Avison Young methodology to determine future demand for warehousing space.
We will conduct this study with variables for warehouse demand by county, spatially.
The forecast of future demand will take into account trends in the logistics industry, technological developments and a propensity to shift logistics to out-of-state locations if it is beneficial for the industry.

18
Deliverable 3 Next Steps: Matching Supply and Demand
After completing Deliverables 1 and 2, we will identify each county where future supply is insufficient, as the excess demand for one or more of the following outcomes:
• Existing space will become more efficient.• Other land uses (e.g., failing retail malls, vacant land, underperforming
residential of commercial acreage, etc.) will be redeveloped as industrial space.
• Demand will divert to other counties with available land.
We will estimate the likelihood that the excess demand for each intermodal channel will be accommodated by each of these alternatives.
John Husing will apply concepts from “Dirt Theory” to explain how Southern California’s subregions grow and spread over time. This will suggest which subregions will develop their land first.