wang ssy 20150708_1730_upmc_jussieu_-_amphi_durand
TRANSCRIPT

MRICES-CIECIA:A new multi-
regional integrated assessment model
on climate change economics
Zheng Wang, Gaoxiang Gu, Jing Wu,Changxin Liu, Rui Huang
Institute of Policy and Management, CAS
East China Normal University

Some practical challenges encountered in IAM
In many existing IAM, the national economies are independent and thus cannot reflect the reality of the current economic integration. In particular, the emission reduction policies might arouse the global economic crisis.
Existing technical economic model of technological advancement are more inclined to consider energy technologies, without considering the changes brought about by the technological advances of the industrial structure, and this change is the basis of carbon emission intensity decreased
Therefore, the need to build a global economic interaction and evolution of the IAM contains industrial structure, which implies the need to consider the evolution of general equilibrium and economic dynamics

MRICES is a Prototyping of CIECIA
MRICES: Multi-factor Regional Integrated Climate change Economic assessment model System, it is a development of RICE
CIECIA: Capital, Industrial Evolution and Climate change Integrated Assessment model
CIECIA is dynamic general equilibrium system with Endogenous Technological Progress

MRICES-CIECIA Structure
A multi-national-sectoral dynamic general equilibrium model
Endogenous technological progress mode with knowledge capital accumulation and process technology evolution
international capital flows with different patterns
Global carbon cycle model with three-carbon pools
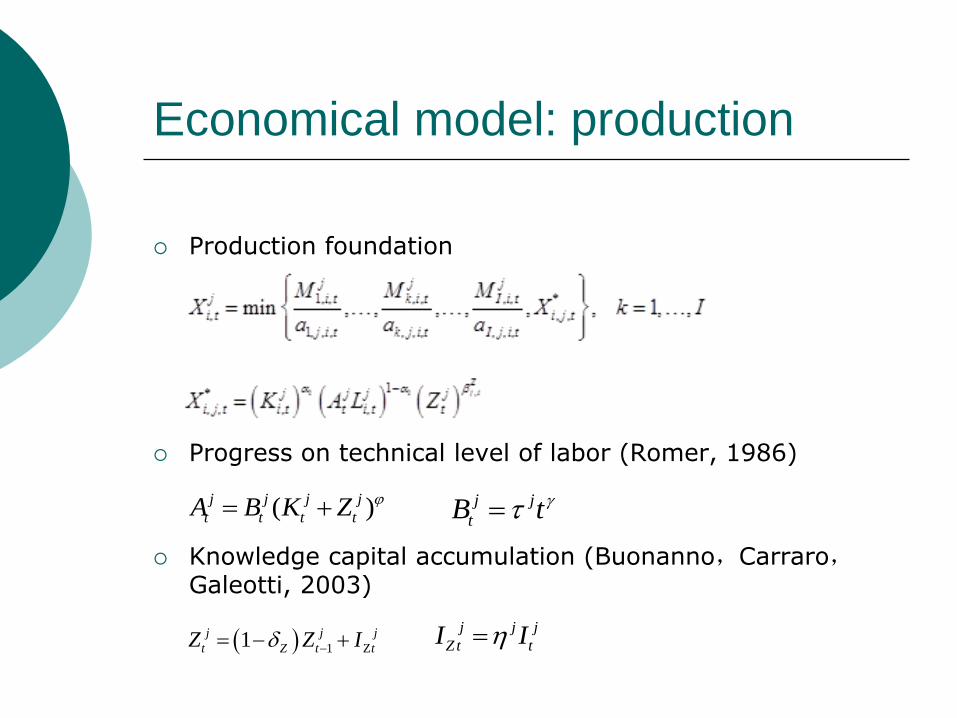
Economical model: production
Production foundation
Progress on technical level of labor (Romer, 1986)
Knowledge capital accumulation (Buonanno,Carraro,Galeotti, 2003)
( )j j j j
t t t tA B K Z j j
tB t
1 Z1j j j
t Z t tZ Z I j j j
Z t tI I

Economical model: evolution
' *
, , , , , , , 1 , , , ,ln( ) ln( )k j i t k j i t n j k i t na a
* * *
1, , , , , , , , , , , ,
' ' ' ' *
1, , , , , , , , , , , , , , , , , 1 ,1 1
* * *
1, , , , 1 , , , , 1 , , , , 1
, , , ,
, , , , if
, , , , Otherwise
j i t n k j i t n I j i t n
J J
j i t k j i t I j i t k j i t i t k j i t n i tk k
j i t n k j i t n I j i t n
a a a
a a a a p a p
a a a
, , , , (0; )j k i t n N ,
jj t
t j tj j
t t
Za b c
Z K
Technological progress is accomplished by the process of innovation, process innovation is an evolutionary selection process, and the process of innovation occurs stochastically (Lorentz, Savona, 2008). The variance of technological shock which follows normal distribution is controlled by knowledge capital

Economical model: international
capital flows
International capital flows balanced based on equilibrium of ROI (Jin, 2012)
international capital flows based Capital attractive (by Wang, Ge, 2007)
Mix Pattern
,,
, ,
,
exp ln 1
y jx x tx y j y y t
i j i t t t y y
x t t
X XTK K w L
K X
,
,
,,,,,
2
1( , , )
i j
x y y
x ti jx yx yi j
g
t
TKS
TKR i j t
I
, 1
1 , 1
, 1
(1 )
1( , , ) E E
(1 ) (1 )
1 1
j li t ji i
i tg
i tk l k l
sX
R i j t RX
s s s s
, 1 2( , , ) (1 ) ( , , )j
i tR R i j t R i j t

Carbon cycle system model
Single level carbon cycle system (Nordhaus,Yang,1996)
Three levels of carbon cycle (Svirezhev et al 1999)
Technical improvements carbon emissions
1t t t t t tQ V So O
1590 1 590c c
t t tQ
1
0
1 ln tt tT T
, , , , , ,
j e j
i t i j E j i t i tE a Y , , ,
j c j
t j e i t i te iQP E
J j
t t tjQ QP QL

Model: Climate System
Climate damage function Nordhaus Pattern
Weitzman Pattern
Carbon tax module
1,
, ,
0, 2
1
19
j
j tN
i j t
j
t
b
DT
1, ,
, , 2 6.754
1
120.46 6.081
j
j i tW
i j t
t t
b
T T
, , , , , ,
1
Ic tax in tax c tax out
i j t i j t i j t
i
I I
*
, , , , , , ,1 -c tax out j g j j c
i j t i j t t i i t j e i tI R I E

System structure

System Interface

Parameter correction
International capital flow patterns
Knowledge capital investment rate
Carbon cycle
=0.345
China UAA Japan EU India Russia CAE HDC MDC LDC
0.0141 0.0257 0.0332 0.0165 0.005 0.01 0.018 0.0014 0.0041 0.0016

Calibration (2007-2011)
GDP
Z-test:Z=0.4810
International capital flows
Z test:Z=0.081
Energy use
Z-test:Z=0.0062
Carbon Emission
Z-test:Z=0.0284
=0.9968
=0.9323
=0.9978
=0.9950

BAU: GDP growth of countries
0
10
20
30
40
50
60
70
2010 2020 2030 2040 2050 2060 2070 2080 2090 2100
Trill
ion
US
Do
llar
GDP CHN
USA
JPN
EU
IND
RUS
ODC
HDC
MDC
LDC

BAU: GDP per capita of countries
0
2
4
6
8
10
12
2010 2020 2030 2040 2050 2060 2070 2080 2090 2100
10
th
ou
san
d U
S D
olla
rs
GDP per capita
WorldCHNUSAJPNEUINDRUSODCHDCMDCLDC

BAU: Changes of industrial structure
0%
10%
20%
30%
40%
50%
60%
70%
80%
90%
100%
2010 2020 2030 2040 2050 2060 2070 2080 2090 2100
China
OthServ
Ins&Fin
Trans&Comm
Trd&Busi
Const
HvyMnfc
ChemInd
LghtMnfc
Mtl&Mn
Enrg
FdPro
Agri
0%
10%
20%
30%
40%
50%
60%
70%
80%
90%
100%
2010 2020 2030 2040 2050 2060 2070 2080 2090 2100
USA
OthServ
Ins&Fin
Trans&Comm
Trd&Busi
Const
HvyMnfc
ChemInd
LghtMnfc
Mtl&Mn
Enrg
FdPro
Agri
0%
10%
20%
30%
40%
50%
60%
70%
80%
90%
100%
2010 2020 2030 2040 2050 2060 2070 2080 2090 2100
EU
OthServ
Ins&Fin
Trans&Comm
Trd&Busi
Const
HvyMnfc
ChemInd
LghtMnfc
Mtl&Mn
Enrg
FdPro
Agri
0%
10%
20%
30%
40%
50%
60%
70%
80%
90%
100%
2010 2020 2030 2040 2050 2060 2070 2080 2090 2100
Japan
OthServ
Ins&Fin
Trans&Comm
Trd&Busi
Const
HvyMnfc
ChemInd
LghtMnfc
Mtl&Mn
Enrg
FdPro
Agri
0%
10%
20%
30%
40%
50%
60%
70%
80%
90%
100%
2010 2020 2030 2040 2050 2060 2070 2080 2090 2100
Russia
OthServ
Ins&Fin
Trans&Comm
Trd&Busi
Const
HvyMnfc
ChemInd
LghtMnfc
Mtl&Mn
Enrg
FdPro
Agri
0%
10%
20%
30%
40%
50%
60%
70%
80%
90%
100%
2010 2020 2030 2040 2050 2060 2070 2080 2090 2100
India
OthServ
Ins&Fin
Trans&Comm
Trd&Busi
Const
HvyMnfc
ChemInd
LghtMnfc
Mtl&Mn
Enrg
FdPro
Agri

BAU:Carbon Emissions and temperature rising
0
500
1000
1500
2000
2500
3000
3500
4000
4500
2010 2020 2030 2040 2050 2060 2070 2080 2090 2100
MtC
Carbon Emissions
CHN USA JPN EU IND RUS ODC HDC MDC LDC0
100
200
300
400
500
600
700
800
0
0,5
1
1,5
2
2,5
3
3,5
2010 2020 2030 2040 2050 2060 2070 2080 2090 2100
pp
m
℃
Temperature rising and concentration of carbon dioxide in the atmosphere
temperature rising concentration of carbon dioxide in the atmosphere

Scenario analysis :Knowledge
Capital Investment Policy
Policy Scenario 1:
Policy Scenario 2:
Policy Scenario 3:
CHN USA JPN EU IND RUS ODC HDC MDC LDC
0.025 0.0257 0.03 0.0165 0.01 0.015 0.018 0.01 0.01 0.01
CHN USA JPN EU IND RUS ODC HDC MDC LDC
0.03 0.035 0.035 0.025 0.02 0.025 0.025 0.02 0.02 0.02
CHN USA JPN EU IND RUS ODC HDC MDC LDC
0.04 0.04 0.04 0.04 0.035 0.04 0.04 0.035 0.035 0.035

Knowledge capital investment policy:
temperature rises more than 2℃
0
0,5
1
1,5
2
2,5
3
3,5
2010 2020 2030 2040 2050 2060 2070 2080 2090 2100
MtC
Temperature rising in Scenarios
Scenario 1 Scenario 2 Scenario 3

Knowledge capital investment policy -
cumulative utility change
-2
0
2
4
6
8
10
CHN USA JPN EU IND RUS ODC HDC MDC LDC
%
Changing rates of cumulative utilities in Scenario 1
2007-2025 2007-2050 2007-2075 2007-2100
2007-2025 Global 2007-2050 Global 2007-2075 Global 2007-2100 Global
-2
0
2
4
6
8
10
12
14
CHN USA JPN EU IND RUS ODC HDC MDC LDC
%
Changing rates of cumulative utilities in Scenario 2
2007-2025 2007-2050 2007-2075 2007-2100
2007-2025 Global 2007-2050 Global 2007-2075 Global 2007-2100 Global
0
2
4
6
8
10
12
14
16
18
CHN USA JPN EU IND RUS ODC HDC MDC LDC
%
Changing rates of cumulative utilities in Scenario 3
2007-2025 2007-2050 2007-2075 2007-2100
2007-2025 Global 2007-2050 Global 2007-2075 Global 2007-2100 Global

Knowledge capital investment
policy:carbon emissions changes
0
500
1000
1500
2000
2500
3000
3500
4000
2010 2020 2030 2040 2050 2060 2070 2080 2090 2100
MtC
Carbon emissions in Scenario 1
CHN USA JPN EU IND RUS ODC HDC MDC LDC
0
500
1000
1500
2000
2500
3000
3500
4000
2010 2020 2030 2040 2050 2060 2070 2080 2090 2100
MtC
Carbon emissions in Scenario 2
CHN USA JPN EU IND RUS ODC HDC MDC LDC
0
500
1000
1500
2000
2500
3000
3500
2010 2020 2030 2040 2050 2060 2070 2080 2090 2100
MtC
Carbon emissions in Scenario 3
CHN USA JPN EU IND RUS ODC HDC MDC LDC

Global abatement schemes
Stern program, Nordhaus program, UNDP program, equal per capita emissions program (He programs), cumulative emissions per capita equal program (Ding program)
Wang program-Steady economic growth program, developed by 2050 emission reduction targets consistent with the Stern program, and maintaining the 2050 level of emissions after 2050; Russia in 2050 to 60% reduction;China's carbon emissions by 2050 decrease of 15% compared to 2010, to 2100 to reduce carbon emissions by 12% compared to 2050; India and developing countries to maintain the level of emissions in 2010; less developed countries do not participate in the simulation process emissions.
Effective Pareto improvement program: the economies of the cumulative effect to 2100 were greater than the reference scenario, and to meet the 2100 target of temperature control and CO2 concentration control objectives

Assessments of global cooperating
abatement schemes
0
50
100
150
200
250
300
350
400
450
500
0
0,5
1
1,5
2
2,5
pp
mv
℃
Temperature rising and Atmospheric concentration equivalent of CO2
Temperature rising Atmospheric concentration equivalent of CO2

Assessment of global abatement schemes –
the changing rates of cumulative utilities
-2
-1
0
1
2
3
4
CHN USA JPN EU IND RUS ODC HDC MDC LDC
(%)
Stern Scheme 2007-20252007-20502007-20752007-21002007-2025 Global2007-2050 Global2007-2075 Global2007-2100 Global
-2
-1
0
1
2
3
CHN USA JPN EU IND RUS ODC HDC MDC LDC
(%)
Nordhaus Scheme 2007-20252007-20502007-20752007-21002007-2025 Global2007-2050 Global2007-2075 Global
-2
-1
0
1
2
3
CHN USA JPN EU IND RUS ODC HDC MDC LDC
(%)
UNDP Scheme 2007-20252007-20502007-20752007-21002007-2025 Global2007-2050 Global2007-2075 Global
-2
-1
0
1
2
3
4
CHN USA JPN EU IND RUS ODC HDC MDC LDC
(%)
Convergence on carbon emissions per capita Scheme
2007-20252007-20502007-20752007-21002007-2025 Global2007-2050 Global2007-2075 Global
-3
-2
-1
0
1
2
3
4
5
CHN USA JPN EU IND RUS ODC HDC MDC LDC
(%)
Convergence on accumulated carbon emissions per capita Scheme (2007-2100)
2007-20252007-20502007-20752007-21002007-2025 Global2007-2050 Global2007-2075 Global
-3
-2
-1
0
1
2
3
4
5
CHN USA JPN EU IND RUS ODC HDC MDC LDC
(%)
Convergence on accumulated carbon emissions per capita Scheme (2000-2100)
2007-20252007-20502007-20752007-21002007-2025 Global2007-2050 Global2007-2075 Global
-3
-2
-1
0
1
2
3
4
5
CHN USA JPN EU IND RUS ODC HDC MDC LDC
(%)
Convergence on accumulated carbon emissions per capita Scheme (1990-2100)
2007-20252007-20502007-20752007-21002007-2025 Global2007-2050 Global2007-2075 Global
-1,5
-1
-0,5
0
0,5
1
1,5
2
2,5
3
3,5
CHN USA JPN EU IND RUS ODC HDC MDC LDC
(%)
Global economic growth Scheme
2007-20252007-20502007-20752007-21002007-2025 Global2007-2050 Global2007-2075 Global
-2
-1
0
1
2
3
4
CHN USA JPN EU IND RUS ODC HDC MDC LDC
(%)
Pareto Improvement Scheme
2007-20252007-20502007-20752007-21002007-2025 Global2007-2050 Global2007-2075 Global2007-2100 Global

Abatement targets in Pareto improvement Scheme
By 2050 By 2100 Carbon permits 2007~2050 (GtC)
Carbon permits 2007~2100 (GtC)
China 25% reduction based on 2005 level 40% reduction based on 2050 level 84.46 128.93
USA 75% reduction based on 1990 level 40% reduction based on 2050 level 45.92 59.60
Japan 90% reduction based on 1990 level 40% reduction based on 2050 level 8.05 9.04
EU 95% reduction based on 1990 level 40% reduction based on 2050 level 28.96 31.11
India Reduce to 2005 level 20% reduction based on 2050 level 19.15 33.61
Russia 50% reduction based on 1990 level 40% reduction based on 2050 level 17.71 28.65
Other developed countries 98% reduction based on 1990 level 70% reduction based on 2050 level 15.90 16.13
High developing countries 20% reduction based on 2005 level 20% reduction based on 2050 level 49.08 87.72
Middle developing countries 10% reduction based on 2005 level 20% reduction based on 2050 level 26.00 46.09
Low developing countries Start reduction from 2045; maintain 2045’s emission level between 2046 and 2050
maintain 2050’s emission level 14.30 69.23

Conclusion
In the baseline scenario, China, India and other developing countries in the future will maintain high economic growth rates. However, their per capita GDPs are still low; global carbon emissions will keep increasing trend, leading to 3.13 ℃ temperature rising till 2100, higher than 2 ℃ control target.
After 2050, along with the rapid growth of developing countries, the GDP shares of the secondary industrial sectors in developed countries increase slightly, facing a phenomenon of re-industrialization。
Conclusion
Improving knowledge capital investment rate will effectively reduce the carbon intensities of countries. However, relying on knowledge capital investment policy as the only measure cannot achieve global climate protection.
The global abatement schemes assessed in this study are all effective. Among them, the Pareto Improvement Scheme guarantees the benefits of cumulative utilities of all countries, and thus is most feasible.

THANKS 谢谢