wandsnider and camilli 1992
TRANSCRIPT
Board of Trustees, Boston University
The Character of Surface Archaeological Deposits and Its Influence on Survey AccuracyAuthor(s): LuAnn Wandsnider and Eileen L. CamilliSource: Journal of Field Archaeology, Vol. 19, No. 2 (Summer, 1992), pp. 169-188Published by: Boston UniversityStable URL: http://www.jstor.org/stable/529977 .Accessed: 29/08/2011 15:28
Your use of the JSTOR archive indicates your acceptance of the Terms & Conditions of Use, available at .http://www.jstor.org/page/info/about/policies/terms.jsp
JSTOR is a not-for-profit service that helps scholars, researchers, and students discover, use, and build upon a wide range ofcontent in a trusted digital archive. We use information technology and tools to increase productivity and facilitate new formsof scholarship. For more information about JSTOR, please contact [email protected].
Boston University and Board of Trustees, Boston University are collaborating with JSTOR to digitize, preserveand extend access to Journal of Field Archaeology.
http://www.jstor.org
169
The Character of Surface Archaeological Deposits and Its Influence on Survey Accuracy
LuAnn Wandsnider University of Nebraska-Lincoln Lincoln, Nebraska
Eileen L. Camilli University of New Mexico
Albuquerque, New Mexico
Survey is one of the primary methods of data collection in archaeology today. Survey data often constitute the sole conserved record of the prehistoric use of an area and are used as the foundation for culture historical, demographic, and economic reconstructions. Given the fundamental nature of survey data in relation to other archaeological pursuits, identifica- tion of biases inherent in this type of data are important and have been the subject of a number of stimulating studies. Analyses reported here focus on the accuracy of results pro- duced through intensive survey. Using data from several siteless surveys in the American West, the effects of artifact obtrusiveness, especially size, and artifact density on the survey accuracy are investigated. Implications for interpreting a biased archaeological document are addressed.
Introduction
Archaeological survey, the discovery and documentation of prehistoric and historical cultural remains on modern surfaces, is responsible for a growing portion of the in- formation we have about the prehistoric use of various areas (Ammerman 1981; Dunnell and Dancey 1983; Le- warch and O'Brien 1981). In the United States, this ex-
pansion has been prompted in part by legal mandates
requiring regional inventories of historical and prehistoric resources (Judge 1981; Raab 1979). Simultaneously, data obtained through archaeological survey have come to be viewed as of equal or even greater utility to those obtained
through excavation since (1) they are logistically and eco-
nomically easier to obtain (Cherry 1983; Dunnell and Dancey 1983); (2) they afford a regional perspective on prehistoric activities (Cherry 1983, 1984; Dunnell and Dancey 1983); and (3) archaeological deposits are not necessarily destroyed by the documentation process and results, theoretically, can be replicated (Cherry 1983).
Problems with surface archaeological deposits, and hence with the use of archaeological survey data, however, are not insignificant (Lewarch and O'Brien 1981), al- though most have been dismissed. For example, the con- tention that surface remains have less integrity than buried
remains (e.g., Hope-Simpson 1983, 1984) appears trivial when recognizing that buried deposits were at one time on the surface and subject to the same disturbances im-
pacting modern surfaces (Cherry 1984; Dunnell and Dan-
cey 1983). Other recognized problems concern the quality of the
survey results and quality control in archaeological survey (Cowgill 1986, 1989; Powell, Leat, and Thomas in press). As archaeological survey contributes increasingly to the overall knowledge of prehistoric occupancy of an area, so too has concern increased about what survey results ac-
tually represent. This concern is evident in the pioneering work of Plog, Plog, and Wait (1978) and Schiffer, Sulli- van, and Klinger (1978). These studies examined the fac- tors influencing the accuracy and consistency of survey results. Related studies have demonstrated the effects of different sampling procedures (e.g., Judge 1981; contri- butions to Mueller 1975; Plog 1976) and survey intensity (e.g., Cowgill 1990; Plog, Plog, and Wait 1978; Schiffer and Wells 1982) on survey results. O'Brien and colleagues (1982) have reported on the effects of both differential
visibility owing to vegetation and potential fluctuation in crew member interest on the results of their Oaxaca survey. Foley (1981a, 1981b, 1981c), in his survey of the Am-
170 Surface Deposits and Survey/Wandsnider and Camilli
boseli (Kenya), and Gallant (1986), in his survey of two Greek islands, addressed bias in their survey results intro- duced by varying amounts of groundcover.
This study focuses on the characteristics of surface ar-
chaeological deposits and how the completeness and con-
sistency of survey results are influenced by these charac- teristics. The data employed in this analysis were obtained
during three intensive, siteless surveys and utilize both
experimental "seeding" data and assemblage data. We first
explore the effect of two characteristics of archaeological deposits, artifact obtrusiveness and density, on survey re- sults. We then consider the implications of these effects for traditional site survey and more recent siteless survey efforts. By way of introduction, clarification of several terms is offered.
Measuring the Archaeological Record The archaeological document with which archaeologists
return from the field is a product of several factors, only one of which is the archaeological deposit itself. Here, we
distinguish between the surface archaeological record, i.e., the empirical reality of the surface archaeological deposits (similar to Cowgill's [1970] potential finds population), and the surface archaeological document, similar to
Cowgill's physical finds population. Following Cherry (1983, 1984), Dunnell and Dancey (1983), and Lewarch and O'Brien (1981), the surface archaeological record is assumed to be as suitable an object of study as is the total
archaeological record, with both surface and subsurface
components. Further, both the archaeological document and record are considered contemporary phenomena that
differentially reflect past systemic behavior. The agreement between the archaeological document
and the archaeological record varies as a function of factors such as artifact obtrusiveness, density, and clusteredness, and others mentioned above. This relationship between record and document is described by terms such as accu-
racy, precision, reliability, and validity. Rarely are survey procedures evaluated with respect to these qualities; in- stead, archaeological survey is almost always assumed to
produce accurate, precise, reliable, and valid results (but see Plog 1986; Powell, Leat, and Thomas in press).
Such assessments, however, have been made by archae-
ologists (e.g., Beck and Jones 1989; Bowers, Bonnichsen, and Hoch 1983; Nance 1981, 1988; Read 1986) in dis-
cussing both direct measurement of the archaeological record and indirect measurement of past behavior. Here, we use Nance's (1988: 248-249) distinction to discrimi- nate between making measurements on the content and
configuration of an archaeological record and making
measurements on aspects of the past, e.g., occupation span or curation behavior. The first involves direct measure- ments made on objects, while the second involves indirect
measurement, since the past cannot be directly experi- enced. In this paper, we are most concerned with the
accuracy of direct measurements made on the archaeolog- ical record, since indirect measures of curation or occu-
pation span, for example, are contingent on the quality of these observations. Much of the following discussion can be construed in terms of the discovery of archaeological sites. We will concentrate, however, on the discovery of artifacts since it is artifacts and features that are actually observed by the archaeologist, while sites are entities that must be analytically defined and may be so defined in a
variety of ways. Validity has to do with the quality of indirect measure-
ment, i.e., the extent to which they actually measure the
target phenomena. For example, psychologists (cf. Car- mines and Zeller 1979; Zeller and Carmines 1980) mea-
suring personality traits and cultural anthropologists (Ber- nard 1988: 48-61) interested in monitoring quality of
life, are highly concerned with the validity of the ques- tionnaires they use to measure these complex qualities. Likewise, Nance (1988: 281-282) discusses the validity of faunal element frequencies as a measure of qualities of
prehistoric diet. Since we are interested in the represen- tativeness of observations made on the archaeological rec- ord itself, rather than the past, the question of measure- ment validity is not raised in the discussion that follows.
Other terms in measurement parlance, however, are
quite pertinent. Precision, reliability, and accuracy are at- tributes both of measuring instruments and direct mea- surements made with those instruments. In this case, they refer to survey procedures and results. Precision and reli-
ability are often used interchangeably. Here, we follow Bernard (1988: 49) in usage of these terms. Precision refers to the resolving power of the measurement instrument. Traditional moderate-intensity site survey, for example, faithfully measures the numbers and locations of archae-
ological manifestations with standing architecture. It is less faithful with respect to documenting small artifact
scatters and reproduces even less faithfully the locations of individual artifacts. Thus, the level of precision of mod-
erate-intensity survey is at the resolution of archaeological sites with standing architecture (Cowgill 1990).
Reliability refers to the agreement between, or among, two or more measurements made on the same phenome- non. A reliable measuring instrument yields measurements with a small amount of error that is randomly, not system- atically, distributed. If multiple executions of a site survey
Journal ofFieldArchaeology/Vol. 19, 1992 171
procedure in the exact same area yielded varying frequen- cies of different kinds of artifacts, then that procedure would be considered unreliable. Conversely, if statistically unvarying frequencies of the archaeological phenomenon had been obtained, then the procedure and results would both be considered reliable.
Accuracy relates to the deviation between actual and measured. An accurate measuring device produces mea- surements with a small deviation, i.e., with little bias or systematic error, given a stipulated level of precision. Ac- curate archaeological survey generates a document that is a faithful representation of the archaeological record with
respect to the target characteristics. In recent years, the domain of archaeological phenomena over which archae-
ologists attempt to obtain an accurate and reliable picture has expanded; the level of survey precision demanded by archaeological questions has become finer. Not only are architectural features sought, but also remains that are less obtrusive. It is for this reason that archaeologists have increased the intensity and evenness of survey.
What are the specific characteristics of the archaeological record that survey procedures should accurately and reli-
ably portray? The answer depends on the desired level of
precision, which is determined by the questions being asked of the record. For all levels of precision, however, frequency of an archaeological phenomenon is one ob- vious attribute. Another is the state of the discovered phenomenon specified to a desired level of detail. For example, correctly identifying the artifact states of "ce- ramic," vs. "chipped stone," vs. "fire-altered rock," vs. "ground stone," vs. "other" may be appropriate in some instances. In others, correctly specifying "flake" from "core" from "angular debris" from "worked tool" may be important. The vast literature on sampling and sampling within the context of archaeological survey is concerned entirely with the faithful and simultaneous depiction of these two characteristics, frequencies and state of a given phenomenon.
Another aspect of the archaeological record that has become increasingly important to archaeologists is its spa- tial structure, i.e., the spatial relationships among like and different archaeological phenomena. Sampling is designed to generate frequency estimates of a given class of phe- nomenon. It is difficult, however, to sample for structure without knowing beforehand the nature of that structure. For this reason, some archaeologists (contributors to Fish and Kowalewski 1990) have called for full-coverage sur- vey, i.e., survey of large expanses of land. Insofar as such survey can guarantee the accurate recording of all instances of phenomena in state X for a given area, then a faithful picture of the spatial relationship between those phenom-
ena can also be assumed. With such a picture of the ar- chaeological landscape, questions that demand structural data can be addressed.
The focus of this paper is on evaluating the accuracy of a more precise (relative to site survey) documentation procedure given variable densities and degrees of artifact obtrusiveness. Previous work in this area (Camilli, Wand- snider, and Ebert 1988; Larralde 1990; Wandsnider 1989; Wandsnider and Ebert 1984; Wandsnider and Larralde 1986) suggests that an accurate portrait of the archaeo- logical record may be tied directly to attributes of artifact abundance, clustering, and obtrusiveness. The present ef- fort is therefore directed towards better specifying the parameters of the relationship between document accuracy and these record characteristics.
Character of Surface Archaeological Deposits Attributes of archaeological deposits that influence how
that deposit is documented include, among other things, the obtrusiveness of artifacts, their clustering, and their density. Obtrusiveness refers to the probability of discov- ery of an archaeological phenomenon given the survey technique (Schiffer, Sullivan, and Klinger 1978: 6). The obtrusiveness of high-density artifact scatters with a di- ameter of 30 m is high if the survey transect spacing is 15 m or less. Obtrusiveness of the same archaeological phenomenon would be reduced given survey procedures with a transect spacing wider than 15 m (see Cowgill 1990: 252-256). Probability of discovery is also affected by surface visibility, which is conditioned by extent and nature of vegetation and sedimentation. Thus, architec- tural remains on a scoured land surface are more obtrusive than those in a pine forest. In this study, survey methods were held constant (see below) and groundcover was sparse, with the result that obtrusiveness is almost solely referable to characteristics of the artifacts themselves and their distribution. Attributes of artifact obtrusiveness con- sidered here include artifact color, size, and shape.
Schiffer and colleagues (1978; see also Read 1986) considered the effects of two other deposit characteristics, frequency (or abundance or density) and clusteredness, on discovery. If the frequency of an archaeological phenom- enon (i.e., artifact or site) is high or these phenomena are not highly clustered, then the total frequency in state X may be estimated from an accurate and reliable survey of a relatively small area. The spatial relationships among different and similar kinds of phenomena, however, can- not be estimated from the sample. As abundance falls or archaeological remains become more clustered, sample survey becomes a less reliable way of documenting the
172 Surface Deposits and Survey/Wandsnider and Camilli
character of an archaeological surface distribution, even with respect to frequency, since survey within the sample units may or may not encounter archaeological remains. That is, the variance about the artifact frequency estimate increases dramatically as the target population decreases in size or becomes more aggregated. In this study, the effects of density and clusteredness on survey results are considered.
Survey Projects and Study Areas
The data used in this analysis were collected from three
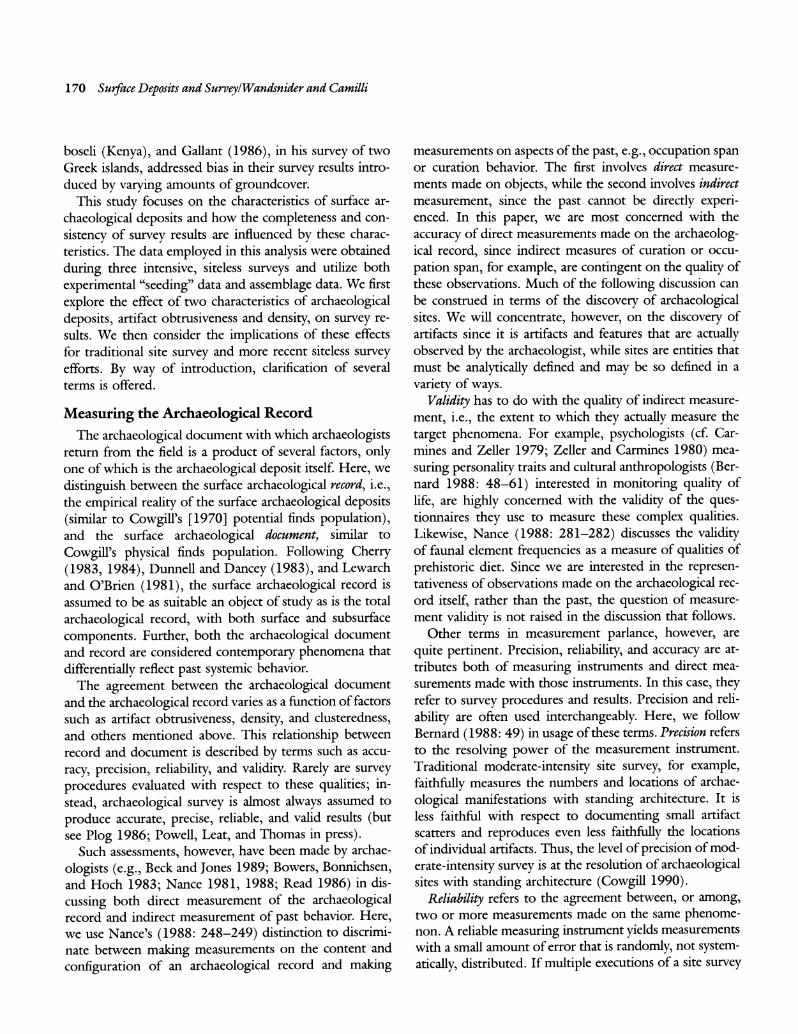
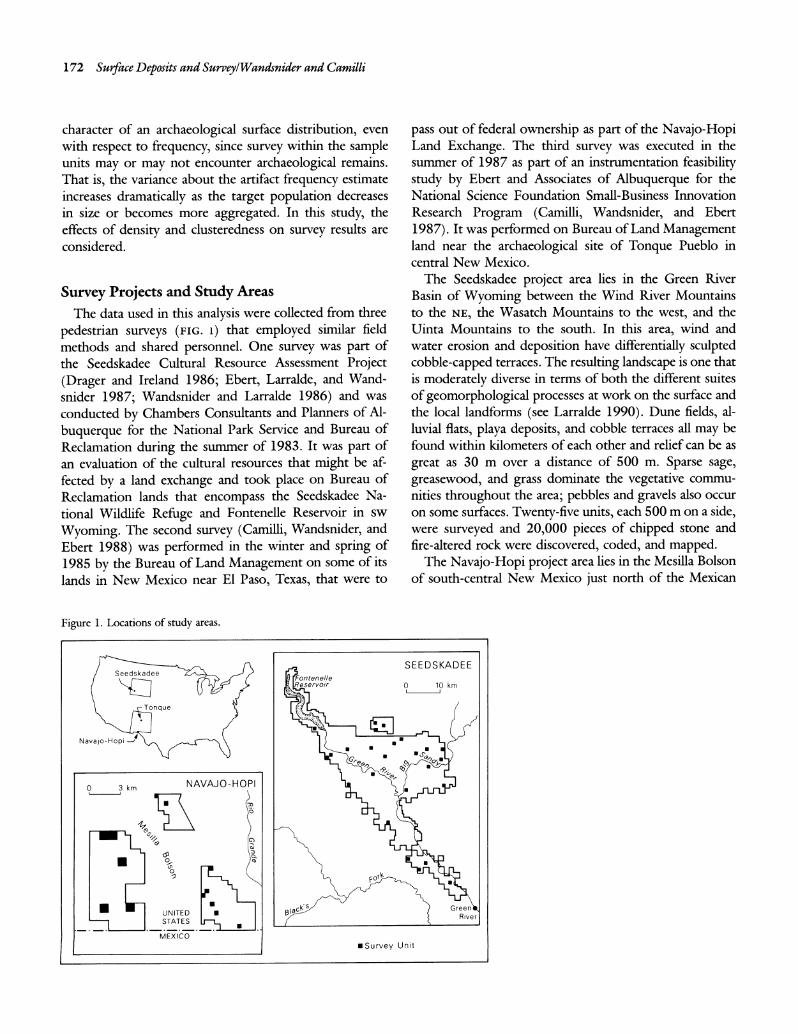
pedestrian surveys (FIG. 1) that employed similar field methods and shared personnel. One survey was part of the Seedskadee Cultural Resource Assessment Project (Drager and Ireland 1986; Ebert, Larralde, and Wand- snider 1987; Wandsnider and Larralde 1986) and was conducted by Chambers Consultants and Planners of Al-
buquerque for the National Park Service and Bureau of Reclamation during the summer of 1983. It was part of an evaluation of the cultural resources that might be af- fected by a land exchange and took place on Bureau of Reclamation lands that encompass the Seedskadee Na- tional Wildlife Refuge and Fontenelle Reservoir in sw
Wyoming. The second survey (Camilli, Wandsnider, and Ebert 1988) was performed in the winter and spring of 1985 by the Bureau of Land Management on some of its lands in New Mexico near El Paso, Texas, that were to
pass out of federal ownership as part of the Navajo-Hopi Land Exchange. The third survey was executed in the summer of 1987 as part of an instrumentation feasibility study by Ebert and Associates of Albuquerque for the National Science Foundation Small-Business Innovation Research Program (Camilli, Wandsnider, and Ebert
1987). It was performed on Bureau of Land Management land near the archaeological site of Tonque Pueblo in central New Mexico.
The Seedskadee project area lies in the Green River Basin of Wyoming between the Wind River Mountains to the NE, the Wasatch Mountains to the west, and the Uinta Mountains to the south. In this area, wind and water erosion and deposition have differentially sculpted cobble-capped terraces. The resulting landscape is one that is moderately diverse in terms of both the different suites of geomorphological processes at work on the surface and the local landforms (see Larralde 1990). Dune fields, al- luvial flats, playa deposits, and cobble terraces all may be found within kilometers of each other and relief can be as
great as 30 m over a distance of 500 m. Sparse sage, greasewood, and grass dominate the vegetative commu- nities throughout the area; pebbles and gravels also occur on some surfaces. Twenty-five units, each 500 m on a side, were surveyed and 20,000 pieces of chipped stone and fire-altered rock were discovered, coded, and mapped.
The Navajo-Hopi project area lies in the Mesilla Bolson of south-central New Mexico just north of the Mexican
Figure 1. Locations of study areas.
SEEDSKADEE Seedskadee Fontenee
Reservoir 0 10 km
Tonque
Navajo-Hopi
0 3 km NAVAJO-HOPI
UNITED Green STATES
River
MEXICO ESurvey Unit
Journal of FieldArchaeology/Vol. 19, 1992 173
border. The Rio Grande, to the east, is the nearest major drainage, and the Portillo Mountains rise to the west of the project area. The bolson is the relic of an ancient, internally drained basin. Today, it is mantled with coppice dunes anchored by mesquite in some parts and yucca in others. Localized occurrences of sand sheets that appear to be presently inactive are also found; naturally occurring gravels, the majority of them less than 2 cm in diameter, were found in dune blowouts. Compared with the Seed- skadee project area, the Navajo-Hopi area has a very low
diversity in type of landform. Over a distance of 400 m, elevation may vary at most 5 m and usually much less. Bureau of Land Management personnel surveyed 28 units, each 400 m on a side. In these, 30,400 pieces of chipped stone, ceramics, and fire-altered rock were discovered, coded, and mapped.
The Tonque project survey area, measuring 400 m x 400 m, lies on the north-trending slope of a dissected
pediment associated with the northern Sandia Mountains about 30 km NE of Albuquerque, New Mexico. Arroyo Tonque, which flows into the nearby Rio Grande, bounds the project area to the north and Arroyo Una de Gato, a
tributary of Arroyo Tonque, lies to the south. Juniper parkland covers approximately the central third of the area; to the south is a gently-sloping expanse of snakeweed and to the north is a broken terrace covered with low shrubs. Pebbles of various colors are a common feature of some portions of the unit. Ebert and Associates personnel surveyed this single unit and recorded approximately 2300 sherds, pieces of chipped stone, and feature-related cob- bles.
In each area, siteless survey procedures were followed. Siteless methods include off-site, non-site, and other sur-
vey procedures. In such procedures, the artifact is the unit of discovery, but typically the unit of collection and anal-
ysis is the survey unit. These analytic units may vary in size from 66.6 sq m (Seaman, Doleman, and Chapman 1988a), to 250 sq m (Foley 1981c), to 1 ha (Irwin- Williams et al. 1988), to 13 ha (Button 1987), to 25 ha
(Bettinger 1976, 1977; Thomas 1971, 1973, 1975), or, if defined by the extent of an agricultural field (O'Brien et al. 1982; Bintliff and Snodgrass 1985, 1988), may be of any size. Such data are used to discuss variation in the densities of specific kinds of artifacts across large expanses of land. Similar to the procedures employed by Dancey (1973) and Davis (1975), the survey procedures utilized during the projects described here not only used the ar- tifact as the unit of discovery, but mapped artifacts to the nearest centimeter or meter. In this manner, the higher- resolution spatial information of artifact distributions was conserved. Thus, this suite of field techniques has been
termed distributional to distinguish it from other siteless field methods (Ebert, Larralde, and Wandsnider 1987).
Distributional methods involved the intensive (5 m transect interval) and controlled (transect guides are es- tablished prior to survey) survey of small parcels of land (500 m on a side for the Seedskadee survey and 400 m on a side for the other two). The locations of all artifacts were marked with orange pinflags as they were found by a five-person "discovery" crew. The artifact locations were later visited by a separate crew that encoded up to 15 attributes for each artifact using a predetermined, com-
puter-compatible coding scheme. In the earlier Seedskadee and Navajo-Hopi surveys, codes were manually tran- scribed onto FORTRAN forms and later entered into
computer files. In the later Tonque survey, artifact attri- bute codes were entered directly into hand-held field com-
puters; these files were later transferred to the laboratory computer for analysis. While visiting the artifacts to code them, other artifacts were inevitably noticed and these were flagged in red to distinguish them from those found
during the systematic survey. All discovered artifacts were
mapped by a third two-person crew. An Electronic Dis- tance Measuring (EDM) theodolite was used to map, to the nearest centimeter, about half of the Seedskadee and
three-quarters of the Navajo-Hopi artifacts. In high arti- fact density areas, a grid system with movable tapes was used to record the provenience of artifacts to the nearest meter. All provenience information was initially hand- transcribed and then entered into computer files. In the
Tonque survey, no provenience grid system was employed. Furthermore, in contrast to the other two surveys, a data receiver attached to the EDM logged the point-proveni- enced data, which were later transferred to the laboratory computer.
This study makes use of two kinds of data that were collected as part of these surveys. The first comes from the "seeding" of survey units with painted hardware prior to survey. With these experimental data, the characteristics of the archaeological document can be directly compared with the known characteristics of the seeded archaeolog- ical record. The second kind of data comprises the pop- ulation of prehistoric artifacts that were recorded during controlled survey, flagged in orange, and those found dur- ing the second unsystematic encoding pass through the survey unit, flagged in red. Ratios of orange-flagged ar- tifacts to the total sample of discovered artifacts are used in the second set of analyses.
Seeding Experiments The seeding experiments consisted of introducing a
known quantity of a contemporary material into a unit
174 Surface Deposits and Survey/Wandsnider and Camilli
prior to its survey. Palynologists use a similar technique to "spike" their samples with an easily recognizable exotic
pollen or sphere that behaves like pollen so that recovery and sedimentation rates can be estimated (e.g., Davis
1967, 1976).
Seedskadee Seeding Experiment This first experiment considered the accuracy of the
distributional survey procedure with respect to artifact
obtrusiveness, as measured by geometry and color, and clusteredness. Seedskadee Unit 24 was seeded, prior to
survey, with 203 contemporary artifacts, washers (D. 1.5 cm; surface area 1.77 sq cm) and nails (5 cm in length; surface area 1.5 sq cm) spray-painted black and buff.' Two different sorts of distributions were mimicked through seeding: "isolated occurrences" and "sites" (artifact clus-
ters). Isolated artifacts were laid out according to no par- ticular plan, but cannot be said to have been randomly distributed. Varying shapes and densities of artifact clus- ters were introduced onto the landscape. The seeded ar- tifacts were mapped as they were introduced into the
survey tract. These objects were then discovered and re- corded in the same manner as all prehistoric artifacts (i.e., flagged in orange during the first survey pass and flagged in red if found by encoding or mapping crew members).
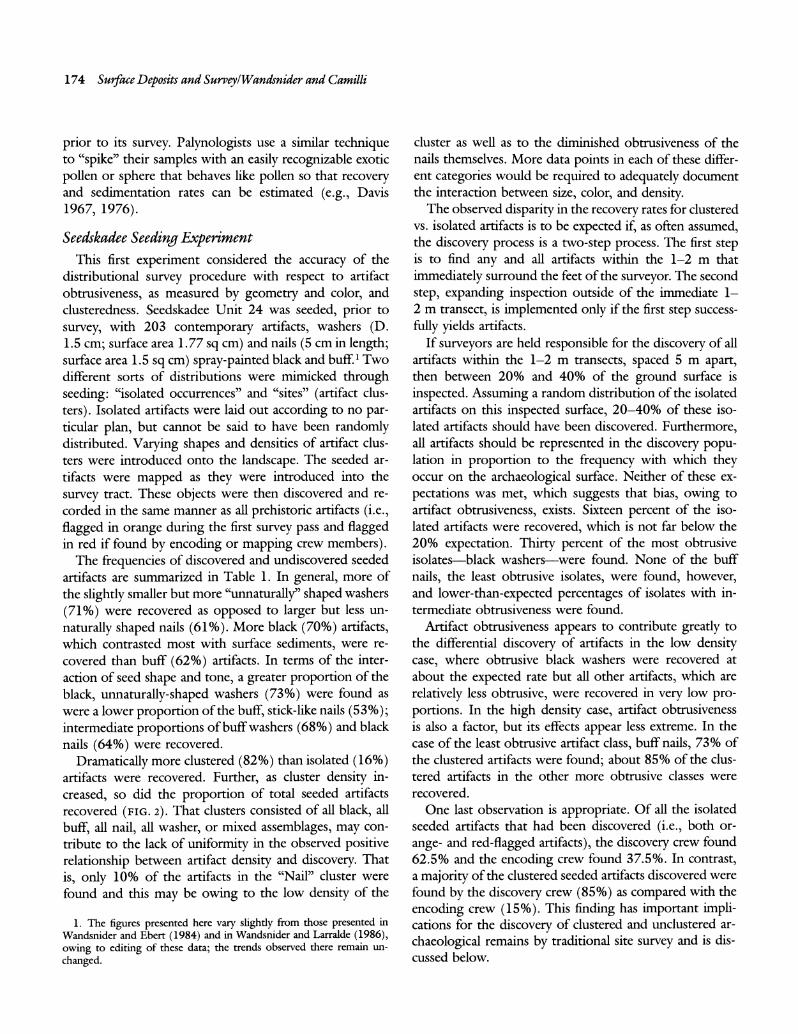
The frequencies of discovered and undiscovered seeded artifacts are summarized in Table 1. In general, more of the slightly smaller but more "unnaturally" shaped washers
(71%) were recovered as opposed to larger but less un-
naturally shaped nails (61%). More black (70%) artifacts, which contrasted most with surface sediments, were re- covered than buff (62%) artifacts. In terms of the inter- action of seed shape and tone, a greater proportion of the
black, unnaturally-shaped washers (73%) were found as were a lower proportion of the buff, stick-like nails (53%); intermediate proportions of buff washers (68%) and black nails (64%) were recovered.
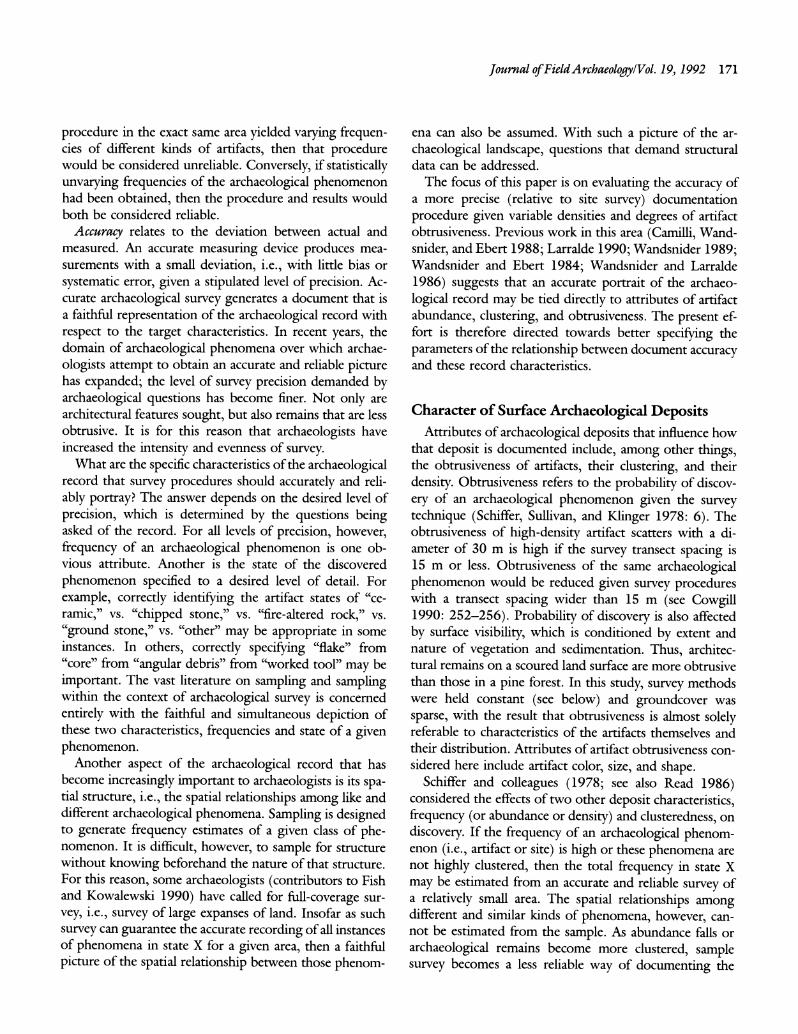
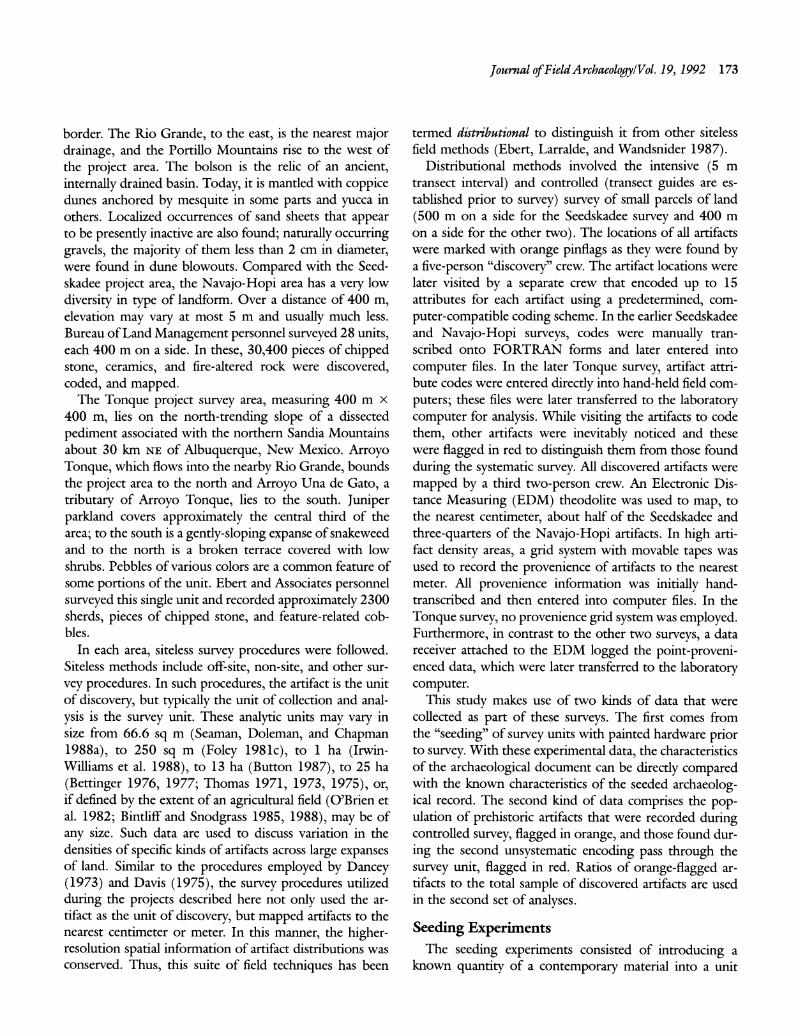
Dramatically more clustered (82%) than isolated (16%) artifacts were recovered. Further, as cluster density in- creased, so did the proportion of total seeded artifacts recovered (FIG. 2). That clusters consisted of all black, all buff, all nail, all washer, or mixed assemblages, may con- tribute to the lack of uniformity in the observed positive relationship between artifact density and discovery. That is, only 10% of the artifacts in the "Nail" cluster were found and this may be owing to the low density of the
cluster as well as to the diminished obtrusiveness of the nails themselves. More data points in each of these differ- ent categories would be required to adequately document the interaction between size, color, and density.
The observed disparity in the recovery rates for clustered vs. isolated artifacts is to be expected if, as often assumed, the discovery process is a two-step process. The first step is to find any and all artifacts within the 1-2 m that
immediately surround the feet of the surveyor. The second
step, expanding inspection outside of the immediate 1- 2 m transect, is implemented only if the first step success-
fully yields artifacts. If surveyors are held responsible for the discovery of all
artifacts within the 1-2 m transects, spaced 5 m apart, then between 20% and 40% of the ground surface is
inspected. Assuming a random distribution of the isolated artifacts on this inspected surface, 20-40% of these iso- lated artifacts should have been discovered. Furthermore, all artifacts should be represented in the discovery popu- lation in proportion to the frequency with which they occur on the archaeological surface. Neither of these ex-
pectations was met, which suggests that bias, owing to artifact obtrusiveness, exists. Sixteen percent of the iso- lated artifacts were recovered, which is not far below the 20% expectation. Thirty percent of the most obtrusive isolates-black washers-were found. None of the buff
nails, the least obtrusive isolates, were found, however, and lower-than-expected percentages of isolates with in- termediate obtrusiveness were found.
Artifact obtrusiveness appears to contribute greatly to the differential discovery of artifacts in the low density case, where obtrusive black washers were recovered at about the expected rate but all other artifacts, which are
relatively less obtrusive, were recovered in very low pro- portions. In the high density case, artifact obtrusiveness is also a factor, but its effects appear less extreme. In the case of the least obtrusive artifact class, buff nails, 73% of the clustered artifacts were found; about 85% of the clus- tered artifacts in the other more obtrusive classes were recovered.
One last observation is appropriate. Of all the isolated seeded artifacts that had been discovered (i.e., both or-
ange- and red-flagged artifacts), the discovery crew found 62.5% and the encoding crew found 37.5%. In contrast, a majority of the clustered seeded artifacts discovered were found by the discovery crew (85%) as compared with the encoding crew (15%). This finding has important impli- cations for the discovery of clustered and unclustered ar- chaeological remains by traditional site survey and is dis- cussed below.
1. The figures presented here vary slightly from those presented in Wandsnider and Ebert (1984) and in Wandsnider and Larralde (1986), owing to editing of these data; the trends observed there remain un- changed.
Journal of Field Archaeology/Vol. 19, 1992 175
100-------------------- - ----- -
Buff
S 40 ----------------------------I --------------------------- --------- Black
Mixed
Nails
Washers
0- 0 1 2 3 4 5 6
Cluster Density (artifacts I sq m)
------0 -?-- ---------- --------WB------- ---------
Buff I
ca ', II | i
.... ...
.r 0 ... ', ,---------
Clse Dnit (atfat / qm
Figure 2. Seedskadee seeding experiment: percentage of orange-flagged artifacts vs. cluster density. "Buff" refers to clusters with buff washers and nails; "Black" to black washers and nails; "Mixed" to buff and black nails and washers; "Nails" to buff and black nails; and "Washers" to buff and black washers.
Tonque Seeding Experiment The Tonque seeding experiment was conducted differ-
ently from that implemented during the Seedskadee Proj- ect. A total of 328 washers, of three diameters (45 mm, 26 mm, and 19 mm) and spray-painted white, brown, and black, were introduced into the unit prior to survey.
A regular, dispersed pattern of artifacts was simulated. In this case, the brown washers would have contrasted least with the surface sediments; white and black washers would have contrasted the most. Thus, this experiment focused
solely on artifact obtrusiveness, as measured by artifact tone and size.
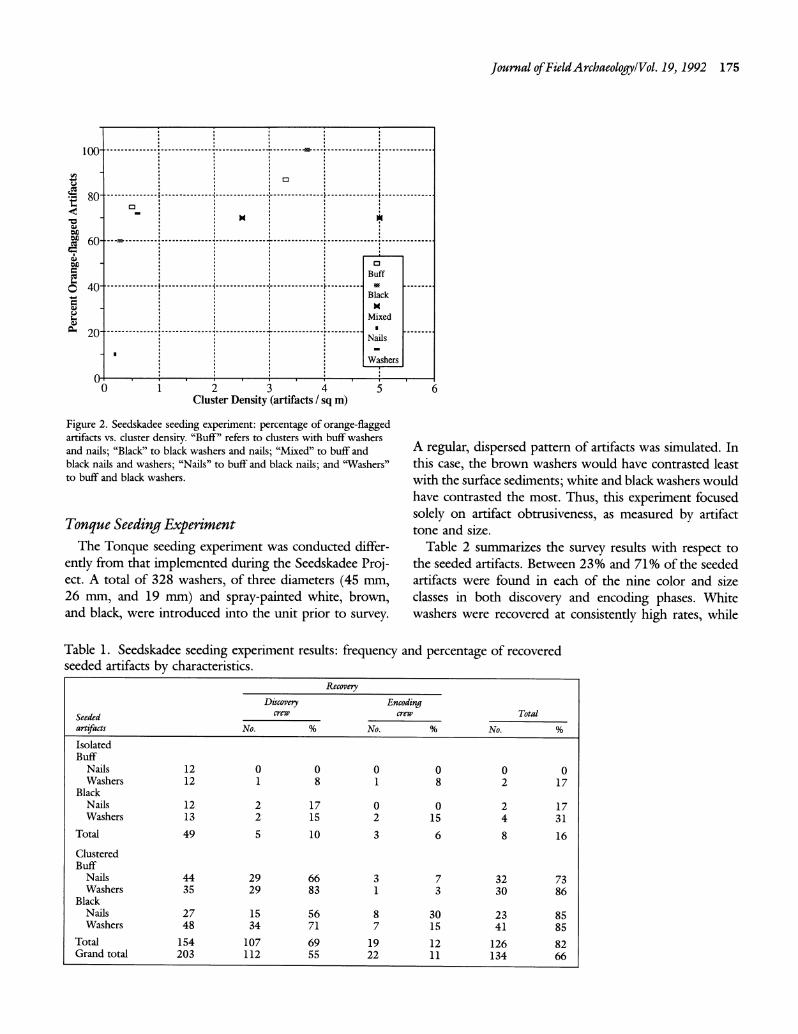
Table 2 summarizes the survey results with respect to the seeded artifacts. Between 23% and 71% of the seeded artifacts were found in each of the nine color and size classes in both discovery and encoding phases. White washers were recovered at consistently high rates, while
Table 1. Seedskadee seeding experiment results: frequency and percentage of recovered seeded artifacts by characteristics.
Recovery
Discovery Encoding Seeded crew crew Total
artifacts No. % No. % No. % Isolated Buff
Nails 12 0 0 0 0 0 0 Washers 12 1 8 1 8 2 17
Black Nails 12 2 17 0 0 2 17 Washers 13 2 15 2 15 4 31
Total 49 5 10 3 6 8 16
Clustered Buff
Nails 44 29 66 3 7 32 73 Washers 35 29 83 1 3 30 86
Black Nails 27 15 56 8 30 23 85 Washers 48 34 71 7 15 41 85
Total 154 107 69 19 12 126 82 Grand total 203 112 55 22 11 134 66
176 Surface Deposits and Survey/Wandsnider and Camilli
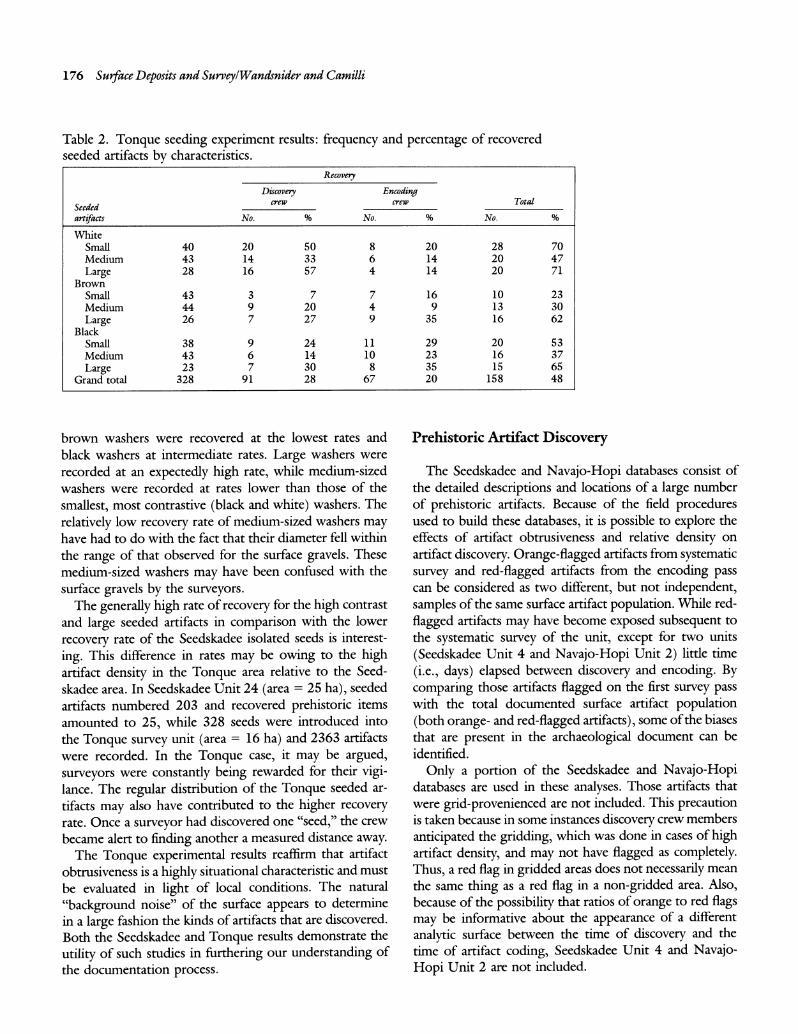
Table 2. Tonque seeding experiment results: frequency and percentage of recovered seeded artifacts by characteristics.
Recovery
Discovery Encoding
Seeded crew crew Total
artifacts No. % No. % No. %
White Small 40 20 50 8 20 28 70 Medium 43 14 33 6 14 20 47
Large 28 16 57 4 14 20 71 Brown
Small 43 3 7 7 16 10 23 Medium 44 9 20 4 9 13 30
Large 26 7 27 9 35 16 62 Black
Small 38 9 24 11 29 20 53 Medium 43 6 14 10 23 16 37
Large 23 7 30 8 35 15 65 Grand total 328 91 28 67 20 158 48
brown washers were recovered at the lowest rates and black washers at intermediate rates. Large washers were recorded at an expectedly high rate, while medium-sized washers were recorded at rates lower than those of the
smallest, most contrastive (black and white) washers. The
relatively low recovery rate of medium-sized washers may have had to do with the fact that their diameter fell within the range of that observed for the surface gravels. These medium-sized washers may have been confused with the surface gravels by the surveyors.
The generally high rate of recovery for the high contrast and large seeded artifacts in comparison with the lower
recovery rate of the Seedskadee isolated seeds is interest-
ing. This difference in rates may be owing to the high artifact density in the Tonque area relative to the Seed- skadee area. In Seedskadee Unit 24 (area = 25 ha), seeded artifacts numbered 203 and recovered prehistoric items amounted to 25, while 328 seeds were introduced into the Tonque survey unit (area = 16 ha) and 2363 artifacts were recorded. In the Tonque case, it may be argued, surveyors were constantly being rewarded for their vigi- lance. The regular distribution of the Tonque seeded ar- tifacts may also have contributed to the higher recovery rate. Once a surveyor had discovered one "seed," the crew became alert to finding another a measured distance away.
The Tonque experimental results reaffirm that artifact obtrusiveness is a highly situational characteristic and must be evaluated in light of local conditions. The natural
"background noise" of the surface appears to determine in a large fashion the kinds of artifacts that are discovered. Both the Seedskadee and Tonque results demonstrate the
utility of such studies in furthering our understanding of the documentation process.
Prehistoric Artifact Discovery
The Seedskadee and Navajo-Hopi databases consist of the detailed descriptions and locations of a large number of prehistoric artifacts. Because of the field procedures used to build these databases, it is possible to explore the effects of artifact obtrusiveness and relative density on artifact discovery. Orange-flagged artifacts from systematic survey and red-flagged artifacts from the encoding pass can be considered as two different, but not independent, samples of the same surface artifact population. While red-
flagged artifacts may have become exposed subsequent to the systematic survey of the unit, except for two units (Seedskadee Unit 4 and Navajo-Hopi Unit 2) little time (i.e., days) elapsed between discovery and encoding. By comparing those artifacts flagged on the first survey pass with the total documented surface artifact population (both orange- and red-flagged artifacts), some of the biases that are present in the archaeological document can be identified.
Only a portion of the Seedskadee and Navajo-Hopi databases are used in these analyses. Those artifacts that were grid-provenienced are not included. This precaution is taken because in some instances discovery crew members
anticipated the gridding, which was done in cases of high artifact density, and may not have flagged as completely. Thus, a red flag in gridded areas does not necessarily mean the same thing as a red flag in a non-gridded area. Also, because of the possibility that ratios of orange to red flags may be informative about the appearance of a different
analytic surface between the time of discovery and the time of artifact coding, Seedskadee Unit 4 and Navajo- Hopi Unit 2 are not included.
Journal of Field Archaeology/Vol. 19, 1992 177
Artifact Obtrusiveness As discussed above, artifact obtrusiveness, frequency,
and local artifact density or clusteredness may all predis- pose an artifact to discovery. The characteristics of an artifact that might make it more conspicuous include its size and tone (or lightness) relative to the size and tone of background surface sediments. In the Seedskadee proj- ect, size information was recorded only for chipped stone and ground stone artifacts. Length was measured in mil- limeters for complete flakes, all formal tools, and all
ground stone. No size information for fire-altered rock was recorded and no ceramics were discovered.
The coded attributes of surface artifacts were modified and refined for the Navajo-Hopi project based on Seed- skadee project experiences. For the Navajo-Hopi survey, dimensions were again recorded to the nearest millimeter for all complete flakes, formal tools, and complete ground stone artifacts. Size class (0-30 mm, 31-60 mm, 61- 100 mm, and > 100 mm) was recorded for chipped stone
debris, cores, and fragmentary ground stone as well as for fire-altered rock. Maximum dimension was recorded for all ceramics.
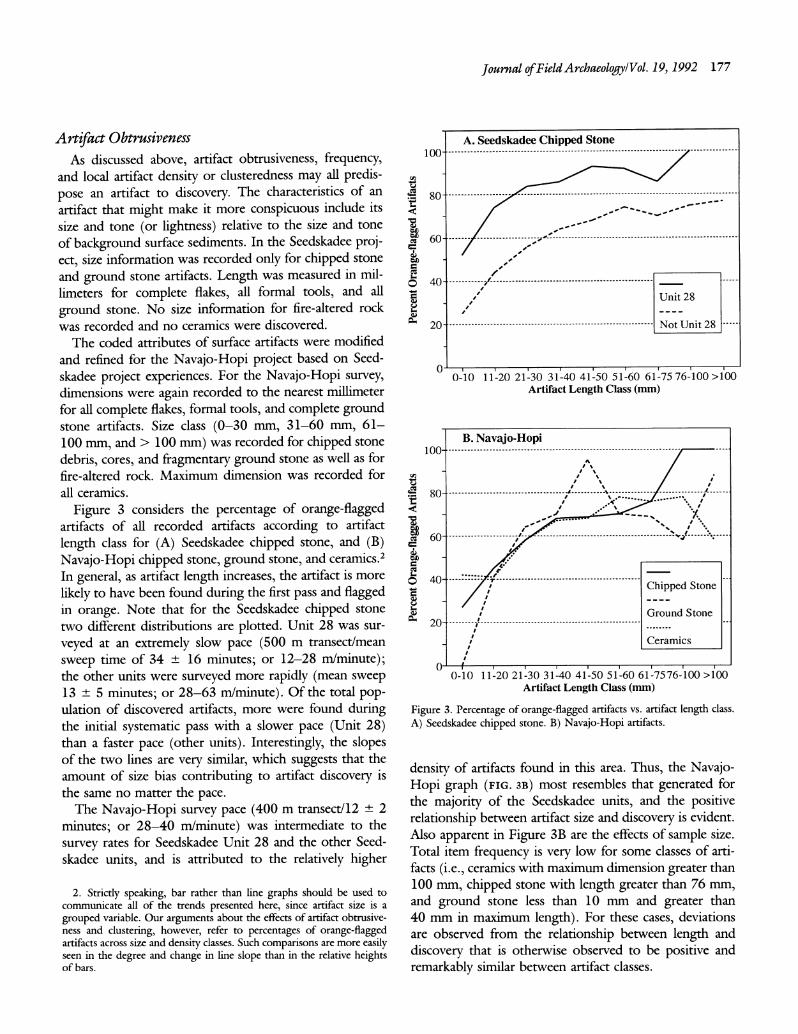
Figure 3 considers the percentage of orange-flagged artifacts of all recorded artifacts according to artifact
length class for (A) Seedskadee chipped stone, and (B) Navajo-Hopi chipped stone, ground stone, and ceramics.2 In general, as artifact length increases, the artifact is more
likely to have been found during the first pass and flagged in orange. Note that for the Seedskadee chipped stone two different distributions are plotted. Unit 28 was sur-
veyed at an extremely slow pace (500 m transect/mean
sweep time of 34 ? 16 minutes; or 12-28 m/minute); the other units were surveyed more rapidly (mean sweep 13 - 5 minutes; or 28-63 m/minute). Of the total pop- ulation of discovered artifacts, more were found during the initial systematic pass with a slower pace (Unit 28) than a faster pace (other units). Interestingly, the slopes of the two lines are very similar, which suggests that the amount of size bias contributing to artifact discovery is the same no matter the pace.
The Navajo-Hopi survey pace (400 m transect/12 -
2
minutes; or 28-40 m/minute) was intermediate to the
survey rates for Seedskadee Unit 28 and the other Seed- skadee units, and is attributed to the relatively higher
A. Seedskadee Chipped Stone
80
100- ------------------------------------ -
C~ 60
/
40----------------------------------------------
20 .
Unit 28
20 --------------------------------------- Not Unit 28 -----
0-10 11-20 21-30 31-40 41-50 51-60 61-75 76-100 >100 Artifact Length Class (mm)
B. Navajo-Hopi
8 0 - - - - - - - - - - - - - - - - - - - - - - - - - - - - --A - - - - - - - - - --.. . . . . . . . . . . . . . . . . . . . . . . . ..-'--
- - - - . . . . . ..-
- "v- . . . .-
SX80
60 ------------------------- *-- -------------- ------,:---------~-----_:------,-- -- - -
Chipped Stone
Ground Stone 20-
/ Ceramics
0-10 11-20 21-30 31-40 41-50 51-60 61-7576-100 >100 Artifact Length Class (mm)
Figure 3. Percentage of orange-flagged artifacts vs. artifact length class.
A) Seedskadee chipped stone. B) Navajo-Hopi artifacts.
density of artifacts found in this area. Thus, the Navajo- Hopi graph (FIG. 3B) most resembles that generated for the majority of the Seedskadee units, and the positive relationship between artifact size and discovery is evident. Also apparent in Figure 3B are the effects of sample size. Total item frequency is very low for some classes of arti- facts (i.e., ceramics with maximum dimension greater than 100 mm, chipped stone with length greater than 76 mm, and ground stone less than 10 mm and greater than 40 mm in maximum length). For these cases, deviations are observed from the relationship between length and
discovery that is otherwise observed to be positive and
remarkably similar between artifact classes.
2. Strictly speaking, bar rather than line graphs should be used to communicate all of the trends presented here, since artifact size is a grouped variable. Our arguments about the effects of artifact obtrusive- ness and clustering, however, refer to percentages of orange-flagged artifacts across size and density classes. Such comparisons are more easily seen in the degree and change in line slope than in the relative heights of bars.
178 Surface Deposits and Survey/Wandsnider and Camilli
A. Seedskadee Chipped Stone 1 0 0 -----------------------------------------------------------------------------------------------
80---......-------------------.------
---------------------------
cuo6----------- ---- 6 0 -. - ---- ---- ---- ---- --.0. 10.. - --.................................................................
40 ----------------------------------------- S40 ................................................ _
Unit 28
20-------------------------- -------------Not Unit 28
01 0-30 31-60 61-100 >100
Artifact Size Class (mm)
B. Navajo-Hopi 100-............................................................................................
80 -----------------------------------------------------
60 -------------------- ----------------------- -------
-
.
ea 60-
....-)j- ,
SChipped Stone
? 40 ------- - ---------------------------
.
40 Ground Stone
S 20-- - - -- - Ceramics
FAR
0-30 31-60 61-100 >100 Artifact Size Class (mm)
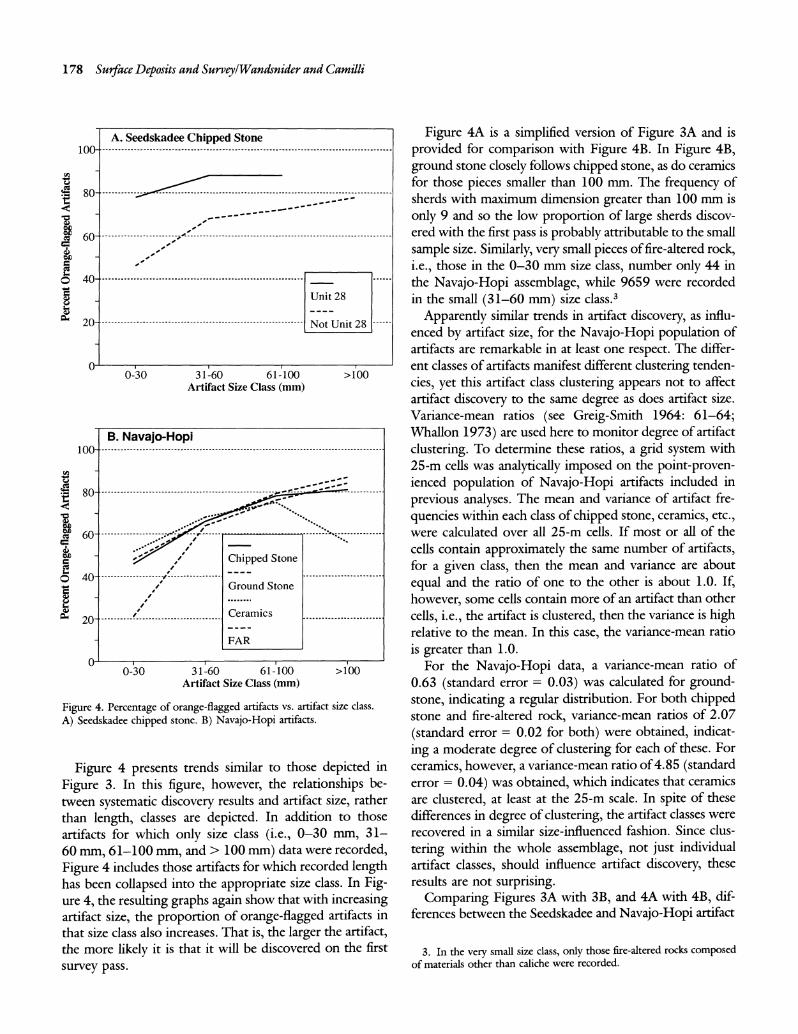
Figure 4. Percentage of orange-flagged artifacts vs. artifact size class.
A) Seedskadee chipped stone. B) Navajo-Hopi artifacts.
Figure 4 presents trends similar to those depicted in
Figure 3. In this figure, however, the relationships be- tween systematic discovery results and artifact size, rather than length, classes are depicted. In addition to those artifacts for which only size class (i.e., 0-30 mm, 31- 60 mm, 61-100 mm, and > 100 mm) data were recorded,
Figure 4 includes those artifacts for which recorded length has been collapsed into the appropriate size class. In Fig- ure 4, the resulting graphs again show that with increasing artifact size, the proportion of orange-flagged artifacts in that size class also increases. That is, the larger the artifact, the more likely it is that it will be discovered on the first
survey pass.
Figure 4A is a simplified version of Figure 3A and is
provided for comparison with Figure 4B. In Figure 4B, ground stone closely follows chipped stone, as do ceramics for those pieces smaller than 100 mm. The frequency of sherds with maximum dimension greater than 100 mm is
only 9 and so the low proportion of large sherds discov- ered with the first pass is probably attributable to the small
sample size. Similarly, very small pieces of fire-altered rock, i.e., those in the 0-30 mm size class, number only 44 in the Navajo-Hopi assemblage, while 9659 were recorded in the small (31-60 mm) size class.3
Apparently similar trends in artifact discovery, as influ- enced by artifact size, for the Navajo-Hopi population of artifacts are remarkable in at least one respect. The differ- ent classes of artifacts manifest different clustering tenden-
cies, yet this artifact class clustering appears not to affect artifact discovery to the same degree as does artifact size. Variance-mean ratios (see Greig-Smith 1964: 61-64; Whallon 1973) are used here to monitor degree of artifact
clustering. To determine these ratios, a grid system with
25-m cells was analytically imposed on the point-proven- ienced population of Navajo-Hopi artifacts included in
previous analyses. The mean and variance of artifact fre-
quencies within each class of chipped stone, ceramics, etc., were calculated over all 25-m cells. If most or all of the cells contain approximately the same number of artifacts, for a given class, then the mean and variance are about
equal and the ratio of one to the other is about 1.0. If, however, some cells contain more of an artifact than other
cells, i.e., the artifact is clustered, then the variance is high relative to the mean. In this case, the variance-mean ratio is greater than 1.0.
For the Navajo-Hopi data, a variance-mean ratio of 0.63 (standard error = 0.03) was calculated for ground- stone, indicating a regular distribution. For both chipped stone and fire-altered rock, variance-mean ratios of 2.07
(standard error = 0.02 for both) were obtained, indicat-
ing a moderate degree of clustering for each of these. For
ceramics, however, a variance-mean ratio of 4.85 (standard error = 0.04) was obtained, which indicates that ceramics are clustered, at least at the 25-m scale. In spite of these
differences in degree of clustering, the artifact classes were recovered in a similar size-influenced fashion. Since clus-
tering within the whole assemblage, not just individual artifact classes, should influence artifact discovery, these results are not surprising.
Comparing Figures 3A with 3B, and 4A with 4B, dif- ferences between the Seedskadee and Navajo-Hopi artifact
3. In the very small size class, only those fire-altered rocks composed of materials other than caliche were recorded.
Journal of Field Archaeology/Vol. 19, 1992 179
Table 3. Navajo-Hopi lithic materials by inferred tone. Any material that had been fired was considered "Dark."
Color Rock
Light Quartzite Chalcedony Chalcedonic petrified wood Indeterminate sedimentary rock Sandstone Quartzitic sandstone Caliche
Variable Fine-grained rhyolite Undifferentiated crystalline volcanic rock Chert Petrified wood Indeterminate cryptocrystalline rock Indeterminate metamorphics Other Indeterminate
Dark Obsidian Other glassy volcanic rock Basalt Banded quartzite Coarse rhyolite Vesicular basalt Scoria Limestone
discovery trends are obvious. These differences may be attributable to the presence of naturally-occurring gravels in the Seedskadee area, which vie with large artifacts for the attention of the surveyor. In the Navajo-Hopi area, gravels with much smaller dimensions occur. Also, the
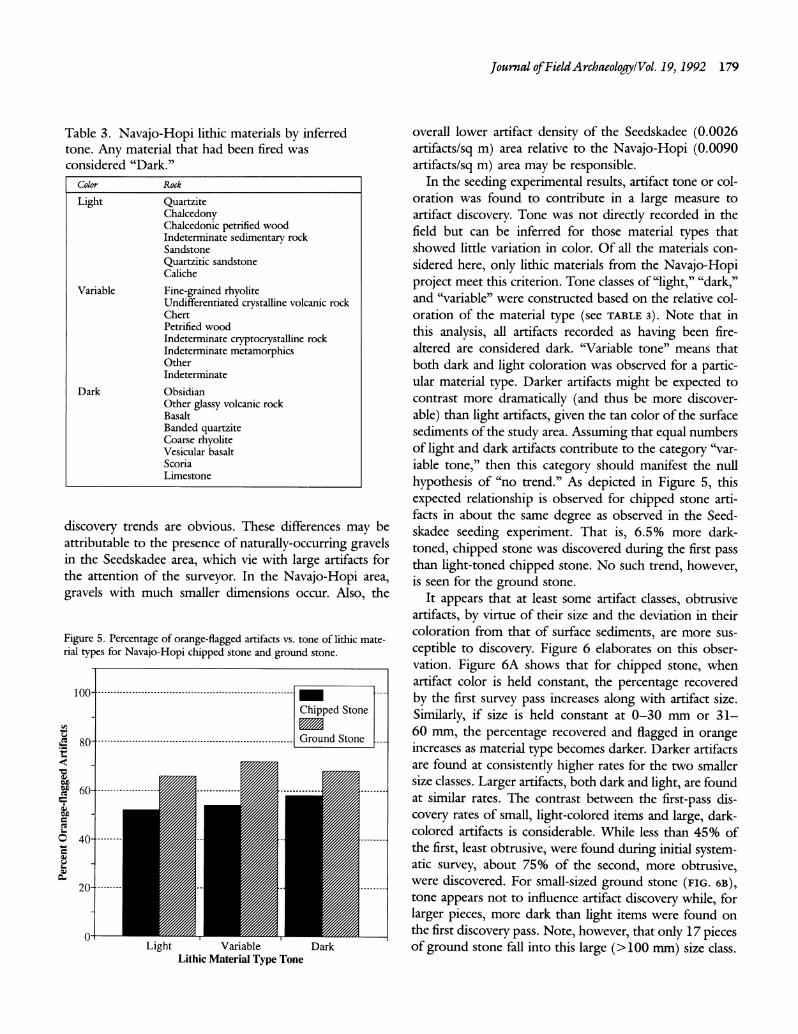
Figure 5. Percentage of orange-flagged artifacts vs. tone of lithic mate- rial types for Navajo-Hopi chipped stone and ground stone.
100 -------------------------------- Chipped Stone
80..................---------------................------------------------------ Ground Stone
- _
S 60-------------------.. ...........
0 40--------
20 ..--------
Light Variable Dark Lithic Material Type Tone
overall lower artifact density of the Seedskadee (0.0026 artifacts/sq m) area relative to the Navajo-Hopi (0.0090 artifacts/sq m) area may be responsible.
In the seeding experimental results, artifact tone or col- oration was found to contribute in a large measure to artifact discovery. Tone was not directly recorded in the field but can be inferred for those material types that showed little variation in color. Of all the materials con- sidered here, only lithic materials from the Navajo-Hopi project meet this criterion. Tone classes of "light," "dark," and "variable" were constructed based on the relative col- oration of the material type (see TABLE 3). Note that in this analysis, all artifacts recorded as having been fire- altered are considered dark. "Variable tone" means that both dark and light coloration was observed for a partic- ular material type. Darker artifacts might be expected to contrast more dramatically (and thus be more discover- able) than light artifacts, given the tan color of the surface sediments of the study area. Assuming that equal numbers of light and dark artifacts contribute to the category "var- iable tone," then this category should manifest the null hypothesis of "no trend." As depicted in Figure 5, this expected relationship is observed for chipped stone arti- facts in about the same degree as observed in the Seed- skadee seeding experiment. That is, 6.5% more dark- toned, chipped stone was discovered during the first pass than light-toned chipped stone. No such trend, however, is seen for the ground stone.
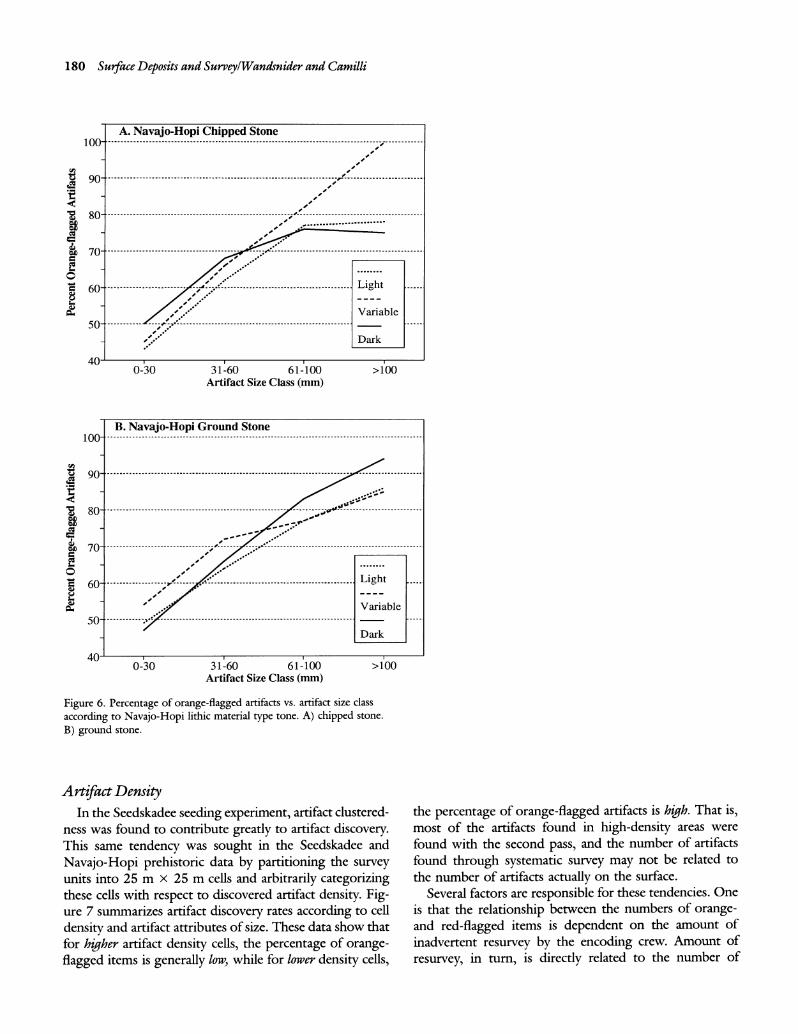
It appears that at least some artifact classes, obtrusive artifacts, by virtue of their size and the deviation in their coloration from that of surface sediments, are more sus- ceptible to discovery. Figure 6 elaborates on this obser- vation. Figure 6A shows that for chipped stone, when artifact color is held constant, the percentage recovered
by the first survey pass increases along with artifact size. Similarly, if size is held constant at 0-30 mm or 31- 60 mm, the percentage recovered and flagged in orange increases as material type becomes darker. Darker artifacts are found at consistently higher rates for the two smaller size classes. Larger artifacts, both dark and light, are found at similar rates. The contrast between the first-pass dis-
covery rates of small, light-colored items and large, dark- colored artifacts is considerable. While less than 45% of the first, least obtrusive, were found during initial system- atic survey, about 75% of the second, more obtrusive, were discovered. For small-sized ground stone (FIG. 6B), tone appears not to influence artifact discovery while, for larger pieces, more dark than light items were found on the first discovery pass. Note, however, that only 17 pieces of ground stone fall into this large (>100 mm) size class.
180 Surface Deposits and Survey/Wandsnider and Camilli
A. Navajo-Hopi Chipped Stone 100
40 I
. ............
40P
"Variable
, . Dark
0-30 31-60 61-100 >100 Artifact Size Class (mm)
B. Navajo-Hopi Ground Stone 1 0 0
- -------------- --------- -----... ...--.-............ .... ............. ..................... .. ...... .....
100------. . . . . . ..--------------------------------------------
0 - 8
-
60- Li
. .ght
S60 ------- 0 ------ ----------- - --- ---------------Ligh
Variable " 5 0 . .. .... .... ....--
---- - -- - - -- - - -- - - -- - - -- - - -- - - -- - - -- -.
Dark
401 0-30 31-60 61-100 >100
Artifact Size Class (mm)
Figure 6. Percentage of orange-flagged artifacts vs. artifact size class
according to Navajo-Hopi lithic material type tone. A) chipped stone.
B) ground stone.
Artifact Density In the Seedskadee seeding experiment, artifact clustered-
ness was found to contribute greatly to artifact discovery. This same tendency was sought in the Seedskadee and
Navajo-Hopi prehistoric data by partitioning the survey units into 25 m x 25 m cells and arbitrarily categorizing these cells with respect to discovered artifact density. Fig- ure 7 summarizes artifact discovery rates according to cell
density and artifact attributes of size. These data show that for higher artifact density cells, the percentage of orange- flagged items is generally low, while for lower density cells,
the percentage of orange-flagged artifacts is high. That is, most of the artifacts found in high-density areas were found with the second pass, and the number of artifacts found through systematic survey may not be related to the number of artifacts actually on the surface.
Several factors are responsible for these tendencies. One is that the relationship between the numbers of orange- and red-flagged items is dependent on the amount of inadvertent resurvey by the encoding crew. Amount of
resurvey, in turn, is directly related to the number of
Journal of FieldArchaeology/Vol. 19, 1992 181
A. Seedskadee Unit 28 1 0 0 - - - -----------------------------------------------------------------------------------
90 - ---------- -------------: 60--------- - --------
80 ------------- .-------
- 7 00 ----------------------- ------------------------- -------.-----.-----------
6 0 --------------------------------------------------------------------------------------
0 50
S40--------------------------------------Low- Density ..
201 1 1
0-30 31-60 >60 Artifact Size Class (mm)
C. Navajo-Hopi- 100 ------
90-1 Low Density
t 80 -- Moderate Density
70 - High Density .-
60- Very High Density --.-
...
"- ---- ------
? 5 0 ------------------------.,t - -... -.- -- - -- - -- - -- - -- - -- -
S•S
30 ------------------ --
----------------•
•-----------
----- ------------
20- 0-30 31-60 >60
Artifact Size Class (mm)
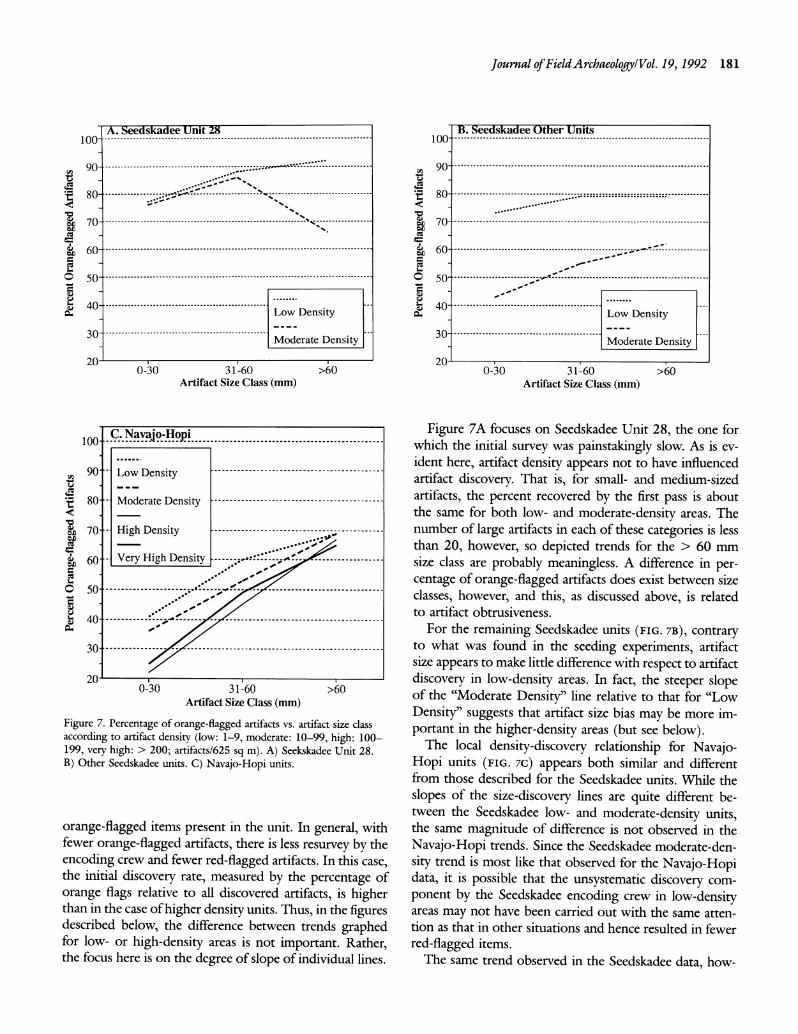
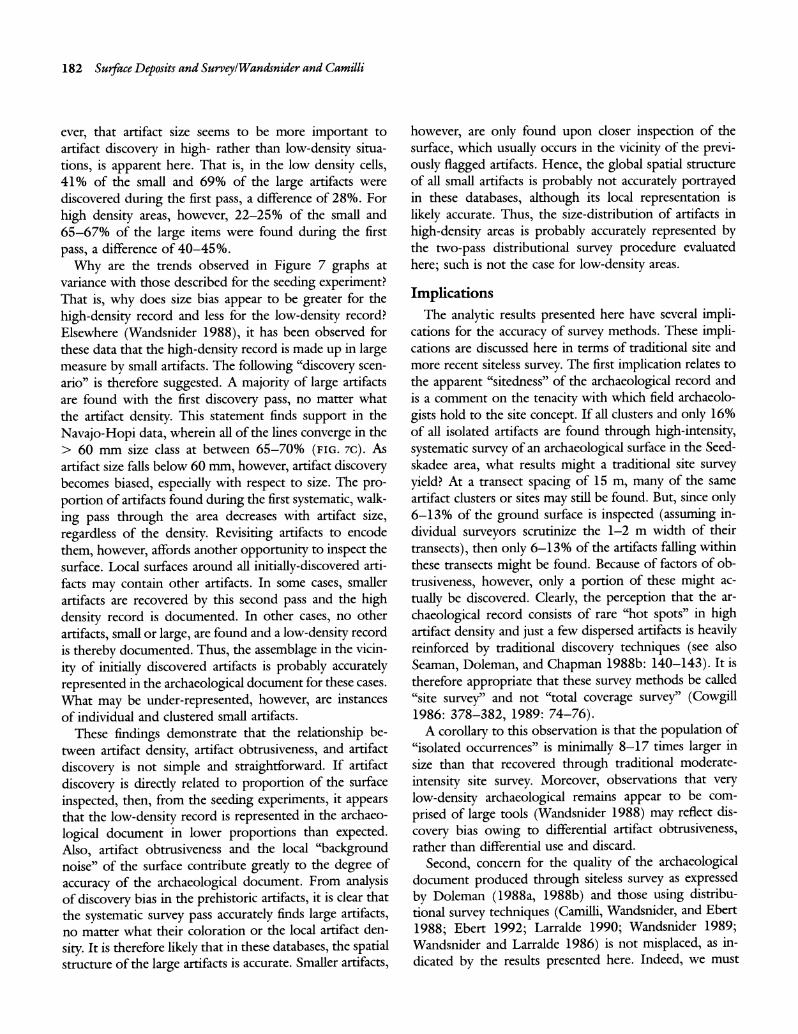
Figure 7. Percentage of orange-flagged artifacts vs. artifact size class according to artifact density (low: 1-9, moderate: 10-99, high: 100- 199, very high: > 200; artifacts/625 sq m). A) Seekskadee Unit 28. B) Other Seedskadee units. C) Navajo-Hopi units.
orange-flagged items present in the unit. In general, with fewer orange-flagged artifacts, there is less resurvey by the encoding crew and fewer red-flagged artifacts. In this case, the initial discovery rate, measured by the percentage of orange flags relative to all discovered artifacts, is higher than in the case of higher density units. Thus, in the figures described below, the difference between trends graphed for low- or high-density areas is not important. Rather, the focus here is on the degree of slope of individual lines.
B. Seedskadee Other Units 100------------------------------------------------------------
90 .----------------------------------------- ------------------
S80 ------------------------------------ ------
70 ------------------------------------- -------------------
60---------------------------- C 60
.....
450 ---------------------
a Low Density
30_
----------------------- Moderate Density
0-30 31-60 >60 Artifact Size Class (mm)
Figure 7A focuses on Seedskadee Unit 28, the one for which the initial survey was painstakingly slow. As is ev- ident here, artifact density appears not to have influenced artifact discovery. That is, for small- and medium-sized artifacts, the percent recovered by the first pass is about the same for both low- and moderate-density areas. The number of large artifacts in each of these categories is less than 20, however, so depicted trends for the > 60 mm size class are probably meaningless. A difference in per- centage of orange-flagged artifacts does exist between size classes, however, and this, as discussed above, is related to artifact obtrusiveness.
For the remaining Seedskadee units (FIG. 7B), contrary to what was found in the seeding experiments, artifact size appears to make little difference with respect to artifact discovery in low-density areas. In fact, the steeper slope of the "Moderate Density" line relative to that for "Low Density" suggests that artifact size bias may be more im- portant in the higher-density areas (but see below).
The local density-discovery relationship for Navajo- Hopi units (FIG. 7C) appears both similar and different from those described for the Seedskadee units. While the slopes of the size-discovery lines are quite different be- tween the Seedskadee low- and moderate-density units, the same magnitude of difference is not observed in the Navajo-Hopi trends. Since the Seedskadee moderate-den- sity trend is most like that observed for the Navajo-Hopi data, it is possible that the unsystematic discovery com- ponent by the Seedskadee encoding crew in low-density areas may not have been carried out with the same atten- tion as that in other situations and hence resulted in fewer red-flagged items.
The same trend observed in the Seedskadee data, how-
182 Surface Deposits and Survey/Wandsnider and Camilli
ever, that artifact size seems to be more important to artifact discovery in high- rather than low-density situa-
tions, is apparent here. That is, in the low density cells, 41% of the small and 69% of the large artifacts were discovered during the first pass, a difference of 28%. For
high density areas, however, 22-25% of the small and 65-67% of the large items were found during the first
pass, a difference of 40-45%.
Why are the trends observed in Figure 7 graphs at variance with those described for the seeding experiment? That is, why does size bias appear to be greater for the
high-density record and less for the low-density record? Elsewhere (Wandsnider 1988), it has been observed for these data that the high-density record is made up in large measure by small artifacts. The following "discovery scen- ario" is therefore suggested. A majority of large artifacts are found with the first discovery pass, no matter what the artifact density. This statement finds support in the
Navajo-Hopi data, wherein all of the lines converge in the > 60 mm size class at between 65-70% (FIG. 7C). As
artifact size falls below 60 mm, however, artifact discovery becomes biased, especially with respect to size. The pro- portion of artifacts found during the first systematic, walk-
ing pass through the area decreases with artifact size,
regardless of the density. Revisiting artifacts to encode
them, however, affords another opportunity to inspect the surface. Local surfaces around all initially-discovered arti- facts may contain other artifacts. In some cases, smaller artifacts are recovered by this second pass and the high density record is documented. In other cases, no other
artifacts, small or large, are found and a low-density record is thereby documented. Thus, the assemblage in the vicin-
ity of initially discovered artifacts is probably accurately represented in the archaeological document for these cases.
What may be under-represented, however, are instances of individual and clustered small artifacts.
These findings demonstrate that the relationship be-
tween artifact density, artifact obtrusiveness, and artifact
discovery is not simple and straightforward. If artifact
discovery is directly related to proportion of the surface
inspected, then, from the seeding experiments, it appears that the low-density record is represented in the archaeo-
logical document in lower proportions than expected. Also, artifact obtrusiveness and the local "background noise" of the surface contribute greatly to the degree of
accuracy of the archaeological document. From analysis of discovery bias in the prehistoric artifacts, it is clear that the systematic survey pass accurately finds large artifacts, no matter what their coloration or the local artifact den-
sity. It is therefore likely that in these databases, the spatial structure of the large artifacts is accurate. Smaller artifacts,
however, are only found upon closer inspection of the
surface, which usually occurs in the vicinity of the previ- ously flagged artifacts. Hence, the global spatial structure of all small artifacts is probably not accurately portrayed in these databases, although its local representation is
likely accurate. Thus, the size-distribution of artifacts in
high-density areas is probably accurately represented by the two-pass distributional survey procedure evaluated
here; such is not the case for low-density areas.
Implications The analytic results presented here have several impli-
cations for the accuracy of survey methods. These impli- cations are discussed here in terms of traditional site and more recent siteless survey. The first implication relates to the apparent "sitedness" of the archaeological record and is a comment on the tenacity with which field archaeolo-
gists hold to the site concept. If all clusters and only 16% of all isolated artifacts are found through high-intensity, systematic survey of an archaeological surface in the Seed- skadee area, what results might a traditional site survey yield? At a transect spacing of 15 m, many of the same artifact clusters or sites may still be found. But, since only 6-13% of the ground surface is inspected (assuming in- dividual surveyors scrutinize the 1-2 m width of their
transects), then only 6-13% of the artifacts falling within these transects might be found. Because of factors of ob-
trusiveness, however, only a portion of these might ac-
tually be discovered. Clearly, the perception that the ar-
chaeological record consists of rare "hot spots" in high artifact density and just a few dispersed artifacts is heavily reinforced by traditional discovery techniques (see also
Seaman, Doleman, and Chapman 1988b: 140-143). It is therefore appropriate that these survey methods be called "site survey" and not "total coverage survey" (Cowgill 1986: 378-382, 1989: 74-76).
A corollary to this observation is that the population of "isolated occurrences" is minimally 8-17 times larger in size than that recovered through traditional moderate-
intensity site survey. Moreover, observations that very low-density archaeological remains appear to be com-
prised of large tools (Wandsnider 1988) may reflect dis-
covery bias owing to differential artifact obtrusiveness, rather than differential use and discard.
Second, concern for the quality of the archaeological document produced through siteless survey as expressed by Doleman (1988a, 1988b) and those using distribu- tional survey techniques (Camilli, Wandsnider, and Ebert 1988; Ebert 1992; Larralde 1990; Wandsnider 1989; Wandsnider and Larralde 1986) is not misplaced, as in- dicated by the results presented here. Indeed, we must
Journal of FieldArchaeology/Vol. 19, 1992 183
conclude that the archaeological documents discussed here are not, at the level of artifact resolution, accurate repre- sentations of the archaeological record they reflect. More- over, the degree of the inaccuracy varies according to surface artifact density. In areas with high artifact density, the artifact size distribution and thus the artifact assem-
blage is probably well-represented by the distributional, two-pass survey procedure. In low artifact density areas, however, the document is less consistent with respect to both spatial configuration and size distribution, and, to a much lesser extent, with respect to tone (and therefore material type) of artifacts.
A more general observation can be made for those site- less survey procedures that incorporate only one survey pass. In these cases, both the low- and high-density dis- tributions are probably biased in a fashion similar to that observed for the low-density case discussed here. That is, large artifacts are probably well represented, but not the smaller artifacts, yielding a document that reflects both distorted density and assemblage composition.
Does this lack of accuracy in the survey document as
produced by currently implemented distributional meth- ods mean that high-intensity survey should not be under- taken? The arguments for high-spatial-resolution siteless and distributional survey are compelling since they are based in theory. To Dunnell and Dancey (1983), such
techniques are the only means for documenting variation in the density of classes of artifacts, which reflect the differential persistence of cultural behaviors in space and time. For others interested in hunter-gatherer and early agricultural adaptations (e.g., Bettinger 1977; Button 1987; Foley 1981a, 1981b, 1981c; Irwin-Williams et al. 1988; Seaman, Doleman, and Chapman 1988a; Thomas 1971, 1973, 1975), only procedures such as these permit the detection of non-residential land use. Similarly for Bintliff and Snodgrass (1985, 1988) and Wilkinson (1989), non-residential activities such as field fertilization can only be perceived through such documentation mea- sures. To those interested in the valid construction of land use histories (e.g., Camilli, Wandsnider, and Ebert 1988; Ebert 1992; Wandsnider 1989), only high-intensity sur-
vey procedures produce the required data. No matter the theoretical prompt, both the low- and high-density ar- chaeological record must be documented. Continued re- finement of accurate and reliable survey methods with the required degree of precision is therefore critical.
Based on results presented here, several suggestions can be made for improving the accuracy of the high-resolution survey document recorded through pedestrian survey. Further decreasing survey transect intervals and pace are obvious solutions. The effect of such measures can be
anticipated by reference to the Seedskadee Unit 28 expe- rience. That is, more of the archaeological record would be documented during the first survey pass and survey results may be less influenced by artifact density. Size bias would probably be reduced but not eliminated by such measures. For Navajo-Hopi survey results graphed in Fig- ure 7C, for example, all lines would terminate at around 90% rather than 65-70%, be more closely grouped, and have a more shallow slope.
Evaluation of these measures and their effect on the
accuracy and reliability of survey results, however, requires an independent assessment of the type afforded only by the seeding programs discussed here. Investigation of dis- covery bias through analysis of discovered artifact char- acteristics yields interesting and useful results, as testified by the above results. In the end, however, such studies are
hampered by the fact that since we do not know the exact composition of the archaeological record that is being measured by the survey procedure, it is difficult to draw conclusions about survey accuracy and reliability from these data alone. We have no guarantee that the composite picture of the artifact distribution, the orange- and red-
flagged artifacts together, accurately represents the archae- ological record. This fact points to the need for further calibration studies. Only through introduction of a control set of artifacts, in which the characteristics of the seeded assemblage are established prior to survey, can assessment of discovery bias take place. This action is not lightly recommended, for it is a costly undertaking and produces results that, owing to the immaturity of such studies, can only be generalized to a certain level. That is, the Seed- skadee and Tonque seeding experiments produced redun- dant results to the extent that in each case the most con- trastive artifacts were discovered in higher proportions as
compared with less contrastive artifacts. The existence of this size-discovery relationship, of course, might be sus- pected even without experimentation. The configuration of this relationship is slightly different between the two cases, however, and only through survey of these "inocu- lated" units could this variation be recognized. At this juncture, it is not known if this difference refers to differ- ences between the two in experimental design or in the characteristics of their individual archaeological records.
A related implication concerns how to report the quality of siteless survey results. Beck and Jones (1989: 260) suggest for artifact coding that artifact classification error be reported along with analysis results. Can a similar pre- cision value be calculated for survey results? Should siteless survey reports contain density estimates accompanied by an error term? Operationally, such measures would have to be based on multiple surveys of the same tract of land.
184 Surface Deposits and Survey/Wandsnider and Camilli
To hold the analytic surface constant, yet eliminate the
possibility of surveyor memory influencing the results, multiple crews with similar levels of expertise would have to survey the same land parcel within a brief time frame.
Alternatively, the same could be approached through a one-time survey of a unit containing a calibration artifact
assemblage of a variety of densities. If we were only interested in artifact density, the quality
of the archaeological document could be communicated via such measures. In that questions requiring data on
spatial structure at multiple scales are today more com-
monly asked, a measure of document quality akin to that used to describe image quality is probably more appro- priate. A possible image-quality analog, for example, is the degree to which the responses of the various channels in a multispectral image either correlate, or fail to corre-
late, with their immediately adjacent neighbors in an ex-
pectable manner. For this reason, we have described the
quality of the distributional documents in terms of rep- resenting well the assemblage and spatial structure of the
higher density and large fraction of the lower density components, but poorly representing the small fraction of
low-density areas. Consequent to this determination, we have tailored analysis of the artifact distributions to ac-
knowledge these varying qualities. At present, however, we have not developed a nomenclature for efficiently re-
porting document quality.
Conclusions Given the interaction between the character of the ar-
chaeological record and the survey methods discussed here and the impact of this interaction on the quality of the
archaeological document, several general statements fol- low. First, prehistoric archaeologists are very fortunate that at least some of the materials used by the peoples they study are stable over the long term. That is, most
chipped stone artifacts, unless they are deliberately de- stroyed, will not oxidize like metal or decay like wood. Some ceramics, such as those above a certain size (e.g., 23 mm is suggested by the Navajo-Hopi data) in the American Southwest, are equally impervious to destruc- tion. This observation has implications for discovery of chipped stone and ceramics. When lithic materials are deliberately reduced through knapping and when ceramic vessels break, they break into multiple smaller, stable pieces. Human actions may leave them where they lie, may aggregate them, as in middens, or may disperse them, as in mulching or fertilizing activities (Bintliff and Snod- grass 1985, 1988; Wilkinson 1989). In the first two cases, obtrusiveness (and hence discoverability) is not dimin-
ished by breakage and in fact may be enhanced. That is, numerous small artifacts may be even more obtrusive than one large artifact. That the archaeological document ap- pears rich in these kinds of deposits should not be sur-
prising, given the results reported here. In the instance of dispersion or in the discard of indi-
vidual small items, such as exhausted tools, cores, or re-
tooling debris during a one-time or short-term use of a
place, artifact obtrusiveness becomes important. Our dis-
covery and documentation of materials that relate to such activities is undoubtedly seriously under-represented.
Second, with regard to archaeological survey conducted within a cultural resource management purview, the re- sults reported here speak to at least one important issue. While it is feasible to set aside small tracts of land as
archaeological preserves (Lipe 1974), it is impossible to do so with vast tracts of land upon which both low- and
high-density archaeological remains may be found. De-
velopment and resource extraction concerns cannot tol- erate it. In part for this reason, only small areas that have
"significance" with respect to specific criteria are set aside.
Typically, these small areas or archaeological sites have
exposed architecture or, relative to the surrounding (and imperfectly perceived) area, high artifact densities.
Survey methods commonly used in the American West reflect this conservation sentiment. As discussed above, survey with an acceptable transect interval of 15 m will
intercept, at most, 6-13% of the members of a low-den-
sity artifact population, but only some of these artifacts will actually be found. When found, the documentation and preservation of this record, in terms of "Isolated
Finds," "Isolated Occurrences," etc., are idiosyncratic, de-
pending on the guidelines of the land management agency and how those guidelines are interpreted by the field ar-
chaeologists. And, when documented, it is likely that this
sample of the low-density record is very biased, because of differential artifact obtrusiveness. At least for the Amer- ican West, we must conclude that the low-density record is not being systematically or accurately documented.
To be sure, the outcry that would be heard from the offices of land managers (not to mention field archaeolo-
gists) if they were compelled to survey their land at a 2 m transect interval and record all artifacts of 1 cm and up would be colossal. But, since the low-density record is not being found and is not being preserved, and since it contains information about how past cultural systems used the landscape that is very different from that found in docu- mented and preserved archaeological sites, some evalua- tion of this record is necessary. Intensive documentation of small portions of the low-density landscape should be undertaken to determine what this record is, how to doc-
Journal ofField Archaeology/Vol. 19, 1992 185
ument it, and what biases are therefore built into tradi-
tionally-collected archaeological documents. Given the tens of millions of federal dollars spent on cultural resource
management in the United States (e.g., Keel, Mc- Manamon, and Smith 1989: 25), for example, even 0.25% of this amount spent on such ventures would be a major contribution (see Sullivan et al. 1988).
Third, the variable nature of the archaeological docu- ment suggests that archaeological analysis of survey results
requires modification. Statements that rely on frequencies of different kinds of artifacts should be warranted with
respect to discovery bias. That is, it would be appropriate to talk about the relative proportions of artifacts in differ- ent attribute states by context. For example, if more bro- ken and reworked, as opposed to whole, projectile points are found in low density, as opposed to high-density, contexts, then this trend probably reflects the actual ar-
chaeological record. If, however, the opposite pattern is found, that broken projectile points occur in high-density site areas while whole projectile points are most often found away from sites, such a pattern may reflect discovery bias related to artifact size.
Finally, comprehensive calibration studies or seeding programs that consider the interactions between artifact size, tone, geometry, and clustering and the effects of this interaction on the accuracy and precision of different sur-
vey procedures are highly desirable. Such programs should also consider the different environments in which survey is conducted as the results presented here suggest. The resources required to carry out such a systematic investi-
gation, however, are not often forthcoming within most
survey projects, where emphasis is often on the size of the area surveyed and where the quality of the survey results are assumed to be "high enough." The cost of such as-
sumptions may be admissible in some, but probably in-
creasingly fewer, contexts. Therefore, until a library of baseline information has been compiled, all siteless surveys should incorporate a calibration component. Such studies could verify the results reported here and establish the effects of other factors (such as that survey is done with a sentient instrument capable of learning and of boredom
[O'Brien et al. 1982], or may be affected by groundcover [Foley 1981 c] or, atmospheric conditions [Camilli, Wandsnider, and Ebert 1988]) on document bias. Results of this and complementary surveys of control assemblages could then provide parameter estimates that would facili- tate study of survey accuracy and precision through com- puter simulation, a less expensive alternative.
Following survey of an area, the resulting archaeological document becomes our version of the reality of the ar- chaeological record for that area. An undiminished capac-
ity for imagination ensures that archaeologists can con- struct equally fascinating interpretations of the past with a document that is either inaccurate and unreliable or one that faithfully represents the archaeological record. To evaluate interpretations such as these, i.e., to practice the science of archaeology, only an archaeological document that is accurate and reliable will suffice. For archaeology to make any claims about its status as a science, it must invest in apparatus, field techniques, and methods that
accurately and reliably document the archaeological rec- ord. This study has endeavored to identify one of those domains where such investment is most critical.
Acknowledgments Patrice A. Teltser, Signa L. Larralde, and George T.
Jones carefully read and provided insightful comments on earlier drafts of this paper, for which we are grateful. We remain responsible for errors in fact or reasoning. The Bureau of Reclamation, the National Park Service, Las Cruces District of the Bureau of Land Management, and the National Science Foundation SBIR program sup- ported the initial data collection that made this analysis possible. Other support was provided by the University of New Mexico Department of Anthropology, the Center for Archaeological Investigations at Southern Illinois Uni-
versity-Carbondale, and the Department of Archaeology, Deccan College.
LuAnn Wandsnider is assistant professor in the Department ofAnthropology, University ofNebraska. Her dissertation re- search involved the low-density archaeological record from the American eastern Great Basin. She is interested in hunter- gatherer remains from arid land contexts and in research on long-term land use. Mailing address: Department ofAnthro- pology, 126 Bessey Hall, University ofNebraska, Lincoln, NE 68588-0368.
Eileen L. Camilli is adjunct assistant professor in the De- partment ofAnthropology, University ofNew Mexico. Her work focuses on interpreting the organization ofpast land use as reflected by regional technological and economic indicators. To this end, her research emphasizes increasing the efficiency and quality ofregional archaeological field procedures. Mail- ing address: Department ofAnthropology, University ofNew Mexico, Albuquerque, NM 87131.
Ammerman, Albert J. 1981 "Surveys and Archaeological Research," Annual Review
ofAnthropology 10: 63-88.
186 Surface Deposits and Survey/Wandsnider and Camilli
Beck, Charlotte, and George T. Jones 1989 "Bias and Archaeological Classification," American An-
tiquity 54: 244-261.
Bernard, H. Russell 1988 Research Methods in Cultural Anthropology. Newberry
Park, CA: Sage Publications.
Bettinger, Robert 1976 The Surface Archaeology of Owens Valley, Eastern Califor-
nia: Prehistoric Man-Land Relationships in the Great Basin. Ph.D. dissertation, University of California, Riverside. Ann Arbor: University Microfilms.
1977 "Aboriginal Human Ecology in Owens Valley: Prehis- toric Change in the Great Basin,"American Antiquity 42: 3-17.
Bintliff, John L., and Anthony M. Snodgrass 1985 "The Cambridge/Bradford Boeotian Expedition: The
First Four Years," Journal of Field Archaeology 12: 123- 161.
1988 "Off-Site Pottery Distributions: A Regional and Interre- gional Perspective," Current Anthrapology 29: 506-513.
Bowers, Peter M., Robson Bonnichsen, and David M. Hoch 1983 "Flake Dispersal Experiments: Noncultural Transforma-
tion of the Archaeological Record," American Antiquity 48: 553-572.
Button, Van Tries 1987 The Closed Basin of Colorado's San Luis Valley: Bureau of
Reclamation Archeological Investigations 1976-86. Amar- illo, TX: U. S. Department of the Interior.
Camilli, Eileen, LuAnn Wandsnider, and James I. Ebert 1987 "Report on the Feasibility of a System for Instrument-
Assisted Distributional Archaeological Survey," unpub- lished report to the NSF Small Business Innovation Re- search Program under Award ISI-8660765.
1988 Distributional Survey and Archeological Landscapes in the Vicinity of El Paso, Texas. Las Cruces: Bureau of Land Management, New Mexico State and Las Cruces District Offices.
Carmines, E., and R. Zeller 1979 Reliability and Validity Assessment. Sage University Papers
17. Beverly Hills: Sage Publications.
Cherry, J. F. 1983 "Frogs Round the Pond: Perspectives on Current Ar-
chaeological Survey Projects in the Mediterranean Re-
gion," in D. R. Keller and D. W. Rupp, eds., Archaeo- logical Survey in the Mediterranean Area. BAR International Series 155. Oxford: B.A.R., 375-416.
1984 "Common Sense in Mediterranean Survey? (Reply to R. Hope-Simpson)," Journal of Field Archaeology 11: 117- 120.
Cowgill, George 1970 "Some Sampling and Reliability Problems in Archaeol-
ogy," in J.-C. Gardin, ed., Archtologie et Calculateurs: Probltmes Simiologiques et Mathimatiques. Paris: Centre National de la Recherche Scientifique, 161-175.
1986 "Archaeological Applications of Mathematical and For- mal Methods," in David J. Meltzer, Don D. Fowler, and
Jeremy A. Sabloff, eds., American Archaeology Past and Future. Washington, D.C.: Smithsonian Institution Press, 369-394.
1989 "Formal Approaches in Archaeology," in C. C. Lamberg- Karlovsky, ed., Archaeological Thought in America. Cam- bridge: Cambridge University Press, 74-88.
1990 "Towards Refining Concepts of Full-Coverage Survey," in Suzanne K. Fish and Stephen A. Kowalewski, eds., TheArchaeology ofRegions. Washington, D.C.: Smithson- ian Institution Press, 249-260.
Dancey, William S. 1973 Prehistoric Land Use and Settlement Patterns in the Priest
Rapids Area, Washington. Ph.D. dissertation, University of Washington, Seattle. Ann Arbor: University Micro- films.
Davis, E. L. 1975 "The 'Exposed Archaeology' of China Lake, California,"
American Antiquity 40: 39-53.
Davis, M. B. 1967 "Pollen Deposition in Lakes as Measured by Sediment
Traps," Geological Society of America Bulletin 78: 849- 858.
1976 "Erosion Rates and Land-Use History in Southern Mich- igan," Environmental Conservation 3: 139-148.
Doleman, William H. 1988a "Calibration of Phase I Data: Problems in Sampling Ar-
chaeological Landscapes," in Timothy J. Seaman, Wil- liam H. Doleman, and Richard C. Chapman, eds., The Border Star 85 Survey: Toward an Archeology of Landscapes. Albuquerque: Office of Contract Archeology, University of New Mexico, 31-62.
1988b "Calibration of Phase I Data: Effective Resolution," in Timothy J. Seaman, William H. Doleman, and Richard C. Chapman, eds., The Border Star 85 Survey: Toward an Archeology ofLandscapes. Albuquerque: Office of Contract Archeology, University of New Mexico, 63-84.
Drager, Dwight, and Arthur K. Ireland, eds. 1986 The Seedskadee Project: Remote Sensing in Non-Site Arche-
ology. Washington, D.C.: U. S. Department of the Inte- rior.
Dunnell, Robert C., and William S. Dancey 1983 "The Siteless Survey: A Regional Scale Data Collection
Strategy," in Michael B. Schiffer, ed., Advances in Ar-
chaeological Method and Theory 6: 267-287.
Ebert, James I. 1992 Distributional Archaeology. Albuquerque: University of
New Mexico Press.
Ebert, James I., Signa Larralde, and LuAnn Wandsnider 1987 "Distributional Archaeology: Survey, Mapping, and
Analysis of Surface Archaeological Materials in the Green River Basin, Wyoming," in Alan J. Osborn and Robert C. Haskell, eds., Perspectives on Archaeological Resources Management in the Great Plains. Omaha: I and O Pub- lishing, 159-178.
Journal of FieldArchaeology/Vol. 19, 1992 187
Fish, Suzanne K., and Stephen A. Kowalewski, eds. 1990 TheArchaeology ofRegions. Washington, D.C.: Smithson-
ian Institution Press.
Foley, Robert 1981a "A Model of Regional Archaeological Structure," Pro-
ceedings of the Prehistoric Society 47: 1-17.
1981b "Off-site Archaeology: An Alternative Approach for the Short-Sited," in I. Hodder, G. Isaac, and N. Hammond, eds., Patterns of the Past: Studies in Honor ofDavid Clarke. Cambridge: Cambridge University Press, 157-183.
1981c Off-site Archaeology and Human Adaptation in Eastern
Africa: Analysis ofRegionalArtifactDensity in theAmboseli, Southern Kenya. Cambridge Monographs in African Ar- chaeology 3. BAR International Series 97. Oxford: B.A.R.
Gallant, T. W. 1986 "'Background Noise' and Site Definition: A Contribu-
tion to Survey Methodology," Journal of FieldArchaeology 13: 403-418.
Grieg-Smith, Peter 1964 Quantitative Plant Ecology, 2nd ed. London: Butter-
worths.
Hope-Simpson, Richard 1983 '"The Limitations of Surface Surveys," in D. R. Keller
and D. W. Rupp, eds., Archaeological Survey in the Med- iterranean Area. BAR International Series 155. Oxford: B.A.R., 45-48.
1984 'The Analysis of Data from Surface Surveys," Journal of Field Archaeology 11: 115-117.
Irwin-Williams, Cynthia, Christopher Pierce, Stephen R. Durand, and Patricia Hicks 1988 'The Density Dependent Method: Measuring the Ar-
cheological Record in the Northern Southwest," in LuAnn Wandsnider and James I. Ebert, eds., Issues in Archeological Surface Survey: Meshing Method and Theory. American Archeology 7: 38-54. Albuquerque, NM: Atechiston Press, Inc.
Judge, W. James 1981 'Transect Sampling in Chaco Canyon-Evaluation of a
Survey Technique," in Alden C. Hayes, David M. Brugge, and W. James Judge, eds., Archaeological Surveys of Chaco Canyon, New Mexico. Washington D.C.: U. S. Department of the Interior, 107-137.
Keel, Bennie C., Francis P. McManamon, and George S. Smith, compilers 1989 Federal Archaeology: The Current Program. Washington,
D.C.: U. S. Department of the Interior.
Larralde, Signa L. 1990 The Des~qn of Hunting Weapons: Archaeological Evidence
from Southwestern Wyoming. Ph.D. dissertation, Univer- sity of New Mexico, Albuquerque. Ann Arbor: Univer- sity Microfilms.
Lewarch, Dennis E., and Michael J. O'Brien 1981 'The Expanding Role of Surface Assemblages in Archae-
ological Research," in Michael B. Schiffer, ed., Advances in Archaeological Method and Theory 4: 297-342.
Lipe, William D. 1974 "A Conservation Model for American Archaeology," The
Kiva 39: 215-245.
Mueller, James W., ed. 1975 Sampling in Archaeology. Tucson: University of Arizona
Press.
Nance, Jack D. 1981 "Statistical Fact and Archaeological Faith: Two Models
in Small-sites Sampling," Journal of Field Archaeology 8: 151-165.
1988 "Reliability, Validity, and Quantitative Methods in Ar- chaeology," in Mark S. Aldenderfer, ed., Quantitative Research in Archaeology. Newbury Park: Sage Publica- tions, 244-293.
O'Brien, Michael J., Roger D. Mason, Dennis E. Lewarch, and James A. Neely 1982 A Late Formative Irrigation Settlement Below Monte Albdn:
Survey and Excavation on the Xoxocotldn Piedmont, Oaxaca, Mexico. Austin: Institute of Latin American Studies, Uni- versity of Texas Press.
Plog, Stephen 1976 "Relative Efficiencies of Sampling Techniques for Ar-
chaeological Surveys," in Kent V. Flannery, ed., The Early Mesoamerican Village. New York: Academic Press, 136- 158.
1986 'The Survey Strategy," in Stephen Plog, ed., Spatial Or- ganization and Exchange-Archaeological Survey on North- ern Black Mesa. Carbondale: Southern Illinois University Press, 33-49.
Plog, S. F., F. Plog, and W. W. Wait 1978 "Decision Making in Modem Surveys," in Michael B.
Schiffer, ed., Advances in Archaeological Method and The- ory 1: 383-421.
Powell, Shirley, Lisa Leat, and Rick Thomas in press "Archaeological Survey Data: How Consistently Do Ar-
chaeologists Record Them?" American Antiquity.
Read, Dwight W. 1986 "Sampling Procedures for Regional Surveys: A Problem
of Representativeness and Effectiveness," Journal of Field Archaeology 13: 477-491.
Raab, L. Mark 1979 'The Impact of Contract Archaeology on Analysis of
Surface Data: Prospects and Problems," in M. J. O'Brien and D. E. Lewarch, eds., Recent Approaches to Surface Data and Sampling. Western Canadian Journal ofAnthro- pology 8: 106-113.
Schiffer, Michael B., and Susan J. Wells 1982 "Archaeological Surveys: Past and Future," in R. H.
McGuire and Michael B. Schiffer, eds., Hohokam and Patayan: Prehistory of Southwestern Arizona. New York: Academic Press, 345-383.
Schiffer, Michael B., Alan P. Sullivan, and Timothy C. Klinger 1978 "The Design of Archaeological Surveys," World Archae-
ology 10: 1-28.
Seaman, Timothy J., William H. Doleman, and Richard C. Chap- man, eds. 1988a The Border Star 85 Survey: Toward an Archeology ofLand-
188 Surface Deposits and Survey/Wandsnider and Camilli
scapes. Albuquerque: Office of Contract Archeology, Uni- versity of New Mexico.
Seaman, Timothy J., William H. Doleman, and Richard C. Chap- man 1988b "Summary and Conclusions," in Timothy J. Seaman,
William H. Doleman, and Richard C. Chapman, eds., The Border Star 85 Survey: Toward an Archeology of Land- scapes. Albuquerque: Office of Contract Archeology, Uni- versity of New Mexico, 137-144.
Sullivan, Alan P., III, Mark A. Calamia, Bruce R. Donaldson, Paul R. Fish, Emily Garber, John A. Hanson, Susanna R. Katz, Carl J. Phagan, and LuAnn Wandsnider 1988 "Landscape Archaeological Research and Cultural Re-
sources Management," in Joseph A. Tainter and R. H. Hamre, eds., Tools to Manage the Past: Research Priorities for Cultural Resources Management in the Southwest. USDA Forest Service General Technical Report RM-164. Fort Collins, 98-108.
Thomas, David H. 1971 Prehistoric Subsistence-Settlement Patterns of the Reese River
Valley, Central Nevada. Ph.D. dissertation, University of California, Davis. Ann Arbor: University Microfilms.
1973 "An Empirical Test of Steward's Model of Great Basin Settlement Patterns," American Antiquity 38: 155-176.
1975 "Nonsite Sampling in Archaeology: Up the Creek with- out a Site?" in James W. Mueller, ed., Sampling in Ar-
chaeology. Tucson: University of Arizona Press, 61-81.
Wandsnider, LuAnn 1988 "Cultural Resources 'Catch-22' and Empirical Justifica-
tion for Discovering and Documenting Low-Density Ar-
cheological Surfaces," in Joseph A. Tainter and R. H. Hamre, eds., Tools to Manage the Past: Research Priorities for Cultural Resources Management in the Southwest. USDA Forest Service General Technical Report RM-164. Fort Collins, 90-97.
1989 Long-term Land Use, Formation Processes, and the Structure of the Archaeological Landscape: A Case Study from South- western Wyoming. Ph.D. dissertation, University of New Mexico, Albuquerque. Ann Arbor: University Micro- films.
Wandsnider, LuAnn, and James I. Ebert 1984 "Accuracy in Archaeological Surface Survey in the Seed-
skadee Project Area, Southwestern Wyoming," Haliksa'i: UNM Contributions to Anthrapology 3: 9-21.
Wandsnider, LuAnn, and Signa Larralde 1986 "Seedskadee Cultural Resources Assessment Project: Re-
port to the Branch of Remote Sensing, National Park Service," in Dwight L. Drager and Arthur K. Ireland, eds., The Seedskadee Project: Remote Sensing in Non-Site Archeology. Washington, D.C.: U. S. Department of the Interior, 151-210.
Whallon, Robert, Jr. 1973 "Spatial Analysis of Occupation Floors I: Application of
Dimensional Analysis of Variance," American Antiquity 38: 320-328.
Wilkinson, T. J. 1989 "Extensive Sherd Scatter and Land-Use Intensity: Some
Recent Results," Journal of FieldArchaeology 16: 31-46.
Zeller, Richard A., and Edward G. Carmines 1980 Measurement in the Social Sciences. London: Cambridge
University Press.