walt duffy, matt metheny, zack larson and kerrie pipal documents... · walt duffy, matt metheny,...
TRANSCRIPT


Overview What DIDSON can do. What DIDSON cannot do. Accuracy and precision.
11/18/2010 2

11/18/2010 3
Need for assessing escapement has become more urgent.◦ Responding to ESA requirements◦ Supporting assessment of restoration and
management. Cost effective methods for estimating
escapement are needed.◦ Redwood Creek alone has 196 km of stream
accessible to anadromous fishes, traditional survey methods for this and other basins are costly.

11/18/2010 4
DIDSON uses high frequency sound to produce near video quality images of objects, fish and anything else.
DIDSON is versatile and relatively easy to use, with training.
Technology is advancing - Blueview technologies is developing software that may allow species separation (http://www.blueview.com).

DIDSON can:◦ Provide 24-hour monitoring of spawning
escapement.◦ Estimate net hourly upstream passage at rates of up
to 7,300 fish/hour.◦ Establish run-timing curves for spawning areas.◦ Measure and record lengths of passing fish.
11/18/2010 5
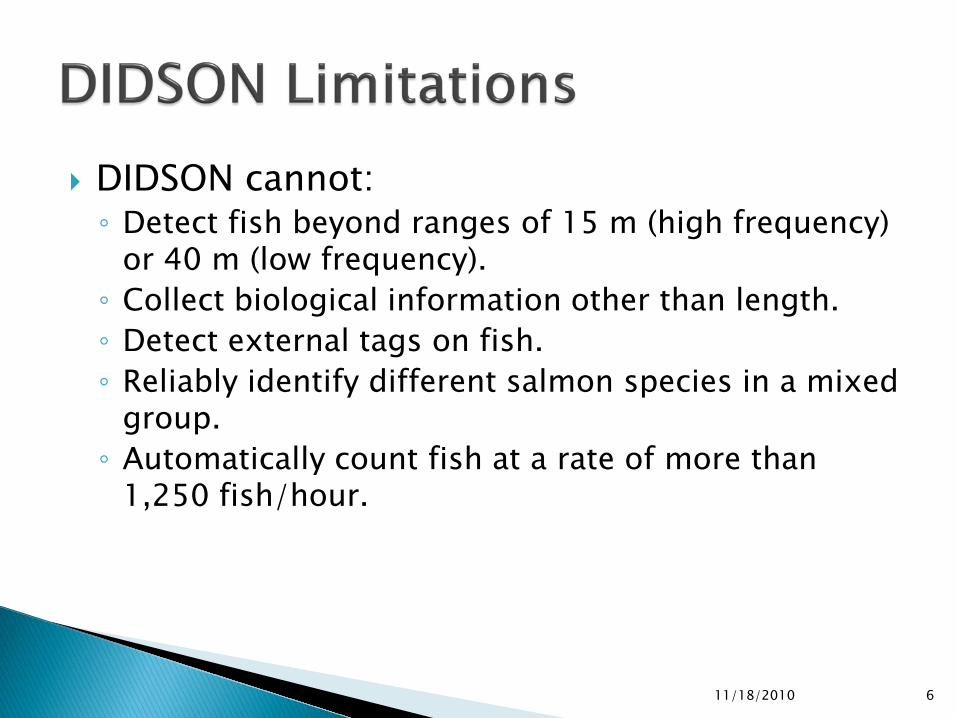
DIDSON cannot:◦ Detect fish beyond ranges of 15 m (high frequency)
or 40 m (low frequency).◦ Collect biological information other than length.◦ Detect external tags on fish.◦ Reliably identify different salmon species in a mixed
group.◦ Automatically count fish at a rate of more than
1,250 fish/hour.
11/18/2010 6

11/18/2010 7
Ln (Tower Count)
Comparison of video and DIDSON counts of migrating sockeye salmon compared with tower counts. Maxwell and Gove (2007) J. Acoust. Soc. Am.122:3364- 3377.

11/18/2010 8
Tower, DIDSON, split-beam and video counts of migrating sockeye salmon at 15 min intervals. Maxwell and Gove (2007) J. Acoust. Soc. Am.122:3364- 3377.

11/18/2010 9
TABLE I. The concordance correlation coefficient CCC and related statistics for sockeye salmon counts in the Wood River made by an observer in a tower paired with counts from the DIDSON, Bendix counter, split-beam sonar, and video.
Comparison CCC 95% LC Precision AccuracyTower—DIDSON 0.994 0.990 0.997 0.998Tower—Bendix 0.967 0.942 0.968 0.999Tower—Split-beam sonar 0.951 0.891 0.966 0.985Tower—Video 0.994 0.989 0.994 1.000
Maxwell and Gove (2007) J. Acoust. Soc. Am.122:3364- 3377.

11/18/2010 10
True Total Length (cm)
50 60 70 80 90 100 110 120 130
DID
SON
Len
gth
(cm
)
60
80
100
120
Size of salmon measured at distances of < 9 m from transducer (solid circles)and salmon measured > 9 m from transducer (open circles).
Burwen, D. L., S. J. Fleischman and J. D. Miller. 2007. AK DFG, Fish Data Series No. 07-44.

Burwen and colleagues concluded:◦ Length measurements of free-swimming fish were
not biased.◦ Reasonably good estimates of fish length can be
extracted from images at distances of< 12 m at high frequency.
Cronkite reported a DIDSON bias ◦ Salmon measured on DIDSON were, on average,
1.6 cm larger than salmon measured at counting fence.
11/18/2010 11

11/18/2010 12