wally was right: predictive ability of the north atlantic
TRANSCRIPT

ANRV309-EA35-09 ARI 19 March 2007 18:4
Wally Was Right: PredictiveAbility of the North Atlantic“Conveyor Belt” Hypothesisfor Abrupt Climate ChangeRichard B. AlleyDepartment of Geosciences and PSICE, Earth and Environmental Systems Institute,Pennsylvania State University, University Park, Pennsylvania 16802;email: [email protected]
Annu. Rev. Earth Planet. Sci. 2007. 35:241–72
First published online as a Review in Advance onFebruary 21, 2007
The Annual Review of Earth and Planetary Sciences isonline at earth.annualreviews.org
This article’s doi:10.1146/annurev.earth.35.081006.131524
Copyright c© 2007 by Annual Reviews.All rights reserved
0084-6597/07/0530-0241$20.00
Key Words
paleoclimatology, ocean circulation, sea ice, Younger Dryas,meridional overturning circulation
AbstractLinked, abrupt changes of North Atlantic deep water formation,North Atlantic sea ice extent, and widespread climate occurred re-peatedly during the last ice age cycle and beyond in response tochanging freshwater fluxes and perhaps other causes. This paradigm,developed and championed especially by W.S. Broecker, has repeat-edly proven to be successfully predictive as well as explanatory withhigh confidence. Much work remains to fully understand what hap-pened and to assess possible implications for the future, but the foun-dations for this work are remarkably solid.
241
Ann
u. R
ev. E
arth
Pla
net.
Sci.
2007
.35:
241-
272.
Dow
nloa
ded
from
ww
w.a
nnua
lrev
iew
s.or
g A
cces
s pr
ovid
ed b
y O
ld D
omin
ion
Uni
vers
ity o
n 04
/23/
18. F
or p
erso
nal u
se o
nly.

ANRV309-EA35-09 ARI 19 March 2007 18:4
INTRODUCTION
The idea of North Atlantic abrupt climate change—freshening of the surface watersleading to a reorganization in oceanic circulation and coupled atmospheric changeswith widespread consequences and often abrupt shifts—is now at least 25 years old(Rooth 1982). This rich field of study has especially been led, championed, publi-cized, and developed into a major paradigm of climate change by Prof. Wallace S.Broecker (e.g., Broecker et al. 1985, 1988, 1989, 1990; Broecker & Denton 1989;Broecker 1994, 1997, 1998). The remarkable success of this research program hasopened new subdisciplines, including the nascent field of abrupt climate change, pro-vided important insights to climate processes, feedbacks, and sensitivity, and capturedpublic as well as scientific attention. Scientific skeptics do still remain (most notablyWunsch 2003, 2005, 2006), providing important impetus for additional research, butBroecker’s North Atlantic/conveyor paradigm has gained widespread acceptance. Forexample, the Broecker papers listed above have been cited more than 2000 times asindexed by ISI, and a brief perusal indicates that at least most of those citations arein general agreement.
Of particular note is the predictive power of Broecker’s paradigm. Far from beingmerely a consistent explanation of previously collected data sets, this hypothesis hasspawned a range of tests that have been borne out, with high confidence. I summa-rize some of these successful predictions after a quick review of terminology. (Thepredictive power also shows the intellectual bankruptcy of those groups, such as theproponents of a 6000-year-old Earth, who deride “historical science” as an oxymoron.)
BESTIARY
The relevant terminology is arcane at best. The summary here may prove useful, butdoes not provide formal definitions.
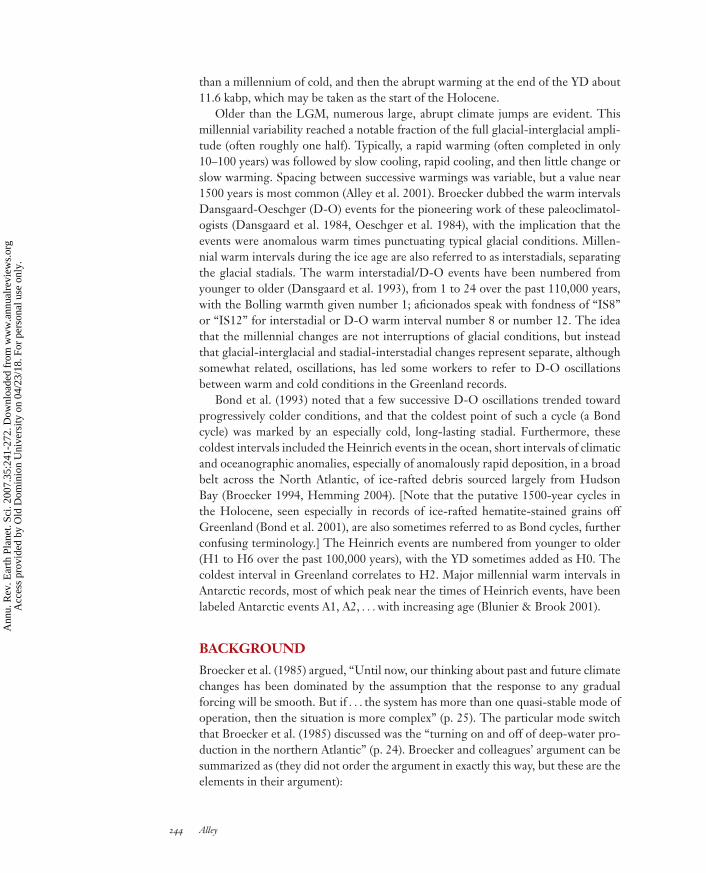
Greenland ice-core records are often used as a type section of millennial climatechange over the last ice age cycle owing to their high time resolution, multiproxy na-ture, and confident paleoclimatic reconstruction. Figure 1 shows the GISP2, centralGreenland record over the past 100,000 years (Grootes & Stuiver 1997).
The broad sweep of the orbitally paced ice age cycle is evident. The warmth ofthe previous interglacial approximately 130,000 years ago is variously called marineisotope stage (MIS) 5e, the Eemian in Europe, or the Sangamonian in North America;Greenland ice of that age and older has been recovered (Suwa et al. 2006), but anintact, ordered record through the complete Eemian has not yet been found, althoughlikely is available given the proper core. The cooling into the most recent ice age(the Weichselian, Wurm, Wisconsinan, Devensian, etc., depending on intellectualor regional heritage) then passed through the cold of MIS 4, the somewhat warmerconditions of stage 3, the last glacial maximum (LGM) in stage 2, and the glacialtermination or deglaciation leading to the warmth of stage 1 or the Holocene.
The abrupt climate changes were especially prominent during times when the iceage cycling reached intermediate temperatures. The youngest generally recognizedabrupt event was the short-lived (roughly one century) cold interval approximately
242 Alley
Ann
u. R
ev. E
arth
Pla
net.
Sci.
2007
.35:
241-
272.
Dow
nloa
ded
from
ww
w.a
nnua
lrev
iew
s.or
g A
cces
s pr
ovid
ed b
y O
ld D
omin
ion
Uni
vers
ity o
n 04
/23/
18. F
or p
erso
nal u
se o
nly.

ANRV309-EA35-09 ARI 19 March 2007 18:4
−60
−50
−40
−30
−20
1
2
34
56
7
8
9
10 13
14
18
1112
15 1617 19 20
21
22
23
Holo-cene
Wisconsinan-Weichselian-Wurm Eem
01
2 34
5
6
MIS1 MIS2 MIS3 MIS4 MIS5
8 YB
L
A7A6
A5
A4A3A2A1
LGM
GISP2
Byrd
Age (kabp)
−420 20 40 60 80 100
−40
−38
−36
−34
−32
δ18O
(p
er m
il)
δ18O
(p
er m
il)
Ice age terms
Marine isotopic stages
Warm D-O events
Occasional terms
Heinrich events
Antarctic warm events
Figure 1Ice-isotopic records (a proxy for temperature, with less-negative values indicating warmerconditions) from GISP2, Greenland (Grootes & Stuiver 1997) and Byrd Station, Antarctica, assynchronized by Blunier & Brook (2001), with various climate-event terminology indicated.Ice age terms are shown in blue (top); the classical Eemian/Sangamonian is slightly older thanshown here, as is the peak of marine isotope stage (MIS, shown in purple) 5, known as 5e.Referring specifically to the GISP2 curve, the warm D-O events or stadial events, asnumbered by Dansgaard et al. (1993), are indicated in red; D-O event 24 is older than shownhere. Occasional terms (L = Little Ice Age, 8 = 8k event, Y = Younger Dryas, B =Bolling-Allerod, and LGM = Last Glacial Maximum) are shown in pink. Heinrich events arenumbered in green just below the GISP2 isotopic curve, as placed by Bond et al. (1993). TheAntarctic warm events A1–A7, as identified by Blunier & Brook (2001), are indicated for theByrd record.
8200 years before present (8.2 kabp, where present is conventionally taken as the year1950, and all ages are given in calendar years), often called the 8k event. The coldesttime of the ice age was approximately 24 kabp (often called the LGM, althoughthat term is also applied to the few millennia from 24 kabp to approximately 19 or17 kabp, and often refers to the time of largest ice). The deglacial warming fromthe LGM to the Holocene was interrupted by the cooling into Heinrich event H1(sometimes called the Oldest Dryas) approximately 16.8 kabp (Hemming 2004), andthe abrupt jump to warmer conditions approximately 14.7 kabp at the start of theBolling-Allerod warmth (which was interrupted by the Older Dryas and the Inter-Allerod Cold Periods). Cooling into the Younger Dryas (YD) followed, giving more
www.annualreviews.org • North Atlantic “Conveyor Belt” Hypothesis 243
Ann
u. R
ev. E
arth
Pla
net.
Sci.
2007
.35:
241-
272.
Dow
nloa
ded
from
ww
w.a
nnua
lrev
iew
s.or
g A
cces
s pr
ovid
ed b
y O
ld D
omin
ion
Uni
vers
ity o
n 04
/23/
18. F
or p
erso
nal u
se o
nly.
ANRV309-EA35-09 ARI 19 March 2007 18:4
than a millennium of cold, and then the abrupt warming at the end of the YD about11.6 kabp, which may be taken as the start of the Holocene.
Older than the LGM, numerous large, abrupt climate jumps are evident. Thismillennial variability reached a notable fraction of the full glacial-interglacial ampli-tude (often roughly one half). Typically, a rapid warming (often completed in only10–100 years) was followed by slow cooling, rapid cooling, and then little change orslow warming. Spacing between successive warmings was variable, but a value near1500 years is most common (Alley et al. 2001). Broecker dubbed the warm intervalsDansgaard-Oeschger (D-O) events for the pioneering work of these paleoclimatol-ogists (Dansgaard et al. 1984, Oeschger et al. 1984), with the implication that theevents were anomalous warm times punctuating typical glacial conditions. Millen-nial warm intervals during the ice age are also referred to as interstadials, separatingthe glacial stadials. The warm interstadial/D-O events have been numbered fromyounger to older (Dansgaard et al. 1993), from 1 to 24 over the past 110,000 years,with the Bolling warmth given number 1; aficionados speak with fondness of “IS8”or “IS12” for interstadial or D-O warm interval number 8 or number 12. The ideathat the millennial changes are not interruptions of glacial conditions, but insteadthat glacial-interglacial and stadial-interstadial changes represent separate, althoughsomewhat related, oscillations, has led some workers to refer to D-O oscillationsbetween warm and cold conditions in the Greenland records.
Bond et al. (1993) noted that a few successive D-O oscillations trended towardprogressively colder conditions, and that the coldest point of such a cycle (a Bondcycle) was marked by an especially cold, long-lasting stadial. Furthermore, thesecoldest intervals included the Heinrich events in the ocean, short intervals of climaticand oceanographic anomalies, especially of anomalously rapid deposition, in a broadbelt across the North Atlantic, of ice-rafted debris sourced largely from HudsonBay (Broecker 1994, Hemming 2004). [Note that the putative 1500-year cycles inthe Holocene, seen especially in records of ice-rafted hematite-stained grains offGreenland (Bond et al. 2001), are also sometimes referred to as Bond cycles, furtherconfusing terminology.] The Heinrich events are numbered from younger to older(H1 to H6 over the past 100,000 years), with the YD sometimes added as H0. Thecoldest interval in Greenland correlates to H2. Major millennial warm intervals inAntarctic records, most of which peak near the times of Heinrich events, have beenlabeled Antarctic events A1, A2, . . . with increasing age (Blunier & Brook 2001).
BACKGROUND
Broecker et al. (1985) argued, “Until now, our thinking about past and future climatechanges has been dominated by the assumption that the response to any gradualforcing will be smooth. But if . . . the system has more than one quasi-stable mode ofoperation, then the situation is more complex” (p. 25). The particular mode switchthat Broecker et al. (1985) discussed was the “turning on and off of deep-water pro-duction in the northern Atlantic” (p. 24). Broecker and colleagues’ argument can besummarized as (they did not order the argument in exactly this way, but these are theelements in their argument):
244 Alley
Ann
u. R
ev. E
arth
Pla
net.
Sci.
2007
.35:
241-
272.
Dow
nloa
ded
from
ww
w.a
nnua
lrev
iew
s.or
g A
cces
s pr
ovid
ed b
y O
ld D
omin
ion
Uni
vers
ity o
n 04
/23/
18. F
or p
erso
nal u
se o
nly.

ANRV309-EA35-09 ARI 19 March 2007 18:4
(a) Greenland ice-core data show many millennial climate events that began andended abruptly (Oeschger et al. 1984, Dansgaard et al. 1984), each involvingcoupled shifts between near-glacial and near-interglacial values in many pale-oclimate proxies, which argues against a purely local or minor explanation ofthe features.
(b) The most recent major oscillation in the ice-core records seems to matchthe well-known European pattern of warming into the Allerod (now typicallytermed the Bolling/Allerod), cooling into the Younger Dryas, and warming intothe Holocene, confirming and extending the ice-core data.
(c) The climate anomaly pattern of the oscillation is consistent with expectationsfor response to changing sea-surface temperatures in the northern Atlantic.
(d) Knowledge of ocean circulation patterns shows the possibility of deep wateron/off mode switches (Stommel 1961, Rooth 1982), in response to interactionbetween freshwater storage/release by ice sheets and salt export by deep wa-ter formation in the northern Atlantic, affecting northern Atlantic sea-surfacetemperatures.
(e) Available data show that changes in ocean circulation occurred.
Broecker et al. stated, “Despite the tenuous nature of the information presentlyavailable and of the difficulties inherent in thinking in terms of mode changes, wemust begin to explore this alternate track” (p. 25).
Twenty years later, the data and models available are much stronger, and the ar-guments have been extended and sharpened in many ways, but Broecker et al.’s basicpicture remains accurate: Abrupt climate changes happened, their large geographicalextent is confirmed by Greenland ice-core data and by geographically widespreadrecords, the pattern closely matches that modeled for North Atlantic causes, andmodels and data agree on the involvement of the meridional overturning circulation[MOC; also, loosely, the conveyor-belt circulation or the thermohaline circulation(THC); see Wunsch 2002 on terminology linked to physical processes]. The hypoth-esis has led to successful predictions in these areas, which have been confirmed bynew observations or models.
THE ICE-CORE DATA
Data from Greenland ice cores (e.g., Dansgaard et al. 1993, Cuffey & Clow 1997,Grootes & Stuiver 1997, Johnsen et al. 2001) clearly show the orbitally modulatedice age cycles and abrupt suborbital or millennial variability. Steps in gas-isotopicfractionation, and their locations relative to changes in other ice-core indicators, showwith high confidence that large temperature changes accompanied large changes inthe oxygen- and hydrogen-isotopic ratios of the ice (Severinghaus et al. 1998, 2004;also see Alley 2000).
Most indicators in the ice cores correlate closely with the ice-isotopic changes(Mayewski et al. 1997). In comparison to the millennial warm times (the D-O events),the ice from millennial cold times has more sea-salt (likely indicating wind-blown“frost flowers” from newly formed sea ice; Rankin et al. 2004) and dust (likely fromAsia; Biscaye et al. 1997). Neither the sea salt nor the dust have important sources
www.annualreviews.org • North Atlantic “Conveyor Belt” Hypothesis 245
Ann
u. R
ev. E
arth
Pla
net.
Sci.
2007
.35:
241-
272.
Dow
nloa
ded
from
ww
w.a
nnua
lrev
iew
s.or
g A
cces
s pr
ovid
ed b
y O
ld D
omin
ion
Uni
vers
ity o
n 04
/23/
18. F
or p
erso
nal u
se o
nly.
ANRV309-EA35-09 ARI 19 March 2007 18:4
in Greenland, and the higher concentrations in the ice formed during colder timescannot be explained by reduced dilution owing to reduced snow accumulation rate(Alley et al. 1995). For the dust, attempts to explain the large (to order-of-magnitude)changes have required source changes; consistent explanations involving subtle shiftsin wind-fields (Wunsch 2006) have not been found (Fuhrer et al. 1999). Deuteriumexcess of the ice is usually argued to reflect primarily evaporation rate at the mois-ture source, with Greenland data interpreted as indicating more southerly moisturesources in colder millennial intervals (Masson-Delmotte et al. 2005).
Of particular importance are the Greenland records of methane (CH4) (Supple-mental Figure 1, follow the Supplemental Material link from the Annual Reviewshome page at http://www.annualreviews.org) and nitrous oxide (N2O). The con-centrations of these gases began rising when abrupt warming occurred in Greenlandand fell with Greenland cooling (Chappellaz et al. 1993, Severinghaus et al. 1998,Brook et al. 2000, Sowers et al. 2003, Fluckiger et al. 2004). CH4 changed with all ofthe major Greenland millennial climate shifts (although amplitudes of changes weremodulated orbitally), and N2O changes have been found with all of the Greenlandmillennial shifts for which detailed data are available (see Supplemental Material).
CH4 and N2O are globally mixed, with widely distributed sources and no dominantlocalized sources. Although atmospheric sinks may have changed, large concentra-tion changes are interpreted to require notable source changes (e.g., Chappellaz et al.1993, Sowers et al. 2003). Preanthropogenic CH4 sources were dominantly terrestrialwetlands, with important terrestrial and oceanic sources for N2O. Terrestrial N2Oproduction is typically from wet soils not as saturated as for optimal CH4 production;thus, CH4 and N2O sources are not exactly colocated in space and time. The oxygen-and nitrogen-isotopic data from Sowers et al. (2003) are most parsimoniously in-terpreted as indicating parallel changes in both terrestrial and marine N2O sourcesduring N2O shifts. Deuterium-isotopic CH4 data across the deglacial abrupt oscil-lations exclude the hypothesis of important contributions to concentration increasesfrom sea-bed CH4 (Sowers 2006).
With atmospheric-concentration changes as large as 50% associated with theD-O oscillations, the distributed sources of CH4 and N2O require involvement oftrace-gas sources across large regions of the globe. CH4 and terrestrial N2O sourcesrequire wetlands. During warm D-O events, expanded or more-productive wetlandsare indicated, perhaps with reduced oceanic ventilation or enhanced organic-matterflux promoting N2O from denitrification in low-oxygen regions (Sowers et al. 2003).
Balance calculations for CH4 require tropical sources to supplement high-northern-latitude production, especially during cold times when ice cover reducednorthern sources (Chappellaz et al. 1993, Smith et al. 2004). This inference is sup-ported by reconstructions of interhemispheric gradients in CH4. Because the tropo-spheric lifetime of CH4 is not too much longer than the interhemispheric mixingtime, an increase in northern CH4 sources will raise concentrations in Greenlandmore than in Antarctica, whereas an increase in tropical CH4 sources will have amore hemispherically symmetric impact. Brook et al. (2000) found that the rise inCH4 at the onset of the Bolling-Allerod and the rise at the termination of the YD
246 Alley
Ann
u. R
ev. E
arth
Pla
net.
Sci.
2007
.35:
241-
272.
Dow
nloa
ded
from
ww
w.a
nnua
lrev
iew
s.or
g A
cces
s pr
ovid
ed b
y O
ld D
omin
ion
Uni
vers
ity o
n 04
/23/
18. F
or p
erso
nal u
se o
nly.
ANRV309-EA35-09 ARI 19 March 2007 18:4
were driven by increases in tropical as well as boreal sources, with boreal sources lessimportant during the YD than during the warm Holocene that followed.
There is still much work to do, but ice cores show that large, abrupt shifts oc-curred repeatedly, affecting Greenland temperature and snow accumulation (Alleyet al. 1993b), and also likely seasonality, as described below, and moisture-source lo-cations, etc. These were accompanied by sufficiently large climate changes beyondGreenland to cause factor-of-several changes in delivery of wind-blown materials,likely involving source changes, and to cause major changes in wetlands and probablymarine conditions extending across broad areas of Earth’s surface, including tropicalregions. These changes occurred before as well as after the last glacial maximum.Thus, the first point in the Broecker et al. (1985) argument, that Greenland ice-coredata show the existence of abrupt climate changes affecting broad regions, has beenconfirmed very strongly, with much of the confirmation involving measurements ofpaleoclimatic indicators that have been developed since 1985 on samples that havebeen collected since 1985.
CORRELATED CLIMATE-ANOMALY PATTERNS
Dating uncertainties of paleoclimatic records typically preclude confident construc-tion of absolutely dated climate-anomaly maps for the 8k and older millennial events,except for the sequence of events from H1 through the end of the YD. However,absolutely dated climate anomalies for this sequence (and especially for the YD) frommany sites agree with the ice-core records, including cool, dry anomalies in sourceregions of CH4 and Asian dust when Greenland ice showed cool, dusty, low-CH4
anomalies. Other millennial climate anomalies in the Greenland ice cores have thesame signature, and, within the dating uncertainties, widespread sites show correlativeevents akin to the YD.
Looking first at the YD, Broecker et al. (1985) noted the similarity in age, duration,and sign of climate anomalies in Greenland ice-core records and in widespread pollenrecords primarily from Europe. Much subsequent work, especially by D. Peteet [Pe-teet 1995a,b; Alley et al. 1993a (organized by Peteet but authored alphabetically)]summarized this effort through the mid-1990s. Recent studies, including Hughenet al. (1998), Wang et al. (2001), Shuman et al. (2002), and Vacco et al. (2005), haveclarified the picture further. The YD is seen to have been a cold event across much ofthe Northern Hemisphere, but especially centered on the northeastern Atlantic, withanomalously dry conditions in broad monsoonal regions of Africa and Asia, tropicalatmospheric circulation shifted southward especially in the Americas, and southernwarmth.
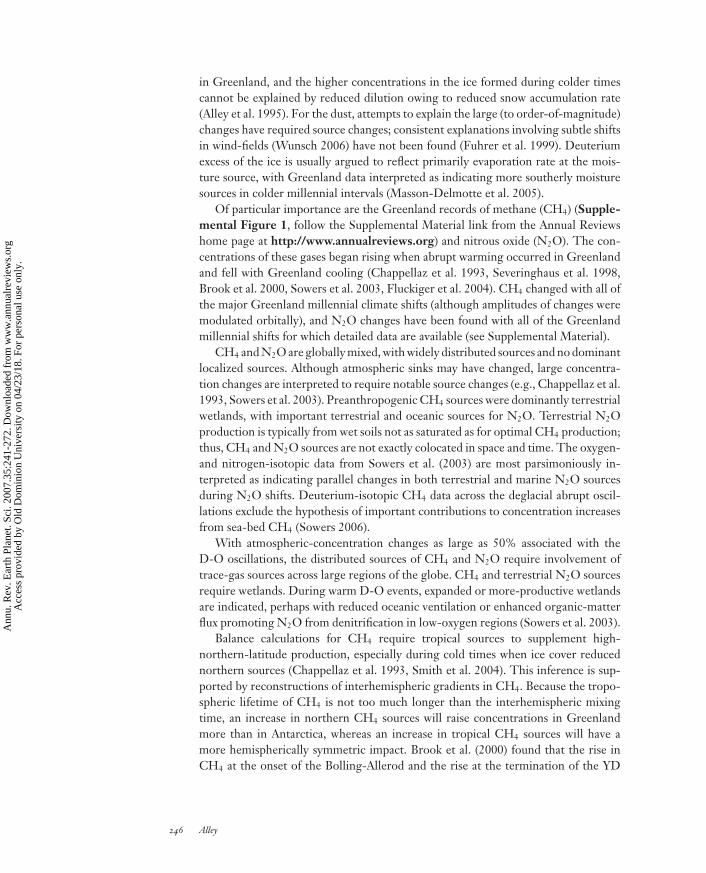
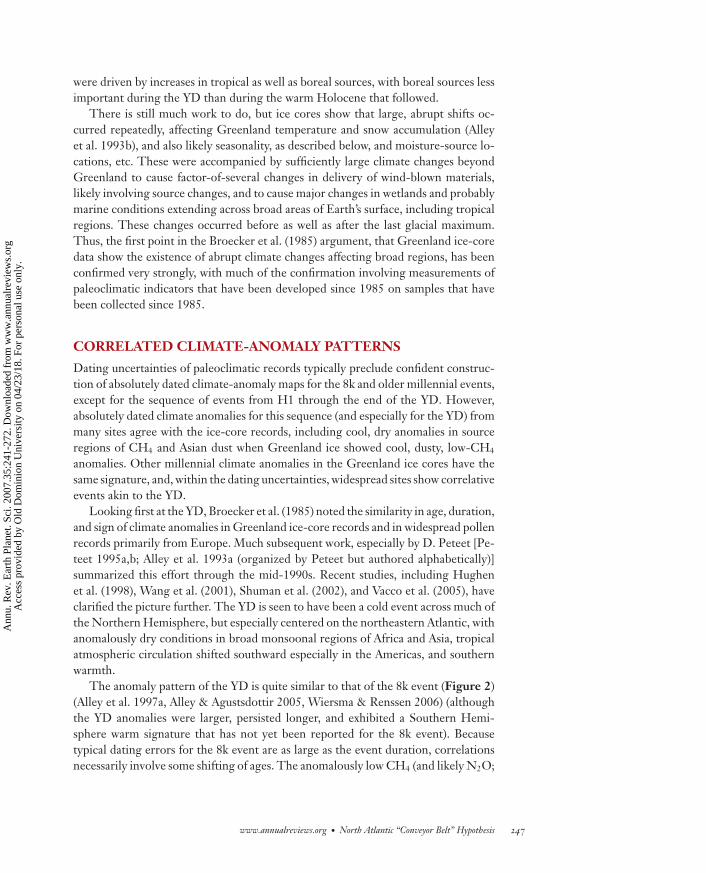
The anomaly pattern of the YD is quite similar to that of the 8k event (Figure 2)(Alley et al. 1997a, Alley & Agustsdottir 2005, Wiersma & Renssen 2006) (althoughthe YD anomalies were larger, persisted longer, and exhibited a Southern Hemi-sphere warm signature that has not yet been reported for the 8k event). Becausetypical dating errors for the 8k event are as large as the event duration, correlationsnecessarily involve some shifting of ages. The anomalously low CH4 (and likely N2O;
www.annualreviews.org • North Atlantic “Conveyor Belt” Hypothesis 247
Ann
u. R
ev. E
arth
Pla
net.
Sci.
2007
.35:
241-
272.
Dow
nloa
ded
from
ww
w.a
nnua
lrev
iew
s.or
g A
cces
s pr
ovid
ed b
y O
ld D
omin
ion
Uni
vers
ity o
n 04
/23/
18. F
or p
erso
nal u
se o
nly.
ANRV309-EA35-09 ARI 19 March 2007 18:4
Figure 2Simulated response to large freshwater forcing simulating the 8k event, modified fromLeGrande et al. (2006). The NASA Goddard Institute for Space Studies (GISS) ModelE wasused, with preindustrial boundary conditions and with freshwater addition simulated toHudson Bay. Averages are given for five simulations using realistic forcings similar to thosereconstructed for the event (2.5 and 5 Sv year of melt water over 0.5 or 1 year). Decadal-meansurface-air-temperature anomalies (◦C) (panel a) and precipitation changes (mm/day) (panel b)are shown. See LeGrande et al. (2006) for the methodology of extracting the short-livedanomalies. The ensemble showed a 40% reduction in MOC from the freshwater input. Alsoshown is a summary map of climate anomalies, from Alley & Agustsdottir (2005). Panels a andb copyright 1993–2005 by The National Academy of Sciences of the United States of America.
248 Alley
Ann
u. R
ev. E
arth
Pla
net.
Sci.
2007
.35:
241-
272.
Dow
nloa
ded
from
ww
w.a
nnua
lrev
iew
s.or
g A
cces
s pr
ovid
ed b
y O
ld D
omin
ion
Uni
vers
ity o
n 04
/23/
18. F
or p
erso
nal u
se o
nly.

ANRV309-EA35-09 ARI 19 March 2007 18:4
Fluckiger et al. 2002) concentrations at this time support correlations to features ofappropriate duration.
Older, short-lived events also can have absolute dating errors as large as event dura-tions, and caution in correlation is warranted (Wunsch 2003). When possible, workers(e.g., Wang et al. 2001, 2004; Sinha et al. 2005) test correlations in the younger partof the record for which absolute dating is sufficiently reliable, followed by matchingof older events using magnitude, pattern, and duration. Again, the knowledge fromthe ice-core records that each event did have a geographically widespread impactincreases confidence in the correlations.
Voelker (2002) developed a database of 183 paleoclimatic records from MIS 3(taken by them as 59–29 kabp). Sites included marine, terrestrial, and ice archives,spread across the globe, but were especially concentrated in the north and in theocean. An assessment of whether D-O-like oscillations were present was providedfor over half of those sites, yielding “yes” in 78 cases, “no” in 12, and a range of otherinterpretations for an additional 24 (including 15 “possibly,” some that showed Hevents but not other D-O oscillations, etc.). The anomaly patterns obtained closelymatch those for the YD and 8k events.
Of particular interest here is the see-saw pattern between the northern and highsouthern latitudes. Broecker et al. (1985) concentrated on the northern hemisphere.However, Crowley (1992) and Stocker et al. (1992a, with coauthor Broecker 1992b)suggested that, because cross-equatorial flow feeds MOC deep-water sinking in thenorthern Atlantic, a reduction in that sinking would warm the south while coolingthe north in a bipolar see-saw (Broecker 1998, Stocker 1998).
Tests of this hypothesis have been provided by correlation of the millennial bandsof northern and southern climate records to assess coherency and phasing. Remark-ably, amid the numerous climate signals, the predicted see-saw is observed with highconfidence. The isotopic ratios of ice from Greenland (GISP2, GRIP, NGRIP) andAntarctic (Vostok, Byrd) ice cores have especially been used as climate indicators(Alley & Cuffey 2001), with relative age established using well-mixed atmospherictracers [isotopic composition of oxygen (Bender et al. 1994), CH4 concentration(Stocker 2000, Blunier & Brook 2001)].
Significant conherency was found by Steig & Alley (2002), Hinnov et al. (2002),Schmittner et al. (2003; see discussion by Huybers 2004 and Schmittner et al. 2004),Knutti et al. (2004), and Roe & Steig (2004), among others, focusing especially onthe 10–90 kabp interval in Greenland and Byrd records (Figure 1; Supplemen-tal Figure 2). Significance levels for the correlations include >99% for stage 3 byKnutti et al. (2004), and 95% for Hinnov et al. (2002) arising primarily from the 10–50 kabp time interval. (Note that Roe & Steig found most coherency in the 50–80 kabp interval with little coherency in the 20–50 kabp interval. Note also thatslight differences in the analyses, such as the inclusion or exclusion of the strongdeglacial signal from 10–20 kabp in a particular window, can explain much of thedivergence between the results.)
Although Wunsch (2003) failed to find significant coherency at millennial fre-quencies, his exploratory data analysis was not optimized to do so because it split themillennial band, lumping any see-saw oscillations slower than 2500 years with the
www.annualreviews.org • North Atlantic “Conveyor Belt” Hypothesis 249
Ann
u. R
ev. E
arth
Pla
net.
Sci.
2007
.35:
241-
272.
Dow
nloa
ded
from
ww
w.a
nnua
lrev
iew
s.or
g A
cces
s pr
ovid
ed b
y O
ld D
omin
ion
Uni
vers
ity o
n 04
/23/
18. F
or p
erso
nal u
se o
nly.

ANRV309-EA35-09 ARI 19 March 2007 18:4
globally in-phase response to ice age variations of greenhouse gases, and combiningthe rest of the millennial band with noise (both climatic and proxy, e.g., Benoist et al.1982, White et al. 1997), and with high-frequency processes (solar variations, vol-canic eruptions) that may be in-phase between the poles (Supplemental Figure 2)and that would not be reliably synchronized by the relative-dating procedure. Evenso, Wunsch (2003) noted that in his analysis, up to 15% of the variance may be incommon between northern and southern records. Roe & Steig (2004) found that thesignificant coherence between northern (GISP2) and southern (Byrd) records leftmost of the variance of both records unexplained. In view of the many influences onclimate and ice-core records, significant coherence and not the fraction of varianceexplained is the more appropriate test of Broecker and colleagues’ hypothesis.
Within this coherent millennial variability, Steig & Alley (2002) found correlationpeaks for a northern lead of a few centuries, antiphased, or a southern lead of morethan a millennium in-phase. Hinnov et al. (2002) found a southern lead of just under400 years, but noted that this likely arose from the application of spectral tools torecords with very different shapes (abrupt warmings in the north versus gradualwarmings in the south), and argued for a synchronous antiphased signal between thehemispheres. Schmittner et al. (2003, 2004) found a northern lead of 400–500 years,antiphased, arguing that a secondary in-phase southern lead arose from the somewhatperiodic nature of the signals. Although Huybers (2004) favored a southern lead forthe antiphased behavior, he could not reject synchronous or northern-lead results asfound in the other studies.
Perhaps of greatest importance in the discussion here, modeling efforts, includingthose by Stocker (2000), Ganopolski & Rahmstorf (2001), Stocker & Johnsen (2003),Schmittner et al. (2003), and Knutti et al. (2004), showed that the bipolar ice-coresignals are reproduced with considerable accuracy by models forced with northernfreshening activating a (modified) bipolar see-saw. The delay in full achievement ofsouthern warming associated with oceanic timescales, and especially the heat capacityof the southern ocean, is increasingly viewed as important in explaining the differentshapes of the northern and southern records (Stocker & Johnsen 2003), as well as thefailure of the very short-lived 8k event to be observed clearly in records of southernclimate.
The observational evidence for a (modified) see-saw is not limited to ice-coredata by any means (e.g., Charles et al. 1996, Lamy et al. 2004, Lynch-Stieglitz 2004,Pahnke & Zahn 2001). As reviewed by Alley & Clark (1999) and Clark et al. (2002),among others, a global multiproxy data set covering the deglaciation can be describedas a globally (near) synchronous ice age cycle plus a north-south millennial see-saw.
For example, the advance of the Franz Josef Glacier, New Zealand, to its prominentlate-glacial moraine (the Waiho Loop) falls just before the onset of the YD (Denton& Hendy 1994), and likely is close to the time of warming-induced retreat fromthe moraine (Anderson & Mackintosh 2006). Hajdas et al. (2006) similarly indicatedan Antarctic-like (anti-Greenland) record for New Zealand climate across the YDinterval, based on a redated bog record (also see Turney et al. 2003). The evidencefrom the southern mid-latitudes includes some disagreements (e.g., Ivy-Ochs et al.1999). However, available evidence increasingly indicates a millennial seesaw pivoting
250 Alley
Ann
u. R
ev. E
arth
Pla
net.
Sci.
2007
.35:
241-
272.
Dow
nloa
ded
from
ww
w.a
nnua
lrev
iew
s.or
g A
cces
s pr
ovid
ed b
y O
ld D
omin
ion
Uni
vers
ity o
n 04
/23/
18. F
or p
erso
nal u
se o
nly.
ANRV309-EA35-09 ARI 19 March 2007 18:4
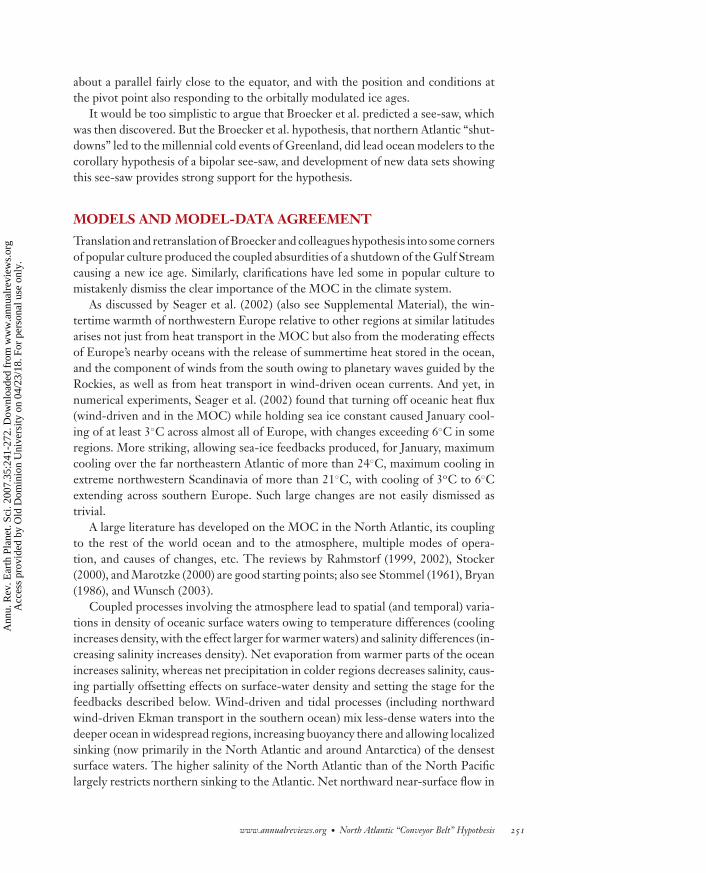
about a parallel fairly close to the equator, and with the position and conditions atthe pivot point also responding to the orbitally modulated ice ages.
It would be too simplistic to argue that Broecker et al. predicted a see-saw, whichwas then discovered. But the Broecker et al. hypothesis, that northern Atlantic “shut-downs” led to the millennial cold events of Greenland, did lead ocean modelers to thecorollary hypothesis of a bipolar see-saw, and development of new data sets showingthis see-saw provides strong support for the hypothesis.
MODELS AND MODEL-DATA AGREEMENT
Translation and retranslation of Broecker and colleagues hypothesis into some cornersof popular culture produced the coupled absurdities of a shutdown of the Gulf Streamcausing a new ice age. Similarly, clarifications have led some in popular culture tomistakenly dismiss the clear importance of the MOC in the climate system.
As discussed by Seager et al. (2002) (also see Supplemental Material), the win-tertime warmth of northwestern Europe relative to other regions at similar latitudesarises not just from heat transport in the MOC but also from the moderating effectsof Europe’s nearby oceans with the release of summertime heat stored in the ocean,and the component of winds from the south owing to planetary waves guided by theRockies, as well as from heat transport in wind-driven ocean currents. And yet, innumerical experiments, Seager et al. (2002) found that turning off oceanic heat flux(wind-driven and in the MOC) while holding sea ice constant caused January cool-ing of at least 3◦C across almost all of Europe, with changes exceeding 6◦C in someregions. More striking, allowing sea-ice feedbacks produced, for January, maximumcooling over the far northeastern Atlantic of more than 24◦C, maximum cooling inextreme northwestern Scandinavia of more than 21◦C, with cooling of 3oC to 6◦Cextending across southern Europe. Such large changes are not easily dismissed astrivial.
A large literature has developed on the MOC in the North Atlantic, its couplingto the rest of the world ocean and to the atmosphere, multiple modes of opera-tion, and causes of changes, etc. The reviews by Rahmstorf (1999, 2002), Stocker(2000), and Marotzke (2000) are good starting points; also see Stommel (1961), Bryan(1986), and Wunsch (2003).
Coupled processes involving the atmosphere lead to spatial (and temporal) varia-tions in density of oceanic surface waters owing to temperature differences (coolingincreases density, with the effect larger for warmer waters) and salinity differences (in-creasing salinity increases density). Net evaporation from warmer parts of the oceanincreases salinity, whereas net precipitation in colder regions decreases salinity, caus-ing partially offsetting effects on surface-water density and setting the stage for thefeedbacks described below. Wind-driven and tidal processes (including northwardwind-driven Ekman transport in the southern ocean) mix less-dense waters into thedeeper ocean in widespread regions, increasing buoyancy there and allowing localizedsinking (now primarily in the North Atlantic and around Antarctica) of the densestsurface waters. The higher salinity of the North Atlantic than of the North Pacificlargely restricts northern sinking to the Atlantic. Net northward near-surface flow in
www.annualreviews.org • North Atlantic “Conveyor Belt” Hypothesis 251
Ann
u. R
ev. E
arth
Pla
net.
Sci.
2007
.35:
241-
272.
Dow
nloa
ded
from
ww
w.a
nnua
lrev
iew
s.or
g A
cces
s pr
ovid
ed b
y O
ld D
omin
ion
Uni
vers
ity o
n 04
/23/
18. F
or p
erso
nal u
se o
nly.

ANRV309-EA35-09 ARI 19 March 2007 18:4
the narrow Atlantic basin is one result, with deep return flow perhaps the definingfeature of the MOC. At present, northern and southern sinking fluxes are of similarmagnitude.
The possibility of two or more modes of oceanic circulation has been knownfor more than a century (Stocker 2000). With appropriate boundary conditions andparameter choices, models can yield circulations including from pole to equator ordominated by sinking in the southern ocean or in the North Pacific. Its small sizemakes the North Atlantic more easily modified than other key regions that mightparticipate in mode-switches of the ocean. Furthermore, the largest ice-age changesin topography and fresh-water fluxes were in the North Atlantic basin, which thus hasbeen forced more strongly than other key areas. One must entertain the possibility thatchanges elsewhere propagated into and affected the North Atlantic (e.g., Weaver et al.2003), but the primary role of North Atlantic forcing as well as response seems likely.
In models that are not too highly diffusive, the circulation pattern can exhibithysteresis (Supplemental Figure 3), which often is discussed relative to freshwatersupply to the surface of the North Atlantic. For sufficiently small supply, the totalwater flux in the MOC is large. Increasing freshwater supply typically reduces theMOC flux slightly and reversibly, with balance achieved by slower export of fresherwaters. However, if a threshold freshwater supply is crossed, the MOC flux dropsgreatly. Subsequently decreasing the surface freshwater supply slightly below thatthreshold gives only a slight MOC increase, and a second, lower threshold must becrossed to restore the initial MOC flux.
Two interrelated feedbacks are especially implicated in the North Atlantic changes:advective and convective (Bryan 1986, Rahmstorf & Willebrand 1995). In the large-region advective feedback, a stronger MOC flow transports more high-salinitytropical waters to the high northern latitudes, giving higher densities there dur-ing wintertime cooling and therefore favoring stronger MOC flow. Some of theAtlantic-Pacific salinity difference is related to such processes; if there were strongNorth Pacific sinking and deep export, the surface of the North Pacific would besaltier. If a small anomalous freshwater flux is added to the northward flowing watersof a vigorous MOC, the overturning flux will be reduced slightly. Because precipita-tion exceeds evaporation in the high-latitude ocean, reduction in the MOC flux willallow further freshening in a positive feedback. The MOC (together with wind-drivencirculation, when included in models) typically can remove the freshwater supply andremain active up to some threshold but not beyond. If such a threshold freshwatersupply exists in a model and is exceeded, continuing accumulation of freshwater in thenorthern Atlantic as the MOC slows will eventually reduce the MOC to near zero.The timescale for “collapse” of the MOC under possible freshwater perturbations(such as might be associated with global warming) is often found to be on the orderof a century, the time for the ongoing supply to freshen the northern Atlantic incompetition with the slowing but still-active export of freshwater in the MOC. Thisadvective feedback is viewed as affecting the whole MOC, hence involving fresheningor salinification of the entire northward-flowing surface branch of the MOC.
The convective feedback is more local. Wintertime sinking in high-latitude seasinvolves a host of local processes (e.g., Marshall & Schott 1999). A fairly shallow layer
252 Alley
Ann
u. R
ev. E
arth
Pla
net.
Sci.
2007
.35:
241-
272.
Dow
nloa
ded
from
ww
w.a
nnua
lrev
iew
s.or
g A
cces
s pr
ovid
ed b
y O
ld D
omin
ion
Uni
vers
ity o
n 04
/23/
18. F
or p
erso
nal u
se o
nly.

ANRV309-EA35-09 ARI 19 March 2007 18:4
of sufficiently fresh water can interfere with the sinking of surface waters, locallystopping convection. Convection might still persist elsewhere, in response to more-favorable local conditions there and depending on the broader conditions of theMOC. However, were sufficient fresh water supplied rapidly to “cap” the entireNorth Atlantic by freshening the near-surface layer, a “halocline catastrophe” mightoccur and suppress sinking in widespread regions (Rahmstorf & Willebrand 1995).(As an imperfect analogy, a conveyor belt at a grocery store might be stopped by thewidespread process of loading on too many weighty items, or by the local process ofwedging a screwdriver where the belt goes down.)
The reader should also recall that, despite the relatively greater influence of salinityon water density at lower temperatures, density does still depend on temperature, andcoupled temperature feedbacks or direct temperature forcing can be important. (Alsonote that Nilsson & Walin (2001) and subsequent papers include the possibility thatnorthern freshening could increase overturning circulation, as well as decrease it, ifthe vertical mixing coefficient is a function of vertical density stratification. However,this is from a steady-state one-basin equator-to-pole rather than pole-to-pole model,and it does not seem to offset the great volume of literature, typically consideringmore-realistic or more-relevant settings, indicating that North Atlantic fresheningwould tend to decrease sinking there.)
There have been dozens, and probably hundreds, of studies of modes of oceancirculation, response of ocean circulation to freshwater or temperature forcing, hys-teresis in the MOC strength, and related topics. Models have ranged from the simplestbox models to fully coupled general circulation models. Background climates haveincluded full-glacial conditions and preanthropogenic, modern, and future green-house. Simulated forcings have included sustained and impulse freshwater additionsof various sizes in various places. A full review is far beyond the scope of this paper;the reviews noted above are good starting points. The intercomparison by Rahmstorfet al. (2005) is helpful, as well as Stouffer et al. (2006), Zhang & Delworth (2005),Vellinga & Wood (2002), and Wood et al. (2003).
My synopsis of this extensive literature is that typically (and considering only themodels that calculate a quantity; clearly, a model that does not simulate sea ice doesnot tell us anything about sea-ice changes):
(a) Unless diffusion is set quite high (e.g., Manabe & Stouffer 1999; Schmittner &Weaver 2001), models exhibit bi- or multimodality and hysteresis in response tovarying North Atlantic freshwater fluxes, with increased freshwater flux favoringreduced MOC.
(b) Mode switches include changes in locations of North Atlantic sinking, as well asin strength of sinking. A useful cartoon may be: a modern ocean with vigorous,high-latitude sinking to great depth; a glacial ocean with somewhat reducedsinking to intermediate depths at lower-latitude sites; and a Heinrich-event orMOC-off ocean with greatly reduced sinking (Sarnthein et al. 1995, Alley &Clark 1999, Alley et al. 1999, Stocker 2000, Rahmstorf 2002). However, thesituation is unlikely to be this simple.
(c) Freshwater perturbations of given size are more effective in changing theoceanic circulation if applied more rapidly and if applied closer to the sites
www.annualreviews.org • North Atlantic “Conveyor Belt” Hypothesis 253
Ann
u. R
ev. E
arth
Pla
net.
Sci.
2007
.35:
241-
272.
Dow
nloa
ded
from
ww
w.a
nnua
lrev
iew
s.or
g A
cces
s pr
ovid
ed b
y O
ld D
omin
ion
Uni
vers
ity o
n 04
/23/
18. F
or p
erso
nal u
se o
nly.

ANRV309-EA35-09 ARI 19 March 2007 18:4
of deep water formation in the North Atlantic, although slow additions andadditions elsewhere can affect the MOC (e.g., Rahmstorf & Willebrand 1995,Manabe & Stouffer 1997, Ganopolski & Rahmstorf 2001, cf. Weaver et al.2003).
(d ) Reduction of the MOC reduces the associated heat flux, leading to atmosphericanomalies and increases sea-ice extent, greatly amplifying atmospheric anoma-lies, especially in northern winter (e.g., Seager et al. 2002, Denton et al. 2005).
(e) Strong deep-water formation in the far northeastern Atlantic (the Greenland,Iceland, and Norwegian, or GIN, seas) is easier to maintain under modernthan under glacial conditions; in turn, fresh water is less able to stop such high-latitude sinking in the modern than in the glacial climate (e.g., Ganopolski &Rahmstorf 2001).
( f ) The atmospheric anomalies associated with southward shift or reduction ofNorth Atlantic MOC sinking generally include: very strong cooling in the farnortheastern Atlantic, especially in wintertime (many degrees to more than20◦C mean-annual); weaker cooling around much of the northern hemisphere,but typically of a few degrees or less remote from the North Atlantic; reducedprecipitation in monsoonal areas of Africa and Asia; southward shift of the ITCZat least over the Americas; and a somewhat delayed (decades or slightly longer)and muted warming in the middle and high southern latitudes, especially inthe South Atlantic, but with more variability between models than in northernresponses.
Numerous papers have assessed (dis)agreements between anomaly patterns asso-ciated with the 8k event, the YD, and various older events including the Heinrichevents, and those (as described above) modeled in response to freshening or spec-ified heat-convergence reduction in the North Atlantic (e.g., Fawcett et al. 1997,Fanning & Weaver 1997, Renssen 1997, Renssen et al. 2001, Renssen & Vanden-berghe 2003, Stocker & Marchal 2000, Alley & Agustsdottir 2005, Zhang & Delworth2005, Wiersma & Renssen 2006, LeGrande et al. 2006). Although there may be atendency for the reconstructed climate anomalies to be slightly larger, or more easilycaused, than the modeled anomalies (reviewed by Alley 2003), and specific mismatchesare noted in almost every comparison, especially in quantitative aspects, the overallobserved and modeled climate anomalies agree closely.
One of the main results of this data-model comparison is identification of the roleof sea ice and seasonality in the events. Sea ice greatly affects regional temperature; thedifference between wintertime near-surface air temperature over a sea ice–coveredocean and an open ocean may be tens of degrees. Models that simulate sea ice typ-ically show that MOC shutdown and North Atlantic freshening favor seasonal seaice formation in some regions (the GIN seas and perhaps the Labrador Sea are ofteninvolved) that had remained open during the winter when the MOC was vigorous,and the new sea ice growth gives strong and strongly seasonal cooling (e.g., Seageret al. 2002). Numerous proxy data sets (Denton et al. 2005; also see Lie & Paasche2006) confirm much stronger wintertime than summertime cooling (SupplementalFigure 4). Shifts in seasonality of temperature and snowfall in Greenland (most cool-ing in wintertime, but also reduced precipitation in wintertime, so that the isotopic
254 Alley
Ann
u. R
ev. E
arth
Pla
net.
Sci.
2007
.35:
241-
272.
Dow
nloa
ded
from
ww
w.a
nnua
lrev
iew
s.or
g A
cces
s pr
ovid
ed b
y O
ld D
omin
ion
Uni
vers
ity o
n 04
/23/
18. F
or p
erso
nal u
se o
nly.
ANRV309-EA35-09 ARI 19 March 2007 18:4
ratios do not record the full cooling) caused small changes in isotopic ratio of accu-mulated ice to represent large changes in temperature, as inferred from calibration ofthe ice-isotopic paleothermometer (Alley & Cuffey 2001, Li et al. 2005, LeGrandeet al. 2006). A strong sea ice anomaly on one side of the equator is modeled to shiftthe ITCZ toward the other hemisphere (Chiang & Bitz 2005, Li et al. 2005), in partowing to cooling and drying in the hemisphere with the extra sea ice.
Broecker et al. (1985) did not predict all of this directly, but their hypothesis has ledto this understanding. They focused on data-model agreement in the North Atlantic.Subsequent refinement of models increasingly demonstrated that the hypothesizednorthern Atlantic freshening would not only have cooled that region and immediatelysurrounding land, but also would have caused the other anomalies noted. Subsequentdata collection, running more-or-less in parallel with the modeling, found thoseadditional anomalies in close agreement with modeled expectations.
EVIDENCE OF MOC CHANGES CORRELATEDWITH ABRUPT CLIMATE CHANGES
The evidence available to Broecker et al. (1985) on MOC changes was quite sketchy.Those authors cited isotopic data, and especially Cd:Ca ratios of benthic foraminiferain the North Atlantic (Boyle & Keigwin 1982), as indicating reduced deep wa-ter formation in the North Atlantic during glacial times, and also cited a per-sonal communication from N. Shackleton suggesting deep water formation in thePacific during glacial times. Broecker et al. then noted that the data linking differ-ent ocean-circulation patterns to different climate states were consistent with theidea that the short-lived (stadial-interstadial) temperature changes involved the sameocean-circulation changes as did the long-lived (glacial-interglacial) temperaturechanges.
Water-mass distributions for glacial-interglacial and stadial-interstadial changesare often reconstructed using tracers. Water that has been near the ocean’s surfacesufficiently long (decades or longer) is largely stripped of nutrients and chemicals, in-cluding cadmium (Cd), that follow nutrients in the ocean, and is depleted of carbon-12(12C; hence enriched in carbon-13, 13C) because those materials are used preferen-tially in plant growth and eventually exported to the deep ocean in sinking fecal pelletsand other materials. Near-surface water also approaches carbon-14 (14C or radiocar-bon) equilibrium with the atmosphere. In contrast, water that has been in the deepocean for a long time (centuries to millennia) accumulates Cd and 12C by dissolutionof the sinking pellets and loses 14C to decay.
Waters that sink around Antarctica first flow southward deeper than the floorof Drake Passage, and upwell before sinking again, failing to spend long enoughon the surface to reach 14C equilibrium and to be greatly depleted of 12C and Cd.Waters that sink in the North Atlantic first flow northward near the surface from theSouth Atlantic, gaining the full surface signal. Thus, southern-sourced and northern-sourced deep waters can be differentiated based on tracer characteristics. Glacial-interglacial mapping has been achieved, and some stadial-interstadial mapping, ofwater-mass characteristics that exhibit these signals (e.g., Sarnthein et al. 1995). High
www.annualreviews.org • North Atlantic “Conveyor Belt” Hypothesis 255
Ann
u. R
ev. E
arth
Pla
net.
Sci.
2007
.35:
241-
272.
Dow
nloa
ded
from
ww
w.a
nnua
lrev
iew
s.or
g A
cces
s pr
ovid
ed b
y O
ld D
omin
ion
Uni
vers
ity o
n 04
/23/
18. F
or p
erso
nal u
se o
nly.

ANRV309-EA35-09 ARI 19 March 2007 18:4
time-resolution records from especially favorable sites with high deposition rates arealso available.
Some of the difficulties in use of tracers to infer oceanic circulation are discussedby LeGrand & Wunsch (1995) in relation to the LGM ocean, an easier problem thanduring the shorter-lived stadial/interstadial oscillations. A chain of scientific reason-ing is required to link an instrumental indication of Cd:Ca ratio in the shell of abottom-dwelling foraminifer to the ocean circulation at the time that foraminiferlived. Accepting the measurement, dating, and linkage between shell and water com-positions, and that southern-sourced and northern-sourced waters maintained theirdistinctive differences in 12C, 14C, Cd, and other tracers, a map of these characteristicsstill does not provide a three-dimensional representation of the locations, directions,and velocities of the flows supplying those water masses.
Nonetheless, the Broecker et al. (1985) hypothesis has led to specific predictionsabout correlations between climate shifts and changes in these and other tracers,which have been confirmed with high confidence, and I am aware of no other com-peting hypothesis that has done so. The modeled oceanic response to North Atlanticfreshening generally includes a reduced flux or a shallowing of northern-sourced wa-ters in the Atlantic, allowing northward and upward expansion of southern-sourcedwaters. This predicts the higher Cd and lower 13C and 14C observed in the northerndeep Atlantic during colder times in the north. (Remembering, again, that the col-lection of data and development of modeling have proceeded together, and that notevery record is equally clear or in equally strong agreement.)
Sarnthein et al. (1995) (also see Elliot et al. 2002), for example, mapped δ13C inthe eastern North Atlantic, and found evidence consistent with three modes of flow: amodern mode with vigorous high-latitude sinking, a glacial mode with sinking shiftedfarther south and not reaching as deeply in the ocean, and a Heinrich mode with littlenorthern sinking. Keigwin & Boyle (1999) found, for stage 3 at Bermuda Rise, thateach of the stadial-interstadial changes in Greenland ice cores between 32 and 58 kabphas a correlative in surface-temperature records (within the dating uncertainties), thatδ13C “decreases during every stadial event, consistent with reduced production of thedeepest component of North Atlantic Deep Water and shoaling of its interface withAntarctic Bottom Water” (p. 164) (and with little dating uncertainty between benthicwater-mass records and planktonic surface-temperature records), and that the Cd:Cameasurements made across one interstadial support this interpretation.
Keigwin (2004) combined paired benthic-planktonic 14C ages of foraminifera fromBermuda Rise to trace the boundary between deeper waters with characteristics con-sistent with southern-sourced water and shallower waters with northern-source char-acter. He found that the boundary was shallower during the LGM and the YD than to-day or just before or after the YD (also see Boyle & Keigwin 1987, Keigwin et al. 1991).
Based on paired uranium-series disequilibrium and 14C ages of deep-water corals,Robinson et al. (2005) documented rapid switches between 14C-enriched and 14C-depleted waters in the deep western North Atlantic. The 14C-enriched (northern-sourced) waters were present in the deep ocean during times when the North Atlanticsurface was warm, replaced by depleted waters during surface cold times, consistentwith the bipolar see-saw; intermediate waters showed more variability.
256 Alley
Ann
u. R
ev. E
arth
Pla
net.
Sci.
2007
.35:
241-
272.
Dow
nloa
ded
from
ww
w.a
nnua
lrev
iew
s.or
g A
cces
s pr
ovid
ed b
y O
ld D
omin
ion
Uni
vers
ity o
n 04
/23/
18. F
or p
erso
nal u
se o
nly.

ANRV309-EA35-09 ARI 19 March 2007 18:4
Skinner & Shackleton (2004) compared radiocarbon ages of benthic and plank-tonic foraminifera shells from a deep core in the northeast Atlantic, cross-dated thecore to Greenland ice-core records using assumed synchrony of cooling in Greenlandand in surface waters at the site, and also assessed deep-water temperature and carbon-and oxygen-isotopic composition. Skinner & Shackleton (2004) found clear evidencefor reduced deep water ventilation during the LGM, increase with the Bolling-Allerodwarming, and reduction with the YD cooling, consistent with varying dominanceby northern-sourced (North Atlantic deep water) versus southern-sourced water(Antarctic bottom water). They stated, “The fact that deglacial changes in the deepwater radiocarbon content of the northeast Atlantic run parallel to opposite changes inatmospheric radiocarbon content and in parallel with Greenland temperature fluc-tuations unequivocally implicates changes in ocean circulation in deglacial climateevolution and illustrates the capacity for the deep ocean to respond and contributeto abrupt climate change” (abstract).
Because of carbon cycle coupling between ocean and atmosphere, the Broeckeret al. hypothesis implies that atmospheric CO2 and 14C should have shifted along withthe oceanic changes at abrupt climate events. As summarized in the SupplementalMaterial, many data sets are consistent with this expectation.
At least three additional and independent approaches reach the same results asthese geochemical proxies: Gulf Stream transport, deep Atlantic grain sizes, and231Pa:230Th.
Gulf Stream transport was reconstructed by Lynch-Stieglitz et al. (1999). Theoxygen-isotopic composition of benthic foraminifera is heavier in colder or saltierwaters. Separating these effects is nontrivial, but because colder or saltier waters aredenser, the foraminiferal isotopic composition is a better indicator of water-massdensity than of either factor contributing to that density. Vertical profiles of den-sity across Florida Strait for a time slice allow geostrophic calculation of the GulfStream flux, consisting of MOC and wind-driven components. Reduced transportis reconstructed for the LGM, consistent with reduced MOC (Lynch-Stieglitz et al.1999). That data set lacked sufficient time resolution to test changes across the YDor other abrupt events, but it does provide evidence of reduced MOC transport ata time when North Atlantic records of 14C, δ13C, and Cd:Ca also indicate reducedMOC transport, suggesting that the interpretation of similar changes in δ13C, 14C,and Cd:Ca over shorter intervals is also accurate. Furthermore, in an abstract, Lynch-Stieglitz & Curry (2003) reported higher time-resolution results, indicating reducedGulf Stream transport through Florida Strait during the YD.
Deep-current strengths associated with the MOC were estimated from grain-size data in a depth transect of sediment cores from the northeastern Atlantic(50–60◦N, 15–25◦W, 1100–4045 m depth) by McCave et al. (1995). They foundweaker deep flows during colder times of the LGM, H1, and the YD, with strength-ened intermediate-depth flows, indicating shallowing of the deep flows of the MOCwith surface cooling. Comparison to previously published data from the westernNorth Atlantic showed much agreement. McCave et al. interpreted this to indicate“(t)emporal patterns of circulation reassuringly similar to some of those inferred fromisotopic and chemical indicators” (p. 151).
www.annualreviews.org • North Atlantic “Conveyor Belt” Hypothesis 257
Ann
u. R
ev. E
arth
Pla
net.
Sci.
2007
.35:
241-
272.
Dow
nloa
ded
from
ww
w.a
nnua
lrev
iew
s.or
g A
cces
s pr
ovid
ed b
y O
ld D
omin
ion
Uni
vers
ity o
n 04
/23/
18. F
or p
erso
nal u
se o
nly.

ANRV309-EA35-09 ARI 19 March 2007 18:4
0 5 10 15 200
1
2
3
δ18O
fo
ram
inif
era
(o/ o
o)
0 5 10 15 20Age (kabp)
0.05
0.06
0.07
0.08
0.09
0.1
231 P
a/23
0T
h
Holocene YD BA H1 LGM
Figure 3231Pa:230Th (blue, calculated for 238U support; 232Th-based calculation results are quitesimilar) and surface-water temperature indicator (red; three-point running average of δ18O ofplanktonic foraminifera G. inflata) for core from 34◦N, 58◦W, 4.55 km depth in NW Atlantic(from McManus et al. 2004). Note that both scales are inverted, such that downward indicatescolder conditions and closer approach to production ratio of 231Pa:230Th, which is 0.093;downward shift is interpreted to be colder surface waters and weaker MOC. Holocene, YD,BA, H1, and LGM are indicated following McManus et al. (2004).
Probably the most interesting development, and the strongest evidence for MOCchanges coincident with millennial abrupt changes in the northern Atlantic, comesfrom the analysis of 231Pa:230Th ratios in North Atlantic sediments (McManus et al.2004, Gherardi et al. 2005, also see Marchal et al. 2000 and Siddall et al. 2005)(Figure 3). Both 231Pa and 230Th are produced in uranium decay series (from 235Uand 234U, respectively) from well-mixed species with long residence times. Both Paand Th adsorb rapidly on particles, but Th has a residence time of 20–40 years inthe water column, and Pa has a residence time of 100–200 years. Particle fluxes stripmost of the Pa and Th from waters entering the North Atlantic, with opal depositionin the circum-Antarctic belt important. The similarity of residence times of water inthe North Atlantic, and of 231Pa in the water, allows the MOC to export a notablefraction of the 231Pa produced in the North Atlantic, whereas almost all of the 230Thproduced in the North Atlantic is deposited there. Were the MOC flux to decrease,increasing the residence time of waters in the North Atlantic, then 231Pa:230Th wouldshift from its vigorous-MOC 231Pa-depleted value toward the production ratio.
Hence, Broecker and colleagues’ hypothesis makes a direct prediction, which wasnot involved in the original hypothesis and not widely measured at that time, aboutthe history of 231Pa:230Th in North Atlantic sediments. Subsequent improvements
258 Alley
Ann
u. R
ev. E
arth
Pla
net.
Sci.
2007
.35:
241-
272.
Dow
nloa
ded
from
ww
w.a
nnua
lrev
iew
s.or
g A
cces
s pr
ovid
ed b
y O
ld D
omin
ion
Uni
vers
ity o
n 04
/23/
18. F
or p
erso
nal u
se o
nly.
ANRV309-EA35-09 ARI 19 March 2007 18:4
have allowed sampling to test this hypothesis. The simple answer is that the predictionis borne out (Figure 3). As stated by McManus et al. (2004; p. 834), “these resultsconfirm the significance of variations in the rate of the Atlantic meridional overturningcirculation for abrupt climate changes.” Sampling on both sides of the North Atlanticshows that near-surface cool intervals of the YD and H1 (and, at least for the westernNorth Atlantic, the LGM) were accompanied by 231Pa:230Th ratios shifted towardproduction values. Subtle differences between the eastern and western North Atlanticsignals are quite interesting, but in no way weaken the main observation. The parallelbehavior across the basin argues against any odd interpretations of particle fluxes, etc.
Clearly, one would like to have multiple indicators of water-mass distribution andcurrent strength across the full bestiary of events, whereas at present most indicatorsare restricted to the deglacial sequence (although some data extend into stage 3), andthree-dimensional mapping is not available for many. Nonetheless, the Broecker et al.hypothesis of involvement of the MOC in millennial oscillations has led to qualita-tively (and often quantitatively) successful predictions about a host of indicators, in-cluding trace-element, stable and radioactive carbon-isotopic changes, grain-size andwater-isotopic distributions in the ocean, and coupled atmospheric-carbon changes.Although there clearly are cases in which data or model are not in full agreementwith Broecker and colleagues’ hypothesis (e.g., see Stocker & Marchal 2000), I knowof no strong cases in which important predictions of the MOC/millennial-climatehypothesis were extensively tested and found to fail consistently, whereas consistentsuccesses are now common.
CHALLENGES AND OPPORTUNITIES
The basic success of Broecker and colleagues’ hypothesis is clear as a predictive aswell as explanatory idea. Yet large gaps exist in our data, models, and understandingof the system, and the changes that happened, and these gaps surely impact ourinterpretation of possible future changes.
The MOC, and in particular the northern Atlantic portion, can operate in multiplemodes. Depending on the model used, and the mean state of the climate, there maybe up to several modes, and one or more may be stable. The two-mode (“on-off”)model is a useful thought experiment but is clearly too simple. The three-mode pic-ture is supported by some evidence (Sarnthein et al. 1995, Alley & Clark 1999, Alleyet al. 1999, Stocker 2000, Rahmstorf 2002). In this view, the presence or absenceof wintertime sea ice in the GIN seas has important impacts on Greenland climateand broad regions of the Northern Hemisphere, but relatively subtle influences onoceanic circulation and linked climate beyond the North Atlantic; wintertime sea icegrowth in the GIN seas is linked to southward shift of sinking for the MOC, andperhaps with shallowing or decreased vigor of the sinking, but MOC sinking contin-ues. The additional cooling shift to the Heinrich or “off” mode involves shallowingand reduction of the remaining sinking, linked with Heinrich events, and has a rel-atively larger impact on the MOC flux, and hence the Southern Hemisphere, but arelatively smaller impact on sea ice, hence the Northern Hemisphere, than does the
www.annualreviews.org • North Atlantic “Conveyor Belt” Hypothesis 259
Ann
u. R
ev. E
arth
Pla
net.
Sci.
2007
.35:
241-
272.
Dow
nloa
ded
from
ww
w.a
nnua
lrev
iew
s.or
g A
cces
s pr
ovid
ed b
y O
ld D
omin
ion
Uni
vers
ity o
n 04
/23/
18. F
or p
erso
nal u
se o
nly.

ANRV309-EA35-09 ARI 19 March 2007 18:4
mode switch involving the GIN seas. This almost certainly still oversimplifies reality,but may be a useful starting point for additional research.
The background climate state rather clearly affects the preferred mode of opera-tion of the system, based on models and data. The GIN seas likely became “stuck”with wintertime sea ice during the LGM, with persistent cold conditions recordedin Greenland. Generation of wintertime sea ice in the warmer Holocene climate isnot as easy, with persistently warmer conditions in Greenland and the GIN seas. TheHolocene GIN seas may have been temporarily shifted toward wintertime sea ice bythe largest of the freshwater forcings, the flood from Lake Agassiz just before the8k event (Clarke et al. 2004), but the condition did not stay beyond a century (Alley& Agustsdottir 2005). When orbital forcing placed the mean climate state interme-diate between glacial and interglacial conditions, as in stage 3, oscillations occurredbetween cold and warm states in the GIN seas. However, despite many insights, Ido not believe that we know the functional dependence of the stable state(s) and thehysteresis loops on the orographic effects of the ice sheets (with larger ice in NorthAmerica favoring more-zonal winds across the Atlantic and thus increased winter-time sea ice formation in the GIN seas), the radiative effects of greenhouse gases,and the orbitally controlled distribution of insolation (with conditions favoring coldGIN seas in turn promoting wintertime sea ice there). The role of brine rejectionfrom sea ice growth and of fresh-water transport linked to sea ice drift also couldbe elucidated better (e.g., Wang & Mysak 2006), as could the relative importance ofsurges or floods versus sustained meltwater routing (Meissner & Clark 2006).
As noted by many workers, the ice core data suggest that during at least most of theice age stadial-interstadial oscillations, the warm interstadials could not be sustained.Large and abrupt warming was followed almost immediately by gradual cooling,leading to more-abrupt cooling. Whether the interstadials were simply unstable orice melting from the interstadial warmth freshened the North Atlantic and pushed itfrom an initially stable mode toward an unstable mode remains unclear. Whichever,if the system was destined to switch from a warmer to a colder mode, it is almostguaranteed that a freshwater event (a surge or flood or switch in location of freshwaterinput to the North Atlantic) served to trigger each cooling, even if the cooling wasinevitable in a steady climate, because there were so many surges and floods andswitches in freshwater input to the North Atlantic (e.g., Teller & Leverintgon 2004,Donnelly et al. 2005, Rayburn et al. 2005). (By analogy, a mortal body is guaranteedto die, but the death certificate lists a cause; prevention of that cause would haveserved only to delay the inevitable. Even if the North Atlantic circulation duringinterstadials was destined to die, something still killed it.) The Broecker et al. (1990)salt oscillator remains intriguing, with a background state (orbits, CO2, insolation,ice-sheet configuration) in which the North Atlantic could not remain permanently inone steady state, but had to oscillate between two (or more) states around a hysteresiscycle. In the real, noisy climate system, both warmings and coolings would havehad “causes,” although the cycling was inevitable. However, for glacial backgroundconditions, Ganopolski & Rahmstorf (2001) found only a single, cold steady statethat could be perturbed easily to a second, warmer steady state before decaying back(also see Romanova et al. 2004).
260 Alley
Ann
u. R
ev. E
arth
Pla
net.
Sci.
2007
.35:
241-
272.
Dow
nloa
ded
from
ww
w.a
nnua
lrev
iew
s.or
g A
cces
s pr
ovid
ed b
y O
ld D
omin
ion
Uni
vers
ity o
n 04
/23/
18. F
or p
erso
nal u
se o
nly.
ANRV309-EA35-09 ARI 19 March 2007 18:4
The preferred spacing of approximately 1500 years between abrupt warmings ishighly intriguing (e.g., Grootes & Stuiver 1997, Alley et al. 2001). Spectral analysestend to indicate that the existence of true periodicity at this frequency depends onwhich published timescale is adopted (Hinnov et al. 2002); for example, the GISP2Meese-Sowers timescale (Meese et al. 1997) gives a clear periodicity (Rahmstorf2003), whereas some other timescales do not. This tends to support the existence ofthe periodicity; fortuitous errors are unlikely to have produced the observed preciseclock in the GISP2 timescale (Rahmstorf 2003). Nonetheless, as one intimately in-volved in timescale development (Alley et al. 1993b, 1997b), I find it hard to believethat we could have produced sufficiently accurate results to find such a precise clock,so I remain personally confused.
Regardless of timescale and precision of clock, there does exist a preferred spacingof roughly 1500 years between abrupt warmings, across a range of sampling intervalsand definitions of what exactly is an abrupt warming (and a similar result is obtainedfor coolings) (Alley et al. 2001). Furthermore, there is a suggestion of a preferredspacing of approximately 3000 years, with avoidance of spacings of approximately2250 and 4250 years. This at least suggests the possibility of elements of stochasticresonance, that a weak “clock” of some sort combines with noise to pace the transitions[Alley et al. 2001, Ganopolski & Rahmstorf 2002; also see Eyink 2005; to the best ofmy knowledge, no one has suggested that the noise and signal are tuned to optimizestochastic resonance, but Alley et al. (2001) specifically argued against such a tuning,with implications for the hypothesis-testing of Roe & Steig (2004).] A solar clockseems most likely (Bond et al. 2001), if a clock is ticking. Braun et al. (2005), using anintermediate-complexity model, showed how superposition of solar cycles of 87 and210 years might give rise to a 1470-year spacing of D-O-type events. Unfortunately,given the available dating uncertainties, and the limited length of the records, thesequestions are difficult to answer at this time (Alley et al. 2001), and new dating anddata sets are probably required to make notable headway.
Broecker et al. (1989) presented evidence from Gulf of Mexico sediment coresshowing the signature of meltwater drainage from the Laurentide ice sheet down theMississippi River shortly before and after, but not during, the YD event. Broeckeret al. (1989) suggested that eastward diversion of the meltwaters (see Meissner &Clark 2006), likely beginning with a flood, triggered and maintained the YD cold,and perhaps that a southward diversion helped reestablish the MOC in the northernAtlantic and end the YD cold interval. Other cold events have been linked to floods,including the 8k event (Barber et al. 1999) and the Preboreal event just after the endof the YD (Fisher et al. 2002; also see Nesje et al. 2004, Donnelly et al. 2005, andRayburn et al. 2005, and papers cited therein). The recent work of Aharon (2003)agrees with Broecker et al. (1989) in showing diversion of glacial meltwater away fromthe Gulf of Mexico during the YD. However, Aharon (2003), Flower et al. (2004), andLowell et al. (2005) are among recent researchers suggesting that the overall storycould prove to be somewhat more complex than previously believed. Refined dating ofevents is almost certainly needed, especially in the Lake Agassiz basin (Broecker 2006).
Additional work seems warranted for understanding the mechanisms of deep waterformation in the North Atlantic, coupling to sea ice, and controls on sea ice because
www.annualreviews.org • North Atlantic “Conveyor Belt” Hypothesis 261
Ann
u. R
ev. E
arth
Pla
net.
Sci.
2007
.35:
241-
272.
Dow
nloa
ded
from
ww
w.a
nnua
lrev
iew
s.or
g A
cces
s pr
ovid
ed b
y O
ld D
omin
ion
Uni
vers
ity o
n 04
/23/
18. F
or p
erso
nal u
se o
nly.
ANRV309-EA35-09 ARI 19 March 2007 18:4
of the critical role these played in the past changes, and the role they may play infuture changes. Although some careful work has been done (e.g., Zhang & Delworth2005) the mechanisms by which North Atlantic changes affect other features (shifts inITCZ, monsoonal precipitation, etc.) are often not as well understood as they mightbe, and enhanced insights should prove useful.
Note added in proof: The study by Seager & Battisti (2007) covers some of thesame material reviewed here, and then provides an interesting and useful perspectiveon atmospheric and oceanic processes in and well beyond the North Atlantic, andon the possible role of tropical or other extra-North Atlantic processes in the abruptclimate changes. Clearly, the reality of the abrupt climate changes, and the success ofthe Broecker et al. (1985) view in predicting new data sets, do not provide a completeprocess understanding of the events; much interesting science remains.
SUMMARYBroecker et al. (1985) combined paleoclimatic data from ice, land records,and deep and shallow marine settings; results from atmospheric and oceanicmodeling; and process understanding to present the audacious hypothesis ofimportant paleoclimatic changes in response to mode flips in the MOC inthe northern Atlantic. Broecker et al. (1985) noted “the tenuous nature ofthe information presently available.” Since then, in numerous papers (e.g.,Broecker et al. 1988, 1989, 1990; Broecker & Denton 1989; Broecker 1994,1997, 1998), Broecker and colleagues have worked to thicken the tenuousinformation and to build and join communities to do likewise. Although greatlyrefined, the basic picture remains essentially unchanged. Too much freshwaterin the North Atlantic will slow the MOC sinking or shift it southward, allow seaice growth in the GIN seas and perhaps elsewhere, and generate important andwidespread climate anomalies. Strong feedbacks and hysteresis in the NorthAtlantic allow abrupt mode switches. The preferred mode(s) depends on thebackground climate, but modes, hysteresis, and jumps are possible in a broadrange of climates. (Clearly, in a climate that is too warm for wintertime sea iceformation in the absence of MOC sinking, cessation of MOC sinking cannotgenerate wintertime sea ice formation.)
Broecker et al. (1985) provided perhaps the wisest council arising fromthis understanding: “Thus, if the changes that characterized glacial time andthose that will characterize the coming CO2 superinterglacial time involvemode switches, investigations of the transient climate response have to allowfor this possibility. . .we must begin to explore this alternate track. . . . Evengiven the full use of present resources, it will be several decades before wepossess sufficient understanding to predict future climates. Unless we intensifyresearch in these areas, the major impacts of CO2 will occur before we areprepared fully to deal with them.” I can do no better today than to echo thisstatement.
262 Alley
Ann
u. R
ev. E
arth
Pla
net.
Sci.
2007
.35:
241-
272.
Dow
nloa
ded
from
ww
w.a
nnua
lrev
iew
s.or
g A
cces
s pr
ovid
ed b
y O
ld D
omin
ion
Uni
vers
ity o
n 04
/23/
18. F
or p
erso
nal u
se o
nly.

ANRV309-EA35-09 ARI 19 March 2007 18:4
FUTURE ISSUESPrediction of future shutdowns inevitably involves details of model perfor-mance as well as forcings and requires more space than is available here. A fewresults seem clear, however:
(a) MOC shutdown cannot trigger a new ice age, completely stop the mostlywind-driven Gulf Stream, cause the extinction of humanity or even of Eu-ropeans, or exceed the fertile imaginations of Hollywood writers.
(b) Although unlikely, MOC shutdown remains possible and important. Thestrong link between past MOC changes and rainfall in monsoonal regionsand elsewhere raises clear concerns about the future; pending better eluci-dation of the mechanism(s) involved, and whether they are adequately re-produced in model studies, even weakening of the MOC conceivably couldbe important.
(c) Typical coupled-model “global warming” runs over the next century or moreusually produce slowing of the MOC without shutting it down or causingnet cooling, and thermal as well as salinity effects are important (Gregoryet al. 2005, Stouffer et al. 2006).
(d ) However, some intermediate-complexity models indicate that future fresh-water fluxes in a warming world, including possible meltwater fluxes fromGreenland, could be sufficient to trigger a shutdown (Rahmstorf et al. 2005;also see Fichefet et al. 2003 and Schlesinger et al. 2006), although a shut-down does not occur in other intermediate-complexity models (also seeRidley et al. 2005).
(e) Were a shutdown to occur fairly soon, notable regional climate anomalies,including net cooling over the northeastern Atlantic, would be expected(Fichefet et al. 2003, Wood et al. 2003).
( f ) Impacts of such a shutdown are expected to be sufficiently large that theymerit serious consideration in planning to generate optimal economic re-sponse to greenhouse gas emissions (Keller et al. 2000, 2004).
In short, even though a large, rapid, high-impact event seems unlikely based onmost of the literature, the nonzero possibility and the potentially large impactsmotivate further research, which is likely to pay off in knowledge for policymakers.
ACKNOWLEDGMENTS
I thank W. Broecker, O. Marchal, J. Lynch-Stieglitz, A. LeGrande, E. Brook, theChangelings, and other colleagues for advice. Partial funding was provided by theNational Science Foundation Office of Polar Programs through grants 0229609,0424589, 0440447, 0539578 and 0531211, and by the Gary Comer Science andEducation Foundation.
www.annualreviews.org • North Atlantic “Conveyor Belt” Hypothesis 263
Ann
u. R
ev. E
arth
Pla
net.
Sci.
2007
.35:
241-
272.
Dow
nloa
ded
from
ww
w.a
nnua
lrev
iew
s.or
g A
cces
s pr
ovid
ed b
y O
ld D
omin
ion
Uni
vers
ity o
n 04
/23/
18. F
or p
erso
nal u
se o
nly.
ANRV309-EA35-09 ARI 19 March 2007 18:4
LITERATURE CITED
Aharon P. 2003. Meltwater flooding events in the Gulf of Mexico revisited: impli-cations for rapid climate changes during the last deglaciation. Paleoceanography18:1079
Alley RB. 2000. The Younger Dryas cold interval as viewed from central Greenland.Quat. Sci. Rev. 19:213–26
Alley RB. 2003. Palaeoclimatic insights into future climate challenges. Phil. Trans. R.Soc. London A 361:1831–48
Alley RB, Agustsdottir AM. 2005. The 8k event: cause and consequences of a majorHolocene abrupt climate change. Quat. Sci. Rev. 24:1123–49
Alley RB, Anandakrishnan S, Jung P. 2001. Stochastic resonance in the North At-lantic. Paleoceanography 16:190–98
Alley RB, Bond G, Chappelaz J, Clapperton C, Del Genio A, et al. 1993a. GlobalYounger Dryas? EOS 74:587–89
Alley RB, Clark PU. 1999. The deglaciation of the northern hemisphere: a globalperspective. Annu. Rev. Earth Planet. Sci. 27:149–82
Alley RB, Clark PU, Keigwin LD, Webb RS. 1999. Making sense of millennial-scale climate change. In Mechanisms of Global Climate Change at Millennial TimeScales, ed. PU Clark, RS Webb, LD Keigwin, pp. 385–94. Washington, DC: Am.Geophys. Union
Alley RB, Cuffey KM. 2001. Oxygen- and hydrogen-isotopic ratios of water in pre-cipitation: beyond paleothermometry. Rev. Mineral. Geochem. 43:527–53
Alley RB, Finkel RC, Nishiizumi K, Anandakrishnan S, Shuman CA, et al. 1995.Changes in continental and sea-salt atmospheric loadings in central Greenlandduring the most recent deglaciation. J. Glaciol. 41:503–14
Alley RB, Mayewski PA, Sowers T, Stuiver M, Taylor KC, Clark PU. 1997a. Holoceneclimatic instability: a prominent, widespread event 8200 years ago. Geology25:483–86
Alley RB, Meese DA, Shuman CA, Gow AJ, Taylor KC, et al. 1993b. Abrupt increasein snow accumulation at the end of the Younger Dryas event. Nature 362:527–29
Alley RB, Shuman CA, Meese DA, Gow AJ, Taylor KC, et al. 1997b. Visual-stratigraphic dating of the GISP2 ice core: basis, reproducibility, and application.J. Geophys. Res. 102C:26367–81
Anderson B, Mackintosh A. 2006. Temperature change is the major driver of late-glacial and Holocene glacier fluctuations in New Zealand. Geology 34:121–24
Barber DC, Dyke A, Hillaire-Marcel C, Jennings AE, Andrews JT, et al. 1999. Forcingof the cold event of 8,200 years ago by catastrophic drainage of Laurentide lakes.Nature 400:344–48
Biscaye PE, Grousset FE, Revel M, van der Gaast S, Zielinski GA, et al. 1997. Asianprovenance of glacial dust (stage 2) in the Greenland Ice Sheet Project 2 ice core,Summit, Greenland. J. Geophys. Res. 102C:26765–81
Bender M, Sowers T, Dickson ML, Orchardo J, Grootes P, et al. 1994. Climatecorrelations between Greenland and Antarctica during the past 100,000 years.Nature 372:663–66
264 Alley
Ann
u. R
ev. E
arth
Pla
net.
Sci.
2007
.35:
241-
272.
Dow
nloa
ded
from
ww
w.a
nnua
lrev
iew
s.or
g A
cces
s pr
ovid
ed b
y O
ld D
omin
ion
Uni
vers
ity o
n 04
/23/
18. F
or p
erso
nal u
se o
nly.

ANRV309-EA35-09 ARI 19 March 2007 18:4
Benoist JP, Jouzel J, Lorius C, Merlivat L, Pourchet M. 1982. Isotope climate recordover the last 2.5 ka from Dome C, Antarctica, ice cores. Ann. Glaciol. 3:17–22
Blunier T, Brook EJ. 2001. Timing of millennial-scale climate change in Antarcticaand Greenland during the last glacial period. Science 291:109–12
Bond G, Broecker W, Johnsen S, McManus J, Labeyrie L, et al. 1993. Correla-tions between climate records from North-Atlantic sediments and Greenlandice. Nature 365:143–47
Bond G, Kromer B, Beer J, Muscheler R, Evans MN, et al. 2001. Persistent solarinfluence on north Atlantic climate during the Holocene. Science 294:2130–36
Boyle EA, Keigwin L. 1987. North-Atlantic thermohaline circulation during the past20,000 years linked to high-latitude surface-temperature. Nature 330:35–40
Boyle EA, Keigwin LD. 1982. Deep circulation of the North-Atlantic over the last200,000 years—geochemical evidence. Science 218:784–87
Braun H, Christl M, Rahmstorf S, Ganopolski A, Mangini A, et al. 2005. Possiblesolar origin of the 1,470-year glacial climate cycle demonstrated in a coupledmodel. Nature 438:208–11
Broecker WS. 1994. Massive iceberg discharges as triggers for global climate-change.Nature 372:421–24
Broecker WS. 1997. Thermohaline circulation, the Achilles heel of our climate sys-tem: will man-made CO2 upset the current balance? Science 278:1582–88
Broecker WS. 1998. Paleocean circulation during the last deglaciation: a bipolarseesaw? Paleoceanography 13:119–21
Broecker WS. 2006. GEOLOGY: Was the Younger Dryas triggered by a flood?Science 312:1146–48
Broecker WS, Andree M, Bonani G, Wolfli W, Oeschger H, Klas M. 1988. Can theGreenland climatic jumps be identified in records from ocean and land? Quat.Res. 30:1–6
Broecker WS, Bond G, Klas MA. 1990. A salt oscillator in the glacial Atlantic? 1.The concept. Paleoceanography 5:469–77
Broecker WS, Denton GH. 1989. The role of ocean-atmosphere reorganizations inglacial cycles. Geochim. Cosmochim. Acta 53:2465–501
Broecker WS, Kennett JP, Flower BP, Teller JT, Trumbore S, et al. 1989. Routing ofmeltwater from the Laurentide ice-sheet during the Younger Dryas cold episode.Nature 341:318–21
Broecker WS, Peteet DM, Rind D. 1985. Does the ocean-atmosphere system havemore than one stable mode of operation? Nature 315:21–26
Brook EJ, Harder S, Severinghaus J, Steig EJ, Sucher CM. 2000. On the origin andtiming of rapid changes in atmospheric methane during the last glacial period.Global Biogeochem. Cycles 14:559–72
Bryan F. 1986. High-latitude salinity effects and interhemispheric thermohaline cir-culations. Nature 323:301–4
Chappellaz J, Blunier T, Raynaud D, Barnola JM, Schwander J, Stauffer B. 1993.Synchronous changes in atmospheric CH4 and Greenland climate between40-kyr and 8-kyr bp. Nature 366:443–45
www.annualreviews.org • North Atlantic “Conveyor Belt” Hypothesis 265
Ann
u. R
ev. E
arth
Pla
net.
Sci.
2007
.35:
241-
272.
Dow
nloa
ded
from
ww
w.a
nnua
lrev
iew
s.or
g A
cces
s pr
ovid
ed b
y O
ld D
omin
ion
Uni
vers
ity o
n 04
/23/
18. F
or p
erso
nal u
se o
nly.

ANRV309-EA35-09 ARI 19 March 2007 18:4
Charles CD, LynchStieglitz J, Ninnemann US, Fairbanks RG. 1996. Climate con-nections between the hemispheres revealed by deep sea sediment core ice corecorrelations. Earth Planetary Sci. Lett. 142:19–27
Chiang JCH, Bitz CM. 2005. Influence of high latitude ice cover on the marineIntertropical Convergence Zone. Clim. Dyn. 25:477–96
Clarke GKC, Leverington DW, Teller JT, Dyke AS. 2004. Paleohydraulics of thelast outburst flood from glacial Lake Agassiz and the 8200 BP cold event. Quat.Sci. Rev. 23:389–407
Crowley TJ. 1992. North Atlantic deep water cools the Southern Hemisphere.Paleoceanography 7:489–97
Clark PU, Pisias NG, Stocker TF, Weaver AJ. 2002. The role of the thermohalinecirculation in abrupt climate change. Nature 415:863–69
Cuffey KM, Clow GD. 1997. Temperature, accumulation, and ice sheet eleva-tion in central Greenland through the last deglacial transition. J. Geophys. Res.102C:26393–96
Dansgaard W, Johnsen SJ, Clausen HB, Dahl-Jensen D, Gundestrup N, et al. 1984.North Atlantic climatic oscillations revealed by deep Greenland ice cores. SeeHansen & Takahashi 1984, pp. 288–98
Dansgaard W, Johnsen SJ, Clausen HB, Dahl-Jensen D, Gundestrup NS, et al. 1993.Evidence for general instability of past climate from a 250-kyr ice-core record.Nature 364:218–20
Denton GH, Hendy CH. 1994. Younger Dryas age advance of Franz-Josef Glacierin the Southern Alps of New Zealand. Science 264:1434–37
Denton GH, Alley RB, Comer GC, Broecker WS. 2005. The role of seasonality inabrupt climate change. Quat. Sci. Rev. 24:1159–82
Donnelly JP, Driscoll NW, Uchupi E, Keigwin LD, Schwab WC, et al. 2005. Catas-trophic meltwater discharge down the Hudson Valley: a potential trigger for theIntra-Allerod cold period. Geology 33:89–92
Elliot M, Labeyrie L, Duplessy JC. 2002. Changes in North Atlantic deep-water for-mation associated with the Dansgaard-Oeschger temperature oscillations (60–10 ka). Quat. Sci. Rev. 21:1153–65
Eyink GL. 2005. Statistical hydrodynamics of the thermohaline circulation in a two-dimensional model. Tellus A 57:100–15
Fanning AF, Weaver AJ. 1997. Temporal-geographical meltwater influences on theNorth Atlantic Conveyor: implications for the Younger Dryas. Paleoceanography12:307–20
Fawcett PJ, Agustsdottir AM, Alley RB, Shuman CA. 1997. The Younger Dryas ter-mination and North Atlantic deepwater formation: insights from climate modelsimulations and Greenland ice core data. Paleoceanography 12:23–38
Fichefet T, Poncin C, Goosse H, Huybrechts P, I Janssens, et al. 2003. Implicationsof changes in freshwater flux from the Greenland ice sheet for the climate of the21st century. Geophys. Res. Lett. 30:1911
Fisher TG, Smith DG, Andrews JT. 2002. Preboreal oscillation caused by a glacialLake Agassiz flood. Quat. Sci. Rev. 21:873–78
266 Alley
Ann
u. R
ev. E
arth
Pla
net.
Sci.
2007
.35:
241-
272.
Dow
nloa
ded
from
ww
w.a
nnua
lrev
iew
s.or
g A
cces
s pr
ovid
ed b
y O
ld D
omin
ion
Uni
vers
ity o
n 04
/23/
18. F
or p
erso
nal u
se o
nly.

ANRV309-EA35-09 ARI 19 March 2007 18:4
Fluckiger J, Monnin E, Stauffer B, Schwander J, Stocker TF, et al. 2002. High-resolution Holocene N2O ice core record and its relationship with CH4 andCO2. Global Biogeochem. Cycles 16:1010
Fluckiger J, Blunier T, Stauffer B, Chappellaz M, Spahni R, et al. 2004. N2O andCH4 variations during the last glacial epoch: insight into global processes. GlobalBiogeochem. Cycles 18:GB1020
Flower BP, Hastings DW, Hill HW, Quinn TM. 2004. Phasing of deglacial warm-ing and laurentide ice sheet meltwater in the Gulf of Mexico. Geology 32:597–600
Fuhrer K, Wolff EW, Johnsen SJ. 1999. Timescales for dust variability in the Green-land Ice Core Project (GRIP) ice core in the last 100,000 years. J. Geophys. Res.104D:31043–52
Ganopolski A, Rahmstorf S. 2001. Rapid changes of glacial climate simulated in acoupled climate model. Nature 409:153–58
Ganopolski A, Rahmstorf S. 2002. Abrupt glacial climate changes due to stochasticresonance. Phys. Rev. Lett. 88:038501
Gherardi JM, Labeyrie L, McManus JF, Francois R, Skinner LC, Cortijo E. 2005.Evidence from the Northeastern Atlantic basin for variability in the rate of themeridional overturning circulation through the last deglaciation. Earth Planet.Sci. Lett. 240:710–23
Gregory JM, Dixon KW, Stouffer RJ, Weaver AJ, Driesschaert E, et al. 2005. A modelintercomparison of changes in the Atlantic thermohaline circulation in responseto increasing atmospheric CO2 concentration. Geophys. Res. Lett. 32:L12703
Grootes PM, Stuiver M. 1997. Oxygen 18/16 variability in Greenland snow andice with 10(-3)- to 10(5)-year time resolution. J. Geophys. Res. 102C:26455–70
Hajdas I, Lowe DJ, Newnham RM, Bonani G. 2006. Timing of the late-glacial cli-mate reversal in the Southern Hemisphere using high-resolution radiocarbonchronology for Kaipo bog, New Zealand. Quat. Sci. Rev. 65:304–45
Hansen JE, Takahashi T, eds. 1984. Climate Processes and Climate Sensitivity.Washington, DC: Am. Geophys. Union
Hemming SR. 2004. Heinrich events: massive late Pleistocene detritus layers of theNorth Atlantic and their global climate imprint. Rev. Geophys. 42:RG1005
Hinnov LA, Schulz M, Yiou P. 2002. Interhemispheric space-time attributes of theDansgaard-Oeschger oscillations between 100 and 0 ka. Quat. Sci. Rev. 21:1213–28
Hughen KA, Overpeck JT, Lehman SJ, Kashgarian M, Southon J, et al. 1998.Deglacial changes in ocean circulation from an extended radiocarbon calibration.Nature 391:65–68
Huybers P. 2004. Comments on ‘Coupling of the hemispheres in observations andsimulations of glacial climate change’ by A. Schmittner, O.A. Saenko, and A.J.Weaver. Quat. Sci. Rev. 23:207–10
Ivy-Ochs S, Schluchter C, Kubik PW, Denton GH. 1999. Moraine exposure datesimply synchronous Younger Dryas glacier advances in the European Alps and inthe Southern Alps of New Zealand. Geograf. Ann. 81A:313–23
www.annualreviews.org • North Atlantic “Conveyor Belt” Hypothesis 267
Ann
u. R
ev. E
arth
Pla
net.
Sci.
2007
.35:
241-
272.
Dow
nloa
ded
from
ww
w.a
nnua
lrev
iew
s.or
g A
cces
s pr
ovid
ed b
y O
ld D
omin
ion
Uni
vers
ity o
n 04
/23/
18. F
or p
erso
nal u
se o
nly.
ANRV309-EA35-09 ARI 19 March 2007 18:4
Johnsen SJ, Dahl-Jensen D, Gundestrup N, Steffensen JP, Clausen HB, et al.2001. Oxygen isotope and palaeotemperature records from six Greenland ice-core stations: Camp Century, Dye-3, GRIP, GISP2, Renland and NorthGRIP.J. Quat. Sci. 16:299–307
Keigwin LD. 2004. Radiocarbon and stable isotope constraints on Last Glacial Max-imum and Younger Dryas ventilation in the western North Atlantic. Paleoceanog-raphy 19:PA4012
Keigwin LD, Boyle EA. 1999. Surface and deep ocean variability in the northernSargasso Sea during marine isotope stage 3. Paleoceanography 14:164–70
Keigwin LD, Jones GA, Lehman SJ, Boyle EA. 1991. Deglacial meltwater discharge,North-Atlantic deep circulation, and abrupt climate change. J. Geophys. Res.96C:16811–26
Keller K, Bolker BM, Bradford DF. 2004. Uncertain climate thresholds and optimaleconomic growth. J. Env. Econ. Management 48:723–41
Keller K, Tan K, Morel FMM, Bradford DF. 2000. Preserving the ocean circulation:implications for climate policy. Clim. Change 47:17–43
Knutti R, Fluckiger J, Stocker TF, Timmermann A. 2004. Strong hemispheric cou-pling of glacial climate through freshwater discharge and ocean circulation. Na-ture 430:851–56
Lamy F, Kaiser J, Ninnemann U, Hebbeln D, Arz HW, Stoner J. 2004. Antarctictiming of surface water changes off Chile and Patagonian ice sheet response.Science 304:1959–62
LeGrand P, Wunsch C. 1995. Constraints from paleotracer data on the North At-lantic circulation during the last glacial maximum. Paleoceanography 10:1011–46
LeGrande AN, Schmidt GA, Shindell DT, Field CV, Miller DM, et al. 2006. Consis-tent simulations of multiple proxy responses to an abrupt climate change event.Proc. Natl. Acad. Sci. USA 103:837–42
Li C, Battisti DS, Schrag DP, Tziperman E. 2005. Abrupt climate shifts in Greenlanddue to displacements of the sea ice edge. Geophys. Res. Lett. 32:L19702
Lie O, Paasche O. 2006. How extreme was northern hemisphere seasonality duringthe Younger Dryas? Quat. Sci. Rev. 25:404–7
Lowell TV, Fisher TG, Comer GC, Hajdas I, Waterson N, et al. 2005. Testing theLake Agassiz meltwater trigger for the Younger Dryas. EOS 86:365–72
Lynch-Stieglitz J. 2004. Hemispheric asynchrony of abrupt climate change. Science304:1919–20
Lynch-Stieglitz J, Curry W. 2003. High resolution Holocene and deglacial recordsof density structure and flow in the Florida Straits. Euro. Geophys. Soc. Geophys.Res. Abst. 5:13467 (Abstr.)
Lynch-Stieglitz J, Curry WB, Slowey N. 1999. Weaker Gulf Stream in the Floridastraits during the last glacial maximum. Nature 402:644–48
Manabe S, Stouffer RJ. 1997. Coupled ocean-atmosphere model response to fresh-water input: comparison to Younger Dryas event. Paleoceanography 12:321–36
Manabe S, Stouffer RJ. 1999. Are two modes of thermohaline circulation stable?Tellus A 51:400–11
Marchal O, Francois R, Stocker TF, Joos F. 2000. Ocean thermohaline circulationand sedimentary Pa-231/Th-230 ratio. Paleoceanography 15:625–41
268 Alley
Ann
u. R
ev. E
arth
Pla
net.
Sci.
2007
.35:
241-
272.
Dow
nloa
ded
from
ww
w.a
nnua
lrev
iew
s.or
g A
cces
s pr
ovid
ed b
y O
ld D
omin
ion
Uni
vers
ity o
n 04
/23/
18. F
or p
erso
nal u
se o
nly.

ANRV309-EA35-09 ARI 19 March 2007 18:4
Marotzke J. 2000. Abrupt climate change and thermohaline circulation: mechanismsand predictability. Proc. Natl. Acad. Sci. USA 97:1347–50
Marshall J, Schott F. 1999. Open-ocean convection: observations, theory, and models.Rev. Geophys. 37:1–64
Masson-Delmotte V, Jouzel J, Landais A, Stievenard M, Johnsen SJ, et al. 2005. GRIPdeuterium excess reveals rapid and orbital-scale changes in Greenland moistureorigin. Science 309:118–21
Mayewski PA, Meeker LD, Twickler MS, Whitlow S, Yang QZ, et al. 1997. Major fea-tures and forcing of high-latitude northern hemisphere atmospheric circulationusing a 110,000-year-long glaciochemical series. J. Geophys. Res. 102C:26345–66
McCave IN, Manighetti B, Beveridge NAS. 1995. Circulation in the glacial North-Atlantic inferred from grain-size measurements. Nature 374:149–52
McManus JF, Francois R, Gherardi JM, Keigwin LD, Brown-Leger S. 2004. Col-lapse and rapid resumption of Atlantic meridional circulation linked to deglacialclimate changes. Nature 428:834–37
Meese DA, Gow AJ, Alley RB, Zielinski GA, Grootes PM, et al. 1997. The Green-land Ice Sheet Project 2 depth-age scale: methods and results. J. Geophys. Res.102C:26411–23
Meissner KJ, Clark PU. 2006. Impact of floods versus routing events on the thermo-haline circulation. Geophys. Res. Lett. 33:L15704, doi: 10.1029/2006GL026705
Nesje A, Dahl SO, Bakke J. 2004. Were abrupt Lateglacial and early-Holocene cli-matic changes in northwest Europe linked to freshwater outbursts to the NorthAtlantic and Arctic Oceans? Holocene 14:299–310
Nilsson J, Walin G. 2001. Freshwater forcing as a booster of thermohaline circulation.Tellus A 53:629–41
Oeschger H, Beer J, Siegenthaler U, Stauffer B, Dansgaard W, Langway CC. 1984.Late glacial climate history from ice cores. See Hansen & Takahashi 1984,pp. 299–306
Pahnke K, Zahn R. 2001. Southern hemisphere water mass conversion linked withNorth Atlantic climate variability. Science 307:1741–46
Peteet D. 1995a. Global Younger Dryas. Quat. Intl. 28:93–104Peteet DM. 1995b. Global Younger Dryas. Vol. 2. Preface. Quat. Sci. Rev. 14:811–11Rahmstorf S. 1999. Rapid transitions of the thermohaline ocean circulation—a mod-
elling perspective. In Reconstructing Ocean History: A Window into the Future, ed.F Abrantes, AC Mix, pp. 139–49. New York: Kluwer Acad./Plenum Publ.
Rahmstorf S. 2003. Timing of abrupt climate change: a precise clock. Geophys. Res.Lett. 30:1510
Rahmstorf S, Crucifix M, Ganopolski A, Goosse H, Kamenkovich IV, et al. 2005.Thermohaline circulation hysteresis: a model intercomparison. Geophys. Res. Lett.32:L23605, doi:10.1029/2005GL023655
Rahmstorf S, Willebrand J. 1995. The role of temperature feedback in stabilizing thethermohaline circulation. J. Phys. Ocean. 25:787–805
Rankin AM, Wolff EW, Mulvaney R. 2004. A reinterpretation of sea-salt records inGreenland and Antarctic ice cores? Ann. Glaciol. 39:276–82
www.annualreviews.org • North Atlantic “Conveyor Belt” Hypothesis 269
Ann
u. R
ev. E
arth
Pla
net.
Sci.
2007
.35:
241-
272.
Dow
nloa
ded
from
ww
w.a
nnua
lrev
iew
s.or
g A
cces
s pr
ovid
ed b
y O
ld D
omin
ion
Uni
vers
ity o
n 04
/23/
18. F
or p
erso
nal u
se o
nly.
ANRV309-EA35-09 ARI 19 March 2007 18:4
Rayburn JA, Knuepfer PLK, Franzi DA. 2005. A series of large, Late Wisconsinanmeltwater floods through the Champlain and Hudson Valleys, New York State,USA. Quat. Sci. Rev. 24:2410–19
Renssen H. 1997. The global response to Younger Dryas boundary conditions in anAGCM simulation. Clim. Dyn. 13:587–99
Renssen H, Isarin RFB, Jacob D, Podzun R, Vandenberghe J. 2001. Simulation ofthe Younger Dryas climate in Europe using a regional climate model nested inan AGCM: preliminary results. Global Planet. Change 30:41–57
Renssen H, van den Berghe J. 2003. Investigation of the relationship between per-mafrost distribution in NW Europe and extensive winter sea-ice cover in theNorth Atlantic Ocean during the cold phases of the Last Glaciation. Quat. Sci.Rev. 22:209–23
Ridley JK, Huybrechts P, Gregory JM, Lowe JA. 2005. Elimination of the Greenlandice sheet in a high CO2 climate. J. Clim. 18:3409–27
Robinson LF, Adkins JF, Keigwin LD, Southon J, Fernandez DP, et al. 2005. Ra-diocarbon variability in the western North Atlantic during the last deglaciation.Science 310:1469–73
Roe GH, Steig EJ. 2004. Characterization of millennial-scale climate variability.J. Clim. 17:1929–44
Romanova V, Prange M, Lohmann G. 2004. Stability of the glacial thermohalinecirculation and its dependence on the background hydrological cycle. Clim. Dyn.22:527–38
Rooth C. 1982. Hydrology and ocean circulation. Prog. Ocean. 11:131–49Sarnthein M, Jansen E, Weinelt M, Arnold M, Duplessy JC, et al. 1995. Variations
in Atlantic surface ocean paleoceanography, 50◦–80◦N—A time-slice record ofthe last 30,000 years. Paleoceanography 10:1063–94
Schlesinger ME, Yin J, Yohe G, Andronova NG, Malyshev S, Li B. 2006. Assessing therisk of a collapse of the Atlantic thermohaline circulation. In Avoiding DangerousClimate Change, ed. J Schnellnhuber, W Cramer, N Nakiecenovic, T Wigley,G Yohe. Cambridge, UK: Cambridge Univ. Press
Schmittner A, Saenko OA, Weaver AJ. 2003. Coupling of the hemispheres in obser-vations and simulations of glacial climate change. Quat. Sci. Rev. 22:659–71
Schmittner A, Saenko OA, Weaver AJ. 2004. Response to the comments by PeterHuybers. Quat. Sci. Rev. 23:210–12
Schmittner A, Weaver AJ. 2001. Dependence of multiple climate states on oceanmixing parameters. Geophys. Res. Lett. 28:1027–30
Seager R, Battisti DS. 2007. Challenges to our understanding of the general cir-culation: abrupt climate change. In Global Circulation of the Atmosphere, ed.T Schneider, AH Sobel. Princeton, NJ: Princeton University Press. In press
Seager R, Battisti DS, Yin J, Gordon N, Naik N, et al. 2002. Is the Gulf Streamresponsible for Europe’s mild winters? Quat. J. R. Meteor. Soc. 128B:2563–86
Severinghaus JP, Jouzel J, Caillon N, Stocker T, Huber C, et al. 2004. Comment on“Greenland-Antarctic phase relations and millennial time-scale climate fluctua-tions in the Greenland ice-cores” by C. Wunsch. Quat. Sci. Rev. 23:2053–54
270 Alley
Ann
u. R
ev. E
arth
Pla
net.
Sci.
2007
.35:
241-
272.
Dow
nloa
ded
from
ww
w.a
nnua
lrev
iew
s.or
g A
cces
s pr
ovid
ed b
y O
ld D
omin
ion
Uni
vers
ity o
n 04
/23/
18. F
or p
erso
nal u
se o
nly.

ANRV309-EA35-09 ARI 19 March 2007 18:4
Severinghaus JP, Sowers T, Brook EJ, Alley RB, Bender ML. 1998. Timing of abruptclimate change at the end of the Younger Dryas interval from thermally frac-tionated gases in polar ice. Nature 391:141–46
Shuman B, Thompson W, Bartlein P, Williams JW. 2002. The anatomy of a climaticoscillation: vegetation change in eastern North America during the YoungerDryas chronozone. Quat. Sci. Rev. 21:1777–91
Siddall M, Henderson GM, Edwards NR, Frank M, Muller SA, et al. 2005. Pa-231/Th-210 fractionation by ocean transport, biogenic particle flux and particletype. Earth Planet. Sci. Lett. 237:135–55
Sinha A, Cannariato KG, Stott LD, Li HC, You CF, et al. 2005. Variability of South-west Indian summer monsoon precipitation during the Bolling-Allerod. Geology33:813–16
Skinner LC, Shackleton NJ. 2004. Rapid transient changes in northeast Atlantic deepwater ventilation age across Termination I. Paleoceanography 19: PA2005
Smith LC, MacDonald GM, Velichko AA, Beilman DW, Borisova OK, et al. 2004.Siberian peatlands a net carbon sink and global methane source since the earlyHolocene. Science 303:353–56
Sowers T. 2006. Late quaternary atmospheric CH4 isotope record suggests marineclathrates are stable. Science 311:838–40
Sowers T, Alley RB, Jubenville J. 2003. Ice core records of atmospheric N2O coveringthe last 106,000 years. Science 301:945–48
Steig EJ, Alley RB. 2002. Phase relationships between Antarctic and Greenland cli-mate records. Ann. Glaciol. 35:451–56
Stocker TF. 1998. The seesaw effect. Science 282:61–62Stocker TF. 2000. Past and future reorganizations in the climate system. Quat. Sci.
Rev. 19:301–19Stocker TF, Johnsen SJ. 2003. A minimum thermodynamic model for the bipolar
seesaw. Paleoceanography 18:1087Stocker TF, Marchal O. 2000. Abrupt climate change in the computer: Is it real?
Proc. Natl. Acad. USA 97:1362–65Stocker TF, Wright DG, Broecker WS. 1992a. The influence of high-latitude surface
forcing on the global thermohaline circulation. Paleoceanography 7:529–41Stocker TF, Wright DB, Mysak LA. 1992b. A zonally averaged, coupled ocean-
atmosphere model for paleoclimate studies. J. Clim. 5:773–97Stommel H. 1961. Thermohaline convections with 2 stable regimes of flow. Tellus
13:224–30Stouffer RJ, Yin J, Gregory JM, Dixon KW, Spelman MJ, et al. 2006. Investigating
the causes of the response of the thermohaline circulation to past and futureclimate changes. J. Clim. 19:1365–87
Suwa M, von Fischer JC, Bender ML, Landais A, Brook EJ. 2006. Chronology recon-struction for the disturbed bottom section of the GISP2 and the GRIP ice cores:Implications for Termination II in Greenland. J. Geophys. Res. 111D:D02101
Teller JT, Leverington DW. 2004. Glacial Lake Agassiz: a 5000 years history ofchange and its relationship to the delta O-18 record of Greenland. Geol. Soc.Am. Bull. 116:729–42
www.annualreviews.org • North Atlantic “Conveyor Belt” Hypothesis 271
Ann
u. R
ev. E
arth
Pla
net.
Sci.
2007
.35:
241-
272.
Dow
nloa
ded
from
ww
w.a
nnua
lrev
iew
s.or
g A
cces
s pr
ovid
ed b
y O
ld D
omin
ion
Uni
vers
ity o
n 04
/23/
18. F
or p
erso
nal u
se o
nly.

ANRV309-EA35-09 ARI 19 March 2007 18:4
Turney CSM, McGlone MS, Wilmshurst JM. 2003. Asynchronous climate changebetween New Zealand and the North Atlantic during the last deglaciation.Geology 31:223–26
Vacco DA, Clark PU, Mix AC, Cheng H, Edward RL. 2005. A speleothem record ofYounger Dryas cooling, Klamath Mountains, Oregon, USA. Quat. Res. 64:249–56
Vellinga M, Wood RA. 2002. Global climatic impacts of a collapse of the Atlanticthermohaline circulation. Clim. Change 54:251–67
Voelker AHL. 2002. Global distribution of centennial-scale records for Marine Iso-tope Stage (MIS) 3: a database. Quat. Sci. Rev. 21:1185–212
Wang XF, Auler AS, Edwards RL, Cheng H, Cristalli PS, et al. 2004. Wet periodsin northeastern Brazil over the past 210 kyr linked to distant climate anomalies.Nature 432:740–43
Wang YJ, Cheng H, Edwards RL, An ZS, Wu JY, et al. 2001. A high-resolutionabsolute-dated Late Pleistocene monsoon record from Hulu Cave, China. Science294:2345–48
Wang Z, Mysak LA. 2006. Glacial abrupt climate changes and Dansgaard-Oeschger oscillations in a coupled climate model. Paleoceanography 21:PA2001,doi:10.1029/2005PA001238
Weaver AJ, Saenko OA, Clark PU, Mitrovica JX. 2003. Meltwater pulse 1A fromAntarctica as a trigger of the bolling-allerod warm interval. Science 299:1709–13
White JWC, Barlow LK, Fisher D, Grootes P, Jouzel J, et al. 1997. The climate signalin the stable isotopes of snow from Summit, Greenland: results of comparisonswith modern climate observations. J. Geophys. Res. 102C:16425–39
Wiersma AP, Renssen H. 2006. Model-data comparison for the 8.2 ka BP event:confirmation of a forcing mechanism by catastrophic drainage of LaurentideLakes. Quat. Sci. Rev. 25:63–88
Wood RA, Vellinga M, Thorpe R. 2003. Global warming and thermohaline circula-tion stability. Phil. Trans. R. Soc. London A 361:1961–74
Wunsch C. 2002. What is the thermohaline circulation? Science 298:1179–80Wunsch C. 2003. Greenland-Antarctic phase relations and millennial time-scale cli-
mate fluctuations in the Greenland ice-cores. Quat. Sci. Rev. 22:1631–46Wunsch C. 2005. Speculations on a schematic theory of the Younger Dryas. J. Marine
Res. 63:315–33Wunsch C. 2006. Abrupt climate change: An alternative view. Quat. Res. 65:191–203Zhang R, Delworth TL. 2005. Simulated tropical response to a substantial weakening
of the Atlantic thermohaline circulation. J. Clim. 18:1853–60
272 Alley
Ann
u. R
ev. E
arth
Pla
net.
Sci.
2007
.35:
241-
272.
Dow
nloa
ded
from
ww
w.a
nnua
lrev
iew
s.or
g A
cces
s pr
ovid
ed b
y O
ld D
omin
ion
Uni
vers
ity o
n 04
/23/
18. F
or p
erso
nal u
se o
nly.

ANRV309-FM ARI 4 April 2007 13:29
Annual Review ofEarth andPlanetary Sciences
Volume 35, 2007
Contents
FrontispieceRobert N. Clayton � � � � � � � � � � � � � � � � � � � � � � � � � � � � � � � � � � � � � � � � � � � � � � � � � � � � � � � � � � � � � � � � � � � � � � � � �xiv
Isotopes: From Earth to the Solar SystemRobert N. Clayton � � � � � � � � � � � � � � � � � � � � � � � � � � � � � � � � � � � � � � � � � � � � � � � � � � � � � � � � � � � � � � � � � � � � � � � � � � 1
Reaction Dynamics, Molecular Clusters, and Aqueous GeochemistryWilliam H. Casey and James R. Rustad � � � � � � � � � � � � � � � � � � � � � � � � � � � � � � � � � � � � � � � � � � � � � � � � � 21
The Aral Sea DisasterPhilip Micklin � � � � � � � � � � � � � � � � � � � � � � � � � � � � � � � � � � � � � � � � � � � � � � � � � � � � � � � � � � � � � � � � � � � � � � � � � � � � � 47
Permo-Triassic Collision, Subduction-Zone Metamorphism, andTectonic Exhumation Along the East Asian Continental MarginW.G. Ernst, Tatsuki Tsujimori, Ruth Zhang, and J.G. Liou � � � � � � � � � � � � � � � � � � � � � � � � � � � 73
Climate Over the Past Two MillenniaMichael E. Mann � � � � � � � � � � � � � � � � � � � � � � � � � � � � � � � � � � � � � � � � � � � � � � � � � � � � � � � � � � � � � � � � � � � � � � � � �111
Microprobe Monazite Geochronology: Understanding GeologicProcesses by Integrating Composition and ChronologyMichael L. Williams, Michael J. Jercinovic, and Callum J. Hetherington � � � � � � � � � � �137
The Earth, Source of Health and Hazards: An Introduction to Medical GeologyH. Catherine W. Skinner � � � � � � � � � � � � � � � � � � � � � � � � � � � � � � � � � � � � � � � � � � � � � � � � � � � � � � � � � � � � � � � �177
Using the Paleorecord to Evaluate Climate and Fire Interactions in AustraliaAmanda H. Lynch, Jason Beringer, Peter Kershaw, Andrew Marshall,Scott Mooney, Nigel Tapper, Chris Turney, and Sander Van Der Kaars � � � � � � � � � � � � � � �215
Wally Was Right: Predictive Ability of the North Atlantic “ConveyorBelt” Hypothesis for Abrupt Climate ChangeRichard B. Alley � � � � � � � � � � � � � � � � � � � � � � � � � � � � � � � � � � � � � � � � � � � � � � � � � � � � � � � � � � � � � � � � � � � � � � � � � �241
Microsampling and Isotopic Analysis of Igneous Rocks: Implicationsfor the Study of Magmatic SystemsJ.P. Davidson, D.J. Morgan, B.L.A. Charlier, R. Harlou, and J.M. Hora � � � � � � � � � �273
Balancing the Global Carbon BudgetR.A. Houghton � � � � � � � � � � � � � � � � � � � � � � � � � � � � � � � � � � � � � � � � � � � � � � � � � � � � � � � � � � � � � � � � � � � � � � � � � � � �313
Long-Term Perspectives on Giant Earthquakes and Tsunamis atSubduction ZonesKenji Satake and Brian F. Atwater � � � � � � � � � � � � � � � � � � � � � � � � � � � � � � � � � � � � � � � � � � � � � � � � � � � � � �349
vii
Ann
u. R
ev. E
arth
Pla
net.
Sci.
2007
.35:
241-
272.
Dow
nloa
ded
from
ww
w.a
nnua
lrev
iew
s.or
g A
cces
s pr
ovid
ed b
y O
ld D
omin
ion
Uni
vers
ity o
n 04
/23/
18. F
or p
erso
nal u
se o
nly.

ANRV309-FM ARI 4 April 2007 13:29
Biogeochemistry of Glacial Landscape SystemsSuzanne Prestrud Anderson � � � � � � � � � � � � � � � � � � � � � � � � � � � � � � � � � � � � � � � � � � � � � � � � � � � � � � � � � � � � �375
The Evolution of Trilobite Body PatterningNigel C. Hughes � � � � � � � � � � � � � � � � � � � � � � � � � � � � � � � � � � � � � � � � � � � � � � � � � � � � � � � � � � � � � � � � � � � � � � � � � �401
The Early Origins of Terrestrial C4 PhotosynthesisBrett J. Tipple and Mark Pagani � � � � � � � � � � � � � � � � � � � � � � � � � � � � � � � � � � � � � � � � � � � � � � � � � � � � � � � �435
Stable Isotope-Based PaleoaltimetryDavid B. Rowley and Carmala N. Garzione � � � � � � � � � � � � � � � � � � � � � � � � � � � � � � � � � � � � � � � � � � �463
The Arctic Forest of the Middle EoceneA. Hope Jahren � � � � � � � � � � � � � � � � � � � � � � � � � � � � � � � � � � � � � � � � � � � � � � � � � � � � � � � � � � � � � � � � � � � � � � � � � � �509
Finite Element Analysis and Understanding the Biomechanicsand Evolution of Living and Fossil OrganismsEmily J. Rayfield � � � � � � � � � � � � � � � � � � � � � � � � � � � � � � � � � � � � � � � � � � � � � � � � � � � � � � � � � � � � � � � � � � � � � � � � �541
Chondrites and the Protoplanetary DiskEdward R.D. Scott � � � � � � � � � � � � � � � � � � � � � � � � � � � � � � � � � � � � � � � � � � � � � � � � � � � � � � � � � � � � � � � � � � � � � � �577
Hemispheres Apart: The Crustal Dichotomy on MarsThomas R. Watters, Patrick J. McGovern, and Rossman P. Irwin III � � � � � � � � � � � � � � � �621
Advanced Noninvasive Geophysical Monitoring TechniquesRoel Snieder, Susan Hubbard, Matthew Haney, Gerald Bawden,Paul Hatchell, André Revil, and DOE Geophysical Monitoring Working Group � � � � �653
Models of Deltaic and Inner Continental Shelf Landform EvolutionSergio Fagherazzi and Irina Overeem � � � � � � � � � � � � � � � � � � � � � � � � � � � � � � � � � � � � � � � � � � � � � � � � � �685
Metal Stable Isotopes in PaleoceanographyAriel D. Anbar and Olivier Rouxel � � � � � � � � � � � � � � � � � � � � � � � � � � � � � � � � � � � � � � � � � � � � � � � � � � � � �717
Tectonics and Climate of the Southern Central AndesM.R. Strecker, R.N. Alonso, B. Bookhagen, B. Carrapa, G.E. Hilley,E.R. Sobel, and M.H. Trauth � � � � � � � � � � � � � � � � � � � � � � � � � � � � � � � � � � � � � � � � � � � � � � � � � � � � � � � � � � � �747
Indexes
Cumulative Index of Contributing Authors, Volumes 25–35 � � � � � � � � � � � � � � � � � � � � � � � �789
Cumulative Index of Chapter Titles, Volumes 25–35 � � � � � � � � � � � � � � � � � � � � � � � � � � � � � � � � �793
Errata
An online log of corrections to Annual Review of Earth and Planetary Scienceschapters (if any, 1997 to the present) may be found at http://earth.annualreviews.org
viii Contents
Ann
u. R
ev. E
arth
Pla
net.
Sci.
2007
.35:
241-
272.
Dow
nloa
ded
from
ww
w.a
nnua
lrev
iew
s.or
g A
cces
s pr
ovid
ed b
y O
ld D
omin
ion
Uni
vers
ity o
n 04
/23/
18. F
or p
erso
nal u
se o
nly.