wall teichoic acids govern cationic gold nanoparticle
TRANSCRIPT

ChemicalScience
EDGE ARTICLE
Ope
n A
cces
s A
rtic
le. P
ublis
hed
on 2
3 M
arch
202
0. D
ownl
oade
d on
2/1
4/20
22 1
:39:
53 A
M.
Thi
s ar
ticle
is li
cens
ed u
nder
a C
reat
ive
Com
mon
s A
ttrib
utio
n-N
onC
omm
erci
al 3
.0 U
npor
ted
Lic
ence
.
View Article OnlineView Journal | View Issue
Wall teichoic aci
aDepartment of Chemistry, University of
Avenue, Madison, WI 53706, USA. E-mail: jbChemistry Department, Augsburg University
[email protected] of Chemistry, University of MindDepartment of Chemistry, University of Pen
PA 19104, USAeEnvironmental Chemistry and Technolog
Madison, 660 North Part Street, Madison, WfDepartment of Soil Science, University of
Drive, Madison, WI 53706, USA
Cite this: Chem. Sci., 2020, 11, 4106
All publication charges for this articlehave been paid for by the Royal Societyof Chemistry
Received 29th October 2019Accepted 20th March 2020
DOI: 10.1039/c9sc05436g
rsc.li/chemical-science
4106 | Chem. Sci., 2020, 11, 4106–411
ds govern cationic goldnanoparticle interaction with Gram-positivebacterial cell walls†
Emily R. Caudill, a Rodrigo Tapia Hernandez, ‡b Kyle P. Johnson,§c
James T. O'Rourke, {a Lingchao Zhu,kd Christy L. Haynes, c Z. Vivian Feng *b
and Joel A. Pedersen *aefg
Molecular-level understanding of nanomaterial interactions with bacterial cell surfaces can facilitate design
of antimicrobial and antifouling surfaces and inform assessment of potential consequences of nanomaterial
release into the environment. Here, we investigate the interaction of cationic nanoparticles with the main
surface components of Gram-positive bacteria: peptidoglycan and teichoic acids. We employed intact cells
and isolated cell walls from wild type Bacillus subtilis and two mutant strains differing in wall teichoic acid
composition to investigate interaction with gold nanoparticles functionalized with cationic, branched
polyethylenimine. We quantified nanoparticle association with intact cells by flow cytometry and
determined sites of interaction by solid-state 31P- and 13C-NMR spectroscopy. We find that wall teichoic
acid structure and composition were important determinants for the extent of interaction with cationic
gold nanoparticles. The nanoparticles interacted more with wall teichoic acids from the wild type and
mutant lacking glucose in its wall teichoic acids than those from the mutant having wall teichoic acids
lacking alanine and exhibiting more restricted molecular motion. Our experimental evidence supports
the interpretation that electrostatic forces contributed to nanoparticle–cell interactions and that the
accessibility of negatively charged moieties in teichoic acid chains influences the degree of interaction.
The approaches employed in this study can be applied to engineered nanomaterials differing in core
composition, shape, or surface functional groups as well as to other types of bacteria to elucidate the
influence of nanoparticle and cell surface properties on interactions with Gram-positive bacteria.
Introduction
A molecular-level understanding of nanomaterial interactionswith bacterial cell surfaces is needed to effectively designnanomaterial-enabled products intended to modulate bacterialpopulations (e.g., antimicrobials, antifouling surfaces) and forassessing the potential effects of engineered nanomaterialsreleased into the environment. The increase in engineerednanomaterial production and their incorporation intocommercial products makes their introduction into the envi-ronment inevitable during some portion of their life cycle.1
Wisconsin-Madison, 1101 University
, Minneapolis, MN 55454, USA. E-mail:
nesota, Minneapolis, MN 55455, USA
nsylvania, 231 S 34th St, Philadelphia,
y Program, University of Wisconsin-
I 53706, USA
Wisconsin-Madison, 1525 Observatory
8
Bacteria are vital to many biogeochemical processes and mayplay a role in the introduction of nanomaterials into some foodwebs. Molecular-level insight into the interactions of bacteriawith nanomaterials may facilitate their design to either targetharmful bacteria more effectively or reduce their negativeimpacts on benecial microbiota.
The distinct cell envelope architectures of Gram-negativeand Gram-positive bacteria2 lead to the expectation that theirinteractions with charged nanoparticles differ, as indeed hasbeen shown in earlier studies.3–7 The Gram-negative cell enve-lope is composed of two phospholipid membranes with a thin
gDepartment of Civil & Environmental Engineering, University of Wisconsin-
Madison, 1415 Engineering Drive, Madison, WI 53706, USA
† Electronic supplementary information (ESI) available. See DOI:10.1039/c9sc05436g
‡ Current address: Department of Chemistry, University of Illinois atUrbana-Champaign, 505 South Matthews, Urbana, IL 61801, USA.
§ Current address: 3M Center, Saint Paul, MN 55144, USA.
{ Current address: Carteret Community College, 3505 Arendell Street,Morehead City, NC 28557, USA.
k Current address: Department of Chemistry, University of California-Riverside,501 Big Springs Road, Riverside, CA 92521, USA.
This journal is © The Royal Society of Chemistry 2020

Fig. 1 Gram-positive bacterial cell wall, including cytoplasmicmembrane (blue), peptidoglycan (light green), and teichoic acids (redand green). Structures with labelled carbons of (a) the poly(-glycerolphosphate) backbone, alanine and glucose side chains,disaccharide linkage unit between the peptidoglycan and wall teichoicacids, and (b) the sugar and amino acid residues in peptidoglycan areshown. (c) Pictorial representations of the cells prior to sacculi isolationof the three species. The wall teichoic acid of wild type contains bothalanine and glucose, that of DtagE contains only alanine, and that ofDdltA contains only glucose. Abbreviations: ManNAc, N-ace-tylmannosamine; Glc, glucose; GlcNAc, N-acetylglucosamine; Mur-NAc,N-acetylmuramic acid; D-Lac, D-lactyl; L-Ala, L-alanyl; D-g-Glu, D-g-glutamyl; meso-A2pm, meso-diaminopimelyl; D-Ala, D-alanine.
Edge Article Chemical Science
Ope
n A
cces
s A
rtic
le. P
ublis
hed
on 2
3 M
arch
202
0. D
ownl
oade
d on
2/1
4/20
22 1
:39:
53 A
M.
Thi
s ar
ticle
is li
cens
ed u
nder
a C
reat
ive
Com
mon
s A
ttrib
utio
n-N
onC
omm
erci
al 3
.0 U
npor
ted
Lic
ence
.View Article Online
layer of peptidoglycan sandwiched between them; the outerleaet of the outer membrane is composed primarily of lipo-polysaccharides. In contrast, Gram-positive bacterial cells arebounded by a single cell membrane, which includes lip-oteichoic acids anchored into it, and a thick cell wall composedof peptidoglycan with covalently attached wall teichoic acids(WTAs). Previous investigation of electrostatically driven asso-ciation of nanoparticles with the Gram-negative bacterial outermembrane employed intact and lipopolysaccharide-depletedbacteria and supported lipid bilayers incorporating lipopoly-saccharides to demonstrate that lipopolysaccharide structureinuenced the extent and distance from the outer membranelipid bilayer of nanoparticle binding.8 Experimental modelingGram-positive cell surfaces to probe the nanomaterial–bacte-rium interface requires a different approach be taken. Theprominent Gram-positive bacterial cell wall surface structureslack lipid-like character, precluding the use of lipid bilayers tostudy interactions with nanoparticles. Also, given that teichoicacids can account for up to 50% of the mass of the cell wall9 andassist in maintaining cation homeostasis for the cell, under-standing their role in interacting with nanoparticles is vital,particularly for nanoparticles functionalized with cationicgroups.10
For Bacillus subtilis SB491, a Gram-positive bacterium foundin soil and in human and ruminant gastrointestinal tracts, thehydroxyl groups of the glycerol units of the wall teichoic acidpoly(glycerolphosphate) backbone can be substituted withglucose (Glc) or alanine (Ala) residues (Fig. 1). Wall teichoicacids are covalently bound to cell wall peptidoglycan viaa phosphodiester bond formed between the phosphate groupbound to the N-acetylglucosamine (GlcNAc) residue in the WTAdisaccharide linkage unit and the C6 hydroxyl of N-acetylmur-amic acid (MurNAc) residue in peptidoglycan. Each WTAmolecule contains between 45 to 60 glycerolphosphate units.11
Peptidoglycan is composed of alternating N-acetylglucosamine(GlcNAc) andMurNAc residues, connected via aMurNAc D-lactylgroup to a tetrapeptide (L-alanyl-D-g-glutamyl-meso-dia-minopimelyl-D-alanine). The D-Ala of the tetrapeptide is boundto the meso-diaminopimelyl of a pentapeptide (L-alanyl-D-g-glutamyl-meso-diaminopimelyl-D-alanine-D-alanine), which inturn is bound to another MurNAc residue. Approximately everyninth MurNAc unit contains an attached WTA polymer. ForBacillus subtilis, the crosslinking of peptidoglycan strandsresults in a meshwork having a reported effective pore size of4.24 or 5 nm.12,13
Bacteria synthesize WTAs within the cytoplasm and trans-locate them through the cell membrane. Prior to translocation,Glc is added to the C2 hydroxyl of the WTA glycerol via the wallteichoic acid glycosyltransferase Tag E (encoded by the teichoicacid glycerol (tagE) gene).14 Aer translocation, a proposed D-alanyl carrier protein ligase (encoded by the D-alanyl-lipoteichoic acid A (dltA) gene) attaches D-Ala to the WTAs alsoto the C2 hydroxyl of the WTA glycerol.10,15 In the lipoteichoicacids of B. subtilis, approximately 9% of the glycerolphosphatemoieties become substituted with D-Ala and 64%with Glc.15 Thedegree of substitutions of wall teichoic acids have not been re-ported to our knowledge. Deletion of the tagE gene results in
This journal is © The Royal Society of Chemistry 2020
elaboration of WTA lacking Glc attached to the poly(-glycerolphosphate) backbone.14 Deletion of genes in the dltoperon of B. subtilis results in the production of teichoic acidslacking D-Ala and a concomitant increase in methicillinsusceptibility.16 Similarly, the absence of D-alanylation in Gram-positive Lactococcus lactis resulted in decreased resistance tocationic antimicrobials nisin and lysozyme.17 These resultsreinforce the notion that the lack of D-Ala in teichoic acids can
Chem. Sci., 2020, 11, 4106–4118 | 4107

Fig. 2 Assessment of the surface charge of intact wild type and WTAmutant Bacillus subtilis cells: (a) electrophoretic mobility of cells and(b) reduction in absorption at 530 nm to assess the binding of cationiccytochrome c to intact cells; a larger reduction in A530 nm correspondsto a more negative cell surface charge (**, p < 0.01). The DtagE andDdltA mutants lack glucose and alanine residues, respectively, in theirwall teichoic acids.
Chemical Science Edge Article
Ope
n A
cces
s A
rtic
le. P
ublis
hed
on 2
3 M
arch
202
0. D
ownl
oade
d on
2/1
4/20
22 1
:39:
53 A
M.
Thi
s ar
ticle
is li
cens
ed u
nder
a C
reat
ive
Com
mon
s A
ttrib
utio
n-N
onC
omm
erci
al 3
.0 U
npor
ted
Lic
ence
.View Article Online
alter interaction of the cell surface with external factors, such asantimicrobial agents and potentially nanomaterials.
In the present study, we investigated the interactions of WTAfrom the Gram-positive bacterium Bacillus subtilis with goldnanoparticles functionalized with cationic branched poly-ethylenimine (bPEI-AuNPs). The bPEI-AuNPs were chosen forthe colloidal stability conferred by their strong positive charge(vide infra) as well as for the availability of bPEI for use as anexperimental control. We focused on the cell surface compo-nents responsible for the interaction of cationic nanoparticleswith bacterial cell surfaces because prior investigation demon-strated negligible interaction of wild type B. subtilis cells withanionic gold nanoparticles.3 We employed three strains of B.subtilis possessing the same peptidoglycan structure butdiffering in WTA structure due to genetic modications: wildtype (SB 491), the tagE knockout strain DtagE with non-glycosylated WTA, and the dltA knockout strain DdltA withWTA lacking D-Ala. Experiments employed intact cells orbacterial exoskeletons (sacculi) composed of peptidoglycan andcovalently bound WTAs. We note that the sacculi did notinclude lipoteichoic acids which are anchored in the cellmembrane or can be noncovalently associated with the pepti-doglycan matrix.11 Stable isotope-labelled sacculi were used tofacilitate investigation of nanoparticle interaction with WTAand peptidoglycan via solid-state nuclear magnetic resonance(NMR) spectroscopy. Solid-state NMR has been previouslyapplied to characterize WTA of different bacterial species,propose divalent cation binding sites on bacterial sacculi,investigate the interaction of cationic polymers with sacculi,and determine the inuence of antibiotics on cell wall compo-sition.18–20 To our knowledge, the present work represents therst solid-state NMR investigation of nanomaterial interactionwith bacterial cell wall components. Flow cytometry performedon intact bacterial cells showed that WTA composition impactscationic gold nanoparticle association with bacterial cells.Solid-state 31P- and 13C-NMR experiments performed onhydrated sacculi allowed identication of the chemical groupsin peptidoglycan and WTA involved in binding.
Results and discussionBacterial cell surface charge
We investigated the interaction of cationic bPEI-AuNPs with thesurfaces of wild type and WTA-mutant Gram-positive Bacillussubtilis cells. We hypothesized that bPEI-AuNP association withthe cell surfaces is governed predominantly by electrostaticinteractions. We evaluated the impact of the genetic mutationson overall cell surface charge by two approaches: whole-cellelectrophoretic mobility (ue) measurement and the binding ofthe cationic protein cytochrome c. The permeability of bacterialsurface structures (e.g., WTA) to ions and water (i.e., the “so-ness” of the surface) precludes determination of cell surface z-potential from electrophoretic mobility measurements.21 Wetherefore compared electrophoretic mobilities of the bacterialcells directly22,23 recognizing that in addition to the potential atthe polyelectrolyte–solution interface, ue depends on thethickness, charge density, permeability, and homogeneity of the
4108 | Chem. Sci., 2020, 11, 4106–4118
so layer.24 All three strains exhibited negative electrophoreticmobility (Fig. 2a), largely attributable to the phosphate groupsin the WTA on the cell surfaces. The electrophoretic mobilitiesof the three strains were statistically indistinguishable.
We measured the binding capacity of the cationic proteincytochrome c (+8 at pH 7) for B. subtilis cells of each strain asa proxy for their relative amounts of anionic surface charge. Theabsorbance of cytochrome c solutions at 530 nm was used todetermine the amount of the protein removed from solutionupon exposure to bacterial suspensions to provide a measure ofthe amount of negative charge on the cell surfaces.16 Fig. 2bshows that the reduction in A530 was larger for DtagE strain thanfor theDdltA strain indicating that the former possessed a largernumber of negatively charged surface sites. The extent of cyto-chrome c binding to the wild type and DdltA strains wasstatistically indistinguishable, suggesting comparable anionicsurface site densities. This and the equivalent ue for thesestrains contrasts with earlier reports of increased negativesurface charge in dltA-gene deleted strains.11,16 Our results are,however, consistent with those reported for a different Gram-positive bacterium, Lactococcus lactis, for which changes inthe extent of D-alanization did not impact electrophoreticmobility.17
WTA composition
To verify that the B. subtilis mutants expressed the expectedphenotypes, we examined the Ala and Glc contents of WTAisolated from the three strains. We hydrolyzed Ala from WTAand derivatized it with Marfey's reagent to allow detection viaabsorbance at 820 nm.25,26 D-Ala was clearly present inWTA fromboth wild type and DtagE strains, but was signicantly dimin-ished in the DdltA sample (Fig. S1†). The clear differences in thechromatograms indicate that knockout of the D-alanyl-lipoteichoic acid A (DdltA) gene resulted in the expectedphenotype.
We conducted solution 31P-NMR experiments to obtainevidence for the Glc content of isolated WTA from each B.subtilis strain. Fig. 3 compares the 31P-NMR spectra from thestrains collected using a pulse sequence to directly observe Pnuclei. The 31P-NMR spectra of isolated WTA exhibit three mainpeaks centered at approximately 0.73 (peak A), 0.38 (peak B),
This journal is © The Royal Society of Chemistry 2020
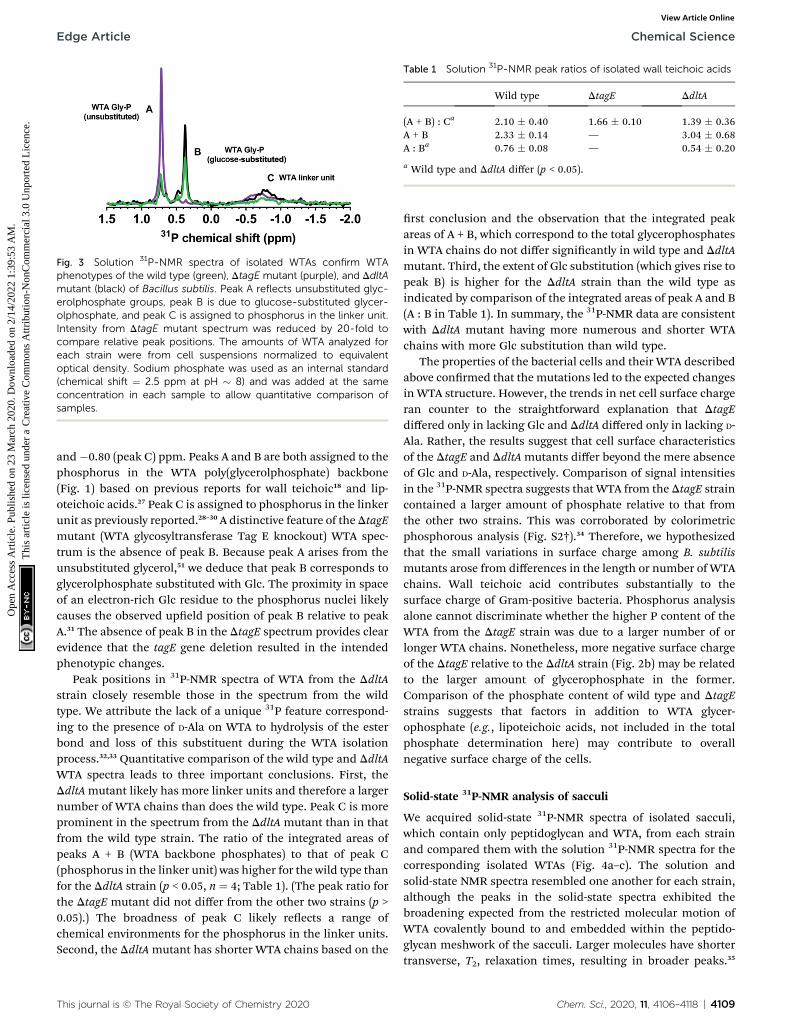
Fig. 3 Solution 31P-NMR spectra of isolated WTAs confirm WTAphenotypes of the wild type (green), DtagE mutant (purple), and DdltAmutant (black) of Bacillus subtilis. Peak A reflects unsubstituted glyc-erolphosphate groups, peak B is due to glucose-substituted glycer-olphosphate, and peak C is assigned to phosphorus in the linker unit.Intensity from DtagE mutant spectrum was reduced by 20-fold tocompare relative peak positions. The amounts of WTA analyzed foreach strain were from cell suspensions normalized to equivalentoptical density. Sodium phosphate was used as an internal standard(chemical shift ¼ 2.5 ppm at pH � 8) and was added at the sameconcentration in each sample to allow quantitative comparison ofsamples.
Table 1 Solution 31P-NMR peak ratios of isolated wall teichoic acids
Wild type DtagE DdltA
(A + B) : Ca 2.10 � 0.40 1.66 � 0.10 1.39 � 0.36A + B 2.33 � 0.14 — 3.04 � 0.68A : Ba 0.76 � 0.08 — 0.54 � 0.20
a Wild type and DdltA differ (p < 0.05).
Edge Article Chemical Science
Ope
n A
cces
s A
rtic
le. P
ublis
hed
on 2
3 M
arch
202
0. D
ownl
oade
d on
2/1
4/20
22 1
:39:
53 A
M.
Thi
s ar
ticle
is li
cens
ed u
nder
a C
reat
ive
Com
mon
s A
ttrib
utio
n-N
onC
omm
erci
al 3
.0 U
npor
ted
Lic
ence
.View Article Online
and�0.80 (peak C) ppm. Peaks A and B are both assigned to thephosphorus in the WTA poly(glycerolphosphate) backbone(Fig. 1) based on previous reports for wall teichoic18 and lip-oteichoic acids.27 Peak C is assigned to phosphorus in the linkerunit as previously reported.28–30 A distinctive feature of theDtagEmutant (WTA glycosyltransferase Tag E knockout) WTA spec-trum is the absence of peak B. Because peak A arises from theunsubstituted glycerol,51 we deduce that peak B corresponds toglycerolphosphate substituted with Glc. The proximity in spaceof an electron-rich Glc residue to the phosphorus nuclei likelycauses the observed upeld position of peak B relative to peakA.31 The absence of peak B in the DtagE spectrum provides clearevidence that the tagE gene deletion resulted in the intendedphenotypic changes.
Peak positions in 31P-NMR spectra of WTA from the DdltAstrain closely resemble those in the spectrum from the wildtype. We attribute the lack of a unique 31P feature correspond-ing to the presence of D-Ala on WTA to hydrolysis of the esterbond and loss of this substituent during the WTA isolationprocess.32,33 Quantitative comparison of the wild type and DdltAWTA spectra leads to three important conclusions. First, theDdltAmutant likely has more linker units and therefore a largernumber of WTA chains than does the wild type. Peak C is moreprominent in the spectrum from the DdltA mutant than in thatfrom the wild type strain. The ratio of the integrated areas ofpeaks A + B (WTA backbone phosphates) to that of peak C(phosphorus in the linker unit) was higher for the wild type thanfor the DdltA strain (p < 0.05, n ¼ 4; Table 1). (The peak ratio forthe DtagE mutant did not differ from the other two strains (p >0.05).) The broadness of peak C likely reects a range ofchemical environments for the phosphorus in the linker units.Second, the DdltAmutant has shorter WTA chains based on the
This journal is © The Royal Society of Chemistry 2020
rst conclusion and the observation that the integrated peakareas of A + B, which correspond to the total glycerophosphatesin WTA chains do not differ signicantly in wild type and DdltAmutant. Third, the extent of Glc substitution (which gives rise topeak B) is higher for the DdltA strain than the wild type asindicated by comparison of the integrated areas of peak A and B(A : B in Table 1). In summary, the 31P-NMR data are consistentwith DdltA mutant having more numerous and shorter WTAchains with more Glc substitution than wild type.
The properties of the bacterial cells and their WTA describedabove conrmed that the mutations led to the expected changesin WTA structure. However, the trends in net cell surface chargeran counter to the straightforward explanation that DtagEdiffered only in lacking Glc and DdltA differed only in lacking D-Ala. Rather, the results suggest that cell surface characteristicsof the DtagE and DdltAmutants differ beyond the mere absenceof Glc and D-Ala, respectively. Comparison of signal intensitiesin the 31P-NMR spectra suggests that WTA from the DtagE straincontained a larger amount of phosphate relative to that fromthe other two strains. This was corroborated by colorimetricphosphorous analysis (Fig. S2†).34 Therefore, we hypothesizedthat the small variations in surface charge among B. subtilismutants arose from differences in the length or number of WTAchains. Wall teichoic acid contributes substantially to thesurface charge of Gram-positive bacteria. Phosphorus analysisalone cannot discriminate whether the higher P content of theWTA from the DtagE strain was due to a larger number of orlonger WTA chains. Nonetheless, more negative surface chargeof the DtagE relative to the DdltA strain (Fig. 2b) may be relatedto the larger amount of glycerophosphate in the former.Comparison of the phosphate content of wild type and DtagEstrains suggests that factors in addition to WTA glycer-ophosphate (e.g., lipoteichoic acids, not included in the totalphosphate determination here) may contribute to overallnegative surface charge of the cells.
Solid-state 31P-NMR analysis of sacculi
We acquired solid-state 31P-NMR spectra of isolated sacculi,which contain only peptidoglycan and WTA, from each strainand compared them with the solution 31P-NMR spectra for thecorresponding isolated WTAs (Fig. 4a–c). The solution andsolid-state NMR spectra resembled one another for each strain,although the peaks in the solid-state spectra exhibited thebroadening expected from the restricted molecular motion ofWTA covalently bound to and embedded within the peptido-glycan meshwork of the sacculi. Larger molecules have shortertransverse, T2, relaxation times, resulting in broader peaks.35
Chem. Sci., 2020, 11, 4106–4118 | 4109

Fig. 4 Solution and solid-state 31P-NMR spectra for (a) wild type, (b)DtagE, and (c)DdltA strains of Bacillus subtilis. Dashed lines in the solid-state spectra indicate deconvolved peaks. Peak A reflects unsub-stituted glycerolphosphate groups, peak B is due to glucose-substituted glycerolphosphate, and peak C is assigned to phosphorusin the linker unit. Sodium phosphate (at 2.5 ppm) and hexamethyl-phosphoramide (at 29.97 ppm) were used as internal standards for thesolution and solid-state spectra, respectively.
Fig. 5 Solid-state 13C-NMR spectra of sacculi from (a) wild type, (b)DtagE, and (c) DdltA strains of Bacillus subtilis. Arrows in black indicatepeaks tentatively assigned to Glc carbons. The peaks are assigned asfollows: (1) carbonyl carbons in peptidoglycan amino acid and aminosugar residues and in WTA linker unit amino sugar residues; (2) C3 inthe peptidoglycan amino sugar residues; (3) C2 in the peptidoglycanand WTA linker unit amino sugar residues; (4) methyl groups in thepeptidoglycan and WTA linker unit amino sugar residues; (5) glycerolC1 and C3; (6) glycerol C2 (blue arrow); (7) C1 from Glc (tentative); (8)C2, C3, and C5 fromGlc (tentative); (9) C4 fromGlc (tentative); and (10)
Chemical Science Edge Article
Ope
n A
cces
s A
rtic
le. P
ublis
hed
on 2
3 M
arch
202
0. D
ownl
oade
d on
2/1
4/20
22 1
:39:
53 A
M.
Thi
s ar
ticle
is li
cens
ed u
nder
a C
reat
ive
Com
mon
s A
ttrib
utio
n-N
onC
omm
erci
al 3
.0 U
npor
ted
Lic
ence
.View Article Online
Peak shis are presented in Tables S1 and S2,† and additionalobservations are provided in the ESI.†
The positions of peaks A and B differ slightly in the decon-volved solid-state spectra for wild type (Fig. 4a) and DdltA(Fig. 4c) relative to the solution NMR spectra; this is attributableto either the presence of shoulders on the peaks in the solutionspectra or differences in chemical environment of the phos-phorus nuclei (i.e., the presence of peptidoglycan in the sacculisamples). Overall, the close resemblance of 31P-NMR spectra ofisolated WTA and cell wall sacculi suggests that the phosphorussignals in the sacculi samples arise exclusively from WTA,conrming the purity of the isolated sacculi with respect toother P-containing species. Though unlikely given the thoroughwashing steps, any phospholipids remaining in the sacculi orWTA samples would produce signals in the same spectralregion (between 1 and �1 ppm).36,37 Specically, the 31P
4110 | Chem. Sci., 2020, 11, 4106–4118
chemical shis produced by phosphatidylethanolamine andphosphatidylglycerol lipids (the dominant phospholipids inGram-positive bacterial membranes) occur at approximately�0.25 ppm and 0.24 ppm, respectively.38 The absence of suchpeaks conrms the purity of both sacculi and isolated WTA.
Solid-state 13C-NMR analysis of sacculi
We further probed the sacculi by solid-state 13C-NMR (Fig. 5).Labeled structures are in Fig. 1 and enlarged in Fig. S3.† Peaksin these spectra reect the C atoms in the peptidoglycan aminoacid and amino sugar residues and in the WTA (amino) sugarresidues and glycerol. The four large peaks dominating thespectra reect the most abundant cell wall components, whichare primarily associated with the GlcNAc and MurNAc aminosugar residues in peptidoglycan. Peak assignments were basedon previous reports39,40 and are provided in Table S3.† Thecarbons of the WTA glycerol and Glc (when present) producesmaller peaks. The Glc carbon peaks were oen difficult todiscern; we consider the assignments of these peaks tentative.The other smaller peaks reect the remaining C atoms in theamino sugar residues in peptidoglycan and theWTA linker unit,and the peptide and D-lactyl group in peptidoglycan.
The 13C spectra for the three strains closely resemble oneanother with respect to peak positions. The peaks attributed toGlc residues were quite small and are indicated in Fig. 5 byarrows in the spectra of the sacculi from the wild type and DdltAstrains; these peaks are displayed more clearly in Fig. S4.† Wallteichoic acid from the wild type and DdltA strains contains Glc,while the WTA of DtagE is unsubstituted (see also Fig. 4). Giventhe nature of cross polarization experiments, rigorous,
C6 from Glc (tentative).
This journal is © The Royal Society of Chemistry 2020

Edge Article Chemical Science
Ope
n A
cces
s A
rtic
le. P
ublis
hed
on 2
3 M
arch
202
0. D
ownl
oade
d on
2/1
4/20
22 1
:39:
53 A
M.
Thi
s ar
ticle
is li
cens
ed u
nder
a C
reat
ive
Com
mon
s A
ttrib
utio
n-N
onC
omm
erci
al 3
.0 U
npor
ted
Lic
ence
.View Article Online
quantitative comparison of peak areas among the three strainsis not possible. Cross polarization transfers magnetization froma nearby network of abundant 1
2-spin nuclei (1H in our case) tothe observed nucleus (13C) during the contact period. Thus,peak intensity and area depend on both the abundance of theobserved nuclei and the number of protons on nearby carbonnuclei (within 3–4 A). The solution 31P-NMR results indicatedthat the DdltA strain contains more Glc than wild type. Wefurther note that the DtagE strain exhibited the largest 13Cchemical shi at C1 and C3 and the smallest at C2 of theglycerolphosphate (Table S3†).
To provide a measure of the rigidity of the peptidoglycanmeshwork and the covalently bound WTA molecules, wequantied longitudinal relaxation time-constants, T1, for
13C insacculi from the three B. subtilis strains using inversion-recoveryexperiments (Fig. S6 and S7†). Our analysis focused on nucleifor which we can assume dipole–dipole interaction dominatesrelaxation rather than chemical shi anisotropy. We thereforeomitted data from carbonyl carbons from the analysis. Relaxa-tion times were measured between �8 and 30 �C to determinethe molecular regime (small or large) based on the increase inmolecular motion with temperature. With the exception of Cgin the Glu residues of DtagE sacculi, T1 decreased as tempera-ture increased for all carbon nuclei analyzed (tted slopesshowed non-zero linear dependence; Fig. S5 and Table S4†). Forresidues exhibiting a decrease in T1 with increasing tempera-ture, larger T1 values indicate hampered motion and higherstructural rigidity and smaller T1 values reect more rapidrelaxation due to higher molecular motion.18,41
We determined T1 values for the13C nuclei in peptidoglycan
and WTA indicated in Fig. 6, as well as for Cg of Glu and Cb ofmeso-A2pm in peptidoglycan (Fig. S5†). We focused on peaksattributable solely to peptidoglycan or to WTA. At 30 �C, thetemperature closest to the sample temperature in the solid-stateNMR experiments, T1 values for peptidoglycan amino sugarresidues and the WTA glycerolphosphate of DdltA were largerthan those of the wild type and DtagE strains (Fig. 6). In
Fig. 6 T1 relaxation time constants at 30 �C for the indicated 13Cresonances of sacculi from wild type, DtagE, and DdltA strains of B.subtilis: GlcNAc C3 and MurNAc C5 of peptidoglycan, GlcNAc andMurNAc C4 of peptidoglycan, glycerolphosphate C1 and C3 of wallteichoic acids, and glycerolphosphate C2 of wall teichoic acids. Non-linear fit statistical significance: *, p < 0.05; **, p < 0.01. Error barsrepresent standard error in non-linear fitting from T1 relaxation timeequation. See Fig S6† for T1 relaxation times for other temperatures.Abbreviations: GlcNAc, N-acetylglucosamine; MurNAc, N-ace-tylmuramic acid.
This journal is © The Royal Society of Chemistry 2020
particular, T1 of C2 (the location of Glc substitution in the wildtype andDdltA strains) was larger inDdltA than for wild type andDtagE, reecting more restrictedmolecular motion for theDdltAstrain. Differences among T1 values for the three strains werealso apparent at 18 and 12 �C, but not at lower temperatures (p >0.05; Fig. S6†). The T1 values indicate that the molecular motionof peptidoglycan strands from the DdltA strain are morerestricted than those from the wild type and DtagE strains,which exhibit similar molecular motion. Likewise, the WTAfrom the DdltA strain exhibits more restricted molecular motionthan does that from the other two strains. The glycer-olphosphate carbons bearing –OH groups (viz. C1 and C3)exhibit somewhat higher molecular motion in the DtagE strainthan in the other two strains. For resonances associated withamino acid residues in peptidoglycan, T1 values did not differamong the three strains at any temperature (p > 0.05).
The lower molecular motion of WTA in DdltA sacculi relativeto those of the other two strains is consistent with the moreabundant Glc substitution of its glycerolphosphate (Table 1),the larger number of WTA molecules bound to peptidoglycan(Fig. 3), and less protrusion into solution due to fewer glycer-olphosphate repeat units per WTA molecule (Fig. S7†). As notedabove, the DdltA strain appears to produce a larger number ofshorter WTA molecules than the other two strains. Shorter WTAstrands dissipate energy less efficiently, leading to longerrelaxation times. Both solution 31P-NMR and phosphorusanalysis indicate that the DtagE strain contains the most glyc-erophosphate groups, although this strain lacks Glc side chains,and the distance that WTA molecules protrude beyond thepeptidoglycan meshwork is unknown. Overall, we hypothesizethat differences in molecular motion result from the differencein type and number of substituents on the WTA glycerol, andthe extent to which the WTA molecules protrude from thepeptidoglycan layer. Specically, the glycerol substituent Glc islarger than –OH; high amounts of Glc substitution and closeproximity of Glc residues to other Glc residues would slow themolecular motion of WTA. Furthermore, more hinderedmolecular motion is expected for shorter WTA as they extendinto solution from the peptidoglycan matrix to a smaller degree.
Nanoparticle properties
To investigate the differential interactions between the B. sub-tilis strains and cationic nanoparticles, we exposed the bacteriato bPEI-AuNPs with core diameters of 10.9 � 1.8 nm as indi-cated by their localized surface plasmon resonance peak,42 ingood agreement with the diameter reported by the manufac-turer based on analysis of transmission electron microscopyimages (12.1 � 0.8 nm). We characterized the hydrodynamicand electrokinetic properties of the particles in 0.025 M NaClbuffered to pH 7.4 with 0.002 M HEPES, the solution we used tostudy the interaction of the bPEI-AuNPs with intact cells. Underthese solution conditions, the number mean hydrodynamicdiameter was 37.7 � 0.3 nm, and the z-potential was +23 �5.9 mV. The bPEI ligands are covalently attached to the nano-particle surfaces. Nevertheless, we determined that a 0.93 nM
Chem. Sci., 2020, 11, 4106–4118 | 4111

Chemical Science Edge Article
Ope
n A
cces
s A
rtic
le. P
ublis
hed
on 2
3 M
arch
202
0. D
ownl
oade
d on
2/1
4/20
22 1
:39:
53 A
M.
Thi
s ar
ticle
is li
cens
ed u
nder
a C
reat
ive
Com
mon
s A
ttrib
utio
n-N
onC
omm
erci
al 3
.0 U
npor
ted
Lic
ence
.View Article Online
solution of bPEI-AuNPs contained 792 � 72 nM bPEI, using thereported average molecular mass for bPEI of 25 000 Da.
Fig. 8 Solid-state 31P-NMR spectra for the (a) wild type (green), (b)DtagE (purple), and (c) DdltA (black) strains before and after exposureto 34 nM bPEI-AuNPs and 29.12 mM free bPEI polymer. In (a) and (c),deconvolved spectra are shown with dashed lines. The orange tracesreflect phosphorus signals upon interaction with 34 nM AuNPs. Greytraces correspond to sacculi exposed to 29.12 mM free bPEI polymer,the estimated amount of free polymer in a 34 nM AuNP solution.Numerical values in green, purple, or black (sacculi for each strain),orange (with AuNPs), and grey (with free bPEI polymer) are the cor-responding chemical shifts for predominant peaks and deconvolvedshoulders.
Nanoparticle–cell surface association
We employed ow cytometry to quantify the number of B. sub-tilis cells of each strain that had bPEI-AuNPs associated withthem.3,8 We previously demonstrated that ow cytometry can beused to quantify the number of bacterial cells having AuNPsassociated with cell surfaces and that the measurementscorrelate well with qualitative TEM observations.3,43 Cells werestained with a membrane-permeant nucleic acid stain to allowintact cells to be sorted from cellular debris. The strong local-ized surface plasmon resonance scattering signal from theAuNPs allowed cells with surface-associated AuNPs to bediscriminated from those lacking associated AuNPs. Thedetected AuNP signals in ow cytometry did not necessarilyoriginate from individual AuNPs; previous TEM analyses haverevealed the likelihood of NP aggregation on bacterialsurfaces.3,6,7 Fig. 7 shows the proportion of cells from eachstrain with bPEI-AuNPs associated with their surfaces (of 104
bacterial cells). Fewer DdltA cells had AuNPs associated withthem than did the wild type and DtagE strains (p < 0.01). Nodifference was observed between the wild type and DtagEstrains.
To gain further insight into the chemical basis for thedifference in bPEI-AuNP association with cells from the threestrains, we employed solid-state 31P- and 13C-NMR. Solid-state31P-NMR spectra were collected from sacculi from the three B.subtilis strains before and aer exposure to 34 nM bPEI-AuNPsand to 29.1 mM free bPEI polymer, the estimated amount of freepolymer in a 34 nM AuNP solution (Fig. 8). For the wild type andDtagE strains, the peaks associated with backbone phosphatesshied upeld upon nanoparticle interaction (Table S2†). Forthe DdltA strain, the dominant peak in the spectrum (peak B)appears to shi downeld upon nanoparticle addition. For allthree strains, the peaks associated with backbone phosphatesshied substantially downeld upon exposure to free bPEIpolymer.
Upeld peak shis typically result from shielding due toaddition of electron density to the observed nuclei. Downeld
Fig. 7 Percentage of cells from each B. subtilis strain with surface-associated bPEI-AuNPs from flow cytometry measurements of 104
bacterial cells. Bacterial cultures were exposed for 10 min to 0.93 nMbPEI-AuNPs.
4112 | Chem. Sci., 2020, 11, 4106–4118
peak shis arise from deshielding, due to removal of electrondensity. The downeld peak shis observed for all strains uponexposure to bPEI polymer (grey traces in Fig. 8) reect removalof electron density from the P nuclei, likely due to formation ofhydrogen bonds between primary amines of bPEI and WTAphosphate oxygen.44 In contrast, addition of bPEI-AuNPsproduced peak shis in the opposite direction for the wildtype and DtagE strains. This change is clearly not the result offree bPEI polymer. These results imply that wild type and DtagEphosphorus nuclei experienced an increase in electron densityin the presence of bPEI-AuNPs, which we attribute to the prox-imity of the AuNPs which contain delocalized electrons.45
Exposure to either the bPEI-AuNPs or the free bPEI causedbroadening of the 31P peaks in spectra acquired from all threestrains (Tables S5–S7†). This broadening may be due toheterogeneity in the interaction of the WTA phosphorus atomswith both bPEI-AuNPs and free bPEI polymer.41 Peak broad-ening may also arise from reduced mobility and slower relaxa-tion times due to the presence of bPEI-AuNPs. Restricted WTAmotion could result from the interactions with bPEI-AuNPs orfree bPEI polymer. In a similar manner, peak broadening in 1H-
This journal is © The Royal Society of Chemistry 2020

Edge Article Chemical Science
Ope
n A
cces
s A
rtic
le. P
ublis
hed
on 2
3 M
arch
202
0. D
ownl
oade
d on
2/1
4/20
22 1
:39:
53 A
M.
Thi
s ar
ticle
is li
cens
ed u
nder
a C
reat
ive
Com
mon
s A
ttrib
utio
n-N
onC
omm
erci
al 3
.0 U
npor
ted
Lic
ence
.View Article Online
NMR spectra of a potential cancer therapeutic molecule wasattributed to its reduced mobility in proximity to the metal coreof poly(ethylene glycol)-AuNPs.46
We further investigated changes in the solid-state 13C-NMRspectra induced by interaction of sacculi from each strainwith bPEI-AuNPs (Fig. 9) and free bPEI polymer (Fig. S8†).Carbon nuclei in wild type and DtagE strains clearly experiencedmore changes in their chemical environments when exposed tobPEI-AuNPs and free bPEI than did the DdltA strain as indicatedby changes in chemical shi, peak width, and normalizedintensity. Changes to these parameters indicate an alteration inthe chemical environment of observed nuclei and suggestpossible interaction sites. Previous studies have suggested thatnanoparticles can affect the signal intensities of interactingbiomolecules to a much larger extent than chemical shis.47
Spectral changes upon introduction of bPEI-AuNPs weresimilar for the wild type and DtagE strains, with the exception ofthose associated with the WTA Glc in the wild type. For bothstrains, exposure to bPEI-AuNPs resulted in substantial atten-uation of the intensities of peaks associated primarily withcarbons in the amino sugar residues, glycerolphosphate, andGlc (wild type only) of WTA (Tables S5 and S6†). The glycer-olphosphate peaks decrease substantially in intensity, andmany of the peaks corresponding to the linker unit GlcNAc andManNAc residues broaden to the point of disappearing into thebaseline (Fig. S9†). Other peaks exhibiting decreased intensity,albeit less pronounced than those of the WTA groups, areassociated with carbons in the amino acid residues of pepti-doglycan (meso-A2pm, L- and D-Ala, Glu) and in the D-Lac
Fig. 9 Solid-state 13C-NMR spectra of (a) wild type, (b) DtagE, and (c)DdltA before (green, purple, and black, respectively) and after (orange)exposure to 34 nM bPEI-AuNPs.
This journal is © The Royal Society of Chemistry 2020
connecting MurNAc to L-Ala (Fig. S9†). The negative charges ofD-g-Glu (and meso-A2pm if not crosslinked) carboxylate groupslikely enhanced interaction with bPEI polymer relative tocarbons in the glycan sugar residues. Peaks associated withamino acid and amino sugar residues in peptidoglycandecreased somewhat in intensity and shied slightly downeld(<0.35 ppm), but otherwise remain largely unaltered. Exposureto free bPEI polymer produced spectral changes that resembledthose observed in the presence of bPEI-AuNPs, although peakintensity also decreased for some carbon nuclei in the GlcNAcand MurNAc residues of peptidoglycan (Fig. S10†). The spectralchanges indicate that WTAs are the primary binding sites forwild type and DtagE sacculi for both AuNPs and free bPEIpolymer, and the chemical environment of some of the carbonresidues in the peptide of peptidoglycan are also affected. Morepeaks decrease in the presence of free bPEI polymer relative tobPEI-AuNPs, suggesting that the peptidoglycan meshwork isless accessible to bPEI bound to the NPs relative to free bPEI.
Peak intensities in the spectra from DdltA sacculi remainedlargely unaltered upon exposure to bPEI-AuNPs or free bPEIpolymer (Table S8†). Specically, peaks corresponding to WTAglycerolphosphate, GlcNAc, and ManNAc were minimallyimpacted by the presence of nanoparticles. Small decreases inpeak intensity and narrowing of peak shoulders were apparentfor a few resonances, including the D-Lac group between Mur-NAc and L-Ala, the WTA linker GlcNAc and ManNAc C5 and C3,and glycerolphosphate C1, 2, and 3 (Fig. S11†). Similar, ratherminor changes are observed in the presence of free bPEI.
Both ow cytometry analysis of whole bacteria cells andsolid-state NMR analysis of bacterial sacculi revealed low asso-ciation of bPEI-AuNPs with the surface of the DdltA mutantrelative to the other two strains. The ow cytometry results forthe DdltA and DtagE strains are consistent with expectationsbased on cell surface charge as reected by cytochrome cbinding (Fig. 2b). The less negatively charged strain, DdltA, hadmuch lower proportion of cells associated with AuNPs, sug-gesting that electrostatic forces contributed to the interactionsbetween whole cells and bPEI-AuNPs. Foxley et al. previouslyreported on the importance of Coulombic interactions betweenthe cationic primary amines of bPEI polymer and the anionicphosphate groups in WTA in methicillin-resistant Staphylo-coccus aureus with slightly different WTA structure from B.subtilis.44 Similar interactions between the bPEI coating theAuNPs and the WTA glycerophosphate in the three B. subtilisstrains is expected. Upon addition of free bPEI polymer, weobserved downeld shis of the dominant peaks in 31P-NMRspectra for each strain which corresponded to the most abun-dant form of glycerol substitution (glucose-substituted (peak B)for wild type and DdltA, and unsubstituted (peak A) for DtagE).Similar downeld peak shis were previously reported fora strain of B. subtilis with poly(ribitol phosphate) WTA mole-cules upon exposure to bPEI in solution 31P-NMR experiments.44
In contrast, we observe small upeld peak shis in 31P-NMR forwild type and DtagE strains upon exposure to bPEI-AuNPs.Comparison of ow cytometry results from the wild type andDdltA strains suggests the electrostatic charge at the cell surfaceis not the sole factor inuencing bPEI-AuNP association with
Chem. Sci., 2020, 11, 4106–4118 | 4113

Chemical Science Edge Article
Ope
n A
cces
s A
rtic
le. P
ublis
hed
on 2
3 M
arch
202
0. D
ownl
oade
d on
2/1
4/20
22 1
:39:
53 A
M.
Thi
s ar
ticle
is li
cens
ed u
nder
a C
reat
ive
Com
mon
s A
ttrib
utio
n-N
onC
omm
erci
al 3
.0 U
npor
ted
Lic
ence
.View Article Online
the bacteria. The surface potentials/charges of wild type andDdltA were not distinguishable by the methods employed;nonetheless, a signicantly higher proportion of wild type thanDdltA cells were associated with bPEI. We hypothesize that theaccessibility of WTA at the cell surface affects associationbetween the bPEI-AuNPs and the bacterial cells.
The T1 measurements show that specic carbons in DdltAsacculi exhibit more restricted molecular motion than in thoseof the wild type, DtagE, or both. This more constrained molec-ular motion may be due to a larger proportion of the WTA beingembedded within the peptidoglycan meshwork in the DdltAmutant than in the wild type (supported by the evidence fora larger number of shorter WTA strands in the DdltA mutantthan in the wild type), making the WTA physically unable tointeract with the bPEI-coated AuNPs. The lower exibility of theDdltA WTA may also reect the presence of more Glc substitu-ents than are attached to the WTA of the wild type. The DdltAWTA that is available to interact with AuNPs may be less exibleand unable to form as many contacts with the nanoparticles asthe WTA from the wild type. Interestingly, although both wildtype andDdltAWTA contain Glc, T1 values are higher for a largernumber of DdltA WTA carbons than in the wild type. Thisfurther suggests wild type has longer WTA than DdltA, sup-porting the interpretation that the accessibility of the WTA tothe AuNPs inuences the extent of NP association. Overall, theT1 results are consistent with observations that wild type andDtagE strains are similar in their interaction with bPEI-AuNPs,while the DdltA strain interacts with the nanoparticles toa much smaller extent as shown by ow cytometry. Peaks in the31P-NMR spectra from wild type and DtagE sacculi exhibit smallupeld peak shis in the presence of AuNPs, indicatingenhanced electron density around the phosphorus nuclei,while a small downeld shi in the main peak is apparent forDdltA. Many changes are apparent in the 13C-NMR spectra forsacculi from wild type and DtagE strains upon interaction withbPEI-AuNPs, while minimal changes are observed for sacculifrom the DdltA strain. Although the DdltA WTA may be shorteror more buried within the peptidoglycan matrix relative to thatin wild type B. subtilis, free polymer can more readily penetratethe cell wall than bPEI-AuNPs. This hypothesis is consistentwith the pronounced downeld peak shi seen in 31P-NMR forDdltA exposed to free bPEI, while the downeld shi uponexposure to bPEI-AuNPs is quite small.
Conclusions
We have examined the interaction of cationic bPEI-AuNPs withintact bacteria and their exoskeletons (sacculi) using wild typeand two mutant strains of Bacillus subtilis that differ in thecomposition of their wall teichoic acids. Through a combinationof ow cytometry and solution and solid-state NMR, we haveestablished a relationship between bacterial cell wall compositionand the association of cationic AuNPs. Flow cytometry data revealsignicantly more bPEI-AuNP associated to the wild type andDtagE strains, the latter of which lacks Glc in its WTA, than to theDdltA strain, the WTA of which lacks Ala and exhibits the mostrestricted molecular motion. Solid-state 31P-NMR spectra suggest
4114 | Chem. Sci., 2020, 11, 4106–4118
AuNPs come into closer proximity to the wall teichoic acidmolecules of wild type and DtagE, compared to DdltA, as evi-denced by an upeld shi when nanoparticles are present. Solid-state 13C-NMR spectra reveal that bPEI-AuNPs induced spectralchanges primarily to the resonances corresponding to the linkerunit between WTA and peptidoglycan, to glycerol in the WTAbackbone for wild type and DtagE, and to the Glc carbons in wildtype. For the DdltA strain, exposure to bPEI-AuNPs impacted thechemical environment of WTA and peptidoglycan carbon nucleito only a small extent. The DdltA strain GlcNAc and MurNAc ofpeptidoglycan and the WTA glycerol generally exhibited morerestricted molecular motion relative to wild type and DtagE asascertained from temperature-dependent T1 relaxation experi-ments. The reduced molecular motion of the WTA in the DdltAstrain likely reected WTA extending to a lesser extent intosolution relative to the other two strains and resulted in corre-sponding diminished interaction with the cationic AuNPs.Similar effects may be seen in cell wall interaction with cationicantimicrobial peptides. The nanoparticle cores used here areinherently larger than the effective pore size of peptidoglycanmeshwork and are not expected to penetrate into the cell wall.48
Our experimental evidence supports the interpretation thatelectrostatic forces contribute importantly to interactions ofGram-positive bacterial surfaces with cationic bPEI-AuNPs andthat the accessibility of negatively charged moieties in teichoicacid chains inuence the degree of interaction. We note thatwall teichoic acid structural variations did not signicantlyimpact cell viability (Fig. S12†) indicating that cell wall muta-tions may alter NP binding, but these binding differences donot necessarily result in changes to bacterial viability.
We found that major components of B. subtilis walls thatinteracted with nanoparticles include the poly(-glycerolphosphate) backbone in WTA, the amino sugars in thedisaccharide linker unit, and the peptides in peptidoglycan.Although our ndings were based on one type of cationicnanoparticle and one Gram-negative bacterial species, theresults demonstrate the importance of the structure andcomposition of wall teichoic acid in modulating interactionwith nanoparticles. The approaches taken in the present studycan be extended to additional systems, including engineerednanomaterials differing in core composition, shape, or surfacefunctional groups to elucidate the inuence of these propertieson interactions with Gram-positive bacteria. Knowledge of suchrelationships can aid the design of nanomaterials to inten-tionally target cells to limit microbial growth or to minimizeundesired impacts on bacteria.
Materials and methodsChemicals and nanoparticles
The chemicals and nanoparticles used, suppliers, and puritiesare described in the ESI.†
Nanoparticle characterization
To verify the nanoparticle properties reported by the manufac-turer, the stock particle solution was diluted 100� in 0.025 M
This journal is © The Royal Society of Chemistry 2020

Edge Article Chemical Science
Ope
n A
cces
s A
rtic
le. P
ublis
hed
on 2
3 M
arch
202
0. D
ownl
oade
d on
2/1
4/20
22 1
:39:
53 A
M.
Thi
s ar
ticle
is li
cens
ed u
nder
a C
reat
ive
Com
mon
s A
ttrib
utio
n-N
onC
omm
erci
al 3
.0 U
npor
ted
Lic
ence
.View Article Online
NaCl buffered to pH 7.4 with 0.002 M HEPES, and UV-Visextinction spectra were acquired (Beckman DU 7500) to deter-mine AuNP core diameter and concentration.42 Particle hydro-dynamic diameter and z-potential were derived from dynamicand electrophoretic light scatteringmeasurements (BrookhavenZetaPALS). All measurements were made in triplicate. Theparticle suspension was stored at 4 �C, and the colloidal stabilityof the suspension was determined prior to all experiments. Thestructure of cationic branched polyethylenimine (bPEI) isshown in Fig. S13.†
Bacterial culture and characterization
Bacterial culture. Bacillus subtilis wild-type SB 491, DtagE,and DdltA strains were purchased from the Bacillus GeneticStock Center (Columbus, OH). Bacterial colonies were inocu-lated into sterile lysogeny broth (LB) from LB agar plates andallowed to grow at 37 �C under shaking (275 rpm, �24 h) untilthe culture reached an optical density at 600 nm (OD600) of 0.8.Bacterial cells were harvested by centrifugation (750g, 10 min),washed in equal volume Dulbecco's phosphate-buffered saline(D-PBS) buffer, and resuspended in 0.025 M NaCl buffered topH 7.4 with 0.002 M HEPES.
Bacterial cell electrophoretic mobility. The electrophoreticmobility of bacterial cells was measured using a BrookhavenInstruments Zeta Potential Analyzer (Holtsville, NY) followingpublished protocols.49,50 Bacterial motility was inhibited with0.001 M sodium azide to prevent such motion from confound-ing the interpretation of electrophoretic mobility measure-ments.50,51 The bacterial cells were removed from the sodiumazide solution by centrifugation (750g, 10 min), resuspended in0.025 M NaCl buffered to pH 7.4 with 0.002 M HEPES (OD600
adjusted to 0.2), and placed in sample cuvette with the elec-trode. Electrodes were cleaned between measurements in 10%ethanol for 30 min to reduce electroocculation, whereinadhesion of cells to the electrodes leads to reductions in themeasured absolute electrophoretic mobility over time.52
Bacterial cell cytochrome c binding capacity. The cyto-chrome c assay was adapted from published protocols.16,53,54
Briey, the OD578 of the bacterial suspension (in 0.025 M NaClbuffered to pH 7.4 with 0.002 M HEPES) was adjusted to 0.94. A75 mL aliquot of 10 mg mL�1 cytochrome c solution was addedto 1.425 mL of each bacterial suspension, as well as to a solutionlacking bacteria as a negative control. Samples were lightlyagitated for 10 min at ambient temperature to increase masstransport of cytochrome c to cell surfaces before centrifugationto sediment cells (12 000g, 15 min). The supernatants contain-ing unbound cytochrome c were then removed and oxidizedwith 20 mL of 30% H2O2. The difference between absorbance at530 nm of supernatants aer exposure to cells and of thenegative control provide an indication of the relative surfacecharge of the cell surfaces.
Flow cytometry to investigate bacteria association withnanoparticles. The fraction of the bacterial cells that had AuNPsattached on their surfaces was assessed by ow cytometry.3,8
Briey, bacterial cultures were diluted in 0.025 M NaCl bufferedto pH 7.4 with 0.002 M HEPES to an OD600 of 0.2 and exposed to
This journal is © The Royal Society of Chemistry 2020
0.9 nM bPEI-AuNP for 10 min. The uorescent dye, SYTO9(Thermo-Fisher, Waltham, MA) was added to stain the nucleicacid for 15 min. Ten thousand cells were sorted from eachsample in triplicate using a ow cytometer equipped with a 20mW, 488 nm laser (Becton Dickenson LSRII SORP). Side scat-tering intensity based on the plasmonic extinction of AuNPs wasmonitored to identify the population of cells with nanoparticlesbound on surfaces. Exposure of the three B. subtilis strains toeither 0.93 nM bPEI-AuNPs or to the amount of free bPEIpolymer in such a suspension (Fig. S12†) produced nodiscernable impact on bacterial viability (assay described in theESI†).
Wall teichoic acid isolation and characterization
Wall teichoic acid isolation. Wall teichoic acid was extractedand isolated from each bacterial strain according to a publishedprotocol.32 Briey, a bacterial culture (20 mL) was sedimented bycentrifugation (2000g, 10 min), washed with 25 mL of 0.05 MMES at pH 6.5, and resuspended in 25 mL of 4% [wt/vol] SDS in0.05 M MES at pH 6.5. Each suspension was adjusted to thesame OD600 value to ensure approximately the same number ofcells were extracted. The bacterial samples were placed inboiling water for 1 h, centrifuged (4000g, 10 min), and resus-pended with 1 mL of 4% [wt/vol] SDS in 0.05 M MES at pH 6.5.The samples were sedimented by centrifugation (14 000g, 10min), and washed with 2% NaCl [wt/vol] buffered to pH 6.5 with0.05 M MES, followed by 0.05 M MES at pH 6.5. The sampleswere incubated with proteinase K (0.02 M Tris–HCl, 0.5% [wt/vol] SDS, 20 mL mL�1 of proteinase K, pH 8.0) at 50 �C for�4 h and washed again with 2%NaCl [wt/vol] buffered to pH 6.5with 0.05 MMES and at least twice with ultrapure water. Finally,the samples were suspended in 1 mL of 0.1 M NaOH and gentlyshaken at room temperature for �16 h. Cell wall debris wasremoved by centrifugation (14 000g, 10 min), and the superna-tant containing isolated WTA was collected for further analysis.
Solution 31P-NMR of isolated WTA. Isolated WTA wereanalyzed by solution 31P-NMR spectroscopy using a BrukerAvance III HD nanobay 400 MHz spectrometer with BBOsmartprobe (31P-NMR frequency at 161.87 MHz) with a sampletemperature of 298 K. The extracted WTA from each bacterialsample was placed in 5 mm NMR tubes with 20% D2O. Sodiumphosphate was used as an internal standard (chemical shi ¼2.5 ppm at pH �8).
Phosphate quantication of isolated WTA. To investigate thedifferences in phosphate content on WTA from each mutant,phosphate was quantied using a colorimetric method basedon the color change resulting from formation of a phospho-molybdate complex.55,56 The isolated WTA from each strain waswashed by placing 200 mL of WTA sample in a test tube with1 mL of 10% Mg(NO3)2$6H2O in ethanol. The mixture wasevaporated to dryness over a strong ame with constant shakinguntil brown fumes disappeared and a white powder was le.Once cooled to room temperature, 1 mL of 1 M HCl was addedto the test tubes, which were then placed in a boiling water bathfor 15 min to hydrolyze inorganic phosphate. A 1 : 1 mixture of10% ascorbic acid and 0.42% ammonium molybdate in 1 M
Chem. Sci., 2020, 11, 4106–4118 | 4115

Chemical Science Edge Article
Ope
n A
cces
s A
rtic
le. P
ublis
hed
on 2
3 M
arch
202
0. D
ownl
oade
d on
2/1
4/20
22 1
:39:
53 A
M.
Thi
s ar
ticle
is li
cens
ed u
nder
a C
reat
ive
Com
mon
s A
ttrib
utio
n-N
onC
omm
erci
al 3
.0 U
npor
ted
Lic
ence
.View Article Online
H2SO4 was used to complex inorganic phosphate from WTAduring incubation for 20 min at 45 �C. The absorbances ofreaction mixtures were measured at 820 nm to quantify theamount of phosphate against a calibration curve constructedfrom potassium phosphate standards.
Isolation and characterization of bacterial sacculi
Isolation of bacterial sacculi. Bacterial cultures were grownin either LB media for solid-state 31P-NMR experiments or 13C-and 15N-labeled minimal (M9L) media (see ESI† for composi-tion, Tables S8 and S9†) for solid-state 13C-NMR experiments.Details of the bacterial culture for isolation of bacterial sacculiare provided in the ESI.†
Solid-state NMR of bacterial sacculi. Isolated WTA wereanalyzed by solid-state 31P and 13C-NMR spectroscopy. Lyophi-lized sacculi samples (1 mg for 31P and 4 mg for 13C-NMRexperiments) were packed into inserts by centrifugation. Asolution of 0.05 M HEPES buffered to pH 7.4 was prepared.Before collecting spectra, 1 mL of this solution alone, withnanoparticles, or with bPEI polymer was added to the lyophi-lized sample. For samples containing both sacculi and nano-particles, a total volume of 1 mL contained both 0.05 M HEPES,pH 7.4 and 34 nM bPEI-AuNPs. For samples containing bothsacculi and free bPEI, a total volume of 1 mL contained both0.05 M HEPES, pH 7.4 and free bPEI equivalent to amount offree polymer in 34 nM of nanoparticles. This was done at least24 h prior to sample collection. The method to quantify the freepolymer is described in the ESI.†
Following thorough sonication and vortexing, samples weresedimented for 30 min at 25 000g in a tabletop centrifuge atroom temperature (Eppendorf, 5417R). Aer removing thesupernatant, samples were packed into solid-state NMR inserts(Bruker, Kel-F). Inserts were placed into 4 mm diameter rotors(Bruker, Kel-F) and spun at 10 000 Hz during data collection.We collected 17 920 scans for each 31P spectrum and 512 scansfor each 13C spectrum. The maximum distance between 13Cnuclei sensed through space was roughly 20 A.57 As a controlexperiment, 34 nM bPEI-AuNPs were analyzed without sacculiby 13C-NMR. No signal was produced from these samples overthe spectral acquisition time. We referenced 13C-NMR spectra toan external adamantine sample (chemical shis of 38.5 and29.5 ppm).58 For 31P-NMR spectra, hexamethylphosphoramidewas used as an internal reference (chemical shi at 29.97 ppm).All spectra were processed in MestReNova, including baselinecorrection and curve smoothing. 13C-NMR spectra werenormalized by scaling the peak at �20 ppm to 100 with respectto intensity.
T1 relaxation experiments. Temperature-dependent 13Clongitudinal T1 relaxation time constants were measured byinversion-recovery aer direct excitation of 13C nuclei usinga Bruker Avance III 500 spectrometer equipped with a Doty4 mm MAS probe with variable temperature capabilities. Nineinterscan delay times were used and ranged from 0.0001 to 8 s.Sample temperatures were set to 30, 18, 12, 6 and �8 �Cfollowing temperature calibration described below. Acquisitiontime (aq) was 30 ms, and 64 scans per experiment were taken.
4116 | Chem. Sci., 2020, 11, 4106–4118
Sample temperatures were calibrated following a publishedmethod.59 The chemical shis of K79Br were measured overa range of temperature settings, and the actual sampletemperatures (Tactual) were calculated based on the expectedrelationship between Tactual and the measured 79Br chemicalshi: (K). The reference chemical shi was obtained at ambienttemperature of 22 �C at a magic angle spinning frequency of 3kHz, decoupler off (PLW2 ¼ PLW12 ¼ 0 W), repetition rate d1 ¼5 s. Parameters were then changed to the experimental values ofa spinning frequency of 8 kHz, 1H decoupler strength¼ 104 kHz(pw90 ¼ 2.4 ms at 200 W), aq ¼ 30 ms, d1 ¼ 15 s. Additionaltemperature points were then set, and the actual sampletemperatures were obtained from the chemical shi differencefrom the reference.59 One measurement was taken at eachtemperature and interscan delay time.
Conflicts of interest
There are no conicts to declare.
Acknowledgements
This work was supported by the National Science Foundationunder the Center for Sustainable Nanotechnology, CHE-1503408. The CSN is part of the Centers for Chemical Innova-tion Program. We thank Charlie Fry, Director of the Universityof Wisconsin-Madison Magnetic Resonance Facility, for helpwith the T1 relaxation measurements, Letitia Yao at theUniversity of Minnesota NMR facility for help with the solution31P-NMR experiments, andMichael Liou for help with statisticalanalysis. The National Magnetic Resonance Facility at Madisonis supported by NIH grants P41 GM103399 (NIGMS) andP41GM66326 (NIGMS). Additional equipment was purchasedwith funds from the University of Wisconsin, NIH (RR02781,RR08438), NSF (DMB-8415048, OIA-9977486, BIR-9214394), andUSDA. The Bruker AVANCE III 500 NMR spectrometer wassupported by a UW2020 grant and a generous gi from Paul J.and Margaret M. Bender. The solution NMR conducted atUniversity of Minnesota was supported by the Office of the VicePresident of Research, College of Science and Engineering, andthe Department of Chemistry at the University of Minnesota.
Notes and references
1 A. Helland, M. Scheringer, M. Siegrist, H. G. Kastenholz,A. Wiek and R. W. Scholz, Environ. Sci. Technol., 2008, 42,640–646.
2 T. J. Silhavy, D. Kahne and S. Walker, Cold Spring HarborPerspect. Biol., 2010, 2, 1–16.
3 Z. V. Feng, I. L. Gunsolus, T. A. Qiu, K. R. Hurley,L. H. Nyberg, H. Frew, K. P. Johnson, A. M. Vartanian,L. M. Jacob, S. E. Lohse, M. D. Torelli, R. J. Hamers,C. J. Murphy, C. L. Haynes, J. Murphy and C. L. Haynes,Chem. Sci., 2015, 6, 5186–5196.
4 J. Beranova, G. Seydlova, H. Kozak, O. Benada, R. Fiser,A. Artemenko, I. Konopasek and A. Kromka, FEMSMicrobiol. Lett., 2014, 351, 179–186.
This journal is © The Royal Society of Chemistry 2020

Edge Article Chemical Science
Ope
n A
cces
s A
rtic
le. P
ublis
hed
on 2
3 M
arch
202
0. D
ownl
oade
d on
2/1
4/20
22 1
:39:
53 A
M.
Thi
s ar
ticle
is li
cens
ed u
nder
a C
reat
ive
Com
mon
s A
ttrib
utio
n-N
onC
omm
erci
al 3
.0 U
npor
ted
Lic
ence
.View Article Online
5 Y. Liu, J. Tan, A. Thomas, D. Ou-Yang and V. R. Muzykantov,Ther. Delivery, 2012, 3, 181–194.
6 S. C. Hayden, G. Zhao, K. Saha, R. L. Phillips, X. Li,O. R. Miranda, V. M. Rotello, M. A. El-Sayed, I. Schmidt-Krey and U. H. F. Bunz, J. Am. Chem. Soc., 2012, 134, 6920–6923.
7 W. Pajerski, D. Ochonska, M. Brzychczy-Wloch, P. Indyka,M. Jarosz, M. Golda-Cepa, Z. Sojka and A. Kotarba, J.Nanopart. Res., 2019, 21, 1–12.
8 K. H. Jacobson, I. L. Gunsolus, T. R. Kuech, J. M. Troiano,E. S. Melby, S. E. Lohse, D. Hu, W. B. Chrisler,C. J. Murphy, G. Orr, F. M. Geiger, C. L. Haynes andJ. A. Pedersen, Environ. Sci. Technol., 2015, 49, 10642–10650.
9 W. Vollmer, D. Blanot and M. a de Pedro, FEMS Microbiol.Rev., 2008, 32, 149–167.
10 S. Brown, J. P. Santa Maria and S. Walker, Annu. Rev.Microbiol., 2013, 67, 313–336.
11 F. C. Neuhaus and J. Baddiley, Microbiol. Mol. Biol. Rev.,2003, 67, 686–723.
12 P. Demchick and A. L. Koch, J. Bacteriol., 1996, 178, 768–773.13 R. C. Hughes, P. F. Thurman and E. Stokes, Z. fur
Immunitatsforsch. Exp. Klin. Immunol., 1975, 49, 26–135.14 S. E. Allison, M. A. D'Elia, S. Arar, M. A. Monteiro and
E. D. Brown, J. Biol. Chem., 2011, 286, 23708–23716.15 M. Perego, P. Glaser, A. Minutello, M. A. Strauch, K. Leopold
and W. Fischer, J. Biol. Chem., 1995, 270, 15598–15606.16 J. Wecke, K. Madela and W. Fischer,Microbiology, 1997, 143,
2953–2960.17 E. Giaouris, R. Briandet, M. Meyrand, P. Courtin and
M. P. Chapot-Chartier, Appl. Environ. Microbiol., 2008, 74,4764–4767.
18 T. Kern, M. Giffard, S. Hediger, A. Amoroso, C. Giustini,N. K. Bui, B. Joris, C. Bougault, W. Vollmer andJ.-P. Simorre, J. Am. Chem. Soc., 2010, 132, 10911–10919.
19 J. A. H. Romaniuk and L. Cegelski, Biochemistry, 2018, 57,3966–3975.
20 R. Nygaard, J. A. H. Romaniuk, D. M. Rice and L. Cegelski,Biophys. J., 2015, 108, 1380–1389.
21 K. Makino and H. Ohshima, Sci. Technol. Adv. Mater., 2011,12, 1–13.
22 M. Dittrich and S. Sibler, J. Colloid Interface Sci., 2005, 286,487–495.
23 H. Y. Buse, J. M. Hoelle, C. Muhlen and D. A. Lytle, FEMSMicrobiol. Lett., 2018, 365, 1–7.
24 S. M. Louie, T. Phenrat, M. J. Small, R. D. Tilton andG. V. Lowry, Langmuir, 2012, 28, 10334–10347.
25 J. G. Adamson, T. Hoang, A. Crivici and G. A. Lajoie, Anal.Biochem., 1992, 202, 210–214.
26 M. Kovacs, A. Halfmann, I. Fedtke, M. Heintz, A. Peschel,W. Vollmer, R. Hakenbeck and R. Bruckner, J. Bacteriol.,2006, 188, 5797–5805.
27 M. Batley, J. W. Redmond and A. J. Wicken, Biochim. Biophys.Acta, Biomembr., 1987, 901, 127–137.
28 N. K. Bui, A. Eberhardt, D. Vollmer, T. Kern, C. Bougault,A. Tomasz, J. P. Simorre and W. Vollmer, Anal. Biochem.,2012, 421, 657–666.
This journal is © The Royal Society of Chemistry 2020
29 C. Schaffer, N. Muller, P. K. Mandal, R. Christian, S. Zayniand P. Messner, Glycoconjugate J., 2000, 17, 681–690.
30 C. Schaffer, H. Kahlig, R. Christian, G. Schulz, S. Zayni andP. Messner, Microbiology, 1999, 145, 1575–1583.
31 L. D. Quin and A. J. Williams, Practical Interpretation of P-31NMR Spectra and Computer Assisted Structure Verication,Advanced Chemistry Development, Toronto, Canada, 2004.
32 T. C. Meredith, J. G. Swoboda and S. Walker, J. Bacteriol.,2008, 190, 3046–3056.
33 D. Mirelman, B. D. Beck and D. R. D. Shaw, Biochem. Biophys.Res. Commun., 1970, 39, 712–717.
34 B. N. Ames, B. Garry and L. a Herzenberg, J. Gen. Microbiol.,1960, 22, 369–378.
35 N. Satoh and K. Kimura, J. Am. Chem. Soc., 1990, 112, 4688–4692.
36 S. Clejan, T. A. Krulwich, K. R. Mondrus and D. Seto-Young,J. Bacteriol., 1986, 168, 334–340.
37 S. Thong, B. Ercan, F. Torta, Z. Y. Fong, H. Y. Alvina Wong,M. R. Wenk and S. S. Chng, Elife, 2016, 5, 1–19.
38 K. L. Lanier, J. D. Moore, D. Smith, S. Li, B. Davis andW. A. Shaw, Quantitative Phospholipid Analysis of SoyLecithin and Krill Lecithin by 31P NMR, 2008.
39 T. Kern, Approches innovantes en RMN biomoleculaire:Cinetiques moleculaires par RMN rapide et paroi bacteriennepar RMN du solide, Universite Joseph-Fourier – Grenoble I,2009.
40 J. Lee and R. I. Hollingsworth, Carbohydr. Res., 1997, 303,103–112.
41 C. V. Rice and J. R. Wickham, J. Am. Chem. Soc., 2005, 127,856–857.
42 W. Haiss, N. T. K. Thanh, J. Aveyard and D. G. Fernig, Anal.Chem., 2007, 79, 4215–4221.
43 J. T. Buchman, A. Rahnamoun, K. M. Landy, X. Zhang,A. M. Vartanian, L. M. Jacob, C. J. Murphy, R. Hernandezand C. L. Haynes, Environ. Sci.: Nano, 2018, 5, 279–288.
44 M. A. Foxley, A. W. Friedline, J. M. Jensen, S. L. Nimmo,E. M. Scull, J. B. King, S. Strange, M. T. Xiao, B. E. Smith,K. J. Thomas, D. T. Glatzhofer, R. H. Cichewicz andC. V. Rice, J. Antibiot., 2016, 69, 871–878.
45 M. A. Bakar, M. Sugiuchi, M. Iwasaki, Y. Shichibu andK. Konishi, Nat. Commun., 2017, 8, 2–8.
46 S. C. Coelho, M. Rangel, M. C. Pereira, M. A. N. Coelho andG. Ivanova, Phys. Chem. Chem. Phys., 2015, 17, 18971–18979.
47 M. Assfalg, L. Ragona, K. Pagano, M. D'Onofrio, S. Zanzoni,S. Tomaselli and H. Molinari, Biochim. Biophys. Acta, ProteinsProteomics, 2016, 1864, 102–114.
48 S. O. Meroueh, K. Z. Bencze, D. Hesek, M. Lee, J. F. Fisher,T. L. Stemmler and S. Mobashery, Proc. Natl. Acad. Sci. U.S. A., 2006, 103, 4404–4409.
49 W. W. Wilson, M. M. Wade, S. C. Holman andF. R. Champlin, J. Microbiol. Methods, 2001, 43, 153–164.
50 T. Ishikawa, B. L. Zhu and H. Maeda, Toxicol. Ind. Health,2006, 22, 337–341.
51 R. E. Martinez, O. S. Pokrovsky, J. Schott and E. H. Oelkers, J.Colloid Interface Sci., 2008, 323, 317–325.
52 A. J. de Kerchove and M. Elimelech, Langmuir, 2005, 21,6462–6472.
Chem. Sci., 2020, 11, 4106–4118 | 4117

Chemical Science Edge Article
Ope
n A
cces
s A
rtic
le. P
ublis
hed
on 2
3 M
arch
202
0. D
ownl
oade
d on
2/1
4/20
22 1
:39:
53 A
M.
Thi
s ar
ticle
is li
cens
ed u
nder
a C
reat
ive
Com
mon
s A
ttrib
utio
n-N
onC
omm
erci
al 3
.0 U
npor
ted
Lic
ence
.View Article Online
53 V. Vadyvaloo, S. Arous, A. Gravesen, Y. Hechard, R. Chauhan-Haubrock, J. W. Hastings and M. Rautenbach, Microbiology,2004, 150, 3025–3033.
54 S. Pricelius, C. Held, S. Sollner, S. Deller, M. Murkovic,R. Ullrich, M. Hofrichter, A. Cavaco-Paulo, P. Macherouxand G. M. Guebitz, Enzyme Microb. Technol., 2007, 40,1732–1738.
55 B. N. Ames and D. T. Dubin, J. Biol. Chem., 1960, 235, 769–775.
4118 | Chem. Sci., 2020, 11, 4106–4118
56 P. S. Chen, T. Y. Toribara and H. Warner, Anal. Chem., 1956,28, 1756–1758.
57 K. Gawrisch and B. W. Koenig, Curr. Top. Membr., 2002, 52,163–190.
58 C. R. Morcombe and K. W. Zilm, J. Magn. Reson., 2003, 162,479–486.
59 K. R. Thurber and R. Tycko, J. Magn. Reson., 2009, 196, 84–87.
This journal is © The Royal Society of Chemistry 2020