walk norwich - final programme report
DESCRIPTION
A summary of work delivered from May 2014 to June 2015TRANSCRIPT

-

Walk Norwich – Programme Report July 2015
Contents
Programme Details
Programme Name
Contact details
Commissioner of the intervention and sources of funding
Location and Setting
Branding and Brand Impact
Aims and Objectives
Intervention Delivery Dates
Intervention Timescale (exposure, quantity and duration)
Duration of Funding
Participation and Recruitment
Participation admission/exclusion criteria
Programme summary
Method of recruitment and referral o City Health Walk Referral o Beat the Street Referral
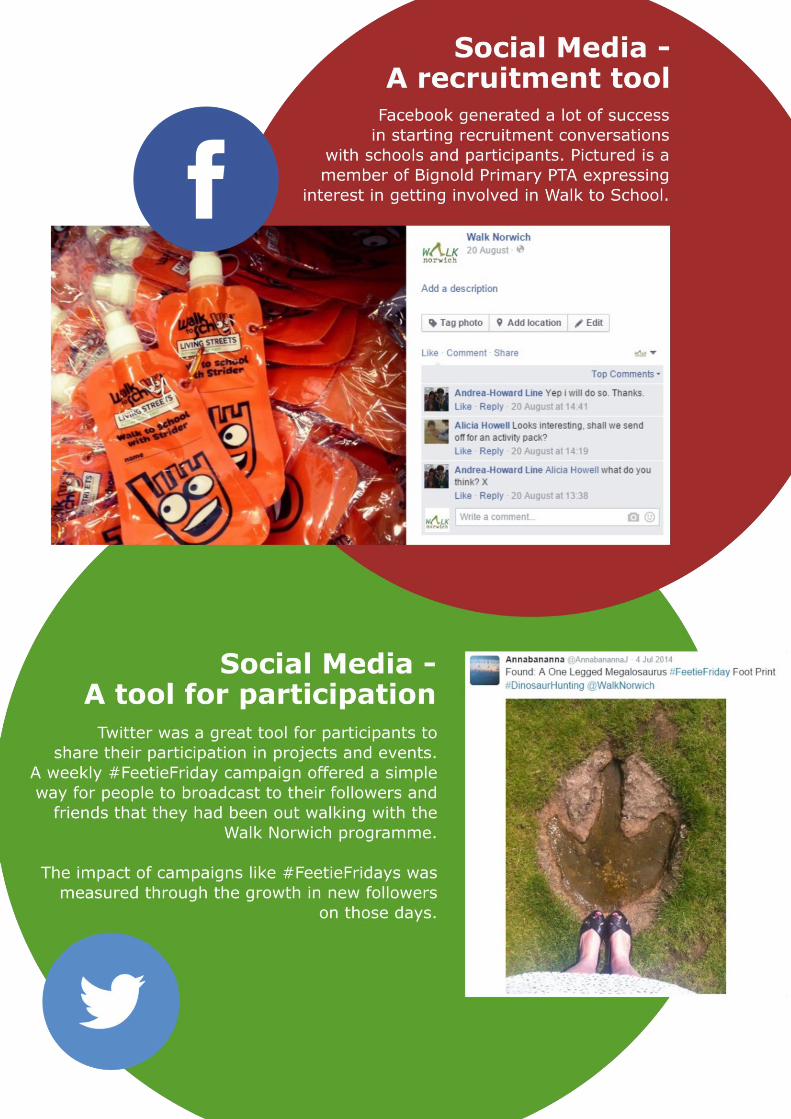
Social media – A recruitment tool
Social media – A tool for participation Programme Governance, Personnel and Strategic Planning
Programme governance diagram
Programme volunteers
Walk Norwich Steering Group
Norwich City Walking Strategy
Walking Cities Network Description of Intervention
City Health Walks
Beat the Street
Programme Innovations
Monitoring and Evaluation
Targets
Map of participants engaged
Achievements against objectives
Continuation and Sustainability
Programme Details Programme Name Walk Norwich Contact Details Project Coordinator – Dan Harris Email - [email protected] Moblie – 07803 246 300
Commissioner of the intervention and sources of funds Late 2013 Norwich City Council was successful in applying for £228,500 from the Department of Health to deliver a 15 month Walking Cities programme of work in Norwich. An in kind contribution of £12,134 was made by Norwich City Council to host the coordinator role and offer the coordinator management support. Funds were then allocated to the following elements of the programme through delivery partners:
£96,000 - Living Streets for Programme Coordinator post and programme support
£10,000 – Liftshare for Personal Travel Plans to be used in workplace engagement
£60,000 – Intelligent Health for the Beat the Street initiative
£37,000 – Active Norfolk for the City Health Walk element of the programme
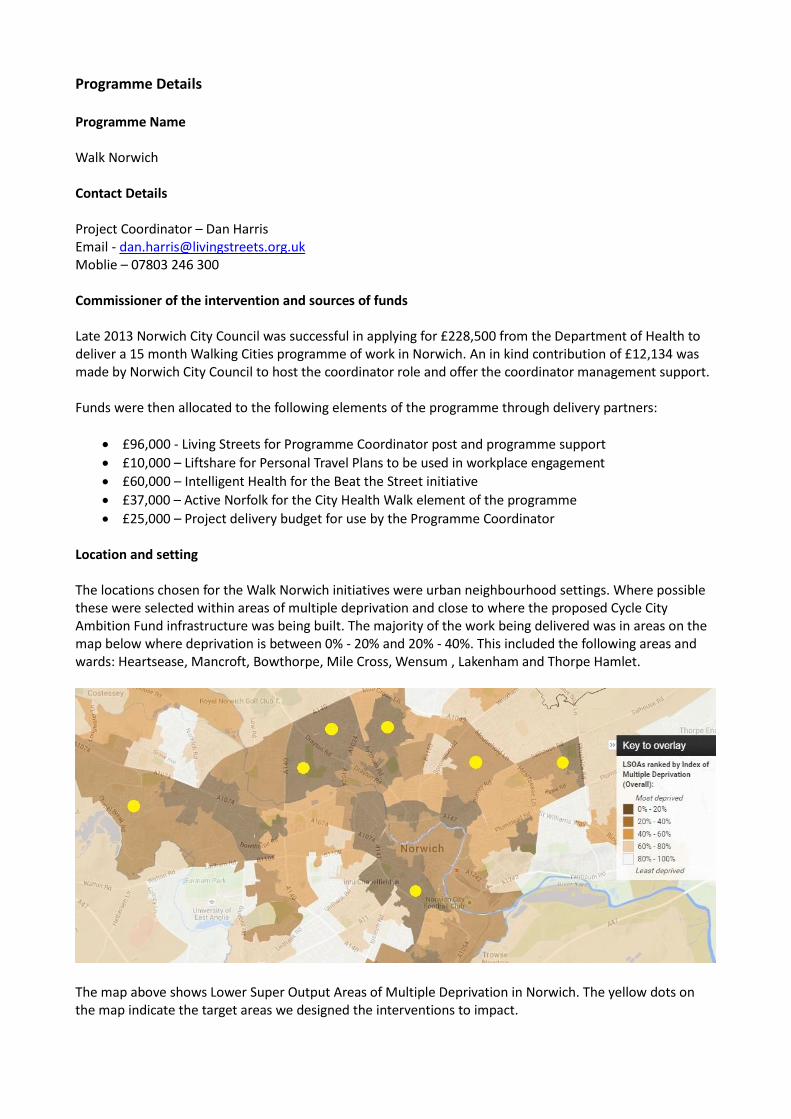
£25,000 – Project delivery budget for use by the Programme Coordinator Location and setting The locations chosen for the Walk Norwich initiatives were urban neighbourhood settings. Where possible these were selected within areas of multiple deprivation and close to where the proposed Cycle City Ambition Fund infrastructure was being built. The majority of the work being delivered was in areas on the map below where deprivation is between 0% - 20% and 20% - 40%. This included the following areas and wards: Heartsease, Mancroft, Bowthorpe, Mile Cross, Wensum , Lakenham and Thorpe Hamlet.
The map above shows Lower Super Output Areas of Multiple Deprivation in Norwich. The yellow dots on the map indicate the target areas we designed the interventions to impact.


Aims and Objectives
Aim Increase walking levels within inactive communities to improve the health of
residents
Empower residents to have more influence in making the cities' streets safer and more
vibrant
Objective Number of people reached with a walking message
Number of Community Street Audits completed
Objective Number of activities and events Number of residents taking part in CSAs
Objective Number of local press pieces Number of Walking Champions supported
Objective Number of people taking part in a walking activity
Number of volunteers taking action
Objective Number of schools involved in walking activities
Number of volunteer hours
Objective Number of people walking more after being involved in our project
Objective Number of people feeling more healthy after being involved in our project
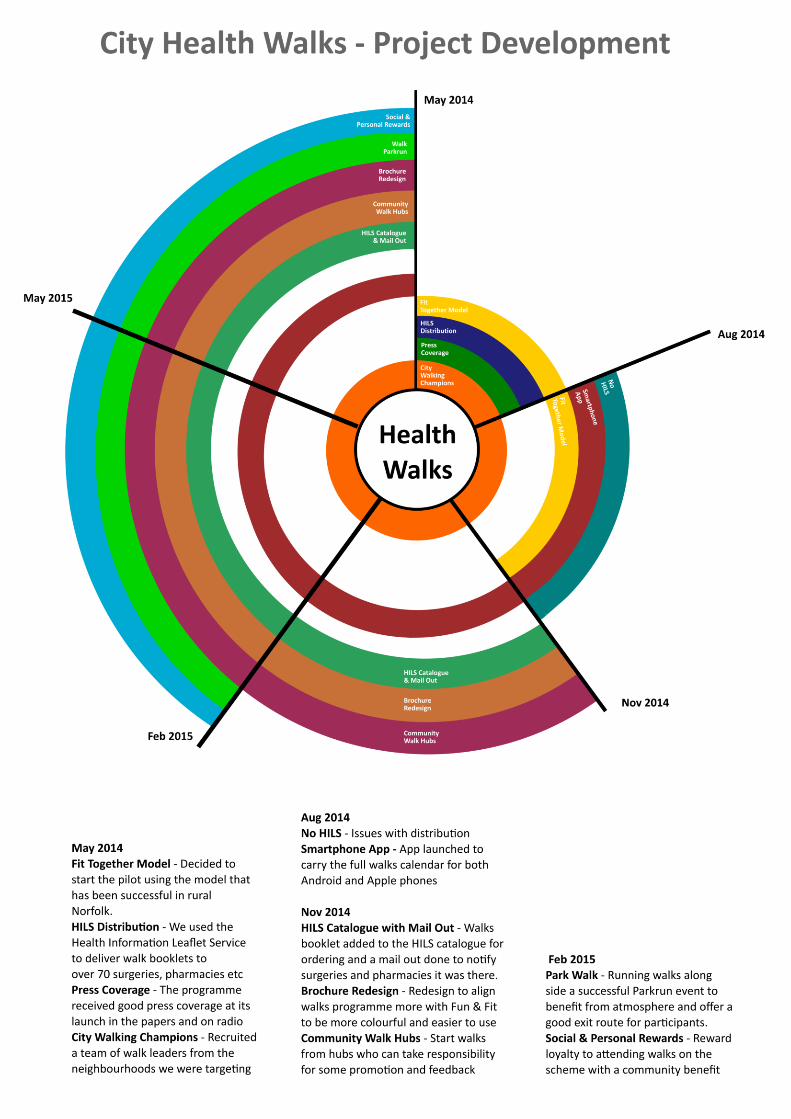
Intervention Delivery Dates The Walk Norwich programme delivery dates ran from 1st May 2014 through to 30th June 2015. Intervention Timescales (exposure, quantity and duration) The programme of work in Norwich was broken down into several interventions which all had different exposure periods and different quantities of delivery. The table below shows in dark blue the months when particular initiatives were gaining exposure, giving a sense of the overall quantity of each individual initiative which the broader programme was made up of.
Intervention\Month May / June ‘14
July / Aug ‘14
Sept / Oct ‘14
Nov / Dec ‘14
Jan / Feb ‘15
March / April ‘15
May / June ‘15
Beat the Street
City Health Walks
Schools Projects
Workplace Offer
Small Grants Scheme
Park Walk
#FeetieFriday
#WalkingCitiesHour
Duration of funding
The funding ran from the start of 2014 until the end of June 2015.
Participant admission/exclusion criteria
There were no admission/exclusion criteria for any of the initiatives we ran within the Walk Norwich programme. The reason for this was the belief that building a critical mass of participation would be more success in recruiting higher number of our target participant than events with small attendances of the target group. With ‘word of mouth’ recruitment proving to be so successful, we looked to build on positive participant experiences, to draw other friends and family into participating.
Delivery Month


Method of Recruitment and Referral City Health Walk Referrals
Data was collected from participants in over 200 health walks delivered by the programme. Promotion of these walks was through a quarterly booklet that was distributed to pharmacies, libraries, GP surgeries, leisure centres and community centres. The data collected shows that libraries were by far the most common place for participants to find a booklet, however it was word of mouth that recruited the most people onto these walks targeted at inactive people in key areas and neighbourhoods.
Where people find out about the walks Percentage of respondents
Library 14.29%
Leisure centre 3.81%
Word of mouth / told about 31.43%
GP surgery 10.48%
Local authority / council 0.95%
Walking group 1.90%
Other community location 0.95%
Other (please tell us how in the next box) 18.10%
Beat the Street Referrals
With the competitive element between schools proving to be such a big part of Beat the Street it is no surprise that the highest referral came from children at participating schools. The Beat the Streets team delivered many school gates events handing out game cards and signing up participants. Libraries again were a popular place to find out about an initiative.
Where people find out about Beat the Street Percentage of respondents
From a child at a participating school 40%
Other (eg. From a friend or work) 23%
From a library 18%
From the Beat the Street team 18%
From a doctors surgery reception 7%
From a GP 0%


Building Influence Walk Norwich Steering Group
The steering group for Walk Norwich met five times over the duration of the programme. The group played an important role in guiding the initiatives delivered and influencing partnership working. Key to the success of the steering group was having stakeholders with strong local knowledge and influence:
Cllr Mike Stonard – Norwich City Council and Cycling City Ambition Grant Executive Board
Shelley Ames - Physical Activity & Health Development Manager, Active Norfolk
Veronica Reynolds - Client Services Director, Intelligent Health
Nick Clarke - Locality Development Manager for Public Health and East Region Physical Activity Alliance Coordinator for Public Health England
Christy Acton – Walking Cities Network Coordinator and Project Manager for Living Streets
Martine Holden - Sport & Leisure Development Manager for Norwich City Council
Rich Hoey - Sport & Equity Development Officer for Norwich City Council
Ben Jones – Chief Executive for Active Norfolk Norwich City Walking Strategy Through meeting with other cities in the Walking Cities Network it became clear that to create a visionary approach to Norwich embracing its status as a Walking City, senior support from the local authority was required. Creating a group of key local authority departments who could influence their area of work was an idea being delivered in Leeds and Birmingham. In November 2014 the Walk Norwich programme was invited to present a proposal for the formation of a City Walking Strategy Group to Norwich City Council’s Corporate Leadership Team. The proposal was given the go ahead from the Corporate Leadership Team.
Sample of slides from Corporate Leadership Team presentation Though this opportunity wasn’t capitalised upon before the end of this initial period of delivery, it remains on the agenda for on-going work beyond June 2015. Walking Cities Network
The Walking Cities Network was coordinated by Living Streets and attended by all of the cities who received Walking Cities funding from the Department of Health. The network met five times during the delivery period of this initiative, visiting each of the funded cities. These meetings offered the valuable opportunity to share experiences and gain inspiration from the delivery in other areas of the country. Elements like the Small Grants Scheme only took place in Norwich following the sharing of the idea at a Network meeting and receiving support from the Coordinator in Leeds with documentation and necessary processes. Locally in Norwich it showed local stakeholders and senior decision makers that Norwich as part of a visionary national piece of work. Projects like the Walking Cities Blog and #WalkingCitiesHour on Twitter gave the network national visibility and placed the work in Norwich on a national stage. This further strengthened local conversations around the sustainability of the programme beyond June 2015.

Description of Interventions
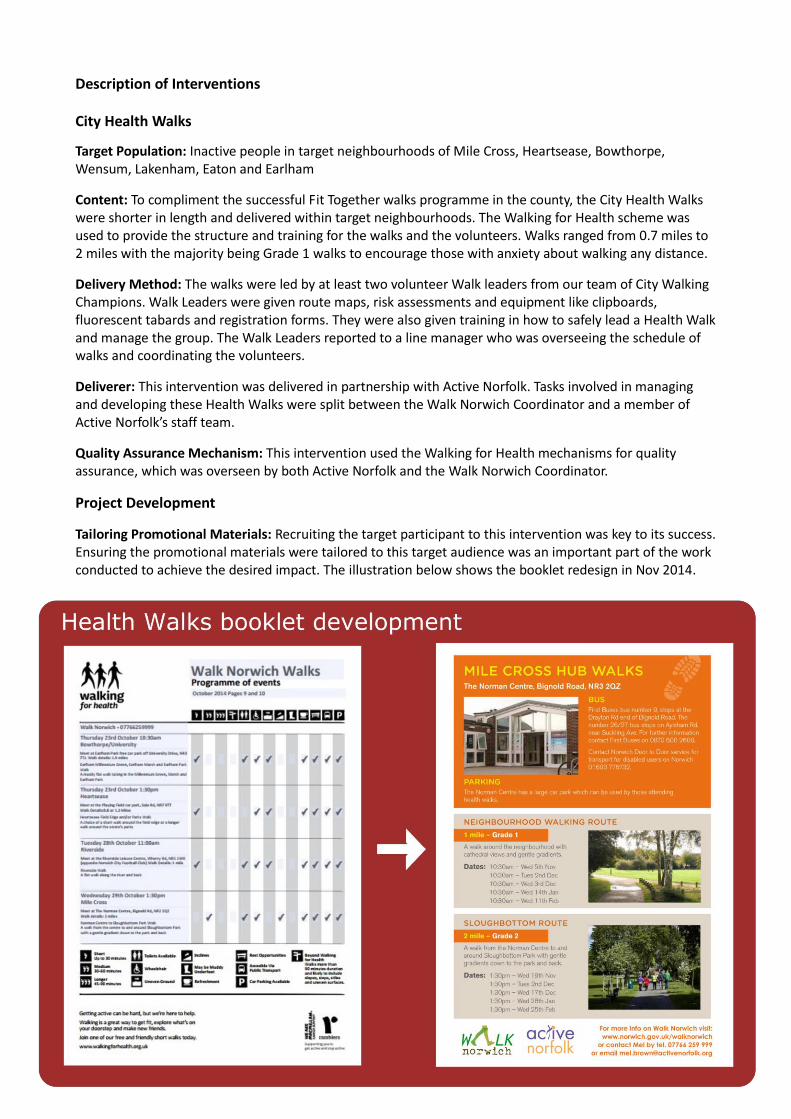
City Health Walks
Target Population: Inactive people in target neighbourhoods of Mile Cross, Heartsease, Bowthorpe, Wensum, Lakenham, Eaton and Earlham
Content: To compliment the successful Fit Together walks programme in the county, the City Health Walks were shorter in length and delivered within target neighbourhoods. The Walking for Health scheme was used to provide the structure and training for the walks and the volunteers. Walks ranged from 0.7 miles to 2 miles with the majority being Grade 1 walks to encourage those with anxiety about walking any distance.
Delivery Method: The walks were led by at least two volunteer Walk leaders from our team of City Walking Champions. Walk Leaders were given route maps, risk assessments and equipment like clipboards, fluorescent tabards and registration forms. They were also given training in how to safely lead a Health Walk and manage the group. The Walk Leaders reported to a line manager who was overseeing the schedule of walks and coordinating the volunteers.
Deliverer: This intervention was delivered in partnership with Active Norfolk. Tasks involved in managing and developing these Health Walks were split between the Walk Norwich Coordinator and a member of Active Norfolk’s staff team.
Quality Assurance Mechanism: This intervention used the Walking for Health mechanisms for quality assurance, which was overseen by both Active Norfolk and the Walk Norwich Coordinator.
Project Development
Tailoring Promotional Materials: Recruiting the target participant to this intervention was key to its success. Ensuring the promotional materials were tailored to this target audience was an important part of the work conducted to achieve the desired impact. The illustration below shows the booklet redesign in Nov 2014.

Baseline Participant Data The survey completed when City Health Walk participants initially sign up is quite thorough. The following data gives a picture of the people we were engaging with this intervention.
Number of days in last week with 30 mins or more activity Percentage of participants
3 days or less 50%
No days 15%
6 days 7%
Long term illness or condition disclosed Percentage of participants
Asthma 8.1%
High Blood Pressure 10%
Diabetes 7.2%
Heart Disease 3.6%
Physical Disability 3.8%
Learning Disability or Difficulty 8.7%
Mental Health Issue 3.8%
Participant Demographic The biggest age category of participants was 55 – 64 who made up 30% of those engaged. Interestingly 23% of participants were over the age of 65 and 26% were under 45.
The gender balance for our City Health Walk participants was roughly a third men and two thirds women. We engaged slightly more men than the regional data shows.
Gender Walk Norwich Participants
Male 34%
Female 66%

Indices of Multiple Deprivation scores for participating walkers The greatest focus of walkers who took part in our City Health Walks are in the 6 – 15 IMD areas with roughly 35% or one third of walkers living in areas with an IMD score in this range. An IMD score of 0 represents the most deprived Lower Super Output Area and 100 represents the least deprived.
IMD Percentage of walker living in area with IMD Score
0 – 5 6.73%
6 – 10 15.38%
11 – 15 19.23%
16 – 20 12.5%
21 – 25 17.31%
26 – 30 12.5%
31 – 35 11.54%
36 – 40 1.92%
Delivery Data
Over the 15 month delivery period 185 City Health Walks were delivered by Walk Norwich.
Description Quantity
Number of participations (headcount) 706
Number of City Health Walks delivered 185
Number of unique walking routes trialled 22
Number of new walkers to the scheme 154
Case Study – City Walking Champion Suzanne Reeves Suzanne is Norwich born and bred, but had no walking background. She grew up with Congenital Heart Disease, and at the age of four and a half years old was diagnosed with tetralogy of fallots. Her Mum died in 2009 of heart disease as her Mother before her. Her son has also been diagnosed with heart disease too. The importance of remaining active throughout life is felt very close to home, and this has been one of Suzanne’s motivations to improve the health of her local community through increasing their physical activity levels. Another big motivation in Suzanne’s life has been the desire to achieve. All of her life she has had a learning disability, which has meant on many occasions she has been written off and not been allowed to succeed. Becoming a City Walking Champion has given her a role within her community and achievable goals which have allowed her to feel that she is contributing to her community. Since becoming a City Walking Champion Suzanne has led over 80 health walks and promoted them throughout her community by delivering programmes to churches, community centres and surgeries. In recognition of her dedication she won an award for Championing Active Travel from Norwich City Council and has lost over a stone in weight. Suzanne’s confidence over the last 15 months has grown so much that she is now applying for jobs in the hope to re-enter the world of work. The positive impact of the project is felt not only in her improved physical and mental health, but in the stronger social connections she now has in her community.

Description of Intervention Beat the Street Target Population: The target for this intervention was inactive people in target neighbourhoods of Heartsease, Sprowston and Thorpe St Andrew, with Heartsease being the key target neighbourhood. Content: This is a complex intervention requiring the installation of technology throughout the target communities that the delivery focuses on. School teams were recruited in the target neighbourhoods and a website was created to be the focal point of tracking each individual’s achievements and how those achievements are contributing to their associated teams score and position compared to the other teams. Delivery Method: This intervention relies on building a critical mass of participation driven by competitive spirit between teams. Creating strong team participation focuses on engaging schools in the target area initially and then using word of mouth to virally build teams from the social and family connections of the school’s students and staff. The delivery window is just 8 weeks. Team participation is incentivised through a cash prize for the most successful teams. Deliverer: This intervention was delivered in partnership with Intelligent Health. Tasks involved in managing the intervention and coordinating community engagement was split between the Walk Norwich Coordinator and Intelligent Health’s staff team. Quality Assurance Mechanism: This intervention used the mechanisms Intelligent Health designed for quality assurance, which was overseen by Intelligent Health and the programme coordinator. Baseline Data
As we also saw with City Health Walk participants there was a large number of people who were active for 30 minutes or more for three days or less, and a high number who hadn’t done 30 minutes of activity in the last week. The change in people’s activity levels shows an encouraging impact of the intervention. 74% of people responding to the survey said they would try to continue the changes after the competition ended.
Number of days in last week with 30 mins or more activity
Percentage of participants before the intervention
Percentage of participants after the intervention
3 days or less 45% 23%
No days 19% 5%
7 days 9% 16%
Heat Map of participation This map shows the areas where participants live. The target area of Heartsease is the area on the map showing the highest levels of participation with the neighbouring area of Sprowston being the second highest.

Benefits that participants agreed with when surveyed Beat the Street was one of the few initiatives that Walk Norwich delivered which included prizes as incentives. Interestingly when surveyed at the end of the delivery period “winning prizes” ranked quite low on the benefits people felt that Beat the Street offered them.
What are the main things you got out of Beat the Street? Percentage that agreed
Getting Fit 57%
Exploring the local area 55%
Feeling more healthy 54%
Spending time with friends and family 46%
Feeling part of the community 46%
Winning prizes 16%
Saving money on travel 13%
Helping with my long term conditions 9%
Headline Results and Delivery Data The key responses from the follow up Beat the Street survey were as follows:
85% of people said Beat the Street helped them to walk more than usual
45% were meeting the physical activity level target at the beginning and this rose to 62% by the end of Beat the Street
74% of people said they would try to continue the changes after the competition ended.
Description Number
Total number of participants 1890
Number of school students participating 1488
Number of members of the public participating 402
Number of school teams 4
Number of other teams 2
Changes in Average Walking Speed Analysis of average speed showed a generally upwards trend over the course of the Intervention. Participants were on average completing moves 18% faster in Week 9 when compared against week 1. The effect of small sample size (greater variation) is apparent when considering Teen Café (Sprowston Youth Engagement Project). This spike in week six from the Teen Café also coincided with their team’s push to get to the top of the leader board.
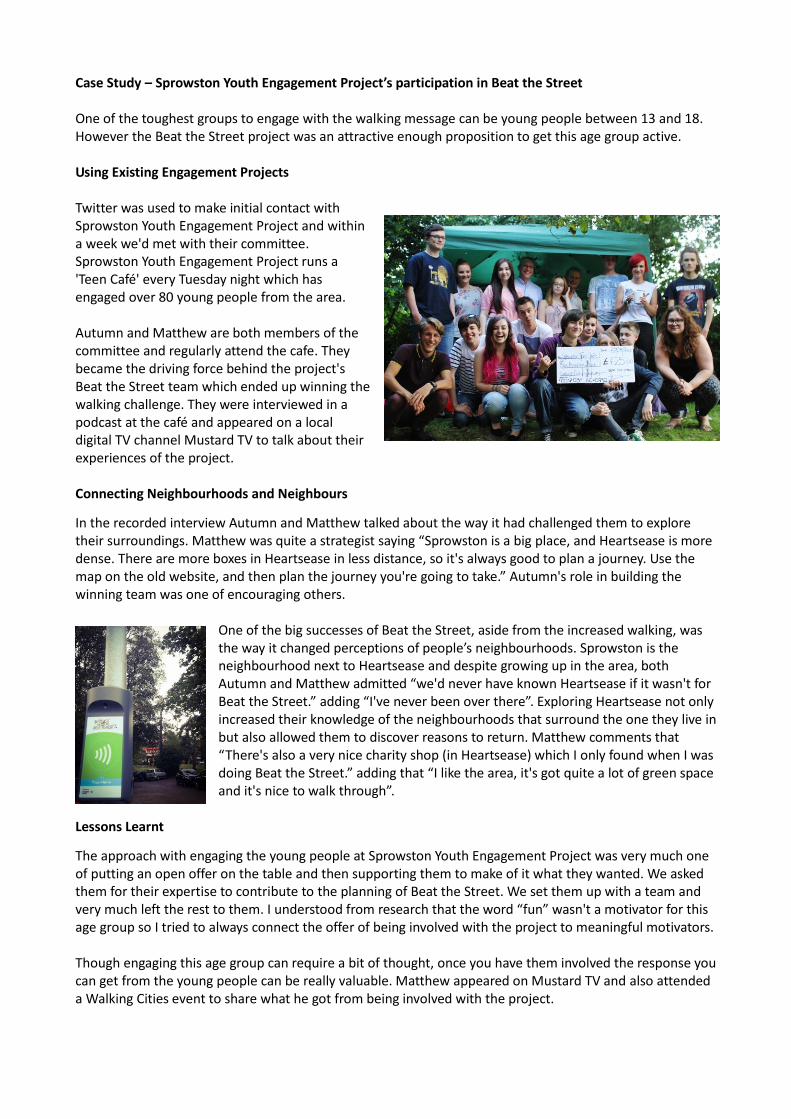
Case Study – Sprowston Youth Engagement Project’s participation in Beat the Street One of the toughest groups to engage with the walking message can be young people between 13 and 18. However the Beat the Street project was an attractive enough proposition to get this age group active. Using Existing Engagement Projects Twitter was used to make initial contact with Sprowston Youth Engagement Project and within a week we'd met with their committee. Sprowston Youth Engagement Project runs a 'Teen Café' every Tuesday night which has engaged over 80 young people from the area. Autumn and Matthew are both members of the committee and regularly attend the cafe. They became the driving force behind the project's Beat the Street team which ended up winning the walking challenge. They were interviewed in a podcast at the café and appeared on a local digital TV channel Mustard TV to talk about their experiences of the project. Connecting Neighbourhoods and Neighbours
In the recorded interview Autumn and Matthew talked about the way it had challenged them to explore their surroundings. Matthew was quite a strategist saying “Sprowston is a big place, and Heartsease is more dense. There are more boxes in Heartsease in less distance, so it's always good to plan a journey. Use the map on the old website, and then plan the journey you're going to take.” Autumn's role in building the winning team was one of encouraging others.
One of the big successes of Beat the Street, aside from the increased walking, was the way it changed perceptions of people’s neighbourhoods. Sprowston is the neighbourhood next to Heartsease and despite growing up in the area, both Autumn and Matthew admitted “we'd never have known Heartsease if it wasn't for Beat the Street.” adding “I've never been over there”. Exploring Heartsease not only increased their knowledge of the neighbourhoods that surround the one they live in but also allowed them to discover reasons to return. Matthew comments that “There's also a very nice charity shop (in Heartsease) which I only found when I was doing Beat the Street.” adding that “I like the area, it's got quite a lot of green space and it's nice to walk through”.
Lessons Learnt
The approach with engaging the young people at Sprowston Youth Engagement Project was very much one of putting an open offer on the table and then supporting them to make of it what they wanted. We asked them for their expertise to contribute to the planning of Beat the Street. We set them up with a team and very much left the rest to them. I understood from research that the word “fun” wasn't a motivator for this age group so I tried to always connect the offer of being involved with the project to meaningful motivators. Though engaging this age group can require a bit of thought, once you have them involved the response you can get from the young people can be really valuable. Matthew appeared on Mustard TV and also attended a Walking Cities event to share what he got from being involved with the project.

Breaking Down Barriers and Creating New Connections
From the evidence collected by the Beat Boxes and from stories shared by participants it is clear that taking part in Beat the Street encourages people to explore new areas of their city and discover new places. Below is a visualisation of the movement of the Sprowston Youth Engagement Projects team, clearly showing that the journeys being made in the last week compared to the first week are taking people to new areas.
The same was evident when looking at the data for Cecil Gowing Primary School, which was a team with a very different demographic. Journeys outside Sprowston increased from 34% to 45% when comparing the first and last week of the initiative. When considering the neighbourhoods of Sprowston and Heartsease in particular, this movement is socially significant. Heartsease is a more deprived area segregated from Sprowston by a main road. Many Sprowston residents when asked had never visited Heartsease.

Description of Interventions Innovations – Zombie Walk Off
This is a new walking intervention format to compliment ‘Beat the Street’ or primary school walking challenge delivery. This walking event is a cross between ‘Capture the Flag’ and a treasure hunt.
The Format: In a chosen neighbourhood five checkpoints are selected. Lampposts make good checkpoints. Each checkpoint either needs a Beat Box or a paper punch for participants to record their visit to the checkpoint. All five checkpoints will be guarded by volunteers dressed as zombies, who will try to remove ‘life’ stickers on the participant’s outer arm. Participants get three ‘life’ stickers with extended tabs to make them easier to remove. The participants have to visit all five checkpoints and return to the finish with at least one life remaining. Each checkpoint has a chalk line drawn round it which the zombie volunteers aren’t allowed to enter.
Number of events delivered 2
Number of participants 105
Innovations – Park Walk
This is a new walk to compliment the success of Parkrun in Norwich and build on the buzz of these successful Saturday morning events to engage inactive people in walking exercise with an exit route.
Format: Participants will walk a route which shares some of the Parkrun route, but doesn't create conflict between walkers and runners.
Start time: 9am – immediately after the Parkrun runners set off
Distance: Roughly 2km so that the walkers return to the finish at the same time as the runners.
Support: 'Walk Parkrun' volunteers with Walking for Health's Walk Leader training support the walk
Delivery period: We started the weekly delivery of these walks in April 2015.
Number of walks delivered 24
Number of participants (headcount) 58
Innovations – Walking Bingo Walking Bingo is a led group walk (maximum group size 20).
Everyone is given a bingo card, small clipboard and bingo dabber. The bingo combinations we look for will follow the traditional UK bingo format of: four corners, one row, two rows and a full house. 75% of the numbers are hidden along the route and 25% are called at regular intervals by the walk leader, so that the game has an added observation element without losing the joy of a bingo caller. People are awarded one sticker for every successful and legitimate cry of BINGO and at the end the three people with the most stickers will be awarded 1st, 2nd and 3rd prizes. The first delivery of this event came at the end of the programme, however development will continue into the second phase of deliver in Norwich.
Number of walks delivered 1
Number of participants (headcount) 26
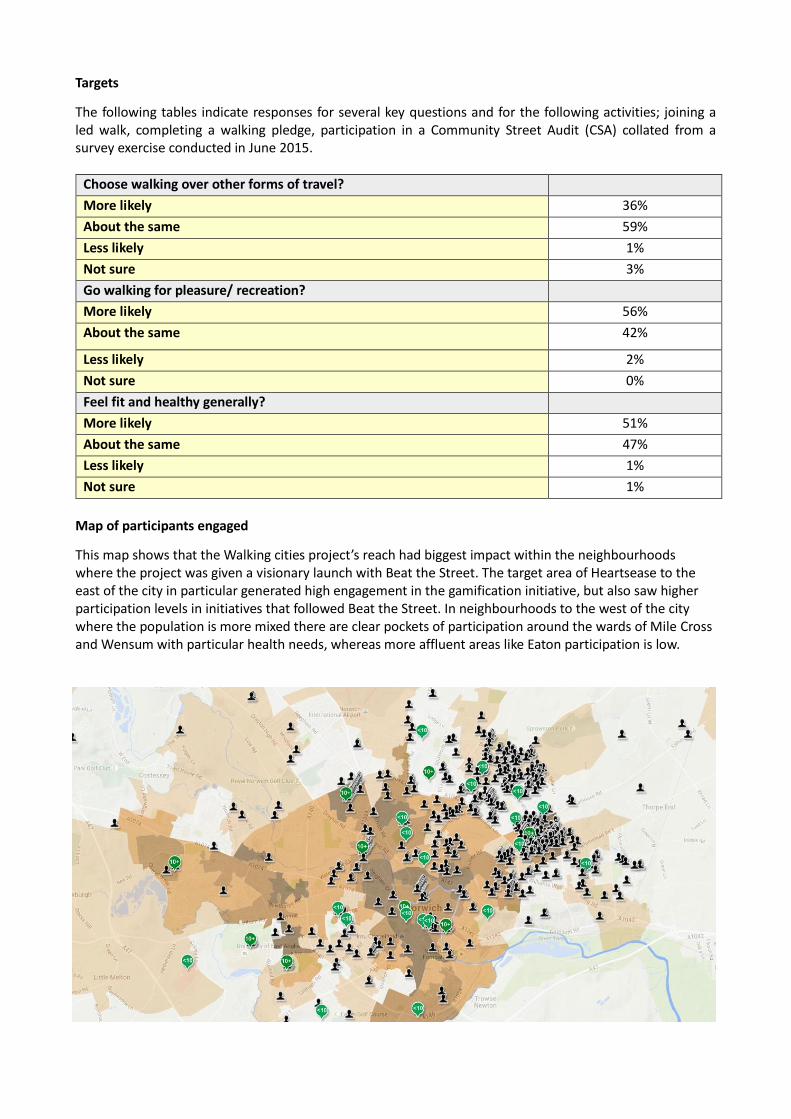
Targets
The following tables indicate responses for several key questions and for the following activities; joining a led walk, completing a walking pledge, participation in a Community Street Audit (CSA) collated from a survey exercise conducted in June 2015.
Choose walking over other forms of travel?
More likely 36%
About the same 59%
Less likely 1%
Not sure 3%
Go walking for pleasure/ recreation?
More likely 56%
About the same 42%
Less likely 2%
Not sure 0%
Feel fit and healthy generally?
More likely 51%
About the same 47%
Less likely 1%
Not sure 1%
Map of participants engaged
This map shows that the Walking cities project’s reach had biggest impact within the neighbourhoods where the project was given a visionary launch with Beat the Street. The target area of Heartsease to the east of the city in particular generated high engagement in the gamification initiative, but also saw higher participation levels in initiatives that followed Beat the Street. In neighbourhoods to the west of the city where the population is more mixed there are clear pockets of participation around the wards of Mile Cross and Wensum with particular health needs, whereas more affluent areas like Eaton participation is low.
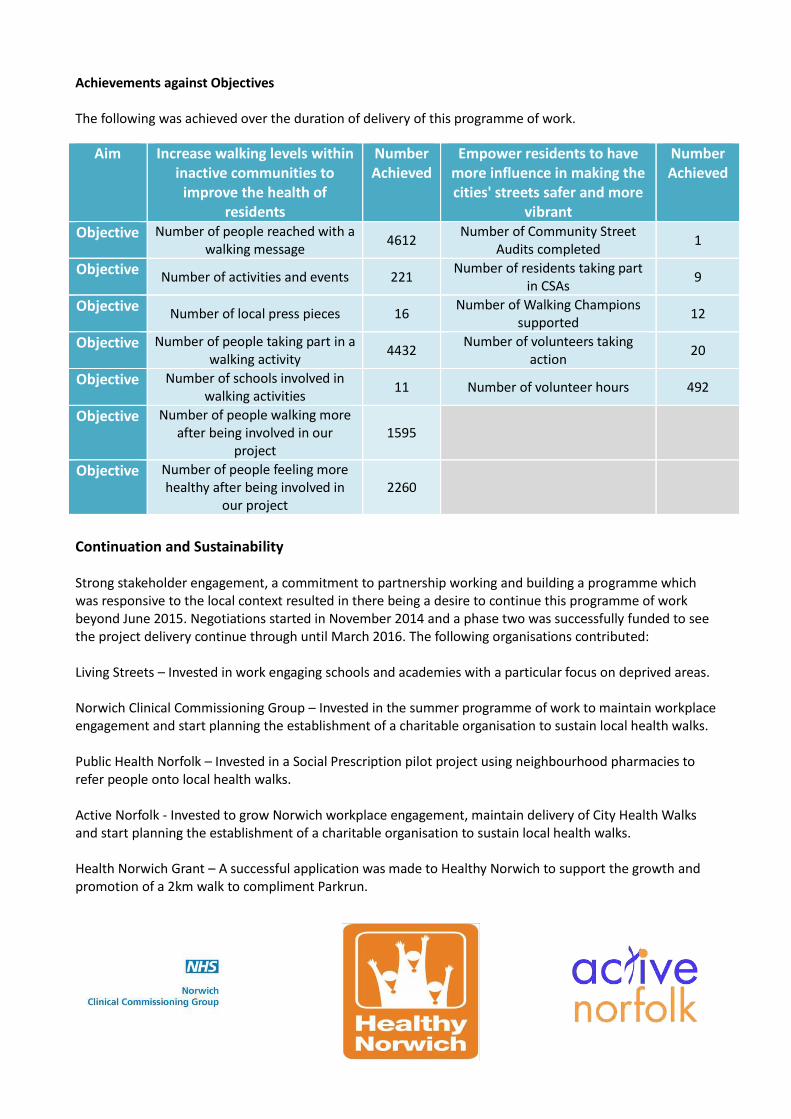
Achievements against Objectives The following was achieved over the duration of delivery of this programme of work.
Aim Increase walking levels within inactive communities to
improve the health of residents
Number Achieved
Empower residents to have more influence in making the cities' streets safer and more
vibrant
Number Achieved
Objective Number of people reached with a walking message
4612 Number of Community Street
Audits completed 1
Objective Number of activities and events 221
Number of residents taking part in CSAs
9
Objective Number of local press pieces 16
Number of Walking Champions supported
12
Objective Number of people taking part in a walking activity
4432 Number of volunteers taking
action 20
Objective Number of schools involved in walking activities
11 Number of volunteer hours 492
Objective Number of people walking more after being involved in our
project 1595
Objective Number of people feeling more healthy after being involved in
our project 2260
Continuation and Sustainability Strong stakeholder engagement, a commitment to partnership working and building a programme which was responsive to the local context resulted in there being a desire to continue this programme of work beyond June 2015. Negotiations started in November 2014 and a phase two was successfully funded to see the project delivery continue through until March 2016. The following organisations contributed: Living Streets – Invested in work engaging schools and academies with a particular focus on deprived areas. Norwich Clinical Commissioning Group – Invested in the summer programme of work to maintain workplace engagement and start planning the establishment of a charitable organisation to sustain local health walks. Public Health Norfolk – Invested in a Social Prescription pilot project using neighbourhood pharmacies to refer people onto local health walks. Active Norfolk - Invested to grow Norwich workplace engagement, maintain delivery of City Health Walks and start planning the establishment of a charitable organisation to sustain local health walks. Health Norwich Grant – A successful application was made to Healthy Norwich to support the growth and promotion of a 2km walk to compliment Parkrun.