wageindicator data report october 2011 domestic … · wageindicator data report october 2011 ......
TRANSCRIPT
Domestic workers
October 2011 WageIndicator Data Report
Their wages and work
in 12 countries
Kea Tijdens and Maarten van Klaveren
University of Amsterdam

About DECISIONS FOR LIFE (http://dfl.wageindicator.org/home)
The DECISIONS FOR LIFE project aims to raise awareness amongst young female workers
about their employment opportunities and career possibilities, family building and the work-
family balance. The lifetime decisions adolescent women face, determine not only their
individual future, but also that of society: their choices are key to the demographic and
workforce development of the nation.
DECISIONS FOR LIFE is awarded a MDG3 grant from the Netherlands Ministry of Foreign
Affairs as part of its strategy to support the United Nations’ Millennium Development Goals
no 3 (MDG3): “Promote Gender Equality and Empower Women”. DECISIONS FOR LIFE
more specifically focuses on MDG3.5: “Promoting formal employment and equal
opportunities at the labour market”, which is one of the four MDG3 priority areas identified
in Ministry’s MDG3 Fund. DECISIONS FOR LIFE runs from October 2008 until June 2011
and was extended till December.
DECISIONS FOR LIFE focuses on 14 developing countries, notably Brazil, India, Indonesia,
the CIS countries Azerbaijan, Belarus, Kazakhstan, Ukraine, and the southern African
countries Angola, Botswana, Malawi, Mozambique, South Africa, Zambia and Zimbabwe.
Project partners are International Trade Union Confederation (ITUC), Union Network
International (UNI), Wage Indicator Foundation, and University of Amsterdam/AIAS.
About Wage Indicator Foundation (http://www.wageindicator.org)
The independent non-profit Wage Indicator Foundation aims for transparency of the labour
market by sharing and comparing data through its network of national websites. Wage
Indicator has operations in more than 60 countries.
The WageIndicator Foundation was established in the Netherlands in 2003. The Foundation
is based in Amsterdam. It has regional offices in Ahmadabad, Bratislava, Buenos Aires, Cape
Town/Maputo and Minsk. Its headquarters and postal address are:
WageIndicator Foundation
Plantage Muidergracht 12
1018TV Amsterdam
The Netherlands

Table of contents
1 Introduction 1
1.1 ILO Convention concerning Decent Work for Domestic Workers .................................................. 1
1.2 About this report ..................................................................................................................................... 2
1.3 The data sources used in this report .................................................................................................... 3
2 Defining domestic workers 4
2.1 Defining domestic work......................................................................................................................... 4
2.2 Domestic workers in the WageIndicator dataset .................................................................................. 4
2.3 The data for domestic work occupations ............................................................................................. 5
3 Employment in domestic work 7
3.1 The demand for domestic work ............................................................................................................ 7
3.2 Numbers of domestic workers .............................................................................................................. 7
3.3 Employment status ................................................................................................................................. 9
4 Socio-demographic characteristics 11
4.1 Gender and household composition .................................................................................................. 11
4.2 Live-in workers ..................................................................................................................................... 13
4.3 Age .......................................................................................................................................................... 14
4.4 Migrant workers ................................................................................................................................... 15
4.5 Education ............................................................................................................................................... 17
5 Remuneration of domestic workers 19
5.1 Wage levels ............................................................................................................................................ 19
5.2 Bargaining power and unionisation ................................................................................................... 21
5.3 Minimum wage setting ........................................................................................................................ 23
5.4 Protecting domestic workers’ remuneration ..................................................................................... 25
6 Working hours of domestic workers 27
6.1 Usual working hours ............................................................................................................................ 27
6.2 Shifts or irregular hours ....................................................................................................................... 29
References 31
Appendix 1 Domestic work occupational titles 33
Appendix 2 The web-survey 34

P a g e | 1
1 Introduction
1.1 ILO Convention concerning Decent Work for Domestic Workers
On 16 June 2011, the International Labour Organization (ILO) adopted a Convention
concerning Decent Work for Domestic Workers. At ILO's 100th International Labour
Conference (ILC) in Geneva, Switzerland, on June 16, 2011, governments, employers and
trade unions from around the world adopted Convention No. 189 and the accompanying
Recommendation No. 201, establishing global minimum labour standards for domestic
workers -- a group of currently between 53 and 100 million people that has long been
excluded from most traditional labour protections. The large majority of domestic workers
are women, many of whom are migrants and girls.1 The basic rights the Convention lays
down include: 1) promotion and protection of the human rights of all domestic workers
(Preamble; Article 3); 2) respect and protection of fundamental principles and rights at work:
a) freedom of association and the effective recognition of the right to collective bargaining; b)
elimination of all forms of forced or compulsory labour; c) abolition of child labour, and d)
elimination of discrimination in respect of employment and occupation (Articles 3, 4, 11); 3)
effective protection against all forms of abuse, harassment and violence (Article 5); 4) fair
terms of employment and decent living conditions (Article 6). The Convention establishes
the right of domestic workers to be informed, in an easily understandable manner, of the
terms and conditions of their employment. It also establishes limits to the proportion of
remuneration that can be paid in kind, and provides for a weekly rest period of at least 24
consecutive hours. The Convention provides for special measures to address the
vulnerability of particular groups of domestic workers: young workers, live-in workers, and
migrant workers. The Recommendation provides practical guidance concerning possible
legal and other measures to implement the rights and principles stated in the Convention.
Support for the Convention at the ILC was overwhelming, with 396 voting in favour and
only 16 voting against (Swaziland as the only government and 15 employers’ organizations),
with an additional 63 abstaining (governments: El Salvador, Malaysia, Panama, United
Kingdom, Singapore, Sudan, Czech Republic, Thailand, the other employers’ organizations).
The Recommendation passed with a vote of 434 to 8, with 42 abstentions (ILO 100th session
website). This success was among others due to lobbying efforts of the International Trade
Union Confederation (ITUC) as well as the International Domestic Worker Network (IDWN)
in partnership with the International Union of Food, Agricultural, Hotel, Restaurant,
Catering, Tobacco and Allied Workers' Association (IUF).2 A number of trade union centres
1 Convention No. 189, full text: http://www.ilo.org/ilolex/english/convdisp1.htm; in brief: ILO 2011b. Recommendation No. 201: http://www.ilo.org/ilolex/english/recdisp1.htm. 2 It has to be noted that a large number of Non-Governmental Organisations (NGOs) in many countries have been active over the years in supporting domestic workers and their cause. For example, in an International NGO Consultation on the Ratification of Convention No. 189, early June 2011 in Geneva, nearly 40 NGOs from all over the world were involved (Hagemann et al 2011).

P a g e | 2
at the ILC included domestic workers in their delegations, as was the case for the delegations
of South Africa, Jamaica, Trinidad & Tobago, Peru, Brazil, UK, US, and the Netherlands.
Whereas historically domestic workers lacked organisation and access to international
legislative processes, now they had the opportunity to bring their demands directly to the
international negotiating table (Hobden 2011). The ILC standard setting process empowered
domestic workers at national level. Once added to the ILC agenda, national trade union
centres and domestic workers met with their respective labour ministries to provide
guidance on what rights they needed and to start processes for ratification of Convention
No. 189. For example, in the Philippines this will result in a first ratification of C189 before
June 2012.3
At the 2011 ILC, the International Trade Union Confederation (ITUC) has coordinated the
trade union input and has actively contributed to the adoption of a strong and fair
Convention on Domestic Workers. After that comes the phase of lobby work in countries for
its ratification, which will most certainly require a lot of persistence: reason why the ITUC is
launching the “12 by 12” campaign on 19 December 2011, on getting 12 countries to ratify
Convention 189 by the end of 2012. The ITUC organises the campaign in partnership with
IDWN, ETUC (European Trade Union Confederation), IUF, PSI, MFA (Migrant Forum Asia),
Solidar and HRW (Human Rights Watch) (www.ituc-csi.org). The extension of the DECISIONS
FOR LIFE (DFL) project offered an opportunity to reach out to this too often forgotten
category of precarious workers. For this reason, the University of Amsterdam/AIAS
conducted research on the incidence, wages, and characteristics of domestic employment in
the DFL countries.
1.2 About this report
This report focuses on the fourteen countries included in the DECISIONS FOR LIFE project.
These countries are Angola, Azerbaijan, Belarus, Brazil, Botswana, India, Indonesia,
Kazakhstan, Malawi, Mozambique, South Africa, Ukraine, Zambia and Zimbabwe.
However, as will be shown in this report, due to a lack of data from the WageIndicator web-
survey our research could not cover all these countries: for eight of the fourteen countries
sufficient data allowed for detailed analyses.
During 2009 and 2010, the University of Amsterdam/AIAS has made inventories with the
underlying gender analyses for all fourteen countries in the DECISIONS FOR LIFE project (See
Van Klaveren et al 2009, 2010, in the References list). In 2011, as part of the DFL project
extension, three more reports are being prepared. The first one addressed the eight service
sector occupations (Tijdens and Van Klaveren 2011). The second report is the current report
on domestic workers. A third report will address minimum wages for women.
3 Confirmed by high government officials at a regional meeting in Manila (October 2011), organised by IDWN/MFA (Migrant Forum Asia), Global Network, the ITUC and the ILO (information ITUC).
P a g e | 3
The outline of this report is as follows. Section 2 details the definition of domestic workers.
Section 3 gives more insight in the employment of domestic workers. Section 4 provides
details about their socio-demographic characteristics, such as household composition, age
and education. Section 5 describes remuneration of domestic workers. Section 6 explores
their working hours, focusing on the length of the working week and on shift and irregular
work.
1.3 The data sources used in this report
The data used in this report stem from several sources. First, the DECISIONS FOR LIFE reports
about the 14 countries have been used. Second, the data of the WageIndicator survey has been
used. This is a multi-country, continuous survey, posted at the national WageIndicator
websites in a wide range of countries, among which the DFL countries, including a paper-
based survey in Zambia. Appendix 2 includes a methodological explanation of this survey.
Third, academic journals and all kinds of reports have been searched for information on
domestic work.

P a g e | 4
2 Defining domestic workers
2.1 Defining domestic work
The overall understanding of the concept of domestic worker is mostly clear. In this report,
domestic work is understood as paid domestic services delivered to private households.
There are three common elements in this definition. We will discuss these three here.
The first one is that the job includes services delivered to a private household. In case of
dependent employment, the definition states that the jobholder’s employer is a private
household. In case of own-account or self-employed workers, the definition states the
worker's services are delivered to a private household. The latter definition is much broader
than the former definition.
The second element is that the job includes domestic tasks, thus tasks related to
housekeeping. Clearly, this states that domestic tasks have to be distinguished from home
work and workplaces at home. It should also be separated from agricultural work, though
the boundaries are not always clear. Housekeeping has a broad meaning, including cooking,
food preparation and dishwashing. It includes cleaning, washing and tidying up. It also
includes child caring and caring for sick or elderly persons in the household. Finally, it also
includes the tasks related to the organisation of housekeeping.
The third element is that the job includes payment for the services delivered. Thus, domestic
work performed by members of the household's family as part of unpaid household duties is
not included in the definition. Discussions concern payment in kind. Domestic workers may
be paid in food and subsistence, in addition to receiving financial remuneration.
2.2 Domestic workers in the WageIndicator dataset
Taken into account the definitions mentioned above, the domestic workers in the
WageIndicator web-survey had to be identified. Two approaches were used. The first one was
based on the ticked occupation, derived from the survey question 'What kind of work do you
do?'. The occupation database underlying this question in the web-survey does not have an
occupational title ‘domestic worker delivering services to private households’, but the
database has several related occupational titles such as domestic cleaner, domestic helper,
child carer, kitchen help, cook, and alike. These jobholders may either deliver their services
to private households or are employed in institutional settings, such as elderly homes or
child care centres.
The second approach was based on the ticked industry, derived from the survey question 'In
what industry do you work?'. The database with industry categories underlying this
question in the web-survey has a broad category ‘Security, cleaning, homework’ and within
that category a number of items, among others ‘Domestic staff employed by private
households’, ‘Security staff employed by private households’, ‘Child care staff employed by

P a g e | 5
private households’, ‘Gardening staff or stablemen employed by private households’, ‘Other
staff employed by private households’ and alike (See Appendix). When listing the job titles
of respondents, who had ticked to be staff employed by private households, we came across
job titles such as au-pairs, nannies and other child minders (grouped under Childcare
workers); domestic workers and home care aides (grouped under Domestic workers); cooks,
catering workers and dishwashers (grouped under Catering workers); and cleaners and
housekeeping staff (grouped under Cleaning workers). Yet, a wide variety of other
occupations was ticked, such as private drivers, doorkeepers, wardens, hairdressers, clerks,
personal assistants, bookkeepers, and alike.
The analyses in this report could have been restricted to a very tight definition of domestic
workers, namely to survey respondents with occupational titles 'domestic cleaner' or
'domestic helper' and to those who had ticked the industry category ‘Domestic staff
employed by private households’. In that case, however, there would have been left simply
too few observations to conduct analyses on these workers' wages and working hours. For
this reason, in this report the domestic work occupations have been defined for the following
occupational titles as indicated above: Catering; Childcare; Cleaning, and Domestic (See
Appendix 1).
2.3 The data for domestic work occupations
The WageIndicator web-survey is a continuous, volunteer survey. For this report, the data
covers the period between January 2006 and July 2011, thus over 5.5 years. Table 1 shows
that in this period of time 7,704 men and women in the domestic work occupations in twelve
DECISIONS FOR LIFE countries under study completed the survey. For two countries, Malawi
and Botswana, we had hardly any data. In order to have sufficient data per country, we
decided to limit the analyses to countries with at least 150 observations. For eight countries
analyses could be made, as Table 1 shows. The one-last row in the table shows which
countries could not be included in the remaining part of this paper. The last column shows
the first quarter in which observations from this country entered the database. As can be
seen, a late start of the survey is one of the reasons for excluding a country from the analysis.
Another reason is that in some countries data-intake was overall insufficient. The remaining
part of this report is based on 7,704 observations in eight of the twelve countries, namely
Belarus, Brazil, India, Indonesia, Kazakhstan, South Africa, Ukraine, and Zambia.

P a g e | 6
Table 1 Number of observations in the four categories of domestic work occupations, breakdown by
country (The one-last column indicates if the country is included in the analyses and the last
column indicates when the web-survey started in the country at stake)
Catering Childcare Cleaning Domestic Total Included Since
Angola 5 2 7 6 20 No 2009Q2
Azerbaijan 18 6 6 3 33 No 2010Q1
Belarus 278 197 166 24 665 Yes 2008Q1
Brazil 1663 352 998 511 3524 Yes 2006Q4
India 417 83 470 409 1379 Yes 2006Q1
Indonesia 100 32 63 22 217 Yes 2009Q2
Kazakhstan 73 54 76 24 227 Yes 2008Q2
Mozambique 10 5 3 5 23 No 2006Q3
South Africa 587 116 166 185 1054 Yes 2008Q1
Zimbabwe 5 1 3 2 11 No 2009Q4
Ukraine 126 107 101 38 372 Yes 2008Q2
Zambia 112 0 48 19 179 Yes 2009Q3
Total 3394 955 2107 1248 7704
Source: WageIndicator data 2006Q1-2011Q2, selection: men and women in the domestic work occupations in 12 DfL countries. No data available for Botswana and Malawi.
It should be clear that the data in the survey is not representative for the domestic workforce
in the countries at stake. The reason is that the WageIndicator survey is a volunteer survey,
thus only web-visitors interested in the topic of the website may complete the survey. In
addition, the WageIndicator survey is a web-survey, thus it requires reading skills. Based on
comparisons with representative data about the labour force from ILO, we know that
younger and male workers are overrepresented in the WageIndicator survey data, whereas
older and the female workers are underrepresented. Graph 2.1 shows to what extent groups
are over- or under-represented in the survey. Particularly in India, with its relative large
share of illiterates in the population, this contributes to the bias in the survey data.
Graph 2.1 Factor of under- respectively overrepresentation of WageIndicator survey data compared to the
Economically Active Population Estimates and Projections 2010 from ILO, Geneva. No data available
for Angola, Botswana, Malawi, Zambia, Zimbabwe.
Source: WageIndicator data 2010
0
1
2
3
4
5
6
7
8
Male30min
Male30_39
Male40plus
Female30min
Female30_39
Female40plus

P a g e | 7
3 Employment in domestic work
3.1 The demand for domestic work
The demand for domestic work stems from households with sufficient income which might
hire a domestic worker or from households where the members are not able to conduct their
housekeeping. Domestic work occurs frequently in case of a dispersed wage distribution,
when the households in the higher layers of the wage distribution can afford hiring a
domestic worker whose earnings are in the lowest ranks of the wage distribution. As the law
and practice ILO report on Decent work for domestic workers in preparing the Convention
noted, in many countries paid domestic work remains virtually invisible as a form of
employment. Domestic work takes place in the home, not alongside co-workers but in
isolation behind closed doors (ILO 2010a: para 4). Related are the difficulties in collecting
data on the number of domestic workers throughout the world. According to the ILO report,
the main reasons for the lack of accurate and comparable data include the high incidence of
undeclared domestic work and the consequent under-reporting, the varying definitions of
domestic work in statistical surveys, and the fact that national statistics often do not count
domestic workers as a distinct category (ILO 2010a: para 20).
Neither much data is available with respect to the number of households hiring a domestic
worker. South Africa is an exception here. In this country in 2000 7% of households indicated
that a non-member did most of the housework. The percentage was highest in urban formal
areas (11%), next highest in rural commercial areas (6%), and 2% or lower in urban informal
or deep rural (i.e. ex-homeland) areas. In terms of population group, the percentage of
households employing domestic workers was 29% among households in which the first
respondent was classified white, 19% among Indian households, and only 2% among
coloured and African households (Budlender 2011a: 6, using South Africa’s Time-Use Survey
2000). Worldwide, the number of households employing one or more domestic workers is
most likely larger than the number of domestic workers, as many domestic workers are
employed by more than one household while the share of households employing several
domestic workers may be quite limited.
3.2 Numbers of domestic workers
Recent ILO estimates based on national surveys and/or censuses of 117 countries place the
number of domestic workers as of the year 2010 at around 53 million worldwide. The
authors regard this as the most reliable minimum estimates available, but add: “Given that
there are reasons to believe that the source data under-count domestic workers, the true
number could be close to the estimate of 100 million domestic workers worldwide that was
previously cited by the ILO” (Simonovsky and Luebker 2011: 6). Following this estimate,
domestic work accounts at least for 1.7% of total employment worldwide, and for 3.6% of
wage employment. The ILO also estimates that women account for five in six (83%) domestic
workers, with female domestic workers making up 3.5% of all female employment and 7.5%

P a g e | 8
of all female wage workers in the world -- reflecting the importance of domestic work as a
source of employment for women. This is especially the case in Latin America and the
Caribbean, where paid domestic work accounts for over 17% of female employment, and in
the Middle East, where even over one in five of female workers (20.5%) are domestic
workers. In particular in the Middle East, many of them are migrant workers (Simonovsky
and Luebker 2011: 7-8). Many children carry out domestic chores in others’ households,
mostly against extremely low pay rates or, in the worst cases, with no pay at all. The ILO
estimates the number of 5-17-year-olds in domestic work worldwide at 15.5 million for 2008,
of which 11.3 million girls (73%). In this category, 4.9 million girls were only 5-14 years of age
(Simonovsky and Luebker 2011: 9). Already because of their age they are lacking in the
national labour market statistics, that mostly cover those 15 years and older.4 We have to
make the reservation here, that our WageIndicator web-survey is not suited to trace child
labour among domestic workers.
Below we recapitulate the indications, from various sources, on numbers of domestic
workers for the 14 DECISIONS FOR LIFE countries. We found such numbers for six
countries.
In 2001, an official survey of urban employment in Angola counted 7,000 domestic workers,
or 0.5% of total employment in urban areas (Van Klaveren et al 2009b). According to the
official 2005/06 Labour Force Report of Botswana, 7% of the female workforce of that
country worked in private households as well as 2% of the male workforce (Van Klaveren et
al, 2009e).
As for South Africa, the official statistics noted for 2007 943,000 women in paid employment
as domestic workers, nearly 16% of total female employment in that country; moreover,
323,000 men worked as domestics, just over 4% of the male workforce. In 2000, 1,036,000
female domestic workers were counted, 18.5% of the female workforce, implying a decrease
of 90,000 or nearly 9% in the years in between. By contrast, in 2000 234,000 male domestics
were counted, suggesting an increase of 90,000 in between 2000 and 2007. It should be noted
that the total figures for 2000 and 2007 likely hide between 200,000 and 300,000 persons
mainly living on subsistence agriculture. Using slightly different criteria than in 2000 and
2007, in April – June 2009 Statistics South Africa counted 931,000 female domestic workers,
or 15.5% of the female workforce. Though between 2007 and 2009 the number of females in
informal labour fell substantially in South Africa, this obviously was not the case for female
domestic workers – in contrast with the decreasing number of male domestics (Van Klaveren
et al 2009c).
The Brazilian Labour Force Survey 2007 counted the considerable amount of 6.3 million
women aged 15-64 employed as domestic workers: 16% of Brazil’s female employment. 62%
of these females were Afro-Brazilians; 64% had either no education or only partial education
4 In some countries child labour on an even lower age is permissible. For example, in India there is no overall minimum age for child labour, though a ruling, effective 2006, prohibits children under the age of 14 from labour in the domestic sector and the hospitality industry (Van Klaveren et al 2010a).
P a g e | 9
at elementary school level. By 2007 about 400,000 men were employed as such, 0.9% of the
male workforce. Other research indicates that in the country’s urban areas, domestic work
recently accounted for nearly half of all paid employment of poor women. According to
official statistics the number of domestic workers in Brazil in 2008 had even grown to 6.6
million, the single largest occupational category in the workforce (Zepeda 2008; Van
Klaveren et al 2009g; Gomes and Bertolin 2010).
In India and Indonesia the shares of female domestic workers seem considerably lower than
in South Africa and Brazil. ILO calculations based on India’s 2004-05 Employment and
Unemployment Survey suggest that the number of female domestic workers was nearly 2
million, or 2.2% of all employed women (compared to 0.5% for men). In particular for India,
NGOs and media have come up with much higher figures of domestic workers, up to 90
million, but it is usually not possible to verify the source or estimation method behind such
non-official figures (Simonovsky and Luebker 2011: 4-5).
Indonesia counted, according to the country’s statistical bureau BPS, in August 2008 1.7
million women performing domestic chores for rich and middle-class households: 4% of its
female workforce, whereas 0.5 million men were domestic workers, nearly 1% of the male
workforce. Like elsewhere, the child domestic workers younger than 15 of age remain
outside the regular labour market statistics. For 2009, BPS stated that 1.6 million girls aged
10-17 were in child labour, of which over one-third in domestic work (Van Klaveren et al
2010b). Earlier, the ITUC concluded, based on ILO reporting, that more than 700,000
children, mainly girls, were employed as domestic workers in Indonesia (ITUC 2009).
3.3 Employment status
Paid domestic work is hardly visible in society and tends to be perceived as something other
than regular employment. As a result, the domestic employment relationship is not
specifically addressed in many legislative enactments, thus rendering domestic workers
vulnerable to unequal, unfair and often abusive treatment (ILO 2010a: para 4). Important
legal initiatives have been taken in this respect in a number of countries, including some of
the FDL countries. For example, in India the Unorganized Workers’ Social Security Bill, 2008,
has been enacted. The Bill addresses pensions, maternity insurance, general insurance and
health insurance (website Ministry Labour & Employment India). Moreover, a Domestic
Workers (Registration, Social Security and Welfare) Bill, 2008, has been proposed by India’s
National Commission of Women which, in its statement of objectives, refers to the “severe
exploitation” faced by domestic workers in the absence of national legal protection and, in
the case of child labour, the lack of enforcement machinery. Building on the initiative of
some state governments in India to take regulatory initiatives in respect of domestic workers,
notably on minimum wages, the Commission proposes legislation to regulate conditions of
work nationally, establish a registry of workers, employers and employment agencies, and
set up state and district boards to monitor and assist domestic workers (ILO 2010a: para 96).
In 2006 Brazil combined two mechanisms to foster the entry of domestic work into the formal
economy and the payment of wages: (1) income tax deductions linked to the payment of
P a g e | 10
social security benefits on behalf of the domestic worker to the National Insti
Security (INS); and (2) simplified social security payment procedures. The formalization of
domestic work and the increase in contributions to the social security scheme were believed
to offset the tax incentives to employers
salary for room and board (ILO 2010a: para 147
What are the employment statuses
in the WageIndicator web-survey? Graph 3.1 indicates that on average eight in t
are employees, with little variation across the four occupational groups. The remaining
group is self-employed or falls in the category ‘other’, which includes trainees, students,
disabled persons, and alike. The graph shows that particularly in
Ukraine the percentages employees are relatively low (around 50%).
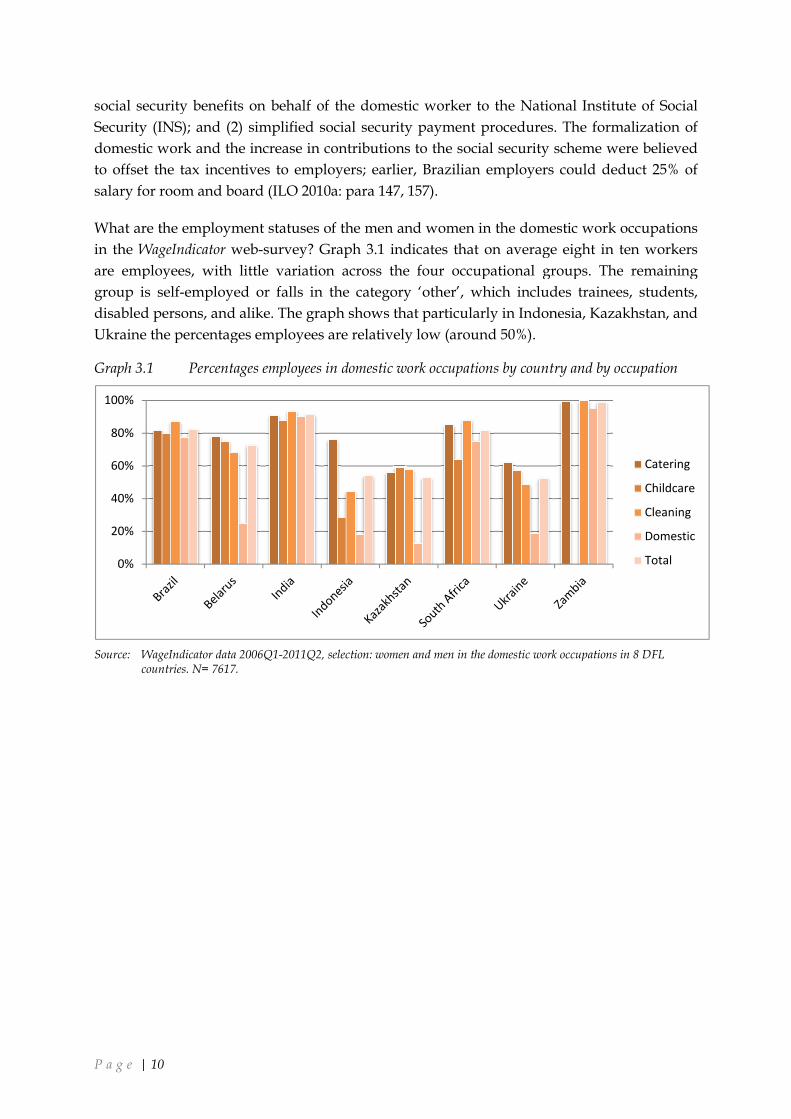
Graph 3.1 Percentages employe
Source: WageIndicator data 2006Q1-2011Q2, selection: women and men countries. N= 7617.
0%
20%
40%
60%
80%
100%
social security benefits on behalf of the domestic worker to the National Insti
Security (INS); and (2) simplified social security payment procedures. The formalization of
domestic work and the increase in contributions to the social security scheme were believed
to offset the tax incentives to employers; earlier, Brazilian employers could deduct 25% of
(ILO 2010a: para 147, 157).
What are the employment statuses of the men and women in the domestic work occupations
survey? Graph 3.1 indicates that on average eight in t
are employees, with little variation across the four occupational groups. The remaining
employed or falls in the category ‘other’, which includes trainees, students,
disabled persons, and alike. The graph shows that particularly in Indonesia, Kazakhstan, and
Ukraine the percentages employees are relatively low (around 50%).
employees in domestic work occupations by country and by occupation
2011Q2, selection: women and men in the domestic work occupations in 8 DFL
social security benefits on behalf of the domestic worker to the National Institute of Social
Security (INS); and (2) simplified social security payment procedures. The formalization of
domestic work and the increase in contributions to the social security scheme were believed
lian employers could deduct 25% of
in the domestic work occupations
survey? Graph 3.1 indicates that on average eight in ten workers
are employees, with little variation across the four occupational groups. The remaining
employed or falls in the category ‘other’, which includes trainees, students,
Indonesia, Kazakhstan, and
by country and by occupation
in the domestic work occupations in 8 DFL
Catering
Childcare
Cleaning
Domestic
Total
P a g e | 11
4 Socio-demographic characteristics
4.1 Gender and household composition
According to the ILO estimates, females make up 87% of domestic workers worldwide. In
Latin America and the Caribbean this
and the Middle East (64%) the female share is lower but still women and girls
majority (Simonovsky and Luebker
derived from the former section, reflect these regional differences: Brazil 94%, South Africa
74%, Indonesia 77%. According to the ILO data, c
predominantly women, while catering is predominantly male and cleaning is equally male
and female (who may well be the main breadwinners for their families and themselves) and,
in many countries, child labourers. Further, these workers often either belong to historically
disadvantaged and despised communities such as minority ethnic groups, indigenous
peoples, low-caste, low-income rural and urban groups, or are migrants (
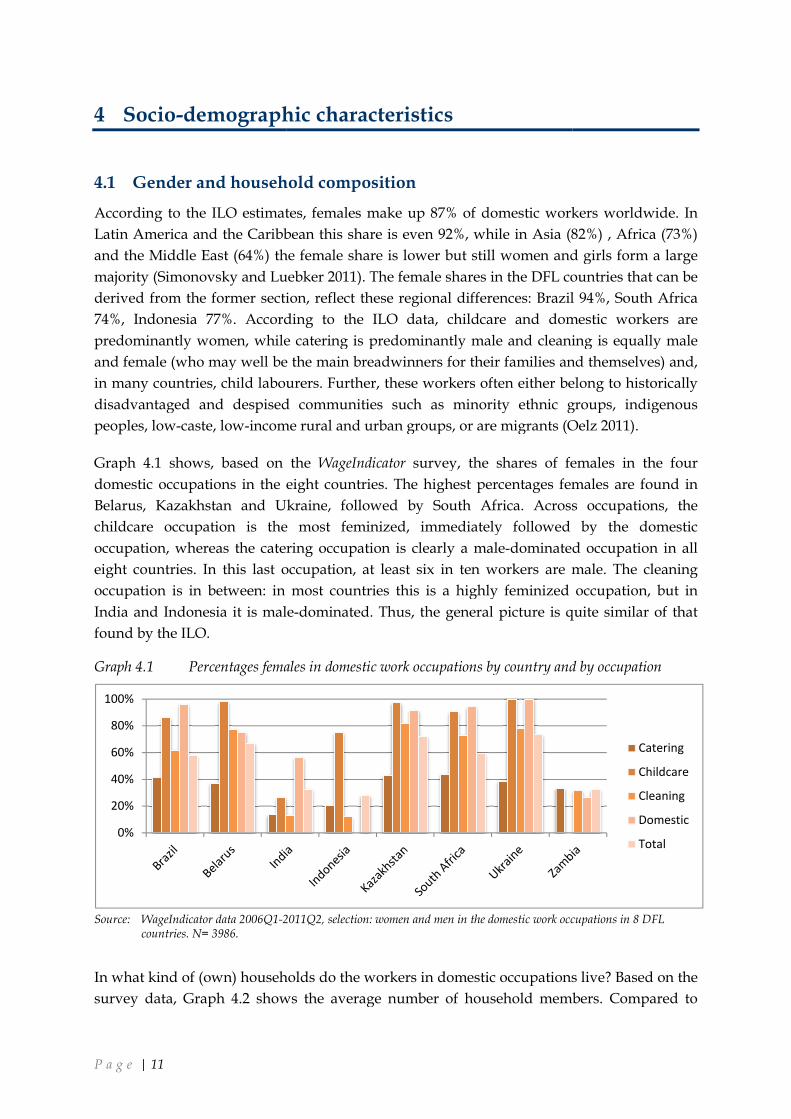
Graph 4.1 shows, based on the
domestic occupations in the eight countries. The highest percentages females are found in
Belarus, Kazakhstan and Ukraine
childcare occupation is the most feminized, immediately followed by the domestic
occupation, whereas the catering occupation is clearly a male
eight countries. In this last occupation, at least six in ten workers are male. The cleaning
occupation is in between: in most countries this is a highly feminized occupation,
India and Indonesia it is male
found by the ILO.
Graph 4.1 Percentages females in domestic work occupations
Source: WageIndicator data 2006Q1-2011Q2, selectcountries. N= 3986.
In what kind of (own) households do the workers in domestic occupations live? Based on the
survey data, Graph 4.2 shows the average number of household members. Compared to
0%
20%
40%
60%
80%
100%
demographic characteristics
Gender and household composition
According to the ILO estimates, females make up 87% of domestic workers worldwide. In
Latin America and the Caribbean this share is even 92%, while in Asia (82%) , Africa (73%)
and the Middle East (64%) the female share is lower but still women and girls
and Luebker 2011). The female shares in the DFL countries that can be
derived from the former section, reflect these regional differences: Brazil 94%, South Africa
According to the ILO data, childcare and domestic workers are
while catering is predominantly male and cleaning is equally male
and female (who may well be the main breadwinners for their families and themselves) and,
in many countries, child labourers. Further, these workers often either belong to historically
vantaged and despised communities such as minority ethnic groups, indigenous
income rural and urban groups, or are migrants (Oelz
Graph 4.1 shows, based on the WageIndicator survey, the shares of females in the four
occupations in the eight countries. The highest percentages females are found in
Ukraine, followed by South Africa. Across occupations, the
childcare occupation is the most feminized, immediately followed by the domestic
whereas the catering occupation is clearly a male-dominated occupation in all
eight countries. In this last occupation, at least six in ten workers are male. The cleaning
occupation is in between: in most countries this is a highly feminized occupation,
male-dominated. Thus, the general picture is quite similar of that
s females in domestic work occupations by country and by occupation
2011Q2, selection: women and men in the domestic work occupations in 8 DFL
In what kind of (own) households do the workers in domestic occupations live? Based on the
survey data, Graph 4.2 shows the average number of household members. Compared to
According to the ILO estimates, females make up 87% of domestic workers worldwide. In
is even 92%, while in Asia (82%) , Africa (73%)
and the Middle East (64%) the female share is lower but still women and girls form a large
2011). The female shares in the DFL countries that can be
derived from the former section, reflect these regional differences: Brazil 94%, South Africa
hildcare and domestic workers are
while catering is predominantly male and cleaning is equally male
and female (who may well be the main breadwinners for their families and themselves) and,
in many countries, child labourers. Further, these workers often either belong to historically
vantaged and despised communities such as minority ethnic groups, indigenous
Oelz 2011).
survey, the shares of females in the four
occupations in the eight countries. The highest percentages females are found in
, followed by South Africa. Across occupations, the
childcare occupation is the most feminized, immediately followed by the domestic
dominated occupation in all
eight countries. In this last occupation, at least six in ten workers are male. The cleaning
occupation is in between: in most countries this is a highly feminized occupation, but in
Thus, the general picture is quite similar of that
by country and by occupation
ion: women and men in the domestic work occupations in 8 DFL
In what kind of (own) households do the workers in domestic occupations live? Based on the
survey data, Graph 4.2 shows the average number of household members. Compared to
Catering
Childcare
Cleaning
Domestic
Total

P a g e | 12
other countries, in India, Indonesia and Zambia these workers live in the largest household
with on average almost 2.5 members, including themselves. By contrast, in Brazil, Belarus,
Kazakhstan, South Africa and Ukraine their households are on average less
persons. When comparing the four occupations, the catering workers on average life in the
largest households, whereas the childcare workers live in households with the smallest
number of members. The cleaning and the domestic workers are in betwe
Graph 4.2 Average numbers of household members of workers in domestic work occupations country and by occupation
Source: WageIndicator data 2006Q1-2011Q2, selection: women and men in the domestic work occupations in 8 DFL countries. N= 6175.
Do the workers in domestic
percentages workers reporting so, based on the survey data. In the four occupations jointly,
five to seven in ten workers live with a partner. Across countries, the share
partner is highest in Belarus, Kazakhstan
Africa. When comparing the four occupations in the eight countries, the catering workers on
average have most often a partner, whereas the domes
childcare and the cleaning workers are in between.
0.0
1.0
2.0
3.0
4.0
her countries, in India, Indonesia and Zambia these workers live in the largest household
with on average almost 2.5 members, including themselves. By contrast, in Brazil, Belarus,
Kazakhstan, South Africa and Ukraine their households are on average less
persons. When comparing the four occupations, the catering workers on average life in the
largest households, whereas the childcare workers live in households with the smallest
number of members. The cleaning and the domestic workers are in between.
Average numbers of household members of workers in domestic work occupations country and by occupation
2011Q2, selection: women and men in the domestic work occupations in 8 DFL
Do the workers in domestic work occupations live with a partner? Graph 4.3 shows the
percentages workers reporting so, based on the survey data. In the four occupations jointly,
five to seven in ten workers live with a partner. Across countries, the share
Belarus, Kazakhstan and Ukraine, and lowest in Brazil, India, and South
Africa. When comparing the four occupations in the eight countries, the catering workers on
average have most often a partner, whereas the domestic workers have least often so. The
childcare and the cleaning workers are in between.
her countries, in India, Indonesia and Zambia these workers live in the largest households,
with on average almost 2.5 members, including themselves. By contrast, in Brazil, Belarus,
Kazakhstan, South Africa and Ukraine their households are on average less than two
persons. When comparing the four occupations, the catering workers on average life in the
largest households, whereas the childcare workers live in households with the smallest
en.
Average numbers of household members of workers in domestic work occupations by
2011Q2, selection: women and men in the domestic work occupations in 8 DFL
live with a partner? Graph 4.3 shows the
percentages workers reporting so, based on the survey data. In the four occupations jointly,
five to seven in ten workers live with a partner. Across countries, the share of workers with a
, and lowest in Brazil, India, and South
Africa. When comparing the four occupations in the eight countries, the catering workers on
tic workers have least often so. The
Catering
Childcare
Cleaning
Domestic

P a g e | 13
Graph 4.3 Percentages of workers in domestic work occupations with a partner by occupation
Source: WageIndicator data 2006Q1-2011Q2, selection: women countries. N= 3986.
Do the workers in domestic occupations have children? Graph 4.4 shows the shares of
workers reporting so, based on the survey data. Across countries large differences can be
noticed. In Brazil, only one in ten workers in the four occupations has a child, whereas in
Zambia this is, with five in ten
eight countries, the catering workers on average have most often a child, whereas the
childcare and the domestic workers have least often so. The cleaning workers are in between.
Graph 4.4 Percentages of workers in domestic work occupations with one or more children country and by occupation
Source: WageIndicator data 2006Q1-2011Q2, scountries. N= 5951.
4.2 Live-in workers
In many cases, the workplace is also the domestic worker's residence. According to the law
and practice ILO report, living and working in their employer’s
negative, impact on workers’ personal autonomy and mobility and can influence decisions as
to their future, including the decision to found a family of their own. It notes that in
0%
20%
40%
60%
80%
100%
0%
20%
40%
60%
80%
100%
s of workers in domestic work occupations with a partner
2011Q2, selection: women and men in the domestic work occupations in 8 DFL
Do the workers in domestic occupations have children? Graph 4.4 shows the shares of
workers reporting so, based on the survey data. Across countries large differences can be
Brazil, only one in ten workers in the four occupations has a child, whereas in
five in ten, much higher. When comparing the four occupations in the
eight countries, the catering workers on average have most often a child, whereas the
childcare and the domestic workers have least often so. The cleaning workers are in between.
s of workers in domestic work occupations with one or more children country and by occupation
2011Q2, selection: women and men in the domestic work occupations in 8 DFL
In many cases, the workplace is also the domestic worker's residence. According to the law
and practice ILO report, living and working in their employer’s home has a major
impact on workers’ personal autonomy and mobility and can influence decisions as
to their future, including the decision to found a family of their own. It notes that in
s of workers in domestic work occupations with a partner by country and
and men in the domestic work occupations in 8 DFL
Do the workers in domestic occupations have children? Graph 4.4 shows the shares of
workers reporting so, based on the survey data. Across countries large differences can be
Brazil, only one in ten workers in the four occupations has a child, whereas in
. When comparing the four occupations in the
eight countries, the catering workers on average have most often a child, whereas the
childcare and the domestic workers have least often so. The cleaning workers are in between.
s of workers in domestic work occupations with one or more children by
election: women and men in the domestic work occupations in 8 DFL
In many cases, the workplace is also the domestic worker's residence. According to the law
home has a major, mostly
impact on workers’ personal autonomy and mobility and can influence decisions as
to their future, including the decision to found a family of their own. It notes that in
Catering
Childcare
Cleaning
Domestic
Total
Catering
Childcare
Cleaning
Domestic
Total

P a g e | 14
particular live-in and migrant domestic workers ar
mistreatment at the workplace. Verbal abuse such as shouting, insulting the employee’s
nationality or race and using inappropriate language, is frequently reported. Physical abuse
of various kinds, including sexual harassme
28). Very few data is available about the numbers of live
in rural areas the percentages live
where only a limited part of houses will have sufficient space to house a domestic worker.
The 2011 Census in South Africa
summerhouse where a domestic worker lives.
To what extent do the workers in domestic occupations i
with their employer? Graph 4.5 shows the percentages workers reporting so, based on the
survey data. Across countries, large differences can be noticed
quite low. In Indonesia, one in ten workers
Belarus, Kazakhstan, South Africa, Ukraine, and Zambia this is one to three in hundred.
When comparing the four occupations in the eight countries, the catering workers on
average live in the least often with l
workers most often live in, with five in hundred workers. The domestic and the cleaning
workers are in between.
Graph 4.5 Percentages of livecountry and by occupation
Source: WageIndicator data 2006Q1-2011Q2, selection: women and men in the domestic work occupations in 8 DFL countries. N= 7617.
4.3 Age
How old are the workers in the domestic occupations? The ILO reports that
be found alongside older age groups. In Ghana, for instance, legal child domestic workers
are reported, whereas in the Southern Cone of Latin America, the bulk of domestic workers
are between 29 and 49 years old, and in Jordan 70% of migrant domestic wo
old and above (ILO 2010a: para 21).
aged 30-49, with 26% aging 50 and above and 19% below the age of 30 (Budlender 2010b: 22).
0%
5%
10%
15%
20%
in and migrant domestic workers are vulnerable to various forms of
mistreatment at the workplace. Verbal abuse such as shouting, insulting the employee’s
nationality or race and using inappropriate language, is frequently reported. Physical abuse
of various kinds, including sexual harassment, has also been identified (ILO 2010a:
28). Very few data is available about the numbers of live-in workers. It can be assumed that
in rural areas the percentages live-in domestics are much higher compared to urban areas,
rt of houses will have sufficient space to house a domestic worker.
The 2011 Census in South Africa contains a survey question asking if the respondent has a
summerhouse where a domestic worker lives.
To what extent do the workers in domestic occupations in our WageIndicator
with their employer? Graph 4.5 shows the percentages workers reporting so, based on the
survey data. Across countries, large differences can be noticed, though the shares remain
. In Indonesia, one in ten workers in the four occupations lives in, whereas in
Belarus, Kazakhstan, South Africa, Ukraine, and Zambia this is one to three in hundred.
When comparing the four occupations in the eight countries, the catering workers on
average live in the least often with less than three in hundred workers, whereas the childcare
workers most often live in, with five in hundred workers. The domestic and the cleaning
s of live-in workers among all in domestic work occupationscountry and by occupation
2011Q2, selection: women and men in the domestic work occupations in 8 DFL
How old are the workers in the domestic occupations? The ILO reports that
be found alongside older age groups. In Ghana, for instance, legal child domestic workers
are reported, whereas in the Southern Cone of Latin America, the bulk of domestic workers
are between 29 and 49 years old, and in Jordan 70% of migrant domestic wo
old and above (ILO 2010a: para 21). In South Africa, in 2007 55% of all domestic workers
50 and above and 19% below the age of 30 (Budlender 2010b: 22).
e vulnerable to various forms of
mistreatment at the workplace. Verbal abuse such as shouting, insulting the employee’s
nationality or race and using inappropriate language, is frequently reported. Physical abuse
nt, has also been identified (ILO 2010a: para 27,
in workers. It can be assumed that
in domestics are much higher compared to urban areas,
rt of houses will have sufficient space to house a domestic worker.
a survey question asking if the respondent has a
WageIndicator survey live in
with their employer? Graph 4.5 shows the percentages workers reporting so, based on the
, though the shares remain
in the four occupations lives in, whereas in
Belarus, Kazakhstan, South Africa, Ukraine, and Zambia this is one to three in hundred.
When comparing the four occupations in the eight countries, the catering workers on
ess than three in hundred workers, whereas the childcare
workers most often live in, with five in hundred workers. The domestic and the cleaning
in workers among all in domestic work occupations, breakdown by
2011Q2, selection: women and men in the domestic work occupations in 8 DFL
How old are the workers in the domestic occupations? The ILO reports that young girls can
be found alongside older age groups. In Ghana, for instance, legal child domestic workers
are reported, whereas in the Southern Cone of Latin America, the bulk of domestic workers
are between 29 and 49 years old, and in Jordan 70% of migrant domestic workers are 30 years
In South Africa, in 2007 55% of all domestic workers
50 and above and 19% below the age of 30 (Budlender 2010b: 22).
Catering
Childcare
Cleaning
Domestic
Total

P a g e | 15
We used the WageIndicator web
occupations in the eight countries. We have to
definitely not a good tool to trace child labour among domestic workers. Graph 4.6 shows
the distribution over three age groups,
the largest share of young domestic workers aged 25 and under with almost four in ten
workers in this age group, followed by Zambia with three in ten
one in ten domestic workers is young, followed by South Africa with almost two in ten. In
Indonesia and in Zambia, the shares of workers aged 26
other countries. In Ukraine, the share of that age group is only three in ten. When tracing the
shares of workers aged 36 and older, not surprisingly in Indonesia this is only one in ten. In
contrast, in Ukraine it is five in ten, followed by South Africa with four in ten.
Indonesia, Zambia also shows a relatively young group of respondents.
Graph 4.6 Distribution of workers in domestic work occupation over age groups by occupation
Source: WageIndicator data 2006Q1-2011Q2, selection: women and men in the domestic work occupations in 8 DFL countries. N= 4557.
4.4 Migrant workers
According to the basic ILO report on domestic workers, one of the most striking changes in
domestic work in the past 30 years has been the growing prevalence of migrant work. In
several regions, including Europe and the Gulf countries and the Middle East,
domestic labourers today are migrant women (ILO 2010a: para 21).
Rights Watch (HRW), by 2010 there were
workers in Saudi Arabia; 660,000 in Kuwait; 200,000 in Lebanon; 300,000 in
196,000 in Singapore – in majority female (HRW 2010: 8).
may be extremely vulnerable, for many reason
regulated and monitored. For example, if
employment in another country,
direct negotiations with the employing household, and thus have no possibility to make their
skills and motivation part of the equation.
with their employers. Socio-cultural factors increase their vulnerability to abusive treatment,
discrimination and unfair working conditions (Oelz 2011: 3
0%
20%
40%
60%
80%
100%
web-survey to explore the age distribution in the four domestic
occupations in the eight countries. We have to repeat one reservation here:
definitely not a good tool to trace child labour among domestic workers. Graph 4.6 shows
the distribution over three age groups, based on the survey data. Obviously, Indonesia has
the largest share of young domestic workers aged 25 and under with almost four in ten
, followed by Zambia with three in ten. In contrast, in Ukraine only
ers is young, followed by South Africa with almost two in ten. In
Indonesia and in Zambia, the shares of workers aged 26-35 is with five in ten larger than in
other countries. In Ukraine, the share of that age group is only three in ten. When tracing the
hares of workers aged 36 and older, not surprisingly in Indonesia this is only one in ten. In
contrast, in Ukraine it is five in ten, followed by South Africa with four in ten.
Indonesia, Zambia also shows a relatively young group of respondents.
Distribution of workers in domestic work occupation over age groups
2011Q2, selection: women and men in the domestic work occupations in 8 DFL
According to the basic ILO report on domestic workers, one of the most striking changes in
domestic work in the past 30 years has been the growing prevalence of migrant work. In
several regions, including Europe and the Gulf countries and the Middle East,
domestic labourers today are migrant women (ILO 2010a: para 21). According to Human
, by 2010 there were approximately 1.5 million migrant domestic
workers in Saudi Arabia; 660,000 in Kuwait; 200,000 in Lebanon; 300,000 in
in majority female (HRW 2010: 8). These migrant domestic workers
may be extremely vulnerable, for many reasons, last but not least as recruitment is poorly
For example, if recruited through intermediaries in one country for
country, they generally have little or no opportunity to engage in
direct negotiations with the employing household, and thus have no possibility to make their
skills and motivation part of the equation. Also language barriers may frustrate negotiations
cultural factors increase their vulnerability to abusive treatment,
unfair working conditions (Oelz 2011: 3; Budlender 2011a: 1
distribution in the four domestic
one reservation here: our web-survey is
definitely not a good tool to trace child labour among domestic workers. Graph 4.6 shows
based on the survey data. Obviously, Indonesia has
the largest share of young domestic workers aged 25 and under with almost four in ten
. In contrast, in Ukraine only
ers is young, followed by South Africa with almost two in ten. In
35 is with five in ten larger than in
other countries. In Ukraine, the share of that age group is only three in ten. When tracing the
hares of workers aged 36 and older, not surprisingly in Indonesia this is only one in ten. In
contrast, in Ukraine it is five in ten, followed by South Africa with four in ten. Besides
Distribution of workers in domestic work occupation over age groups by country and
2011Q2, selection: women and men in the domestic work occupations in 8 DFL
According to the basic ILO report on domestic workers, one of the most striking changes in
domestic work in the past 30 years has been the growing prevalence of migrant work. In
several regions, including Europe and the Gulf countries and the Middle East, the majority of
According to Human
approximately 1.5 million migrant domestic
workers in Saudi Arabia; 660,000 in Kuwait; 200,000 in Lebanon; 300,000 in Malaysia; and
These migrant domestic workers
s, last but not least as recruitment is poorly
ermediaries in one country for
generally have little or no opportunity to engage in
direct negotiations with the employing household, and thus have no possibility to make their
Also language barriers may frustrate negotiations
cultural factors increase their vulnerability to abusive treatment,
; Budlender 2011a: 1). It may also
age 35+
age 26-35
age < 25
P a g e | 16
be that the migrant worker is engaged in, as the ILO calls it, “a triangular employment
relationship where the agency acts as an intermediary by receiving the payment from the
households and, subsequently, compensating the workers after making all the corresponding
social security contributions” (Simonovsky and Luebker 2011: fn. 3). Such constructions may
widen the possibilities of exploitation further. Besides social security contributions,
recruitment fees for agencies, labour brokers and other, often questionable, intermediaries, as
well as travel costs (including return travels), may be deducted from domestic workers’
wages. Such practices may leave them with little or no cash income, notably in the first six
months or so of their job – or even longer (Cf. HRW 2010: 9). Moreover, such practices will
contribute to the extremely long working hours that many live-in migrant workers make (Cf.
King-Dejardin 2011: 4).
Most labour-receiving countries of Asia and the Middle East have relied on introducing
standard employment contracts to regulate terms and conditions of employment of domestic
workers, but with much weaker protections than most labour laws. In addition, governments
have not dedicated significant resources to create monitoring mechanisms to detect cases of
deception, exploitation, and abuse of domestic workers, or to take steps to make labour and
criminal justice systems more accessible and responsive. Reform including the extension of
labour protections in national law to domestic workers has so far been slow (HRW 2010).
Hardly any reliable information could be traced concerning the share of migrants among the
domestic occupations in the DfL countries; most labour force surveys do not ask about
nationality or country of birth. Undocumented workers will rarely be captured. The available
figures mainly concern outgoing migration. For instance, the ILO estimated that about 2006
approximately 72% of Indonesian migrant workers are women, with almost 90% of them
employed as domestic workers in the Middle East and South-East Asian countries (ILO 2007:
7).
Thus, we had to rely on the data of the WageIndicator web-survey, which does provide data
on country of birth. Yet, it does not provide information whether foreign-born workers in
domestic work occupations migrated due to temporary migration schemes for domestic
workers, au-pair arrangements in foreign countries, labour placement agencies, or for
reasons that were not related to the current job. The web-survey contains a survey question if
the respondents are born in the country from where they complete the survey or if they are
born in another country, though not in India. Graph 4.7 (next page) shows that almost all
workers in the domestic work occupations in the survey have responded that they were born
in their own country. In Brazil, Indonesia and Zambia, this is almost 100%. In the former
Soviet countries, these percentages are artificially lower, because part of respondents were
born in Russia, thus before these countries received independence. In India, the survey
question is not asked, because the country is so large and populated, that a question about
country of birth does not make sense. In South Africa, the survey data show that one in ten
workers in the domestic work occupations was not born in this country.

P a g e | 17
Graph 4.7 Percentages of workers in domestic work occupations born in own country, and by occupation
Source: WageIndicator data 2006Q1-2011Q2, selection: women and men in the domestic work occupations in 8 DFL countries. N= 2266.
4.5 Education
It has been gradually recognized that domestic work, far from being ‘unskilled’,
requires a broad range of skills and training.
must be central to domestic work if it is to be seen as something more than a
entailing self sacrifice and low wages. A
reflected in national policies and legislation is to recognize the skills required in domestic
work and to offer domestic workers a better future by promoti
vocational training. Professionalizing domestic work through
formal recognition of skills and qualifications is
power of domestic workers (ILO 2010a, 206, 301
capacity-building and other career development schemes for domestic workers; examples are
Brazil and South Africa. Since 2005 Brazil has been running a government programme which
focuses on social and occupational skills to improve the level of education of domest
workers and strengthen their ability to organize, and, in so doing, it has made human rights,
health and combating violence against women and child domestic labour a matter of public
policy. The programme has been implemented as a pilot project in its f
component) in seven key Brazilian regions (ILO 2010a: para 208). In South Africa, a massive
training project entitled the Domestic Workers Skills Development Project was launched in
2008. It aimed to train 27,000 domestic workers th
2010a: para 209).
What education do the workers in
attainment in a web-survey is not difficult
categories are presented to the respondent to make a choice. Comparing educational
categories is a challenge. Here we build on work,
0%
20%
40%
60%
80%
100%
Percentages of workers in domestic work occupations born in own country, and by occupation
2011Q2, selection: women and men in the domestic work occupations in 8 DFL
It has been gradually recognized that domestic work, far from being ‘unskilled’,
requires a broad range of skills and training. The ILO emphasizes that career
must be central to domestic work if it is to be seen as something more than a
entailing self sacrifice and low wages. A contemporary approach to career development
reflected in national policies and legislation is to recognize the skills required in domestic
work and to offer domestic workers a better future by promoting basic literacy skills and
Professionalizing domestic work through enhancing education
skills and qualifications is also a means of strengthening the bargaining
power of domestic workers (ILO 2010a, 206, 301). A number of countries have developed
building and other career development schemes for domestic workers; examples are
Brazil and South Africa. Since 2005 Brazil has been running a government programme which
focuses on social and occupational skills to improve the level of education of domest
workers and strengthen their ability to organize, and, in so doing, it has made human rights,
health and combating violence against women and child domestic labour a matter of public
policy. The programme has been implemented as a pilot project in its first stage (educational
component) in seven key Brazilian regions (ILO 2010a: para 208). In South Africa, a massive
training project entitled the Domestic Workers Skills Development Project was launched in
to train 27,000 domestic workers throughout the country over three years (ILO
What education do the workers in the WageIndicator survey have? Measuring educational
survey is not difficult as long as the major national educational
d to the respondent to make a choice. Comparing educational
categories is a challenge. Here we build on work, designed by UNESCO and its
Percentages of workers in domestic work occupations born in own country, by country
2011Q2, selection: women and men in the domestic work occupations in 8 DFL
It has been gradually recognized that domestic work, far from being ‘unskilled’, mostly
The ILO emphasizes that career development
must be central to domestic work if it is to be seen as something more than a temporary job
ontemporary approach to career development
reflected in national policies and legislation is to recognize the skills required in domestic
ng basic literacy skills and
enhancing education and
means of strengthening the bargaining
A number of countries have developed
building and other career development schemes for domestic workers; examples are
Brazil and South Africa. Since 2005 Brazil has been running a government programme which
focuses on social and occupational skills to improve the level of education of domestic
workers and strengthen their ability to organize, and, in so doing, it has made human rights,
health and combating violence against women and child domestic labour a matter of public
irst stage (educational
component) in seven key Brazilian regions (ILO 2010a: para 208). In South Africa, a massive
training project entitled the Domestic Workers Skills Development Project was launched in
roughout the country over three years (ILO
survey have? Measuring educational
as long as the major national educational
d to the respondent to make a choice. Comparing educational
UNESCO and its ISCED 1997
Catering
Childcare
Cleaning
Domestic
Total
P a g e | 18
classification, to make educational categories comparable across countries. However, the
level of educational categories may change over time, thus the validity of the comparison is
questionable. Nevertheless, as no other yardsticks are available, we will use the ISCED
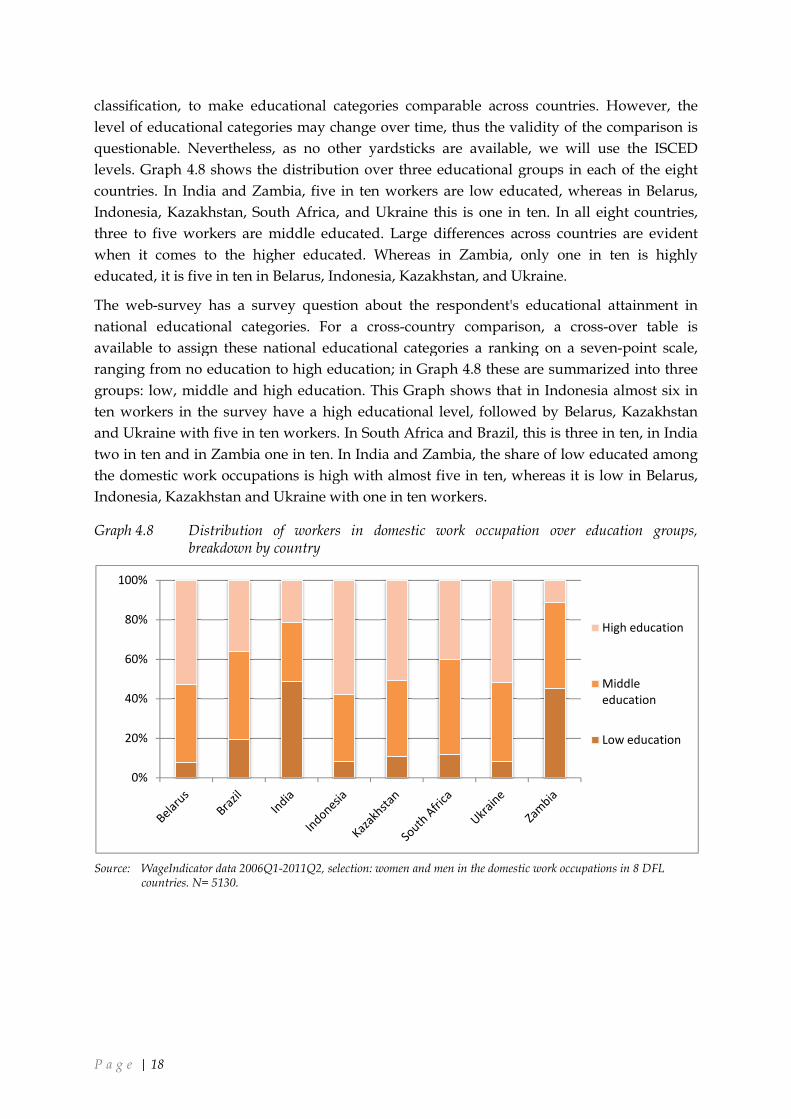
levels. Graph 4.8 shows the distribution over three educational groups in each of the eight
countries. In India and Zambia, five in ten workers are low educated, whereas in Belarus,
Indonesia, Kazakhstan, South Africa, and Ukraine this is one in ten. In all eight countries,
three to five workers are middle educated. Large differences across countri
when it comes to the higher educated. Whereas in Zambia, only one in ten is highly
educated, it is five in ten in Belarus, Indonesia, Kazakhstan, and Ukraine.
The web-survey has a survey question about the respondent's educational attainmen
national educational categories. For a cross
available to assign these national educational categories a ranking on a seven
ranging from no education to high education; in Graph 4.8 these are summ
groups: low, middle and high education. This Graph shows that in Indonesia almost six in
ten workers in the survey have a high educational level, followed by Belarus, Kazakhstan
and Ukraine with five in ten workers. In South Africa and Br
two in ten and in Zambia one in ten. In India and Zambia, the share of low educated among
the domestic work occupations is high with almost five in ten, whereas it is low in Belarus,
Indonesia, Kazakhstan and Ukraine wi
Graph 4.8 Distribution of workers in domestic work occupation over education groupsbreakdown by country
Source: WageIndicator data 2006Q1-2011Q2, selection: women and men in the domestic work occupations in 8 DFL countries. N= 5130.
0%
20%
40%
60%
80%
100%
, to make educational categories comparable across countries. However, the
l categories may change over time, thus the validity of the comparison is
questionable. Nevertheless, as no other yardsticks are available, we will use the ISCED
levels. Graph 4.8 shows the distribution over three educational groups in each of the eight
untries. In India and Zambia, five in ten workers are low educated, whereas in Belarus,
Indonesia, Kazakhstan, South Africa, and Ukraine this is one in ten. In all eight countries,
three to five workers are middle educated. Large differences across countri
when it comes to the higher educated. Whereas in Zambia, only one in ten is highly
educated, it is five in ten in Belarus, Indonesia, Kazakhstan, and Ukraine.
survey has a survey question about the respondent's educational attainmen
national educational categories. For a cross-country comparison, a cross
available to assign these national educational categories a ranking on a seven
ranging from no education to high education; in Graph 4.8 these are summ
groups: low, middle and high education. This Graph shows that in Indonesia almost six in
ten workers in the survey have a high educational level, followed by Belarus, Kazakhstan
and Ukraine with five in ten workers. In South Africa and Brazil, this is three in ten, in India
two in ten and in Zambia one in ten. In India and Zambia, the share of low educated among
the domestic work occupations is high with almost five in ten, whereas it is low in Belarus,
Indonesia, Kazakhstan and Ukraine with one in ten workers.
Distribution of workers in domestic work occupation over education groupsbreakdown by country
2011Q2, selection: women and men in the domestic work occupations in 8 DFL
, to make educational categories comparable across countries. However, the
l categories may change over time, thus the validity of the comparison is
questionable. Nevertheless, as no other yardsticks are available, we will use the ISCED
levels. Graph 4.8 shows the distribution over three educational groups in each of the eight
untries. In India and Zambia, five in ten workers are low educated, whereas in Belarus,
Indonesia, Kazakhstan, South Africa, and Ukraine this is one in ten. In all eight countries,
three to five workers are middle educated. Large differences across countries are evident
when it comes to the higher educated. Whereas in Zambia, only one in ten is highly
survey has a survey question about the respondent's educational attainment in
country comparison, a cross-over table is
available to assign these national educational categories a ranking on a seven-point scale,
ranging from no education to high education; in Graph 4.8 these are summarized into three
groups: low, middle and high education. This Graph shows that in Indonesia almost six in
ten workers in the survey have a high educational level, followed by Belarus, Kazakhstan
azil, this is three in ten, in India
two in ten and in Zambia one in ten. In India and Zambia, the share of low educated among
the domestic work occupations is high with almost five in ten, whereas it is low in Belarus,
Distribution of workers in domestic work occupation over education groups,
2011Q2, selection: women and men in the domestic work occupations in 8 DFL
High education
Middle
education
Low education

P a g e | 19
5 Remuneration of domestic workers
5.1 Wage levels
Low pay for domestic work is a global phenomenon: domestic work is among the lowest
paid work in any national labour market. Domestic workers typically earn less than half of
average wages. In Brazil, their average wage was about 35% of the over-all average, in India
just over 30%, and in Botswana about 15% (Oelz 2011: Table 1). In 2007, in South Africa
domestic workers earned on average 40% of the average of non-domestic workers and wage
employees (Budlender 2011a: 4). In Indonesia at first sight the situation seems better, with
female domestic workers in 2008 per month earning 61% of the average for the female
workforce – but it has to be taken into account that the average working week of female
domestic workers is, with 53 hours, nearly 40% longer than the total average for female
workers (authors’ calculations based on Van Klaveren et al 2010b).
ILO reporting highlights factors that tend to depress domestic workers’ wages even more
than those of otherwise comparable categories of workers. These include unequal bargaining
power, the isolation of in particular live-in workers, to usual lack of co-workers, and “the
perception that the ability to perform domestic work is innate”, including the skills and
competencies required to perform domestic work. To a large extent, domestic work involves
tasks that women have traditionally provided in households without pay, such as cleaning,
cooking, shopping, laundry, as well as caring for children and other household members the
elderly, disabled and other household members in need of care. Such attitudes and
perceptions tend to result in the undervaluation of domestic work in monetary terms. On top
of these factors, socio-cultural factors such as language barriers, may prevent particularly
migrant domestic workers and those belonging to ethnic minority groups or indigenous
peoples from negotiating with their employers. Such factors also increase their vulnerability
to abusive treatment, discrimination and unfair working conditions (ILO 2010a: para 23, 139;
Oelz 2011; Budlender 2011a, 2011b).
Some argue that male-female wage differentials reflect skills differences. Yet, particular
attention should be paid to the principle of equal remuneration for men and women for work
of equal value as set out in the Equal Remuneration Convention (No. 100): remuneration
should be performed should be determined on the basis of the content of the work
performed, taking duly into account the skills, effort, responsibility and working conditions
(Oelz 2011). ILO’s Committee of Experts on the Application of Conventions and
Recommendations (CEACR) has cautioned against undervaluing domestic work by setting
the minimum wage for domestic work equivalent to that for unskilled workers. The CEACR
has questioned the classification of domestic work as ‘unskilled work’, considering the
complex tasks and responsibilities assumed by many domestic workers (ILO 2010a: para 63).
In relation to remuneration, it should be added that domestic workers’ access to social
security is in many countries absent or incomplete. For example, in Latin America in 2003
only 23% of female domestic workers contributed to a social security scheme (For Brazil the

P a g e | 20
share was 29%). On the positive side and concerning the DFL countries, domestic workers
are explicitly included in occupational health and safety legislation in South Africa; in
general health care in Brazil and South Africa; in retirement pension regulation in Brazil, and
in unemployment insurance in again Brazil and South Africa (ILO 2010a: para 211, 213).
Moreover, domestic workers are covered by general maternity leave legislation or by
separate but equivalent provisions in five of 14 countries: Brazil, Kazakhstan, Mozambique,
South Africa, and Zimbabwe (ILO 2010a: para 223).
The WageIndicator web-survey asks in detail about respondents’ wages. A two-step
procedure has been applied to harmonize the hourly wages in the national currencies across
countries and across survey years. First, using the World Bank’s purchasing power parity
indexes, the wages in the database have been converted into standardized US dollars (USD).
In this step, the earnings data becomes comparable across countries. In the data cleaning, the
standardized hourly wages lower than 1 standardized USD or higher than 400 standardized
USD have been considered outliers (Tijdens et al 2010). Second, to make these standardized
wage data comparable over the years (note that we have data between January 2006 and July
2011), all wages have been converted to the level of 2010, using the annual percentage change
in wages of employees per hour, as available in the LABDEV Economic databases and
indicators of the European Commission, DG Economic and Financial Affairs. Thus, using the
2006 percentage change, the standardized USD wages collected in 2006 have been converted
to the level of 2007. Jointly with the wages collected in 2007, these have been converted into
the level of 2008, et cetera. The wages collected in 2011 have been considered equal to the
2010 level, because LABDEV does not yet contain information for 2011. This procedure
results in wage information in standardized USD allowing for cross country comparisons,
using wage data from several years.
Graph 5.1 presents the median hourly wages, expressed in PPP-standardized US dollars for
2010. It shows clearly that the catering workers have the highest earnings in all countries
apart from Indonesia: in this country the cleaning workers have the highest wages. In all
countries, apart from Ukraine, the domestic workers have the lowest wages. Here it should
be taken into account that not sufficient data was available for Indonesia and Kazakhstan. In
most countries, the wages of the childcare and cleaning workers are only slightly higher than
those in the domestic occupations.
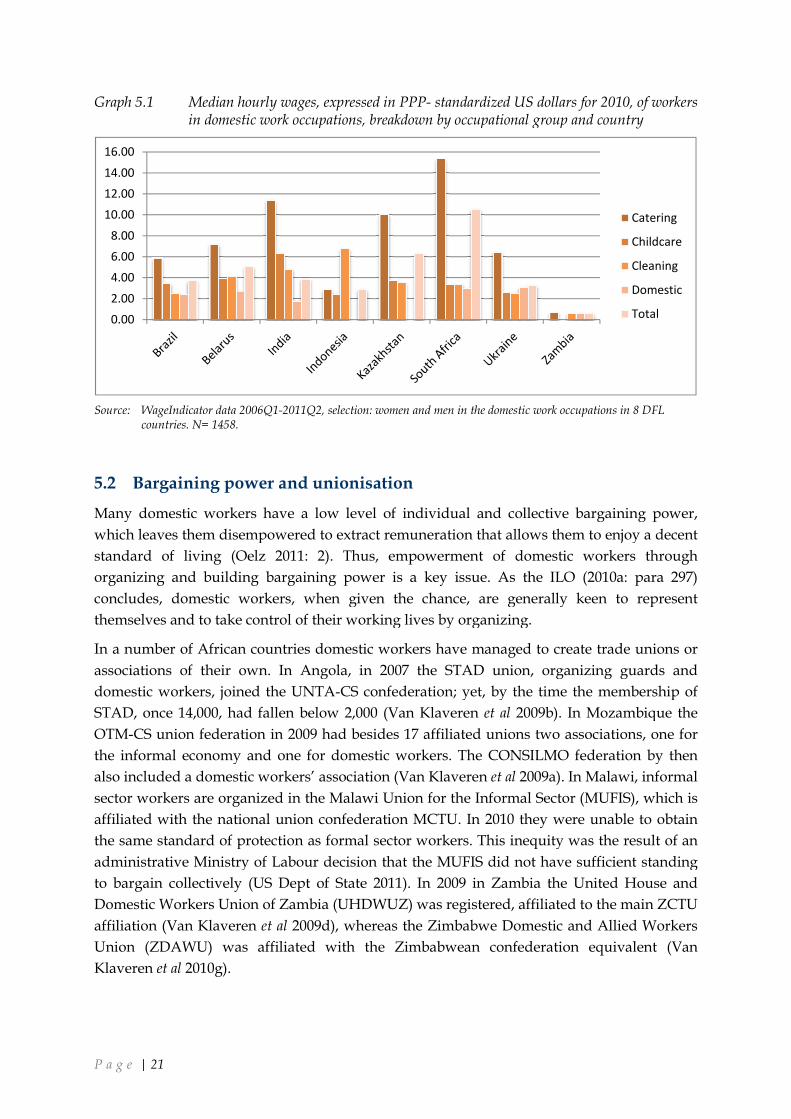
P a g e | 21
Graph 5.1 Median hourly wages, expressed in PPPin domestic work occupations
Source: WageIndicator data 2006Q1-2011Q2, selection: women and men in the domestic work occupations in 8 DFL countries. N= 1458.
5.2 Bargaining power and unionisation
Many domestic workers have a low level of
which leaves them disempowered to extract remuneration that allows them to enjoy a decent
standard of living (Oelz 2011: 2). Thus, empowerment of domestic workers through
organizing and building bargaining power
concludes, domestic workers, when given the chance, are generally keen to represent
themselves and to take control of their working lives by organizing.
In a number of African countries domestic workers have man
associations of their own. In Angola, in
domestic workers, joined the UNTA
STAD, once 14,000, had fallen below 2,000
OTM-CS union federation in 2009 had besides 17 affiliated unions two associations, one for
the informal economy and one for domestic workers. The CONSILMO federation by then
also included a domestic workers’ association (
sector workers are organized in the Malawi Union for the Informal Sector (MUFIS), which is
affiliated with the national union confederation
the same standard of protecti
administrative Ministry of Labour decision that the MUFIS did not have sufficient standing
to bargain collectively (US Dept of State 2011).
Domestic Workers Union of Zambia (UHDWUZ) was registered, affiliated to the main ZCTU
affiliation (Van Klaveren et al
Union (ZDAWU) was affiliated with the Zimbabwean confederation equivalent (Van
Klaveren et al 2010g).
0.00
2.00
4.00
6.00
8.00
10.00
12.00
14.00
16.00
Median hourly wages, expressed in PPP- standardized US dollars for 2010, of workers in domestic work occupations, breakdown by occupational group and
2011Q2, selection: women and men in the domestic work occupations in 8 DFL
Bargaining power and unionisation
Many domestic workers have a low level of individual and collective bargaining power,
which leaves them disempowered to extract remuneration that allows them to enjoy a decent
standard of living (Oelz 2011: 2). Thus, empowerment of domestic workers through
bargaining power is a key issue. As the ILO (2010a: para 297)
domestic workers, when given the chance, are generally keen to represent
themselves and to take control of their working lives by organizing.
a number of African countries domestic workers have managed to create trade unions or
In Angola, in 2007 the STAD union, organizing guards and
domestic workers, joined the UNTA-CS confederation; yet, by the time the membership of
14,000, had fallen below 2,000 (Van Klaveren et al 2009b). In Mozambique the
CS union federation in 2009 had besides 17 affiliated unions two associations, one for
informal economy and one for domestic workers. The CONSILMO federation by then
also included a domestic workers’ association (Van Klaveren et al 2009a). In Malawi, informal
sector workers are organized in the Malawi Union for the Informal Sector (MUFIS), which is
national union confederation MCTU. In 2010 they were unable to obtain
the same standard of protection as formal sector workers. This inequity was the result of an
administrative Ministry of Labour decision that the MUFIS did not have sufficient standing
to bargain collectively (US Dept of State 2011). In 2009 in Zambia the United House and
ers Union of Zambia (UHDWUZ) was registered, affiliated to the main ZCTU
et al 2009d), whereas the Zimbabwe Domestic and Allied Workers
(ZDAWU) was affiliated with the Zimbabwean confederation equivalent (Van
standardized US dollars for 2010, of workers occupational group and country
2011Q2, selection: women and men in the domestic work occupations in 8 DFL
individual and collective bargaining power,
which leaves them disempowered to extract remuneration that allows them to enjoy a decent
standard of living (Oelz 2011: 2). Thus, empowerment of domestic workers through
As the ILO (2010a: para 297)
domestic workers, when given the chance, are generally keen to represent
aged to create trade unions or
2007 the STAD union, organizing guards and
CS confederation; yet, by the time the membership of
In Mozambique the
CS union federation in 2009 had besides 17 affiliated unions two associations, one for
informal economy and one for domestic workers. The CONSILMO federation by then
In Malawi, informal
sector workers are organized in the Malawi Union for the Informal Sector (MUFIS), which is
MCTU. In 2010 they were unable to obtain
on as formal sector workers. This inequity was the result of an
administrative Ministry of Labour decision that the MUFIS did not have sufficient standing
Zambia the United House and
ers Union of Zambia (UHDWUZ) was registered, affiliated to the main ZCTU
Zimbabwe Domestic and Allied Workers
(ZDAWU) was affiliated with the Zimbabwean confederation equivalent (Van
Catering
Childcare
Cleaning
Domestic
Total
P a g e | 22
In South Africa, the South African Domestic Service and Allied Workers Union (SADSAWU)
was formed in 2000. It currently has about 30,000 members, 95% of whom are women.
SADSAWU provides service and support to domestic workers in respect of work-related
problems such as unfair dismissal and low wages, whether or not they are members. The
Congress of South African Trade Unions (COSATU) supports the union by providing
premises, services and personnel, though SADSAWU is not officially a COSATU member.
SADSAWU (and its predecessors) played a major role in campaigns leading, in 2002, to
Sectoral Determination 7, setting a minimum wage for domestic workers (Ordor 2011; on
minimum wages see next section).
In Latin America domestic workers in recent years have increasingly been subject to trade
union action and have growingly acted collectively. For quite some years in Brazil the largest
national trade union centre and ITUC affiliate, Central Unica dos Trabalhadores (CUT), has
taken a leading role in defending and expanding domestic workers' rights (Information
ITUC). Also in Brazil, a National Federation of Domestic Workers (FENATRAD) was created
in 1997 and now has 35 union affiliations (ILO 2010a: para 269; ILO 2010b). In total the
country has about 40 domestic workers’ trade unions, mostly city-based (Gomes and Bertolin
2010). Stimulated by the various union activities in this field, already in August 2011 the
regional organisation of ITUC in Latin America, TUCA-SCA, and the Comité de Mujeres
Trabajadoras de las Américas have launched a campaign for the ratification of Convention
189 (information ITUC).
In India associations of domestic workers have been lobbying for improvements in pay and
conditions since independence in 1947. Indian domestic workers’ unions have continued to
organize strikes, lobby for legislative change and provide support for members, but they
have not been able to provide them with the security offered by the Industrial Disputes Act.
In particular two national confederations affiliated with the ITUC, initially Self-Employed
Women's Association of India (SEWA) and somewhat later also Hind Mazdoor Sabha
(HMS), have been active over the years in organising domestic workers and undertaking
efforts to improve their rights (information ITUC). More locally, for example a domestic
workers’ union in Mumbai, the Gharelu Kamgar Sangh (GKS), is affiliated to a central union,
the Bharatiya Mazdoor Sangh (BMS) (ILO 2010a: para 271). Also in India, a number of
cooperatives run by domestic workers have been established, with some of these having
associated themselves with trade unions (ILO 2010a: para 271, 296).
Only few figures are known about the union density of domestic workers. In South Africa,
the union density among domestic workers can be estimated at 3%. Unionisation in this
group has risen, because union density was only 1% in 1995 (Van Klaveren et al 2009c), but a
major challenge is presented to membership strength by the fact that members tend to drop
off after the work dispute is resolved or otherwise ends (Ordor 2011). According to the
Brazilian 2007 Labour Force Survey, the union density in domestic services, though still very
low, in that country recently showed an increase from 1.7% in 2005 to 1.9% in 2007 (Van
Klaveren et al 2009g).
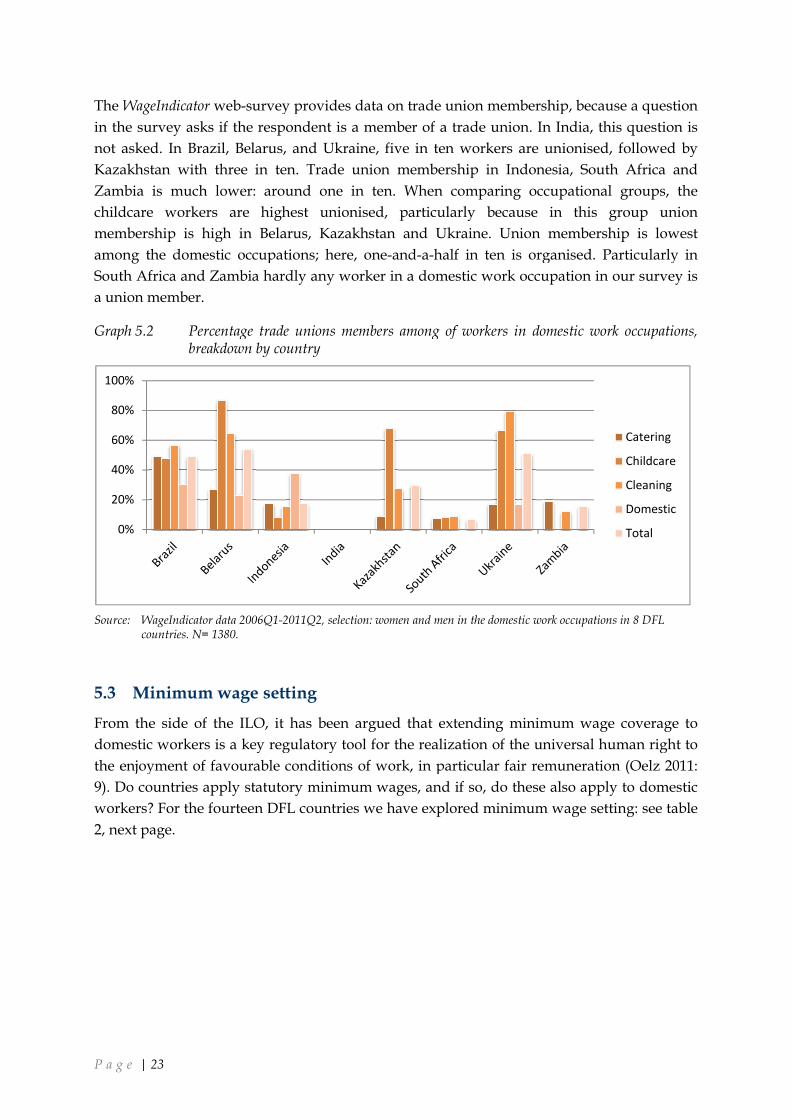
P a g e | 23
The WageIndicator web-survey provides data on trade union membership, because a question
in the survey asks if the respondent is a member of a trade union. In India, this question is
not asked. In Brazil, Belarus, and Ukraine, five in ten workers are unionised, followed by
Kazakhstan with three in ten. Trade union membership in Indonesia, South Africa and
Zambia is much lower: around one in ten. When comparing occupational groups, the
childcare workers are highest unionised
membership is high in Belarus, Kazakhstan and Ukraine. Union membership is lowest
among the domestic occupations; here,
South Africa and Zambia hardly any worker
a union member.
Graph 5.2 Percentage trade unions members among of workers in domestic work occupationsbreakdown by country
Source: WageIndicator data 2006Q1-2011Q2, selection: women and men in the domecountries. N= 1380.
5.3 Minimum wage setting
From the side of the ILO, it has been argued that
domestic workers is a key regulatory tool for the realization of the universal human right to
the enjoyment of favourable conditions of work, in particular fair remuneration (Oelz 2011:
9). Do countries apply statutory minimum wages, and if so, do these also apply to domestic
workers? For the fourteen DFL countries we
2, next page.
0%
20%
40%
60%
80%
100%
survey provides data on trade union membership, because a question
in the survey asks if the respondent is a member of a trade union. In India, this question is
not asked. In Brazil, Belarus, and Ukraine, five in ten workers are unionised, followed by
Kazakhstan with three in ten. Trade union membership in Indonesia, South Africa and
around one in ten. When comparing occupational groups, the
childcare workers are highest unionised, particularly because in this group union
membership is high in Belarus, Kazakhstan and Ukraine. Union membership is lowest
occupations; here, one-and-a-half in ten is organised. Particularly in
South Africa and Zambia hardly any worker in a domestic work occupation
Percentage trade unions members among of workers in domestic work occupationsbreakdown by country
2011Q2, selection: women and men in the domestic work occupations in 8 DFL
Minimum wage setting
From the side of the ILO, it has been argued that extending minimum wage coverage to
domestic workers is a key regulatory tool for the realization of the universal human right to
njoyment of favourable conditions of work, in particular fair remuneration (Oelz 2011:
Do countries apply statutory minimum wages, and if so, do these also apply to domestic
workers? For the fourteen DFL countries we have explored minimum wage setting:
survey provides data on trade union membership, because a question
in the survey asks if the respondent is a member of a trade union. In India, this question is
not asked. In Brazil, Belarus, and Ukraine, five in ten workers are unionised, followed by
Kazakhstan with three in ten. Trade union membership in Indonesia, South Africa and
around one in ten. When comparing occupational groups, the
, particularly because in this group union
membership is high in Belarus, Kazakhstan and Ukraine. Union membership is lowest
half in ten is organised. Particularly in
domestic work occupation in our survey is
Percentage trade unions members among of workers in domestic work occupations,
stic work occupations in 8 DFL
extending minimum wage coverage to
domestic workers is a key regulatory tool for the realization of the universal human right to
njoyment of favourable conditions of work, in particular fair remuneration (Oelz 2011:
Do countries apply statutory minimum wages, and if so, do these also apply to domestic
minimum wage setting: see table
Catering
Childcare
Cleaning
Domestic
Total

P a g e | 24
Table 2 Incidence of Statutory Minimum Wage (SMW) and coverage of domestic workers, by
country, situation 2010 (for Zambia 2011)
Statutory min wage(s)
Domestic workers mentioned in MW law
Domestic workers covered / excluded from SMW/lower SMW
SMW domestic in % of general SMW/other SMWs
Angola yes no
Azerbaijan yes no
Belarus yes no
Botswana yes yes lower 55-65%
Brazil yes yes covered
India yes yes excluded(central)
Indonesia yes no
Kazakhstan yes yes covered
Malawi yes no
Mozambique yes no
South Africa yes yes lower 33-87%
Ukraine yes no
Zambia yes yes lower 67%
Zimbabwe yes yes lower 9-66%
Sources: Van Klaveren et al 2009, 2010; ILO 2010a, 2011a; Oelz 2011; ILO Natlex Database; WageIndicator websites
All 14 DFL countries have a statutory minimum wage (SMW) or a set of such wages
(situation 2010, for Zambia as of 7 January 2011 (ILO 2011a)). In two countries, Brazil and
Kazakhstan, domestic workers are explicitly covered by the national minimum wage. India is
a special case: although the central government in New Delhi excludes domestic work from
the National Minimum Wage legislation (an exclusion that contravenes ILO Convention No.
131 on Minimum Wage Fixing), regional governments are allowed, with previous
notification to the central administration, to set minimum wages for additional (not listed)
occupations; by the end of 2010 the states of Karnataka, Kerala, Andra Pradesh, Tamil Nadu,
Bihar and Rajasthan had done so for domestic work. In four countries, Botswana, South
Africa, Zambia and Zimbabwe, domestics are explicitly legally entitled to a minimum wage,
albeit lower than the general rate and/or the rates for other groups of workers: see the last
column. In the other seven countries domestic workers are not mentioned in minimum wage
legislation i.e. neither explicitly included nor excluded (sources: Van Klaveren et al 2009,
2010; ILO 2010a, 2011a; Oelz 2011; WageIndicator websites; ILO Natlex Database).
South Africa represents a highly interesting case. Here, in September 2002 roughly one
million domestic workers –about 840,000 predominantly African and coloured women
working as housekeepers, cooks and nannies, and another 180,000 men work primarily as
gardeners-- were granted formal labour market protection, and subsequently in November
2002 a schedule of minimum wages for domestics went into effect. Currently South Africa
has occupational minimum wage rates for domestic work set by region. They are computed
on an hourly, weekly and monthly basis, with specifications as to the hours of work involved
for daily or monthly rates. Sectoral Determination 7, regarding the conditions of employment
and minimum wages for employees in the domestic work sector, provides for a yearly
increase by at least 8%, while higher minimum wage increases are triggered by increases in
P a g e | 25
the Consumer Price Index of more than 10% (Oelz 2011: 6). Moreover, in domestic services
employees who work less than 28 hours a week are entitled to an hourly minimum wage
which is about 10% higher than that earned by employees working longer hours, likely to
offset the lower level of benefits received by those working fewer hours per week (Posel and
Muller 2008: 472). Linking levels of remuneration to hours worked is indeed a key element in
addressing inappropriately low pay of domestic workers (Oelz 2011: 4).
In spite of the existence in South Africa of only a small body of Labour Inspectors whose job
is to enforce compliance with minimum wage regulations (Bhorat et al 2010), jointly the new
regulations do appear to have raised the relative wages for the domestic workers. Their
average nominal hourly wages were in September of 2003 23% higher than they had been in
September 2002, while for similar workers in other occupations the nominal increase was less
than 5%. There was some decrease in employment, but that was not clearly related to the
wage increase. Despite substantial non-compliance, for many low paid women the minimum
wage made a difference (Hertz 2005). Budlender (2010) also found that average wages of
South African domestic workers have risen without any significant employment loss since
their minimum wage came into effect in 2002, though she notes that their average working
hours have decreased. Moreover, using South African Labour Force Survey 2007 data the
same author has calculated that domestic workers still suffer from a ‘wage penalty’, earning
13.6% less than other employees with the same characteristics (Budlender 2011a, b).
5.4 Protecting domestic workers’ remuneration
Domestic workers are particularly vulnerable to abusive practices with regard to the
payment of wages. Majorities are engaged informally, without terms and conditions
regarding hours of work and remuneration being clearly established, and without a written
contract or statement of contract particulars. Language barriers and illiteracy among
domestic workers may well aggravate problems in this respect. Various reports and studies
on working conditions of domestic workers found that abusive practices affecting domestic
workers’ pay may include the following (Oelz 2011: 6):
• overtime requirements without compensation;
• inappropriately high portions of the remuneration that are paid in kind, and excessive
cash value attributed to in-kind payments;
• imposition of in-kind payments or deductions without the workers’ prior knowledge
and agreement;
• non-payment or late payment of wages.
Against this backdrop, the ILO has recommended a number of steps towards protecting
domestic workers’ remuneration (ILO 2010a; Oelz 2011):
• the establishment of legal requirements for written contracts of employment or a
written statement of particulars, including making model contracts available to
employers and workers;
• legally, strictly limiting payments in kind and deductions, or the proportion of the
remuneration that may be paid in kind. For example, the legislation in Brazil prohibits

P a g e | 26
deductions from domestic workers’ wages for meals, accommodation, clothing and
hygienic products, except when the domestic worker stays in a different place than the
one where (s)he is employed; in South Africa, payments in kind are legally permitted
up to 25% of remuneration;
• preventing non-payment or late payment, through imposing obligations on employers
for fixed pay intervals and methods of payment, and keeping records of hours worked
and payments made;
• improving compliance with standards protecting domestic workers’ remuneration,
including broad dissemination of information on applicable laws to domestic workers
and their employers;
• developing a coordinated mechanism for information sharing and learning from good
practices in the regulation of domestic work.
P a g e | 27
6 Working hours of domestic workers
6.1 Usual working hours
In preparing Convention No. 189, the ILO has paid special attention to the issue of working
time of domestic workers, and sought to examine and suggest potential frameworks for the
regulation of that working time. A major challenge here is formulating working time
measures that protect domestic workers’ interests while taking into account the needs of the
households that employ them. Complicating factor is the widely varying situation of various
groups of domestic workers: live-in workers tend to work full-time, probably very long
hours, while live-out workers may work full-time for one household or for different
households for two, three or more hours each time per day, week or month. It has been
calculated for Peru (2001) and Chile (2000) that average weekly hours of live-in workers were
respectively 27% and 69% longer than those of live-out workers. Moreover, for live-in
workers the division between work and home, between work and rest, may be a grey, fuzzy
line, whereas other domestic workers have relatively more control over their working time
arrangements (King Dejardin 2011: 1-2). These varying realities remain hidden behind
averages on weekly hours of domestic workers, though the latter may deliver useful
indications. Concerning the DfL countries, the available data shows averages of 49.1 hours
for Zambia (2002), 36.8 hours for Brazil (2007; females: 36.4), and 51.6 hours for Indonesia
(2008; females: 53.0) (King Dejardin 2011: 3; Van Klaveren et al 2009g, 2010b).
Key concerns regard in particular the association between long working hours and shift
work on the one hand and fatigue, (risks of) mental stress and depression, work-related
accidents, problems with own children and family care responsibilities, and quality of
service and performance on the other (King Dejardin 2011: 5). In this context it is striking that
about half of 71 countries surveyed by the ILO in 2009, covering over 56% of domestic
workers, has not imposed a mandatory limit on the length of the working week for domestic
workers (McCann and Murray 2010; ILO 2010a, para 177; Tomei 2011). In one ILO study a
Model Law has been developed, recognizing the importance of providing information about
legal standards, access to independent dispute resolution processes and techniques to
alleviate disparities in bargaining power between individual domestic workers and their
employers. Based on a ‘framed flexibility’ model, the Model Law contains a number of key
‘framing standards’, which provide a framework within which working time flexibility is
constrained by limiting working hours, mandating rest periods and designating certain
periods as ‘unsocial.’ Second, the study the study proposes a set of ‘flexibility’ standards,
addressing the unpredictable requirements that can arise in certain domestic work
occupations, by permitting periods of on-call work. Third, it proposes monitoring standards,
and finally, across the Model Law a set of ‘incentives to bargain’ is found. The first and most
basic step towards ensuring compliance with working time standards remains a written
contract between the employer and the domestic worker (McCann and Murray 2010).
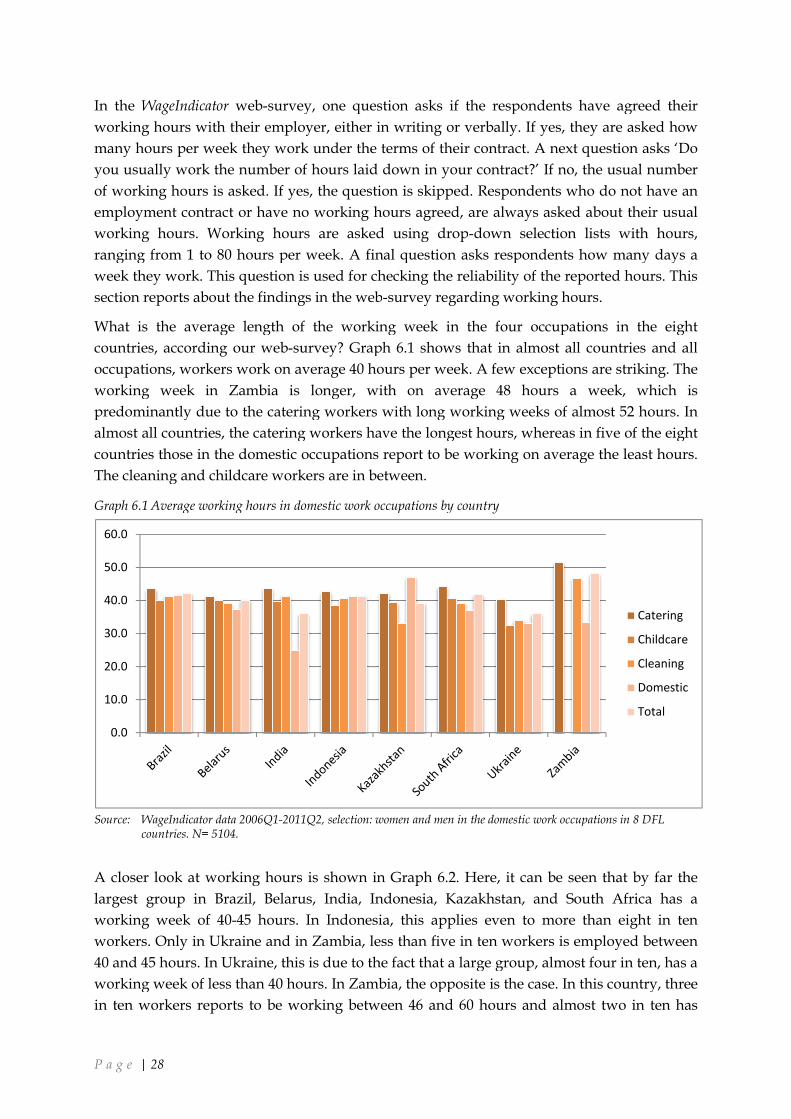
P a g e | 28
In the WageIndicator web-survey, one question asks if the respondents have agreed their
working hours with their employer, either in writing or verbally. If yes, they are asked how
many hours per week they work under the terms of their contract. A next question asks ‘Do
you usually work the number of hou
of working hours is asked. If yes, the question is skipped. Respondents who do not have an
employment contract or have no working hours agreed, are always asked about their usual
working hours. Working hours are asked using drop
ranging from 1 to 80 hours per week. A final question asks respondents how many days a
week they work. This question is used for checking the reliability of the reported hours.
section reports about the findings in the web
What is the average length of the working week in the four occupations in the eight
countries, according our web
occupations, workers work on average 40 hours per week
working week in Zambia is longer, with on average 48 hours a week, which is
predominantly due to the catering workers with long working weeks of almost 52 hours. In
almost all countries, the catering workers have the lo
countries those in the domestic occupations report to be working on average the least hours.
The cleaning and childcare workers are in between.
Graph 6.1 Average working hours in domestic work occupations by
Source: WageIndicator data 2006Q1-2011Q2, selection: women and men in the domestic work occupations in 8 DFL countries. N= 5104.
A closer look at working hours is shown in Graph 6.2.
largest group in Brazil, Belarus, India,
working week of 40-45 hours. In Indonesia, this applies even to more than eight in ten
workers. Only in Ukraine and in Zambia, less than five in ten workers is
40 and 45 hours. In Ukraine, this is due to the fact that a large group, almost four in ten, has a
working week of less than 40 hours. In Zambia, the opposite is the case. In this country,
in ten workers reports to be working betwee
0.0
10.0
20.0
30.0
40.0
50.0
60.0
survey, one question asks if the respondents have agreed their
working hours with their employer, either in writing or verbally. If yes, they are asked how
many hours per week they work under the terms of their contract. A next question asks ‘Do
you usually work the number of hours laid down in your contract?’ If no,
of working hours is asked. If yes, the question is skipped. Respondents who do not have an
employment contract or have no working hours agreed, are always asked about their usual
working hours. Working hours are asked using drop-down selection lists with hours,
ranging from 1 to 80 hours per week. A final question asks respondents how many days a
week they work. This question is used for checking the reliability of the reported hours.
section reports about the findings in the web-survey regarding working hours.
What is the average length of the working week in the four occupations in the eight
web-survey? Graph 6.1 shows that in almost all countries and all
occupations, workers work on average 40 hours per week. A few exceptions are striking. The
working week in Zambia is longer, with on average 48 hours a week, which is
predominantly due to the catering workers with long working weeks of almost 52 hours. In
almost all countries, the catering workers have the longest hours, whereas in five of the eight
countries those in the domestic occupations report to be working on average the least hours.
The cleaning and childcare workers are in between.
Average working hours in domestic work occupations by country
2011Q2, selection: women and men in the domestic work occupations in 8 DFL
working hours is shown in Graph 6.2. Here, it can be seen that by far the
Belarus, India, Indonesia, Kazakhstan, and South Africa
45 hours. In Indonesia, this applies even to more than eight in ten
and in Zambia, less than five in ten workers is
, this is due to the fact that a large group, almost four in ten, has a
working week of less than 40 hours. In Zambia, the opposite is the case. In this country,
o be working between 46 and 60 hours and almost two in ten has
survey, one question asks if the respondents have agreed their
working hours with their employer, either in writing or verbally. If yes, they are asked how
many hours per week they work under the terms of their contract. A next question asks ‘Do
If no, the usual number
of working hours is asked. If yes, the question is skipped. Respondents who do not have an
employment contract or have no working hours agreed, are always asked about their usual
tion lists with hours,
ranging from 1 to 80 hours per week. A final question asks respondents how many days a
week they work. This question is used for checking the reliability of the reported hours. This
y regarding working hours.
What is the average length of the working week in the four occupations in the eight
Graph 6.1 shows that in almost all countries and all
. A few exceptions are striking. The
working week in Zambia is longer, with on average 48 hours a week, which is
predominantly due to the catering workers with long working weeks of almost 52 hours. In
ngest hours, whereas in five of the eight
countries those in the domestic occupations report to be working on average the least hours.
2011Q2, selection: women and men in the domestic work occupations in 8 DFL
Here, it can be seen that by far the
South Africa has a
45 hours. In Indonesia, this applies even to more than eight in ten
employed between
, this is due to the fact that a large group, almost four in ten, has a
working week of less than 40 hours. In Zambia, the opposite is the case. In this country, three
n 46 and 60 hours and almost two in ten has
Catering
Childcare
Cleaning
Domestic
Total
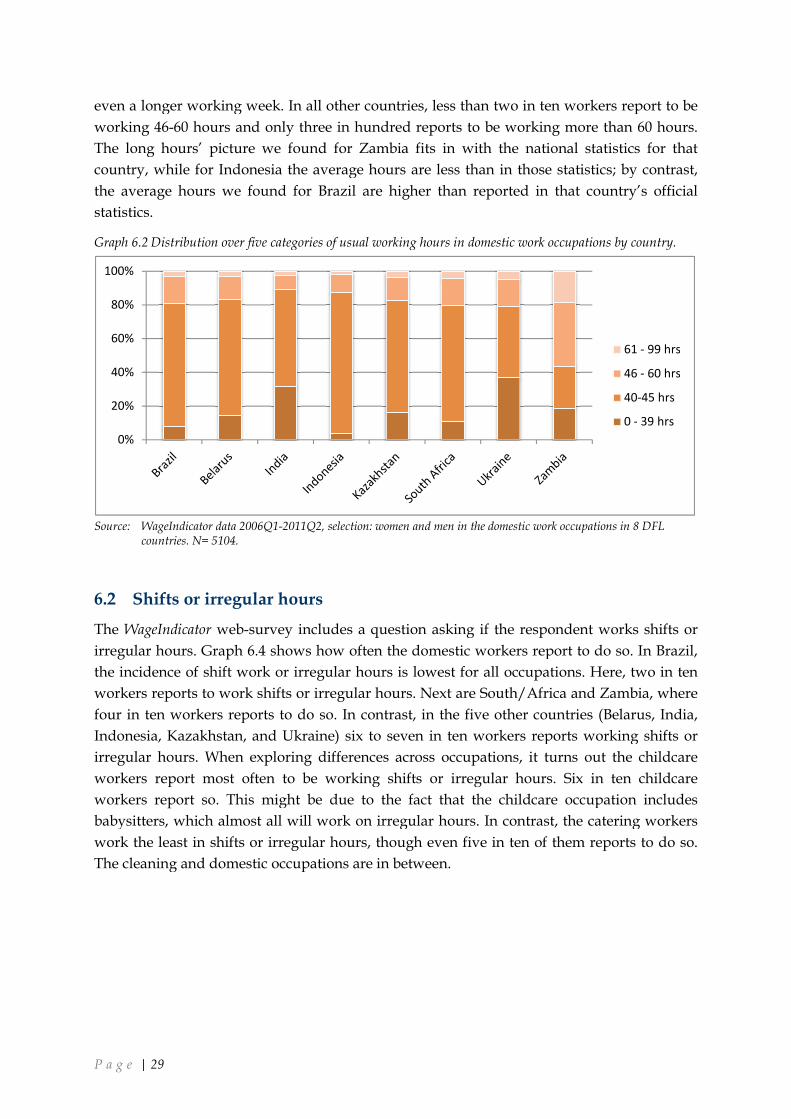
P a g e | 29
even a longer working week. In all other countries, less than two in ten workers report to be
working 46-60 hours and only three in hundred reports to be working more than 60 hours.
The long hours’ picture we fou
country, while for Indonesia the average hours are less than in those statistics; by contrast,
the average hours we found for Brazil are higher than reported in that country’s official
statistics.
Graph 6.2 Distribution over five categories of usual working hours
Source: WageIndicator data 2006Q1-2011Q2, selection: women and men in the domestic work occupations in 8 DFL countries. N= 5104.
6.2 Shifts or irregular hours
The WageIndicator web-survey includes a question asking if the respondent works shifts or
irregular hours. Graph 6.4 shows how often the domestic workers report to do so. In
the incidence of shift work or irregular hours is
workers reports to work shifts or irregular hours. Next are South/Africa and Zambia, where
four in ten workers reports to do so. In contrast, in the five other countries (Belarus, India,
Indonesia, Kazakhstan, and Ukraine) s
irregular hours. When exploring differences across occupations, it turns out the childcare
workers report most often to be working shifts or irregular hours. Six in ten childcare
workers report so. This might be due to the fact that the childcare occupation includes
babysitters, which almost all will work on irregular hours. In contrast, the catering workers
work the least in shifts or irregular hours, though even five in ten of them reports to do so.
The cleaning and domestic occupations are in between.
0%
20%
40%
60%
80%
100%
even a longer working week. In all other countries, less than two in ten workers report to be
60 hours and only three in hundred reports to be working more than 60 hours.
The long hours’ picture we found for Zambia fits in with the national statistics
, while for Indonesia the average hours are less than in those statistics; by contrast,
the average hours we found for Brazil are higher than reported in that country’s official
Distribution over five categories of usual working hours in domestic work occupations by country
2011Q2, selection: women and men in the domestic work occupations in 8 DFL
ular hours
survey includes a question asking if the respondent works shifts or
shows how often the domestic workers report to do so. In
or irregular hours is lowest for all occupations. Here, two in ten
workers reports to work shifts or irregular hours. Next are South/Africa and Zambia, where
four in ten workers reports to do so. In contrast, in the five other countries (Belarus, India,
, Kazakhstan, and Ukraine) six to seven in ten workers reports working shifts or
irregular hours. When exploring differences across occupations, it turns out the childcare
workers report most often to be working shifts or irregular hours. Six in ten childcare
might be due to the fact that the childcare occupation includes
babysitters, which almost all will work on irregular hours. In contrast, the catering workers
work the least in shifts or irregular hours, though even five in ten of them reports to do so.
cleaning and domestic occupations are in between.
even a longer working week. In all other countries, less than two in ten workers report to be
60 hours and only three in hundred reports to be working more than 60 hours.
nd for Zambia fits in with the national statistics for that
, while for Indonesia the average hours are less than in those statistics; by contrast,
the average hours we found for Brazil are higher than reported in that country’s official
in domestic work occupations by country.
2011Q2, selection: women and men in the domestic work occupations in 8 DFL
survey includes a question asking if the respondent works shifts or
shows how often the domestic workers report to do so. In Brazil,
l occupations. Here, two in ten
workers reports to work shifts or irregular hours. Next are South/Africa and Zambia, where
four in ten workers reports to do so. In contrast, in the five other countries (Belarus, India,
ix to seven in ten workers reports working shifts or
irregular hours. When exploring differences across occupations, it turns out the childcare
workers report most often to be working shifts or irregular hours. Six in ten childcare
might be due to the fact that the childcare occupation includes
babysitters, which almost all will work on irregular hours. In contrast, the catering workers
work the least in shifts or irregular hours, though even five in ten of them reports to do so.
61 - 99 hrs
46 - 60 hrs
40-45 hrs
0 - 39 hrs

P a g e | 30
Graph 6.4 Percentage workers reporting shift work or irregular hours
Source: WageIndicator data 2006Q1-2011Q2, selection: women and men in the domestic work occucountries. N= 3068.
0%
20%
40%
60%
80%
100%
Percentage workers reporting shift work or irregular hours in domestic work occupations by country
2011Q2, selection: women and men in the domestic work occu
in domestic work occupations by country.
2011Q2, selection: women and men in the domestic work occupations in 8 DFL
Catering
Childcare
Cleaning
Domestic
Total
P a g e | 31
References
Bhorat, H., R. Kanbur, N. Mayet (2010) Estimating the Effect of Enforcement on Compliance with Minimum Wages: The case of South Africa. October 2010; Paper presented at 2nd Conference Regulating for Decent Work (RDW) – Regulating for a Fair Recovery, ILO, Geneva, July 6-8, 2011
Budlender, D. (2010) Decent work for domestic workers. Study prepared for the SERVICES Sector Education and Training Authority. Johannesburg: Community Agency for Social Enquiry (CASE)
Budlender, D. (2011a) Measuring the economic and social value of domestic work. Geneva: ILO, DOMESTIC WORK POLICY BRIEF 3
Budlender, D. (2011b) Measuring the economic and social value of domestic work: Conceptual and Methodological Framework. Conditions of Work and Employment Series No. 30. Geneva: ILO
Casale, D., D. Posel (2008) Unions and the Gender Wage Gap in South Africa. Paper DRPU Conference 2008: The Regulatory Environment and its Impact on the Nature and Level of Economic Growth and Development in South Africa, DFID/Friedrich Ebert Stiftung
Gomes, A.V. Moreira, P.T. Martins Bertolin (2010) Regulatory Challenges of Domestic Work: The Case of Brazil. Montreal: McGill University –LLDRL Working Paper Series, No. 3
Hagemann, H., B. Tjahjono, C. Salim (2011) Strengthening the Capacity of and Social Protection for Domestic Workers. International NGO Consultation on the Ratification of the ILO Convention on Decent Work for Domestic Workers, Geneva, Switzerland, June 3-4, 2011
Hertz, T. (2005) The Effect of Minimum Wages on the Employment and Earnings of South Africa’s Domestic Service Workers. Washington, D.C.: American University, Department of Economics, Working Paper Series No. 2005-04
Hobden, C. (2011) Reversing a History of Exclusion through International Labour Law. Global Labour Column No. 50, February 28 (http://column.global-labour-university.org/)
Human Rights Watch (HRW) (2010) Slow Reform. Protection of Migrant Domestic Workers in Asia and the Middle East. New York etc.
ILO (2007) Decent Work Country Programme 2006 – 2012. W.p. ILO (2008) Global Wage Report 2008/09: Minimum wages and collective bargaining. Towards policy coherence.
Geneva ILO (2010a) Decent Work for Domestic Workers, Report IV(1). International Labour Conference, 99th
Session, Geneva (http://www.ilo.org/wcmsp5/groups/public/@ed_norm/@relconf/documents/meetingdocument/wcms_104700.pdf)
ILO (2010b) Global Wage Report 2010/11: Wage policies in times of crisis. Geneva ILO (2011a) Zambia enacts new domestic work legislation. Geneva: ILO/TRAVAIL, Developments in Law
and Practice 1/2011 ILO (2011b) Convention No. 189. Decent work for domestic workers. Geneva: ILO/TRAVAIL ILO (2011c) Decent Work for Domestic Workers, Report IV(2A). International Labour Conference, 100th
Session, Geneva ITUC (2009) Annual Survey of Violations of Trade Union Rights. Indonesia. Brussels
King Dejardin, A. (2011) Working hours in domestic work. Geneva, ILO: DOMESTIC WORK POLICY BRIEF 2
McCann, D., J. Murray (2010): The legal regulation of working time in domestic work. Conditions of Work and Employment Series No. 27. Geneva: ILO
Oelz, M. (2011) Remuneration in domestic work. Geneva: ILO, DOMESTIC WORK POLICY BRIEF 1 Ordor, A. (2011) Enforcing Decent Work. Exploring Civil Society Partnerships in Enforcing Decent Work in
South Africa. Paper 2nd Conference Regulating for Decent Work (RDW) – Regulating for a Fair Recovery, ILO, Geneva, July 6-8
Research Network for Domestic Worker Rights (2011) Newsletter No. 1, August
Simonovsky, Y., M. Luebker (2011) Global and regional estimates on domestic workers. Geneva, ILO: DOMESTIC WORK POLICY BRIEF 4

P a g e | 32
Tomei, M. (2011) Interview ILO Online: Questions and Answers on the Convention Concerning Decent Work for Domestic Workers, June 21 (http://www.ilo.org/ilc/ILCSessions/100thSession/media-centre/articles/WMCS_15837)
Tijdens, K.G., M. van Klaveren (2011) Young women in service sector occupations. Bookkeepers, call centre operators, receptionists, housekeepers, IT-programmers, sales persons, secretaries, travel agency clerks. Amsterdam: WageIndicator Data report, June 2011
Tijdens, K.G., S. van Zijl, M. Hughie-Williams, M. van Klaveren, S. Steinmetz (2010) Codebook and explanatory note on the WageIndicator dataset, a worldwide, continuous, multilingual web-survey on work and wages with paper supplements. Amsterdam: AIAS Working Paper 10-102
US Dept of State, Bureau of Democracy, Human Rights, and Labor (2011) 2010 Human Rights Report: Malawi. Washington D.C.
Van Klaveren, M., K. Tijdens, M. Hughie-Williams, N. Ramos Martin (2009a) An overview of women’s work and employment in Mozambique. Amsterdam: AIAS Working Paper 09-77
Van Klaveren, M., K. Tijdens, M. Hughie-Williams, N. Ramos Martin (2009b) An overview of women’s work and employment in Angola. Amsterdam: AIAS Working Paper 09-78
Van Klaveren, M., K. Tijdens, M. Hughie-Williams, N. Ramos Martin (2009c) An overview of women’s work and employment in South Africa. Amsterdam: AIAS Working Paper 09-79
Van Klaveren, M., K. Tijdens, M. Hughie-Williams, N. Ramos Martin (2009d) An overview of women’s work and employment in Zambia. Amsterdam: AIAS Working Paper 09-80
Van Klaveren, M., K. Tijdens, M. Hughie-Williams, N. Ramos Martin (2009e) An overview of women’s work and employment in Botswana. Amsterdam: AIAS Working Paper 09-81
Van Klaveren, M., K. Tijdens, M. Hughie-Williams, N. Ramos Martin (2009f) An overview of women’s work and employment in Malawi. Amsterdam: AIAS Working Paper 09-82
Van Klaveren, M., K. Tijdens, M. Hughie-Williams, N. Ramos Martin (2009g) An overview of women’s work and employment in Brazil. Amsterdam: AIAS Working Paper 09-83
Van Klaveren, M., K. Tijdens, M. Hughie-Williams, N. Ramos Martin (2010a) An overview of women’s work and employment in India. Amsterdam: AIAS Working Paper 10-90
Van Klaveren, M., K. Tijdens, M. Hughie-Williams, N. Ramos Martin (2010b) An overview of women’s work and employment in Indonesia. Amsterdam: AIAS Working Paper 10-91
Van Klaveren, M., K. Tijdens, M. Hughie-Williams, N. Ramos Martin (2010c) An overview of women’s work and employment in Azerbaijan. Amsterdam: AIAS Working Paper 10-92
Van Klaveren, M., K. Tijdens, M. Hughie-Williams, N. Ramos Martin (2010d) An overview of women’s work and employment in Kazakhstan. Amsterdam: AIAS Working Paper 10-93
Van Klaveren, M., K. Tijdens, M. Hughie-Williams, N. Ramos Martin (2010e) An overview of women’s work and employment in Ukraine. Amsterdam: AIAS Working Paper 10-94
Van Klaveren, M., K. Tijdens, M. Hughie-Williams, N. Ramos Martin (2010f) An overview of women’s work and employment in Belarus. Amsterdam: AIAS Working Paper 10-96
Van Klaveren, M., K. Tijdens, M. Hughie-Williams, N. Ramos Martin (2010g) An overview of women’s work and employment in Zimbabwe. Amsterdam: AIAS Working Paper 10-97
website ILO / 100th ILO Annual Conference (http://www.ilo.org/ilc/ILCSessions/100thSession/media-centre/press-releases/WCMS_157891/lang--en/index.htm)
website ILO Natlex Database (last accessed October 30, 2011) (http://www.ilo.org/dyn/natlex/natlex_browse.home)
website International Domestic Workers Network (IDWN) (last accessed October 30, 2011) (http://www.iwdn.info)
website IUF/domesticworkerrights (http://en.domesticworkerrights.org ((last accessed November 19, 2011)
website Ministry of Labour and Employment India / Press Information Bureau (last accessed October 21, 2011) (http://pib.nic.in/newsite/erelease.aspx?relid=76794)
Zepeda, E. (2008) Latin America’s Progress on Gender Equality: Poor Women Workers Are Still Left Behind. Brasilia DF: International Poverty Centre, One pager, February (www.undp-povertycentre.org)

P a g e | 33
Appendix 1 Domestic work occupational titles
Table A1 Domestic work occupational titles in this report
1412020000000 Catering manager CATERING
1412030000000 Kitchen manager CATERING
5120040000000 Food preparation worker CATERING
5120080000000 First line supervisor food servicing workers CATERING
5120090000000 Catering worker CATERING
5120990000000 Cook, all other CATERING
5131030000000 Food server (not in restaurants) CATERING
5131040000000 Host or hostess CATERING
5132010000000 Bartender CATERING
5152020000000 Butler CATERING
9411010000000 Fast-food preparer CATERING
9412010000000 Kitchen helper CATERING
5120100000000 Chinese food cook CATERING
5120110036000 IDN European food cook CATERING
5120120000000 Japanese food cook CATERING
5120140000000 Indian food cook CATERING
5120150000000 Latin American food cook CATERING
5120160000000 Indonesian food cook CATERING
2221030000000 Childrens nurse CHILDCARE
2342010000000 Early childhood educator CHILDCARE
5311010000000 Child care worker CHILDCARE
5311010282600 Pre-school assistant CHILDCARE
5311020000000 Au-pair CHILDCARE
5311030000000 Schoolchildren attendant CHILDCARE
5311040000000 Creche nurse CHILDCARE
5311160000000 Nanny CHILDCARE
5311180000000 Baby-sitter CHILDCARE
5312010000000 Teacher’s assistant CHILDCARE
1219040000000 Housekeeping department manager CLEANING
5151010000000 First line supervisor housekeeping workers CLEANING
5151020000000 Housekeeper in hotels, offices or other establishments CLEANING
9112010000000 Cleaner in offices, schools or other establishments CLEANING
9112020000000 Cleaner in hotels CLEANING
9112030000000 First line supervisor cleaning workers CLEANING
9129990000000 Cleaning worker, all other CLEANING
9412020000000 Dishwasher CLEANING
5152010000000 Domestic housekeeper DOMESTIC
9111010000000 Domestic cleaner DOMESTIC
9111020000000 Domestic help (private homes) DOMESTIC
P a g e | 34
Appendix 2 The web-survey
This paper uses survey data of individuals from eight countries. The data stem from the
continuous, volunteer WageIndicator web-survey (www.wageindicator.org). This is an
international comparable survey in national languages, posted at the frequently visited
WageIndicator websites. The survey contains questions about wages, education, occupation,
industry, socio-demographics, and alike (Tijdens et al, 2010). In 2000, the WageIndicator
project started as a paper-and-pencil survey for establishing a website with salary
information for women’s occupations in the Netherlands. By mid 2011, it had developed into
an online data collection tool hosted on more than 60 national websites with job-related
content, labour law and minimum wage information, and a free and crowd-pulling Salary
Check presenting average wages for occupations. The web-survey has a prize incentive; it
takes approximately 10 minutes to complete part 1 and 10 minutes for part 2.