wacoss submission on the draft decision- mid-west … d56170 public... · the rate of return or...
TRANSCRIPT
Western Australian
Council of Social Service Inc.
ABN 32 201 266 289
City West Lotteries House
2 Delhi Street
West Perth
Western Australia 6005
Phone (08) 9420 7222
Fax (08) 9486 7966
Email [email protected]
www.wacoss.org.au
Mr Lyndon Rowe Chairperson Economic Regulatory Authority PO Box 8469 Perth BC WA 6849 5/11/2010 WACOSS Submission on the Draft Decision- Mid-West and South West Gas Distribution Systems Revised Access Arrangement Dear Chairperson WACOSS welcomes the opportunity to make a submission on the Draft Decision - Mid-West and South West Gas Distribution Systems Revised Access Arrangement. About WACOSS The Western Australian Council of Social Service (WACOSS) is the leading peak organisation for the community, and represents 300 member organisations and individuals, and over 800 organisations involved in the provision of services to individuals, families and children in the community. Each year, WACOSS member organisations deliver community services to hundreds of thousands of West Australians. WACOSS is part of a national network consisting of State and Territory Councils of Social Service, and the Australia Council of Social Service (ACOSS). Our national coverage strengthens our capacity to represent the interests of low income and disadvantaged West Australians across the breadth of State and National agendas. Our Submission WACOSS considers that the B3 reference tariff for residential and small business customers proposed in the draft decision is above the level that would pertain in an efficient market for the delivery of gas distribution network services. WACOSS supports a restructure of the tariff to promote efficiency, access and affordability for B3 tariff consumers. Please find enclosed our submission. No part of the submission is confidential. Please feel free to contact us if you have any queries. Yours sincerely
Sue Ash Chief Executive Officer WACOSS
Ways to make a difference
|Social Policy & Advocacy| Organisation Development Services| Member Services|
WACOSS Submission to
Economic Regulation Authority
Draft Decision – Mid-West and South-West Gas Distribution Systems
Revised Access Arrangement
November 2010
Contact:
Irina Cattalini Director – Social Policy
WACOSS 2 Delhi Street
West Perth WA 6005
2
Table of Contents
Abbreviations .......................................................................................................................................... 3
Executive Summary ................................................................................................................................. 4
1 Introduction .................................................................................................................................. 5
2 WACC issues.................................................................................................................................. 7
2.1 Equity beta ............................................................................................................................... 7
2.2 Debt raising costs .................................................................................................................. 10
2.3 Return on Equity .................................................................................................................... 11
3 Other components of the annual revenue requirement ............................................................ 14
3.1 Lack of public information about capex ................................................................................ 14
3.2 Capex overhead allocations ................................................................................................... 14
3.3 Level at which Capex must be Justified ................................................................................. 15
3.4 Opex Issues ............................................................................................................................ 16
3.5 Unaccounted for Gas ............................................................................................................. 18
3.6 Depreciation .......................................................................................................................... 19
3.7 Tax rate .................................................................................................................................. 20
4 Demand forecasts for B3 tariff class customers ......................................................................... 23
5 Revenue allocation to B3 tariff class customers ......................................................................... 28
6 B3 tariff structure ....................................................................................................................... 34
Bibliography .......................................................................................................................................... 38
This project was funded by the Consumer Advocacy Panel (www.advocacypanel.com.au) as part of
its grants process for consumer advocacy projects and research projects for the benefit of
consumers of electricity and natural gas.
The views expressed in this document do not necessarily reflect the views of the Consumer
Advocacy Panel or the Australian Energy Market Commission.
WACOSS also thanks Luke Berry of Engineroom Infrastructure Consulting for his professional advice.
3
Abbreviations
AA Access Arrangement
AER Australian Energy Regulator
AIC average incremental cost
bppa basis points per annum
capex capital expenditure
DD draft decision
DRC debt raising costs
ERA Economic Regulation Authority
GFC global financial crisis
IPART Independent Pricing and Regulatory Tribunal
LRMC long run marginal cost
opex operating expenditure
RAB regulated asset base
SRMC short run marginal cost
UAFG unaccounted-for gas
WACC weighted average cost of capital
4
Executive Summary
The Western Australian Council of Social Services (WACOSS) welcomes the opportunity to comment
on WA Gas Network’s (WAGN) access arrangement proposal for the Mid-West and South-West Gas
Distribution Systems and on the draft decision on the proposed access arrangements by the
Economic Regulation Authority (the Authority). The access arrangements relate to the setting of gas
distribution or 'reference tariffs' which are a significant portion of the total retail gas price paid by
residential and small business gas consumers.
WACOSS considers that the B3 reference tariff for residential and small business customers
proposed in the Authority's draft decision is above the level that would pertain in a competitive
market for the delivery of gas distribution network services. In addition WACOSS considers that the
B3 tariff should be restructured to promote efficiency, access, and affordable for B3 tariff customers.
The B3 tariff should be lower than the draft decision because:
the rate of return or weighted average cost of capital (WACC) in the draft decision is higher
than appropriate due to overestimation of the equity beta and debt issuing costs;
some other elements of the annual revenue requirement are also too high (operating
expenditure or opex, capital expenditure or capex, the allowance of unaccounted for gas
(UAFG) and the allowance for depreciation). In addition, the corporate tax rate used should
be lower in the final year of the access arrangement;
the demand forecasts for B3 tariff consumers in the draft decision are too low in view of the
movement of electricity prices, leading to over-recovery of revenue under a price cap
approach; and
the share of revenue allocated to the B3 tariff class is higher than efficient price levels, is
inconsistent with the pricing principles in NGR 94, and is inconsistent with the small user
provisions in the WA Local Provisions Regulations.
The B3 tariff should also be restructured to have a lower fixed or standing charge and an ascending
(or inclining) block usage or consumption charge. Such a tariff structure would improve efficiency,
access and affordability for small gas consumers and be consistent with impending carbon price
signals. Own price elasticity of demand for gas would suggest that a differential pricing approach
involving ascending block prices would optimise consumption levels, align with impending carbon
pricing arrangements, and thus assist social welfare.
WACOSS would have preferred greater access to the documentation supplied by WAGN in order to
comment fully. WACOSS is not confident on the basis of the publicly available information it is in a
position to comment comprehensively and in detail on WAGN’s proposals.
WACOSS has not commented on all aspects of WAGN’s original or revised proposals. The absence of
a comment does not indicate that WACOSS supports WAGN’s proposal in those areas.
5
1 Introduction
The access arrangements for the Mid-West and South-West Gas Distribution System will set gas
distribution or 'reference' tariffs for gas users from 1 January 2010 to 30 June 2014.1
The Authority has made a draft decision on WAGN's original proposal for the access arrangements
and has required WAGN to revise its proposal.2 WAGN has submitted both a response to the draft
decision and made proposed amendments to the access arrangement.3 This document is WACOSS's
submission to the Authority on the draft decision and on WAGN's response to the Authority.
The regulatory approach used to set gas distribution tariffs is to:
determine the annual revenue the distribution business requires to cover its efficient costs
of providing reference services plus earn a reasonable WACC on its invested capital; and
allocate the annual revenue requirement across the users of the gas distribution system
through gas distribution tariffs.
Key parameters that influence the annual revenue requirement are the:
WACC;
level of opex;
value of the opening capital base;
forecast capex, which is added to the capital base as it is incurred; and
rate of depreciation.
For the Mid-West and South-West Gas Distribution System, the annual revenue requirement is
allocated across five gas distribution tariff classes, known as A1, A2, B1, B2, and B3. The A1 tariff
class covers the largest users on the distribution network, and the B3 tariff class covers the smallest
users on the network. Each gas distribution tariff is composed of a fixed or standing charge plus a
consumption charge.
Of most concern to WACOSS is the B3 tariff which pertains to residential and small business
customers. Gas distribution charges are typically over 40% of a retail gas bill. Retail gas prices have
already risen considerably, largely due to increases in the wholesale price of gas. Many residential
customers in WA are already struggling to afford gas as evidenced by high disconnection rates and
significant use of payment plans during 2008/09.4
WACOSS welcomes the draft decision by the Authority to reduce the B3 reference tariff from that
originally proposed by WAGN. However, WACOSS considers that the B3 reference tariffs in the draft
decision remain above those that would pertain in an efficient market for the delivery of network
1 In practice from January 2011 given extensions granted to WAGN in relation to its proposal.
2 ERA DD 2010
3 WAGN Submission to DD 2010 and WAGN Amended AAI 2010
4 ERA 2010
6
services, and the structure of the tariffs places a disproportionate and inefficient cost burden on B3
tariff customers, including on low income members of the WA community.
The submission consists of five sections, addressing:
the WACC;
other components of the annual revenue requirement;
demand forecasts for B3 tariff consumers;
revenue allocation to the B3 tariff class; and
the structure of the B3 tariff.
7
2 WACC issues
2.1 Equity beta
The equity beta measure the riskiness of an individual business compared to the overall market,
where the average equity beta of the market is 1.0.5
The draft decision has proposed an equity beta of 0.8 for the WAGN network.6
The draft decision refers to the AER WACC review in 2009, where the AER reviewed appropriate
equity betas for electricity transmission and distribution networks.7 The AER review concluded that,
on the basis of the empirical evidence, equity beta for electricity transmission and distribution
businesses should lie in the range 0.4 to 0.7.
In relation to gas distribution networks, the AER noted in its draft decision on the ActewAGL network
that gas distribution businesses are similarly less risky than the overall market because of the
revenue protection and stability provided by the tariff adjustment mechanism, the roll forward of
the capital base, and the pass-through mechanism. 8
In addition to the factors identified by the AER, a number of other factors make gas distribution
businesses less risky than the overall market:
Revenues are relatively predictable due to the historical stability of overall customer
demand and the established patterns of prices paid by customers;
Costs are relatively predictable given (i) operating expenditure is low compared to required
annual revenues; (ii) capital expenditure is relatively predictable from year to year; (iii) debt
costs are a high proportion of the required annual revenues and can be fixed to a significant
extent; (iv) depreciation charges are a high proportion of the required annual revenues and
can be predicted with a high degree of certainty;
The customer base is diverse and peak demand across different customer segments does
not coincide;
The business possesses significant monopoly power and faces few or no competitive threats;
and
The business benefits from the application of a number of fixed principles in the calculation
of total revenues.9
5 Compare AER ActewAGL Draft Decision 2009, p. 195.
6 ERA DD 2010, p. 135.
7 AER WACC Review 2009.
8 AER ActewAGL Draft Decision 2009, p. 203.
9 For a discussion of the fixed principles applicable to the Mid-West and South-West gas distribution systems,
refer to ERA DD 2010, pp. 206-211.
8
Despite the empirical evidence and the factors listed above, in the AWACC Review, the AER adopted
a conservative equity beta of 0.8 for transmission and distribution businesses. The AER applied this
conservative equity beta during 2010 to the ActewAGL network.
The issue is whether adopting a conservative position similar to the one adopted by the AER in 2009
in the WACC review remains justified.
WACOSS considers that:
it is appropriate to set the equity beta in accordance with the empirical evidence; and
adopting an overly conservative position on the equity beta may lead to distortions in the
other elements of the WACC formula to ensure an outcome that is consistent with observed
WACCs in the market.
WACOSS argues that it is now appropriate to apply a less conservative position than the AER
adopted in 2009 and early 2010 when global markets were in turmoil. WACOSS would advocate for
an equity beta within the range indicated by the empirical evidence, and suggests an equity beta of
0.7 which it notes is at the top end of the indicated range.
The AER maintained its conservative stance of an equity beta of 0.8 in the ActewAGL decision on the
basis of:10
The need to reflect prevailing market conditions;
The risks involved in providing reference services; and
The importance of regulatory certainty.
The AER’s reference to prevailing market conditions is presumably to the impact of the global
financial crisis (GFC).11 WACOSS observes that by late 2010 the impact of the GFC has abated
somewhat and equity markets have appreciated significantly.
Taking the GFC into account is theoretically doubtful, since returns to equity and thus equity betas
should be measured over the long term, including both downturns and upturns in economic activity.
The Authority has recognised this point in the setting of the WACC parameters, for example, the
market risk premium.12
Further, the equity beta is a comparative term that measures the difference in riskiness of an
individual asset or business against the average riskiness of the market. Therefore, it makes no
sense to increase the equity beta of gas networks against the market due to ‘prevailing market
10
AER ActewAGL Draft Decision 2009, p. 207.
11 The ERA notes that AER was also influenced by the GFC at the time of the WACC review (May 2009) to
increase the market risk premium from 6 per cent to 6.5 per cent, although it noted that 6 per cent was the
“best estimate of the forward looking long term MRP”: ERA DD 2010, p. 106.
12 ERA DD 2010, pp. 106-108.

9
conditions’. These market conditions affect both the individual business and the broader market
equally, and so the equity beta of the business against the market remains the same.13
In defence of the AER’s position it could be argued that in 2009 the GFC appeared to represent a
discontinuity in market behaviour due to the extreme level of volatility observed in risk and equity
returns, and this discontinuity may have brought standard economic concepts such as the equity
beta into doubt. However, it is now clear that the impact of the GFC can be quantified and
measured, and the GFC can be seen as a periodic part of the longer-term economic cycle rather than
a discontinuity in economic activity.
The AER also justified its conservative position on the basis of the risks in providing reference
services and the importance of regulatory certainty. However, these risks are simply a subset of all
the risks captured in the equity beta estimates of 0.4 to 0.7. Many or all industries in the market
face risks in service provision, and threats from government or regulatory intervention. These risks
have already been fully factored into the observed equity beta estimates. Thus, to allow an equity
beta above the observed range would be to double-count these risks.
WACOSS notes that the AER applied an equity beta of 0.8 to the ActewAGL network. Even if this
equity beta is appropriate for the ActewAGL network, it is clear that the WAGN network is a less
risky asset and therefore a lower equity beta can be justified. The WAGN network is a much longer
established network, is a much larger network, and gas in WA faces less competition from cheap
coal-fired electricity than in the ACT. Further, the WAGN network has a much more diverse
customer base. The ActewAGL customer base is largely made up of small businesses and residential
customers, with relatively insignificant industrial demand. In contrast the WAGN network serves a
wide range of industrial, business and residential consumers across its five different tariff classes.
Peak demand from different customer classes on the WAGN network does not coincide, enabling the
WAGN network to deliver more gas per unit of transport capacity, and making the WAGN network
less dependent on weather than the ActewAGL network.14
WACOSS notes that users would bear the costs of an overly conservative approach to the estimation
of the equity beta. These costs would include both the additional tariffs paid above efficient market
levels, and the lost production and amenity from lower gas use due to higher prices. The impact of
an equity beta above the level suggested by empirical evidence is significant, as shown in table 1.
The additional costs of the higher beta are $2.08m in 2010-11 alone, or around $10million over the
access arrangement period.
13
Put another way, if a business is half as risky as the market average, then market turmoil that affected both
the business and the broader market would not justify concluding that the business is now as risky as the
market average.
14 These observed variations in the inherent riskiness of the WAGN network compared to the ActewAGL
network capture non-diversifiable risks that should appropriately be captured in the choice of the equity beta.
That is to say, an efficiently run gas distribution network with the characteristics of the WAGN network would
always be less risky than an efficiently run gas distribution network with the characteristics of the ActewAGL
network.

10
Table 1: Comparison of a 0.8 and 0.7 equity beta
Equity beta Real pre-tax WACC Return on Asset in 2010-11
($m Dec 2009)
0.8 6.896% 53.92
0.7 6.63% 51.84
Difference 0.226% or 22.6 basis points 2.08 in 2010-11
2.2 Debt raising costs
The draft decision proposes debt raising costs (DRC) or debt issuing costs of 0.125 per cent. The DRC
is added to the cost of debt to determine the debt margin over the nominal risk-free rate.15 The
impact of the DRC on the derived real pre-tax WACC is diluted by the ratio of debt to total enterprise
value and by inflation. Thus a DRC of 0.125 per cent adds around 0.074 per cent or 7.4 basis points
to the real pre-tax WACC of 6.89 per cent.
The draft decision refers to a 2004 report by Allen Consulting Group16 on the DRC and the May 2010
AER decision in relation to ETSA.17
The Allen Consulting Group accepted the legitimacy of including DRC18 as well as including these
costs as part of the debt margin.19 The Allen Consulting Group indicated that banks priced DRC at
between 0.08 and 0.085 per cent, usually referred to as8-8.5 basis points per annum (bppa).20 It
noted that the DRC varied based on the tenor or time to maturity of the debt issuance and the size
of the debt, with the DRCs for larger debts at longer tenors relatively lower than for smaller debts at
shorter tenors.21 It tabulated DRCs between 10.4 bppa and 8.0 bppa for 5 year debts between
$175m and $1,050m. For debts between $350m and $700m the DRC was in the range 9.0 to 8.2
bppa. In this case, WAGN’s benchmark debt is around $500m22 and the appropriate tenor is 10
years given WAGN’s debt risk premium has been assessed by the Authority with reference to 10 year
borrowings.23 This would suggest a DRC at the lower end of the 8.2-9.0 bppa range would be
appropriate.
15
ERA DD, p. 136.
16 Allen Consulting Group 2004
17 AER ETSA 2010.
18 Allen Consulting Group 2004, pp. xiii-xiv.
19 Allen Consulting Group 2004, pp. xix.
20 Allen Consulting Group 2004, pp. xvi-xvii.
21 Allen Consulting Group 2004, pp. xviii-xix.
22 At 60 per cent of WAGN’s regulated asset base of $800-$900m over the term of the access arrangement.
23 ERA DD, p. 120.

11
The Allen Consulting Group noted that the ACCC had allowed a DRC in relation to GasNet in 2002 of
12.5 bppa. However, the Allen Consulting Group indicated that this DRC included a dealer swap
margin of 5.0 bppa. It considered that the dealer swap margin “should be treated as part of the debt
risk premium rather than the transaction cost on debt, and so excluded from the calculation of
transaction costs”.24
The recent AER decision in relation to DRC in May 2010 in relation to ETSA in South Australia
provided for a DRC of 9.1 bppa.25 In the recent ActewAGL decision, the AER permitted DRC costs of
$0.9m as part of opex over the 5 years of the access arrangement.26 This equates to a DRC of 7.2 to
6.4 bppa (reducing as the asset base increases over the life of the access arrangement).27
WACOSS argues that the DRC of the WAGN network should be set at 8.5 bppa. This would be in line
with recent regulatory decisions and practice. WACOSS believes that a DRC of 8.5 bppa would
reflect the efficient DRC costs of a benchmarked firm controlling an asset similar to the WAGN
network.
The impact of setting a DRC of 8.5 bppa compared to the DRC in the draft decision of 12.5 bppa is
indicated in table 2. In 2010-11 the difference in allowed revenue is $0.18m or around $1m over the
course of the access arrangement.
Table 2: Comparison of different allowances for debt raising costs
DRC (bppa) Real pre-tax WACC (%) Return on Asset in 2010-11 ($m Dec 2009)
12.5 6.896 53.92
8.5 6.873 53.74
Difference 0.023 or 2.3 basis points 0.18 in 2010-11
2.3 Return on Equity
WAGN has submitted a report by SFG Consulting (SFG) in support of a higher rate of return on equity
than the value of 9.96 per cent used in the draft decision.28
The SFG report identifies a return on equity of at least 10.5 per cent based on an analysis of the
dividend yields from a selection of firms that it argues are comparable to WAGN:
APA Group (APA);
24
Allen Consulting Group 2004, pp. xvi.
25 AER ETSA 2010, p. 124.
26 AER ActewAGL Final Decision 2010, p. 93.
27 Calculated as $0.2m per year on a regulatory asset base opening at $278.1m in 2010-11 and opening at
$310.6m in 2014-15. This is an overestimate as the total DRC allowed over 5 years is $0.9m.
28 See Annexure 1 to WAGN Submission in response to the DD 2010.
12
Hastings Diversified Utilities Fund (HDF);
Envestra (ENV);
Spark Infrastructure (SKI);
SP Ausnet (SPN); and
DUET Group (DUE) – a part-owner of WAGN.
The main problem with SFG’s approach is that it is not appropriate to compare the return on equity
of these firms to that for a single asset such as the Mid-West and South-West Gas Distribution
Systems. These firms own multiple assets, including regulated and non-regulated assets. Many of
the assets owned by these companies also have higher equity betas than gas distribution assets. For
example, APA Group owns gas-fired power stations, transmission pipelines, and manages regulated
assets for other companies such as Envestra. All these assets and activities are more risky than
ownership of a gas distribution network. As such the data from these companies is not relevant to
estimation of the return on equity for the Mid-West and South-West Gas Distribution Systems.
Another problem with SFG’s approach is that dividends may not represent a good proxy for expected
return on equity for the firm. Dividends are set by each firm's Board. For a variety of reasons, a
Board may set dividends in a way that varies from expected returns on equity. In recent times, some
Boards have kept dividends artificially high out of a concern that a cut in dividends would undermine
market confidence and the share price.29
It is also noted that of the six companies in the data set, four paid unfranked dividends while SPN
paid dividends franked to 40 per cent and ENV paid dividends franked to 55 per cent.30 Franking31
levels have declined in recent years for some of these companies, meaning that it is more
appropriate to compare dividend yields after adjusting for franking levels. The SFG report did not
adjust for changes in the level of dividend franking.
Finally, it is noted that the SFG report is based on a data set drawn from the period November 2009
to March 2010 and a relatively small group of companies. With such a narrow data set the factors
driving expected returns to equity may vary from trend levels, either positively or negatively.
Selection of another restricted period would likely result in a different outcome.32 As an example of
how dividend yields can vary over time, the data set of APA, ENV, DUE, SPN, SKI, and HDF after
market close on 26 October 2010 had an average dividend yield of 9.55 per cent, a significant decline
on the 10.5 per cent dividend yield in the SFG report, and also below the level allowed for WAGN in
the draft decision.33
29
Telstra is perhaps the most notorious example.
30 Data drawn from CommSec.
31 Franking of dividends represents the level of tax paid on those dividends by the company, which can be held
in the hands of eligible shareholders as a tax benefit.
32 Interestingly, although the SFG report is dated 1 September, it did not appear to draw on data after March
2010.
33 Data drawn from CommSec based on 85% APA, 10.3% ENV, 11.4% DUE, 8.4% SPN, 10.7% SKI, and 8.0% HDF.
CommSec reports dividend yields based on a blend of the past 12 months and the consensus dividend for the

13
WACOSS also notes that the Utilities index (XUJ) on the Australian stock exchange comprises ten
infrastructure companies. The ten companies include the above six companies plus AGL Energy
(AGK), Energy World Corporation (EWC), Indigent Energy (IFN), and Prime Infrastructure (PIH.) The
average dividend yield across these other four companies is only 2.8 per cent (as at 26 October
2010). Therefore the average dividend yield across all ten companies in the XUJ index is only 6.8 per
cent. WACOSS also notes that AGK and PIH are at least as comparable to WAGN as four of the
companies in the SFG comparator group, namely SPN, HDF, DUE, or SKI. However, the dividend
yields are 3.6 per cent for AGL and 4.7 percent for PIH. Including even just AGK and PIH in the
comparator group would have had a major impact on the average dividend yield.
WACOSS considers that the SFG report does not make a case for raising the rate of return on equity
from the draft decision.
next 12 months. For these six companies the consensus dividends were based on 3 broker reports for all
companies except APA, which was based on 4 broker reports.

14
3 Other components of the annual revenue requirement
3.1 Lack of public information about capex
WACOSS has concerns about the levels of capex in the draft decision. However, it is difficult to judge
whether WAGN’s actual or proposed capex spending meets the criteria in the National Gas Rules
(NGR.) This is because the spending has not been presented with sufficient granularity by either
project or sub-classification. The publicly released material does not contain sufficient information
for stakeholders to assess individual projects or assess the appropriateness of WAGN’s capital
overhead.
Further, there are some contradictions in the information that has been publicly released. In
particular, in WAGN’s original submission in support of its proposal it has presented information in
table 11 on different categories of capex.34 The composition of capex spending presented in table 11
does not tally in significant respects with the capex information depicted in figure 3 of the same
submission.35 For example, the demand-based capex spend in table 11 for the first half of 2010 of
$1.249m out of a total of $28.070m does not tally with the depiction of demand-based capex
spending in figure 3, where it is roughly half of the total. Again, the ‘others’ capex spend in table 11
for 2012-13 of $9.256m does not tally with the depiction of ‘others’ capex spending in figure 3,
where it is significantly smaller than any other category of capex spending for that year.
It may be that some of the spending categories have become switched in development of the figure
or the table. Both the lack of granularity in information-provision and the contradictions in the
information provided make it difficult for parties making submissions to comment with confidence
on the proposed capex spending. For example, as a result of the lack of data, WACOSS is not able to
compare unit rates for construction with those for other networks or to take a view on the
appropriateness of such rates.
3.2 Capex overhead allocations
WAGN reports that it has allocated an overhead component to cover the cost of managing capital
projects.36 Unfortunately, the public versions of the original or revised submission do not provide
any information to judge the appropriateness of the overhead component. Unlike other elements of
the forecast capex budget, the overhead allocation is not subject to market testing through
contracting out processes. It is also unclear whether the overhead allocation should be the same
where WAGN is delivering capex projects in-house, as management of in-house projects may involve
a lower overhead than contracted-out projects.
34
WAGN submission 2010, p. 40.
35 Figure 3 is at WAGN Submission 2010, pp. 39. For example, compare 2010 demand capex presented in
table 11 compared with figure 3.
36 WAGN Revised Submission, p. 40.
15
WACOSS notes that WAGN’s capex performance is projected to worsen significantly over the
upcoming access arrangement period compared with its historical performance against the capex
benchmarks set out in its revised Access Arrangement Information (AAI).37
WACOSS urges careful scrutiny of the capex overhead allocation, particularly given this
deterioration in forecast capex performance.
3.3 Level at which Capex must be Justified
Frontier reviewed WAGN’s actual capex over the current access arrangement period and forecast
capex over the upcoming access arrangement period.38 Frontier made a number of criticisms of the
information presented by WAGN:
WAGN was unable to substantiate net incremental revenue figures for both actual and
forecast demand and user-initiated capex expenditures to satisfy the net incremental
revenue test in Rule 79(2)(b), later supplying a Marsden Jacob report to justify one project
(the Mandurah lateral and associated DBNGP gate station);39
The information supplied by WAGN did not demonstrate how each individual project
satisfied the relevant capex criteria in NGR 79(2) and the regulator might consider applying a
threshold of $2million above which projects needed justification at the individual level; and
Forecast capex could only be justified on a 20 year timeframe.
Frontier did find that in aggregate the actual and forecast capex did meet the requirements of the
net incremental revenue test.
The Authority’s draft decision expressed the view that “rule 79 does not provide for any particular
level of disaggregation of capital expenditure” and that “the Authority must apply the tests in rule 79
... based on the manner in which WAGN has disaggregated the expenditure ... (provided this has
been done on a logical and rational basis)”.40
WACOSS disagrees with the Authority’s approach in the draft decision. WACOSS is concerned that
such an approach might constrain a regulator from rejecting individual project capex even where
those projects clearly do not meet the tests in NGR 79. WACOSS considers it would set a dangerous
precedent to permit individual projects to escape scrutiny.
The Authority’s approach may not be consistent with its actual practice in the draft decision to the
extent that it states that it ‘must apply the tests in rule 79 based on the manner in which WAGN has
disaggregated this expenditure (provided this has been done on a logical and rational basis)’.
Frontier’s report makes no findings about capex on any level of disaggregation and only provides
that the capex tests are met on a fully aggregated basis. As a result, the Authority has not even
applied the tests on the basis of the disaggregation presented by WAGN.
37
WAGN Revised AAI, figures 1 to 4, pp. 22- 23.
38 Frontier 2010
39 Frontier 2010, p. 4.
40 ERA DD 2010, p. 60.
16
WACOSS notes that the approach in the draft decision also does not accord with the approach
adopted by other regulators. For example, the practice of the AER has been to review actual and
forecast capex at a project level. For example in the ActewAGL decision, it reviewed major projects
presented by ActewAGL in the ACT, and rejected one major project, the Hoskinstown to Fyshwick
Loop.41 Similarly in electricity regulation, transmission and distribution capex over a threshold must
be justified on an individual basis.
WACOSS supports Frontier’s suggestion to set a threshold amount and review capex projects that
exceed this threshold on an individual basis.
3.4 Opex Issues
WAGN compares its forecast opex performance against three benchmarks:
Operating Expenditure per kilometre of main;
Operating Expenditure per GJ delivered; and
Operating Expenditure per customer connection.42
Compared to its historical performance, the figures show forecast performance worsening against
these three indicators. For example, using the opex in its revised AAI, WAGN’s performance in
figures 4, 5, 6, and 7 shows an increase in the opex required to deliver services per kilometre of
main, per GJ of gas delivered, per customer connection. WACOSS is concerned about this upward
trend in the forecast opex requirement to deliver services. The upward trend against benchmarks
over the upcoming access arrangement period suggests that WAGN is seeking more forecast opex
than it needs.
In its defence, WAGN argues that the above-trend opex proposal for the upcoming access
arrangement period is due to higher UAFG, higher regulatory costs, higher corporate costs allocated
to WAGN within its group of companies, and higher labour costs.43
In terms of higher regulatory costs, no reason has been advanced why regulatory costs would be
higher under the NGL and NGR than historic performance under the Gas Code. It is also unclear why
this would be the case. The NGL and NGR are an evolution from the Gas Code rather than a radical
change. In fact, regulatory costs should be gradually decreasing as regulated firms become more
familiar with economic access regulation since the enactment of Part IIIA of the Trade Practices Act
in the mid-1990s.
It is also unclear why a higher proportion of corporate costs should have been allocated to WAGN
following a restructure of its group of companies since WAGN's activities in delivering reference
services remain fundamentally the same. Under the ring-fencing provisions in the Gas Code and in
the NGL and NGR, WAGN is obliged to maintain separate accounts from other activities, and to
allocate shared corporate costs on an appropriate basis between WAGN’s activities and other
41
AER ActewAGL Draft Decision2009, pp. 32-36.
42 WAGN Revised AAI 2010, pp. 21 – 26.
43 WAGN Revised AAI 2010, pp. 24 - 25.
17
activities. Accounting policies should be consistent between periods. As a result, there should not
be an increase in allocation of corporate costs and any such increase calls into question the
effectiveness of WAGN’s accounting and ring-fencing compliance.
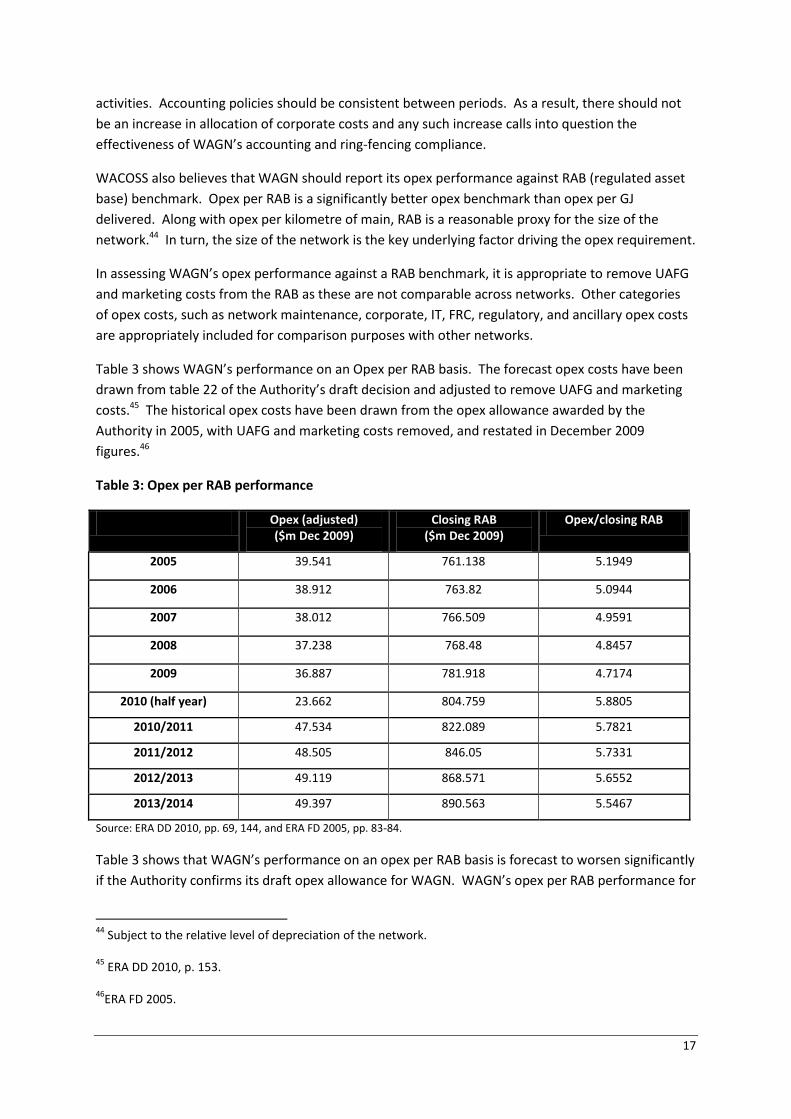
WACOSS also believes that WAGN should report its opex performance against RAB (regulated asset
base) benchmark. Opex per RAB is a significantly better opex benchmark than opex per GJ
delivered. Along with opex per kilometre of main, RAB is a reasonable proxy for the size of the
network.44 In turn, the size of the network is the key underlying factor driving the opex requirement.
In assessing WAGN’s opex performance against a RAB benchmark, it is appropriate to remove UAFG
and marketing costs from the RAB as these are not comparable across networks. Other categories
of opex costs, such as network maintenance, corporate, IT, FRC, regulatory, and ancillary opex costs
are appropriately included for comparison purposes with other networks.
Table 3 shows WAGN’s performance on an Opex per RAB basis. The forecast opex costs have been
drawn from table 22 of the Authority’s draft decision and adjusted to remove UAFG and marketing
costs.45 The historical opex costs have been drawn from the opex allowance awarded by the
Authority in 2005, with UAFG and marketing costs removed, and restated in December 2009
figures.46
Table 3: Opex per RAB performance
Opex (adjusted) ($m Dec 2009)
Closing RAB ($m Dec 2009)
Opex/closing RAB
2005 39.541 761.138 5.1949
2006 38.912 763.82 5.0944
2007 38.012 766.509 4.9591
2008 37.238 768.48 4.8457
2009 36.887 781.918 4.7174
2010 (half year) 23.662 804.759 5.8805
2010/2011 47.534 822.089 5.7821
2011/2012 48.505 846.05 5.7331
2012/2013 49.119 868.571 5.6552
2013/2014 49.397 890.563 5.5467
Source: ERA DD 2010, pp. 69, 144, and ERA FD 2005, pp. 83-84.
Table 3 shows that WAGN’s performance on an opex per RAB basis is forecast to worsen significantly
if the Authority confirms its draft opex allowance for WAGN. WAGN’s opex per RAB performance for
44
Subject to the relative level of depreciation of the network.
45 ERA DD 2010, p. 153.
46ERA FD 2005.
18
the current access arrangement period is in the range 5.2 to 4.7, while its performance for the
upcoming access arrangement period would be in the range 5.9 to 5.5, and therefore consistently
worse. It is understood that other gas distribution networks in Australia typically deliver
comparably adjusted opex per RAB performances in the range 3 to 6, with an average performance
of 4. The significant upswing in opex per RAB, together with the relatively poor performance against
other networks, would tend to suggest that the opex allowance in the draft decision is more than is
necessary for WAGN to perform its operating and maintenance activities.
3.5 Unaccounted for Gas
There is little information available to judge whether the opex allowance for UAFG is appropriate.
The information available in the public documentation simply notes that the “forecast cost of
unaccounted for Gas is based on Gas prices received as a result of a tender process”.47 WACOSS
understands that the Authority may have access to more information about this tender process.
However, a number of questions remain for interested parties, and WACOSS believes that it is quite
possible that the allowance for UAFG is too high
First, it is unclear whether the tender process was at arm’s length and the tender price is actually
market-competitive.
Second, if the tenor of the tender arrangement is longer or shorter than the four and a half years of
access arrangement), the tender is almost certainly not an appropriate measure for determining the
UAFG allowance. Shorter term or longer term arrangements would likely be at different prices
because of different commercial views around future gas price movements and risk appetites.
Longer term and shorter term gas price arrangements almost invariably differ from each other.
Third, if tenor of the tender arrangement is appropriate for pricing UAFG, there is still an issue about
whether the tender price should be taken into account. The question is whether the tender price is
theoretical (the tender was conducted solely to establish a current market price) or the actual price
paid by WAGN. . In this regard, it is noted that WAGN’s revised AAI in October 2010 forecasts UAFG
prices $1.068m higher than the January 2010 AAI.48 . WAGN has not explained the difference. This
may mean that WAGN is paying another price for UAFG than the tender price, or may be a result of
variation clauses in the tender and contract documentation. If it is the result of variation clauses,
the issue arises how the impact of such clauses should be assessed in determining the UAFG
allowance. On the other hand, WAGN may be operating under a longer-term arrangement that pre-
dates the high prices that prevailed at the end of the GFC and during the Varanus Island explosion. If
so WAGN has simply used the tender process to set a particular ‘market’ price and the tender price
may not be the appropriate price for determining the UAFG allowance. In either situation, the
variation in UAFG in the amended AAI should be explained.
47
WAGN revised AAI, p. 20.
48 Compare WAGN AAI table 19, p. 20 and WAGN revised AAI table 19, p. 20.
19
Fourth, there may be some level of double-counting of UAFG. Some distribution networks have
provisions in their shipper contracts for shippers to pay for or supply UAFG. If this is the case then it
would not be appropriate to make an allowance for UAFG.
Given these issues with the UAFG, it may be appropriate for the Authority to test the cost of UAFG.
The recent high wholesale prices for gas may come to be viewed as an aberration caused by a
combination of the GFC and Varanus Island explosion. WACOSS notes that Verve is currently
conducting litigation against its gas suppliers on the basis that the prices pertaining in the market
following the Varanus Island explosion were atypical and longer term prices will return to trend
levels. It may be dangerous to rely too heavily on prices from the 2007 and 2008 periods to
determine forecast UAFG.
Finally, WACOSS is concerned that WAGN may not be applying full competitive rigour to minimise
both the price of UAFG and the amount of UAFG itself. In an environment where gas prices are
elevated in the immediate term, WACOSS is concerned that WAGN may be indifferent to the price
that it pays for UAFG because it is confident that it can pass these costs on through the access
arrangement process. As such WAGN may not have applied sufficient competitive rigour in its
tender processes and the UAFG costs may not have been minimised. Accordingly, WACOSS
considers it would be valuable to retest the tender outcomes for UAFG against a second tender, and
in particular a tender with the same tenor as the access arrangement. Further, WACOSS is
concerned that WAGN may not have incentives to apply rigour in its management of UAFG in the
network to minimise losses. As a network is renewed, UAFG should naturally fall. High UAFG in
particular segments of the network can be a signal to renew those parts of the network. WACOSS
considers that it would be appropriate to set UAFG reduction targets for WAGN's network. These
targets should represent incremental falls in UAFG in the order of 1-2 per cent per annum. Such
targets would reflect the natural falls in UAFG that can be expected as the network is renewed
through the significant capex budget that WAGN has proposed in its revised AAI. They would also
provide WAGN with further incentives to actively manage UAFG. WACOSS notes that the AER has
set UAFG forecasts or targets for networks such as the ActewAGL network. The UAFG forecasts are
under those proposed by the regulated business.49
3.6 Depreciation
WAGN has over-depreciated its assets due to significant delays in capex during the current access
arrangement period compared with the forecast capex schedule at the commencement of the
current access arrangement period.
The draft decision proposes that this over-depreciation should not be carried forward into the new
access arrangement period but should be accounted for by an “adjustment in the cost of service as
reflected in the total revenue within the reference tariff model in 2010”.50 In other words, the draft
decision proposes that the relevant asset lives should be restated at their actual asset life and
depreciated value, with the over-depreciation being taken as a reduction to revenue requirements.
49
AER ActewAGL Final Decision 2010, p. 85.
50 ERA DD, p. 87.
20
At issue are:
the appropriate level of the offsetting adjustment; and
the arrangements that should apply to future similar instances of over-depreciation.
It is difficult to determine from the Authority’s modelling whether the over-depreciation has been
adjusted for appropriately as between the current and new access arrangement periods.
WAGN proposed to adjust for the over-depreciation by reducing the amount of depreciation it
would claim during the first half of 2010 to $0.328m.51 The Authority has rejected this approach.
The Authority’s modelling appears to have added back in depreciation charges of $10.945m for 2010
(compared to the $0.328m) and reduced revenues in present value terms by $10.071m.52 The
additional depreciation allowance of $10.617m proposed by the Authority exceeds the reduction in
revenues of $10.071m. The amounts both appear to have been stated in common present value
December 2009 terms, and it is not clear why they do not equate with each other. The difference
appears to be $0.546m to the advantage of WAGN.53
The second issue is whether it is desirable that over-depreciation is permitted to occur. A regulated
company might choose to defer capex to near the end of an access arrangement period to earn
excess depreciation in the early part of the access arrangement period. It is noted that over-
depreciation occurred at the start of the current access arrangement period, with a carry-over value
of $7.206m from the access arrangement period prior to that.54 The regulated company might
choose to do this in particular where (as here) it perceives it may earn a higher real WACC in the
future access arrangement period, or for cash flow reasons.
Permitting carry-over of depreciation can also cause a level of pricing instability for customers due to
the impact of the adjustments and result in customers during the earlier access arrangement period
essentially paying more than they should to the benefit of customers in the later access arrangement
period. Prices including these adjustments will deviate from efficient levels, causing over- or under-
consumption. WACOSS considers that the Authority should avoid these problems by adjusting for
variations between forecast and actual depreciation each year.
3.7 Tax rate
NGR 76(c) provides that total revenue for each regulatory year of the access arrangement is to be
determined using the building block approach including the “estimated cost of corporate income tax
for the year” (italics added).
51
ERA DD, p. 87.
52 ERA Modelling, p. 1.
53 It is not clear whether the different values are stated in Dec 2009 terms and whether this accounts for the
difference of $0.546m.
54 ERA Modelling, p. 6.
21
The draft decision approves WAGN’s use of a corporate tax rate of 30 per cent for each year of the
access arrangement.55 WAGN notes in its AAI that it “has used the tax rate of 30 per cent in
determining the Rate of Return for the WAGN GDS *gas distribution system+”.56
There is currently a proposal from the Commonwealth Government to cut the corporate tax rate in
2013-14 for large business from 30 per cent to 29 per cent (and then to 28 per cent in 2014-15).57
The year 2013-14 is the last year of the new access arrangement period. Any cut in the corporate
tax rate would deliver a gain to WAGN compared with the assumed tax rate of 30 per cent.
WACOSS argues that the Final Decision should build in the ability to adjust the assumed corporate
tax rate if in fact the corporate tax rate is cut in 2013-14 as planned by the incumbent government.
It is clear from the words in NGR 76(c) that total revenues are to be constructed each year based on
the parameters to be applied in that year.
The choice of the taxation rate is important as it influences the real pre-tax WACC through the
derivation of the real pre-tax WACC from the nominal pre-tax WACC.58 A lower corporate tax rate is
associated with a lower investor requirement in respect of the nominal pre-tax WACC or real pre-tax
WACC. WACOSS’s modelling would suggest that applying a 29 per cent corporate tax rate in 2013-
14 would be associated with an investor requirement for a real pre-tax WACC of 6.876 per cent
compared with a real pre-tax WACC of 6.896 per cent where the corporate tax rate was 30
percent.59 These results are presented in table 4 below.
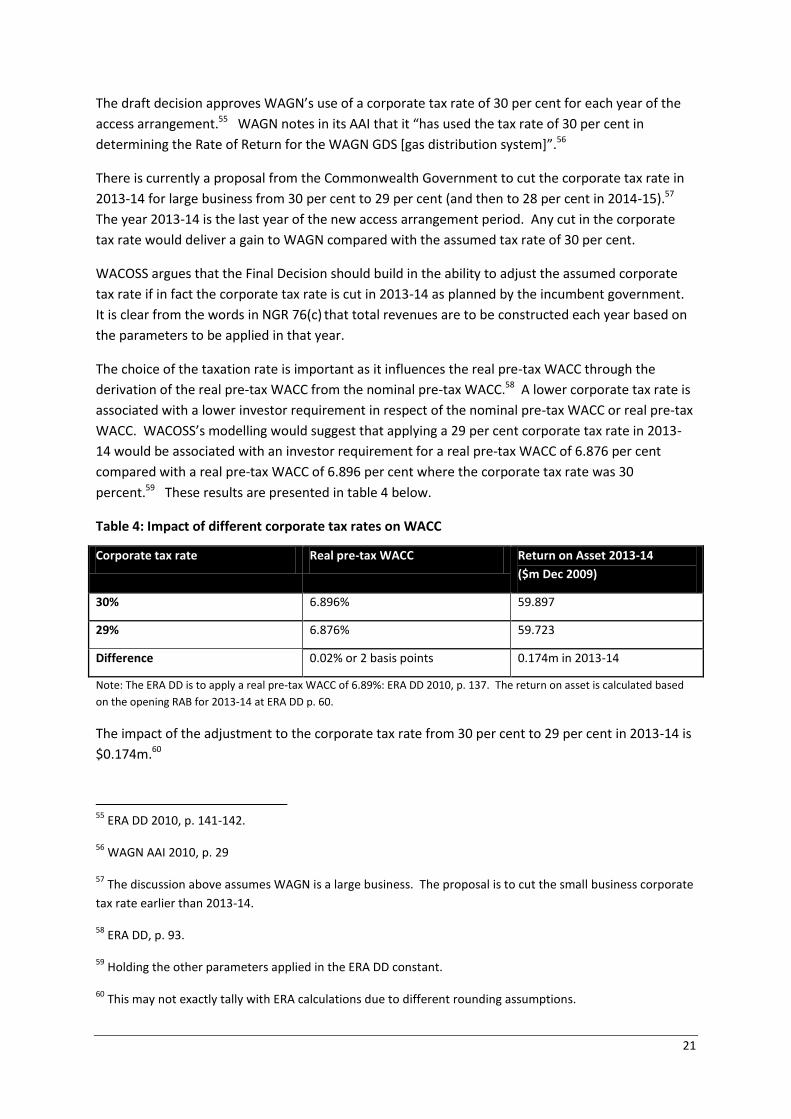
Table 4: Impact of different corporate tax rates on WACC
Corporate tax rate Real pre-tax WACC Return on Asset 2013-14
($m Dec 2009)
30% 6.896% 59.897
29% 6.876% 59.723
Difference 0.02% or 2 basis points 0.174m in 2013-14
Note: The ERA DD is to apply a real pre-tax WACC of 6.89%: ERA DD 2010, p. 137. The return on asset is calculated based
on the opening RAB for 2013-14 at ERA DD p. 60.
The impact of the adjustment to the corporate tax rate from 30 per cent to 29 per cent in 2013-14 is
$0.174m.60
55
ERA DD 2010, p. 141-142.
56 WAGN AAI 2010, p. 29
57 The discussion above assumes WAGN is a large business. The proposal is to cut the small business corporate
tax rate earlier than 2013-14.
58 ERA DD, p. 93.
59 Holding the other parameters applied in the ERA DD constant.
60 This may not exactly tally with ERA calculations due to different rounding assumptions.
22
It is recognised that the cut in the corporate tax rate may not occur. Nonetheless, the NGR does
make it clear that total revenues should be based on the parameters that apply in the relevant year.
Accordingly, the ERA DD should recognise the potential for the tax cut advocated by the
Commonwealth Government.
The Authority could recognise the tax cut by making an adjustment to the total revenue for 2013-14
of $0.174m provisional upon the tax cut being made. An alternative would be for the Authority to
make provision in the new access arrangement starting 2014-15 to claw back any gain resulting from
a cut in the corporate tax rate in 2013-14. This approach of adjusting total revenue in out-years of
the access arrangement for events that occur during those years would provide symmetry with the
pass-through provisions in the proposed access arrangement. The pass-through arrangements
permit WAGN to either pass on the costs of particular events or submit fresh access arrangements to
take account of the impact of those events.61
61
See ERA DD 2010, pp. 177-180.
23
4 Demand forecasts for B3 tariff class customers
The Authority has adopted an average demand forecast for B3 tariff customers of 18.5 GJ per
annum. WACOSS considers that this forecast appears too low, and believes that average gas
demand by B3 customers will in fact grow from current levels of about 19.12 GJ per annum to 19.5
GJ per annum by the last year of the upcoming access arrangement period.62
Since tariffs are based on a price cap approach, the forecast of 18.5 GJ per annum will lead to higher
than appropriate tariffs in circumstances where actual average B3 customer usage is above 18.5 GJ
per annum. If, for example, average B3 customer usage were to be 19 GJ per annum over the access
arrangement period then tariffs would be overstated by more than 2.6 per cent, and would be
overstated by more than 5.1 per cent if usage were 19.5 GJ per annum.
The Authority’s own analysis in the draft decision appears to be heading towards an average
consumption value per B3 customer of 19 GJ per annum. However, the Authority recommends a
reduction from this value to a value of 18.5 GJ per annum without providing specific reasons for that
adjustment.63
WACOSS considers that the lower forecast of 18.5 GJ per annum:
Is significantly below historical usage levels, and below the trend rate of marginal decline in
gas usage;
Does not incorporate appropriate recognition of the relative impact on gas demand of
relative changes in electricity prices; and,
May not have fully accounted for the effects of the GFC and self-rationing in the aftermath
of the Varanus Island explosion during 2008.
These factors are expanded upon below.
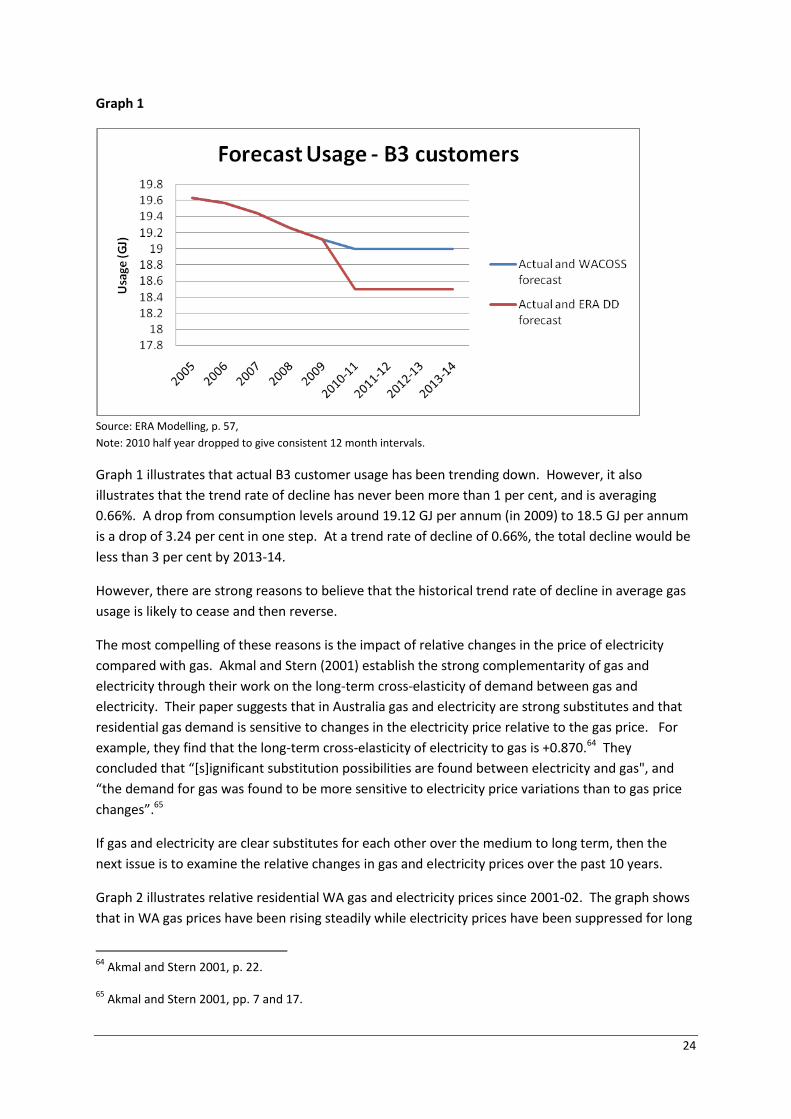
Graph 1 below illustrates trend historical and forecast consumption by B3 customers
62
Average gas demand might be expected to grow steadily from current levels around 19.12 GJ per annum to
19.5 GJ per annum in 2013-14. Changes in consumption are unlikely to be sudden.
63 ERA DD, p. 164.
24
Graph 1
Source: ERA Modelling, p. 57,
Note: 2010 half year dropped to give consistent 12 month intervals.
Graph 1 illustrates that actual B3 customer usage has been trending down. However, it also
illustrates that the trend rate of decline has never been more than 1 per cent, and is averaging
0.66%. A drop from consumption levels around 19.12 GJ per annum (in 2009) to 18.5 GJ per annum
is a drop of 3.24 per cent in one step. At a trend rate of decline of 0.66%, the total decline would be
less than 3 per cent by 2013-14.
However, there are strong reasons to believe that the historical trend rate of decline in average gas
usage is likely to cease and then reverse.
The most compelling of these reasons is the impact of relative changes in the price of electricity
compared with gas. Akmal and Stern (2001) establish the strong complementarity of gas and
electricity through their work on the long-term cross-elasticity of demand between gas and
electricity. Their paper suggests that in Australia gas and electricity are strong substitutes and that
residential gas demand is sensitive to changes in the electricity price relative to the gas price. For
example, they find that the long-term cross-elasticity of electricity to gas is +0.870.64 They
concluded that “*s+ignificant substitution possibilities are found between electricity and gas", and
“the demand for gas was found to be more sensitive to electricity price variations than to gas price
changes”.65
If gas and electricity are clear substitutes for each other over the medium to long term, then the
next issue is to examine the relative changes in gas and electricity prices over the past 10 years.
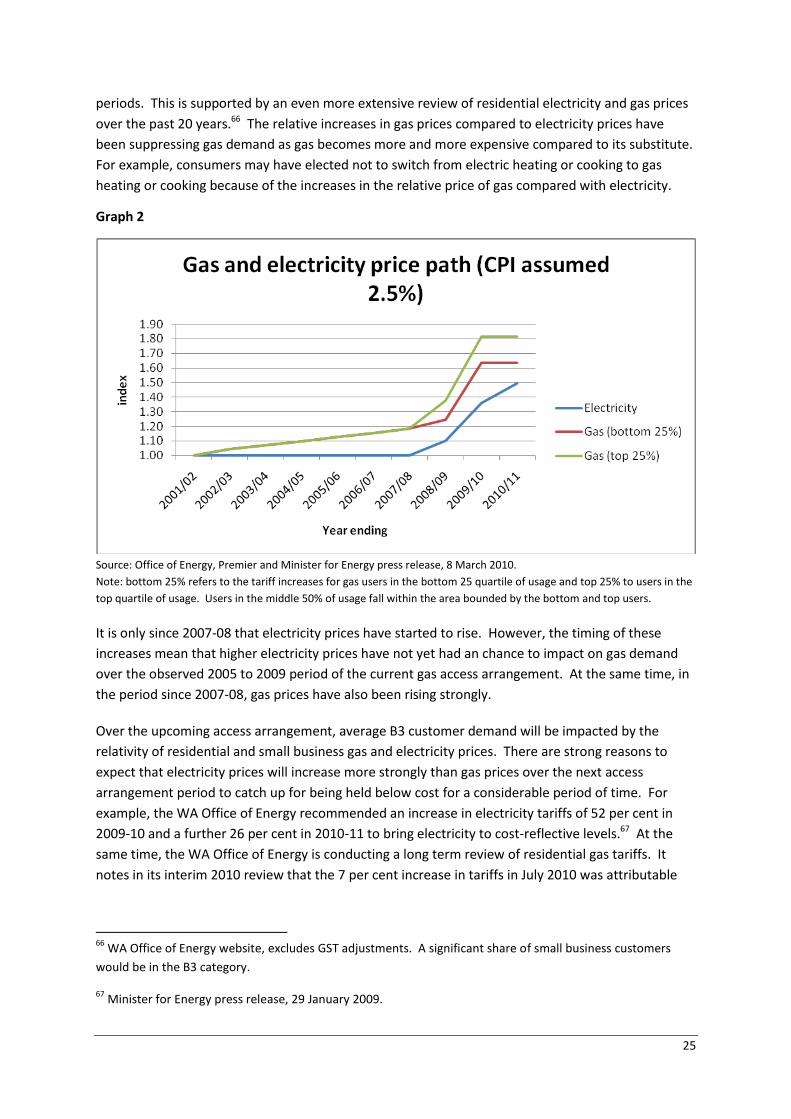
Graph 2 illustrates relative residential WA gas and electricity prices since 2001-02. The graph shows
that in WA gas prices have been rising steadily while electricity prices have been suppressed for long
64
Akmal and Stern 2001, p. 22.
65 Akmal and Stern 2001, pp. 7 and 17.
25
periods. This is supported by an even more extensive review of residential electricity and gas prices
over the past 20 years.66 The relative increases in gas prices compared to electricity prices have
been suppressing gas demand as gas becomes more and more expensive compared to its substitute.
For example, consumers may have elected not to switch from electric heating or cooking to gas
heating or cooking because of the increases in the relative price of gas compared with electricity.
Graph 2
Source: Office of Energy, Premier and Minister for Energy press release, 8 March 2010.
Note: bottom 25% refers to the tariff increases for gas users in the bottom 25 quartile of usage and top 25% to users in the
top quartile of usage. Users in the middle 50% of usage fall within the area bounded by the bottom and top users.
It is only since 2007-08 that electricity prices have started to rise. However, the timing of these
increases mean that higher electricity prices have not yet had an chance to impact on gas demand
over the observed 2005 to 2009 period of the current gas access arrangement. At the same time, in
the period since 2007-08, gas prices have also been rising strongly.
Over the upcoming access arrangement, average B3 customer demand will be impacted by the
relativity of residential and small business gas and electricity prices. There are strong reasons to
expect that electricity prices will increase more strongly than gas prices over the next access
arrangement period to catch up for being held below cost for a considerable period of time. For
example, the WA Office of Energy recommended an increase in electricity tariffs of 52 per cent in
2009-10 and a further 26 per cent in 2010-11 to bring electricity to cost-reflective levels.67 At the
same time, the WA Office of Energy is conducting a long term review of residential gas tariffs. It
notes in its interim 2010 review that the 7 per cent increase in tariffs in July 2010 was attributable
66
WA Office of Energy website, excludes GST adjustments. A significant share of small business customers
would be in the B3 category.
67 Minister for Energy press release, 29 January 2009.
26
mainly to increased wholesale gas commodity prices. It appears that residential gas prices may be at
cost reflective levels already.
If, as expected, electricity prices increase more strongly than gas prices, the long term and significant
decline in electricity prices compared with gas prices will be reversed. This trend reversal could be
expected to lead to increased gas demand for residential users during the next access arrangement
period. WACOSS argues that this should logically be reflected in the demand forecasts for gas use
for the B3 customer class over the 2010 to 2014 period.
Finally, WACOSS notes, as the draft decision does, that the GFC and the Varanus Island explosion
impacted recent gas use by residential and small business customers. The Varanus Island explosion
occurred on 3 June 2008 and constrained supply of up to 30 per cent of the WA market for at least
two months. While consumers did not face specific rationing, they were strongly encouraged to cut
back on consumption for this period. The draft decision notes the impact of the Varanus Island
explosion as the reason for averaging 2007 and 2008 data rather than relying solely on 2008 data.
However, WACOSS believes that this may understate the impact of the Varanus Island on B3
customer demand. When the trend in gas consumption over the period 2005 to 2009 is analysed,
the reduction in 2008 in B3 customer demand is significantly higher than in any other year during
the current access arrangement (-0.93 per cent compared with an average over the other three time
periods of -0.57 per cent).
WAGN’s proposal and the draft decision also touched on the fact that the GFC may have impacted
on B3 customer demand. The impact of the GFC would have been felt from late 2007 into 2009. 68When the trend reduction in B3 customer demand is analysed, the percentage reductions over
2007 to 2009 are greater than from 2005 to 2006. This is unsurprising as gas demand exhibits strong
income elasticity effects.69 In fact, the reduction in gas demand from the GFC could be said to be
surprisingly small given its impact on other areas of consumer demand.
WACOSS considers the net effects of the Varanus Island explosion and the GFC have been to reduce
B3 gas demand during the 2007 to 2009 period. These effects are unlikely to significantly affect gas
demand during the upcoming access arrangement period. In fact, since the price relativities
between gas and electricity have favoured gas since 2009, demand for gas by B3 customers is likely
to actually reverse the downward trend and start to increase.
In summary, WACOSS considers that B3 gas demand over a long period has been suppressed by low
electricity prices. This, in conjunction with other market factors such as improved efficiency of
appliances, has created a long-term downward trend in gas demand among B3 customers.
However, underlying B3 customer demand for gas will increase in trend terms as electricity prices
rise relative to gas prices. This trend is already likely to have taken hold during the current access
arrangement period, but been masked by short term factors such as the GFC and the Varanus Island
explosion. As these short term factors recede, gas demand among B3 customers could expect to
increase. For all these reasons, WACOSS argues that demand forecast for B3 customers should be
68
ERA DD, pp. 106-107.
69 Akmal and Stern 2001, p. 22. The income price elasticity for gas is found to be 1.882.

27
set to rise to around 19.5 GJ per annum by 2013-14. Adjusting estimated usage from 18.5 GJ per
annum to 19.5 GJ per annum would reduce B3 tariffs by around 5.4% in 2013-14.70
70
(19.5-18.5)/18.5*100%
28
5 Revenue allocation to B3 tariff class customers
WACOSS considers that under the suggested tariffs in the draft decision (and in WAGN’s original and
revised approach), B3 tariff customers shoulder an unreasonable share of the total annual revenue
requirement. It is arguable that the revenue allocation to B3 tariff customers breaches NGR 94 and
the WA Local Provisions Regulations. There are also strong social and economic reasons to
rebalance tariffs so that the other four tariff classes pay a higher share of the total annual revenue
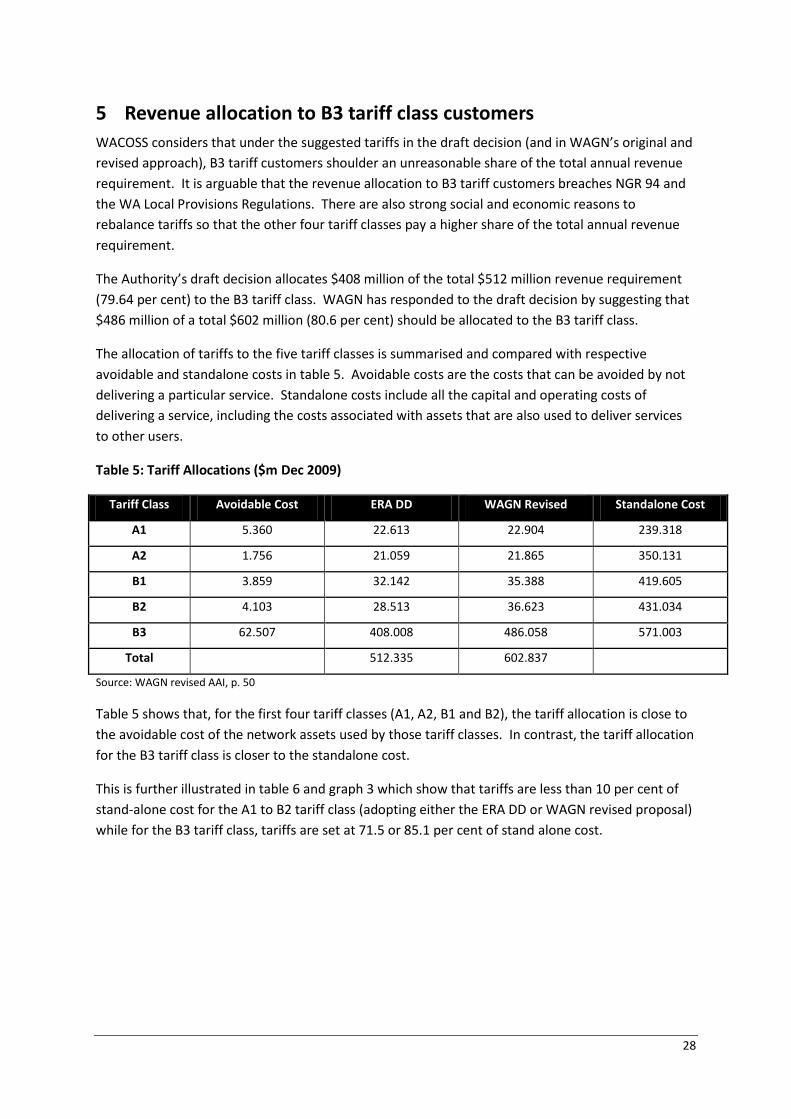
requirement.
The Authority’s draft decision allocates $408 million of the total $512 million revenue requirement
(79.64 per cent) to the B3 tariff class. WAGN has responded to the draft decision by suggesting that
$486 million of a total $602 million (80.6 per cent) should be allocated to the B3 tariff class.
The allocation of tariffs to the five tariff classes is summarised and compared with respective
avoidable and standalone costs in table 5. Avoidable costs are the costs that can be avoided by not
delivering a particular service. Standalone costs include all the capital and operating costs of
delivering a service, including the costs associated with assets that are also used to deliver services
to other users.
Table 5: Tariff Allocations ($m Dec 2009)
Tariff Class Avoidable Cost ERA DD WAGN Revised Standalone Cost
A1 5.360 22.613 22.904 239.318
A2 1.756 21.059 21.865 350.131
B1 3.859 32.142 35.388 419.605
B2 4.103 28.513 36.623 431.034
B3 62.507 408.008 486.058 571.003
Total 512.335 602.837
Source: WAGN revised AAI, p. 50
Table 5 shows that, for the first four tariff classes (A1, A2, B1 and B2), the tariff allocation is close to
the avoidable cost of the network assets used by those tariff classes. In contrast, the tariff allocation
for the B3 tariff class is closer to the standalone cost.
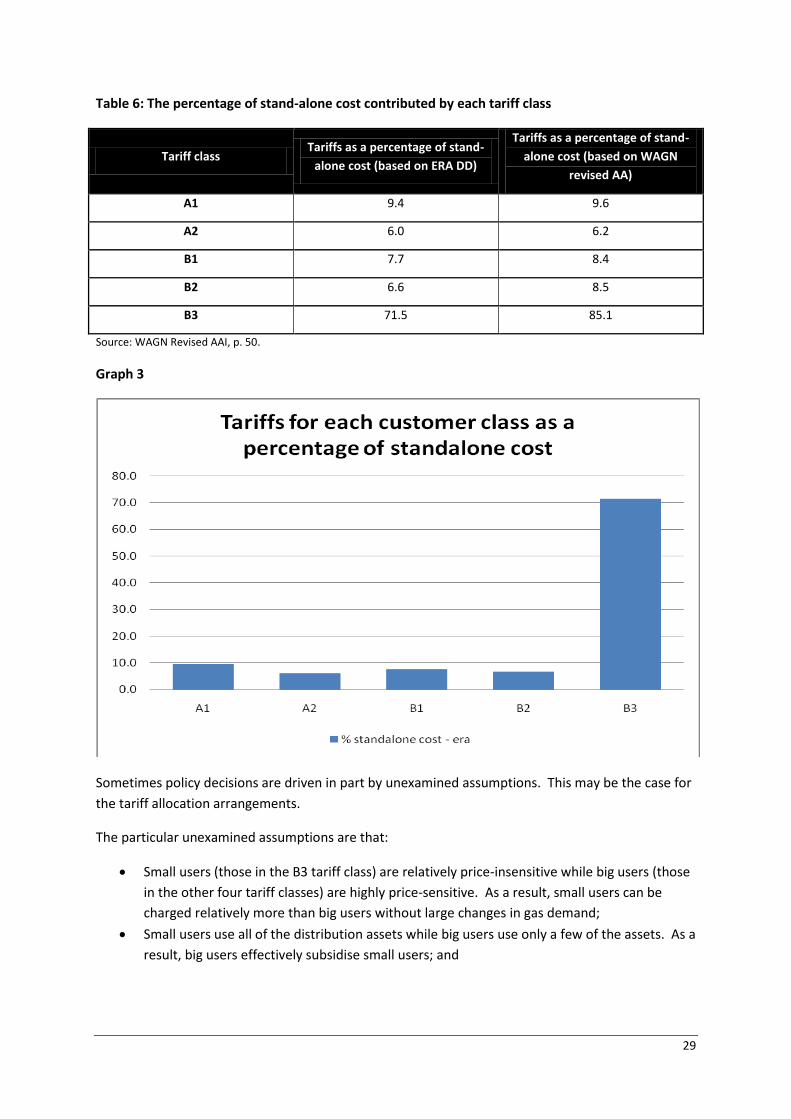
This is further illustrated in table 6 and graph 3 which show that tariffs are less than 10 per cent of
stand-alone cost for the A1 to B2 tariff class (adopting either the ERA DD or WAGN revised proposal)
while for the B3 tariff class, tariffs are set at 71.5 or 85.1 per cent of stand alone cost.
29
Table 6: The percentage of stand-alone cost contributed by each tariff class
Tariff class Tariffs as a percentage of stand-
alone cost (based on ERA DD)
Tariffs as a percentage of stand-
alone cost (based on WAGN
revised AA)
A1 9.4 9.6
A2 6.0 6.2
B1 7.7 8.4
B2 6.6 8.5
B3 71.5 85.1
Source: WAGN Revised AAI, p. 50.
Graph 3
Sometimes policy decisions are driven in part by unexamined assumptions. This may be the case for
the tariff allocation arrangements.
The particular unexamined assumptions are that:
Small users (those in the B3 tariff class) are relatively price-insensitive while big users (those
in the other four tariff classes) are highly price-sensitive. As a result, small users can be
charged relatively more than big users without large changes in gas demand;
Small users use all of the distribution assets while big users use only a few of the assets. As a
result, big users effectively subsidise small users; and
30
Therefore, it is possible and desirable to rebalance tariffs to eliminate these cross-subsidies
and move towards cost-reflectivity by charging a high share of the total revenue
requirement to small users.
In fact, WACOSS would argue that:
Small users are highly price-sensitive, particularly over the medium term (discussed further
below) and over a threshold level of usage.71 There is no reason to suspect big users are
more price-sensitive than small users;
Small users and big users alike use many of the assets within a distribution network. This
can be seen from table 5 which shows that the stand-alone cost of every tariff class is a
major percentage of the total revenue requirement (for example, on WAGN’s figures, the
standalone cost of providing services to the B1 tariff class is $431 million out of a total cost
of $602 million). Clearly, all tariff classes use most of the network assets and on this
measure it is clear that big users are not subsidising small users;
For the WAGN network, small users pay close to the standalone cost of the assets they use,
while big users pay close to the avoidable cost of the assets they use. On this basis, small
users are likely to be subsidising big users; and, big users have the potential to be the more
significant drivers of both business-as-usual and expansion capex spending. This means that
in terms of forward-looking measures of pricing efficiency such as LRMC there is a case for
big users to face higher tariffs to reflect their relative contribution to increases in the cost of
service. On this basis, it is clearly arguable that small users are significantly subsidising big
users, with resulting losses in efficiency.
WACOSS believes the available evidence tends to suggest that small users are cross-subsidising big
users. This view can be tested by:
comparing the WAGN network with other networks; and
examining whether WAGN is charging each tariff class at or near its LRMC. LRMC is a
measure of cost-reflectivity for customers.
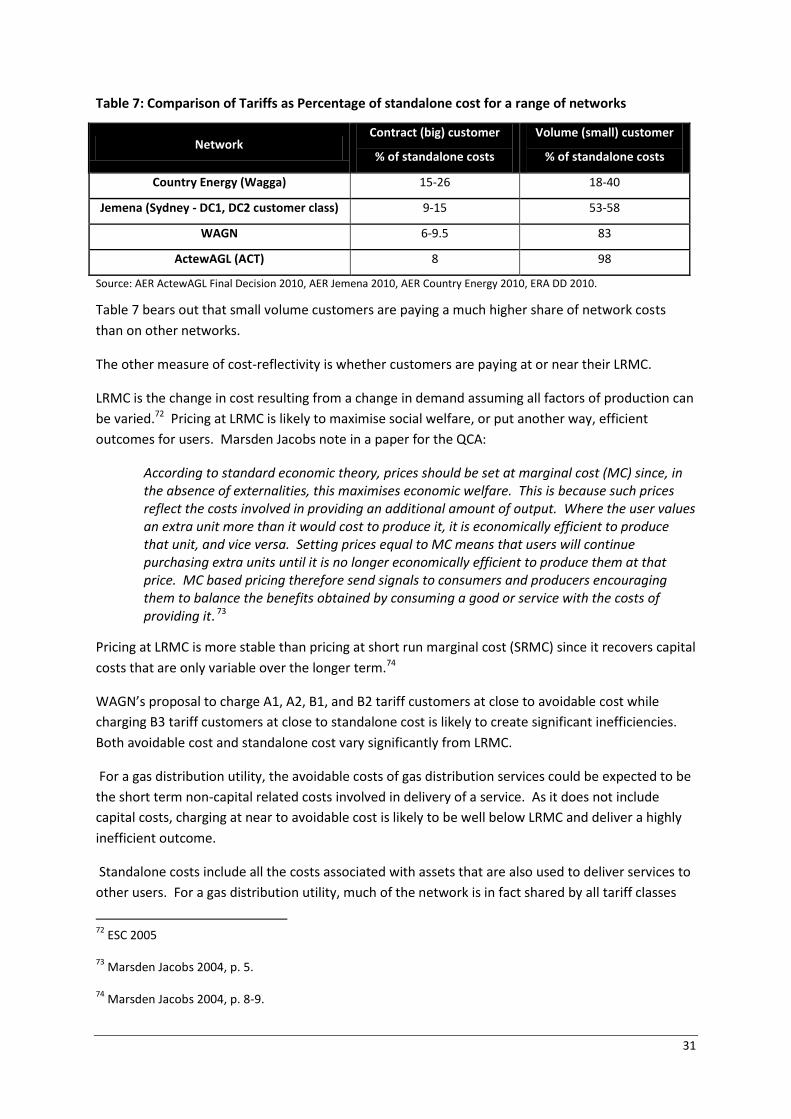
Table 7 compares tariffs for contract (big) and volume (small) customers on a range of Australian gas
distribution networks. It shows that volume customers pay a significantly lower share of the total
revenue requirement on the Country Energy and Jemena Sydney networks than on the WAGN
network. It is noted that on the ActewAGL network, volume customers pay a higher percentage of
standalone cost than on the WAGN network. However, that network is quite different in the sense
that it is relatively new, has few big customers, and is seeking to expand the number of big
customers. This is very different to the WAGN network.
71
It is noted that below a certain threshold level, residential use tends to be less discretionary or price-
sensitive. In these circumstances, high prices could force low income consumers into either a debt spiral or
into a level of ‘under-consumption’ associated with health or other problems.
31
Table 7: Comparison of Tariffs as Percentage of standalone cost for a range of networks
Network Contract (big) customer
% of standalone costs
Volume (small) customer
% of standalone costs
Country Energy (Wagga) 15-26 18-40
Jemena (Sydney - DC1, DC2 customer class) 9-15 53-58
WAGN 6-9.5 83
ActewAGL (ACT) 8 98
Source: AER ActewAGL Final Decision 2010, AER Jemena 2010, AER Country Energy 2010, ERA DD 2010.
Table 7 bears out that small volume customers are paying a much higher share of network costs
than on other networks.
The other measure of cost-reflectivity is whether customers are paying at or near their LRMC.
LRMC is the change in cost resulting from a change in demand assuming all factors of production can
be varied.72 Pricing at LRMC is likely to maximise social welfare, or put another way, efficient
outcomes for users. Marsden Jacobs note in a paper for the QCA:
According to standard economic theory, prices should be set at marginal cost (MC) since, in the absence of externalities, this maximises economic welfare. This is because such prices reflect the costs involved in providing an additional amount of output. Where the user values an extra unit more than it would cost to produce it, it is economically efficient to produce that unit, and vice versa. Setting prices equal to MC means that users will continue purchasing extra units until it is no longer economically efficient to produce them at that price. MC based pricing therefore send signals to consumers and producers encouraging them to balance the benefits obtained by consuming a good or service with the costs of providing it. 73
Pricing at LRMC is more stable than pricing at short run marginal cost (SRMC) since it recovers capital
costs that are only variable over the longer term.74
WAGN’s proposal to charge A1, A2, B1, and B2 tariff customers at close to avoidable cost while
charging B3 tariff customers at close to standalone cost is likely to create significant inefficiencies.
Both avoidable cost and standalone cost vary significantly from LRMC.
For a gas distribution utility, the avoidable costs of gas distribution services could be expected to be
the short term non-capital related costs involved in delivery of a service. As it does not include
capital costs, charging at near to avoidable cost is likely to be well below LRMC and deliver a highly
inefficient outcome.
Standalone costs include all the costs associated with assets that are also used to deliver services to
other users. For a gas distribution utility, much of the network is in fact shared by all tariff classes
72
ESC 2005
73 Marsden Jacobs 2004, p. 5.
74 Marsden Jacobs 2004, p. 8-9.
32
(for example the high pressure backbone of the network).75 As a result, charging one tariff class at
or near standalone costs will result in that tariff class paying well above the efficient prices indicated
by LRMC for that tariff class.
This implies that by charging B3 customers well above LRMC (i.e. near standalone cost) while
charging other customers well below LRMC (i.e. near avoidable cost), small users are significantly
cross-subsidising big users.
In the fact of this, the main argument to justify such cross-subsidies for big users would be that big
users are more price-sensitive (price-elastic) than small users, and therefore require discounts to
LRMC in order to achieve efficient levels of use. However, the available evidence suggests that
residential gas users are in fact highly price sensitive. Akmal and Stern (2001) provide evidence that
the long-term own price-elasticity of domestic gas customers across Australia is high (-0.702).76 In
fact, gas is still growing relative to other energy sources, and in a more mature market the own
price-elasticity of gas might be closer to -1. In addition, B3 customers have increased their
disconnection rates significantly in recent times in response to higher prices, and have substitutes
such as bottled LPG.77
In preference to charging B3 customers at close to standalone cost, WACOSS argues that total
revenues should be allocated to customers based on the LRMC of serving these customers. This
would result in a fairer allocation of annual revenue to B3 customers.7879
WACOSS believes moving tariffs for B3 customers towards LRMC is within the legislative
requirements of the NGL and NGR.
The relevant legislative and regulatory requirements are contained in NGR 94 and the WA Local
Provisions Regulations.
Local Provisions regulation 7 provides that when exercising discretion, the regulator must take into
account the impact on small use customers, including the method of determining the tariffs. This
applies despite anything in the NGL or NGR, and in addition to anything in the NGL or NGR. This
means that it applies in addition to any provision that the discretion of the regulator is limited.
The provisions apply to B3 tariff customers as they fall within the definition of small use customers
contemplated by regulation 7.
75
From table 5, it is clear that even A1 customers use around 40 per cent of total network assets while B2
customers use around 72 per cent and B3 customers use around 95 per cent of total assets. Compare also
Narayan, Paresh Kumar and Russell Smyth 2005.
76 Akmal and Stern 2001, p. 22.
77 Depending on the level of tariffs.
78 Marsden Jacobs 2004, p. 16.
79 Compare Marsden Jacobs 2004, pp. 12-13.
33
NGR 94 provides that:
(i) Tariffs should be between standalone cost and avoidable cost.
(ii) The tariff must take account of LRMC
(iii) The tariff must have regard to transaction costs
(iv) The tariff must have regard to whether the relevant tariff class are able or likely to
respond to price signals
(v) Tariffs must be adjusted to ensure recovery of expected revenue with minimum distortion
to efficient patterns of consumption.
It is noted that one of the guiding principles of NGR 94 is that tariffs should be between standalone
cost and avoidable cost. Arguably, the power to set prices between standalone and avoidable cost
in NGR 94 was granted to permit Ramsay pricing arrangements (that is, the ability to charge a
different price to different consumers in order to maximise consumption). Having recognised this,
there is also a specific obligation that tariffs must take account of the other range of factors listed in
NGR 94, namely LRMC, transactions costs, the price-sensitivity of customers, and a concern that
tariffs should be set with minimum distortion to efficient patterns of consumption. It is considered
that these other factors provide guidance on where tariffs should be set in the broad range between
standalone cost and avoidable cost. These factors show a clear concern that tariffs should achieve
demand and supply efficiency (charging users no more than it costs to produce a unit of service
while enabling the supplier to earn sufficient revenue to sustain services required by customers). As
discussed above, tariffs close to LRMC are most likely to deliver demand and supply efficiency.
WACOSS recognises that the regulator has limited discretion to remake the tariffs proposed by the
service provider. However, at the same time, it is noted that:
the WA local provisions impose a positive obligation to consider the impact of tariffs on
small use (B3) customers; and
there is an obligation under NGR 94 to demonstrably have regard to all the factors in NGR
94.
In any event, it is noted that the draft decision significantly changes the B3 tariffs (and other tariffs)
proposed by WAGN.
Therefore, WACOSS considers NGR 94 and Local Provision regulation 7 do give the regulator to
intervene to move tariffs towards more efficient outcomes.
Unfortunately, the information is not available for stakeholders to determine LRMC for any of the
tariff classes.
However, WACOSS believes that the Authority could access this information. Given that LRMC
pricing would result in a fairer allocation of annual revenue to B3 consumers, WACOSS believes that
the Authority should estimate LRMC and move tariffs towards LRMC pricing over time.
34
6 B3 tariff structure
WACOSS is concerned about the structure of the B3 tariff.
The draft decision proposes to restructure the B3 tariff from the current arrangements by setting a
higher standing charge (up from $28.59 to $50.09 – a 75 per cent increase) coupled with a flat usage
charge (compared with the current three declining block prices). WAGN’s revised access
arrangement proposes to retain two declining block prices. Table 8 summarises the tariff structures
for the 2010/11 year.
Table 8: Comparison of tariff structures for 2010/11 year
Tariff Current ERA DD WAGN revised AA
Standing charge ($) 28.59 50.09 63.14
Usage charge per GJ ($) 9.50 (under 15 GJ) 6.80 (all usage) 13.43 (under 10 GJ)
5.69 (15-45 GJ) 5.80 (over 10 GJ)
3.86 (over 45 GJ)
Graph 4 below illustrates that compared to the current arrangement, the draft decision shifts more
of the burden of revenue collection within the B3 category on to the smallest users within the B3
tariff class. Even though average prices are set to fall under the draft decision, users on the B3 tariff
using less than 8 GJ would pay more under the Authority’s draft decision than under the current
tariff structure.
Graph 4
WACOSS believes that there are good social and economic arguments from the current B3 tariff
structure towards one with a lower standing charge and ascending (or inclining) block prices.
35
WACOSS’s proposal would be to impose a standing charge around $30 (similar to the present
standing charge) and include two ascending block prices. The first block could be set a little under
the average usage level, say 15 GJ. The second block price could, for example, be 15 per cent higher
than the first block price, with the usage charges for both blocks calculated to deliver the necessary
revenue requirement for the B3 tariff class.
WACOSS is aware of the economic argument for a high standing charge coupled with a low usage
charge, namely, that the fixed costs of serving gas distribution customers (including B3 customers)
are relatively high and the variable usage costs are relatively low. However, this argument overlooks
the economic efficiencies and social welfare benefits that could result from a tariff structure with a
lower standing charge plus ascending block prices.
First, a relatively lower standing charge would provide low income and vulnerable users who
struggle to pay their gas bills (and have few options to reduce usage) with greater options to access,
maintain, and afford a gas connection (Moreover all small usage customers within the B3 tariff
would certainly be much better off under such a proposal). All B3 customers would be able to
connect at a relatively lower price and could more easily afford to maintain their connection by
reducing usage. This should result in fewer disconnections and an improvement in social welfare.
Currently, the WAGN network is experiencing a high level of disconnection. For Alinta, residential
disconnections rose in 2008/09 from 2.3 per cent to 2.9 per cent of the residential customer base.80
This disconnection rate is high compared to interstate networks. The disconnection rate of 2.9 per
cent exceeds the historical disconnection rates in NSW, Victoria, and South Australia, and is only
lower than the ACT in a comparison of five jurisdictions. 81 Historical Victorian disconnection rates
are around 0.5 to 0.8 per cent, less than a quarter of the WA rates in 2008/09. The draft decision’s
proposal to increase the standing charge by 75 per cent from $28.59 to $50.09 is only likely to
accelerate the already very high disconnection rate among B3 tariff customers. In fact, the high
standing charges and declining block tariffs proposed by the Authority and WAGN may lock out low
income customers, especially those that have been previously disconnected.
Second, ascending block tariffs better allocate the costs associated with growth in demand among
consumers. Higher use consumers pay an additional amount for that portion of growth that they
create. Indirectly, ascending block tariffs can provide better signals for setting forward capex
budgets. WACOSS notes that a number of electricity distributors in Australia have proposed
ascending block tariffs for this reason.82 NSW, for example, now has ascending retail block tariffs for
electricity.83
80
ERA 2010b, p. 7.
81 See, for example, AER 2009, figure 11.9, p. 310.
82 For example, NSW electricity distributors in their submissions to the 2004 price review: IPART website
83 See, for example EnergyAustralia’s retail tariffs at
http://www.ipart.nsw.gov.au/files/Energy%20Australia%20Regulated%20Retail%20Price%20List%20-
%20July%202010.PDF, which has two blocks, with the lower block set at use up to 1750 kWh in a quarter.
36
Third, an ascending block approach could provide environmental benefits by encouraging lower
usage, especially in relation to discretionary use. This is because additional units of consumption are
at higher prices, rather than the current situation of being at lower prices. This incentive aligns with
proposals to introduce carbon prices to the energy sector (either in isolation or as part of an
economy-wide price).
Fourth, the ascending block tariff approach aligns with the current retail price structure. This
consists of two price blocks, one for usage under 15 GJ per annum and a second for usage over 15 GJ
per annum.84
Fifth, the fact that WAGN has proposed two blocks would suggest that the transactions costs
associated with two blocks compared with one block are not significant. It is understood that the
retailers have sophisticated billing systems that could support ascending block tariffs.
Fifth, high marginal prices per GJ at low usage levels may encourage some users, in particular new
users, to adopt bottled LPG rather than distributed natural gas. 85 Analysis based on WAGN’s revised
prices would indicate it is cheaper to use bottled LPG than distributed natural gas up to around 15 GJ
per annum.86
Ascending block tariffs as a form of differential pricing are likely to maximise social welfare by
minimising the distortions to efficient usage. Low income customers are more sensitive to prices
and have stronger marginal incentives to reduce use compared to high income customers (and as
noted elsewhere, the average own price elasticity of residential gas customers is a high -0.702). As a
result, price variation through an ascending block tariff approach would be likely to increase usage
by more price elastic low income customers.87
WACOSS notes that the Government has expressed interest in applying inclining block tariff
structures in the energy market in WA. The Minister for Energy released a press statement on 19
March 2010 announcing that the Government would investigate alternative pricing models for
84
Noting that the exact retail blocks vary at 15.768 GJ per annum.
85The Queensland Competition Authority (QCA) in its Review of Small Customer Gas Pricing and Competition in
Queensland analysed the usage levels at which customers would use bottled LPG rather than distributed
natural gas. The QCA found that it was cheaper, in the Queensland market, for customers using 5 GJ or less
per annum to use bottled LPG (QCA 2008, figure 6.1, p. 51).
86 The cost of bottled LPG is based on a customer hiring two LPG 45 kg cylinders at $56 rental per year and filling them with
88 litres of LPG at $81.50 each: Kleenheat WA contact centre, conversation 16 June 2010. A litre of LPG is assumed to
have an energy content of 26.5 MJ: ABARE 2010, p. ix.
87Body of Knowledge on Infrastructure Regulation, Tariff Design: Economics of Tariff Design – Deviations from
Marginal Cost Pricing: Ramsey Pricing, accessed at http://www.regulationbodyofknowledge.org/chapter5/narrative/02/02/

37
electricity.88 WACOSS is currently working on a project with the WA Office of Energy considering
applying ascending block tariffs in electricity pricing.
In summary, these social and economic benefits of a lower standing charge plus ascending block
prices as proposed by WACOSS would encourage usage of the network by a wider range of
residential and small business customers. This would provide greater economies of scale and a more
diverse and secure income stream to WAGN. For example, more low income users and more small
users within the B3 tariff class would connect to the gas network. As a result, WAGN would be able
to spread revenue collection over a wider customer base and provide services at lower risk and
WACC.
88
Ministerial Media Statement: Review of electricity pricing to help ease financial pressure on WA households,
Peter Collier, The Government of Western Australia, 19 March 2010, accessed 4 November 2010
http://www.mediastatements.wa.gov.au/Pages/Results.aspx?ItemId=133249

38
Bibliography
ABARE 2010 (Arif Syed, Jane Melanie, Sally Thorpe and Kate Penney), Australian Energy Projections
to 2029-30, Research Report 10.02, March.
AER 2009, State of the Energy Market 2009, December.
AER WACC Review 2009, Final Decision: Electricity transmission and distribution network service
providers Review of the weighted average cost of capital (WACC) parameters, May.
AER ETSA 2010, Final Decision, South Australia: Distribution Determination 2010-11 to 2014-15, May.
AER ActewAGL Draft Decision 2009, Draft decision– ACT, Queanbeyan and Palerang gas distribution
network, 1 July 2010–30 June 2015, November.
AER ActewAGL Final Decision 2010, Final decision– ACT, Queanbeyan and Palerang gas distribution
network, 1 July 2010–30 June 2015, March.
Akmal and Stern 2001, Residential Energy Demand in Australia: an Application of Dynamic OLS,
October. Accessible at http://dspace.anu.edu.au/bitstream/1885/40556/1/eep0104.pdf
Alinta website, www.alinta.net.au
Allen Consulting Group 2004, Debt and Equity Raising transaction costs: Final Report to ACCC,
December.
Body of Knowledge on Infrastructure Regulation, Tariff Design: Economics of Tariff Design –
Deviations from Marginal Cost Pricing: Ramsey Pricing, accessed at
http://www.regulationbodyofknowledge.org/chapter5/narrative/02/02/
ERA FD 2005, Final Decision on the Proposed Revisions to the Access Arrangement for the Mid-West
and South-West Gas Distribution Systems, July.
ERA 2010, 2008/09 Annual Performance Report: Gas Trading Licences, March.
ERA DD 2010, Draft Decision 2010 on WA Gas Networks Revisions Proposal for the access
arrangement for the Mid-West and South-West Gas Distribution Network, August.
ERA Modelling, Draft Decision 2010 on WA Gas Networks Revisions Proposal for the access
arrangement for the Mid-West and South-West Gas Distribution Network, Appendix 2 - Authority’s
Reference Tariff Model (Public Version), August.
ESC 2005, LRMC workshop, accessed at http://www.esc.vic.gov.au/NR/rdonlyres/041DF3E6-8E3B-
47DA-9E76-7489B1218097/0/ LRMCWorkshop20051020.ppt
Frontier 2010, Review of application of New Capital Expenditure Criteria to the WA Gas Networks
Gas Distribution Systems, June.
IPART website, http://www.ipart.nsw.gov.au/electricity/electricity_details_05.asp.
Marsden Jacobs 2004, Estimation of Long Run Marginal Cost (LRMC), November, accessed at
http://www.qca.org.au/files/QCALRMCFinal.pdf.
39
Minister for Energy press release (29 January 2009), Electricity tariff report released.
Minister for Energy press release (19 March 2010), Review of electricity pricing to help ease financial
pressure on WA households
Narayan, Paresh Kumar and Russell Smyth 2005, The residential demand for electricity in Australia:
an application of the bounds testing approach to cointegration , Energy Policy Volume 33, Issue 4,
March, pp. 467-474.
Premier and Minister for Energy press release (8 March 2010), State Government announces
increases in tariff arrangements.
QCA 2008, Review of Small Customer Gas Pricing and Competition in Queensland.
WAGN Access Arrangement 2010, January.
WAGN Access Arrangement Information 2010, January.
WAGN Amended AAI 2010, October
WAGN Submission 2010, January.
WAGN Submission to DD 2010, October.
WAGN Submission to DD – Annexure 1 2010, October.
WA Office of Energy Report to the Minister for Energy 2009, Electricity Retail Market Review - Final
Recommendations Report; Review of Electricity Tariff Arrangements, January.
WA Office of Energy, http://www.energy.wa.gov.au/2/3263/64/electricity_tariff_increases.pm,
accessed 11 October 2010.
WA Office of Energy 2008, Gas Tariffs Review: Interim Report, June.
WA Office of Energy 2009, Gas Tariffs Review: Interim Report, June.
WA Office of Energy 2010, Gas Tariffs Review: Interim Report, March.