wa7890008967, revision 9 part vi, postclosure unit 1 june
TRANSCRIPT

WA7890008967, Revision 9 Part VI, Postclosure Unit 1
June 29, 2011 300 Area Process Trenches
Addendum D; Groundwater Monitoring Plan
Addendum D 300 Area Process Trenches Groundwater Monitoring Plan

SUPPORTING DOCUMENT
2. TitLe
Groundwater Monitoring Plan for the 300 Area Process Trenches 5. key Wards
RCRA, Final Status, Compliance Monitoring
7. Abstreoet
I 1. Totll Pa;es f 5'9'
3. Nl.llber 4. Rav Na.
WHC-SD-EN-AP-185 0
6. Auttlor
N~; J. W. lindberg C. J. Chou V. G.A Johnson ()l!jl..-
~ Ul..DY~ ., .. 11 .. ,
This document outlines the groundwater monitoring plan, under RCRA regulations in 40 CFR 264 Subpart F and WAC 173-300-645, for the 300 Area Process Trenches. The 300 Area Process Trenches will go into final status in September 1995 and sampled under a compliance monitoring program. This plan provides current program conditions and requirements.
8. RELEASE STAMP

i~ i .;. .. -~
WHC-SO-rN-AP-185, Rev. 0
CONTENTS
1. 0 INTRODUCTION . . . . . . . . . . . . . . . • . • • . . . 1-1 1.1 HISTORY OF GROUNDWATER MONITORING AT THE 300 APT . • . 1-1 1.2 CHANGES FROM INTERIM-STATUS GROUNDWATER MONITORING • • • . l-2
2.0 FACILITY DESCRIPTION AND OPERATION HISTORY . . . 2-1
3.0
4.0
HYDROGEOLOGY AND GROUNDWATER MONITORING RESULTS 3.1 GEOLOGY ............. .
3.1.1 Holocene Surficial Deposits 3.1.2 Hanford Formation ...• 3.1.3 Ringold Formation ... 3.1.4 Saddle Mountains Basalt
3.2 GROUNDWATER HYDROLOGY . . . . 3.2.1 Aquifers ....•... 3.2.2 Aquifer Propert1es ... 3. 2. 3 Groundwater Flow . . • •
3.3 GROUNDWATER CONTAMINATION HISTORY .......... . 3.3.1 Geohydrology and Ground-Water Quality Beneath the
300 Area, Hanford SHe, Washington ..••... 3.3.2 Perchloroethylene Plume ............ . 3.3.3 Early Resource Conservation and Recovery Act of
1976 Monitoring ....•.....•...... 3.3.4 Recent Resource Conservation and Recovery Act of
1976 Groundwater Monitoring ..•........ 3.4 CONCEPTUAL MODEL FOR LOCALIZED noEEP" AQUIFER OCCURRENCE OF
CHLORINATED HYDROCARBONS ........ .
GROUNDWATER MONITORING PROGRAM . . . . . . . . . . . 4.1 OBJECTIVES OF GROUNDWATER MONITORING PROGRAM . 4.2 DANGEROUS WASTE CONSTITUENTS 4.3 GROUNDWATER MONITORING WflLS 4.4 COMPLIANCE MONITORING ...
4.4.1 Concentration Limits 4.4.2 Point of Compliance 4.4.3 Compliance Period .
4.5 SAMPLING AND ANALYSIS .•.... 4.5.1 Constituents to be Analyzed 4.5.2 Background Values ..•.. 4.5.3 Sample Frequency ...... . 4.5.4 Analytical Procedures .......... . 4.5.5 Geochemical Evaluation of Iron and Manganese .
4.6 STATISTICAL METHODS ..... 4.6.1 Tolerance Intervals ..•..••••.. 4.6.2 Confirmation Sampling ......... . 4.6.3 Non-detects . . . . . . . . . . . . . . . . ... 4. 6. 4 Out 1 i ers . . . . . . . . . . . . . . . . . .
4.7 DE1£RMINING RATE AND DIRECTION OF GROUNDWATER FLOW .
; i i
3-1 3-1 3-1
3-11 3-12 3-13 3-14 3-14 3-14 3-18 3-21
3-21 3-22
3-22
3-31
3-43
4-1 4-1 4-3 4-9 4-9
4-12 4-12 4-12 4-13 4-13 4·14 4-14 4-15 4-16 4-16 4-18 4-19 4-20 4-20 4-21

WHC-SD-EN-AP-185, Rev. 0
CONTENTS {cont.)
5.0 DATA MANAGEMENT AND REPORTING ..... 5.1 DATA VERIFICAliON AND VALIDATION . 5.2 REPORTING .....
6.0 CORRECTIVE ACTION PROGRAM
7.0 REFERENCES •.......
APPENDICES
A. Summary of Constituents Sampled to 1988
B. Analytical Data, May 1986 - June 1988 .
C. Concentration vs. Time Plots for Detected Constituents and Constituents Exceeding MCls ...... .
D. Well Construction and Completion Summaries ....... .
iv
5-1 5-1 5-1
6-1
7-1
A-1
B-1
C-1
D-1

WHC-SD-EN-AP-185, Rev. 0
LIST OF FIGURES
2-1. Location of the 300 Area and the Hanford Site 2-2
2-2. locations of Main Facilities in the 300 Area . 2-3
2-3. Schematic Cross Section of the 300 Area Process Trenches 2-4
2-4. Topography in the vicinity of the 300 Area Process Trenches 2-5
3-L location Map of 300 Area Wells . . . . . . 3-2
3-2. Generalized Geologic Process Trenches
Column for the 300 Area Near the
3-3. Location Map for the Geologic Cross Sections
3-4. Geologic Cross Section A-A'
3-5. Geologic Cross Section B-B'
3-6. Geologic Cross Section C"·C'
3-7. General lzed Hydrogeology Comparison of Geologic and Hydrologic Units in the 300 Area .....
3-8. 300 Area Water Table Map, September 20-21, 1994
3-9. 300 Area Water Table Map. June 22-23, 1994
3-10.
3-11.
Location Map for Wells Used in and Band 1979 . . . . . . . .
Locations of Monitoring Wells 1986 and 1987 ...•...
the Study by Lindberg
Added to the Network in
3-12. Locations of Monitoring Wells in Cut·rent Network
3-13. Trichloroethene
3-14. CIS 1,2-Dichloroethene Plume
3-15. Uranium Plume
4-1. A Statistical Perspective of the Sequence of Groundwater Monitoring Requirements Under the Resource Conservation and Recovery Act of 1976 . . . .......... .
4-2. Locations of Monitoring Wells Proposed for the Revised 300 Area
3-6
3-7
3-B
3-9
3-10
3-15
3-19
3-20
3-23
3-32
3-33
3-40
3-41
3-42
4-2
Process Trenches Groundwater Monitoring Plan . . . . . 4-11
4-3. Profiles of Eh, Dissolved Oxygen, and Ferrous Ion with Depth . . 4-17
v

WHC-SD-EN-AP-185, Rev. 0
LIST OF TABLES
2-1. An Estimate of Chemicals Discharged to the 300 Area Process Trenches Prior to February 1, 1985 • • • . . . . • • 2-6
3-1. Characteristics of 300 Area Wells 3-3
3-2. Hydraulic Conductivities Estimated from Aquifer Tests in Wells Near the 300 Area Process Trenches . . . . . . . • • 3-17
3-3. Standard list of Analyses for the 300 Area Network . 3-25
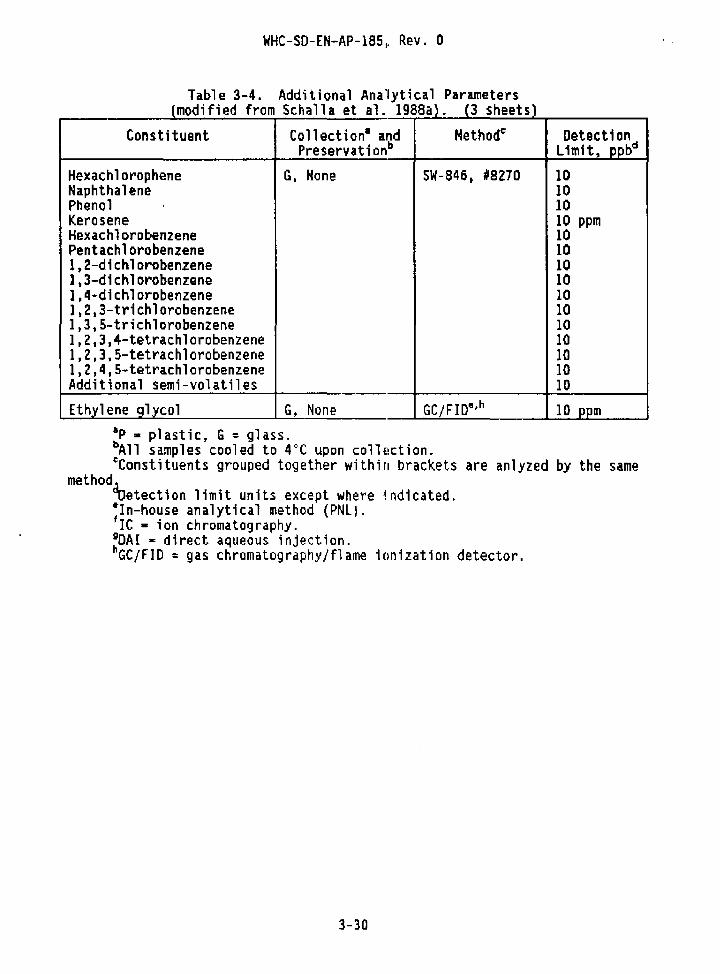
3-4. Additional Analytical Parameters ...
3-5. Monitoring Wells Used for the 300 Area Process Trenches
3-6. Appendix IX Constituents Not in WAC 173-303-9905 List
. 3-28
3-34
3-35
3-7. Constituents Analyzed in the Current Monitoring Well Network 3-38
4-1. Status of Monitoring Results for Constituents in the 300 Area Process Trenches for Groundwater Protection ...
4-2. Status of Monitoring Results for Other Hazardous Chemical Constituents in the 300 Area Process Trenches for Groundwater Protection ............• , , ...
4-3. Status of Monitoring Results for Radiological Constituents in the 300 Area Process Trenches for Groundwater Protection
4-4. Status of Monitoring Results for Detected VOA Constituents in the 300 Area Process Trenches for Groundwater Protection
4-S. Proposed Wells for the 300 Area Process Trenches Monitoring Well Network . . . . . . . . . . . . . . . • . . . . . •
4-6. Wells Used for Semiannual Depth-to-Water Measurements
vi
4-4
4-6
4-7
4-B
4-10
• 4-22

CERCLA
DOE DQO DWS ECOLOGY Eh EPA ERA GeoDAT HEIS MCL ou PCE POC PNL QA QC RCRA 1CE 1SD VOA WHC
':J
WHC··SD-EN-AP-185, Rev. 0
ACRONYMS
Comprehensive Environmental Response, Compensation and Liability Act U.S. Department of Energy data quality objectives Drinking Water Standards State of Washington Department of Ecology redox potential U.S. Environmental Protection Agency expedited response action Geosciences Data Analysis ToolKit Hanford Environmental Information System maximum contaminant level operable unit perchloroethylene point of compliance Pacific Northwest Laboratory quality assurance quality control Resource Conservation and Recovery Act of 1976 trichloroethylene treatment, storage, and disposal Volatile Organic Analysis Westinghouse Hanford Company
vii

WHC-SD-EN-AP-185, Rev. 0
This page intentionally left blank.
viii
• i ·. : ~
WHC-SD-EN-AP-185, Rev. 0
1.0 INTRODUCTION
This document describes the groundwater monitoring program for the Hanford Site 300 Area Process Trenches (300 APT). The 300 APT are a Resource Conservation and Recovery Act of 1976 {RCRA} regulated unit. The 300 APT are included in the Dangerous Waste Portion of the Resource Conservation and Recovery Act Permit for the Treatment. Storage, and Disposal of Dangerous Waste, Permit No. WAB90008967, (referred to herein as the Permit) (Ecology 1994} and are subject to final-status requirements for groundwater monitoring (Ecology 1994).
This document describes a compliance monitoring program for groundwater in the uppermost aquifer system at the 300 APT. This plan describes the 300 APT monitoring network, constituent list, sampling schedule, statistical methods, and sampling and analysis protocols that will be employed for the 300 APT. This plan will be used to meet groundwater monitoring requirements from the time the 300 APT becomes part of the Permit and through the postclosure care period until certification of final closure.
1.1 HISTORY OF GROUNDWATER MONITORING AT THE 300 APT
An extensive groundwater monitoring program was carried out during the operational life of the 300 APT {1975 to 1994). Prior to, and continuing beyond the time the 300 APT went into service, many of the wells in the 300 Area ~ere monitored for both radioactive and nonradioactive constituents, as well as water levels. In 1994; Ecology issued a RCRA Permit for the Hanford Site {Ecology 1994). The effective date of the Permit was September 28, 1994. RCRA treatment, storage, and disposal (TSD) units included in the Permit are required to conduct a final status groundwater monitoring program (see Section 1.2). Only five TSD units were included in this Permit originally. The 300 APT is scheduled to be included in the Permit as a TSD unit undergoing closure through the permit modification process in September 1995. Currently, the Comprehensive Environmental Response, Compensation and Liability Act (CERCLA) Record of Decision is not completed. Consequently, final closure specifications (e.g., cleanup levels, remediation methodology) are not yet known to the closure process. In 1977, Pacific Northwest Laboratory (PNL} initiated a site-specific program of groundwater monitoring. During the first year of the program, groundwater samples were collected monthly from approximately 30 wells, and water levels were measured weekly. A reduced level of effort was continued on this program until 1985.
From 1985 to the present the 300 ATP site nas been regulated under RCRA. The first groundwater monitoring compliance plan was initiated in 1986 {Schalla et al. 1986). In the Consent Agreement and Comp7iance Order {Ecology and EPA 1986) tne 300 AlP site was placed in an interim-status groundwater qua1ity assessment monitoring program. Tne assessment-• level status was based on the decision that (1) the groundwater monitoring wells around the 300 APT were inadequate for alternate groundwater monitoring as described in 40 CFR 265.90(d) (EPA 1984} and Washington Administrative Code {WAC) 173-303-400 (Ecology 1986) and {2) the groundwater quality in the 300 Area had been adversely impacted by the operations of the 300 APT. In response to the Consent Agreement and Compliance Order over 20 additional
1-1

WHC-SO-EN-AP-185. Rev. 0
wells were installed and monitored. The 300 ATP site was extensively characterized (Schalla et al. 1988b), and a revised groundwater monitoring compliance plan {Schalla et al. 1988a) was implemented in 1988. The plan has been modified as groundwater data were collected and analyzed. The data are reported to the State of Washington Department of Ecology (Ecology) quarterly, along with data from other RCRA-regulated units at the Hanford Site. Interpretive reports are submitted to Ecology annually.
The 300 APT are located fn the 300-FF-1 source operable unit (OU) and 300-FF-5 groundwater OU, under the authority of RCRA TSO and CERCLA past practice. In an expedited response action (ERA) in 1991, sediment from the sides and bottom of the trenches was removed and stored at the northern ends of the trenches. The action lowered the concentrations of uranium and various nonradioactive constituents, but uranium, trichloroethylene {TCE), and cis-1,2-dichloroethylene (cis-DCE) are still detected in downgradient wells. Any additional corrective action deemed necessary will be deferred until decisions are made regarding the 300-Ff-1 and 300-FF-5 OUs.
1.2 CHANGES FROM INTERIM-STATUS GROUNDWAT~~R MONITORING
Interim- and final-status groundwater regulations differ in several respects. The "assessment" program under interim status is equivalent to a "compliance'' program in final status. In compliance monitoring, specific constituents are chosen and compared to concentration limits. If these limits are exceeded, the site enters a corrective action phase. Statistical methods proposed in this document are different than those used under interim status. Final-status regulations require independent samples, which involves waiting periods between samples, rather than filling multiple bottles at once (replicates). In final status, samples are required at least semiannually rather than quarterly as in interim status.
The proposed program has a smaller monitoring well network and a shorter constituent list than the previous program. A complete description of the proposed groundwater monitoring program is presented in Section 4.0.
1-2

,,, ~-~-.
WHC-SD-EN-AP-185, Rev. 0
2.0 FACILITY DESCRIPTION AND OPERATION HISTORY
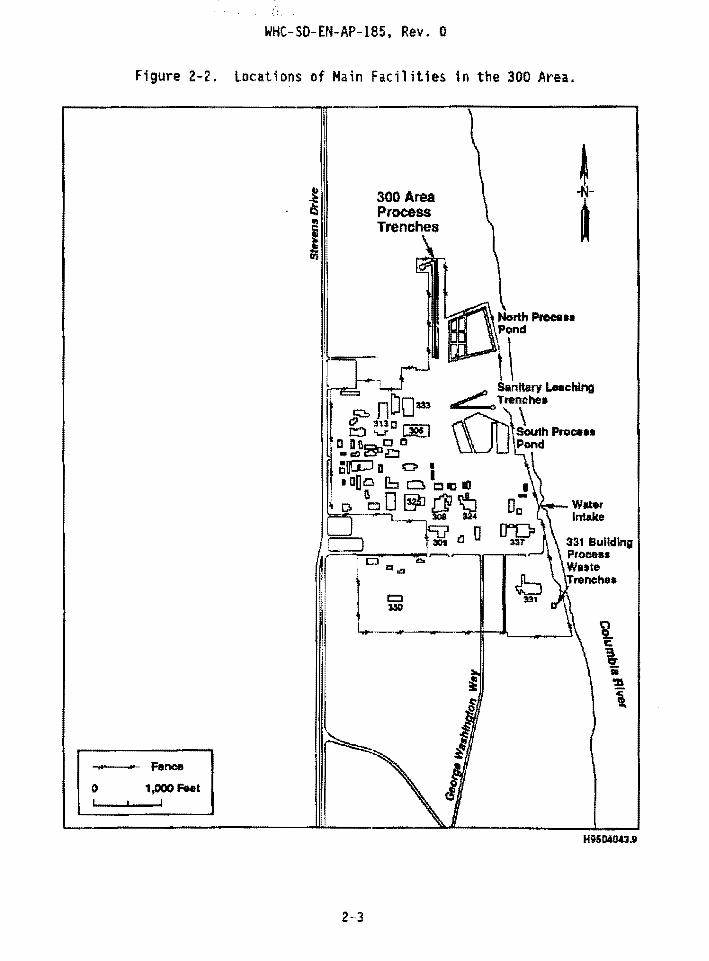
The 300 APT are located in the 300 Area of the Hanford Site (Figure 2-1). The 300 Area is a research and former nuclear fuels operations area encompassing approximately 2.9 km (720 acres) in the southeastern portion of the Hanford Site. Figure 2-2 shows the 300 Area main facilities.
The 300 APT began operating in 1975 and was the main facility for disposal of most liquid process wastes generated in the 300 Area unti1 the trenches were removed from service. The liquid waste discharged to the 300 APT consisted mostly of wastewater with relatively low concentrations of chemical contaminants. More concentrated wastes were generally not discharged to the 300 APT. The discharge rate has varied over the years, but it reached a maximum average of about 8,641 Ljmin {2,283 gal/min) during 1979. Total discharge for 1979 was 4.5£9 l (1.2E9 gal). Since 1987, when fuels fabrication ceased in the 300 Area, the wastewater has consisted of cooling water with small quantities of nonhazardous maintenance and process waste. When the 300 APT were in use, the east and west trenches were used alternately for periods of up to approximately 8 months. The west trench was removed from service in November 1992; the east trench remained in service with an average discharge of 814 L/min (215 gal/min). The 300 APT was administratively isolated from receiving further discharges in December 1994 and was physically isolated in January 1995.
The 300 APT consist of two separate 457-m- {1,500-ft-) long trenches excavated 3.7 m (12 ft) into the subsurface and separated by an earthen berm. The unlined trenches are excavated into the sandy gravels of the Hanford formation, and the bottoms of the trenches are about 6.1 m (20 ft) above the water table. Figure 2-3 contains a schematic cross section showing the dimensions and relationship of the eastern trench to the water table and the nearby Columbia River. Figure 2-3 also shows the area in plan view with the location of the schematic cross section, some example well locations, and nearby facilities. If the cross section were continued to the west to include the western trench, it would look very similar to the eastern trench except for the enlarged northern end which is caused by a natural depression (Figure 2-4). In 1990, the depression was separated from the west trench by a berm needed to support a birdscreen placed over the trench. The north 91 m (300 ft) of the original trenches, including the depression, are now an impoundment area for covered, low-level radioactive and low-level, mixed waste soils.
A concrete weir box is located at the south end of the trenches. Process sewer effluent reached the trenches through 24-inch-diameter 300 Area Process Sewer System piping that is connected to the weir box. The weir box measures 21.3 m (70ft) long {east-west dimension), 3m (10 ft) high. and 3m (10 ft) wide. It has two sluice gates that, in the past, allowed the trenches to be operated alternately.
Administrative controls to prevent disposal of dangerous wastes to the 300 APT were instituted on February 1, 1985. Prior to that time, a var1ety of chemical wastes was included with the wastewater. However, no large quantity of any one waste was included in the process wastes. Estimated amounts of chemicals discharged to the 300 APT are summarized in Table 2-1. From the
2-1

WHC-SD-EN-AP-lBS, Rev. 0
Figure 2-1. Location of the 300 Area and the Hanford Site.
0 200 Kilometers
Idaho 0 150 Mllae
~
o 20 Kilometers
0 10 Mlln
HD504043.7
2-2
WHC-SO-EN-AP-185, Rev. 0
Figure 2-2. locations of Main Facilities in the 300 Area.
Fence
0 1,000 Feet
H95D400.11
2-3

A
•
WHC-SO-EN-AP-185, Rev. 0
Figure 2-3. Schematic Cross Section of the 300 Area Process Trenches (modified from Schalla et al. 1988b).
Elevation 373ft.
~~--1,000 tt (305m)
'so· ... r Sides Sloped at 1:1
Elevation 361 ft. __.. ~ ""1 10 tt -20ft
"V Water Table =
Elevations are In Feet Above Mean Sea Level
Not to Scale
Location of Cross Sectk>n
Burial Ground M (Retlv
o 400 Feet ~
--Fence
• Well Location
A'
H8504043.1
2-4

,}
WHC-SD-EN-AP-185, Rev. 0
Figure 2-4. Topography in the Vicinity of the 300 Area Process Trenches.
CoiiiOUJ interVal "' 2 meters
D•tabue: 02-MAY-1995
2-5

WHC-SO-EN-AP-185, Rev. 0
Table 2-1. An Estimate of Chemicals Discharged to t~e 300 Area Process Trenches Prior to February I, 1985
(modified from Schalla et al. 1988a).
<Grams
Intermittent Discharges
<Kilograms later Discharges•
Arrmanium bifluoride
Antimony Arsenic Barium Cadmium Dioxane Dioxinc Hydrocyanic acid Pyridine Selenium &
compounds Thiourea Misc. laboratory
chemicals
Benzene
Carbon tetrachloride Cnromium Chlorinated benzenes Oegreasing solvents Formaldehyde Formic acid Hexachlorophene Kerosene Lead
Methy ethyl ketone Mercury
Copper
Detergents Ethylent glycol Hydrofluoric acid Nitrates Nitric acid Sodium hydroxide Paint solvents Photo chemicals Sodium chloride
Uranium Perchlaroethylene
Napthalene Heating oil Nickel Phenol Silver Sulfuric acid Tetrachloroethylene
{perchlorethylene) Toluene Tributylphosphate
(paraffin hydrocarbon solvents)
1,1,1-Tric:hloroethane
(methyl chloroform)
Trichloroethylene Xylene
30 kg/mob
:S:30 kg/mob ~200 l/mo 100 kg/mob :S:2,000 kg/mo ;S;300 l/mo :S300 Lfmo siOO l/mo S700 l/mob 75 tonsfyr
20 kgtmob 450 l
300 l d
~hese discharges were relatively continuous. ~ischarged at least through 1988. clncluded only because of the potential for dioxin to exist as a trace
impuri£Y in chlorinated benzenes. Known spills.
2-6

1::. ' WAC~SO-EN-AP-185, Rev. 0
beginn1ng of operations in 1975 until October 1993, a continuous, composite sampler was located at the headwa11 to ana1yze the wastewater at the point. of discharge to the trenches. S i nee 1993, the effluent has been ana 1 yzed by a sampler located outside the unit.
In 1991 an ERA was undertaken at the 300 APT: This action was initiated because of concerns about analytical results of trench sampling in 1986 (DOE-Rl 1990, Table 15). The ERA objective was to reduce the potential migration of contaminants in the soil at the bottom of trenches to groundwater. The specific ERA goal was to reduce the measurable level of radiation in the trenches to less than three times the upper tolerance limit of background. This was accomplished by removing contaminated sediments, using them to fill in the north end of the trenchest and immobil1z1ng them. In the process much of the inorganic constituents (including heavy metals' were removed as well {DOE-Rl 1992).
Approximately 5,400 m3 (7,000 yd3} of sediment were removed f.
trench and relocated to the north e~ds of the trenches. About r ; of chemically and radioactively contaminated soil from the sides : 1.3 m (4ft} from the _bottom of each trench were removed. The le~· ·. --~~=vely contaminated sediments (<2,000 cpm) we'l"e relocated to the nr _ · .. r.a of each trench. The more radioactively contaminated sediments {>2,l>~-- ,~pm) were consolidated in the depression located at the north·ll'fest C(lrner vf the west trench. Contaminated soils in the depression were isolated fro~ the effluent and then covered with a plastic barrier and a layer of clean aggregate. Results of pre- and post-ERA sampling and analysis (DOE-Rl 1992) indicate that the ERA successfully reduced trench contamination at all areas of the trenches other than the position where contaminated soils were stockpiled. Results of groundwater sampling and analysis after the IRA also show a drop ;n constituents of concern. As an example, uranium concentrations in well 399-l-17A declined following ERA (see Section 3.3}.
2-7

WHC-SD-EN-AP-185, Rev. 0
This page intentionally left blank.
2-8

<I .. :
WHC-SD-EN-AP-185, Rev. 0
3.0 HYDROGEOlOGY AHO GROUNDWATER "ONITORING RESUlTS
Information about geology, groundwater hydrology, and groundwater contamination in the vicinity of the 300 APT has been derived predominantly from wells. Since the first 300 Area groundwater monitoring well was installed in 1943 {399-3-6), many additional wells of a variety of construction types have been installed to monitor the groundwater and characterize the geology. Most wells fit into one of two types: {1) a pre-1985 type that is nominal 0.15 to 0.30 m (6 in. up to 12 in. diameter} carbon steel casing that was perforated (early design) or screened (later design) in the saturated zone and (2) a 1985 to recent type that meets the requirements of WAC 173-160, Nin1mum Standards for Construction and Maintenance of Wells (REFERENCE). These more modern regulatory-compliant wells have nominal 10-cm (4-in.) stainless steel casing with stainless steel, wire-wrap screens in the saturated zone, and extensive annular and surface seals. Figure 3-1 is a map of the 300 Area showing well locations. Table 3-1 provides well construction details.
3.1 GEOLOGY
This section summarizes the geology in the vicinity of the 300 APT. More detailed discussions are found in lindberg and Bond (1979), Schall a et al. (1988b), Delaney et al. (1991), Gaylord and Poeter (1991), and Swanson et al. (1992). From youngest to oldest, the geologic units found beneath the 300 Area are:
• Holocene surficial deposits • Hanford formation • Ringold Formation • Saddle Mountains Basalt.
These units are discussed in the following sections.
A stratigraphic column (Figure 3-2) and a series of geologic cross sections {Figures 3-3 through 3-6) show the distribution and characteristics of geologic units within the 300 Area. The 300 Area is located within one of the broad, flat synclines {Pasco syncline) within the larger Pasco Basin. The basalts and overlying sediments are essentially horizontal. The following sections discuss the geologic units beneath the 300 Area in more detail.
3.1.1 Holocene Surficial Deposits
Holocene surficial deposits in the vicinity of the 300 Area include eolian sandy silts and fluvial deposits associated with the Columbia River. The eo I ian deposits are in the form of thin (0 to 2 m [0 to 6.6 ft]) sheets and thicker (2 to 5 m [6.6 to 16 ft]) dunes. Dunes are especially well developed and remain active in the area to the north of the 300 Area. Inside the perimeter fence of the 300 Area the eolian deposits are mostly absent or reduced in thickness as a result of construction activities. Recent fluvial deposits such as overbank silts and channel deposits of sand and gravel are found in areas immediately adjacent to the Columbia River.
3-1

WHC-SD-EN-AP-185, Rev. 0
Figure 3-1. Location Map of 300 Area Wells .
• S.S27-Ei
• 5-2
• IJ.4 • 8-2
• 8-5
• 6-Sa..E12
• &.1 Wall Loe~~tlon end Number
a sws-1 Surface Water Monitoring Station
,,. .... Fence
D 1,000 Feet
8-3 •
• S11E13
• 1-taA, a. c
3··2
1·14 •
• I-S18-E14
Proctss Water Tl"'ffChes
··~I •1·1CA, 8
1111-+--- Ncrlh. Process Pond
I-S28·E11 •
S30·E1SA, B
H!1504048

"i .. '.
WHC-SD-EN-AP-185, Rev. 0
Table 3-l. Characteristics of 300 Area Wells. (3 sheets 1
Well Completed T WL B S/P AQuifer I WAC
O'l"ig1 na 1 16 Wells in Groundwater Monitoring Plan (Scha11a 1988b)
699-S19E13 11/71 50 51 78 p TU N
399-1-6 2/75 22 33 43 s TU N
399-1-4 5/50 23· 38 70 p TU N
399-1-5 2/75 23 35 45 s TU N
399-1-1 11/48 40 33 75 p TU N
399-8-2 5/50 43 50 72 p TU N
399-1-2 4/50 25 42 75 p TU N
399-1-3 4/50 25 34 70 p TU N
399-1-7 3/85 25 37 70 s TU N
399-1-8 8j85 85 40 105 s BU N
399-2-1 11/48 18 34 75 p TU N
399-3-7 1/44 45 --- 60 p TU N
399-3-10 9;76 34 40 49 s TU N
399-4-1 2/51 25 so 80 p TU N
399-4-7 11/61 21 36 46 p TU N
699-S30El5A 10/71 58 6~, 78 s __ ...__ TU N
Wells Completed in 1986 and 1987 in Response to the Trj-Party Agreement
399-4-11 11/26/86 55 63 70 s TU y
399-l-9 2112/87 170 10 178 s c Yl
399-1-10A 12/23/86 23 31 39 s TU Y2
399-l-11 11/20/86 26 35 47 s TU y
333-1-12 ll/3/86 45 42 60 s TU y
399-1-13A 11/5186 38 46 53 s TU Y2
399-l-14A 11/14/86 31 39 47 s TU Y2
399-1-15 11/17/86 29 36 44 s TU y
399-l-16A 12/5/86 32 39 48 s BU Y2
399-1-168 2/10/87 105 38 liS s c y
399-l-16C 1/16/87 167 40 178 s TU y
399-l-17A 11/13/86 25 35 40 s BU y
3-3

WHC-SD-EN-AP-185, Rev. 0
Table 3-1. Characteristics of 300 Area Wells. {3 sheets'
Well Completed T Wl B S/P Aquifer WAC
399-1-178 12/19/86 100 33 110 s c y
399-1-17C 1/16/87 161 3 171 s TU y
399-1-18A 11/12/86 38 47 54 s BU Y2
399-1-188 1/23/87 109 43 119 s c y
399-l-18C 1/6/87 130 45 140 s TU y
399-1-19 5/23/86 -- 33 -- -- TU N1
Miscellaneous Wells
399-1-108 10/8/91 105 38 115 s BU y
399-1-148 10/31/91 99 38 110 s BU y
399-2-2 10/3/76 35 39 55 s TU N
399-2-3 10/4/76 45 40 55 s TU N
399-3-1 10/26/48 20 40 65 p TU N
399-3-2 10/13/47 40 51 75 p TU N
399-3-3 2/9/48 52 51 81 p TU N
399-3-6 8f43 42 49 55 p TU N -399-3-8 3/11/70 28 44 48 p TU N
399-3-9 8/30/76 45 55 55 s TU N
399-3-11 9/17/76 45 53 65 s TU N
399-4-9 9/26/76 38 38 58 s TU N
399-4-10 9/27/76 30 34 so s TU N
399-5-1 2/19/51 23 51 s.a p TU N
399-6-1 6/2/50 25 45 s.o p TU N
399-8-1 6/6/50 35 52 60 p TU N
3-4

,..,... I·.,
WHC-SD-EN-AP-185, Rev. 0
Table 3-1. Characteristics of 300 Area Wells. (3 sheets'
Well Completed T WL B S/P Aquifer WAC
399-8-3 3/7/51 25 so 72 p TU N
699-S27-El4 4/15/48 45 58 1005 p TU N
699-S29-El2 11/5/71 59 38 79 s TU N
Aquifer= Which aquifer screened or casing perforated in which aquifer?
8 = Depth to bottom of screen or perforations in feet. BU = Bottom of unconfined aquifer. C = Confined aquifer.
Completed = Completion date. Nl = Carbon steel casing, not perforated or screened, open
at hole bottom. P = Access to aquifer through perforations in casing. S = Access to aquifer through well screen.
5/P z Screen or perforations in carbon steel casing? T = Depth to top of screen or perforations in feet.
TU = Top of unconfined aquifer. WAC =Well construction complies with WAC 173-160?
WL - Depth to water in feet. Y/N = Yes/No.
Yl = Well has a 10-in. carbon steel casing that was left in hole to 100 ft.
Y2 • Two screens, telescoping screen left in hole.
3-5

WHC-SD-EN-AP-lBS, Rev. 0
Figure 3-2. Generalized Geologic Column for the 300 Area Near the Process Trenches.
Elevation -380ft
Approximate LHhology
Depth to Water
.. 34oft
-320ft
-305ft -295ft
-270ft
-230ft
.. 220ft
.. 170ft
Depth ----~v~----~~--~~~·~~*~w~·--~-~-~·<~--~\4r~------
--40 tt
.. so tt
-.75ft -85ft
-110ft
-150ft
-160ft
~. . b c/ (:) 0 . .• ·a .. '0 0• •c....,...-' • • • cO o o IQ
• Q • .. 0 "'c::- 0 0 0 • , 0 'C D {) •0 0 • ...--. o• or--.o:....Oa o., c.oo .......__.., • o o ~ • "-------' • o '"' .. 0 • 0 a 0 g • 0 o o0 ... c:';) 0 ° ·O•GJI•• •o • o a • • c • ... • • • .. .. 0 •
• • ; ... c 1 • • 0 • d c • o. o
~::> ' ., • " --nd Gra I • • 0 o • • c. • o 0 0 .. • -llii:N:I Y VB .,p 110 • a o. 0
a,.a • 'i. o , c~:nd Cobbles g"b ''a"',., •0
• D 0 Q. "CI ~ II "'. • • .. "' II ..
,. -- 1111 Q • • .. c 0 • l::t • 0 • • .C> • '0 • • liT .. 0 .. • 0 .. .. • 0 • • • • • .. • • e • o· . . . .. l •
... .. ... .:.. (I ..... Q •• CJ •• d 0 • o ... 41'0
.... ~ • ,.c • 0'0. ,. 6. r:! 1\. ••• :0'· •• 0 0 p: :a• •• • 0 : • i. 0 Ill " .. .. .. .... 4• 0 'Q ~ Ill .. .. • • o. c. o • o • Cll c. • • o: • • ~o .• .• ! 0., • • ,.: • -_':.a o' .. b • •
·~. 0~ ~·\.c fJ .. () ... o ... --o· a .. • .,o •• o • • ......... g -I ..,. 0
...,--...., --Sin Layer.. • o • • • • a • • • • • • .. ; : c·""' • • 0 •• d o• • o .. o
.. ._ ~fQ • Q. • OQ IC:Ii 1 0• 11:11 Do,. ~ .._ 0 0 • .... •
• o : .. 'i c • • • C ., • o • a ~ G • " o .. c, o o .. o c ... Qo • ~o • ... • a o., • ,.. • • o b •a • •
r::P .. D• .. •c .p• t:ll~~oo.._.,.o..o• ,.. r,o• 011111 • -~· •
SHt and Clay Layera with Minor Sand and Gravel
SlttandCiay
3-6
Geologic Unit
Eolian Sand
G laciofluvlal Sediments (Hanford formation)
Ringold Formation
Columbla River Basalt Group (Y~:klma Basan Subgroup)
tlt504043.2

i,):.
WHC-SD-EN-AP-185, Rev. 0
Figure 3-3. Locat1on Map for the Geologic Cross Sections.
N 385,000
N 380,000
N 275,000
Hanford Site Boundary
E2,305,0Da E %,:S1 0, DOG
300-FF·!!i Boundary
300-FF-2
• ...
• S1DJ::U
300-FF-1
; !1-1 4-1 i >5-7 ! ~i 'i • e ~ s:z7EI4 ! 4-U
I~ • I,J· 4-1
300-FF-3 i I if
; /l !:::;--~ 11. l . z ' "'~! ,~,___ ...... 300-FF-5 Boundary i '\~ AII£15C
l \~<· i '\ \
i t~ ~ 3DDO ; • Area i . ' ! •
• 1·12 Wtll Location and Numbtr (Wtllll Fftllud by Ull·, Exc•pl T'hon lkglnnlng with S •• ~fiiH with a. J
N 275,000 Lambtrt Coordlr111'" (Jett)
3-7
:f
i i • • • • \ :; • !. \ i ! i i ! l \ i • ~ \ \ ...
Hll2 011013.3

w I co
A North
j ••• l i 300-
~ 200] It tOO )j!
lw
~
~ -. ;'j; ~
EXPLANATION
Grain Size Scaie
0
"' . " i i '? "' do !!!
.;, do :21
0 - " -~ :l ~ :; :; ~
~ Pebble-Cobble Gravel (locally Boutder Rk:h) '\SandS Mud (Clay and/or Sill
Additlonalllthotoglc Syrrools
WffA Clay- Ale~ Bill Sandy ~ oasan
See Fip'a 3- 3 far Craq Sidon l~>~;~~llion.
SOU'e.l: SWMIIOII 1882.
i 'I' l m
Other iniormaliort
ll
m Rl i
~ w ~ ~ ...
A' South
400 i ...1 (/)
300:::e
200! c::: 0
100 iii ii (i]
A, 8, C1, C2 Muddy lnlarvalsln Upper Gravelly Rlrlgok:l
LM lower Mud lnlarval
f Hanlorc:l FonnaliortiRhgold Fonnallon Conlad
Formation Com ad
Unit or Major Fac:kts Corllact
0 IOOOF£ET -o 300UETEAS
Y1nk:111 ~ •IX
t1:t-17a/457•1W-II-t3
"T'1 ~.
tO c ., m
w I
""" ::E: :I: n I
(j') VI
<tl Cl
0 I
-' 1'11
0 :z: o.c I
..... :l:> .., 1' n -., co 0 U'l -V) V)
;%:1
VI I'D
<tl < n <"+ ..... 0
0 ~
~ I )> -

w I
U)
1l' ., :c ...J (I)
:l ., >
~ c; 0
11 : w
B WestM
~ VJ
*LU Ealaa
.coo-
300 ______ __._ ----200
100
EXPLAN.ATION
Grain Size Scali
~~~
~ Pebble·~bbls Gravet (lo<:ally Boulder Rich) '\Sands
Mud (Clay and/or Sit)
Addllonaf l..lhologlc SymbOlS
W4I}J Clay • Rk:h 1111111 Sandy ~ Basall
Se• Rglq 3-3,. en. s.dlon lccallon
Sourc;e; SwwliOft 11182.
B' East .. IV
":' • • 400 ii
:! it I
..J (I)
300 .:::t
200 i c:.
~ 100 l
UJ
OSher lnlormallon
A, 8, C 1, C2 Muddy lntewals lnl.lpper Gravely Ringold
LM Lower Mud lhlerYal·
{t Hanlord FonnadoniiRirQold Fonnalkm contact
Formatbn co~
un• or Mal« FacJez1 Coni act
0 IOOOFEET = o 300UETERS
\'lldll:lile.w-b-6Jl
... t76111<15744fl.t41-t3
'TI ..... u:::r c:. -s (I)
w I
tn ~ -· n I
(l') (,1) ,., 0
0 I ..... 1"'1
0 ::z. Ul
I .... > n '"Q
I
n .... ., a::l 0 tn . VI
"' ::1:1 V)
,., ID < n . r+ ..... 0 0 = c:r m

w I .....
0
·-·------------------------,
c ~ Southwest~
~ .w 'i
:! 400 ...J 1/}
~ 300 <» :>
~ 200 c: .9
1100
~ caw
EXPLANATION
Grain Size Scale
; ....
H lilnlord F Dm'lalion
-::.-::.::.-=..-::.. - i[_-:. ~--=-
_-_lfi
% Pebble-Cobble Gravel (locally Boulder Rich)
'\:Sands Mud {Clay and/or Sill)
Add~bnallilhologlc S~mbols
~ Clay·Rich
- Sandw ~Basal
S..f9n a .. l!lb CRln--. t.oc.llon.
~; Sw1111son 1992.
Ill ..,
LM
c· Northeast
0 ... 400 ~
,.J (I}
300 ~ ':1>
200 ~ c: Q
L -ii tOO ~
iD
Other Information
A, B,C1, C2
LM J:l A
MlJCi1V lnlervals In Upper GJByetly Ringold
Lower Mud Interval Hanlord FonnalloniRingOid Formatloll Clmact
Formation Conlael
UnH or Mafor Fades Contact
0 IOOOFEET
·---=~-0 3(10 IETEA9
~E~~-sx
813-1789/457 .. 315-16-13
..,., ..... tQ c .., (!)
w I
0'1 E: . ::r ('""l
r C) VI (I) 10 0 r ...... ..,., 0
;z 1.0 I ~- > n "0
I ("") -co 0 tn (I> (I>
~
U'l (!)
iO < n . c+ ..... 0
0 :::1
n I
n -
WHC-SD-EN-AP-185, Rev. 0
3.1.2 Hanford Format1on
Delaney et al. (1991} discuss three main facies associated with the Hanford formation: (1) gravel-dominated facies, (2) sand-dominated facies, and (3) slackwater deposits composed of interbedded silts and fine sands. The Hanford formation in the vicinity of the 300 Area contains two of the three facies, (1) first and (2) second. Slackwater deposits composed of interbedded silts and fine sands, the third facies discussed in Delaney et al. (1991}, are absent, although silts occasionally occur as minor portions of the other two facies. The mafn characteristics of the two facies that comprise the Hanford formation in the 300 Area are summarized as follows:
1. Gravel-dominated. The gravel-dominated facies generally consists of granule to boulder gravel with a dominantly sandy matrix. These sediments display massive and planar to low-angle bedding, and large-scale scour cut-and-fill structures (such as channels) and foreset bedding in outcrops. They are usually matrix poor and sometimes display open-framework texture. Lenticular sand and silt beds sometime are intercalated throughout the facies. Gravel clasts are predominantly basalt (50-80%). Other clast types include Ringold Formation and Plio-Pleistocene unit rip-ups. coarse-grained plutonic rocks such as granites, and metamorphic clasts composed of quartzite and gneiss. The gravel-dominated facies was deposited by relatively high-energy floodwaters within main channelways associated with Pleistocene cataclysmic flooding.
2. Sand-domjnated. The sand-dominated facies is characterized by fine- to coarse-grained sand and granule gravel displaying plane lamination and cross bedding and sometimes channel-fill sequences. These sands may contain small pebbles and rip-up clasts in addition to pebble-gravel interbeds and silty interbeds less than 1 m (3.3 ft.) thick. The silt content of these sands is variable, but where it is low, an open framework texture is common. These sands are usually composed of predominantly basaltic grains and are often referred to as black, gray. or salt-and-pepper sands. The sand-dominated facies was deposited adjacent to main flood channelways during the waning stages of cataclysmic flooding or in areas of reduced velocity as water spread out in more open areas downstream of flow restrictions such as canyons or channelways.
The Hanford formation in the vicinity of the 300 APT is about 15.2 m (50 ft) thick and is mostly the gravel-dominated facies. Locally the graveldominated facies can be further divided into two types. pebble to cobble gravel and boulder gravel. The pebble to cobble gravel type is the most abundant Hanford formation sediment in the 300 Area. Except for minor interbedded strata consisting of boulder-rich deposits and a few sand-rich horizons (sand-dominated facies). this sediment type makes up the bulk of the Hanford formation. The boulder-rich gravels are distinguished from the pebble to cobble gravels on the basis of increased boulder content. Boulder-rich gravels contain greater than approximately 25% boulder-sized clasts (>25.6 em [>10 in.] diameter). The thickest occurrence of boulder-rich gravels in the 300 Area is found between boreholes 399-1··16ABC and 399-3-9 where up to 18 m (60 ft) of such strata have been logged. These gravels do not extend west of boreholes 399-l-l7ABC, although they may extend to the southwest. A second
3-11

WHC-SD-EN-AP-18!., Rev. 0
boul der-r1 ch zone up to 6 m ( 20 ft) is 1 oca.ted at or near the uppermost portions of the Hanford formation in the sc,uthern portion of the 300 Area, and a third one occurs in the northernmost part of the 300 Area. The first and second zones may interfinger near wells 399-3-3, 399-2-3, and 399-2-1, but the third zone appears to be separate from the other boulder-rich zones by pebble to cobble gravels.
The sand-dominated facies of the Hanford formation in the 300 Area consists largely of basaltic coarse-grained sand and granules with an openframework texture. Silt content is low. Thick occurrences of this facies are rare in the 300 Area, and the thinner horizons that do occur are too thin to be easily shown on the cross sections (Figures 3-4 to 3-6). However, thin beds of the sand-dominated facies are common and often intertalated with layers in the pebble to cobble gravel of the gravel-dominated facies.
3.1.3 Ringold Formation
The Ringold Formation near the 300 APT is about 37 m (120 ft) thick and contains three of the five Ringold Formation facies. The three occurring Ringold Formation facies are (1) fluvial gravel, (2) overbank deposits, and (3) lacustrine deposits. These facies are described in detail in Delaney et al. {1991} and lindsey (1991). They can be summarized as follows:
1. Fluvial gravel. Clast-supported granule-to-cobble gravel with a sandy matrix dominates the facies. Intercalated lenses of sand and mud are common. Clast lithologies are dominated by quartzite and basalt with subordinate lithologies including silicic plutonic rock, intermediate to silicic volcanic rocks, gneiss, volcanic breccias, and greenstone. Matrix sand is sublithic, subarkosic, and arkosic with the feldspars being dominated by plagioclase. Sand beds in the association generally are quartz-felspathic, with basalt content usually ranging between 5% and 25%. Low-angle to planar stratification, massive ibedding, wide shallow channels, and large-scale cross bedding are f1Jund in outcrops. Compaction and cementation are highly va'r'iable with most cementation consisting of CaC03 and iron oxides. The CISSociation was deposited in a gravelly fluvial braidplain cha·racterized by wide, shallow, shifting channels.
2. Overbank deposits. This facies dominantly consists of laminated to massive silt, silty fine-gra·ined sand, and paleosols containing variab 1 e amounts of pedogenic ca 1 ci urn carbonate. Overbank deposits occur as thin (<0.5 to 2m [1.6 to 6.6 ft]) lenticular interbeds in the fluvial gravel facies and as thick (up to 10 m [33 ft]) laterally continuous Sl!quences. These sediments record deposition in proximal levee to more distal floodplain conditions.
3. lacustrine deposits. Plane lam·inated to massive clay with thin silt and silty sand interbeds d'isplaying some soft-sediment deformation characterize this a~;sociation. Coarsening upward sequences less than 1 to 10m p.3 to 33ft) thick are common. Strata comprising the association were deposited in a lake under standing water to deltaic conditions.
l-12

WHC-SD-EN-AP-185, Rev. 0
Ringold Formation strata in the 300 Area are generally divided into a lower, mud-dominated sequence and an upper, gravelly sequence (Figures 3-4 to 3-6). The lower 17m {55ft) composed of mud is laterally extensive and consists of lacustrine deposits overlying overbank deposits. It is correlated to the lower mud sequence found elsewhere throughout the Pasco Basin near the bottom of the Ringold Formation. The gravelly sequence overlying the lower mud sequence is composed dominantly of the fluvial gravel facies and is roughly correlated to Ringold Formation gravel units {B, C, and E) {Delaney et al. 1991, lindsey 1991}. 1 Two mud-dominated intervals are found in the upper gravel sequence in the 300 Area. They are discontinuous, pinch out, and are not found in the immediate vicinity of the 300 APT. However, they do occur to the west and south and consist dominantly of paleosols typical of overbank deposits.
There is evidence of erosion and channelization of the top of the Ringold Formation throughout the 300 Area {lindberg and Bond 1979, Schalla et al. 1988b, and Swanson et al. 1992). These channels cause the upper Ringold Formation surface (and overlying Hanford gravels} to be lower by approximately 3 to 9 m (10 to 30 ft} in the channels. One of these channels may occur in the vicinity of wells 399-l-17ABC and 399-l-16ABC as inferred by lindberg and Bond (1979). However, well spacing in the 300 Area is too large to resolve structural details of these channels (such as size and orientation} on the Hanford~Ringo1d Formation contact.
3.1.4 Saddle Mountains Basalt
Underlying the 52 m (or 170 ft} of Hanford and Ringold formation sediments is the Saddle Mountains Basalt. The uppermost basalt member of this formation in the vicinity of the 300 Area is the approximately 24 m (80 ft} thick Ice Harbor Member, which contains three flows that erupted from vents near Ice Harbor Dam east of Pasco, Washington (Helz 1978, Swanson et al. 1979, DOE 1988). These basalt flows are typical in that they have rubbly or scoriacious flow tops and bottoms and relatively dense interiors. locally, these flows have an abundant amount of palagonite indicating they were in contact with wet conditions as they were emplaced. Underlying the lowest Ice Harbor Member flow is the Levey interbed, which is one of the intercalated members of the Ellensburg Formation. The Levey interbed locally is about 5 m {or 11ft} thick and, like other Ellensburg Formation interbeds, consists of a mix of volcaniclastic and silisiclastic sediments usually as sands, gravelly sands, or sandy silts. Underlying the levey interbed is the Elephant Mountain Member (two basalt flows) and below that the Rattlesnake Ridge interbed of the Ellensburg Formation.
1Note: The letters A, B, and C are also used to identify muddy units on the geologic cross sections {Figures 3-4, 3-5, and 3-6). This is a unique usage. The letters A, B, and C after Delaney et al. {1991) and lindsey (1991} are in more widespread use and refer to gravelly units in the Ringold Formation throughout the Hanford Site.
3-13

WHC-SD-EN-AP-185, Rev. 0
3.2 GROUNDWATER HYDROLOGY
This section discusses the different aquifers within the suprabasalt aquifer system (Delaney et al. 1991). Aquifers below the suprabasalt aquifer system, although mentioned, are not relevant to this groundwater monitoring plan and are not discussed in detail.
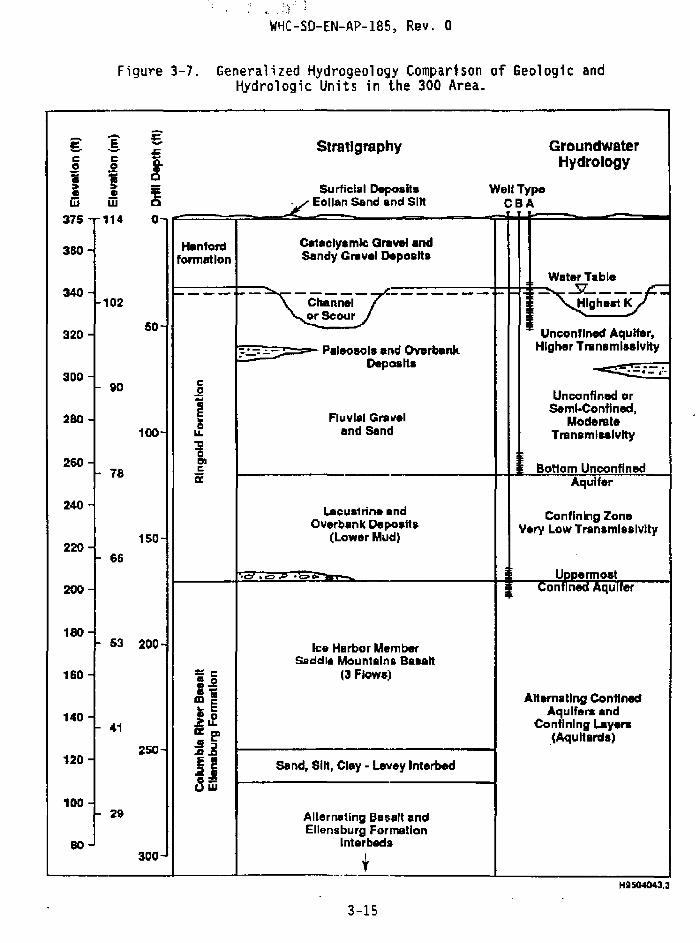
3.2.1 Aquifer~
Aquifers w1thin the suprabasalt aquifer system are those that are above the uppermost, regionally extensive, confining layer (Figure 3-7). In the 300 Area the uppermost, regionally extensive, confining layer (aqu1tard, aquiclude) is the lower mud unit of the Ringold Formation. Other mud units {designated A, B, C on the geologic cross sections [see Figures 3-4 t~rough 3-6]) exist within the Ringold Formation, but they are discontinuous.
In the 300 Area the muds that exist above the lower mud unit pinch out and are not present below the 300 APT. Therefore, the unconfined aquifer extends from the water table {at about 10.1 m (33 ft] below ground surface) to the top of the Ringold Formation lower mud unit. Elsewhere in the 300 Area where one or more of the upper muds are present, the aquifer(s) between the partially confining mud units is (are) partially confined. In the immediate vicinity of the 300 APT the unconfined aquifer is composed of the lowermost 5 m (17 ft) of Hanford formation and approximately 20 m (65 ft} of Ringold Formation. The Hanford formation there is composed primarily of the graveldominated facies. and the Ringold Formation above the lower mud unit is dominantly the fluvial-gravel facies.
Aquifers below the Ringold Formation lower mud unit are completely confined. These confined aquifers include any coarse-grained Ringold Formation sediments below the lower mud unit 1 high permeability zones within basalt flows such as rubbly or scoriacious flow tops and bottoms, and interbeds of the Ellensburg Formation if the permeability is high. These confined aquifers are intercalated with- and confined by- dense interiors of the basalt flows.
3.2.2 Aquifer Properties
The most recent aquifer tests and laboratory tests of borehole samples are reported in Swanson et al. 1992. The following are pertinent conclusions of the testing reported in that report.
• The best estimate for unconfined aquifer properties came from multiple-well analysis of constant discharge tests. Test results for the uppermost portion of the unconfined aquifer at well
2Note: The letters A, B. and C are also used to identify gravel units in the Ringold Formation. The use of the letters for muddy units is unique to the 300 Area. The letters A, B. and C aftel' Delaney et al. (1991) and lindsey (1991) are in more widespread use throughout the Hanford Site for the gravelly units.
3-14
g c 0 i ~ m
375-
3SD-
340
320-
300-
280-
260-
240
220
200
180
160-
140-
120-
100-
so
.:·.~ .:
W~C-SD-EN-AP-185, Rev. 0
Figure 3-7. Generalized Hydrogeology Comparison of Geologic and Hydrologic Units in the 300 Area.
- € .§. ~ Stratigraphy Groundwater
c ! Hydrology
1 ~ Surficial Deposits Well Type
w / Eolian Sand and Silt CBA 114 o-
Hllnford c.taclysmlc Gr~~vel and formation Sandy G111vel Deposita
Water Table
~--- ~- ----- ------- ~ - S'---:;F 102 Channel Highest K or Scour
50-Unconfined Aquifer,
:-.:.... . ..:.~ Paleosols and Overbank Higner Transmissivity r- Deposits
~:_;-
r- ao c 0 Unconfined or ;
§ Auvlal Gra11al Sem~Conflned,
Cl and Sand Moderate
100- u. Transm lulvlty ']! 0 l:b
BoHom Unconfined r- 78 c a: Aquifer
Lacuatrlna and Confining Zone 011erbank Deposits Vary Low Transmissivity
150 (lower Mud)
66 .. c::;r l!lc:::::l--;p •c::;..Oi ............... 1 Uooermost
j Confined Aquifer
53 200 Ice Harbor Member Saddle Mountains BauH
=c (3 Flows) • .2
=· Alternating Confined mE J.f Aquifers and
41 a::~ Confining Layera
{Aquitards) 250 jj
E • Send, Silt, Clay- Levey lnterbed .il:c am r- 29 Alter11111ing Basalt and
Ellensburg Formation Interbeds
300- t HSI504043.3
3-15

WHC-SD-EN-AP-185, Rev. 0
clusters 699-S22-E9ABCO and 699-S27-E9ABCD (Figure 3-1) were 36 and 49 mjd (120 and 161 ft/d) for horizontal hydraulic conductivity. 2.1 and 5.5 m/d (7 and 18 ft/d} for vertical hydraulic conductivity, 0.37 and 0.02 for specific yield, and 0.013 and 0.005 for storativity.
• Water levels measured at the twa sites (cluster wells in lower Ringold Formation confined aquifer, lower unconfined aquifer, and upper unconfined aquifer) show an upward hydraulic gradient, demonstrating that the this area is probably a discharge area for the semiconfined and confined aquifers below the unconfined aquifer. (The unconfined aquifer, in turn, discharges to the Columbia River.)
• Barometric efficiencies estimated for wells screened at the bottom of the unconfined aquifer {8 wells) are 10% and 18% for the two cluster sites. For the uppermost confined aquifer (C wells) the efficiencies are 28% and 22% for the two cluster sites. These results indicate that the bottorr1 of the unconfined aq~ifer, and. of course, the uppermost confined aquifer in the Ringold Formation, are at least partially confined in the vicinity of the 699-S22-E9 and 699-S27-E9 well cluster sites. {Because the two upper mud units in the Ringold Formation are missing in the vicinity of the 300 APT. the bottom of the unconfined aquifer in the vic1nity of the 300 APT may not show the same results.)
• The specific yield result of 0.02 may indicate a semiconfining condition.
• Laboratory test results on split-tube samples yielded vertical hydraulic conductivities that were at least one order of magnitude lower than the best estimated horizontal values.
The well clusters used for the aquifer testing reported in Swanson et a1. (1992) are effectively screened entirely in the Ringold Formation because the water table is either at or lower than the Ringold/Hanford formation contact at those well sites. However, the water table near the 300 APT is within the Hanford formation, possibly because of channeling in the top of the Ringold Formation.
Table 3-2 shows previously collected hydraulic conductivity data derived from well pumping tests (Schalla et al. 1988b, Appendix D). These data are from wells that are closer to the 300 ~PT than the wells reported in Swanson et al. {1992). As expected, hydraulic conductivities at the top of the unconfined aquifer in wells near the 300 APT are higher. It is suspected that these higher hydraulic conductivities in the wells closer to the 300 APl are the result of a greater contribution of groundwater from the Hanford formation which generally has a higher hydraulic conductivity than the Ringold Formation.
3-16

: 'W'*!~'SO-EN-AP-185, Rev. 0
Table 3-2. Hydraulic Conductivities Estimated from Aquifer Tests 1n Wells Near the 300 Area Process Trenches (from Schalla et al. 1988b}.
~ ~~QrAy]j' ~gndy~t1vitt Aquifer m/d {ft/d)
A-Wells
399-1-13 3353 (10,998) Top of Unconfined *
399-1-lSA 15240 _{49,987) Top of Unconfined*
399-1-16A 152 (499) Top of Unconfined*
B-Wells
399-1-188 0.58 {1. 90) Bottom of Unconfined
399-1-178 3.66 (12. 0_) Bottom of Unconfined
399-1-168 Test #1 0.61 _(2.00) Bottom of Unconfined
399-1-168 Test #2 0.91 (2.98) Bottom of Unconfined
C-Wells
399-1-lSC 1.83 (6.00) Uppermost Confined
399-1-17C 79.2 (260) Uppermost Confined
399-I-16C 2. 72 (8.92) Uppermost Confined
399-1-9 1.83 (6.00) Uppermost Confined
*rap of the unconfined aquifer at this well is within the lower portion of the Hanford formation.
3-17
WHC-SO-EN-AP-185, Rev. 0
3.2.3 Groundwater F1ow
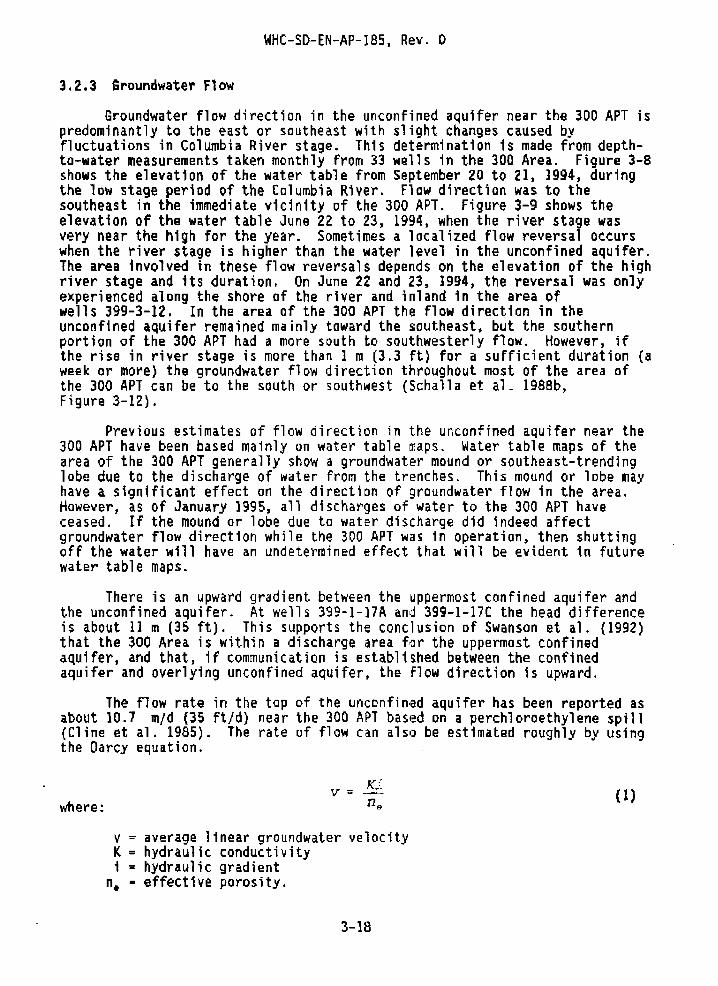
Groundwater flow direction in the unconfined aquifer near the 300 APT is predominantly to the east or southeast with slight changes caused by fluctuations in Columbia River stage. This determination is made from depthto-water measurements taken monthly from 33 wells 1n the 300 Area. Figure 3-8 shows the elevation of the water table from September 20 to 21, 1994, during the low stage period of the Columbia River. Flow direction was to the southeast in the immediate vicinity of the 300 APT. Figure 3-9 shows the elevation of the water table June 22 to 23, 1994, when the river stage was very near the high for the year. Sometimes a localized flow reversal occurs when the river stage is higher than the water level in the unconfined aquifer. The area involved in these flow reversals depends on the elevation of the high river stage and its duration. On June 22 and 23, 1994, the reversal was only experienced along the shore of the river and inland in the area of wells 399-3-12. In the area of the 300 APT the flow direction in the unconfined aquifer remained mainly toward the southeast. but the southern portion of the 300 APT had a more south to southwesterly flow. However, if the rise in river stage is more than 1 m (3.3 ft) for a sufficient duration (a week or more} the groundwater flow direction throughout most of the area of the 300 APT can be to the south or southwest (Schalla et al. 198Bb, Figure 3-12).
Previous estimates of flow direction in the unconfined aquifer near the 300 APT have been based mainly on water table maps. Water table maps of the area of the 300 APT generally show a groundwater mound or southeast-trending lobe due to the discharge of water from the trenches. This mound or lobe may have a s1gn1ficant effect on the direction of groundwater flow in the area. However, as of January 1995, all discharges of water to the 300 APT have ceased. If the mound or lobe due to water discharge did indeed affect groundwater flow direction while the 300 APT was in operation, then shutting off the water will have an undetermined effect that will be evident in future water table maps.
There is an upward gradient between the uppermost confined aquifer and the unconfined aquifer. At wells 399-l-17A and 399-l-17C the head difference is about 11m (35ft). This supports the conclusion of Swanson et al. {1992) that the 300 Area is within a discharge area far the uppermost confined aquifer, and that, if communication is established between the confined aquifer and overlying unconfined aquifer. the flow direction is upward.
The flow rate in the top of the uncon fi n•i!d aquifer has been reported as about 10.7 m/d (35ft/d) near the 300 APT based on a perchloroethylene spill (Cline et al. 1985). The rate of flow can also be estimated roughly by using the Darcy equation.
where:
v: average linear groundwater velocity K = hydraulic conductivity 1 ~ hydraulic gradient
n. - effective porosity.
3-18
(l)

Figure 3-8. 300 Area Water Table Map, September 20-21, 1994.
300-FF-2 I I
Preens
... , (10S.III
0 400 Meters
0 SOD 1000 Fee1
15-1 (101.1'11
a.._,, (103Miw (10:1"1
04-!1 4-1 300 Area 110UJJ
' I UI'EU (103.111
0
I ~ ! i ~ ; i t . ' ! ;
0 s-1 Well Location 1nd Number (Weill Prefixed by 391·, Except (103.78• Tho.e Beginning wHh S are Prefixed with 69i-)
(Number In paranlheslsll water llbltt elevation In meter1)
• 1-12 Monitoring Network Well (1C3.e> (Number In paronthesll I• w.ter table akivatlon In meter1)
A S'Mio-1 Surlace-Water Monitoring Station
Roads
Water Table COntour In Meters. Contour Interval= 0.1 Meter•. --'\0$.6-- (Nota: Change met~n to feet by multiplying by 3.28)..
--• .. • Generalized GroundWater Flow Direction
Gradient 0.0004.
J-19
R
\
' \ .... 11G144ia

WHC-SD-EN-AP-185, Rev. 0
Figure 3-9. 300 Area Water Table Map, June 22-23, 1994.
300-FF-2
0
I l • !
Procua
0 500 1000 Feet
300-FF-3
1-18A. (100-4»1
,., .. tf,,.,ec
, I I
OS27E1<1 110U1)
~ • • !
0 !·1 Well Location and Number (We lit Prefixed by 399-, Except (HM.74) These Beginning with 5 are Prefixed wHh 699·}
(Number In par11nthetltla water table elevation In meters)
• 1-1-u. MonHorlng Network Well (,011.92) (Number In parenthesis Is watlltf" tabla elevation In meters)
a SWS-1 Surface-Water Monitoring Station
Roads
1_ _ Water Table Contour In Meters. Contour lnterva I = 0.1 Matti's.
--'\CIA· {Note: Change meters to feet by multiplying by 3.28).
--•~~ Generalized Groundwater Flow Direction
Gradient 0.0003.
3-20
HI41101DM

; 1
; ' ' WHeLS'O-EN-A P-185, Rev. 0
Schalla et al. (1988b) reported values of hydraulic conduct1v1ty for the unconfined aquifer in the vicinity of the 300 APT from 150 to 15,000 mjd (500 to 50,000 ft/d) {Table 3-2). Swanson et a1. (1992) reported hydraulic conductivities for the Ringold Formation as 36 and 49 m/d {120 and 161 m/d) for two well sites southwest of the 300 APT. The hydraulic gradient near the 300 APT was 0.0003 for the water table depicted in Figure 3-9 (June 22-23, 1994) and 0.0004 for the water table depicted in Figure 3-8 (September 20-21, 1994). Estimates of effective porosity for the unconfined aquifer range from 0.10 and 0.30. Using the above-stated values for input parameters to the Darcy equation, the range of average linear groundwater velocity is 0.036 m/d (0.11 ft/d) to 61.0 mjd (200 ft/d). The large range in flow velocity values is a result of the large range in values of hydraulic conductivity reported for the aquifer. If it is assumed that the Hanford formation is a major contributor to the hydraulic conductivity parameter in the vicinity of the 300 APT (because of the presence of channels that cause the water table to be within the Hanford formation), then the average flow velocity may be closer to the upper portion of the range, which is supported by the estimate of Cline et al. (1985}.
lhe estimates of groundwater flow rate are based on aquifer conditions in the vicinity of the 300 APT when at least 800 l/min (215 gal/min) are discharged to the trenches. However, flow rates in the future may be much lower than those calculated, since wastewater discharges to the trenches have ceased. After discharges cease, the entire volume of groundwater available in the unconfined aquifer near the trenches must come through the less permeable Ringold Formation sediments upgradient (northwest) of the trenches. Without the mounding effect due to 300 APT discharge, the water table gradient may decrease enough to significantly lower the flow rate (DOE-Rl 1995c). Water table maps constructed in the future, after the local unconfined aquifer has adjusted to the lack of 300 APT discharges, will be helpful in determining any significant change in gradient.
3.3 GROUNDWATER CONTAMINATION HISTORY
3.3.1 Geohydrology and Ground-Water Quality Beneath the 300 Area, Hanford Site, Washington (lindberg and Bond 1979)
The earliest major study of groundwater contamination in the 300 Area is reported in lindberg and Bond (1979). In that study, groundwater samples were collected monthly for one year (during calendar year 1977) from 29 wells in the 300 Area (see Figure 3-10). The samples were analyzed for the following constituents .
3-21

WHC-SO-EN-AP-185, Rev. 0
Radioactive Constituents
Gross alpha Gross beta Gamma scan Uranium Tritium
Nonradioactive Constituents
Bicarbonate Carbonate Calcium Magnesium Sodium Chloride Sulfate Nitrate Chromium Copper Potassium Fluoride pH Specific conductivity
The 29 wells in the sampling network at that time were all constructed of perforated carbon steel casing with dedicated submersible electric pumps. This well type does not meet current regulatory standards (WAC 173-160).
Results showed that calcium, magnesium, sodium, bicarbonate and sulfate were lower in concentration near the 300 APT than in background wells (dilution). Constituents that were found to be in higher concentrations near and downgradient of the 300 APT were gross alpha, uranium, chloride, and nitrate. Presumably, discharges to the trenches were responsible for the constituents with higher concentrations.
3.3.2 Perchloroethylene Plume (Cline et al. 1985)
following two accidental releases of perchloroethylene (PCE) to the 300 APT (454 L [120 gal] on November 4, 1982, and 76 L [20 gal} an July 6, 1984), several wells were closely monitored to track the plume. The follaw1ng wells showed elevated levels of PC£: 399-1-5, -1-2, -1-3, -2-1, -2-2, -3-1, -4-7, and -4-10. Peak concentration of PCE (1,840 ppb) was found in well 399-1-5 about 5 days after the first release. Movement of the peak concentration was estimated at 10.7 m/d {35ft/d) (Cline et al. 1985).
3.3.3 Early Resource Conservation and Recovery Act of 1976 Monitoring (Schalla et al. 1988a and 1988b)
By 1985, a RCRA interim-status groundwater monitoring program for the 300 APT was in effect. The effort was based on the groundwater monitoring requirements in 40 CFR 265.90 (EPA 1984), WAC 173-303-400 (Ecology 1986), and past groundwater monitoring conducted in the 300 Area. The well network,
3-22

•'"'";
Figure 3-10.
• 8-2
i ' ; i ,.WJim..JSD-EN-AP-185, Rev. 0
Location Map for Wells Used in the Study by Lindberg and Bond 1979.
Praeeu Watar Trenches
• 1-4. 8-3
8-1 •
• &-1 Well Location • 699-S29-E12 Well Location Outside 300 Area
Fence
3-23

WHC-SO-EN-AP-185, Rev. 0
which was sampled monthly, consisted of the following 16 wells. Fourteen monitored the upper portion of the unconfined aquifer and two (399-1-8 and -4-1) monitored the base of the unconfined aquifer. The wells are shown on Figure 3-1):
399-1-1 399-1-2 399-1-3 399-1-4
399-1-5 399-1-6 399-1-7 399-1-8
399-2-1 399-3-7 399-3-10 399-4-1
399-4-10 399-8-2 699-S19-El3 699-S30-E16A
Six of the wells have stainless-steel screens, and the other 10 have perforated casings (Table 3-1}.
Based on instructions given in Test Methods for Evaluating So1jd Waste (EPA 1986} and information provided by the facility manager concerning the composition of the wastes, the constituents listed in Table 3-3 were analyzed in the groundwater samples collected from the 16 wells. The U.S Environmental Protection Agency (EPA) guidance suggested that analyses should be conducted for the Primary Drinking Water Standards (DWS} and for specific dangerous waste constituents known to have been discharged to the unit. Additional parameters, such as the contamination indicator parameters that are required for a detection-level program (but not necessary for an alternate or assessment-level program), were added to provide consistency with other interim-status programs. In addition, samples from two wells sampled quarterly were also being analyzed for some additional parameters, including the dangerous waste constituents in WAC 173-303-9905 (Ecology 1986). These additional analyses (Table 3-4) provided information needed for the permitting process and to further ensure that potential contaminants are not being overlooked. The two wells chosen for the extra analyses included one upgradient well (699-S19-El3) and one downgradient (399-1-3).
The dangerous waste constituents list in WAC 173-303-9905 is very similar to the Appendix IX list of 40 CFR 264, Subpart F. However, there are some differences. Those constituents in Appendix IX that are not in WAC 173-303-9905 are listed in Table 3-6. All of the constituents listed in Table 3-6 were analyzed later in all 11 of the wells of the current 300 APT program.
Results of the early analyses under the interim-status program are documented in Schalla et al. (1988a, Tables 6 and 7) and Schalla et al. {1988b). Schalla et al. (1988a), Table 6, (Summary of Constituents Sampled to Date) shows that the herbicides and pesticides on the Interim Primary OWS list were never reported above detection limits nor were the phenols in the 1 1st of water qua 1 tty parameters. Very few of the constituents 1 n the s itaspecific list and almost none of the additional .constituents sampled as part of the WAC 173-303-9905 list were detected. Several other constituents have only been reported above detection limits sporadically. Among those constituents that are regularly reported as being above the detection limit are gross alpha, gross beta, barium, nitrate, sodium, iron, sulfate, chloride, copper, ammonium, vanadium, potassium, chloroform, and methylchloride.
Schall a et al. (1988a), Table 7, (Analytical Data, June 1988-May 1986), compiles the results for those constituents that had at least one value reported above detection limits. Gross alpha and beta both exceeded their
3--24

·. ,, ' ~L . -1
; .. / ~~ I .. . •; : 1 u :~: t WHC-SO-EN-AP-185, Rev. 0
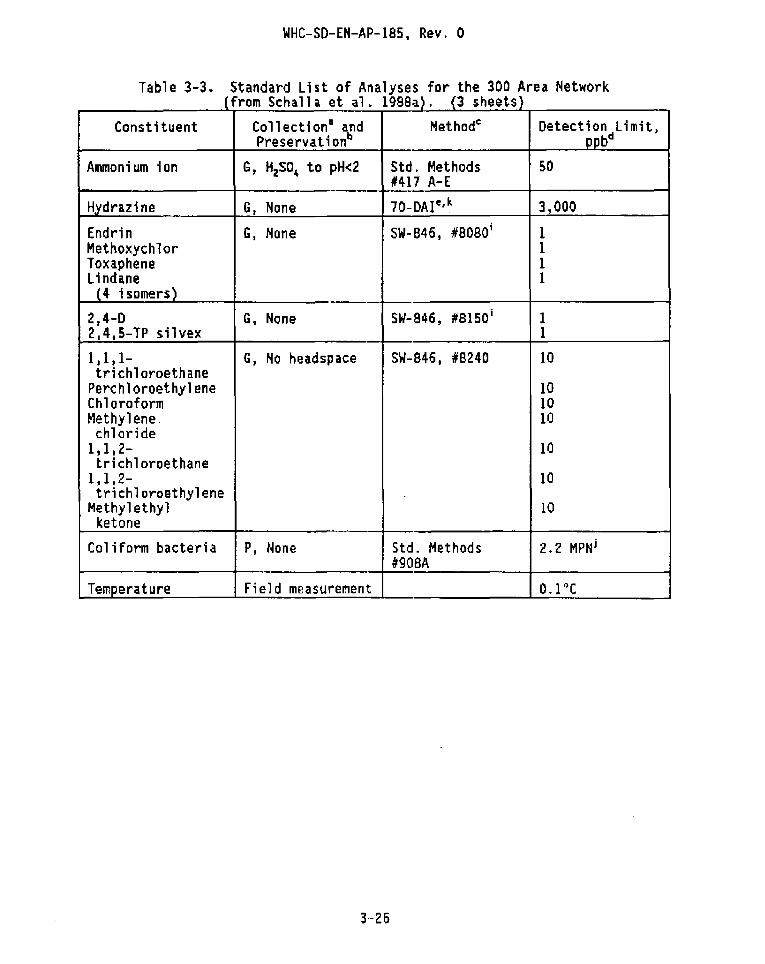
Table 3-3. Standard List of Analyses for the 300 Area Network (from Schalla et al. 1988a}. (3 sheets}
Constituent Collection• ~d Methode Detect 1 on limit, Preservation ppbcl
Barium P, HN~ to pH <2 SW-846, #6010 6 Cadmium 2 Chromium 10 Silver 10 Sodium 100 Nickel 10 Copper 10 Aluminum 150 Manganese 5 Iron 50 Calcium 50 Zinc 5
Arsenic P, HNO, to pH<2 SW-846, #7060 5
Mercury P, HN~ to pH<2 SW-846, #7470 0.1
Selenium P, HNO. to pH<2 SW-846, #7740 5
Lead P, HNCh_ to pH<2 SW-846, #7421 5
Nitrate P, None 70-ICe,t SOD Sulfate 500 Fluoride 500 Chloride 500
Cyanide P, NaOH to pH>l2 SW-846, #9010 10
Sulfide P, zinc SW-846, #9030 1,000 acetate + NaOH to pH>9
Radium P, HNO'~~ to pH<2 EPA Method #903.0 1 pCi/l
Gross alpha P, HN03 to pH<2 EPA Method 4 pCi/L 680/4-75-001
Gross beta P, HN03 to pH<2 EPA Method 8 pC1/L 680/4-75-001
Natural uran1um11 P, HN<>,; to pH<2 20-U-03tt 4 pCi/L
Strontium-901 P, HNO'~~ to pH<2 20-Sr-ozh 5 pCi/L Gamma scanlf P, HN~ to pH<2 30-GS & 40-07h 20 DCi/l CCs)
Total organic G, No headspace SW-846, #9020 100 halogen
Total organic G, H2S04 to pH<2 Std. Methods #505 1,000 carbon
3-25
WHC-SO-EN-AP-185, Rev. 0
Table 3-3. Standard List of Analyses for the 300 Area Network (from Schalla et al. 1988a). {3 sheets)
Constituent Collection' and Methode: Detection limit, Preservationb DDbd
Ammonium ion G, H2S04 to pH<2 Std. Methods 50 1417 A-E
Hydraz1ne G, None 70-DAie,k 3,000
Endrin G, None SW-846, #8080; 1 Methoxychlor 1 Toxaphene 1 lindane 1
(4 isomers)
2,4-D G, None SW-846, #8150; 1 2,4,5-TP silvex 1
1,1,1- G, No headspace SW-846, #8240 10 trichloroethane
Perchloroethylene 10 Chloroform 10 Methylene 10 chloride
1,1,2- 10 trichloroethane
1,1,2- 10 trichloroethylene
Methyl ethyl 10 ketone
Coliform bacteria P, None Std. Methods 2.2 MPNi #908A
Temperature Field measurement o.1 <)c
l-26
·. : '~ wHtL~O-EN-AP-185, Rev. 0
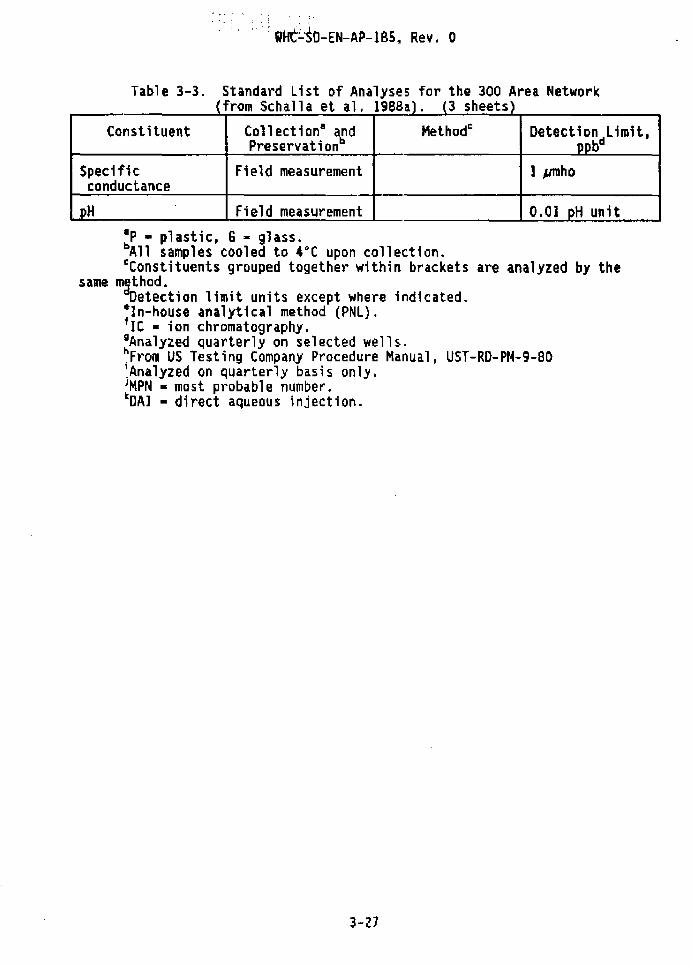
Table 3-3. Standard List of Analyses for the 300 Area Network (from Schalla et al. 1988a). (3 sheetsl
Constituent Co 11 ect 1 on1 ~d Methode: Detection Limit, Preservation _ll!)_bd
Specific Field measurement 1 pmho conductance
pH Field measurement 0.01 pH unit •p • plastic, G - glass. bAll samples cooled to 4DC upon collection. c:constituents grouped together within brackets are analyzed by the
same m~thod. Detection limit units except where indicated.
•tn-house analytical method (PNL}. 1 IC • ion chromatography. 8Analyzed quarterly on selected wells. ~From US Testing Company Procedure Manual, UST-RD-PM-9-80 ~Analyzed on quarterly basis only. JMPN • most probable number. kDAI - direct aqueous injection.
3-27

WHC-SO-EN-AP-185, Rev. 0
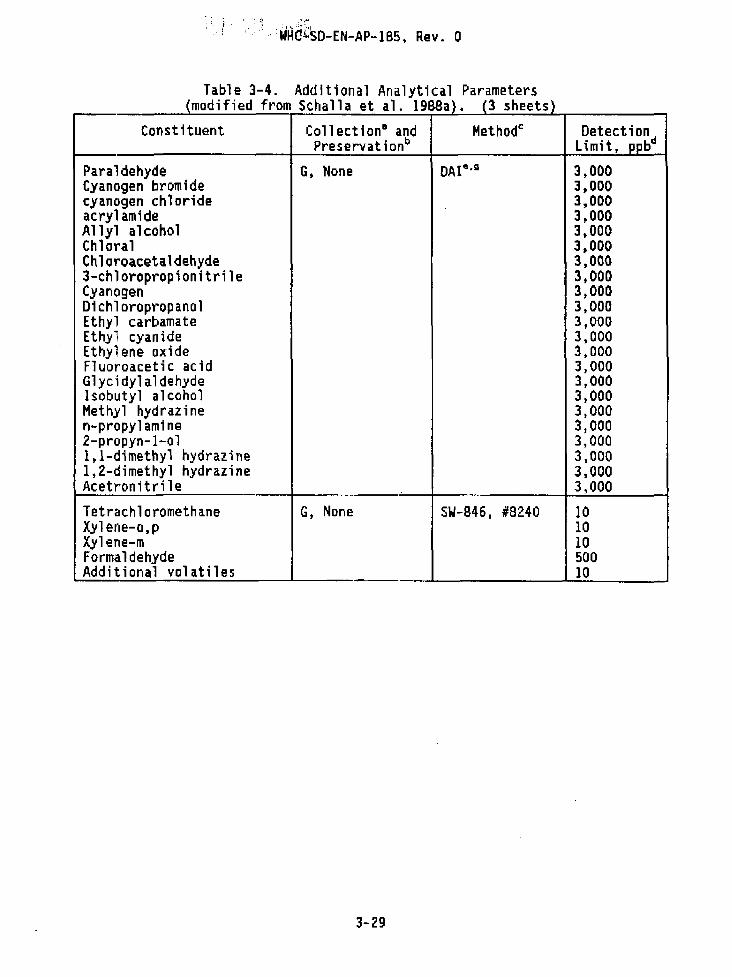
Table 3-4. Additional Analytical Parameters (modified from Schalla et al. 1988a). (3 sheets)
Constituent Collection• a~d Methode: Detect1on Preservation limit. DDbd
Beryllium Osmium
P, HN~ to pH<2 SW-846, #6010 5 300
Strontium 300 Antimony 100 Vanadium 5 Potassium 100
Tha111um P, HNO.., to pH<2 SW-846, #7840 zoo Thiourea G, None SW-846, #8330 200 1-acetyl-2-thiourea (modified) zoo 1-(o-chlorophenyl) 200 thiourea
Diethylstilbesterol 200 Ethylenethiourea 200 1-naphthyl-2-thiourea 200 N-phenylthiourea 200
ODD G, None SW-846, #8180 1 DOE 1 DDT 1 Heptachlor 1 Heptachlor epoxide 1 Dieldrin 1 Aldrin 1 Chlordane 1 Endosulfan I 1 Endosulfan II 1 Chlorobenzil ate 100
2,4,5-T G, None SW-846, #8150 1
Perchlorate P, None 70-Ic··1 1,000 Phosphate 1,000
Carbophenothion G, None SW-846, #8140 2 Tetraethyl pyrophosphate 100 Disolfoton 2 Dimethoate 5 Methyl parathion 2 Parathion 2
Citrus red #2 G, None AOAC, #34.015B 1,000
3-28
.··· ! · . ··. ·!· · WHdiso-EN-AP-185, Rev. o
Table 3-4. Additional Analytical Parameters (modified from Schalla et al. 1988a). (3 sheets_l
Constituent Collection• and Methode: Detection Preservationb limit, ppbd
Paraldehyde G, None DAie.s:~ 3,000 Cyanogen bromide 3,000 cyanogen chloride 3,000 acrylamide 3,000 Allyl alcohol 3,000 Chloral 3,000 Chloroacetaldehyde 3,000 3-chloropropionitrile 3,000 Cyanogen 3,000 D1chloropropanol 3,000 Ethyl carbamate 3,000 Ethyl cyanide 3,000 Ethylene oxide 3,000 Fluoroacetic acid 3,000 Glycidylaldehyde 3,000 Isobutyl alcohol 3,000 Methyl hydrazine 3,000 n-propylamine 3,000 2-propyn-1-ol 3,000 1,1-dimethyl hydrazine 3,000 1,2-dimethyl hydrazine 3,000 Ac:etronitrile 3,000
Tetrachloromethane G, None SW-846, #8240 10 Xylene-o,p 10 Xylene-m 10 Formaldehyde 500 Additional volatiles 10
3-29
WHC-SD-EN-AP-l85t Rev. 0
Table 3-4. Additional Ana~ytical Parameters (modified from Schalla et al. l988a}. (3 sheetsl
Constituent Co 11 ect i on• and Preservationb
Method" Detect ton Limit, ppbd
Hexachlorophene G, None SW-846, #8270 10 Naphthalene 10 Phenol 10 Kerosene 10 ppm Hexachlorobenzene 10 Pentachlorobenzene 10 1,2-dtchlorobenzene 10 1,3-dtchlorabenzene 10 1,4·d1chlorobenzene 10 1,2,3-trichlorobenzene 10 1,3,5-trichlorobenzene 10 1,2,3,4-tetrachlorobenzene 10 1,2,3,5-tetrachlarobenzene 10 1,2,4,5-tetrachlorobenzene 10 Additional semi-volatiles 10
Ethylene glycol G, None GC/FID11'h 10 ppm
•p • plastic, G =glass. bAll samples cooled to 4oC upon collection. ~constituents grouped together within brackets are anlyzed by the same
method doetect1on 11mit units except where jndicated. ~In-house analytical method (PNL). 'IC • ion chromatography. gOAl - direct aqueous injection. ~GC/FID = gas chromatography /fl arne ion i zat 1 on detector.
3-30

; ! I =!
WHC-50-EN-AP-185, Rev. 0
screening limit for Interim Primary DWS. Gross alpha and uranium are closely correlated (Schalla et al. 1988b). However, subtraction of uranium from gross alpha would probably bring gross alpha to below the "adjusted • gross alpha limit (15 pCi/L). Chromium, mercury, selenium, and fluoride were reported as being above Interim Primary DWS at least once.
3.3.4 Recent Resource Conservation and Recovery Act of 1976 Groundwater Monitoring
In 1985 and 1987, 18 new wells (figure 3-11) were installed to enhance the understanding of hydrogeology at the 300 APT and to help characterize the direction and extent of contamination in Hanford and Ringold Formation sediments. The new wells, wh1ch were designed to meet WAC 173-160 standards, included three well clusters (399-l-16ABC, 399-1-17ABC, and 399-1-18ABC) and eight single wells. Each well cluster included one well in the upper portion of the unconfined aquifer ("A" well), one well at the bottom of the unconfined aquifer (·s~ well), and one well in the uppermost confined aquifer below the Ringold Formation lower mud unit ("C" well) .. Total number of wells in the network temporarily rose to 34 (16 original plus 18 new wells). The samples from the network of 34 monitoring wells were analyzed for a list of constituents. which included the list of dangerous waste constituents in WAC 173-303-9905 (PNL 1988). Later some wells were dropped because they did not meet WAC 173-160 standards. However, other wells (e.g., 399-2-1 and 399-3-10) were added even though they did not meet WAC 173-160 standards. They were added because they were in good positions to intercept contaminants flowing southeast from the 300 APT that had passed wells closer to the trenches. Wells added that did not conform to WAC 173-160 standards provided data for information and supplementary purpnses only. Important RCRA unit decisions could not be made based on data from wells that did not meet the WAC 173-160 standards.
Since 1989, wells were periodically dropped from the network and the sampling schedule was changed from monthly to quarterly and eventually to semiannually. These changes were made because data quality objectives (DQO) in the groundwater monitoring plan (Schalla et a1. 198Ba) regarding hydrogeology and contamination were satisfied, the ERA in 1991 significantly reduced contamination in the trenches, and fewer wells sampled less frequently would still provide adequate groundwater monitoring. Currently the well network has been reduced to 11 wells sampled semiannually (Figure 3-12). Table 3-5 lists the 11 wells, the aquifers screened, sampling frequency, frequency of water level measurements, and compliance with WAC 173-160 standards. Table 3-7 lists the contaminant constituents analyzed in the current monitoring well network and the frequency of the sampling. One well (399-1-·17A) 1s still sampled quarterly in order to comply with regulatory requirements for quarterly sampling for s1tes under groundwater quality assessment programs and to provide a rapid detection or early warning for any new contaminants inadvertently discharged to the 300 APT prior to January 1995 when lines to the trenches were ~blanked" off.
3-31

WHC-SD-EN-AP-185, Rev. 0
Figure 3-11. locations of Monitoring Wells Added to the Network 1n 1986 and 1987 .
i • I
• 1·13 Added W•ll
------------ F11nce
0 1,000 Feet '~ _j
• 1·18A, 8, C
1·14A, B •
Process Water Trenct..
I ~ }
North Process
,_ma, ·1-10A. 8
1•13 • 1-1~ Pond
1-1D l f':"';;' • • 1•16A, 8, C, D
.J •·uA. B, C I I
D ,.,/ Sanitary Leeching
~ Q _ Trenci'Mia
? \[r[j \ r::::l D c::J South Process [] 0 I!Jc:~r~C D Pond .. ,.e~~~~
~IJ[i::J D 0 i c DDl:!J b D c ltl 10
D ~rJ Da~ ..........-:IL 4-11
c=J c:;:r ~ D l a· 6 ,............,--...., r---.~
1 nc ~ ! !
4
3-32
I::::J
H9504043.10

.·, ... , ·,; · .. :i <
•. I ,=
~" ;. -.uie'JSo-EN-AP-185, Rev. 0
Table 3-6. Appendix IX ConJtituents Not in WAC 173-303-9905 List. {3 sheets)
Appendix IX Constituent SW-846 Method •
Acena.I_lhthalene 8270
Acenaphthylene 8270
Acetone 8240
Allyl chloride 8240
Aniline 8270
Anthracene 8270
Antimony 6010
Aramite 8270
Benzo[k]fluaranthene 8270 --Benzo[ghi]perylene 8270
Benzyl alcohol 8270
alpha-BHC 8080
beta-BHC 8080
delta-BHC 8080
gamma-BHC; lindane 8080
Bis{2-chloro-1-methyl-ethyl} ether; 8270 2,2'-0ichlorodiisopropyl ether
Bromodichloromethane 8240
4-Chlorophenyl phenyl 8270
Chloroprene 8240
Cobalt 6010 -Copper 6010
Dibenzofuran 8270
01bromochloromethane; 8240 Chlorodibromomethane -1,2-Dibromo-3-chloro-~ropane; DBCP 8240
p-(Oimethylaminoj azobenzene 8270
Dinoseb; DNBP; 2-sec-Butyl-4,6- 8270 din1trophenol
Ethyl benzene 8240
3-35

WHC-SD-EN-AP-185, Rev. 0
Table 3-6. Appendix IX Con~tituents Not in WAC 173-303-9905 (3 sheets} list.
Appendix IX Constituent SW-846 Method*
Fluorene 8270
Jsodrin 8270 --Isophorone 8270
Methoxychlor 8270
Methylene bromide; Dibromomethane 8240
Methylene chloride; Dichloromethane 8240
2-Hethylnaphthalene 8270
4-Methyl-2-pentanone; Methyl 8240 isobutyl ketone -· o-Nitroaniline 8270
m-Nitroaniline 8270 -· Nitrobenzene 8270
p-Nitrophenol 8270
N-Nitrosodiphenylamine 8270
N-Nitrosodipropylamine; 8270 Di-n-propyl nitrosamine
Phenanthrene 8270
Pyrene 8270
Safrole 8270
Styrene 8240
Sulfide 9030
Tin 6010 --Vanadium 6010
3-36

; ': --~c-~!:Oi~N-AP-185, Rev. 0
Table 3-6. Appendix IX Con~tituents Not in WAC 173-303-9905 list. (3 sheets)
Appendix IX Canst ituent SW-846 Method•
Vin,Yl acetate 8240
Xylene 8240
Zinc 6010
•constituents listed here were analyzed in all 11 wells of the 300 API {Figure 3-12) by the methods listed.
SW-846 Methods. 6010- ICP Metals (see Table 4-1, this document). 8240 - Volatile Organic Analysis (Gas Chromatograph since 1994, Gas·
Chromatograph/Mass Spectrometer before 1994 -·See Table 4-4, this document). 8270- Semi-Volatile Organic Analysis !Analyzed in all eleven 300 APT
wells during the period 5/88-5/90). 8080- Pesticides (see Table 4-1, this document). 9030- Sulfide (Analyzed in all ll 300 APT wells 2/87-5/90).
3-37

WHC-SD-EN-AP-185, Rev. 0
Table 3-7. Constituents Analyzed in the Current Monitoring Well Network.
Semiannual Schedule - All 11 300 APT Network Wells
Alkal1nity Gross Alpha Gross Beta Uranium Coliform Spectfic Conductance (Lab) ICP Metals (including arsenic, selenium, and lead) - unfiltered ICP Metals (including arsenic, selenium, and lead) - filtered Mercury·- unfiltered Mercury - filtered pH (Lab) Radium TOC TOX Tritium Volatile Organics Analysis {GC)
Quarterly Schedule - Well l-I7C Only
Anions Specific Conductance (Lab) Garrma Scan pH (Lab) Strontium-90 TOX TOC Isotopic Uranium Uranium Volatile Organics Analysis (GC)
3-38

. . ' . ; ' . i ... i . •' l . 1! ·;_ ' ~ ::.
. ~Ht~~D-EN-AP-185, Rev. 0
Results of groundwater sampling and analysis since Schalla et al. (1988a; 1988b) are reported quarterly (data only) and annually (including interpretations) as RCRA reports by the Westinghouse Hanford Company (WHC) Groundwater Management Group for the U.S. Department of Energy (DO£). The following 1s a summary of results since 1987.
Only chromium, lead, selenium, lindane, and gross alpha have values larger than the maximum contaminant levels (MCls). Chromium exceedances (Appendix C) may be the result of an excessive amount of suspended particles (turbidity} 1n groundwater samples because the exceedances are associated with unfiltered samples. lead exceedances occurred prior to the ERA (1991) 1n two wells that did not meet WAC 173-160 standards for construction. Since the ERA, lead concentrations have been below the MCL of 50 ~g/l. Exceedances of selenium and lindane may actually be analyttcal problems due to detection limits that are higher than respective MCls. Other constituents of interest such as gamma-emitting radionuclides and strontium-90, copper, sulfate, zinc, chloride, and silver were all below the Primary and Secondary DWS or the 4 mremjyr equivalent concentration for radionuclides (Appendix C). (Gross alpha and uranium are discussed later).
Volatile Organic Analysis (VOAs) results indicate that several constituents are detected in downgradient wells of the 300 APT well network. The detected VOA constituents include PC£, toluene, xylene, benzene, TCE, chloroform, ethylbenzene, and cis-DCE (Appendix C). However, only TCE and cis-DCE are consistently above the DWS of 5 and 70 ~g/L, respectively. The well showing the exceedances of TC£ and cis-DCE is 399-1-169, which is a downgradient well screened at the bottom of the unconfined aquifer {Figures 3-13 and 3-14).
Concentrations of iron and manganese In filtered samples are consistently higher than DWS for two wells, iron in well 399-1-178 and manganese in well 399-1-168 and 399-1-178 (Appendix C). Both wells are screened at the bottom of the unconfined aquifer. These results may be due to reducing conditions and the effect on well structures such as stainless steel casing and the effects of drilling. A similar relationship between sampling depth and concentration profiles for redox-sensitive species has been documented in Johnson et al. (1994}.
Uranium continues to be detected in several wells in the vicinity of the 300 APT and is correlated with gross alpha {Schalla et al. 1988b, Section 7.2; Appendix C; Figure 3-15). The 1991 ERA reduced the concentrations of gross alpha and uranium (Appendix C) significantly in wells downgradient of the 300 APT. Currently, uranium concentrations at wells 399-1-17A and 399-1-lOA are above the EPA (proposed) guidance value of 20 ~g/l for total uranium (EPA 1991). The MCL for gross alpha is based on the exclusion of the uranium component, which is referred to as "adjusted" gross alpha. In a few cases, the adjusted gross alpha concentrations have exceeded the 15 pCi/l (adjusted) gross alpha standard {EPA 1991; 40 CFR 141.15). However, on the average, the standard is not exceeded in any of the downgradient wells. The occasional exceedances of the adjusted gross alpha standard are attributed to random fluctuations in the measurement of gross alpha and uranium, andjor perhaps due to the presence of some residual radon decay products. Specific isotopic analyses (e.g., plutonium-238, 239, 240 and americium-241) would be needed to
3-39

WHC-SD-EN-AP-185, Rev. 0
Figure 3-13. Tr1chloroethene Plume.
Trlchloroethene Plume May • October 1994
1-178 Well Number (prefix 399) • Well Location
.11 TCE Concentration In ppb
Contour Interval= 1 ppb
0 1000 Feet
0 300 Meters
1·11 •
.11
1·14 • _,,
300 Area-" Process Trenches
lnferre~ Groundw;ler "'
Flow Direction
3-40
1·108 • .11

~ . . ~.
l '" 'i ' . "WHt~~O-EN-AP-185, Rev. 0
Figure 3-14. CJS 1,2-Dichloroethene Plume.
CIS 1.2·Dich!oroethene Plume October· December 1994
1·11B Well Number (prefix 399) • Well Location
1.40 DCE Concentration In ppb
Contour Interval= 25 ppb
0 1000 Feet
0 300 Meters
1-18 • .11
1•14 •
. 11
300 Area"' Process Trenches
lnferr~ Groundwiter'
Flow Direction
3-41
1·12 • . i 1
1·10A • . 11
""505013.2

WHC-SO-EN-AP-185, Rev. 0
Figure 3-15. Uranium Plume.
l.(rgnlum PILUDI October· December 1994
~ 1·1iA,B Well Number (prefix 399) 1·18A,B\ Well Location • •
40 I -N-10.9 Uranium Concentration I
I
~ lnppb I l
I I
Contour Interval= 5 ppb \ 0 1000 Feet .... ....
0'1
0 300 Meiers
300 Area rl Process
Trenches i: i ~ • :!
~--- ~ ... lnferre • ---
Groundw Flow
Direction ·""' .,
3-42

rule out the presence of other alpha emitters in groundwater at this site since they have not been previously excluded on the basis of direct measurements in groundwater at the 300 APT. However, based on soil column analytical results {DOE-RL 1995a, Appendix 70) and the expected chemical behavior of plutonium and americium, it is highly unlikely that transuranics are present in groundwater beneath the 300 APT.
3.4 CONCEPTUAL MODEL FOR LOCALIZED 1 DEEPN AQUIFER OCCURRENCE OF CHLORINATED HYDROCARBONS
A conceptual model is needed to explain the persistent occurrence of TCE and related degradation products in one downgradient well completed at the bottom of the unconfined aquifer {-166) (Figures 3-13 and 3-14). One possible explanation is that a liquid phase of PC£ (density 1.6 g/ml} settled to the bottom of the aquifer beneath the 300 APT. Slow dissolution and microbial degradation of the free phase would then provide a long-term source of PCE and degradation products (TCE and OCE) to the deeper zone of the unconfined aquifer. Since well -16B is downgradient from the trenches, this well would be in the contaminant plume from such a source. If this explanation is correct, it should be consistent with the hydrogeology and hydraulic setting previously d1scussed.
For example, the Darcy velocity, see Equation (1), is 0.0016 m/d using an average hydraulic conductivity of 1.4 m/d for the bottom of the unconfined aquifer at 300 APT (Table 3-2), an average gradient of 0.00035, and an effective porosity of 0.3. The observation well is over 300m (984 ft) downgradient from the trench, suggesting a travel time of greater than 500 years. Since the recorded spills occurred in 1982 and 1984, the computed travel time is inconsistent with this conceptual model. It is also noteworthy that PCE and degradation products were detected shortly after well -168 was installed in 1987 (Appendix C).
Thus, it seems unlikely that the observed chlorinated hydrocarbons in -166 are related to the recorded spills in 1982 and 1984. One alternative possibility is that, during the early years of operations, undocumented ground disposal occurred in the upgradient vicinity of the well. Since this is currently the only well with a persistent occurrence of significant concentrations of chlorinated hydrocarbons, a local source near the well is suggested.
Additional field work would be needed to investigate the possibility of soil dump sites near well -168 and or to distinguish among other possible alternatives. These possibilities should bf considered if the groundwater MCL exceedances for TCE and related degradation products persist.
3-43

WHC-SO-EN-AP-185, Rev. 0
This page intentional1y left blank.
3-44

: i " w:H'hiso- EN-AP-185, Rev. o
4.0 GROUNDWATER MONITORING PROGRAM
Chapter 4.0 describes the groundwater monitoring act;v;ties to be conducted at the 300 APT during the compliance period (including the closure period) for this unit. The groundwater monitoring program is designed to (1) protect human health and the environment; {2) comply with the intent of final status groundwater monitoring requirements of WAC 173-303-645 (Ecology 1986) and 40 CFR 264 Subpart F; and {3) conduct groundwater investigations or remediation, should it become necessary, in a technically sound and cost effective manner.
Three levels of groundwater monitoring programs are identified under final status regulations: (1) detection monitoring, (2) compliance monitoring, and {3) corrective action {Figure 4-1). Each monitoring program is briefly described below.
Detection level monitoring program. Indicator parameter data (e.g •• pH. s-pe-dffc--cond-Lidfrice. -TOC, TOX, or heavy metals, waste constituents. or reaction products) from downgradient compliance point wells are compared with background wells data semiannually to determine 1f the unit is impacting the groundwater quality.
Compliance level monitoring program. lf groundwater sampling during the detection level monitoring program reveals a statistically significant increase (or pH decrease} over upgradient background concentrations for groundwater, a compliance level monitoring program is established. The monitoring objective is to determine whether groundwater concentration limits have been exceeded at the downgradient {compliance) wells.
Corrective actjon level monitoring orogram. If the referenced concentration limit(s) for a given groundwater parameter or parameters are significantly exceeded during compliance monitoring, a corrective action level monitoring program will be developed and implemented to protect human health and the environment.
4.1 OBJECTIVES OF GROUNDWATER MONITORING PROGRAM
The 300 APT groundwater monitoring prl)gram bypassed the detection-level stage and went directly into a RCRA interim··status (assessment) level program in June 1985. The detection-level monitoring program was bypassed because groundwater was already known to be contaminated. Monitoring wells were constructed in response to a Consent Agreement and Compliance Order issued jointly by Ecology and the EPA (Ecology and EPA 1986).
The 300 APT is scheduled to be included the final-status RCRA Permit as a TSD unit undergoing closure through the perntit modification process in September 1995. The groundwater near the 300 APT needs to be monitored under a final status program that is comparable or equivalent to the assessment level initiated under the interim status. ~ence. a compliance monitoring program is proposed for the 300 APT. The proposed compliance monitoring program will (l) obtain samples that are representative of existing groundwater conditions; (2) identity key monitoring constituents that are
4-l

WHC-SD-EN-AP-185, Rev. 0
figure 4-1. A Statistical Perspective of the Sequence of Groundwater Monitoring Requirements Under the Resource Conservation
t ...,. ............... ,..
Upgradlent (background} Downgradlent
A ~L U' UL Detection Monitoring
--~...r....L--......... ~-=-------- No Release
Trigger Compliance
_.._..._.__._~J.,..I,;;:-"""--........ ~-- Monitoring
c Compliance -----..-:;;...If--........__...-.._;=--- Monitoring
Trigger E D Corrective i= ------~-=-....__..___~-Action
Corrective E Action ------~-__....~.-~~--- Begins
Corrective F Action __ .-.-c;....,~...._ ........ _...,L...:~......_ ___ Continues
Return to G Compliance --=-L--___. _ ___.-.;p-.------ Monitoring
Concentration
Null Hypothesis
Clean
Alternauve Hypothesis
Contaminated
Nult Hypothesis
Contaminated
Alternative Hypothesis
CJean
UL =Upper Limit LL = Lower Limit
(Notice that until contamination above a risk standard is documented (D) the null hypothesis Is tl'1at the facility Is clean. Once the facility has been proven to be In exceedance of a health criteria then the null hypothesis Is that the facility is contaminated until proven otherwise (G).
He401016.1
4-2

;_ ..
·. · .. i 'W~~!So-EN-AP-185, Rev. 0
attributable to past operations of the 300 APT; (3) determine applicable groundwater concentration limits (e.g., risk-based maximum concentration limits}; and (4) determine whether referenced groundwater concentration limit(s) for a given parameter or parameters are exceeded. A DQO process is used to guide the groundwater monitoring activities to be conducted for the 300 APT. The primary purpose of the OQO process is to ensure that the type, quantity, and quality of groundwater monitoring data used in the decisionmaking process are appropriate for their intended applications. Details concerning the DQO process can be found in f.PA (1993}.
4.2 DANGEROUS WASTE CONSTITUENTS
Section 4.2 identifies constituents that are attributable to past opera t 1 ons of the 300 APT. Groundwater chemistry s amp 1 es are co 11 ected quarterly from well 399-l-17A to provide near-trench monitoring of contaminants. All other wells in the monitoring network are sampled semiannually. Monitoring results have been reported in the RCRA quarterly and annual reports. Since 1987, a very large amount of hydrogeologic and contaminant data have been collected from the 300 APT wells. Consequently. the rate, extent, and concentrations of groundwater contaminants originating from the 300 APT are well understood (WHC 1990). Furthermore, an ERA was initiated in July 19g1. The ERA removed a layer of contaminated sediments containing uranium, copper, chromium, and silver. In January 1995, the 300 APT was permanently isolated from the process sewer (its only source of effluent), therefore eliminating the trenches as a source of groundwater recharge.
Groundwater monitoring results are available from the Hanford Environmental Information System (HEIS) and the Geosciences Data Analysis ToolKit (GeoDAT). The following are considered when deriving a constituent list appropriate for the 300 APT:
• Inventory/process knowledge • Driving force • Contaminant mobility • Preferential pathways • Monitoring objectives • Detection history at the unit.
Per WAC 173-303-645 and 40 CFR 264, Subpart F, groundwater concentration limits must be established in the faciltty permit {by the regulators). These limits are not to be exceeded. These concentration limits may be different than the risk-based groundwater cleanup standards as required by the Method C (industrial scenario) of the Model Taxies Control Act, WAC 173-340-720(4}. Table 4-1 summarizes the status of 14 constituents where groundwater concentration limits have been established (see WAC 173-303-645(5)(a), Table 1).
Only chromium, lead, selenium, and lindane have values larger than the MCLs given in WAC 173-303-645(5)(a), Table 1. Chromium exceedances were isolated events that were probably caused by suspended particulate in the unfiltered samples. Lead exceedances were observed, prior to the 1991 ERA, in two non-RCRA wells. After the ERA, lead concentrations have been below the
4-3

WHC-SD-EN-AP-185, Rev. 0
Table 4-1. Status of Monitoring Results for Constituents in the 300 Area Process Trenches for Groundwater Protection.
Constituent• MCL MCL. Exceed Concentration Rangeb {mg/L) (p.g/l) (Y/N} 11'9/LJ
Arsenic 0.05 50 N <0.64 - 6.7 {unfiltered} <0.64 - 6.2 (f11tered}
Barium 1.0 1,000 N <2.0 - 70 (unfiltered) <2.0 - 70 (filtered)
Cadmi urn O.Olc lOC yd <10 (unfiltered) <10 _(filtered}
Chromium 0. osc sac y 4 occurrences observed in unfiltered samples from wells 3-1-12 {150 ppb), 3-l-16A (147 ppb), 3-1-17A {140 ppb), 3-1-lSA {120 ppb).
Lead 0.05 50 '{ 2 occurrences (in 1985) observed in unfiltered samples from non-RCRA standards wells 3-2-1 (55 and 58 ppb) and 3-3-10 ( 77. 5 and 73. 5 ppb).
Mercury 0.002 2 N <0.2 (unfiltered) <0.2 _!filtered)
Selenium 0.01 10 yd <20 (unfiltered) <10 (filtered)
Silver 0.05 50 N <20 (unfiltered) <20 {fiHered)
Endrin 0.0002 0.2 y.J < 1 (a 11 s amp l e s)
Lindane 0.004 4 N <0.05 (all samples)
Methoxychlor 0.1 100 N <2 {all sam_p_les)
Tox~hene 0.005 5 N <2 {all sam_Q_les)
2,4-D 0.1 100 N <10 (all sam~lesl
2,4,5-TP sllvex 0.01 10 N <2 {all sam_g_les) MCL • max1mum contam1nant level. Y/N ;• yes;no. 8 from WAC 173-303-645 (S)(a). bfrom results analyzed by DataChem laboratories (after 12/31/91}. cMCls for chromium and cadmium have been revised to 0.1 mg/l {100 ~9/L)
and to 0.005 mg/L (5 ~g/L), respectively, per 40 CFR 141.62 (b}(S). effective 7/30/92.
dall samples were essentially not detected (exceedances due to detection limits larger than required MCLs).
4-4

MCL of 50 ~g/l. All samples analyzed for cadmium, selenium, and lindane were essentially non-detects and the exceedances were caused by detection limits that were higher than the respective MCls. Other constituents of interest (e.g., copper, sulfate, zinc, chloride, silver, gamma-emitting radionuclides, and strontium-90) were all below the Primary and Secondary OWS or the 4 mremjyr equivalent concentrations for radionuclides (see Tables 4-2 and 4-3}. Gross alpha and uranium exceedances were observed in all wells in the monitoring network except for wells 3-1-14A, 3-1-168, 3-1-178, and 3-1-18A. Gross beta exc~edances were observed in wells 3-1-lOA, 3-1-11, and 3-1-16A. In general, the excess beta can be accounted for by the beta decays associated with the uranium-238 present in the groundwater samples from the 300 APT wells that exhibit gross beta levels >50 pCijl.
An evaluation of VOA results revealed that detected analytes include PC£, toluene, xylene~ benzene, TCE, chloroform, ethylbenzene, and cis-DCE (see Table 4-4). Only TCE and DCE have been observed in well 3-1-168 consistently above the DWS of 5 and 70 ~g/l, respectively. Unplanned releases (two spills) of PCE occurred in 1982 and 1984.
Concentrations of iron and manganese ·n filtered samples are consistently higher than the respective OWS in two wells (3-1-176 for iron, 3-1-166 and 3-1-176 for manganese) of the 300 APT network (see Table 4-3}. These two wells were completed at the botton of the unconfined aquifer. The elevated iron and manganese concentrations observed in the "deep" unconfined aquifer are probably influenced by chemical reducing conditions (i.e,, the absence of oxygen and negative oxidation-reduction potentials). A similar relationship between sampling depth and concentration profiles for redox sensitive species has been documented in WHC (Johnson et al. 1994). A limited follow-up geochemical investigation is needed. Measurements of Eh (redox potential) and dissolved oxygen should be determined for these two wells to confirm that the hypothesized reducing conditions exist at these wells. Metals (iron and manganese) will be added to the list of monitoring constituents if it can be demonstrated that the elevated concentrations are caused by other than chemical reducing cond·itions.
Uranium was the most significant and widespread groundwater contaminant resulting from past operations of the 300 APT. The mitigating action of the ERA reduced uranium concentrations in well 3-1-17A significantly. Currently, uranium concentrations at wells 3-1-17A and 3-1-10A have remained above the EPA oroposed guidance value of 20 ~g/l for :ota1 uranium (EPA 1991). However, the EPA proposed standard of 20 ~g/l applie:; to community and nontransient, noncommunity water systems. This may be ul:ra conservative for the 300 APT.
Based on the above considerations, th•~ following constituents are proposed for the initial monitoring program to comply with WAC 173-303-645(4). The list will be reassessed periodically an1i revised should there be a need to update the monitoring list.
4-5

Table 4~2. Status of Monitoring Results for Other Hazardous Chemical Constituents in the 300 Area Process Trenches for
Groundwater Protection.
Constituent• MCL MCL Exceed Concentration Rangeb (rng/l) (J'Q/ll _iY/N) (ttg/l)
Copper 1.0 1.000 N <2.0 - 20.0 (unfiltered} <2.6 - 20.0 (filtered)
Iron 0.3 300 y 3-1-178 (320- 450), in filtered samples
Manganese 0.05 50 y 3-1-168 (67- 74), 1n filtered samples 3-1-178 (67- 83}, in filtered samples
Sulfate 250 250,000 N (11 ' 000 - 53, 000)
Total Dissolved 500 500,000 N (221,000- 248,000}, TDS Sol ids (TDS) data in well 3-1-lOA only
Zinc s 5,000 N <3.44 - 24.0 {unfiltered) <3.44 - 23.0 (filtered)
Chloride 250 250.000 N (4,600 - 150,000) MCL = max1mum contam1nant level. Y/N = yes;no. •from 40 CFR 143.3 Secondary Maximum CDntaminant Levels. bfrom results analyzed by Datach~~m Lab1lratories (after 12/31/91).
4-6

Table 4-3. Status of Monitoring Results for Radiological Constituents in the 300 Area Process Trenches for Groundwater Protection.
Constituent MCL MCL (pCi/L) (.ug/L)
Gross Alpha 15
Uranium 20a
Gross Beta 50
Sr-90 8
Tc-99 900
Tritium 20,000
Cs-137 200
Co-60 100
MCL *maximum contaminant level. Y/N = yesjno.
Exceed l'fJN}_
'{
y
't
N
N
N
N
N
Concentration Rangeb (J.LgLLl
exceedance observed in all wells except for in wells 3-1-14A, 3-1-168, 3-1-178, and 3-1-lSA
exceedance observed in all wells except far in wells 3-1-14A, 3-1-168, 3-1-178, and 3-1-lSA
exceedance observed in wells 3-1-lOA (13.6 -68), 3-1-11 (6.51- 63), and 3-1-IGA 120 - 8~)
essentially all NO
(10 - 281) in 3-l-10A, where the upper value 281 was flagged with a "R" {rejected) for gross a and gross f3 anal_yses
highest range of concentrations were observed in well 3-1-18A, (10,900 - 11,500) indicating upgradient source of contamination
essentially all NO
essentially all NO
'From Federal Register, Vol. 56, No. 138, 7/18/1991, Proposed Rule: National Primary Drinking Water Regulations, Radionuclides (EPA 1991).
bFrom results analyzed by DataChem Laboratories (after 12/31/91).
4-7

Table 4-4. Status of Monitoring Results for Detected VOA Constituents in the 300 Area Process Trenches for Groundwater Protection.
Constituent• MCL MCL Exceed Concentration Rangeb (mg/L) (Jl9 /l)
Ethyl benzene 0.7 700 Toluene 1 1,000
Tetrachloroethylene 0.005 5
Xylenes 10 10,000
Ci s-1, 2-DCE 0.070 70
Chloroform None None
Benzene 0.005 5
TCE 0.005 5
MCL =maximum contaminant level. ~IN .. yestno. NA • not applicable.
(Y/N)_ (~-t9/L)
N 0.06 - 0.08
N 0.03 - 0.06
N 0.09 - 0.74
N 0.05 - 0.08 '( exceedance observed in
well 3-l-16B"
NA 0.06 - 9.30 {GC) 1.40- 22.0 (GC/MS)
N 0.02 - 0.06
~ exceedance observed in well 3-I-16Bc
8 VOA analyzed by Gas Chromatography (GC) and/or Gas Chromatography/Mass Spectrometry (GC/MS).
bFrom results analyzed by DataChem Laboratories (after 12/31/91}. "See time vs concentration plots in Appendix C.
4-8

• Radionuclides--chemical uraniurr
• VOAs--TC£ and DCE
• Metals--iron and manganese will be added to the list depending on the outcome of follow-up geochemical investigations (i.e., if elevated levels are not due to chemical reducing conditions.
Additional constituents will be collected (see Section 4.5.1).
4.3 GROUNDWATER MONITORING WELLS
The proposed groundwater monitoring network for the 300 APT contains eight wells set up as four pairs of deep and shallow wells for the unconfined aquifer (Table 4-5). Three of the well pairs are downgradient and one pair is upgradient {figure 4-2). The wells were selected in order to fulfill the requirements for monitoring well networks for RCRA sites in compliance programs of final status (WAC 173-303-645). Appendix A contains the well construction and completion summaries, including schematics, for the eight wells. Specifically, the objective was to select wells that would monitor the appropriate portion of the aquifer for waste constituents of concern. In the case of the 300 APT the constituents of concern are TCE, DCE, uranium, and possibly iron and manganese (see Section 4.2). All but TCE and DCE are migrating through the upper portions of the unconfined aquifer. TCE and cis-DCE are detected in wells monitoring the base of the unconfined aquifer (see Section 3.4). Therefore, wells screened in the bottom portion of the aquifer are appropriate too, both down- and up-gradient. The three downgradient well pairs (3S9-l-10AB, 399-l-16AB, and 399-l-17AB} are east, southeast, and south, respectively, of the 300 APT to intercept any groundwater contaminants emanating from the 300 APT and flowing with the groundwater in directions consistent with historical data. Based on the Monitoring Efficiency Model (Jackson et al. 1991), the proposed downgradient wells should provide a monitoring efficien~y of approximately 88%, assuming a groundwater flow direction of south-sJutheast (S.27°E or 153° azimuth}. The upgrad·ient well pair (399-l-lSAB) was chose~ because it was close to the 300 APT but not too close to the trenches tJ encounter contaminants temporarily flowing in a reverse direction when the Columbia River stage is high. All eight of the proposed wells were constructed to WAC 173-160 standards.
4.4 COMPLIANCE MONITORING
Groundwater protection regulations establish requirements concerning groundwater monitoring and corrective action standards for the permitted regulated units (e.g., surface impoundment, land disposal unit). Furthermore, for each dangerous waste constituent entering the groundwater from a regulated unit, the un1t permit must include a concentration limit that cannot be exceeded. These concentration limits are the .,triggers 11 that determine the need for further action.
4-9

WHC-SD-EN-AP-185. Rev. 0
Table 4-S. Proposed We 11 s for the· 300 Area Process Trenches Monitoring Well Network.
Well Aqu1fer Sampling Water Levels Well Frequency Standards
399-1-1QA116 Tap Unconfined
Semiannuill Quarterly WAC: 173-160
399-l-1089, Bottom Semiannual Quarterly WAC-113-160 Unconfined
399-l-16Au Top Semiannua 1 Quarterly WAC 173-160 Unconf1ned
399-1-16887 Bottom Semiannual Quarterly WAC 173-160 Unconfined
399-l-17AI!o6 Top Semiannual Quarterly WAC 173-160 Unconfined
399-1-17886 Bottom Semiannual Quarterly WAC 173-160 Unconfined -
399-l-18A86 Top Semhnnua I Quarterly WAC 173-160 Unconfined
3 99 ... 1-18887 Bottom Semiannual Quarterly WAC 173-160 Unconfined
Note: Su ers:cri p p t tollowin 9 we I number denotes the y ear of construction.
4-10

'•'. ,':,
WHC-SD-EN-AP-185, Rev. 0
Figure 4-2. Locations of Monito~ing Wells Proposed for the Revised 300 Area Process Trenches Groundwater Mon1toring Plan .
• 1·13 Propa .. d Well Pair
Fence
0 1,000 r:.et
• 1·184,.
Procest W1ter Trenches
l nf=-
• •1-16A, B 1·17A, B I I
D .., Sanitary Leaehlng
~ \] :~Trenches
~ \ c:::;J D CJ (\Qj South Process
1J D Dc:~rot:l c \J ond • a:! JQ! .. l.::J
CirJPo o ; aDOa b Q c~ ID
D ~D Dil~
il::l ! 1:1~
t
4-11
\ 'Z. • \
Ht504043.12

WHC-SO-EN-AP-185, Rev. 0
4.4.1 Concentration limits
For the 300 APT constituents of concern, the proposal is to use the following MCLs as the concentration limit5.
1. For TCE, the MCL is 5 ~g/L. This limit is based on National Primary OWS (40 CFR 141.6l(a)}. lhis limit is also the MCL set forth in WAC 246-290-310.
2. For cis-DCE, the MCL is 70 ~g/L. This limit is based on National Primary OWS (40 CfR 141.6l(a)).
3. For uranium, there is no DWS established. However, 20 ~g/L for total uranium in public drinking water supplies was included in proposed changes to 40 CFR 141 (EPA 1991). This value 1s proposed for the 300 APT until the rule containing the subject standard is promulgated.
Groundwater quality criteria for TCE is set at a different level, 3 ~9/L, in WAC 173-303-200. However, the purpose of WAC 173-303-200 is to set groundwater quality standards that are (1) preventative in nature and (2} protective of existing and future beneficial uses through the reduction or elimination of contaminants discharged to the subsurface. Therefore, these standards are more stringent than other types of standards in order to control the source discharged to groundwater. Once contaminants have reached groundwater, the applicable standard should be set at the MCl and/or the state required cleanup standard.
4.4.2 Point of Compliance
The point of compliance {POC) 15 defined in 40 CFR 264.95 and WAC 173-303-645(6) as a "vertical surface" located at the hydraulically downgradient limit of the waste management area that extends down into the uppermost aquifer underlying the regulated unit. The POC is the place in the uppermost aquifer where groundwater monitoring takes place and the groundwater protection standard is set. For the 300 APT~ the POC should be the downgradient monitoring wells as provided in Section 4.3. (i.e .• monitoring wells 3-1-lOA and -lOB, 3-l-16A and -168, 3-1-17A and. -178).
4.4.3 Compliance Period
The compliance period is defined as the number of years equal to the active life of the waste management area {including any waste management activity prior to permitting and the closure period). Typically, groundwater monitoring is required for a period of 30 years following completion of closure activities, although this time frame may be shortened or extended by the regulatory authority. If corrective action is engaged by the owner or operator (due to exceedance of groundwater concentration limit), then the compliance period will be extended until it can be demonstrated that the applicable limit has not been exceeded for il period of three consecutive years.
4-12

WHC-SO-EN-AP-185, Rev. OA
4.5 SAMPLING AND ANALYSIS
Section 4.5 describes or references procedures for sample collection, sample preservation and shipment, chain of custody requirements, analytical procedures, and quality assurance. Specific sampling and analysis procedures are referenced. Work by subcontractors shall be conducted to their equivalent approved standard operating procedures.
All field sampling activities will be recorded in the proper field logbook as specified in Ell 1.5 and subsequent revisions (WHC 1988). Electric submersible or Hydrostar3 pumps will continue to be used in existing monitoring wells for purging and sampling. Before sampling each well, the static water level will be measured and recorded as specified in Ell 10.2 (WHC 1988). Based on the measured water level and well construction details, the volume of water in the well will be calculated and documented in the well sampling form or field notebook. These steps will be performed electronically in the field. As specified in £II 5.8, each well will be purged before sampling until the approved criteria are met (WHC 1988). Purge water will managed according to Eli 10.3 (WHC 1988). In the situations where the well pumps dry because of very slow recharge, the sample will be collected after recharge. Samples will be collected and field preserved as specified in Ell 5.8. Sampling equipment decontamination will follow procedures specified in Ell 5.4 (WHC 1988).
Sample chain-of-custody, sample packaging, and shipping required by WAC 173-303-645(8)(d) are discussed in Ell 5.1 and 5.11 (WHC 1988). The general quality assurancejcontrol (QA/QC) protocols will include the sitespecific analytes for this plan (WHC 1993). The purpose of the QC activities is to determine and documente that samples were carefully collected and transferred to an analytical laboratory, that the quality of the analytical results being produced by the laboratory are defensible, and that corrective actions will be taken as necessary.
Under the proposed compliance-level monitoring program, water-level elevation data will be evaluated annually to determine if the monitoring wells ae strategically located. If the evaluation indicates that existing wells are no longer adequately located, the groundwater monitoring network will be modified to bring it into compliance with WAC 173-303-645(8)(a). Descriptions of monitoring constituents, monitoring frequency, and analytical procedures specific to the 300 APT are provided below.
4.5.1 Constituents to be Analyzed
The constituents to be analyzed initially for the 300 APT include;
(I) The detected constituents of concern identified in Section 4.2 (incuding yranium and biodegradation products of tetrachloroethylene). These constituents of concern will be sampled independently four times in each sampling event (semiannually).
3Hydrostar is a registered trademark of Instrumentation Northwest, Inc.
4-13

WHC-SD-EN-AP-185, Rev. OA
(2) Metals (iron and manganese). Groundwater samples will be analyzed semiannually for these metals together with dissolved oxygen and redox potential as part of the follow-up geochemical investigation (Section 4.2). They will be added to the constituents of concern list if elevated levels are not due to chemical reducing conditions.
(3) Four constituents required by Ecology including thallium. PCBs. chrysene. and benzo{alpyrene. These four constituents are required by Ecology in response to their concern about dangerous wastes leaching from the relocated sediments stockpiled at the north ends of the trenches. Groundwater samples will be analyzed for these constituents semiannually for two years (four sampling periods). If the constituents are detected they will be added to the list of constituents of concern.
(4) Field parameters that are routinely measured at the well head (including pH, conductivity, turbidity. and temperature).
A large number of wells were sampled periodically during the 1988-1991 time period for dangerous waste constituents per WAC 173-303-9905 and site specific constituents (see Section 3.3). This effort established the constituents of concern for the interim remedial action and the final status monitoring plan. Since 300 APT discharges have ceased, only residual contaminants from past practice discharges should be present in groundwater in the vicinity of the trenches. Thus, previous groundwater characterization and monitoring data (historical data) are considered adequate for addressing the Appendix IX requirements for this final status monitoring plan.
4.5.2 Background Values
Background values (area) are defined as the levels of chemical, physical, biological, or radiological constituents or parameters upgradient of a unit, practice, or activity that have not been affected by the unit. Groundwater monitoring data obtained from upgradient wells will be used to track the encroachment of upgradient sources of contaminant plumes. Background data also will be reevaluated if changes in groundwater flow directions result in changes in definition of upgradient wells.
4.5.3 Sample Frequency
In compliance with regulations, all wells (compliance and background) will be sampled at least semiannually during the compliance period. During each semiannual sampling event, a sequence of at least four independent samples will be collected from compliance wells and results compared to the groundwater concentration limits established in Section 4.4.1. Statistical methods are discussed in Section 4.6.
The requirement of obtaining four independent samples could be accomplished by reference to the uppermost aquifer's effective porosity (n ); horizontal hydraulic conductivity (Kh); and hydraulic gradient (i). The e
4-14

. . .
·, ' ;, · ·~ ··wHf:-~D-EN-AP-185. Rev. o
minimum t1me interval between sampling events that will provide an independent sample of groundwater is estimated as follows (EPA 1989):
1. Calculate the horizontal component of the average linear velocity of groundwater (Vh) using the Darcy equation
n., with:
Kh ~ 43 m/d (Swanson et al. 1992)
i ~ 0.0003 or 0.0004 (DOE-Rl 1995b, Figures 6.1-4 and 6.1-5}
Vn: (43 m/d * 0.0003)/0.2 - 0.0645 m/d, or
Vh = (43 mjd * 0.0004)/0.2 ~ 0.086 m/d
2. The horizontal component of the average linear velocity of groundwater, Vn, has been estimated to be from 0.0645 to 0.086 m/d. Monitoring well diameters at the 300 APT are 0.1016 m. Therefore, the minimum travel time, T, to obtain an independent sample for t hi s unit i s :
T = (0.1016 m)/{0.0645 m/d) = 1.6 d (based on i : 0.0003)
or
T = {0.1016 m}/{0.086 m/d} e 1.2 d {based on i • 0.0004).
Based on the above calculations, sampling every other day would prov~de the required independent samples. However" a "disturbed zone" due to purg1ng may create a larger "effective" diameter than used in the above calculation. Therefore, to account for the disturbed zone and/or to reduce the autocorrelation effects (which may happen if groundwater is sampled too close in time), a monthly sampling interval is recommended. Sampling will be accomplished in months when the water leve1 is high {March, April, May 1 and June) and again when the water level is low (September, October, November, and December).
4.5.4 Analytical Procedures
The laboratory approved for the groundwater monitoring program will operate under the requirements of current laboratory contracts and will use standard laboratory procedures as listed in the SW-846 {EPA 1986) or an alternate equivalent. Alternate procedures, when used, will meet the guidelines of SW-846, Chapter 1.0. Analytical methods and quality control for the RCRA groundwater monitoring activities are described in WHC (1993).
4-15

WHC-SO-EN-AP-185, Rev. 0
4.5.5 Geochemical Evaluation of Iron and Manganese
The hypothesis that elevated iron anc manganese is due to reducing conditions in certain wells completed at the bottom of the unconfined aquifer will be tested by analyzing key redox (oxidation-reduction) indicator parameters:
• Fe II • dissolved oxygen • EhA
Under reducing conditions, low dissolved oxygen (<1 ppm) and low or negative redox potentials (Eh) (see Figure 4-3}, iron and manganese associated with sediments as oxide coatings on mineral grains can be converted to lower oxidation states (Fe•z and Mn+2). This results in dissolution at the solidliquid interface (i.e., between pore fluid and surfaces of the oxide coatings). The resultant manganese and iron dissolved in the pore fluid is thus free to pass through a membrane filter when the sample is pumped from the well and directly through the filter holder at the well head. The occurrence of elevated iron and manganese under the above conditions is thus a natural consequence of the aquifer host material {i.e, presence of oxide coatings) and the isolation of the test zone from atmospheric oxygen.
The location of the screened interval at the bottom of the aquifer for the two "deep~ wells in the 300 APT with anomalous dissolved iron and manganese and the corresponding'ly low hydraulic conductivities (wells -168 and -175) support the ''redox" hypothesis. lhe additional hydrochemical measurements needed to test the hypothesis will be made in the field using (1) a special sample pump to ensure that in-leakage of air (oxygen) does not occur during sample extraction and {2) flow-through test equipment to record dissolved oxygen, Eh, temperature, and pH continuously during an extended purge cycle (up to six bore volumes). Confirmatory measurements of divalentiron will be made in the field using HACH~ kit methods. Low dissolved oxygen (<1 ppm) low or negative Eh potentials, and the presence of Fe·2 • will be taken as indirect evidence for accepting the hypothesized natural occurrence of elevated manganese and iron.
4.6 STATISTICAL METHODS
Section 4.6 proposes statistical evaluation procedures for use with the 300 APT monitoring program. Statistical evaluation of groundwater monitoring data will comply with requirements set forth in the WAC 173-303-645 (B)(h) final status regulations. Specifically, procedures outlined 1n the follow1ng EPA technical guidance documents will be followed:
• Statistical Analysis of Groundwater Monitoring Data at RCRA FaciJjties: Interim Final Guidance (EPA 1989)
• Statistical Analysis of Groundwater Monitoring Data at RCRA Facilities- Draft Addendum to Interim Final Guidance (EPA 1992).
4-16
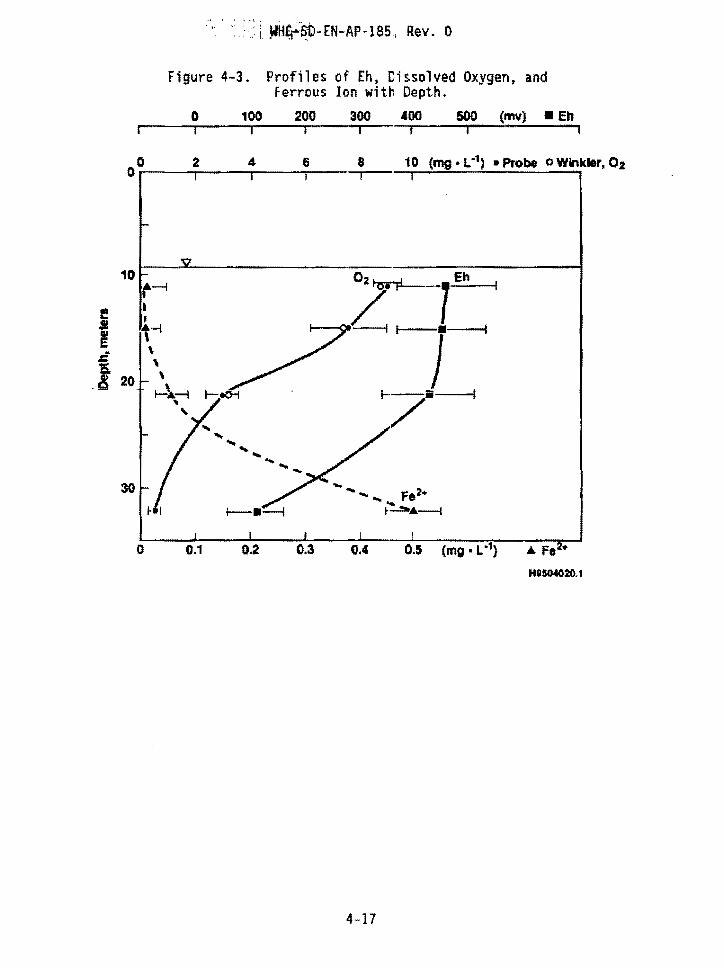
·: ~ I .~111~~00-EN-AP-1 85 , Rev. 0
Figure 4-3. Profiles of Eh, Dissolved Oxygen, and Ferrous Ion with Depth.
0 100 200 300 400 500 (mv) • Eh
00 2 4 6 8 10 (mg • L"1) • Probe o Winkler, 02
10 Ozl-trirfL-- Eh f'-4
L:~l~ !!! I
• I , .... J
3£ \
_! \
20 ' j---ii----1
.... / .... .... .... .... ........
30 .... .... .... Fe2• .......
t...:...!ltA--1
0 0.1 0.4
HIISM020.1
4-17

WHC-SD-EN-AP-185, Rev. 0
For a compliance-level groundwater monitoring program, the monitoring objecti~e 1s to determine if a groundwater concentration limit such as an MCL has been exceeded. This is a very different problem than the detection-level monitoring where the objective is to detect leakage from the unit by employing upgradient/downgradient comparisons.
4.6.1 Tolerance Inter~als
For a compliance-level groundwater monitoring program, the choice of an appropriate statistical test depends on the type of groundwater concentration limit. For health-based concentration values (e.g., an MCL or an ACl derived from health-based risk data), the tolerance interval approach is recommended (EPA 1992, page 50}. A tolerance interval is constructed in such a way that it contains at least a specified proportion, P, of the population with a specified confidence coefficient, 100(1 - a}%. The proportion of the population included, P, is referred to as the coverage. The probability, 100(1 - a)%, with which the tolerance interval includes the proportion P% is referred to as the tolerance coefficient. If compliance data follow a normal or a log-normal distribution, an upper 95% one-sided tolerance limit with a 95% confidence is recommended to be calculated for each constituent of concern in each compliance well (EPA 1989, 1992). If the upper tolerance limit from any compliance well exceeds a MCL, it is interpreted as sign1ficant evidence that more than 5% of all compliance values exceed the fixed limit (e.g., MCL). Parametric tolerance limits (suitable for normally or log-normally distributed data} are of the form:
x + ks (one-sided)
where x is the sample mean; s is the sample standard deviation; and k is a multiplier based on the coverage, the confidence level, and sample size. Values of k can be obtained from EPA (1989). To reduce uncertainty in the estimates of the mean and standard deviation, at least 8 to 10 samples {from each compliance well} are needed.
When the normal or log-normal distribution cannot be justified, especia11y when a large portion of the samples are non-detects, the use of nonparametric tolerance intervals should be considered. The upper tolerance limit is usually the maximum observed observation from each compliance well for each semiannual sampling event.
Because the parametric tolerance interval approach depends heavily on the normal or log-normal assumption, the adequacy of this assumption should be assessed by probability plot~ andjor statistical goodness-of-fit tests, such as the Shap1 ro-Wi lk_ t~sj: or_l iJJ i.efar_s_ tf}-St- _Qf_ normaU-ty (Gi 1 bert 1987, Conover 1980). Unfortunately, all of the available tests for normality of data do not exhibit high degrees of power when the sample size is small (i.e., <20 to 30 observations). In a compliance monitoring program, it is impractical to obtain 30 independent samples during -each semiannual sampling event. Therefore, a nonparametric tolerance interval approach should be considered for the 300 APT. One advantage is that, unless all the sample data are non-detect, the maximum value will be a detected concentration, leading to
4-18

' :··} ~ ~ ; ·.i W'i-IC-SD-EN-AP-185, Rev. 0
a well-defined upper tolerance. However, the nonparametric tolerance intervals require a large number of samples to provide a reasonable coverage and tolerance coefficient.
In order to have a minimum coverage of 95% with 95% confidence, 59 samples are needed. This means one would be 95% sure that at least 95% of the population measurements will fall below the maximum value based on 59 observations. When the maximum value (from four samples} is chosen as the upper tolerance limit, the average coverage (not the minimum coverage as discussed above) is 80%. That is, one would expect that on average that 80% of the population from that compliance well will be below the maximum value. More samples are needed to achieve a higher coverage. It can be shown that at least 19 samples (per compliance well per semiannual period) are necessary to achieve 95% coverage on average. For the purpose of this monitoring plan, it is assumed that a 80% average coverage is acceptable because (1) a very large amount of hydrogeologic and contaminant data have been collected from the 300 APT wells since 1987 and (2) the rate, extent, and concentrations of groundwater contaminants originating from the 300 APT are well understood.
4.6.2 Confirmation Samplin~
For tolerance limits to be useful resampltng has to be allowed before a decision is reached. This is because tolerance limits have a built-in failure rate of (1 - P)%. For example. one would expect 1 in every 20 samples to be outside of the upper 95% tolerance limit just by chance. To decrease the chance of a false positive decision because of either the built-in failure rate or the effects of gross errors in sampling or analysis, verification resampling is necessary. This is the best available approach to balance false pasitive aRd-false negative des4s1ons--(G4b~ons 1994}.- -ln case of an initial exceedance, a verification sampling is needed to determine if the exceedance is an artifact caused by an error in sampling, analysis, or statistical evaluation or natural variation in the groundwater. Recent EPA guidance (1992) encourages the use of resamples as a means to reduce the facility-wide false positive rate.
Confirmation retesting can be accomp'lished by taking a specific number of additional, independent samples from the well where a specific constituent triggers the initial exceedance. Because more independent data are added to the overall testing procedure, retesting of additional samples, in general, will make the statistical test more powerful and result in a more reliable determination of possible exceedance. Therefore, the objectives for the verification sampling are to ensure (1) quick identification and confirmation of contamination exceeding some standard, if any, and (2} the statistical independence of successive resamples from any well where initial exceedance occurred. The performance of the statistical retesting strategy depends substantially on the independence of the data from each well.
After considerations cited above, it is proposed to obtain two independent samples, split each sample, and send the splits to two different laboratories for independent verification. In this way, laboratory bias (if present) can be investigated. A statistically significant result will be declared only if all resamples are larger than the MCL. If all resamples are
4-19

WHC-SD-EN-AP-185, Rev. 0
below the MCL, the compliance monitoring program will continue. If results are inconclusive, another round of verification resamples will be initiated.
Finally, if the magnitude of the initial exceedance is small (e.g., <25%), special analysis may be requested in order to achieve lower detection limits and/or improved accuracy and precision.
4.6.3 Non-detects
Non-detects will be handled per recommendations stated in the EPA guidance documents (1989 and 1992). Non-detects will not present a problem in using a nonparametr1c method to evaluate compliance data if the detecti9n limit is lower than the MCL. If a parametric statistical method is used, then the handling of non-detects will depend on the percentage of detected values. Basically, a substitution method (use l/2 of the detection limit to replace non-detects} will be used if less than 15% of all samples are non-detects. If the percent of non-detects is between 15% to 50%, either Cohen's method or Aitchison's adjustments will be used. Detailed descriptions of these methods can be found in EPA (1989 and 1992). When more than SO% of the sample values are non-detects, the Poisson model may be used to derive a Poisson tolerance limit. Steps to calculate an upper tolerance limit using the Poisson model are given in EPA (1992).
4.6.4 Outliers
An outlier is an observation that do~s not conform to the pattern established by other observations in the d~ta set. Possible reasons for its occurrence include contaminated sampling equipment, inconsistent sampling or analytical procedure, data transcribing error, and true but extreme measurements. Statistical methods such as Grubbs' methods {Grubbs 1969) for testing of outliers and;or the box-and-whisker plot (Ostle and Malone 1988) may be used. Once an observation is found to be an outlier, the fol1owing action should be taken:
• If the error can be identified and the correct value can be recovered through the Request for Analytical Data Review (RAD£) process (see Section 5.1), replace the outlier value with the corrected value.
• If the error can be documented but the correct value cannot be recovered, the outlier should be deleted. Describe this deletion in the statistical report.
• If no error can be documented, then assume that the value is a valid measurement. However, obtain another sample to confirm the high value, if necessary.
4-20

. ' ! ~ . . I~
.·' ·:.
WHC-SD-EN-AP-185, Rev. 0
4.7 DETERMINING RATE AND DIRECTION OF GROUNDWATER FLOW
Depth to water will be measured in 32 300 Area wells semiannually in order to construct water table maps. These maps will be used to interpret the direction of groundwater flow and to derive the water table gradient. The gradient, in turn, will be used with estimated values of hydraulic conductivity and effective porosity to calculate flow rate by using the Darcy equation (see Section 3.2). Because the 300 Area water table is significantly affected by Columbia River level, the semiannual measurements will be coordinated with seasonal fluctuations of Columbia River stage in order to construct water table maps corresponding to high and low stages. Historically, high river stage is somewhere in the months of May or June, and low river stage occurs in September. Therefore, the semiannual measurements will be in September and in either May or June. Exact times of measurement will be adjusted to ensure that high and low stages are represented. The wells measured semiannually for water level are listed in Table 4-6 and shown 1n Figure 3-1. Water levels will be measured and recorded as specified in Ell 10.2 {WHC 1988).
In addition to the 32 wells measured semiannually for constructing water table maps, 8 other wells will be measured semiannually to determine hydraulic head of the lower portion of the unconfined aquifer (4 wells} and upper confined aquifer (4 wells}. The wells measured in the lower portion of the unconfined aquifer are 399-1-108, 399-1-168, 399-1-178, and 399-1-188. Wells measured in the uppermost confined aquifer are 399-1-9, 399-1-16C, 399-1-17C, and 399-l-18C. Figure 3-1 shows the well locations.
4-21
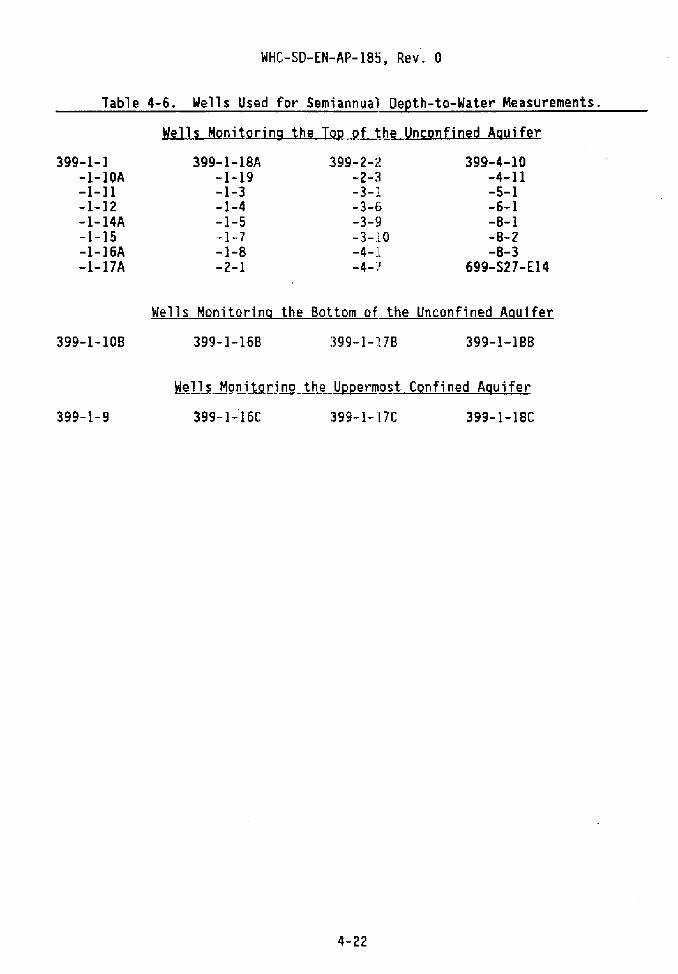
WHC-SD-EN-AP-185, Rev. 0
Table 4-6. Wells Used for Semiannual Depth-to-Water Measurements.
Wells Monitoring the Top of the Unconfined Aguifer
399-1-1 399-1-lSA 399-2-2 399-4-10 -1-10A -1-19 -2-3 -4-11 -1-11 -1-3 -3-1 -S-1 -1-12 -1-4 -3-6 -6-1 -1-14A -1-5 -3-9 -8-1 -1-15 -1-7 -3-10 -8-2 -1-16A -1-8 -4-1 -8-3 -1-17A -2-1 -4-} 699-S27-E14
Wells Monitor1ng the Bottom of the Unconfined Aquifer
399-1··108 399-1-168 399-1-178 399-1-188
Wells Monitoring the Uppermost Confined Aquifer
399-1-9 399-l-16C 399-1-HC 399-1-lSC
4-22

; .· . ' ''' ;::,··-t WHC-SO-EN-AP-185, Rev. 0
5.0 DATA MANAGEMENT AND REPORTING
5.1 DATA VERIFICATION AND VALIDATION
All contract analytical laboratory results are entered into the HEIS database. Data from this larger database are downloaded to smaller data sets for data validation, data reduction, and trend analysis. Data verification and validation activities should follow WHC-CM-7-8, Section 2.6, "Validation and Verification of RCRA Groundwater Data" (WHC 1992). Suspected data are submitted for formal review and resolution through the RADE process per Section 4.2, 11 Evaluation of Requests for Analytical Data Review" (WHC 1992}. Results of data verification and validation shall be reported 1n the RCRA quarterly and annual reports.
5.2 REPORTING
The results of statistical evaluation will be reported to Ecology in the RCRA quarterly and annual monitoring reports. The statistical results will include a list of groundwater parameters analyzed, detection limits, and analytical results. If a statistically significant exceedance (after the confirmation resampling evaluation process) is determined at any well at the POC, the following steps will be taken per WAC 173-303-645(10)(g)(i)(i1).
• Notify Ecology in writing within 7 days of the finding with a report indicating which concentration limits have been exceeded.
• Submit an application for a permit modification to establish a corrective action program to Ecology in 90 days.
In case of a false positive claim, the following procedures will be taken per WAC 173-303-645(10)(i)].
• Notify Ecology in writing within 7 days of the finding (i.e., exceedance) that a false positive claim will be made.
• Submit a report to Ecology within 45 days. This report should demonstrate that a source other than the 300 APT caused the standard(s} to be exceeded or that the apparent noncompliance with standard(s) resulted from error in sampling, analysis, or evaluation.
• Submit an applicat1on for a permit modification to make appropriate changes to the compliance monitoring program within 45 days.
• Continue monitoring in accordance w1th the compliance monitoring program.
S-1

WHC-SO-EN-AP-185, Rev. 0
This page intentionally left blank.
5-2

WHC-SD-EN-AP-185, Rev. 0
6.0 CORRECTIVE ACTION PROGRAM
If, at the POC, dangerous waste constituents of concern are measured in the groundwater at concentrations that exceed the applicable groundwater concentration limit, a corrective action level monitoring program will be established. The development of a corrective action level monitoring program will be initiated by integration of RCRA/CERCLA programs. Groundwater monitoring will continue as described in Chapters 4.0 and 5.0. Implementation of the corrective action will be deferred and integrated with the remediation of the 300-FF-1 (source} and 300-FF-5 (groundwater) operable units. A description of the groundwater monitoring plan that will be used to assess the effectiveness of the corrective/remedial action measures will be submitted when the need for corrective action ·is first identified.
6-1

WHC-SD-EN-AP-185, Rev. 0
This page intentionally left blank.
6-2
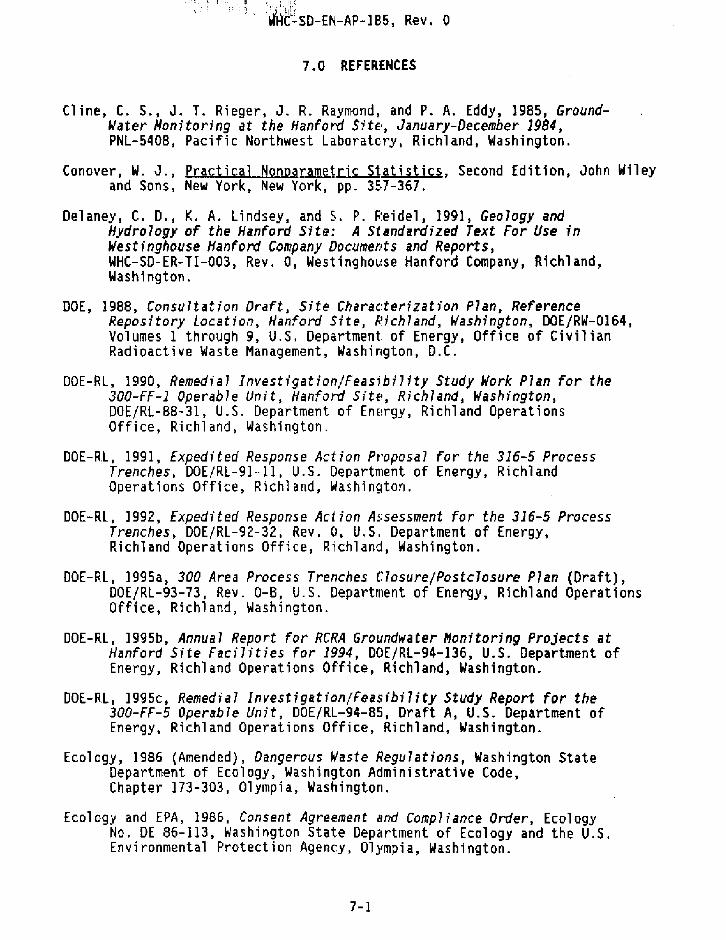
~ l· . ' ; ~\ :~ -:
wHc:so-EN-AP-185, Rev. o
7.0 REFERENCES
Cline, C. S., J. T. Rieger, J. R. Raymond, and P. A. Eddy, 1985, GroundWater Honi tori ng at the Hanford Site,, January-December 1984, PNL-5408, Pacific Northwest Laboratcry, Richland, Washington.
Conover, W. J., Practical Nonparametrjc Statistics, Second Edition, John Wiley and Sons, New York, New York, pp. 357-367.
Delaney, C. D., K. A. Lindsey, and S. P. ~~eidel, 1991, Geology and Hydrology of the Hanford Site: A Standardized Text For Use in Westinghouse Hanford Company Documents and Reports, WHC-SD-ER-TI-003, Rev. 0, Westinghouse Hanford Company, Richland, Washington.
DO£, 1988, Consultation Draft, Site Charac:terization P1an, Reference Repository Location, Hanford Site, Richland, Washington, 00£/RW-0164, Volumes 1 through 9, U.S. Department of Energy, Office of Civilian Radioactive Waste Management, Washington, D.C.
DO£-RL, 1990, Remedial Investigation/Feasibi11ty Study Work Plan for the 300-FF-1 Operable Unit, Hanford Site, Richland, Washington, DOE/RL-BB-31, U.S. Department of Ensrgy, Richland Operations Office, Richland, Washington.
DO£-R.L, 199 I, Expedited Response Action Pr·oposa 1 for the 316-5 Process Trenches, DO£/RL-91-11, U.S. Department of Energy, Richland Operations Office, Richland, Washington.
OOE-Rl, 1992. fxpedi ted Response Action A~:sessment for the 316-5 Process Trenches, DOE/RL-92-32, Rev. 0, U.S. Department of Energy, Richland Operations Office, Richland, Washington.
DOE-Rl, 1995a, 300 Area Process Trenches C1osure/Postc1osure P1an (Draft), 00£/RL-93-73, Rev. 0-B, U.S. Department of Energy, Richland Operations Office, Richland, Washington.
DOE-RL, 1995b, Annual Report for RCRA Groundwater Monitoring Projects at Hanford Site Facilities for 1994, DO£/Rl-94-136, U.S. Department of Energy, Richland Operations Office, Richland, Washington.
DDE-Rl, 1995c, Remedial Investigation/Feasibility Study Report for the 300-FF-5 Operable Unit, OOEfRL-94-85, Draft A, U.S. Department of Energy, Richland Operations Office, Richland, Washington.
Ecology, 1986 (Amended), Dangerous Waste Regulations, Washington State Department of Ecology, Washington Administrative Code, Chapter 173-303, Olympia, Washington.
Ecology and EPA, 1986, Consent Agreement and Compliance Order, Ecology No. DE 86-113, Washington State Department of Ecology and the U.S. Environmental Protection Agency, Olympia, Washington.
7-1

WHC-SD-EN-AP-185, Rev. 0
Ecology, 1994, Dangerous Waste Portion of' the Resource Conservation and Recovery Act Permit for the Treatment, Storage, and Disposa1 of Dangerous Waste, Permit No. WA7B90008967, Effective September 28, 1994, Washington State Department of Ecology, Olympia, Washington.
EPA, 1984, Interim Status Standards for Owners and Operators of Hazardous Waste Treatment, Storage, and Oisposa1 Facilities, U.S. Environmental Protection Agency, 40 CFR Part 265, U.S. Government Printing Office, Washington, D.C.
EPA, 1986, Test Hethods for Evaluating Solid Waste, SW-846, Third Edition, U.S. Environmental Protection Agency, Washington, D.C.
EPA, 1987, A1ternate Concentration Limit Guidance: P1rt I, ACL Policy and Information Requirements, EPA/530/SW-87-017, U.S. Environmental Protection Agency, Washington, D.C.
EPA. 1989, Statistical Analysts of Groundwater Monitoring Data at RCRA Facilities - Interim Final Guidance, PBB9-151047, U.S. Environmental Protection Agency, Washington, D.C.
EPA, 1991, Proposed Ru1es for National Primary Drinking Water Regulations: Rad1onuc1ides, Federal Register 56:138, July 18, 1991, U.S. Environmental Protection Agency. Washington, D.C.
EPA, 1992, Statistical Analysis of Groundwater Monitoring Data at RCRA Facilities - Draft Addendum to Interim Fina1 Guidance, EPA/530-R-93-003, U.S. Environmental Protection Agencj, Washington, D.C.
EPA, 1993, Data Quality Objectives Process for Superfund - Interim Fina1 Guidance, EPA/540-R-93-071, U.S. Environmental Protection Agency, Washington, D.C.
Gaylord, D. R., and E. P. Poeter, 1991, Geology and Hydrology of the 300 Area and Vicinity, Hanford Site,, South-Centra] Washington, WHC-EP-0500, Westinghouse Hanford Company, Richland, Washington.
Gibbons, R. D •• Statistical Methods for Groundwater Monitoring, John Wiley and Sons, New York, New York, pp. 15, 84-93.
Gilbert, R. 0., 1987, Statistical Methods for Envjronmental Pollution Monitoring, Van Nostrand Reinhold Company, New York, New York, pp. 157-162.
Grubbs, F. E. , 1969, "Procedures for Detecting Out 1 yi ng Observations in Samples," Technometrjcs, 11:1-21.
Helz, R. T., 1978, The Petrogenesis of the· Ice Harbor Hember, Columbia Plateau, Washington, Ph.D. Dissertation, Pennsylvania State University, University Park, Pennsylvania.
7-2

WHC-50-EN-AP-185, Rev. 0
Jackson, R. l., C. M. Einbereger, R. B. Mercer, and C. R. Wilson, 1991, Effjciency-Ba.sed Groundwater Monitoring Network Design for Hazardous Waste Sites, WHC-SA-1157-FP, Westinghouse Hanford Company, Richland, Washington.
Johnson, V. G. and C. J. Chou, Some Statistical Aspects of Background Based Groundwater Standards at an Arid Hazardous Waste Site, WHC-SA-2358-FP, Westinghouse Hanford Company, Richland, Washington.
lindberg, J. W., and F. W. Bond, 1979, Geohydrology and Ground-Water Qua7ity Beneath the 300 Area, Hanford Site, Washington, PNL-2949, Pacific Northwest Laboratory, Richland, Washington.
Lindsey, K. A., 1991, Revised Stratigraphy for the Ringold Formation, Hanford Site, South-Central Washington, WHC-50-EN-EE-004, Rev. 0, Westinghouse Hanford Company, Richland, Washington.
Ostl e, B. and L. C. Mal one, 198B, Statistics in Research: Basic Concepts and Techniques for Research Workers, Fourth Edition, Iowa State University Press, Ames, Iowa, pp. 66-67.
PNL, 1988, Groundwater Monitoring Comp7 ia.nce Projects for Hanford Site Facilities: Progress Report for the Period April to June 30, 1988, PNL-6675, Vol. 1, Pacific Northwest Laboratory, Richland, Washington.
Schalla, R., R. L. Aaberg, D. J. Bate&, J. V. M. Carlile, M. D. Freshley, T. l. Liikala, P. J. Mitchell, K. B. Olsen, and J. T. Rieger, 1988a, Revised Ground-Water Monitoring Comp7ia..nce Plan for the 300 Area Process Trenches, PNL-6671, Pacific Northwest Laboratory, Richland, Washington.
Schalla, R., R. W. Wallace, R. L. Aaberg, S. P. Airhart, D. J. Bates, ,J. V. M. Carlile, C. S. Cline, D. I. Denn1son, M.D. Freshley, P. R. Heller, E. J. Jensen, K. B. Olsen, R. G. Parkhurst, ,J. T. Rieger, and E. J. Westergard, 1988b, Interim Characterization Report for the 300 Area Process Trenches, PNL-6716, Pacific Northwest Laboratory, Richland, Washington.
Swanson, D. A., T. L. Wright, P. R. Hooper, and R. D. Bentley, 1979, Revised in Stratigraphic Nomenc1 ature of the Co 1 umbi a River Bas a 1t Group, Bulletin 1457-G, U.S. Geological Survey, Washington, D.C.
Swanson, L. C., G. G. Kelty, K. A. Lindsey, K. R. Simpson, R. K. Price, and S. 0. Consort, 1992, Phase I Hydrogeologic Summary of the 300-FF-5 Operable Unit, 300 Area, WHC-50-EN-TI-052, Rev. 0, Westinghouse Hanford Company, Richland, Washington.
WHC, 1988, Environmenta1 Investigations and Site Characterization Manual, WHC-CM-7-7, Westinghouse Hanford Company, Richland, Washington.
7-3

WHC-SD-EN-AP-185, Rev. 0
WHC, l990, Liquid Effluent Study: Groundwater Characterization Data, WHC-EP-0366, Westinghouse Hanford Company, Richland, Washington.
WHC, 1992, Environmental Engineering and GeotechnoJogy Function Procedures, WHC-CM-7-8, Vol. 4, Westinghouse Hanford Company, Richland, Washington.
WHC, 1993, Qua1ity Assurance Project Plan for RCRA Groundwater Monitoring Actjvjtfes, WHC-SD-EN-QAPP-001, Rev. 2, Westinghouse Hanford Company, Richland, Washington.
7-4

. ::. n!:: .... WHC-SD-EN-AP-185, Re~. 0
APPENDIX A
SUMMARY OF CONSTITUENTS SAMPLED TO 1988 {Taken from Scha11a et a'l. 1988a, Table 6}
A-1

WHC-SD-EN-AP-185, Rev. 0
This page intentionally left blank.
A-2

·-- ~- • •• •- ~ •- ------- ·------- --- r ~ •• ~------ ~Con•litu~nt I i&l•Conl•ain~tion lndic•lora---·------------------------------------------
CDNCDDE CDNNAWE ANALUNIT OETLIWIT SAMPLlS OELDIDL ALLDELOI WAXtiWll REGACEN FUttNAUE
1111 C eN DUCT UWHO 113 0 Condu(liwi~J 11111 PH 112 0 ~~~ (88 TOll PPII 100 187 IU otal organic ~alogen cu roc PPB 1000 111 IIHI Totil orguic cubon
----------------------·-···------------------Conatituant li•l•Orinking lalar Standarda----------------------·····----------------·--
CONCOOE CONNAWE ANALUNTT OETLIIIIT SAUPLES OELOIDL AlLDELOI WAllllUJT REGAQEN FUllMAUE
109 COLI FRII 1/PN s %11 lU I EPA Colifora bactaria Ill BETA PC! /l I 210 j U EPA Orau bat& :IC --~- -I& I RADIUU PCI/l I 210 lU i EPA Radiu• ~ ,~~-,
212 LD.UPH.- PC! /l 4 210 J H EPA Oroaa 1lpha n ---I
.08 BAIHUW PPO d 21ft 17 lOU EPA Dtr i Ul (A
UJ UOWJU\1 PP8 2 :11a 201 11 EPA Cadaiua c All OIRDUUII PPB 10 Ul 200 '0 EPA Ch ru io;a I ,.., Ata SilVER PPII I 0 ua 21' 'D EPA S i I ver 2 !20 ARSEIIJC PPB 6 218 JU U EPA Araanic: I
A21 IIEIIC Ul'l' PPB I 2U IU 2 [f'A lit rcu f'J ):>
> A22 SELEIIUU f>I"B 6 21t 212 10 EP~ Salaniua ""0 I I All [IIORIIt I"PB 1 2U 2'18 ... . 2 EPA Endrin ....... w
AH WETIILOII I"PB 1 218 21& ... 1nD fH lh\l>o.vJcl>lc.r m Al& TOXAEitE I"PB l 218 21& ••• 6 EPA luaphana U"'
ue a-BIIC PPB 1 21& 2111 ... ~ EPA ilrha-BHC U1 b-BfiC PPII l 218 ua ... ~ EPA Et. a~DHC ~ AlB ,-anc PPB J 218 211 ... ~ EPA Outa-BHC A]~ -BHC PPII I 218 211 ••• 4 EPA lhlh-BHC < . Ul LEAOCF PPB ' 218 U2 U EPA ltad {graphi\a furnaca) 02 UJRAJE PPB ua 211 a 4iiDI EPA llilrah 0 CH flUO Ill D PPB IiilO 2:11 l!! 1401 EP,\ F lqor idt Hll 2,4-D PPB I 214 214 ... lCD EH 2 t-D HH 2,4,1iTP PPB I 214 214 ... 10 EPi 2:4,5-JP ail~u
---------~------------------------------------Conllilu•nl Littcquaii\'J C~ari~l•risli~•------------------------------------------·-··
CGiftODE CONNAWE ANALU~IT DETLJWIT SAUPLES 8ELDIDL AllBELOI UAXLI\111 REQAOEN FULLIIAYE
All StDIUW PPB IOU 218 0 Sod illl AIJ 1/UGESE PPB li 218 182 lliiAQiiAUt
AHI IRON PPB n 2:18 88 Iron cu PM ENOl PPB 10 2:18 ~II '" Pl!a no I Cll SULFATE PPB ~00 211 I Sulfalt CH CIILORIO PPB 600 211 0 Chlorih

---------·---------------·-------------------------Con3Liluent lie~:Sile Sperifit---------------------------------------------------
C DNCGDE CONNAME AHALUNIT DETLIUIT SAUPLES OEIOJOL ALLBELDI IAKLIMII REQAOEN FULLNAYE
Al2 HICKEl PPII 10 21G 2'02 Nickel All COPPER PPII 10 2111 13 D 1301\ [p"p cor""' AIS ANTIDNY PPB I 00 2HI
2111 ·--An ••ony
AU ALUIIHUII PPB 160 2U IBV Alu•inu• A24 TIIIOURA PPB 200 211 209 Tldou~•• A&l TETRAII E PPB 10 218 218 ••• 5 EP.I.P letra~hloro•eLh•n• AU BE liZ ENE PPB I D 218 21$ ... 6 £PAP Ben~ene
AB DIOKANE PPO 618 us 2111 ••• Oiox•n• AH IIETifDNE PPB JG ua "' ll•thrl 1thyl ketone H5 PYRIDIN PPB 500 2111 2U tH
UDD EPAP Prridhe
1.611 TI)LUEifE PPB 10 2111 211 ••• Tol111n1 11&1 J,l,I·T PPP 10 2111 214 2 00 EPAP 1,1,1-trichloroeth•n• AU J I 2-J PPB to ?HI 214 1,1,2-trlchloroe~h•n• HI ThCEHE PP9 10 2111 212 5 EI'AP Trichloroeth,l•n• ua PEACEME PPB lD 2111 lll~ Perchloroethrl•n• :C A71 OPXYLE PI'B I D 218 2111 ••• ~~0 ErAP ,)'1•••-o,p :::t: 814 11-XYLE PP9 I 0 2111 2111 ... 440EYAP Xy 1 en•-• n 881 12-,ben PPII JD ~n 2111 ••• 1,2-,icnlorobenfen• I
8112 13-" llu PI'S lll 2\6 '218 ••• 1,3-dlchlorob•nEen• Vt c
863 H·dbo11 PPB II na 211 "' 1,4-,icblorobenlen• I C211 PEITCHB PPII 10 218 21 II • •• P•n~JchlorDbtn•••• IT'I
C31 THRCHI PPB 10 218 ~~~~ uo t,2,4,i-tttr•rnlorobtnt•n• z I cu I ltlCHLI PP9 10 Ull 211 ... 1,2,•-trichlorob•nlen• ;p
)> CH HEXACHl PPII' 10 2111 Ul "" Heuchlorophen -o C66 NAPHTHA PPB I 0 2111 2111 ... '"-Shl.h•lu• I
I ...... -4>oo en 123TRI PPB tO ue 2111 ... J, ,3-trichlorobtnl•"' to
C58 UUIU PPII 10 218 218 ... 1,3,6-trichitrobonl•n• (It
en IUHE PPII lU 211 218 ••• 1,2,3,4-,•trl<hloroh•nzen• caa 123UE PP& II 211 218 ... 1,2,3~5-te\rtchloroblniJne ;%) CHI CYANIDE PPII JD 211 21ll (fIn j I ltl
C11 F OIIIIALII PP8 5110 Ul 21! ... Fornll~t < CJI SULFIDE PP8 1000 211 201 Sulfide en KEADSEII PP8 10000 2111 2U IU K1r11en• 0 CliO Hlt.IOIUU PP8 20 "' u A••oni111 io11 Cll ETHYGL Y PPII IIJOOO 211 tll ... UhJI•n• tiJtol en DIOXIN PPB .1 2111 2111 ... Di o•l n
------------------···-···---------------------------Con~titll•nt ll•t•l•l·llon;t-----------------------------------------------------
CflNCODE CONNAYE ANALUifll DElliiiT SAWPLES IIELGJOL ALLBELOJ UAXLIWIT REOAaEN FULLNAWE
Al4 VANADUU Pf'B 5 2111 Ul Vnadi1.11 All POTASUII PPB 100 218 s PGlll s iu• ABI <HLfOitM Pf'B ]0 IU 24 Chlorohr• AU UETHYC II PPB JO 1111 14 ll•thpl•"• chl~rld• £189 HHCBEII PP9 Ill 2U 2111 ••• Hetlchltrob•nl•n• C61 HEXAEHE PPB ID 164 Ut ... He•achloroero[•"• Cll2 Clllllo.lE Pf'8 lOll 1118 108 tu ChI ort~b•lll tl1 • CJI PHOSPHA PPB 1000 211 ?10 Phosph~• Ctl STRYCHN PPB 50 101 IDe ... S t qor:ho i n• en UALIIYDR PPB 600 108 IDB uo U;deic hJdrilide (93 loHCOllM PPB 101) lOft 168 ... Nirotinic acid

·············--·-------- --·-·····-··-·····-·····Con•titu•n~ l.ist~IAC 173-803-tSD6·------------------------·--·----·······
UN CODE CUNNAWE ANALONIT DETLIWIT SAWPlES BEL«IOL AllBELOI UAMliYif REOAOEN FULLNAWE
AOI IEIIYlAit PPB ' u u ... Bn1llin A02 OS Ill Ull PPB 3110 HI 111 ••• 11•1111111 A Ill STIIOIIUII PPB 300 1ft U•u SLront i"• AOi ZINC PPB r; u ' I in.; AD& CALCIUU PPil till u II Caldu1 A:ll UIALIUII PPB HI Ill u Thall iu• A26 .lCETIIE.l .PPil 2DO u u .... 1-•~•t,t-t-lhiourea A21! C"LORU Pf'll 200 u u ••• 1-fo·< loroch•ariJ thiour•• A21 OJETI!Ol PPB 200 u lith oi.th,latil ··~•rol .\28 ElHYREA. PPII 200 Ill II tu ELhylen•thiour•• Al!i IIAPHRU PPD 200 1b U•u 1-naphLhtl·l-~hiour•• Al2 PMEHRH PPB 21llt u u ... N-bh••1l hiour•• .uo ODI'l PPB l u u ... DO Ji41 OI>E PPII I Ill u ... DOE :IlL ~42 DDT PPil 1 u u ••• DOT :::1: AU lfEPTLDR PPB l u Ill ... II EP4P H11phd l4tr n AH HEPUDE 1'1"11 1 111 II U1 0 F.PI.P ~epLchlor tpGKid• I
(I) .H6 DlElRlN PPS I u Utu Dtelirin 0 AH UOinN Pl'll I u U•u Udda I
AU CJLUMf PPB I I& 16 ••• 0 Ef'AP Chlordtn. ..., z AH UOIIJ PPB 1 u IS ••• Endonl fa .. I I
.Afi2 ENDD:I pp(l I 2 t .... Endoulf 1111 Jl > Al'l ACAUJ N Pl'il 10 H u ... .lcrol•in "1:1
:J>oo AU .ACIIYILE PPB Ul 111 u ... Acr7 tan it ri h I I -(J1 AH IJSfNER PPO 10 111 llou Bi•(c-loro••thyl) etnar CD
AlS llt8WINE Pl'll u 111 u ••• ilro•oiCILOIII t.n A111 JU::IHRRB PPB u 111 u ... U•Lh7l bruill•
~
lt.H UIIBJDE PPII Ul 16 U•u Carbo• •••ulfide ;ltJ All CMl8ENZ PPfl 10 18 Uou c•ler•ll•nun• (D
AU CHLJHER PPII liJ u u ... 2-chl•r••LhJI wlnyl et~tr < . A Ill lotETHClll PPil u 111 16 ... lldh7f chloride A87 CIIIITHER Pl'll 10 18 u "" Chlo~•••Lh~l ••thrl athtr 0 1.83 CRIHDU PPII 10 u u ... CroLoulde rd• AU OIBRCIIl PPD Ill u u ... 1,2·dibro•o·3-chlorepropant i.96 fli81!HII PPll 10 u .. '.' 112-dibro•oe\han• A81 IISRIIEJ PPB Ill u II II I ltllrtaolethna AB1 DI8UTEII PPil 10 u u ... 1 1 4-dichloro-2-~u,one AU 0 I COIF II P PO 10 u u ... Oechl•rodilluoro••~hlnl A80 l,l·PlC PPB 10 Ill u ... 1,1-dichtoro•l~•n• AIIO 1 2-DIC PPB 10 u 11 ... 5 EPAP 1,2-dichleroelhant A9J TiAHilCE PPB 10 u 11 ••• 10 EPAP Trant-1,2-~i~hloro•~h•n• AU OICETIIY l'I'B 10 111 u ... 1 EPAP 1,1·dic tor••'~YI•n• A9f OICPAHE PPB 10 II 11 ... e £PAP 1,2-dichloroprop••• I.U DICPEHE PPII 10 n u ••• 1,3-dichtoroprop•n• A95 NNOIEI!Y PI'D 10 u u ... M,N-di•Lh~ih~drllin• 1.91 1 ,1- Dill PPB 3000 111 I ill It. 1,1-di••t yl ,~r1zino AU 1,2-0UI PI'S 3000 n u ... 1,2-di••thrth~dr•rl•• 1\99 HYDRSUl PPB 10 Ill u ... H1drot•n aulf1d• 801 IODOioiET PP8 JD HI HI • • • r odo•• tlune nu LIETIIACfi 1'1'8 10 18 1111 ... lht.hacrJ lonHri h
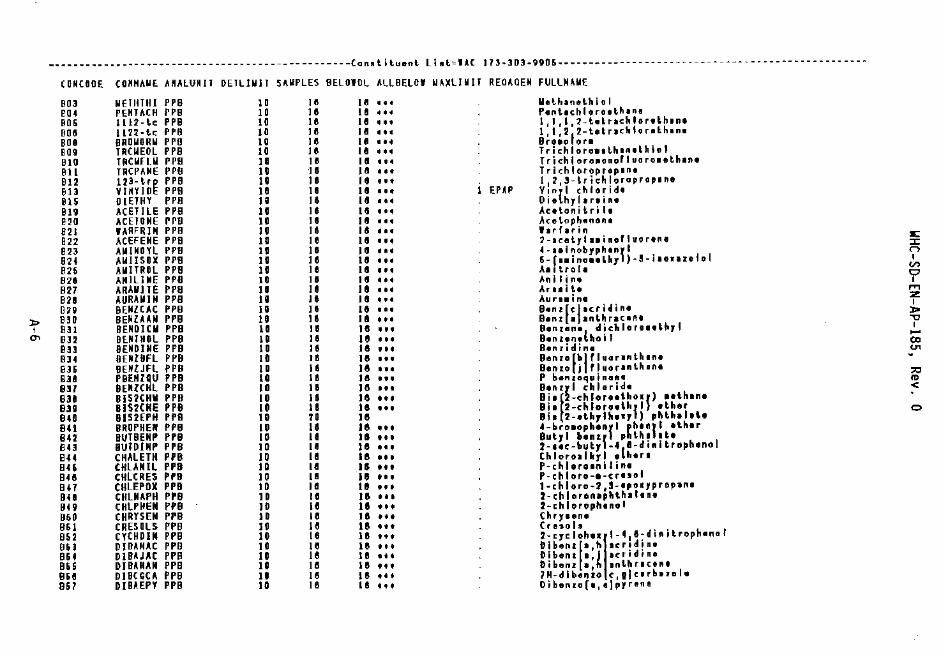
••••••••••••······················---------------Canotituent liateiAC 173-3Dl-990~-------------------------·-·······················
( IJNCODE (O~HAWE AMALUNIT DETLIWIT S~WPLES BELOIOL ALLBELDI UAXLIWIT REDAOEN FULLNAME
'"' WETIHHI PPB ID " Ul o • • Methan•~hiol
'"' PENTACH PPB ID " 18 ••• P•ntt~hlorotthant
""' 1112-tc PPB ID " 18 ... I, 1 ,1,2-t•Lrachlor•Lhont
'"' 1122-t.c PPO ID " 1(1 ••• 1, 1,2,2-tttrachlor•thon•
'"' BRDI.IIJRI.I PP8 10 " u ••• Broto ore
'"' TROIEDL PPB 10 " 18 ••• Trichlotottthontthlol
"' lfl(l.lfl.ll PP9 II " u ••• Trichlorotonofluarotethant Bll TRCPANE PPO 10 " Ill ou Trithloroprepone
"' 123-tr~ PPB 10 " u ... 112,3-trich loropraptne
'" VIHYIIJ PPB " " II ou I EPAP V'"{' chloride
"' OIETHY PP8 " " II • •• Oie hylutint
"' ACETILE PPB 10 " HI • •• Acetonitri It
"' ACETIINE PPU ID " ll•u A<:.etoph•none
"' tARFRIH PPB II " Ill ... ltrf~rin
"' "" ACEFENE PPU ID " 18 ... 2-Hetyln i nof I uo rue "' '" AIIINOYL PPB II " II • •• 4-ninobJPhlll{l n
'" AWIISQ)( PPB 10 " II "' 6-raeinoltLhy )·!-itOIIZOioJ ' ~ '" AIIHROL PP8 ID " 18t .. A11trole 0
"' ANILlNE PPO ID " HI t •• Anllin. ' '" ARAlflTE PPB " " Uou Aneih ~
'" AURAIIIN PPO " " I I o • • Aur1ein1 z ' "" BENZCAC PPB " " II ooo Benz(eJ•~rldine ,.
l> '" BENZAAH PPB " " u.,. Benz 1 enthraca~t ~
"' BENDIClf PPB " " HI t" Oenr•n•l di<:.hloratothrl ' ' -~ "' DlNIIIOL PPB " " 18 ... Bonuoo hoi! "' '" BENDINE PPB " " II uo Ronridino ~
"' DENlBFL PPB " " HI tto Benrofblfl~aranthtna
'" DEHlJFL PPD " " II uo Benro j flqor•n~hono "' "' P0£11l~U PPB " " 18 ... P bonroquinan• m
'" BEIIlC l PPB " " )(I ... Btnr~l chlorldo <
'" DI5'2CHV PPB " " II ••• Bi1~ -chloreetho•J) eelhtne
"' BIS2CHE PPB " " II "' Bi• 2-chlorn\h{l ethtf 0
'" BISHPH 1'1'8 " " " Bl• 2-•t.hylh••r I phth•lt\e
'" BROPHE" PPB " " 18 ... 4-brotopt..nfl chldt' athar
'" IJUTBENP PPB " " Jl ... Butrl llenl{ p th1 1h
'" BUlDINP PPB " " 18 •• • 2-••c-butr -4,1-dinitrophenol
'" CHALETH PPB " " 18 ... Chloroalkyl 1 htrl
'" CHLANIL PPB " " 18 ... P-chlorunilino ... CIILCRES PrU " " Jill •• ' P-chloro-•-~r••ol
"' CHLEPOX PPB " " Ill ... 1-chloro-2,!-tpo•rpropan• ... CHLII,I,PH PPB 10 " 18 ... 2-chloronephthaltno
'" CHLPIIEN PPB 10 " II"' 2-chlorophenol
'" CHRY5EN PPB 10 " llltto Chryeene
"' CRESOLS PPB " " II ttt Crnol1
'" CYCHDIN PPB " " 18 Ht ,_,,,,.,,.l,_'·':''''''''''"'' '" DIIIAIIAC PPB " " 18 ttt Oibentt•,h 1crtd1n•
'" DIBAJAC PPB 10 " u ... Oibenl 1 1<:-ridine
"' DIBAMAN PPB 10 " 18ttt Dibenl ,;l 1n\hrocen1
'" DIBCGCfl PPB " " " ... 111-dibento c,g)ctrbiiolo
"' DIBAEPY PPB " " u ... D i banro (1, 1] pJ ren I

······--------·----------------------------------C~na~i~utn~ lisl=WAC 11l-3U3-IIG05-------------·----------·····---------------
C ONCDIIE COINAWE ANALUNIT OETLIWIT SAWPLES BELOWOl ALLB[LDI WAXLIWIT REOAOEN FULLNAUE
868 OIBAHPY PPB 10 u Utu D!bcnl9l'·~)PJrent 86~ OIBAif'Y PPB u 10 Ill ••• D•b•n•o 1 1 C[''"' 840 DtBPIHH PPB n u u ••• Di-n-•u tl p halate BH D ICHBEM PPO ID u Ul Ill t,J'-dic lerobenJidin• B8S H -dchp PPI 1G 111 lll ttl 2,(-dichltrtphtntl BU 211-dch~ PPO 10 u II 1u 21 11-dichlorophtool 1181 DIErHT PPO 10 II u ... D••thrl phL~•l•t• oaa DIH't'SAF PPQ 10 16 U1n Dihtdrouhola 8611 DliiETHB PPB 10 ta u Ill S,S -dieaiho•JbtnJidilt 010 01 IlEA liB PPB 10 18 II •• I P-dioothrl••inoazobtnJan• 811 OBIBENl PPD I 0 u II "' 1,12-di••lhrlb•n•(•l•nlhrtcant IH2 IHIII~'flB t>r9 10 u 11 ... S~J"-dieathrlbonr•d••• 813 1 HJI NIK PPB I 0 14 Ill ••• I ioh1101 BH OIWPHAII PPD I 0 I~ HI oot Alth•l•lth•·die•thrlphtnt~hrl••in• 1176 OIWUEM PPB 10 ta llll ... 2, -d •• ~~lth•nol liC B78 Ill liP HTH. PPB l D 18 u ... 01aathyl ' ~ alata :r:: 811 0 IIIIENl PI'B 10 18 u ••• I) j II j LrObtn IIRI
('""")
1111 D IIICIIE5 PI'B 10 HI u ••• (,1-diniLro-o-cra~ol and ••I~• , VI
811 DIIIPilfll PPB 10 II liS ... 2,4·dinitrorh•••l c 880 2~-4int PPB 10 Ill 11 IU 2,4-dinl\ra al~••• I
1181 28-dint PP8 10 II 18 ... 2,11-dinitr~t~l~•~• 1'1"'1 ::z:
882 D I OI'Mlll l'f' II )0 u Utu OI•II•OCLJI phlhatatt r DU DIPHAIII PP8 10 18 11 ... Di~h•nrlnino :Po
;b DU DIPHHVO PPB 10 u u ... 1, -diph'"f'h{dratin• .., I
I 886 DJPRNIT PPB I 0 18 u ... D1-n-proJ11 ni naanin• ,_, ...... 888 ETifltlNE I'PB ! 0 !e Ia ••• Ethylantlllina CD
887 ElHIIHH PPB I 0 18 1111 ••• Ethyl ••lhanaaulfona\a U1
881 flUIRAN PPB I D 18 II '" fl11or•~lhana 890 HEIC8UT I'PB 10 1& 16 ••• H•••chlorobuladiano :::a DH HEl(UC PPB 10 Ill !6 ... ll•••chloroc{clopanLadi•n• rtl
892 HUUflf PPB 10 u 18 1 •• Ha•achloro• hana < 893 INDENOP PP8 u Ill 16 .. , Indano(li2,S·t•)pyrlno O'H ISOSOLE Pl'll 10 18 Utu r. ••• ,, •• 0
891i liiAlO ILE PI' II 10 18 !lou lltlononiLrih 898 IIELPIIAL PPB I 0 u II ••• llal&haltn 9111 WETH,.PY PPB 10 u 11 ••• llol 'f'' i lana 1191 liiETIINYL PPB 10 18 II too llatho onrl on UEUllR PPB 10 HI u ••• 2-oathJIIzirldint COl WE TCHA N PPO I D 16 u ,,, 1-aot\r'cholanLhra•• co~ WEIIISC PP8 lD 16 }Ill ... 4,4'-••~hrlanabiafl·chloroanllln•) (03 WEUCJI PP9 l 0 Ul
HI ''' 1-.. t.hrllachnih I•
CDI WETACRY PPB I D 16 Ill '" Yathrl ••thatrri•L• COli IIETIISUl PPB 10 Ill HI •" Ytlh[l aalhaA•aulf,na\e co e. IIETPAOP PP9 10 Ill I e. "' 2-•• hll-2-(••~hrlthio) pr,planaldahyde·o-COT UETIIIOU PPB 10 u 11!1 tft lltlhJI hlouradl co e. IIAPIIIIUt rro 10 a 16 ... 1,•-A•rhlha~uinone cog 1- n;a ph a PPB 10 Ill u ... 1-naph hylui ... CID 2- Ill ph I PPB 10 18 II ott 2·n•rUhyla• i ne Cll IIITRAIIl PPD I 0 u IIIII P-ni roani I ina Cl2 lll1BEIIZ PPB 10 Ill u ... II it.robiRJ ina

w ~
< ' a ' ~ • ~ • ~ • ~ • ' • " w • • " < ' • • w
' • ' u
< ~ • • ~ -• • < ~
~ • - • < ~ • w , ~
• ~ ~ - < • < ~
0 • u • • ~ w • • w ~ • ~ < • ' • ~
' w • ' ' a ~ ~
< a < w ~
< a • • u
w c c u • • u
WHC-SD-EN-AP-JB5, Rev. 0
• -• • • ~
• • 0 • 0 ~ ~
• - • ~ •
•• • •• < •• • ww w
·- ·• ~~
~~
................................................................................. ....................................................... ...................................................... ~ccccmcmmomo~o•••••••••••••••o•••••ooooooo••••o•co --------------------------------------------------
----------------------------------------·········· --------------------------------------------------a~ccoccoaacccocooooaoaaaeaoooaoaoaoaNNN~ftwa•ooocoo -----------------------------------= ooooocoo c c:ooooaco;oc "' -................. ...
0 ooommooommmmmcmmmmmmmmommmmoommommmmmmmmmmomoommm ~~~~~~~~~~~~~~~~~~~~~~~~~~~~~~~~~~~L~L~~~~LLLLLL~L L~~LLLLL~LLLL~~~LLL~~LLLLLLL~LLLLLLLLLLL~LLLL~~~LL
=~~~w•~~~ow~~zLzw•zw-- L~cca~=~~==-c•-o~-c•~ww~~w•ww~•w•~~L~oz=-=n-cLv~zc-~~~o•oLL•~~=~=cz~~===ccw· =~---wc-=--~-uu·-~~-•=oucoz~~==zocw•LL~•L~~mu~-~=u L=000~~>3ZLCC-•ZZZ~ZW~==~~~~ •L-LNZhCW=~WZ<kZZ~~~~C •----------••zzww.uo~~~--~=~--~-=~n=-=~3•=•••==~~~ • zzzzzzzzzz--wwzzz-cwwcwzo•--=~=w=-~wc•-wc-~~<u~== zzzzzzzzzzzzzLLLLLLL~~~----~N-~--UDZ•uoD~LUUULC<~u
~-~m-•~=-N~·~--~e-~~~~c~o-~-~~--~=-~-~-~-~~-~=~~a~ -------~N~N~NNNN~~~~~~~~----~----~~~CCCOCCCeC~~·-~ uu~uuuuuuuuuuuuuuuuuuuuuuuuuuuuuuuuuuuuuuuuuuuuuuu
A-8

-----------------------------------·-------------ConaliluenL liat.~IAC l1~-30S-tt05------------·---·------------·---------
CDNCDDt cONIUiiE ,;, NALUiilT i::.ETiiiH i SHIH fS BEL DIDL ALLB[l D1 IIA~;LI V H IIEC.\QEII FUllNAIIE
(98 CHLP RIP PPB 3000 II II uo !-chI oropropi 0111t rll e Cll9 CY AMtGN 1'1'8 SODO " u "' Cpnoetn HOI OICPROP I'PB 3000 u u ••• D•chloropropfnol 1\0l f_T 110.110 PPB soao u HI ott EU,I ~arbn•~• fl04 ETIICYAN PPB !UO u
HI ''' Elh~l cy1nid•
~05 ETNO XID PPB saOD u II tot ElhJI.nt 01id• 11011 EIHWETII PPD 3008 u II tot ElhJI ••th•crwl•l• 1101 FLUOROA PPD SliD I HI II ••' fluoro•c•tic acid 1101 OL'fCTOY PfB !000 u U•to o lye i dr l•ld•hrh 11011 ISOBUTY PPD 3000 Ill u "' hobutrl alu ol 1110 IIETZINE PPII 3000 u u ... v.thrl bJdr•lin• lUI PADPYlA PP 8 3000 u u ••• M-proprluiu 1117 PRDPYitl PPB 3000 u 111 ••• 2-prllp{n-J-ol IllS 2 4 •- T P PB I 14 1• ••• 2 . 4 . [i-101 AhhNE P~B l 0
:'1: 102 KEIIA.NE PPII 0 ~ 0 :I: !Ol MECYPEN PPB 0 1 0 n ·' 104 IIEBUPHT PPi a I 0 I
121 TAF PPII a 2 0 tn Cl 183 IHT PPS I G I
IU UNKHOIN PPB 0 • G IT1 :z !
;too > ""'0 I ' 1.0 -(ll
U'1
:10 II) <
0

WHC-50-EN-AP-185, Rev. 0
This page intentionally left blank.
A-10

;~ • L ''
··.;.·,,[
WHC-SD-EN-AP-185, Rev. 0
APPENDIX B
ANALYTICAL DATA, MAY 1986 - JUNE 1988 (Taken from Schall a et al. 1988a, Table 7)
B-1

WHC-SD-EN-AP-185, Rev. 0
This page intentionally left blank.
B-2

Cl:l I
w
·-·····--------------------·· ----------------C~natil~enl I i•t;Conli•i~alion Indicalor•----------------········-----------------··--·
CONS TIT
1~1 CDMDUCJ UMHO
Iii PH
cea TOM
CGi lOC
PPB
PPB
SAI.IPLES
Ill
112
161
161
()EltiiUl
100
1000
BELOIDL
()
0
158
1115
IUXLIIIIT !.lEAN
?B?
7.03
2U
llOD
WED !AM
281
1.1
30.J
eu
STODEV
811. 1
0.8HI
1010
U8
COEFFYAR
30.7
11.2
410. D
16.0
UIMUIUW
IH
3 g
2.l
urnmw na 8.S
IU.Il
IDSD
----------------------------------------··---Con•lilu•nl li1l•DrinkinR lal•r Standard•---------------·-------------------·---·------
CDMSTil
I D I CDLIFHW UP II
Ill
181
?I?
A05
An1
ADI
AID
BETA PCI/l
RAO !UII Pet /l
UIALPHA PC 1/l
BARIUII PPI
C AOIIIUW PPB
CIIUUUW PPB
S ILV:OR PPII
A20 ARSENIC PPB
.-\21 WERCURV PPB
AZ2 SELENUW PPB
A61 LEAOOF PPB
C12 NITRATE PPB
Cl4 FLUORID PPB
SAWPLES
211
21 D
21 D
210
21&
216
21&
2U
2U
218
'lUI
218
211
211
DEfl.llllf
l
0
Ill
• a ~
ID
10
' 5
500
son
I!ELotOL
IU
• tea
' 17
201
200
?U
1118
U1
U!
HU
0
133
IIAMLIIIIT
50
u
I 000
10
60
Eoo
.a 2
10
liD
.uooa
1400
II fAll
R 12
14. I
D. 0588
IIi. a 40 8
2. 13
II. 1
10
5. 26
0.6?7
'." 6.&t
lBtDD
~1&
!.lED IAN
l
12
D.OH2
u.e 53 &
2
ID
10
li
0.1
~
li
tgooo ~00
STDOEV
16.4
I. 18
o. 12e
11 .li
.. 4
O.lll6
11
o_ au I. 56
l.l
L. 01
•. 85
6170
l7tl
C IIEFFVAR
113 I
82.~
ll2. ~
1.1 .I
IH 0
n.o 146 .li
I. I
U.lii
251.3
21.1
re.o SD.6
3D .6
II IIIIWUII
0
0.7111
-0. 121
I. 31
I
2
10
10
• D. I
Iii
Iii
28110
&II II
UAXIIIUII
1100
411
11.175
51.1
HI
211
It
23
e.e 11
48
IIIII DO
lUO
:c :X: ~-n "' 1 :~-c-.
Vl c t
IT1 :z
I
> ....... t .....
DO U1 .. :;:1:1 1'0 <:
0

---------------------------------------------(on~titu~nt list~qualilJ Ch•r•cleri•tics-------------------------------------------·
CDNSTIT S "I.IPLES DETLIVIT EIELD1 Dl IIAXLII.IJT WEAN WEOIAN STDDfV COEFFVAR WINIIIUW IUXIUUW
All SDOIUW PPB :ne 100 D 16300 tuoa 5100 33.~ U2D 29800
.1.11 IIANCESE PPB 2111 5 U2 11.67 6 75 a !Ill. 5 & !&7
1.19 lRilN PPB 2le liD !IS 26l'l Sl lOBO U3.2 0 l49GO
en SULFATE PPEI 211 500 0 21100 111200 9170 46 .I (1100 531510
(75 CIILDRID PPIJ 211 60(1 0 IUOO 1 HIOO 1111100 7&. 4 8ft0 72200
--------------------------------------------------Conatituent Li1tBSit1 Sptci,ic-------------------------------------------------
C(USHT S AWPL ES DETL !lilT IIELOIOL IIAXLIIIIT WEAN WED IAN S TDOEV OEFFVAR IIINIUUII IIAXIUUW ~ :X:
lllCJIEL 1'1'9 10 '2(1'2 10 05 ~
~12 21ft ll 10 11.98 8!.1 I en
.1.13 COPPER PPS 218 10 130 UDD 22.2 Ill' H.6 11t. D 10 5l8 0 t
ALUUNUW PPR ue 150 ltiG HO 7080 1'1'1 Alii '" no 4811 219 e ::z:
I
AH THTOUAA PPS 211 700 209 2011 no ID tl !I I 200 I O'iiO > -u CD t I AH IIETHDU PPEI 2U lll 216 9.U ID 0.436 4.4 3.7 lL .... ~ m
Aft/ 1, 1,1-l PPii :lie )0 214 20U I D. 4 Ill 4. a 1 411. 1 Ill 12 V" -AU 1, I, t- T PPB 218 II 7H 10.1 10 l U.ll 10 2! ::0
I'll <
AS 'II TRICEIIE PP9 218 ta 212 5 0.13 II l.U 14.7 ,_. 14
A70 HRCEME PPO 218 10 IU 10.4 10 4 73 4li. I 2 55 0
CJO CUM IDE PPB 211 10 Ul I D to e.!H .!1.1 10 14
CJI SULFIDE PPO 711 tODD 708 1020 I DOD 187 U.4 IDDII 3001
ceo AWIIDNJU PPU Ul 50 8'11 uu 111 lt.' 111.0 3D 3111
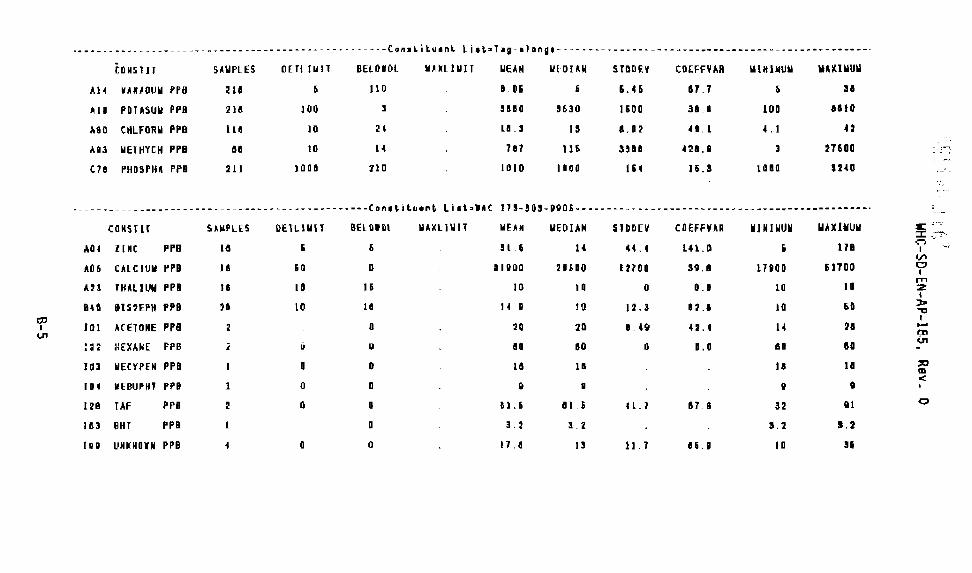
····--·--"--····"--------------------------···-----Con•~itw•nl Li•t~T•g-alongl--"---------------------------------·----·····-·--·
CONS liT S.I.IIPl ES OETI!IIIl BEL OIOL IIHLIIIJT IIE.I.N WI DUll STODEV COEFFYAA lllHlll\.111 litUIIIUII
AI~ WAUOUII rra 216 5 110 8 05 i li.H 17.7 ~ u
All PO TASUII PPB 214 100 ] H&O 3630 1600 ill. I 100 1110
1180 CIILFORII PPB 118 10 24 18.] u a.u 41. I (.1 u .l.g] IIEltiYCH PPB 88 10 14 181 !H 3380 421.1 3 nuo oe PHDSP1U PPB 211 10 DO 710 1010 I DOD 164 U.S 11111 a 3240
·-------------------------------·----------···--ConttiLu•nt li•t~IAC 11!-!0!-IGDi·------------------------··------·-------·······
COliS TIT S ~IIPLfS DETLJIU l IIEl Ollll ll.l.ll:llllll liE AN liED IAN 510DEV CDfFFYAA IIJNIIIUII IIAXUiUII s: ..
A04 ZINC PPII 18 li 6 3l 6 u H.4 l41. 0 fl. 118 ~,7 I ..
Vl AD 6 CAI.CIUII PPB u liD n 3UOQ 2UDO l210D 31.8 171110 & 1100 c
I
Ul THAll Uli PPI 10 15 I Q I 0 IT1
u Ill Q O.lt 10 2 I
&til IHS2EPH PPB 2D \0 18 H 8 !0 U.3 12.1 10 u :1>' -,::!
C!:l I I fl]t ACETONE PI'S 0 20 20 1.49 U.4 14 21 ...... VI ~
:n~ HEXANE f'Fii :i ii g 80 80 0 a.o u IG U"l
U3 IIEnPEN PPB 0 0 u Ill 14 u ;a CD <
104 IIEBUPH I PI' II 0 D e D D • . 128 TAF PPR 2 0 a u .b Ill .5 H _7 87. a 32 Ill 0
1113 IIHT PPB a 3 2 3.2 J.'l 1.2
I~D UNKNOIN PPB • 0 0 17 .8 13 II. 1 u ' I 0 Jli

WHC-SD-EN-AP-185, Rev. 0
This page intentionally left blank.
B-6
WHC-SD-EN-AP-185, Rev. 0
APPENDIX C
CONCENTRATION VS. TIME PlOTS FOR DETECTED CONSTITUENTS AND CONSTITUENTS EXCEEDING MCLs
C-1
WHC-SD-fN-AP-185, Rev. 0
This page intention~lly left blank.

120
110
100
90
..J 80
' ·r-t u 0 70 ........
.-.. r t-
t.o.'l z 60 w ~ UJ cr 50 ::J c.n <t UJ :I: t10
30
20
10
0
Gross Alpha w/U (MCL w/o U = 15 pCi/L)
Well: 399-1-10A Code: ALPHA 0
{
[ ll:f.l
\ \ \ ~~ I ~ {]
I L fl_ _]
J I ~~I
/ J( I:J
I j
~ " / I
v \ !/ \ v I
r.l-.1""1 j ~·-..._.-..-PI rtl. .... l.! ~ - "1::. I
I
87 88 89 90 91 92 93 9-4 95
VI='AJ:I
..• .,;.;
:IIC . ,';..· :z:: n I
VI 0 I
""' z I > ""0 I ....
co l.n
"
"' tD <
0

160
150
140
130
120
110 ..J
........ 100 .....
u a.
90 ~
n I 1-
80 .,. z
UJ ::t:
70 w cc ::::l
60 {/) oc{ w ::E
50
40
30
20
10
0
Gross Alpha w/U (MCL w/o U = 15 pCi/L)
Well: 399-1-11 Code: ALPHA 0
~
lR_
1\ ..... I I,;;T
\ " \ v ~
~
-- ----····-
87 88 89
J2 /
90
.. .... /1 ~
/ /
/ /
L_ ____
91
YEAR
92
~ 1-i:::t
93 94
I
!
'
~ i
95
::c: ::t: n I
U'l 0 I
1""1 z I
)> "0
I ,_. lXI !J1
~ <
0

90
80
70
60 ·ri
u c. .._.
n 50 in I-
z w ~ w 40 a: :J Ul <(
w ::!!: 30
20
10
0
Gross Alpha w/U (MCL w/o U = 15 pCi/L)
we 11: 399-1-12 Code· ALPHA 0
IJ
I
I I
~ I
f j r= ~
I ~ !'... J{ J(
--
87 88 89 90
. - [
~ "'J
91
YEAR
92
I
K
\ \ I
~/ n y \ '
~ i
~- - - '-------- --·-·····- --
93 94 95
lC :I: .. n <, ..
I t/1 0 I
1"1'1 2: I > "'=' I ..... (X) U'l
:::0 (1)
< . 0
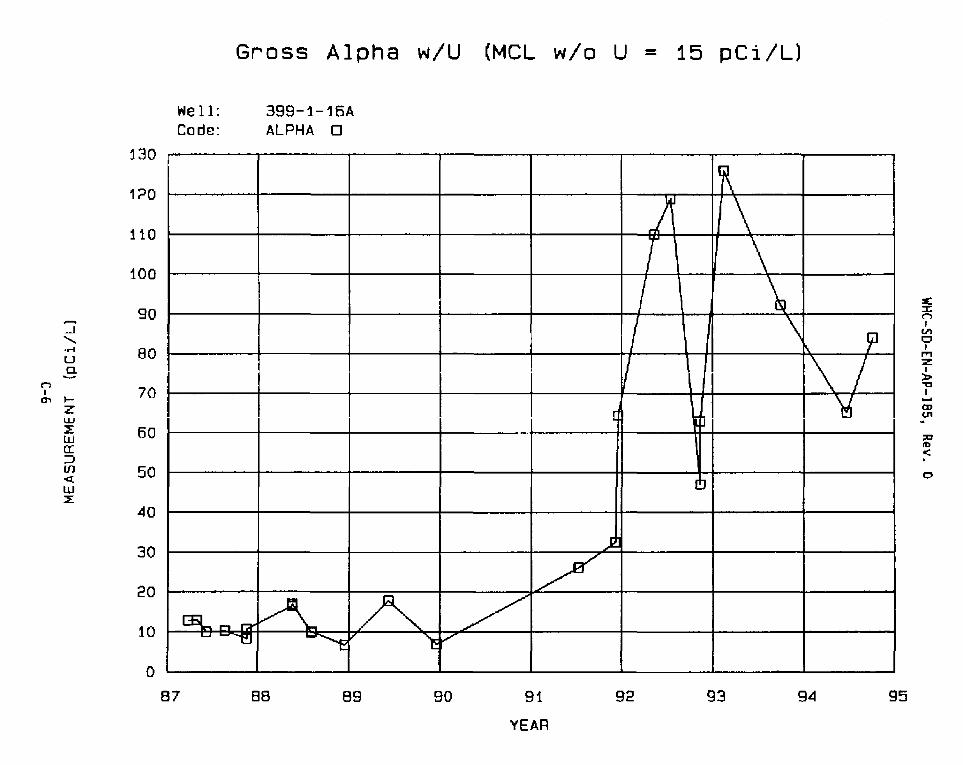
130
120
110
100
90 -_J ....... ...... u 80 c. -n
I 70 C'l .._
z i.Lj
~ 60 w a: :J U) 50 <d; lU ~
40
30
20
10
0
Gross Alpha w/U (MCL w/o U = 15 pCi/L)
Well: 399-1-16A Code: ALPHA 0
l:£l.. n r:::r A ~ ..... ~-e::J
~
87 88 89
~ v
90
/ /
91
YEAR
1\ } \ T \ I _\ I \ 11 [\
l ~I [ ] 'M
I!J
~
92 93 9.4
I
;
;
J 95
:C :r: n I
VI 0 I
I'T'I :z
I ~ "1:1 I -m
V1
::0 rb < . 0

210
200
190
180
170
160
150
_j 1~0 ....... ...... 130 u 0. 120 -("""")
I 1--...I z 110
w 100 ~ w a: 90 ::l [f) 80 <C(
w 70 ::;:.:
60
50
40
30
20
10
0
Gross Alpha w/U (MCL w/o U = 15 pCi/L)
Well: 399-1-17A Code: ALPHA 0
r:l
] G~-o
I [
I I I I 1i
I i \ I fi\
~ /' \
~ I ;b I I J I ~ ~
e J r("
1 I I
I~ 87 88 89 90
LY
......
f'L
~
91
YEAR
\ 1
rn.
\ G: \
m \
e l\ \
~
92
[iJ
r\ \
Q (;J \ V\ V\ _\
.J tti\ j ~ J \_
~ ~"0 I!J ~
93 . 94
.:: ::I: "·· r> I Vl c I
......
.:z I > ~ I -ClO
U"l ,.
::a (D
<
0
95

........ _J
' ...... u a ..._.
n lr-coz
w ~ lJJ a: :::J Ul oct w ::E
Gross Alpha w/U (MCL w/o U = 15 pCi/L)
We 11: 399-2-1 Code: ALPHA 0
BO
70
60
50
40
30
20
10
0
85
I
1}1
_,.4 ...
IM I;' 1/..¥1 ~
~ w ~ril '1'!11! ~
1._ .. ··-·-------L..,___
86 87
~ J
T' 'J I
......
. I II m
Ji! A / r\ 1r ~,.., _r. v
.............. --
88 89
I;
90
YEAR
~
-91 92 93 94 95
::.: :c ("") I
VI 0 I ,...., :z I
]:lo -o I -co
U1 >#
"' m <
0

60
50
- 40 ..J
' ...... u a ........
n I 1-1,1)
7 ~" w ....... ~ w ([ :.:J U1 <X: w :E 20
10
0
Gross Alpha w/U (MCL w/o u = 15 pCi/L)
Well: 399-3-10 Code: ALPHA 0
1
I ~
I~
I ~
[ ~~ u ~
{
~~ Jll~ N~ _g)~
N --- '---
85 86 87 88
I I I
~
ll 1\ l [\ I~
)/
---
89
--
90
YEAR
~ ~
91 92
I I
I
~ ~
"""t:! v 93 94 95
~ n ' VI
c I
rn 'Z I
J/JIOo "0 I -(J)
!.-" ~
::a m < . 0
... ~ ~

31 30 29 28 27 26 25 2LI 23 22 21 20
0 a 19
n..9 18 .... 17 ol-z 16
w ::l::
15 w 1LI a: :J 13 (() <( 12 w 1 1 ~ 10
9 8 7 6 5 Ll 3 2 1 0
We 11: Code:
-\ \ \
_\
399-1-16A BENZENE 0
~ .. - .....
87 88 89
Benzene (MCL
.. ...
399-1-168 BENZENE 0
r .. ... -.......
90
' ' '
91
YEAR
5 ppb)
-l n l L\
I I l I ;\
I l... I _:\. I "\
1\ I \ .I
"- ~ M.
92 93
"\ \..
fq. - ...... -. 9LI
I
..
95
:E: ::I: n
I VI 0 I ,...,
:z I
> -.::7 I -c:o
tn
XI 11)
<
0

-_j ........ •.-t
u Q.
0 U1
II
_.J u ~ -m
-t-1 Q)
m U')
en 0 L
(.!)
<( 0 -o I -I <C 0'11-0) lL (TJIIJ
........ QJ ,.....,"0 QJ 0 l:U
0 00
I ....
1-o r-'
-~
WHC-SD-EN-AP-185, Rev. 0
I~ l
~ ~
-=
0 tD
--
0 lD
;
0 -;;;·
c( ~
~
0 ("11
n; r J o J lN 31f.l3t:lnsv 3~
(-11
.f)
~ ~
0 C\J
p-
~~
~ v~
~
0 - 0
lD Ol
v en
(11
rn
ru Ol
..-1 a: 01 .<C
0 Ol
Ol [D
CD CD
UJ >

-_j ......... ·r-1
u 0.
0 lD
II
_j
u ::E -m +-' OJ 0)
(J')
(J')
0 L (!)
...... -o I ...... I <(
CJJI-OJW (TJIIJ
..... QJ
.... '0 Ql 0 ~u
WHC-SD-EN-AP-195. Rev. 0
G::::: ~
0 lD
~
~
0 Ill
~ 1\.
("3c;;; -:..., 'i!J
(l/~Jd] lN3~3~nSV3~
C-12
0 N
.~ ~
)p
~ ~
~ ~
Lj.l
lD
\ [j v \ ~ ..... -
0 ..... 0
Lf) m
1"1 m
(\J rn
...... a: m <t: w
0 Ol
rn CD
CD OJ
,..._ co
>-

-_j ........ ·r1
u n 0 lf)
II
_j
u ~ -ro .., QJ m en Ul 0 c..
(.9
< lD ..... 0 I ..... I <[
C'll-DlUJ Mrn
...... QJ
- '0 Q) 0 ~u
0 Ol
,...., -
: I .: ~
WHC··SD-EN-AP-185, Rev. 0
··-;--·
-1---
0 co
-
1---1"---
0 lO
r---
0 tf)
._..
v -e -....-
(l/iJd) lN3W3~nSV3W
C-13
;)
__...... -
\
I\ I,J.J
ctJ
\
',r [~.-I ~ 0 ru 0 - 0
If) D1
ru C1l
- cr: m <:t w
0 Ol
O"l tD
co (II
>-

120
110
100
90
..J 80
' ·r-1
u ..9 70
n I
.... 1-~ z 60 L!.!
~ UJ cr 50 :J UJ < w
40 ~
30
20
10
0
Gross Beta (MCL = 50 pCi/L)
Well: 399-1-17A Code: BETA 0
(iJ
~
r " ~~ 9 I \ q L J
tp--.e ~
V\ v \ ~I \ /) \;
C,.J
[!J
87 88 89
~
90
B
91
YEAR
[]
[
l. I
'J \ ~ ~ ... k...z /~ _... .-2' ~~\ Ul-l ....
~
92 93 94 95
E :I: ('""') I tn 0 I
1""'1 :z I > -u
I .... co U1 .. :lO It' <
0

160000
150000
140000
130000
120000
110000
D 100000 a a.
n ~ 90000 I
..... I-U"' - 80000 ""-
w ~ lLI 70000 a: ::::> rn
60000 <X UJ ~
50000
40000
30000
20000
10000
0
Chloride (MCL = 250000 ppb)
We 11 : 399- 1- 1 7 A Cade: CHLORIO 0
]
4' ["' ll~ 4 h
~ I l
J r ' ~ ~ [
I 1\ I I(] ~ ~ li i
~ ~ -~tl]~~~ ~ ~~ ~ ~~ (fftJmJ [
87 88 89 90
...
1.--.
,..,
~~ ....
h
1:1 l~ J
(
r
"\ % !IIIIIL ttl
CLJ~iitw~ ~
91
YEAR
92 93
..,
I ~ I J
.r.
94
... ~;
i
I
!
-
95
~ ,--,_ :r ---('""')
I
V1 0 I
1""'1 z I
:z,. "'0 I .....
CXt U1
,., rD < . 0

0 . > Q)
a: ~
= co ......
' 1::1..-c:c ' z
w
' 0 V)
' u ~ :)I:
~6
"/\. e
vs E6 26
~ n ~ '\ \ 1'1 J
\ V' J r\ /\ ' I r\
M" ~ ">1. \
' ..... , \
\ I I
\ I ~ "
(~
~
'\.
t:::IV3A
~6
""-"-....
06 68 88 LB
"'-..... A - AA A V' .., .... "V ..,
\
\ ,...., \._... r\
V'WV'V'
\ ,.....,
\ I
" \ r .-.
'\ r'--....... .... 1\ I
'\. L 1 'i
" ./ \ ~
..... \ ..... \ \ \ J
\ \ I l v -
0 ~tiO.:llHJ 0 WtiO.:llHJ :apoJ 89~-~-66E V9~-~-66E :{{aM
W.JO J 0 ... 10 I ltJ
0 t .;J ......
1,t: (, ~-.::I
9 : l_
8 ~ I rn 6 l>
Ol [I) c
~' :0 rn
2l ~ rn
E:~ z <D -1 .....
l?l I
u
(;~ "D u
9l a
Ll Bl Gl be "(;2
;;2 Ec llc !;c

E (_
0 't-
0 L 0 coO r-1
.r:: ,.... - ::E:
u I IJ: -a I L... Ol__J
m:r fll[.J
< D ,.... - ~ I (I - 0 I lJ. m__J m:c f11U
,...; (jJ ~ "0 QJ a ~ u
0
""
WHC-SO-EN-AP-185, Rev. 0
0 C'1
0 (\J
(Qdd) 1N3W3~nSV3W
C-17
0 0 -
Lf) 01
...,. 01
fT) m
('\J Ol
-· m·
0 en
Ol (IJ
CD CD
r-.. CD
a: <{ w >-
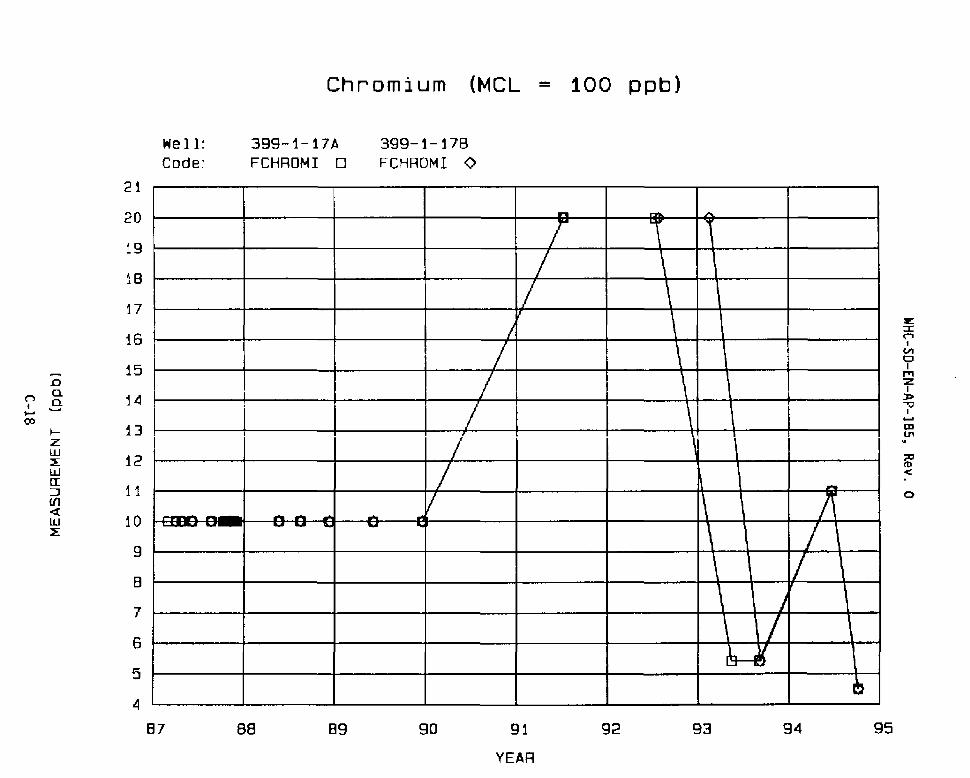
21
20
19
18
17
16
15 0
n a. 1-tl l a. ....
co f- 13 z w ::::E 12 w a: ::J 1 1 ({] <t w 10 ::::E
9
8
7
6
5
4
Chromium (MCL = 100 ppb)
Well: Code:
.--... ... -...__ __
399-1-17A FCHROMI D
.......... -- ....
87 88 89
399-1-178 FCHROMI 0
I I
.... !
I I
I I
j_ I
v - ~ - ...
90 91
YEAR
92
,..,...
\ \ \ \ \ \ \ \
,.,
\ /'1 \ I \ 1/ \ )
\ I u
93 94
~
95
:.E: :::I: n t
VI 0 I
l""t 'Z I ~ -.;;7 l ....
tD ...,.,
::11:1 Ill <
0

,-..
.0 a. a. 0 0 0 ~
II
...J u II)o ~ I'--- -cr
IW ....... 0...
L 10... QJ cno mu c. 1"1LL c. 0 u <0
I'---a: IW -o... 10. 010 ClU (T]t.L
...... Q}
--o OJ 0 ~u
:: ~ . : . i
WHC-SO-EN-AP-185, Rev. 0
~----------_,-------~--+-----------~---------+--,
0 0 .... (T)
i I -~-
0 C\J
(Odd) .LN3~31:::1nSV3~
C-19
0 0 .......
Ln C'l
v []1
fTJ []1
N O'l
-Cl
0 C1
Cl (D
tD (D
,..... (D
([
< w ;>--

-D a. a
0 ,.....
II
...J u ~ -QJ
c QJ r-1
~ .c -1-' QJ
0 L 0 r-1
.c u .,... D
w u 0
CIJD lD -w 10
...-1(\J I -Oltn m~--< [T)U
....... QJ
....... '0 QJ 0 3:U
WHC-SD-EN-AP-185, Rev. 0
~---~
[~ v--
\
0 (T) -
0 C\J -
-=--G
[ :
'
I
() ..... .....
"7
0 0 ..-1
(Odd) 1N3~3~nsv3~
C-20
0 Ol
0 (D
lf) O'l
r1 a: Ol q w
>-
C\l 01
..... m

11
10
9
8
D 7
c. ("") c. I -~ ..... 6
t-z w ~ w 5 II :::J Ul ...::!; w 4 ~
3
2
1
0
Ethylbenzene (MCL = 700 ppb)
Well: 399-1-16A 399-1-168 Code: ETHBENZ 0 ETHBENZ 0
I I
I - -- \
\
-----
89 90
I I
_Ill
I I
\ I 1\
\ / 91
~ L 92
YEAR
....
\ 1\ \ \ \ \ \ ~
93 94
I I
;
I ~
\ \- i
95
::E '-"""" :I: ~; VJ c I
I'TI :::z I
;r:. ""'0 I .....
(J) VI .. :10 t1l <
0
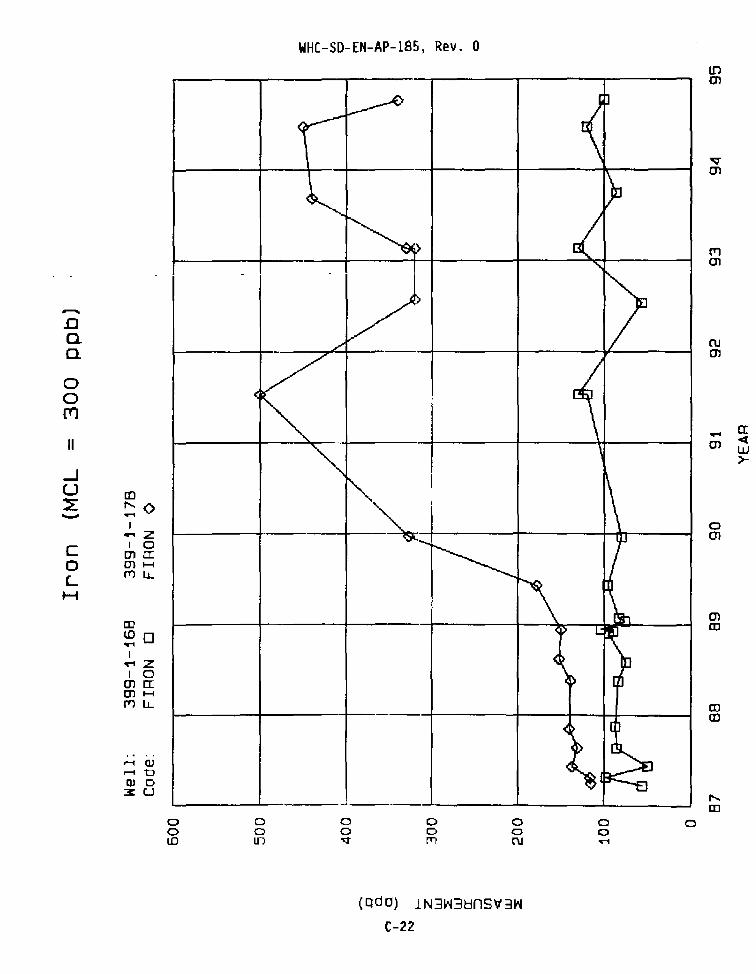
_....., .0 a. c.
0 0 (11
II
...J u ([)
~ ,....,0 - ....... J ......,z
c I 0 rna
0 ffiH
L rTlLL.
H
ID 1.00 -I -z I 0
mer: (F)H rTlLL.
.....-{ CJ -0 Ql 0 3:U
0 0 lD
0 0 Ul
WHC-SD-EN-AP-185, Rev. 0
0 0 ...
0 0 0 0 [T'l ru
(Qdd) lN3~3~nSV3H
C-22
0 0 .......
0
tn m
M Ol
ru m
-en
0 m
0) ID
CD aJ
"' [I)
a: ...:I UJ >-

........
.0 c. c. 0 1.()
II
_j
u ~ -u co QJ _j
0 -o I {T) 10
Ol<( rnw rr1..J
-o I (\)
10 01<! OlW {ll_j
....... Q}
....... 0 w 0 3:U
0 0 .......
<) I""'
0 rn
0 CD
- ~:: '
WHC-SD-EN-AP-185, Rev. 0
....... ...,
'·
i I
0 r---.
I
I
:
i
0 U:)
~
0 lCl
{qdd) lN3~3~nSV3~
C-23
J. 0 {T)
0 (\J
<ft \
) I> 7
'II
f)
'~ c~ t~
i~
~~ :r:l"
0 0 .....
tfl 0'1
'V m
(T} m
(\J
O'l
0 a: m ..:~ w
en w
w tD
(CJ w
U1 CD
>·

we 11: Code:
100
90
D a. a.
n '
N 1--.j>o. z 80 . " ~ I ~
w [[
:::J {/] I o::t w :::E
70
60
87
Manganese (MCL = 50 ppb)
I I
399-1-168 FMANGAN 0
\ Ill
88 89
399-1-178 FMANGAN 0
\I Ll 7
90
I
/f I
91
YEAR
I
_\I t::.J'\. \1
92
:1: :I: ("") I tn c I
I 1""1 ::z
I ~ ""0
"I
I -(D U'1 -:c tD <
/I I I 0
93 94 95
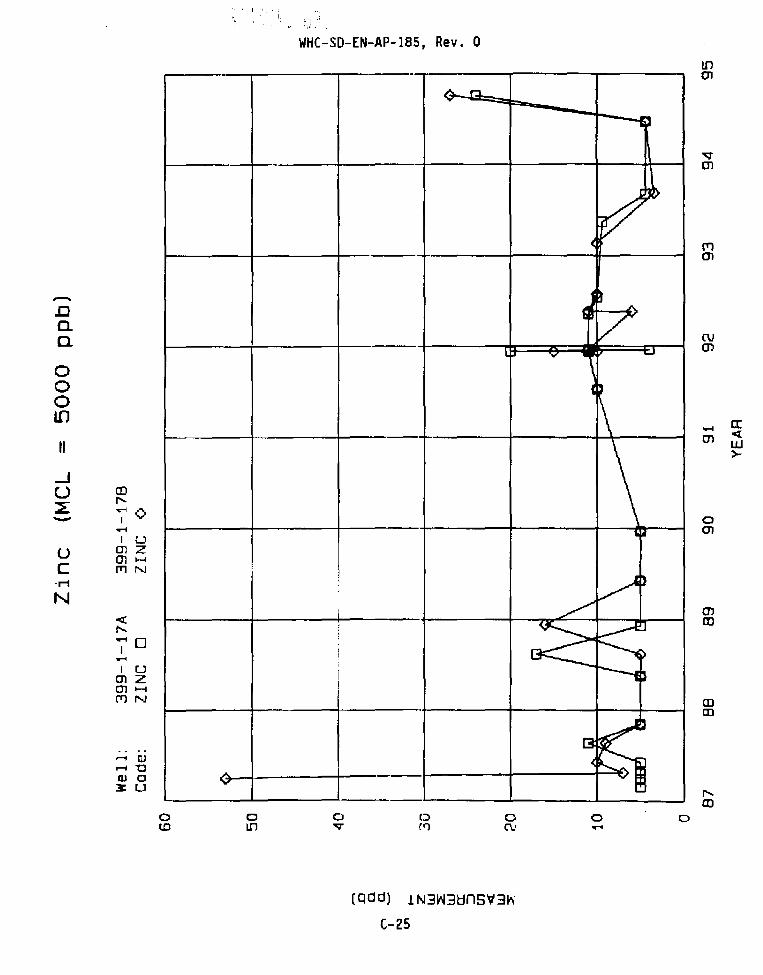
......... .0 a. a 0 0 0 lf)
II
_j
u ~ -u c -r-1
N
CD I"-....... 0 I -I u rnz rn~-~ (TIN
<( ,......
-o I -I u enz en~-~ (TIN
0 tD
A v-
I ,
0 LI1
',! .; -
WHC-SO-EN-AP-185, Rev. 0
i
i !
~__n.
[
0 {\)
(Qdd) !N3~3~nSV3H
C-25
,,.
(
~t>
~ A
~
/ v- ....
\
't\
'II
~ v~
< K --u
[3
~ <
0 - 0
tn en
{") en
ru O"l
- a: m < w
0 0'1
O"l m
CD CD
>-

21
20
19
18
17
16
15
1Ll .0 a.
n a 13
~-N 12 0'1 1--
z 4 1 w £ £
:::E w 10 (( :J UJ 9 <:{
w 8 :::E
7
6
5
4
3
2
1
We 11: Code:
,........_ .... ..___ ..... -
87
399-1-17A SILVER 0
... .. ... .... ... ....
-
88 89
Silver (MCL = 50 ppb)
399-1-178 SILVER <>
J
I I
I I
~ ... r
/_ I
-"' ..,
'\ \ \ \ \ \ \
I -~-
____ j ...._.... ·~· ..... ~.-~ v ... - 1"1 ..
90 91
YEAR
\
\ \
92
1\
_\ \ \ _\ \ l ___.e--El ...... ...
----
93 94
I
I
' i
'
95
X: =r: n I
{/)
0 I
I'T'I :z I
)::o ""0 j .....
(XJ U"'
::c ro <
0

-..c a. 0..
0 0 0 0 lCJ ru II
_, u ~ -w .fJ ro '+-........ :l (fl
<o " ...-tlJ..J I f--< I 1..1..
01 . .J C'l :::> fTl Cll
.. ...... Q.l ...... "0 w 0 xu
..
. i
WHC-SD-EN-AP-185, Rev. 0
L------------------L----·-------------b----------------~ 0 0 0 0 [TJ
0 0 0 0 C\J
0 0 0 0 ......
(Qdd) 1N3W3~n5~3W
C-27
0
Ln en
C'l rn
C\J en
0 01
C'l al

We 11: Code:
11
10 __.. ... --t
9
8
0 7
a Q -...,
I 6 N 1--co z ,_.
LLJ
::E w 5 rr ::::J UJ <{
w 4 ::E
3
2
1
0 L__________ --
87
Tetrachloroethene (MCL = 5 ppb)
l. ...
399-1-16A PERCENE 0
........ -... - -
-----·- ---
88 89
399-1-168 PERCENE 0
- .... ... ..... ...
\
90
\ \
\_
\ 91
YEAR
\ "-
I I I I
· .
... ~
\ \ \ \
4~ v' ~ "-J"
92 93 94 95
:11!: ::c n I
VI 0 I
/'TI ::z
I ,.. '"C I -D)
"" ;:1:1 ttl <
o

We 11: Code:
11
10 -.., g
8
.0 7 0.
\
\ \ t
n o. ,-N 6 \ 1,0 1--
z w :::E w 5 (I :.::J (/l
<t w 4 :::E
3
2
1
0
87
Toluene (MCL = 1000 ppb)
.\. ....
399-1-16A TOLUENE D
... ' ...
88 89
399-1-168 TOLUENE 0
- .. ... .... ...
\
l
\
90
\ \
\ 91
YEAR
\
.. ""' \ \
A. ..... Jill
92
a..
\ \ \ \ ~ ~----
93 94
-·'
95
::E: :X: ,., I
V'l c I
1""'1 :z I > "'0 I .......
Cia U'1 .. ';lC ro < . 0

12
11
10
9
8 D a
n a. 7 I
w 0 t-
c ? u w :E w
5 a: :::J U)
< w :E il
3
2
1
0
TCE (MCL 5 ppb) DCE (MCL 70 ppb)
We 11: 399-2-2 399-2-2 Code: CIS12DE 0 TRICENF 0
I
A..
{\ "'-
l \ J I~. I \ I I ' \ I
I \ I I ·\ l
I \ /_ . I ·\ \ I I .... I
J. r\ "' \ ( ~
\ !
\ \ J
\' .... tJ
r::: -- ·-
88 89 90 91 92 93 94 95
YEAR
s::: ::z:: ("") I
VI 0 I ,.., :z I > .., I -())
U'l
XI ltl <
0

25
2-4
23
22
21
20
19
18 .D 17 a
n a 16 I -w .... ...... ~h
z i...,l
w 1-4 ~ w a: :J
13 (.{) 12 <(
w .:::>- 11
10
9
8
7
6
5
-4
Trichloroethene MCL = 5 ppb
Well: 399-1-168 Code: TRICENE D
rl
,...,
~ ...... / j ~ !\ ~ ..... L.. v \ ...., ....
\ !\ v \ LJ
\ ~
·~ ·~-'- ·- .. ~ ~ .. -. ,.
87 88 89
....
r - -~
\ \
\ \
---- ---~ - '·- -~- -----"
l. '-'
90 91
YEAR
,...
...., \ ~ \ \ LJ\ ~ )., ....,
\ ~ l I
.... 19' ...
92 93
,..,
..-/"\ \
1\ \ \ S--e
94 95
=c :I: n I Vl 0 I
IT! :z I )> -.;:1 I -01)
U'1
:::0 I'D <
0

.......... .c a. a. L!l
ll
_J u L _.
Q.l
c OJ ..c. ..jJ
OJ 0 [_
0 t"""1
.c u
·r-1
L 1--
mD ,..... -w IZ ..... w I u
O}H rnrr [T'Jt-
..... Q}
.-.o QJ 0 3:U
- ---
n ...... 0 m
WHC-50-[N-AP-185, Rev. 0
ro
.... ~ v-
----r----
1~
[J
IP
--1--- q.J '
IP
IIJ
[p
lP
--l ~
ID LO
(Qdd) 1N3~3~nsv3~
C-32
} v-k(
v-
C\J 0
1.!1 rn
{'") m
C\J Ol
..... c: m <l w
0 01
en IIl
(I)
co
>-

E ::J ·rl
c m ~ ::J
0
f\J::E I:J
......, H
IZ 01<1: mer (TJ:J
- Q) ..... '0 w 0 3:U
I ~ ' '
.... ~
; .I!
0 (TJ
WHC-SD-EN-AP-18;, Rev. 0
~ ~
f\
\ \ \ \
---B ~ ~ El
~ -~ ~ ~
DEl
~ ......,
"tk ~ ~
-
0 ru
.....
-
(Qdd) 1N3~3~ns~3~
C-33
0 ...... 0
Ul 0'1
[T) (J1
(\1 m
-m
0 ([ 0'1 oe:( w
m (D
(D
tD
tO (D
ln (D
>-

.D c. ,-.,
j w .p.
I-z w z w II :::::> Ul <(
w ::E
Uranium
Well: 399-1-10A Code: URANIUM 0
160
150
140
130
1
uo
100 I
90
80
70
60
50
40
30
20 v 10
0
90
/
~
l I
j / I ~
~/ /
/__
/ L
/
---·-·········-- ·-······~-~·-··-························-···---
91 92
MCL = 20 ppb
..C1
\ \ ~
\ --"=L
... ~ \ \ \
. --- ·-
93
YEAR
I
..r::1
b:r-~ \ \ \ \
CJ
·-
94
!
I
95
s:: :::z::: n I
V)
0
' ...., :z I > "'Cl I ....
(lO u-. ~
:;10 ID < . 0

E :J . .,; c: ttl (_
::J
0 ..... -~ J:J ...., H
JZ (JJ<(
rna: C'1:::J
0 ......
;: : .. 1 .. WHC-SD-EN-AP-185, Rev. 0
~ ~
~ 1..:!1;
"" ""
0 0
0 en
~
0 CD
v ~ ~
~ \
L v V"
v ~
v.---
~ "
'"" "" ~ ""' 0
1.0 0 1!1
0 ''Q"
{Qdd) 1~3W38nSV3W
C-35
0 C'1
0 {\)
0
IC1 en
('f) m
C\J m
0 CJ)
a: < w >-

.n c. c. 0 ru II
_J
u ~
E :::l
·r-1
c 10 L =>
D (\1
-~ I::J .,.. H
IZ 01<!: rna: 1"1::J
...... Q)
.....-it:J Ql 0 ~u
0 m
cr ~
[9.
0 CD
-
WHC-SD-EN-AP-185, Rev. 0
~ ~_....-
1-. -
0 lD
'K
ve(
·-r---
0 If)
~ ____-IP
"" ' [> v
r-- - t--
~~
v
0 [1')
0 [\1
(Qdd) 1hi3H38nS'V3H
C-36
0 -
ID O'l
f'1 Ol
C\1 m
-m
0 m
II ct w >-

D a c.
0 ru II
_J u L
E :::J
·1""'1
c ro c... :>
<D tO .-4~ i:::l
.-4 H
I:Z 01<( OlO: M:J
....... Ill
.-1'0 aJ 0 31: Ll
' .. :• .• .. '
: ~ i ! : . ':; ... :·h wHt.::so-EN-AP-185, Rev. o
--e ---~ :.--~ --~
--.......... '-.......
'-... ~
...............
r---..... ~ ~
:..;.-- f.--" ~
~ f.----· --:--
~ ~ --r --,...---
I
L r-- ....__ -.........
1--r--r-... !---~
~
1\ ~
\
\ ~ ~
0 0 0 0 0 0 0 0 C) 0 0 0 0 0 0 0 0 w m ~ ~ ru - o m m ~ w m • M ru -.-4 .,...., ..... .,...., ..... - .-4
(Qdd) 1N3~3~nSV3~
C-37
Ln 01
N 01
-01
0 01

.0 0. Q
0 ru II
_J
u 2
E :J ·r1
c ro L :=J
<0 r--. -~ I ~ ..-.H I z
[J]<l: en a: I'TJ::>
,.... QJ ,...."0 QJ 0 3:U
0 0 0 0 t.O 1!1
WHC-SD-EN-AP-185, Rev. 0
0 0 '<;f
---
0 0 0 0 C"1 ru
(Qdd) !N3~3tlnSV3~
C-38
0 0 0 .....
tf) m
(TJ 01
(\J
01
-m
0 01
a: ct UJ >-

.c Q. Q.
0 ru II
_I u ~
E :J
·r-1 c: ro (_
=> 0
.-t;:E 1:) r\IH IZ 01<[ rna: [TJ:)
- ll.l -'0 Ql 0 ~u
0 0 ....
WHC-SD-EN-AP-185, Rev. 0
--1---~
~ ~
0 01
0 CD
----~ < '-.......... ~ ~
~ [:>
~ ~
~ ~
~
1\ 1\
~-t-t=.
~~ ~
I--
r---..... l """-....
~ ~ ~
' ~ i
0 tO
0 Ul
(Odd) 1N3W3~nS~3H
C-39
0 (T)
0 C\J
0 .... 0
111 m
(T)
m
N rn
.... rn
0 en
a: c;(
UJ >

-D Cl. Cl. ("') ._..
I .... 0 1-
z UJ ~ w [[ :J (I) -ex: w ~
We 11: 399-3-10 Code: URANIUM 0
27
26
25
2LI
23
22
21
20
19 ...... 10
17
16
j5
14
13
12
11
10
9
90 91
Uranium MCL = 20 ppb
l~
_\ \
~ 1\ l \. I ~
_1:': --·~ - I
/ \ j I \ I
J \ j \ I \ l ~ I ~ I
\ I \ l
\} ~
- -·-·
92 93 94
YEAR
\ _\
_\ _:
l!J j
I
I
i
I
]
95
:c :::1: ('")
1 en 0 I ,..., z I > -a 1 ....
00 U"t
::c fl)
<
0

-D c. a
0 0 0 0 'oM
u _J u ~ -Q.)
c Q.)
,...... >-X
ID<) lD ...... IW
....-tZ IW
Cl..J Cl> (11)(
<r:o lO -IUJ ...-~z IW
Ul..J Cl> f"lX
.-t II)
.-tO DJ c ::J:U ii
- 0 ...... -
' ' ' ~ ! . ; ' :
WHC-SD-EN-AP-185, Rev. 0
-r--r--
Cl [(l
v v ...
I
---- l!f
IV v
!ill'
c~
Ill
I)
0
.. n
.......__,
lO 10
(QOd) lN3~38nS~3~
C-41
y) v ~
_J
v v ,.
v
(\1 0
l.['l 01
'V m
ru m
...... CI m <t: UJ
0 m
m [(l
OJ ID
>

WHC-SD-EN-AP-185, Rev. 0
This page intentionally left blank.
C-42

.j I •
WHC-SD-EN-AP-185, Rev. 0
APPENDIX D
WELL CONSTRUCTION AND COMPLETION SUMMARIES
D-1

WHC-SD-EN-AP-185, Rev. 0
This page intentionally left blank.
D-2

WHC-SO-EN-AP-185, Rev. 0
WELL CONSTRU~TION AND COMPLETION SUMMARY
DrH liMg Sflllllle Method: Cable tool Nethod: Drive barrel OrllliM!il 3DO Area Water Additives Fluid Used: Supply Used: Not do~umented Driller's WA State Nllle: COrdon L 1 c N r: __,o..,a"-ry"-----Drillin!il Company COI!pllny: As sod a ted p r il \ ers Location: ___ _ Date Date Started: 13Nov86 Complete: 22Noy89
Depth to water: 29.0-ft Nov86 (Ground surface) Z9.4-ft 17bec93
GENERALIZED Geologist's STRATIGRAPHY Log
~10: Coarse to medium SAND 1~20 Sandy GRAVEL l~30 Silty, sandy GRAVEL 3GM35 Silty, sandy PEBBLES
WELL TEMPORARY NL.Jo!BER: 399-1- 1 OA WELL NO:_.S2:·;.z3"----H811~ord Coordinates: N/S S ~?.293 E/W E 14.411 State RN 7,083.8 RE 16,0 .6 c oord 1 nat e5 : H Not doqment ed E N c t doc Start C~rd #: Not documented T A s Elevation -- -- ---Ground surface: 371.94-ft Brass cap
Elevation of reference point: [373.65-ftl (top of casing) Height of r•ferenc• point above[ 1.71-ft] grollld surf.ace
Depth gf surfac• sul [Oo-13.5- ftl Type of surface seal: Portland ~eoent 4·ft x 4-ft x 6-in(nom) eKtending 3-ft into annutus. Bentonite ~rumbles to 13.5-ft
1--: 6-in ID stninless steel ~asing, +1,7 .. 2.1..5-ft
H~te diameter, o..4S.O-ft, 11-in nominal
Volclay bentonite pelllts, 13,5 .. 18.5-ft
Drawing By Date Reference
RKL/3-01-10A.ASB 1?Jan94 HANFORD WELLS WHC-SD-EN-DP-071
=------------: ~ : I
---1 silica sand pack,
iH!i i:!i DTB
r~~~=: i':Ba~k.fi ll W ·fmfmfmfmt!if ----~:
D-3
18.5 .. -39.5-ft. 8oo1?-mesh
6-in $tainless ste•l screen 24.5•39.5-ft. #40-slot
10-in telescoping screen, 29.5 .. 39.5-ft
DTB=Depth to bottom, 39.1-ft. 12Febll2
Borehgle drilled depth: t .:.s.o-ft 1

Drilling Method: Cable toot Drflllna FLuid Used: ~eN water Orfl ler• s Nllllll!:: D Rosslnlll'1 Drlt ling
WHC-SO-EN-AP-185, Rev. 0
WELL CONSTRUCTION AND COMPLETION SUMMARY
S811f>le Method: prjve barrel A deli t ive~
I.IELL NUMBER: 399-1-1QB
TEMPORARY WELL N0:_1,_·...:.1.::.:DB::..._ __
Used: Not dop.pent ed lolA State
Hanford coordinates: N/S Not ctoc...nented E/W Not doc
RN 57,667.3 RE 16,033.3 lie Nr: Not OoeYDeDted CO!Il)any
State NAD83 CCKJrdiMtes: N Start
116,729.06m E 594.351.091!!
Company: [aiser ;ngine~rs Date
location: Hanford Date
Card N: Not documented T __ R __ s __ _ E I evat ion
started: 06Sap91 Complete: DBoct91 Ground surface: 372.47-ft Brass Clp
Depth to Hater: 3?.7-ft OBOct91 {Ground surface)
GEIE RALJ ZED Geologist's STRATIGR~PHY Log
Qoo8: SAND ~10: SILty SAND 1~J5: Gravelly silty SAND 35•J9,4: Sandy GRAVEL 39,4-49.6: Gravelly SAND 49.6-54.7: Sandy G~VEL 54.7•72: Gravelly SAND 72 .. 73: SILT 73"79.8: Gravelly SAND 79.8R80.1: Gravelly SILT 80.1~: Gravelly SAND 98w109,St Slightly gravelly SAND 109.~113: Gravelly SAND 113.,119: Sll T
Drawing By: RKL/3·01·10B.ASB oa ta :_,3=<-1,_,J"''an~9'os-~..,...,--Reference : HANFORD WELLS
WHC-SD-EN-TI·052
I ----1 Elevation of reference point: [375.58-ftl
(top of inner casing) Height of refer.nce point above[ 3,11-ft J grotnd surface
Depth of surface seal [Q*20.3·ftl Type of surface seal: 4-ft • 4·ft concrete surface pad extends 2.5-ft into annulus Portland cement grout to 20.3-ft
4·ln ID T304 stainless steel casing, +1,5o+104.S·ft
Bentonite crumbles, Z0.3 .. zB.Z-ft
Bentonite slurry, 28.2oo99. O-ft
Hoi e di llllll!ter, ~53.0·ft, 10.95-in 53.D-119.0·ft, 8.8-in
Si I fca s.ard pacll;, 99.~100.8-tt. 4~109-mesh
1 1oo.&*114.4·ft. 20w40·rnesh
~~~} 4·in T304 stainL•ss steel •cr.en, ~)fiji -: 104.5w114.5-ft, 110-5\ot !:!!liroiii -"'..-~- r-1 Bentonite hole plug,
····.-___J 115.3"119.0-ft
•·::::;;; ;~--·- 1 BorMole drHled capth: L B-in casing sho~ 1 [ 1}9.0-ft]
cut off ard left in hole, -117.~119.0-ft
0-4

l · .I ~ -~
WHC-SD-EN-AP-185, Rev. 0
WELL CONSTRUCTION AND DOMPLeTION SUMMARY
Drilling sample \JELL TEMPORARY WELL NO:-'C=-·....:.1:..:.A __ _ Method: cable tool Method: Drive b8rrel
Drilling 300 Area Water Addltlves NUMBER: 399·1-16A
F lui d Used :-'s,.,y .. co"""""ly.__ ____ used: Not doc ~me~"~ ted llantord Coordinates: N/S S 23,341 E~ E 14,304
RN 56,035.6 RE 15,910.1 Driller's WA State Na~~~e: Amos Lie Nr:_1...,2.=.24"----0rfll!ng Company c~any: As soc 1ated Dr i ll ers Location: ___ _ Date Date Started: 01Dec86 Complete: 04Dec86
Depth to water: 40.0-ft pec86 (Ground surface} 38.1-ft 1lPec93
GENERALIZED Geologist's STRATIGRAPHY Log
ON15: Silty, sandy GRAVEl 15•20 Clayey, sandy GRAVEL 20*30 Silty, sandy GRAVEL 30*35 Silty, gravelly SAND 35"45 Silty SAND with CLAY end GRAVEL 45~ro silty, gravelly SAND
State Coordinates: N Not docunented E Not doc:\ll!!f!ted St.flrt Card #: Not docunent ed Elevation Ground surface: 3SO.Z1·ft
T __ R __ s_
Bras5 c11p
----1 Elevation gf reference point: [381.51-ftl
I --;-:
Ctop of casing) Height of reference point above[ 1.30-ft l grol.rod surface
0 epth of surface seal [ QooS. 0- ftl Type of surf11ce seal: 4-tt K 4·ft concrete surface pad Cement to 5.0-ft
6·in 10 stainless steel casing, +1.3 .. 32.5-ft
Bentonite crumbles, 5.0o<21. 0· ft
Hole dilll!ll!ter, ~7.5-ft. 11·in nominal
Bentonite pellets, 21.!)::?4 .8· ft
Silica sand pack, ?4.e~7.5-ft. 1~20-m;ih
6-in stainless steel screen, 32.5~7.5-ft, #20-stot
·=~ ....... ..,.,.=~-L: 10-in telescoping screen, 37.5~7.5-ft, p40·stot
Borehole drilled depth: [ 47. 5-ft l
Drawing By D11te Refer-em:e
RKL/3•01·16A.ASS 12Jan94 HANFCSP WELLS WfiC-SD·EN-OP·O'i'l
D-5
DTB=Depth to bottom, ~7.8-tt, 04Dec90

WHC-SD-EN-AP-185, Rev. 0
WELL CONSTRUCTION AloiD COIPLETIOH SIMIARV
DriLLing ~le \JELL TEMPORARY Method: Ceble tooL Method: Drive barrel Drilling 300 Area Water Additives
MUMBER: 399·1 ~ 168 WELL MO :-'C~·:..-~1~D __ _ Hanford
Fluid Used: Suoo\¥ Used: Ngt dgc~.mented Coordinates: N/S S ?3 1350 E/W E 14 1326 State RN 56,026.9 RE 15,931.6 Driller's WA State
Name: Cordon/Amos Lie Nr: 1517/1224 Drilling Company C orpany: Associ a ted 0 r i ll ers Location: ___ _ Date Date Started: 29Jan67 Complete: 10FabB7
Depth to water: 37.5·ft Feb87 (Ground &urface) 37.8-ft 1?Pec93
GENERALIZED Geologist's STRATIGRAPHY Log
D-10: Sandy GRAVEL 1GN35: Silty, sandy GRAVEL 35M45: Gravelly, silty, clayey SAND 45-60: Silty, sandy GRAVEL 60-65: Clayey, &ilty, sandy GRAVEL 65"75: Silty, gravelly SAMO 75"80: Silty, sandy GRAVEL 80"85: Clayey, sandy GRAVEL 85w90: Gravelly, silty, clayey SAND 90N95: Sandy GRAVEL 95"110: Silty, sandy GRAVEL 11D-TD: Clayey, silty sandy GRAVEL
Coordinates: N Wot do~nted E Not doe Start Card#: Not doeunented T __ R __ s __ _ Elevation Ground surface: 380.03·1t Brass cap
I -----1
---1 .4 • ...........----:
Elevation of reference point: [l81.14~ftl (top of casing) Height of reference point above[ 1.11-ft J grolnd surface
D~th of surface seal Type of surface seal: 4-ft • 4-ft surface pad Cement to 5.0- ft
6·1n ID stainless steel easing, +1.1"105.0-ft
Bentonite crumbles, 5 ,Q:-+Z01 O-ft
VoLclay tablets, ?O.Oo-99.7-ft
Hole diameter, GM60.0-ft, 13-in ngmina\ 60.~118,0-ft. 11-ln nomina\
Silica sand pack, 99.7•118.0-ft, 8M12·nesh
6-in stainless steel screen, lOS.D-115.0-ft, 120-slot
[ Ow5.0-ftJ
'---------------' .------1 Borehole drilled depth;
DTB=Depth to bottoq, 115.5-ft, 03Dtc90
[ 1 18.0-ftl
Drawing By: RKL/3·01-16B.ASB Date 12Jan94 Reference :-'Hw;A~N~FQ6~D~WE~L;:!!l-2S==,....
WHC·SD·EW·OP-071
0-6

WHC-SD-EN-AP-185, Rev. 0
WELL CONSTRUCTION AND COMPLETION SUMMARY
Drilling S.mpte Method: Cable toot Method; Drive barrel Drilling 3oo Area ~star Additives fluid Used: Supply Used: Not doeuntnted Driller's WA State Name: Cordon Lie Hr:__,D,...,Oc:.-794----Drilllng Company conpany: A~>soc I a ted Dr Ill ers Lee at i on; ___ _ Dete Date Started; 08Nov86 C~l ete; BN ovl!6
WELL TEMPORARY HUMBER: 399·1·17A WELL HD: . ...::.C·....t?A<!!... __ !Ianford Coordinates: State Coordinates: Start
11/S S 23,331 Etw E 13.63D RN 56,045.7 RE 15,236.2
N Not documented E Not doc
Card #: Not dO(;!,IIletlted T_R_S __ _ Elevation Ground surface: 375.13·ft Brass eap
Depth to water: 32.3-ft Nov86 (Ground surface) 33.2-ft 17bec93 J ' ---, Elevation of reference point: 13?7.47·ftJ
(top of casing) GENERALIZED Geologi~>t's STRATIGRAPHY Log
0<-1 0: Sandy GAAVEL 10M25 Silty, sandy GRAVEL 25~35 Silty, gravelly SA~D 35~0 Silty SAND
Drawing By: RKL/3·01-liA.ASB Date 12Jan94 Reference : ...,H;7,A:;;:N,_F:Oli?D"=W"::EL:-:Lc::S=,....
WHC·SD·EH·pP·D71
D-7
Height of reference point above[ Z.3·ft 1 11 rol.l'ld sur fee a
Depth of surface seal Type of surface seal: 4·ft x 4·ft concrete pad. Cement to 5.0·ft
6-in JD stainless steel casing, 5.()oo25.D·ft
Bentonite crunbles, 5.0..19.4·ft
DTB=Oepth to bottom, 41.5-ft, 03Dec90
[ 0:5,0-ftl
[ 41.0-ft l

WHC-SD-EN-AP-185~ Rev. 0
WELL DO~STR~CTI~ AND CDM~LETlON SUMMARY
Dri II ing Sarpl ~ WELL TEMPORARY Method: Cable tool Method: Drive barrel NUMBER: 399·1·1!8 WELL NO: C·2B Drilling 300 Area W11ter Additives Hao1ord -=""""-"'----
fluid Used: Supply U~ed: Not da~u.ented Coordinates: N/S S 23,317 E/W E 13.604 DriLler's WA State State RN S6,DS9,S RE 15,210.3 Name; Cordon L i~ Nr:.,..,.,.l5,._1.,7_____ Coordinates: N Not doc:YI'II!f'lted E Mot do~ D rflli na Corrpany Start Coopany: Ass~:~ciated Dri tiers Location:____ Card N: Not docU'I'IIlnted T __ R __ S __ _ Date Date Elevation
~,_,:S:_:t:a:_rt:,:ed=:::::;;D:;l:;D;;e:;eB:;6::;:::;;:::;;=...:C::~:.::.:..:l e:,:t:e.:,;: =1=9D=ee;:S::6:::==::..LG::..ral:l"1d s:urface: 375, 48· f t Brass eap
Depth to water: i! 9·ft Dee86 (Ground surface):3-tt 11Dec93
GENERALIZED Geologist's STRATIGRAPHY Log
0<>5: Silty SAND 5~15: Silty, sandy PEBBLES 1~25: Sandy PEBBLES ~30: Gravelly SAND JOwlS: Sandy GRAVEL 35~0: Sandy PEBBLES 4~5: Sandy GRAVEL 55"70: Silty, sandy GRAVEL 7~5: Sandy GRAVEL 85M90: Silty, ssndy GRAVEL 90+-95: Sandy GRAVEL 95~105: Silty, sandy GRAVEL 105•110: Silty, gravelly SAND 11GM115: Sandy, gravelly CLAY
Drawing By RKL/3·01·1!B.ASB Date 12Jpn94 Reference ---;H~A~N,!:FO=:R::!D!..W""E:::L-:-L-::5--
WHC·SO ·EN·DP·071
I ----: Elevation of reference point: ~77.87-ftl
I
Tl-:
c top of cas I ntll Height of reference point above[ 2.}9-ft l ground surface
Depth of surface seal [ ~,O-ft] TYP- of surface seal: 4·ft x 4·ft concrete aurface pad CHIIInt to 4.0-ft
Bentonite crumbles, 4.0..28,0·ft
6·in ID stainless steel easing, +2.4 .. 100.0-ft
\lolclay tablets, 20. 8oo95 ,O-ft
Silica sand peck, 95.~113.5-ft. a~Jz-mesh
6·in stainless steel screen, 100M110·ft. #40·slot
F iII,
[ 100.0-ft]
~~~~~~lli:~~s: 1 13.5"1 1s.o·tt C Borehole drilled depth: [ 1 15.0· ft]
0-8
DTB.Pepth to bottom, 110.2·ft, 03Pee90

~- ~ .
:1 i· . 1'~ .. ' ., .r.
WHC-SD-EN-AP-185, Rev. 0
~LL CONSTRUCT!Qirj AIID CCfoiJ>LETlON SI..NIARY
Drilling Semple M•thcd: cable tool Method: Drfve barrel DrlllinQ 300 Ar•• ~ater Additives Fluid Used: Supply Und: Not doc:unent!!jl Driller's ~A State MIIMi: Cordon L ic Nr:---!D~0~79L-----Drl\llng Company Company: Anoc ilted Dr ill ers Loc•t ion=------Date Da~e St~rt&d: 06Nov86 conplete: 12Nov86
WELL TEMPORARY Nl.MIER: 399-1 ·18r\ WELL NO:_,C=-·...:l.::.A __ _ !Ianford Coordinates: N/S N 2Q.407 E/W E 1Z.S1Z State RN 58,970.1 RE 14,481.3 toordil'llltes: N -~lll4o:::...1 L!9Z!Olo8!...-_ E 2.308,254 Start tard t; Not documented Elevation Ground surface: 387.77-tt
T __ R __ s __ _
Brass .;ap
Depth to water: 47.0-ft NovS6 (Ground surface) ~-9-ft 175ec9J 1+--·--: Elevation of reference po1nt: [390.§3-ftl
GENERALIZED Geologist's STRATIGRAPHY Log
0<+5: No record 5#15! Si!ty SAND 1~35: Gravelly SAND 3S*45: Silty, gravelly SAND 45~0: GravellY SAND Nith trace
of SILT 6~TD: Sandy GRAVEL with trace
of SILT and CLAY
DraNing By: RKLt3·01·18A.ASB Date :~12~J~a~n~94~~~--Ra1aran.;e : HANFORQ WELLS
WHC·SO·EN·DP·071
(top of casing) Height of r~ferenca point above[ 3.Q6·ft ] grOIId surface
Depth of surface saal Type of surface seal: 4-ft x 4-ft eone~ete surface pad Cement to 5 .5· ft
Bentonite crumbles, 5.5 .. 31.8-ft
6-in 10 stainless steel casing, 1'3.1 .. 39 .0- ft
Hola di!lll'eter, ~3.0-ft, 11-in nominal
Volcley bentonite pellets, 31.§:34.0-ft
Silica sand pack, 3;.0*54.0-ft. ~12-mesh
6-in stainless steel screen, 39.~4.0-ft, "0-stot
10-in telescoping screen, 39.Qt.54. 0- ft
Gravel pack to 54.4-ft
F1t I, 54,4-63.0·ft
Borehole drilled depth:
DTB-Depth to bottc::rn, 53.8-ft, 06Nov90
[ 63, O·ft l

WHC-SD-EN-AP-185, Rev. 0
WE L L Cot! S Til UC ll otl AND CC»> PL E T I OH SUMMARY
DrfLtlng S~le Method: Cable tool Method: prjye barrel Drflling 300 Area Water ~dditives Fluid Used: ~upply used: Not dot!.JDented Dritlerrs UA State N~: Cordon Lie Nr:....:::;00~79'-<-----Drill1ng c~ny C~ny: Associated Drillers Lo~:ation: _____ _ Date Date Started: 13Nov66 Complete: 2DJan87
Depth to water: 42.5·ft Jan87 (Ground surface) 44.0•ft J70ee23
GENERALIZED Geologist's STRATIGRAPHY log
QMS: Not documented 5,.11: SAND 11,.15: SAND end GRAVEl 15•25: Sandy GRAVEL 25,.30: Sit ty, aarKiy GRAVEL 3~0: Sandy GRAVEL with
trace of SILT 40..SO: Silty, sandy GRAVEL 5~55: Pebbly SAND 55"60: Sandy, silty GlAVEL 60w65: Pebb(y SAND 65N85: S1lty, sandy GRAVEL SSW90: Sandy SILT 90-95: Silty, sandy GRAVEL 95~115: Sandy, silty GRAVEL 115 .. 120 Silty, sandy GRAVEL 120.125 Sandy, clayey GRAYEL 125 Sandy, gravelly CLAY
Dr~wing By: RKL/3·01·188.ASB Date : 12Jan94 l(eference :-:7HA:-;N:;.:f;:,:O~RD:=-:-WE-:::-:-l~LS;:---
WHC·SD·EN·DP-071
D-10
IJI!LL TEMPORARY NUMBER: 399-1-1811 Hun ford
WELL NO :_c"-·_,3.._11 __ _
Coordinates: N/S S 20 420 E/W E 12.865 State RN 58,956.5 RE 14,470.8 Coordinates: N Not dOCUDeQted E Not doe Start Card 1: Nat documented Elevation
T __ R __ s __ _
G r·ound surta~:e: 387. 24· ft Bress cap
Elevation of r•ference point: [389.94 ftJ (top of Cll5ing) Height of reference point above[ 2.70·ft J gro.n:l surface
Depth of surface seal [ ~5.0·ftl Type of surface seal: 4·ft x 4·ft concrete surface pad Cement to 5.0-ft
Bentonite crumbles, 5.Qw34.0·f[
6-in IO stainless steel easing, +Z. 7"108. 5 • ft
Hole diameter, ~125.0-ft, ll·in nominal
Yo lc lay grout, l4 .Q+:l OS .0- ft
Silica sand pac~, 10S.Q:11S.O-ft, &ot1?-rnesh
6·in stainless steet screen, 108.5~118.5-ft, 140-slot
FiLl, 118.0..U5.C·ft
Borehole drilled depth: [ 125.0·ftJ

This page intentionally left blank.