w-m3 iniamted in resivnse to scolmnterey … marine in defense is to augment the overseas lifting...
TRANSCRIPT

W-M3 261 - m nm Iou or THE- OUTPORTZN REI PIUUN V/2INIAMTED IN RESIVNSE TO T. (U) VWRL OST TMNI
SCOLMNTEREY CR J N NCFRRlNJUN AM
UNLSIFIED F/O 15/1 N
Eiimmhhohhil
0 .wn OMN

1.:, 11112O
11111.25IIII11111 **1111p
MICROCOPY RESOLUTION TEST CHARTNAI NAL HU0 E I.U A LK ,

NAVAL POSTGRADUATE SCHOOLMonterey, California
(N
~DTIC
(N %ELECTE kI
DCP THESIS
AN EXAMINATION OF THE OUTPORTING SHIP
PROGRAM IMPLEMENTED IN RESPONSE TO THE
INCREASED PROGRAM SIZE OF THE READY
RESERVE FORCE
by
Joan Marie McFarland
June 1988
Thesis Advisor: Alvin F. Andrus
II
Approved for public release, distribution is unlimited
$ 11 08 018

SCURITY CLASSIFICATION OF THIS PAGE
REPORT DOCUMENTATION PAGE1a REPORT SECURITY CLASSIFICATION lb RESTRICTIVE MARKINGS
Unclassified2s SECURITY CLASSIFICATION AUTHORITY 3 DiSTRIBUTION/AVAILABILITY OF REPORT2Approved for public release,
bDECLASSIFICATIONJ'DOWNGRADING SCHEDULE distribution is unlimited
4. PERFORMING ORGANIZATION REPORT NUMBER(S) 5 MONITORING ORGANIZATION REPORT NUMBER(S)
6& NAME OF PERFORMING ORGANIZATION 16b OFFICE SYMBOL 7a NAME OF MONITORING ORGANIZATIONNaval Postgraduate School (If applicable)aa54 Naval Postgraduate School
6c. ADDRESS (City, State, and ZIP Code) 7b ADDRESS(City, State, and ZIP Code)
Monterey, California 93943-5000 Monterey, California 93943-5000
Ba. NAME 0F 'UNDU'C,S0NSORNG b8b OFFICE SYMBOL 9 PROCUREMENT INSTRUMENT IDENTIFILATION NUMBERORGANIZATION (If applicable)
8c. ADDRESS (City, State, and ZIP Code) 10 SOURCE OF FUNDING NUMBERS
PROGRAM PROJECT TASK .WORK UNITELEMENT NO NO NO 1 .CCESSION NO
11 TITLE (Include Security classification) An Examination of the Outporting Ship ProgramImplemented in Response to the Increased Program Size of teh Ready Reserve
Force12 PERSONAL AUTHOR(S) Joan Marie McFarland
13a TYPE OF REPORT 'b TME COVERED 14 DATE OF REPORT (Year,Month, Day) 15 PAGE COJNTMaster's Thesis FROM, TO June 1988 10R
16 SUPPLEMENTARY NOTATION The views expressed in this thesis are those of the authorand do not reflect the official policy or position of the Department ofDefense or the U.S. Government-
17 COSATI CODES 18 SUBjECT TERMS (Continue on reverse if necessary and identify by block number)FIELD GROUP SUB GROLP -Strategic Sealift, Outporting, Ready Reserve
Force, National Defense Reserve Fleet, Militari-p4 . t.nm n g-rh n - M --
19 ABSTRACT (Continue on reverse if necessary and identify by block number) Ni, This thesis is a discussion of jthe actions the Government has taken in response to the decline of thecivilian merchant marine fleet. Early sealift capability, a vital componentof the U.S. defense strategy has deteriorated. Progresively more expansive lmeasures have been adapted in governmental efforts to build up a strongarsenal of assets capable of responding rapidly in the event of acontingency. This thesis looks at the componenets of the strategic sealiftprogram, the National Defense Reserve Fleet, the Ready Reserve Force and,the newest measure, the ship Outporting Program. This program wasimplemented to alleviate congestion at the fleet anchorages, therebyreducing the ship activation and loadout times, ensuring rapid delivery ofU.S. fighting force equipement overseas. This study culminates with thepresentation of data that may be used to develop a model that will appraisethe effectiveness fo outporting a Ready Reserve Force ship.
20 DISTRIBUTION 'AVAILABPLITY OF ABSTRACT 21 ABSTRACT SECURITY CLASSIFICATION:UNCLASSIFIE DUNLiMITED 0 SAME AS RPT 0 DTIC USERS Unclassified
22a NAIME Oi1 RESPONS'BLE INDiV,DUAL 2b TELEPHONE (Include Area Code) z2c OFFICE SYMBOLAlvin Andrus (408) 646-2413 1 55AsDD FORM 1473, 84 MAR 83 APR ed~tion may be used until exhausted SECURITY CLASSIFICATION OF THIS PAGE
All other editions a,e obsolete ,u s ro.e, ..t ,.-ti- O-f¢e ie6-4O0424.i
' ° -- = = lllli~ l i l / l lij 0

Approved for Public Release; distribution is unlimited
An Examination of the Outporting Ship ProgramImplemented in Response to the IncreasedProgram Size of the Ready Reserve Force
by
Joan Marie McFarlandLieutenant, United States Navy
B.S., University of Kentucky, 1975
Submitted in partial fulfillment of therequirements for the degree of
MASTER OF SCIENCE IN MANAGEMENT
from the
NAVAL POSTGRADUATE SCHOOLJune 1988
Author: L
Joan M. McFarland
Approved by: .Alvin F. Andrus, Thesis Advisor
0C
Dan C. Boger,Sec d Rader
David R. Whipp i~rman0 Department of Ami trative Sciences
Actin ean othformat* n nd Policy Sciences

ABSTRACT
This thesis is a discussion of the actions the
Government has taken in response to the decline of the
civilian merchant marine fleet. Early sealift capability,
a vital component of the U.S. defense strategy has
deteriorated. Progressively more expansive measures have
been adapted in governmental efforts to build up a strong
arsenal of assets capable of responding rapidly in the
event of a contingency. This thesis looks at the
components of the strategic sealift program, the National
Defense Reserve Fleet, the Ready Reserve Force and, the
newest measure, the ship Outporting Program. This program
was implemented to alleviate congestion at the fleet
anchorages, thereby reducing the ship activation and
loadout times, ensuring rapid delivery of U.S. fighting
force equipment overseas. This study culminates with the
presentation of data that may be used to develop a model
that will appraise the effectiveness of outporting a Ready
Reserve Force ship.
NTIS -
COPV PTIC
J, Q,
S S

TABLE OF CONTENTS
I. INTRODUCTION ...................................... 1
A. STATEMENT OF PROBLEM .......................... 1
B. BACKGROUND .................................... 2
1. Federal Policy ............................ 4
C. SEALIFT ASSETS ................................ 5
1. Merchant Marine Fleet ....................... 5
2. Government Owned Assets .................... 6
D. THESIS OBJECTIVE .............................. 7
E. THESIS CONTENT ................................ 7
II. STRATEGIC SEALIFT ................................. 9
A. BACKGROUND .................................... 9
B. OBJECTIVE OF STRATEGIC SEALIFT PROGRAM ....... 12
C. ELEMENTS OF STRATEGIC SEALIFT PROGRAM ........ 14
1. Strategic Mobility Elements ............... 14
2. Catagories of Military Shipping .......... 15
D. COMPONENTS OF STRATEGIC SEALIFT PROGRAM ...... 17
1. Commercial & Government ControlledAssets ................................... 17
2. Reserve Fleet ............................ 19
E. ORGANIZATION ................................. 24
1. Military Sealift Command ................. 24
2. Maritime Administration .................. 25
III. READY RESERVE FORCE .............................. 28
iv

A. COMPONENTS OF THE READY RESERVE FORCE ........ 28
1. Composition of Ready Reserve Force ....... 29
2. Acquisition Procedures .................... 32
a. Types of Ships ......................... 35
b. Deadweight Ton Capacity ............. 37
B. COSTS ........................................ 39
1. Program Budget ............................. 39
2. Maintenance and Operations Costs ......... 41
C. ACTIVATION PROCEDURES .......................... 46
1. Planning & Execution Procedures .......... 46
a. Joint Deployment Agency .............. 47
b. Deliberate Planning Process .......... 47
c. Crisis Action System .................. 48
d. The Warning Order ..................... 48
e. Execution Order ....................... 49
f. Activation of the Ready ReserveForce ................................ 49
2. Exercise - Breakout 87 .................... 51
a. Background ............................. 51
b. Conclusions ............................ 54
IV. Ready Reserve Force Outporting Program ........... 56 S
A. BACKGROUND ................................... 56
B. OBJECTIVES ................................... 57
C. COMPONENTS OF THE OUTPORTING PROGRAM ......... 59 0
1. Resources ................................ 59
2. Benefits of Outporting Ships .............. 62
v 0

3. costs...................................... 63
D. CONCLUSIONS.................................... 65
V. SUMMARY & CONCLUSIONS.............................. 66
A. SUMMARY........................................ 66
B. CONCLUSIONS.................................... 67
C. AREAS FOR FUTURE STUDY......................... 69
APPENDIX A: Ships in the National Defense ReserveFleet)....................................... 83
APPENDIX B: Ready Reserve Fleet as of 31 December1989.......................................... 89
APPENDIX C: Outported Ready Reserve Force Ships......... 92
0APPENDIX D: Readiness Status of Outported RRF Shp .. 94
LIST OF REFERENCES....................................... 97
INITIAL DISTRIBUTION LIST................................ 100
vi

from Northis a mind- 0 0 * * * * *
the iceberg.pressure of- that's the
ly is a vital 0 0 0 0 0 0 0 0 * •
strategy; a
for deterrence
cessary. How 0 0 0 0 0 0 0 0 0
ipment did not
t can respond 0 0 * * 0 * * * 0 0
rgo. However,
s destroyed if
support and 0 0 0 0 0 0 0 0 0 0 0
res much more
y vastly more
about 95%, by 0 0 0 * 0 0 0 0 0 0 0 0
of fuels and
t be available
they are not
gy is a very
egy.

B. BACKGROUND
The Military Sealift Command j- tasked with providing
this strategic sealift support. It performs its strategic
sealift assignment through the use of two major sources:
the U.S. Merchant Marine and Government-owned ships. U.S.
Government-owned ship assets are those operated by the
Military Sealift Command in peacetime or held in the
custody of the Maritime Administration in the National
Defense Reserve Fleet and its readily available Ready
Reserve Force. Over half of the ships in the Ready Reserve
Force are dispersed to commercial ports, rather than being
berthed at +he National Defense Reserve Fleet anchorages,
to secure accessibility should the need arise for early
sealift support.
The U.S. Maritime industry provides a source of sealift
assets from the regularly operating U.S. flag fleet, which
may be chartered or requisitioned for military use in time
of war or national emergency. [Ref. 31 There is growing
concern over the ability of the Merchant Marine to meet the
needs of our national defense strategy. The role of the
merchant marine in defense is to augment the overseas
lifting capabilities of the Air Force, Navy and Marine
Corps for personnel, equipment and stores, and at the same
time to continue its normal role of transporting the
material needed to support the national economies of the
United States and its allies. So important are these roles
2

to the preservation of the U.S. defense strategy that the
merchant marine has often been called "the fourth arm of
national defense."
Doubt exists about the merchant marine's ability to
support rapid deployment of the U.S. forces, while
maintaining shipping lines to the U.S., because of the
erratic history of the merchant marine throughout past
periods of conflict. During both World Wars and, to a
lesser extent, the Korean and the Vietnamese conflicts, the
U.S. began each crisis with too little usable shipping to
directly support the fighting forces. Massive shipbuilding
efforts had to be undertaken in order to promote adequate
shipping. However, in each case, once the hostilities
abated, the shipping industry was allowed to lapse into
chronic decline.
There is the potential for history to repeat itself.
In 1986 the U.S. flag oceangoing merchant marine of about
470 ships (including 100 inactive ships as of June 1, 1986)
was ranked 16th in the world in terms of number of ships.
The U.S. fleet carries only some 5% of U.S. waterborne
foreign trade. This means the U.S. must depend on foreign
ships to carry 95 percent of American imports and exports.
[Ref. 4] Given its present status, relying on ships in
the merchant fleet to fulfill mobilization shipping
requirements is risky.
3

There are two possible options that deserve study if
one concurs that the declining U.S. private fleet is unable
to meet the defense sealift needs. The government may
(1) pursue a policy of actively supporting the merchant
marine, or (2) build up a strong arsenal of government
owned assets. Any maritime policy that actively supports
an increase in the size of the private merchant fleet
conversely lessens the need for government owned shipping
assets.
1. Federal Policy
The federal government has historically supported
and promoted the U.S. merchant marine on the grounds of
national security. The fleet exists largely because of a
web of subsidies and supports provided by U.S. law. [Ref.
5]. Shipyards received subsidies to offset lower foreign
building costs. Shipowners have received subsidies to
compensate for lower foreign operating costs. The US
merchant fleet has benefitted from the exclusion of ships
built and registered abroad from domestic U.S. ocean trade.
Maritime supports were deeply cut in 1981 when the Reagan
administration excluded construction subsidies from the
maritime budget request. [Ref 6].
The continuing decline in the merchant fleet is being
offset by a buildup of government owned assets. This is
occurring at a time when the federal budget deficit is a
topic of unparalleled importance. Many Department of
44

Defense programs are vulnerable to budget constraints and
lowered funding levels. In the FY89 amended budget
submission, the Department of Defense absorbed a $33
Billion reduction. The Assistant Comptroller of the Nevy,
RADM Seeley, [Ref. 7] noted that the Department of the
Navy's "Fair Share" reduction of this total was 12.3
Billion. This leaves many programs as potential
candidates for a budget cut.
As budget actions stress the importance of getting the
most effective use of dollars, a closer examination is
necessary of the funding requirements for maintenance of
the Ready Reserve Force. One component of the Ready Reserve
Force program subject to scrutiny is the Outporting Ship
Program. This program was implemented to support the early
sealift capability of the Ready Reserve Force. Projected
costs for the Outporting Ship Program are slightly more
than $10 Million per year. Under the austere funding
constraints, are the costs allocated to this program
justifiable?
C. SEALIFT ASSETS
1. U.S. Merchant Fleet
The merchant fleet is presently struggling with
higher capital and operating costs. According to the
Maritime Administration , the privately owned, deep-draft
fleet of the U.S. Merchant Marine declined by 33 vessels
in one year, totalling 546 vessels with a carrying capacity
5
0

of auout 23 million deadweight tons on July 1, 1987. As
the size of the merchant fleet declines, the importance of
the Ready Reserve Force as the Department of Defense's
primary source of quick response sealift increases.
2. Government Owned Fleet
When demand for sealift assets exceeds the
availability of the Military Sealift Command ships and
voluntary charters from U.S. flag carriers, the importance
of the Ready Reserve Force increases. The rationale for
maintaining a government owned fleet is the quick response
capability. The Ready Reserve Force was established to
provide a force of cargo ships that could be activated
within five to ten days. These cargo ships have a high
potential for support of military forces in a contingency
situation and are upgraded and maintained in a state of
readiness so that they can be relied upon to support
emergencies.
The Ready Reserve Force is expanding rapidly. About 30
of the National Defense Reserve Fleet ships were classified
as Ready Reserve Force ships in March 1983; the Maritime
Administration Monthly Report for January 1988 shows 91
ships in the group; and it is estimated that about 116
ships will be in the Ready Reserve Force by 1991. The goal
for 1992 is 120 ships. An objective of the Ready Reserve
Force program is to be able to activate numerous ships
6

concurrently. In support of this goal, the outporting
program was implemented.
Less than half of the Ready Reserve Force ships are
homeported at one of the three National Defense Reserve
Force sites: James River, VA; Beaumont, TX; or Suisan Bay,
CA. As of 31 December 1987, 48 Ready Reserve Force ships
were outported at 23 different ports. A question that has
served as a guide in this research is: Does the outporting
of the Ready Reserve Force ships effectively improve the
early sealift capability needed to meet the urgent sealift
requirements of the military services?
D. THESIS OBJECTIVE
The objective of this thesis is to examine the effect
the increased program size of the Ready Reserve Force has
on the dispersal of the ships. In response to the
shrinking of the U.S. flag fleet, the size of the Ready
Reserve Force was expanded. Consequently, the fleet
anchorages became concentrated with Ready Reserve Force
ships which they could not rapidly activate. To alleviate
the congestion problem, the outporting program was
implemented.
E. THESIS CONTENT
The following chapter discusses the strategic sealift 5
concept, the defense strategy , the components of the
sealift program and the organizational structure. Chapter 3
7

provides an indepth study of the Ready Reserve Force.
Chapter 4 presents data on the outporting program. Chapter
5 provides a summary, conclusions and presents data that
may be used to develop a logistics model to appraise the
effectiveness of outporting a ship versus berthing it at an
National Defense Reserve Fleet site.
8
L

II. STRATEGIC SEALIFT
A. BACKGROUND
The continuing deterioration of U.S. maritime power
puts the United States' national security strategy of
forward deployment and forward deterrence in a precarious
situation. Between 1946 and 1986, the U.S. Merchant Marine
declined from more than 3,000 ships actively engaged in
U.S. oceanborne foreign trade to just 470 ( 370 active, 100
inactive). Less than 5% of U.S. trade is carried in U.S.
flag ships. As Figures 1 and 2 illustrate, the NATO flag
fleets are experiencing the same difficulties as the U.S.
Merchant Marine.
TRFNI).S IN NATO FLA( FI.FFTMILITARILY USEFUL DRY CARGO SHII'S
SOURCE STRATEGIC SEALIFT VIVI$SlN. U S NA VY
331M - Q0
Dr)W 31.0c: - 1.600 eN MBER(010,MTNS) OF
2OOU -%% 1_1 SHIPS
25".0U 2.700
1970 J975 11011 1990
YEAR
Figure 1Trends In NATO Flag Fleet
Militarily Useful Dry Cargo Ships[Ref. 8]
9
. . . .. ... ....... . . ... 6 = i m mr . .

TRENDS IN NATfO FLAG FIEETMII ARIIN' USEFUL. TANKERS
(z 2.IIW DWT AND sIUO.MA D WL1
SOURCE STRIATEGIC SEAuFT DIVISION. US NAVY44M1 lAW
42.m -- 1.330
13W
D I.2W NUMB. 4 m1.500 U I
0. TONS) -3 OFSHIPS
:.100
2.II I I9W
YEAX
Figure 2Trends In NATO Flag FleetMilitarily Useful Tankers
(>2,000 DWT and <100,000 DWT)[Ref. 8]
The flag fleet that the United States has historically
relied upon to provide the sealift capability required for
national defense has changed. Although there are adequate
world shipping assets to satisfy this nation's commerce in
peacetime, it is questionable if these assets would be made
available to the U.S. in crisis or war. Figure 3 shows how
the nation's ability to meet mobilization shipping
requirements is graduated from a U.S. Navy ship and crew
available for immediate military use to an open-charter
ship obtained through profit incentive. The non-U.S. flag
ships in the higher risk categories (lower right of Figure
3) do not afford the confidence required by Navy strategic
sealift planners. [Ref. 8]
10
• ----- ll liiili i liii II II" i iiI

U.S. NAVY SHIP AND CREW
NAVY SHIP. CI VIL SERVICE CREW
U.S.-FLAG SHIP. U.S. MERCHANT CREW0
U.S.-OWNED SHIP. FOREIGN CREW
AUID SHIPPING
OPEN CHARTFRSHIPPING
Decreasing Control
Figure 3Ability to Meet Mobilization Requirements
[Ref. 8]
The U.S. does not have adequate strategic sealift
capability, leaving it unable to meet its overseas
commitments, or to satisfy the requirements of even a
single theater conflict. This was the conclusion provided
in testimony on 12 April 1988, to the Senate Armed Services
subcommittee on projection forces and regional defense, by
the head of the U.S. Transportation Command. Air Force
General Duane H. Cassidy, commander-in-chief of the six
month old command said: "The current inventory of ships
suitable for strategic sealift is inadequate to meet the
requirements of even a single theater conflict."
Furthermore, he is predicting a "dramatic net decrease" in
11

the number of ships, merchant seaman, shipyard facilities
and workers by the turn of the century [Ref. 9].
Gen. Cassidy asserted that it is presently impossible
for the U.S. to meet the needs of national strategy from
U.S. resources. "Everything ... points to the fact we are
headed in the wrong direction in ships, shipyards and
seaman." He stressed the need to revitalize the commercial
maritime industry. [Ref. 9] Published projections show a
requirement for an active fleet of about 600 U.S. flag
ships to meet vital defense needs. [Ref. 8]
B. OBJECTIVE OF STRATEGIC SEALIFT PROGRAM
The changing realities of the U.S. merchant marine,
such as fewer ships, smaller crews, containerization for
economic survival, and a decreasing percentage of trade,
have eroded the U.S. flag fleet's capability to meet surge
Unit Equipment deployment requirements. In 1975, General
Catton, USAF, [Ref. 10] noted the importance of sealift in
the following remark.
I see no advantage, possibly even military disaster, in asituation where modernized military and civilian aircraftteam up to deliver a fighting force able to close withthe enemy, only to find that an antiquated military andcivilian sealift force cannot sustain their effort.
In 1984, the Navy officially recognized the importance
of sealift capability when the Secretary of the Navy
designated strategic sealift a separate and distinct Navy
function, along with Sea Control and Power Projection.
12

Strategic Sealift is the afloat pre-positioning and the
traditional ocean movement of U.S. fighting force unit
equipment and sustainment in times of national emergency.
The objective is to deliver the required unit equipment and
sustainment where and when the CINC requires. In
clarifying this role, the Chief of Naval Operations defined
Strategic Sealift as "The afloat prepositioning and ocean
movement of materials, petroleum, oil lubricants and
personnel in support of assigned logistic support missions
of the U.S. Government, including the necessary cargo
handling systems and personnel to ensure delivery of cargo
ashore." [Ref. 11: p. 1)
The availability of ships in the event of a contingency
is an important criterion of the U.S. defense strategy.
U.S. national security strategy is based upon a forward
defense concept. Threats to American and U.S. allies will
be countered at their sources, overseas, according to this
strategy. [Ref. 13) The forward defense concept is
fundamentally rooted in America's ability to project U.S.
combat forces into any threatened region of the world:
rapidly, efficiently, and in sufficient numbers to deny
aggressors an early military advantage. This power
projection function, in turn, will require the immediate
deployment of strategic mobility forces - sealift, airlift, 0
and prepositioned material - to move and sustain U.S.
forces overseas [Ref. 8].
013
.i i i i I I i i

C. ELEMENTS OF THE STRATEGIC SEALIFT PROGRAM
To compensate for the decline in the merchant marine
industry, the Navy is acquiring more government owned
assets. Since 1984, the Navy has undertaken a rapid
expansion of the government-owned Ready Reserve Force and
other logistics ships. Under current plans, by the mid-
1990's the U.S. Navy's Strategic Sealift Program will have
148 ships readily available to meet surge shipping
requirements, most of which are in the Ready Reserve
Forces, and are to be activated in 4 to 20 days in response
to national emergencies.
1. Strategic Mobility Elements
Three mobility elements are required for the
deployment and sustainment of U.S. forces overseas. They
are sealift, airlift and prepositioning. The Navy's time-
phased sealift capability program provides the ships and
cargo handling systems to load, transport and offload
equipment and material of U.S. military forces anywhere in
the world. The Air Force is responsible for the airlift
function, carrying personnel and limited amounts of high
priority equipment and supplies. Airlifted troops will be
integrated with equipment lifted simultaneously or
prepositioned. Prepositioning is a joint responsibility of
all the services.
14

2. Categories of Military Shipping
Sealift support for a contingency includes three
categories of shipping. Listed in order of sensitivity,
they are: prepositioned, surge, and resupply. Military
equipment, loaded aboard ships and prepositioned in a
contingency area, can be delivered rapidly to forces
airlifted into the theater of operations. Surge shipping
lifts the bulk of the CONUS-based equipment and initial
sustaining supplies. Resupply shipping immediately follows
to meet daily consumption rates and build up theater
reserve stock levels. [Ref. 11]
SEALIFr REQUIREMENT
DAILYTONNAGE
SURGE SUSTAINING
DAYS AFTER DEPLOYMENT
Figure 4Time Phasing of Military Support Shipping
[Ref. 8]
Figure 4 illustrates the sequence of shipping of
the two basic commodities of strategic sealift, unit
equipment and sustainment, during the three phases, afloat
prepositioning, surge and sustainment. As surge shipping
115

peaks, combat forces are delivered in-theater; resupply
rates increase as force levels grow, then taper off to
consumption rates, after in-theater stock levels are
achieved. [Ref. 8]
Prepositioning equipment and supplies in the
forward areas is the surest way of guaranteeing delivery of
fully equipped forces with little or no warning time. In
1986, there were 13 ships specifically configured to remain
at sea for extended periods of time. The Maritime
Prepositioning Ships carry a full range of Marine Corps
cargo. In total, they can carry enough supplies and
equipment to support three full marine brigades (50,000
men) for 30 days. [Ref. 12]
Surge shipping augments prepositioned shipping,
and is obtained from government-controlled assets, and may
include vessels from commercial sources if they are
available early enough. [Ref. 11] Surge efforts are
planned to begin within days of a National Command
Authority decision to deploy. This response is critical in
order to support an overseas military operation requiring
great volumes of priority combat cargo. Most surge
shipping cargo consists of unit equipment such as wheeled
and tracked vehicles, non-self-deployable aircraft, and
limited amounts of sustaining combat supplies and
ammunition.
16

Resupply shipping provides the bulk of sustaining
support to deployed forces. Forces in the forward area of
operations depend upon this shipping to replenish their
daily consumption, and increase in-theater reserves to a
30-60 day level. Initial resupply shipping arrives after
surge shipping and continues for the duration of a
contingency. Resupply shipping is obtained from U.S.
commercial sources and includes the re-use of the
prepositioned ships and surge ships after their initial
discharge in the theater of operations. [Ref. 11]
D. COMPONENTS OF STRATEGIC SEALIFT PROGRAM •
1. Commercial & Government Controlled Assets
Commercial shipping resources are the first means
of expanding sealift capability in the event of an
emergency. The problem with counting entirely on this
shipping in an emergency is twofold. First, the very
nature of the shipping business dictates that at any
particular time, company fleets will be scattered
worldwide. Second, the total number of suitable U.S. flag
ships is relatively small.
To illustrate this point, consider the situation on
a particular day in 1975. Of the 228 privately owned
general cargo ships that belonged to companies that had
pledged a portion of their fleet to the Department of
Defense in a less than general mobilization contingency, 56
were in/or near U.S. Atlantic/Gulf Coast ports. In a
17

Mediterranean or Persian Gulf contingency, the Department
of Defense could reasonably only count on these ships as
being available in the prescribed 5-10 days. [Ref. 14:p.
122]
The following situation further underscores the
uncertainty involved over the availability of the privately
owned merchant ships. On 1 January 1982, there were 244
general cargo ships in the privately owned fleet. Assume
that 25%, approximately 60 ships, are at or near
continental U.S. Atlantic and Gulf ports on any given day
and half of this number are pledged to the Department of
Defense. In this scenario, only thirty ships would be
available to provide sealift capability. [Ref. 6]
When commercial and controlled fleet assets are
inadequate to meet the sealift needs, the Ready Reserve
Force is activated. Figure 5 illustrates the normal
sequence of resource utilization.
Availability of ships after the Ready Reserve Force
has been exhausted comes from the Sealift Readiness
Program. Under this program, operators agree, as a
precondition to bidding on defense shipments, to make a
portion of their fleet available in a contingency.
Historically, between 100 and 115 vessels have been pledged
under the Sealift Readiness Program. [Ref. 14] However, a
call-up of vessels under the Sealift Readiness Program has
never been made, hence defense planning cannot rely on past
18

SFCRI IAR-! ppTSO .D ~ 1,A hr ' P IsNORMAL MSC OP(ARY(O 0I ONREGNEST 0 A' Tt4"' COi%:" A I.lP9I
CONTROLLED I
FLEET I
No
NI ICYIc I ______
FIGURE 5Sequence of Resource Utilization
experience. Implementation in peacetime would mean that
U.S. operators would risk losing cargoes on their regular
trade routes.
2. Reserve Fleet
The chief rationale for maintaining a government-
owned merchant marine in peacetime is :he quick response
capability it presumably would have in today's world of
instant crises. Historically, the military has had in-
house sealift capability in times of war, but at the end
of hostilities, the shipping would be retired and the
relevant command(s) disbanded. However, after World War
YES I
19
Ii

II, the U.S. maintained and expanded its shipping
capabilities.
At the end of the World War II, the U.S. government
owned over 5,000 cargo vessels. To reduce the size of
this government owned fleet, Congress passed the Merchant
Ship Sales Act of 1946. This Act authorized the sale of
these ships first to American buyers and then to foreign
nationals. When it became apparent that a majority of these
surplus ships would remain unsold, and consequently unused,
the Act was amended so that these ships would enter a newly
established National Defense Reserve Fleet. Specifically,
the act [Ref. 14] stated:
The Commission shall place in a National Defense Reserve(1) such vessels owned by it as, after consulting withthe Secretary of War and the Secretary of the Navy, itdeems should be retained for national defense, and (2)all vessels owned by it on December 31, 1947, for thesale of which a contract has not been made by thattime...a vessel placed in such reserve shall in no casebe used for commercial operations, except that any suchvessel may be used during any period in which vessels maybe requisitioned under Section 902 of the Merchant MarineAct of 1936, as amended.
Table 2.1 displays the growth and decline of the National
Defense Reserve Fleet between 1945 and 1985. At the
beginning of Fiscal Year 1945, there were 1,421 ships
dispersed at nine locations. In 1950, this total peaked at
2,277 ships. However, by 1978 the National Defense Reserve
Fleet had shrunk to 306 ships. As of 31 December 1987,
there were 331 ships in the fleet layberthed at three
locations, one on each coast.
20

TABLE 2.1NATIONAL DEFENSE RESERVE FLEET: 1945-1985
[Ref. 15]
Fiscal Year Ships Fiscal Year Ships
1945 5 1965 15941946 1421 1966 13271947 1204 1967 11521948 1675 1968 10621949 1934 1969 10171950 2277 1970 10271951 1767 1971 8601952 1853 1972 6731953 1932 1973 5411954 2067 1974 4871955 2068 1975 4191956 2061 1976 3481957 1889 1977 3331958 2074 1978 3061959 2060 1979 3171960 2000 1980 3031961 1923 1981 3171962 1862 1982 3031963 1819 1983 3041964 1739 1984 386
1985 300
Ships in the National Defense Reserve Fleet would
remain idle but available for service when needed and were
moored at nine different sheltered anchorages located
throughout the U.S. The locations on the Atlantic Coast
were: Hudson River, New York; James River, Virginia;
Baltimore, Maryland and Wilmington, Delaware. The Pacific
Coast locations were: Suisun Bay, California; Astoria,
Oregon and Olympia, Washington. The Gulf Coast locations
were at Beaumont, Texas and Mobile, Alabama.
Today, the ships of the National Defense Reserve
Fleet are located at three locations. They are: James
21

River, Virginia; Suisun Bay, California and Beaumont,
Texas. Appendix A lists the reserve ships by location,
name and type.
For the most part, vessels of the National Defense
Reserve Fleet are of World War II vintage. These vessels
are considered of value because they are self-sustaining
break-bulk type vessels. But the fact remains they are
old, slow (15 knot) ships that would require 20-60 days, if
not longer, to activate. As the age of the National
Defense Reserve Fleet increased, the rationale that it
should be maintained as a znurce of emergency shipping
became less convincing. The most often cited problem was
the time required to break out a ship, i.e., have the ship
reactivated, crewed, and ready to receive cargo. It was
generally accepted that the minimum breakout time was
forty-five days, far too long in an era where contingencies
occurred overnight and additional shipping was needed in
days, not weeks. [Ref. 4] Others believed that the ships
would be useful for only a one-way, one trip voyage
carrying a relatively small amount of cargo. [Ref. 16: p.
61]
In 1974, the U.S. General Accounting Office
investigated the National Defense Reserve Fleet as a source
of emergency shipping. A report issued in 1976 concluded
that the types of ships found in the reserve fleet, mainly
break-bulk cargo vessels, were particularly suited to
22
0 Rlmm m

Department of Defense emergency sealift requirements. It
also found that for ships that were better preserved,
breakout time could be shortened to 5 to ten days. [Ref.
17]
As a result of the General Accounting Office study,
the Ready Reserve Forces; was established under a
Memorandum of Understanding between the Department of
Transportation and the Navy as a fully funded Navy program
within the responsibility of the Military Sealift Command.
During peacetime, the Ready Reserve Force is maintained by
the Maritime Administration.
The Ready Reserve Force was originally co-located
at the National Defense Reserve Fleet sites in James River,
VA; Beaumont,TX; and Suisun Bay, CA. Originally, it was to
consist of thirty ships, all Victory ships, which would
provide for a high state of readiness for small fast
breaking contingency situations where it was not feasitle
to mobilize or requisition existing U.S. flag ships. But,
the Ready Reserve Force has expanded beyond the borders of
the original concept. As of 1 April 1988, the Ready
Reserve Force contained 93 ships. These ships comprise a
cross section of the merchant fleet, ranging from former
Military Sealift Command fleet oilers to large Roll On/Roll
Offs. All are maintained in a 5, 10, or 20-day readiness
status. Appendix B identifies the Ready Reserve Force
ships by name and location. [Ref. 15]
23
.I

E. ORGANIZATION
1. Military Sealift Command
When activated, the Ready Reserve Force falls under
the operational control of the Military Sealift Command
established in 1949. The Military Sealift Command is a
U.S. Navy command with fleet status, assigned the overall
mission of providing "the sealift capacity to deploy and
sustain military forces anywhere in the world as rapidly
and as long as operational requirements dictate, in support
of national security objectives." [Ref. 19] The
Commander, Military Sealift Command, reports directly to
the Chief of Naval Operations, and, as executive agent for
the Secretary of the Navy, is the single manager for all
Department of Defense sealift. The Military Sealift
Command functions as the Transportation Operating Agency
for Sealift under the Joint Operations Planning System.
In both peacetime and time of crisis, the Military
Sealift Command uses its own or chartered ships as well as
contracting with commercial carriers to transport military
cargo. It maintains its own civil service crewed
controlled fleet for two reasons. One reason is to fulfill
worldwide Department of Defense sealift requirements to
*0 locations where commercial carriers do not adequately meet
needs. The second reason is to provide the base for a
mobilization fleet in the event of a contingency.
24

The number of ships maintained in the Controlled
Fleet each year is based upon peacetime and contingency
requirements. Each year, various services submit a
projection of their sealift requirements. The Defense Fuel
Supply Center in Alexandria, Virginia, coordinates and
projects overall military requirements for fuel and its
transport. The Military Sealift Command uses the
predictions to plan shipping assets requirements for the
year. For example, the Military Sealift Command plans its
Controlled Fleet so it can handle about 85% of anticipated
tanker requirements and charter commercial tankers when
necessary. If Department of Defense cargo requirements are
insufficient to keep all the Controlled Fleet ships in
active operation, some are put into a reserve status.
2. Maritime Administration
The Maritime Administration was created as an
agency within the Department of Commerce in 1950. As a
result of the signing of Public Law 97-31, on 6 August,
1981, the Maritime Administration was transferred to the
Department of Transportation. [Ref. 14]
The Maritime Administration maintains the National
Defense Reserve Fleet as a ready source of vessels for use
during national emergencies and assists the U.S. maritime
industry in fulfilling its traditional role as the Nation's
fourth arm of defense in logistically supporting the
military when needed.
25

The Ready Reserve Force is a joint program of the
Maritime Administration and the Navy. The Department of
the Navy provides the Maritime Administration the (1)
composition, (2) outport locations , (3) specific ship
features, (4) modifications and (5) ship types that should
be acquired for the Ready Reserve Force; then the Maritime
Administration executes the Department of the Navy
guidance.
As of February 1988, funding for maintaining the
Ready Reserve Force, acquiring additional ships, and all
ancillary expenditures associated with the Ready Reserve
Force management will be appropriated directly to the
Maritime Administration. [Ref. 20] Previously,
appropriations for the Ready Reserve Force program were
obtained by the Navy and transferred to the Maritime
Administration. The 1990 President's budget will change
the functional classification of the Ready Reserve Force
funding from National Defense to Transportation. [Ref. 21]
To ensure the most effective allocation of
resources to meet Department of Defense sealift
requirements, the Department of the Navy is instructed to
cooperate fully in developing the Ready Reserve Force
portion of the Maritime Administration budget request.
They will continue to provide , on an annual basis, all the
necessary information, including, but not limited to:
number of call-ups; duration of call-ups; ship types of
26

call-ups; acquisition requirements; training requirements;
and projected costs for the above.
27

III. READY RESERVE FORCE
A. COMPONENTS OF THE READY RESERVE FORCE
The Ready Reserve Force is composed of a mix of ships
selected and upgraded from the National Defense Reserve
Fleet and other ships acquired by the Navy or the Maritime
Administration. The time-phased build-up, the total number
of ships, the mix, specific ship types, positioning, and
timing of future changes in the Ready Reserve Force
composition is determined by the Navy, in accordance with
requirement validations and budget limitations, and subject
to the availability of ships as determined by the Maritime
Administrator. [Ref. 22]
The ships are maintained in accordance with standards
agreed to by the Commander, Military Sealift Command, and
by the Maritime Administration. These specifications
include, but are not limited to, the requirement that each
ship enter the Ready Reserve Force in a state of good
repair and preservation, fully classed by the American
Bureau of Shipping, possessing current United States Coast
Guard Certificate uf Inspection and fully documented by the
U.S. Coast Guard. The ships are maintained "In Class" as
required by the American Bureau of Shipping and the U.S.
Coast Guard, and in documentation by the Coast Guard. The
Maritime Administration maintains the ships in such a state
28
D

that they can be activated and ready for sea within a
specified time frame. These predetermined time frames,
i.e., within 5, 10 or 20 days, are provided by the Military
Sealift Command and assigned to each Ready Reserve Force
ship. [Ref. 22]
1. Composition of the Ready Reserve Force
Within 11 years, 1976-87, the Ready Reserve Force
has grown from the proposed 30 Victory ships, with a
30,000 dead- weight ton capacity, to 90 ships, with a
1,472,129 deadweight ton capacity [Ref. 18]. New ships
are being entered into the Ready Reserve Force on a
continuous basis. For the purposes of this paper, the
status of the Ready Reserve Force was frozen as of 31
December 1987. At that time, it was comprised of 90 ships.
A telephone conversdtion [Ref. 23] with OP-423, Strategic
Sealift, on February 18, 1988 revealed that the Ready
Reserve Force had expanded to 92 ships by this time; less
than a month later, it was learned from Kevin Burns, [Ref.
20] Military Sealift Command, that the Ready Reserve
Force had acquired another ship and now totaled 93 vessels.
Appendix B groups the 90 Ready Reserve Force ships in the
fleet as of December 1987 by location, and identifies their
type, age and deadweight ton capacity [Ref. 18].
The original intent of the Ready Reserve Force was
to provide a high state of readiness for small, fast
breaking contingency situations where it was not feasible
29

to mobilize or requisition existing U.S. flag ships in
commercial operation. [Ref. 24] As the Ready Reserve Force
grew to 90 ships, the National Defense Reserve Fleet
declined, from 348 to 241 ships. Table 3.1 presents the
status of the U.S. Reserve Fleet on 30 December 1987.
TABLE 3.1U.S. RESERVE FLEET ON 30 DECEMBER 1987
[Ref. 25]
Location National Defense Ready ReserveReserve Fleet Force
James River 91 38Beaumont 77 31Suisun Bay 73 21
Total 241 90
The Ready Reserve Force is continuing to grow and
it is anticipated that it will be comprised of 101 ships
by the end of FY88, progressing toward the 1992 goal of 120
ships. Table 3.2 shows the projected growth of the Ready
Reserve Force in the 5-year defense plan.
30
300

TABLE 3.2FIVE YEAR PLANNING GOAL FOR THE READY RESERVE FORCE
[Ref. 26]
Ship Type FY-88 FY-89 FY-90 FY-91 FY-92
Dry Cargo 89 94 97 100 100
Heavy Lift Ships 7 9 9 9 9Roll-On/Roll-Off 17 17 17 17 17Container (TACS) 8 10 12 12 12Breakbulk 57 58 59 62 62
Tankers 12 14 15 16 20
TOTAL 101 108 112 116 120Annual Program Growth +7 +4 +4 +4
Although all ships in the Ready Reserve Force are
assigned to a region, they are not all physically present
at that location. The outporting program was implemented in
1986 due to the inability of the National Defense Reserve
Fleet sites to concurrently activate the increased number
of ships. The outported ships are pierside in a stand-by
status in different harbors throughout the country. Two
ships are located in Japan, and one is located in Hawaii.
In December,1989, 52% of the Ready Reserve Force
ships were located at outports. Table 3.3 shows the number
of outported Ready Reserve Force ships assigned to each
region.
31

TABLE 3.3OUTPORTED READY RESERVE FORCE SHIPS
[Ref. 26]
Location RRF Outported
James River 38 20
Beaumont 31 7
Suisun Bay 21 20
Total 90 47
2. Acquisition Procedures
The ships for the Ready Reserve Force are acquired
from three sources: upgrading ships from the National
Defense Reserve Fleet, ships retired from the Military
Sealift Command, and direct procurement from commercial
sources. Table 3.4 summarizes the acquisition methods for
106 ships placed in the Ready Reserve Force. Sixteen of
these ships have been scrapped, renamed or retired into the
National Defense Reserve Fleet, leaving 90 in the active
Ready Reserve Force, as of December 1989.
The Navy provides the Maritime Administration with
annual defense requirements pertaining to ship levels and
ship mix. Based on this guidance, a Source Selection Plan
is developed from their listing of current and projected
vessels available to support the specified criteria. This
plan provides the basic guidance to the Source Evaluation
Board in preparing the solicitation and conducting the
acquisition. Ships from the National Defense Reserve Fleet
32

TABLE 3.4METHOD OF ACQUISITION OF RRF SHIPS
[Ref. 18]
RRF Acquisition # of Ships COST
Construction Differential 36 $141,199,989Subsidy
510(i) 7 10,857,150National Defense Reserve 3 0
FleetTransfer 13 210,000Purchase 47 354,596,198
Total 106 492,994,803
Note: (1) Construction Differential Subsidy (CDS) - Tostumulate shipbuilding in the United States, theMerchant Marine Act of 1936 provided for aconstruction differential subsidy, a direct subsidythat covered the difference in price between a shipbuilt in the United States and teh price that wouldbe paid for the same ship if built abroad. Hasbeen pahsed out. In FY-82, no CDS funds wererequested.
(2) 510 (i) - Ship owners turning in older shipswere given a dollar credit toward new constructionunder this section of the Merchant Marine Act of1936. [Ref. 4)
and the retired Military Sealift Command fleet are selected
for inclusion in the Ready Reserve Force based upon the
same criteria.
The first ship to enter the Ready Reservc Force,
the Catawba Victory, was brought to a quick breakout status
for about $800,000. Before a second Victory could be
upgraded, however, other types of ships were being turned
into the National Defense Reserve Fleet that, from a
military planner's point of view, had a greater defense
33

utility than the Victories. These were Seatrains, C-3's,
and C-4's. Ship operators turning in these older ships
were given a dollar credit toward new construction under
Section 510(i) of the Merchant Marine Act of 1936. As long
as construction funds were appropriated by Congress, the
system worked.
In 1981, when construction subsidies were cut, the
problem became how to compensate the owner of a desirable
candidate ship for the Ready Reserve Force. The fall-back
position was to give the owner the equivalent trade-in
value in scrap tonnage. For example, an operator could
trade in a C-3 for the scrap value of five or six scrap
candidate ships. [Ref. 4]
Another process for acquiring ships through
commercial sources is through contract purchases. The
Military Sealift Command contracting office issues a
Request for Proposal, indicating the types of ships desired
according to the priority list. Ships in excess to the
needs of U.S. flag operating companies and meeting defined
Ready Reserve Force requirements are given priority in the
competitive procurement processes. Other ships are
considered if the said priority ships are not available or
are not available in sufficient numbers to satisfy the
requirement, provided they can be documented under the U.S.
law when the title transfers. [Ref. 22]
34

After 1982, the available scrap tonnage was
insufficient to compensate for desired additional ships in
the Ready Reserve Force. [Ref. 6] In 1982 and 1983, only
six ships were placed in the Ready Reserve Force, four
through a Construction Differential Subsidy , and two
acquisitions were under section 510(i) of the Merchant
Marine Act.
After 1983, direct purchasing became the most
prevalent method for acquiring ships for the Ready Reserve
Force. A total of 47 ships were purchased for the Ready
Reserve Force between the purchasing of the first ship in
August 1984 and the 106th ship in December 1987.
Funding for the future purchase of commercial vessels for
the Ready Reserve Force is contained in Table 3.5.
TABLE 3.5FUNDING FOR READY RESERVE FORCE PURCHASES
[Ref. 27]
Fiscal Year Amount1988 $43.4 Million1989 35.4 Million1990 62.8 Million1991 13.8 Million1992 36.9 Million
a. Types of Ships
The types of vessels most suitable for military
logistical support are Roll On/Roll Off's, Lighter Aboard
Ships's (LASH), breakbulk vessels and container ships, in
approximately that order. The container ships are less
valuable because of their dependence on sophisticated port
35
6I

facilities, which may not be available in the event of a
contingency or war. Nonetheless, container ships are
included in all sealift deployment plans, and efforts
continue at the Department of Defense to increase their
capabilities. [Ref. 4, p. 87] Less important are the
tankers and the bulk carriers.
The following definitions of the types of ships
in the Ready Reserve Force was provided in a briefing for
the Amphibious Community. [Ref. 24]
(1) Roll-on/Roll-off (RO/RO). When used in conjunctionwith surge shipping, these ships are used for theinitial movement of oversized combat equipment. Theyhave the distinct advantage of fast turnaround asmoving vehicles can be driven down their ramps. Theynormally require a developed port to discharge theircargo; however, the Navy has developed a system foruse in low seas that enables vehicles to be drivenonto lighterage. Most of the Roll On/Roll Off's arediesel powered and are capable of carrying about20,000 to 30,000 deadweight tons of cargo at a speedof about 21-23 knots.
(2) Lighter Aboard Ship (LASH). LkSH ships are used insustaining military supplies or carrying unitequipment. They operate in a manner similar to thecontainer ship, lifting the lighters or barges out ofthe water by means of an overhead, traveling gantrycrane which will then stack the lighter atop otherlighters in a cargo cell.
(3) SEABEE Ships. These ships are also used insustaining military supplies or carrying unitequipment. With this ship, the lighters are liftedby means of an elevator and are moved to differentdeck levels where they are transported forward forsecuring. There is no height limitation placed onthe cargo in a lighter. SEABEE ships carry 381,000-ton capacity barges which are loaded by a sternelevator.
(4) Breakbulk. This is the largest category of shipswithin the Ready Reserve Force. These ships are usedfor resupply operations. They are labor intensive
36

and have long load and off-load times. The advantageof breakbulk ships is their self-sustainability, theability to discharge cargo offshore by use of ships'booms and cranes. They are also capable of handlingmost military cargoes. The Breakbulk's are generallyfaster ships with speeds in excess of 20 knots andwill use steam turbines to provide the power. Thecapacity of these ships is about 12,000 to 14,000deadweight tons.
(5) Auxiliary Crane Ship (TACS). These ships give non-self-sustaining ships such as container ships thecapability of off-loading in a forward area. Theytoo may be used during surge shipping. The AuxiliaryCrane Ships are modified container ships outfittedwith marine heavy-lift cranes. They are capable ofoff-loading wheeled or tracked vehicles (includingthe M-1 tank) and lighters up to 110 tons. Whenequipped with the Navy's Sealift EnhancementFeatures, consisting of sea sheds or flat racks,these ships are able to carry a large amount ofcargo.
(6) Tankers. As of 15 April 88, the Ready Reserve Forcehas nine tankers for the carriage of liquid cargoes.This category is scheduled to grow to 20 ships by theend of FY92. All of the tankers are capable ofcarrying a mix of different types of liquid cargoes,several are also capable of carrying out underwayreplenishment.
(7) Troop Ship. There is only one troop ship in theReady Reserve Force and it will be used to deliveraugmenting troops to the forward theater.
b. Dead Weight Ton Capacity
As of 31 December 87, the Ready Reserve Force had
90 vessels of 1,472,129 deadweight tons (16,357-deadweight
ton average) distributed as follows:
37

TABLE 3.6DEADWEIGHT TON CAPACITY OF SHIPS IN THE READY RESERVE FORCE
[Ref. 18]
Number Type Total Averageof deadweight (tons)
deadweight (tons)ships
52 Breakbulk 647,261 12,4472 Seatrain 24,604 12,302
Part. Cont.4 LASH 140,380 35,0953 SEABEE 115,230 38,4104 Crane 51,868 12,9678 Tanker 165,463 20,683
16 Roll-On/Roll-Off 306,045 19,1281 Troopship 8,759 8,759
A 1983 Center for Naval Analysis study
estimated that the average size of a new vessel in the
Merchant Marine was 50,000 deadweight tons. (Ref. 28] As
recent trends have been toward larger ships, this 1983
approximation is a very conservative estimate of the
average size of a new vessel today. Calculations performed
on the deadweight ton capacity of the ships in the Ready
Reserve Force as of December 1987, show the average size
to be 16,357 deadweight tons. Using these figures, one
can presume that one 1983 ship can provide the sealift of
3.06 ships in the Ready Reserve Force as of December 1987.
[Ref. 28)
Reviewing the age and deadweight ton capacity
of the ships in the Ready Reserve Force, listed in Appendix
B, a pattern becomes apparent; the older the ship, the
smaller the deadweight ton capacity. Compare the American
38
Victory, a 43 year old breakbulk ship with 10,700
deadweight ton capacity to the 19 year old breakbulk, the
Cape Nome, with 15,690 deadweight ton capacity. Or compare
the 30 year old Roll On/Roll Off, the COMET, with 10,111
deadweight ton capacity to the 9 year old Roll On/Roll Off,
the CAPE HORN, with 20,870 deadweight ton capacity. Over
75% of the ships in the Ready Reserve Force, as of December
1987, are 20 years or older; the overall average age 23
years.
B. COSTS
1. Program Budget
Through FY88, the Maritime Administration had only
program responsibility for the Ready Reserve Force, while
the Navy budgeted for most of the costs, including
acquiring additional ships and providing maintenance.
However, in FY-89, the funding and program management
responsibility will be consolidated in the Maritime
Administration. The funding will remain in the national
defense function, but the administration will consult with
Congress about transferring the funding to a transportation
function in future budgets. The Navy will provide planning
guidance annually to the Maritime Administration for use in
formulating funding requirements. The guidance issued by
the Navy addresses the following areas:
(1) Revised Ready Reserve Force Ship Levels and Ship Mix
(2) Ship Upgrading/Acquisitions/Deletions/Downgrading
39
mW N I l ( (IN (Immre ( .. .. ,,( m m ) -

(3) Readiness Category for Each Ready Reserve Force Ship
(4) Ship Positioning Requirements
(5) Ship Activations
(6) Training Requirements
Planning guidance issued in 1986 by the Chief of
Naval Operations to the Maritime Administration for the
portion of the five year defense plan pertaining to the
Ready Reserve Force contained the following projected
expenses:
TABLE 3.7PLANNING GUIDANCE
[Ref. 26]
FY-88 FY-89 FY-90 FY-91 FY-92
Maintenance $61,406 $67,158 $50,875 $30,407 $49,161
Activation 7,259 5,962 6,000 7,259 8,296
Upgrade 6,375 0 15,411 40,562 33,392
TOTAL 75,040 73,120 72,286 78,228 90,849
Outporting 10,082 10,315 10,424 10,500 10,578
PROGRAMTOTAL 85,122 83,435 82,710 88,728 101,427
In actuality, the Maritime Administration received
appropriations totalling $110,751,000 for the Ready Reserve
Force in FY-89. [Ref. 29] This total is broken down into
two catagories:
40

(1) Fleet additions ................ $35,400,000
(2) Maintenance & operations ....... $75,351,000
The 1989 Appendix to the 1989 FY Presidential Budget
defines these activities as follows:
(1) Fleet additions - This activity prcvides forexpansion or selective replacement of the ReadyReserve Force ships. Acquisitions will be made toprovide the number and type of ships required forthis program based on Department of Defenseplanning.
(2) Maintenance & operations - This activity providesfunds for the Ready Reserve Force ship activationsand deactivations required to test ship reactivationreadiness and to support Department of Defense/Navyexercises of a broader purpose. The costs of shipoperations will be funded by the organizationrequiring the ship activation. This activity alsoprovides for maintaining the Ready Reserve Forceships in an advanced state of reactivation readinessand the associated costs of berthing ships atdispersed locations. (OUTPORTING)Also included are special programs in support of theReady Reserve Force and special training related tothese ships such as that for radio officers andcrane ship cargo handling crews. [Ref. 36]
2. Maintenance and Operations Costs S
A 1983 study, done by thz Center for Naval
Analysis, estimated that it costs approximately $1,000,000
per year (in 1982 dollars) to keep a reserve vessel fully
maintained in ready reserve status. [Ref. 28] This study
speculated that this was a low estimate and claimed their
experience with one particular ship, the SS OHIO, indicated
an annual cost greater than $2,000,000. (Note: The SS
OHIO was one of the older ships in the Ready Reserve Force.
41

up II m_ I U Io
It is a 44 year old SEATRAIN and has been transferred to
the National Defense Reserve Force)
A research paper on the reactivation process for
the Ready Reserve Force prepared by the same agency, the
Center for Naval Analysis, in 1985, estimated a lower cost.
This paper stated that ships could be maintained in the
Ready Reserve Force for about $700,000 per year per ship.
[Ref. 30]
A breakdown of the total maintenance costs of a
ship in the Ready Reserve Force was received from the
Military Sealift Command [Ref. 20]. The total cost
includes the following expenses:
(1) Reserve Fleet Costs - These are the MaritimeAdministration associated overhead costs.
(2) General Agent Costs - The Ships Manager Fee.
(3) Service Contract - This includes such items as radar
and other specialized equipment.
(4) Supply Material.
(5) American Bureau of Shipping/United States CoastGuard - Surveys and tests conducted every 4-5 years.
(6) Drydock - Conducted on a five year cycle
(7) Other materials.
(8) Painting - Conducted on a five year cycle.
Figures 6, 7, and 8 were received from the
Maritime Administration and are projected annual
maintenance costs for three ships in the Ready Reserve
Force.
42

READY RESERVE FORCE (RRF) PROGRAMPROJECTED MAINTENANCE COST ESTIMATES
Vessel SS AGENT Project MAINTENANCE Status: DayLocation JilF Design C3,-S-36a Type B/ZkegIor. E
I IYear 1987 1 1988 J989 1990 1991 1 1992
-- --- I .. I .---------- .--------------------Rsrve Fleet 132000 136000 13700 137400 137300i 137700General Agnt 5000c i 75000 75000 75000 750001 75000Serv. Cntrct, 60000: 60000 600001 60000 60000i 60000SuplylMatrl I 30000; 30000, 30000, 30000 30300 30000ABSIUSC SIR 65000 125000; 850001 215000f 65C00 125000Lrydoot 0. 0 0! 400000 0' COtrr Malnt/R, 0, 1050000 500001 50000, 500001 50000Painting J 0, 0! 0 01 700000, 0
--------------- ---------- ---------- ---------- ------ --------------Total 337003 147670; 43700,1 9674001 1117303 47770r
Figure 6Projected Maintenance Costs for the SS AGENT The SSAgent is a 27 year old breakbulk ship, 11,089deadweight tons, berthed at James River, VirginiaNational Defense Reserve Fleet site.
[Ref. 31]
READY RESERVE FORCE (RRF) PROGRAMPROJECTE[, MAINTENANCE COST ESTIMATES
Vessel SS AIDE Pro eC: MAINTENANCE Status: DayLocation QUONSET PT., RI Design C3-S-38a Type B/BRegion E
..............................................................................
Year 1987 1 1988 1989 ) 1990 1 1991 1 1992
Rarve Fleet 132000, 1367 )0 137000 137400 137300 137700General Agnt 500001 750001 75000 750001 75-00 75000 0Strv. Cnrrct GOUOO 60000 60000 60000 600C0 60000Suply/Matrl 30000 30000 30000 30000 30000 30005AIS/USCG I/R 65000 125000 65000 235000 i 65D00 125000Drydock 01 0 0 O! '000001 0Othr Maint/R 0 210000 1210000 2100001 2100001 210000Paint ing 0 01 - - - --0 --------- 0 4 0 00 - Cl----
~~~- --------- --- I------- - ------ I
Total 337000 636700, 15770001 7.740 0 13773001 637700'
Figure 7Projected Maintenance Costs - SS AIDEThe SS Aide is a 28 year old breakbulk ship, 11,021deadweight tons, outported at Quonset Point, R.I.
[Ref. 31]
43

READY RESERVE FORCE (RRF) PROGRAMP oJECTEL MAINIENANCE COST ESTIMATES
vessel SS CAPE DOUZLAS PTO.ect MAINTENANCE Stacus; DayLocation JACKSONVILLE, FL Design RO/RO CTR Type RO/RO CTR
Region E
Year 1987 1 1988 1989 1990 I 1991 1992
Rarve Fleet 1320CC 137O001 1 370001 1 374600 1373001 1377CGeer , 1 050ooooI 1500001 1500001 000'o , oooServ. Cntrctl 75000, 750001 ;5000 75000, 7500C. 7500C
Supiv/MatrlI 0000 o40000 4000, O 40000 00:? 4O000CABS'USCL I/R C' 0, C C 1Drvdoc C. I 0 :o 00:0: 0Othr Maint/R i 380000! 430000 i 41000C '100 C CC) 4 1000:
Painting 0 0 0 700000' C 0
Total b70.0 E3107. 912000: '512,0C 12;2C bi8 70,
Figure 8Projected Maintenance Costs - SS CAPE DOUGLASThe SS Cape Douglas is a 15 year old Roll On/Roll Offship, 21,398 deadweight ton capacity outported atJacksonville, FL.
[Ref. 31]
The ships in the Ready Reserve Force operate under
a contract between the Maritime Administration and
individual companies. These contracts, called Ship
Manager Contracts, are awarded by the Maritime
Administration according to a competitive procurement
process. In the maintenance costs estimates provided in
Figures 6, 7 and 8, the general agent contracts for the
breakbulks averaged $75000 per year, and the Roll On/Roll
Off general agent fee was projected to be S150,000.
In early 1988, the Maritime Administration awarded
contracts, totalling about S11.7 million in their first
44

year, to ten companies to maintain 71 of the ships in the
Ready Reserve Force. The contracts run for five years and
cover varying numbers of vessels. The names of the
companies that received the contracts were published in the
Journal of Commerce. [Ref. 32] Along with the name of the
company, the number of ships they are to manage and the
first year value of the contract was published. A example
of the listings follows.
(1) American Overseas Marine Corp., Quincy, Mass, 12ships, $1.9 million.
(2) Marine Transport Lines, Secaucus, N.J., four ships,$786,460.
(3) American President Lines, Ltd., Oakland, CA, ten
ships, $1.2 million.
The duties of the Ship Manager are defined [Ref. 17] to
include:
(1) Procure the ship's Master, subject to the NationalShipping Authority's approval, as an agent andemployee of the U.S. government.
(2) Procure and make available to the Master, forengagement by him, the officers and crew required.
(3) Equip, victual, supply, and repair the vessel.
(4) Develop activation specifications in coordinationwith the Maritime Administration Cognizant RegionalDirector and Ship Operations Officer.
(5) Hire tugboats and pilots and pay canal tolls.
(6) Appoint port agents at all ports for husbanding theship.
(7) Relay voyage instructions directly to the Master, asmay be required.
(8) Assist, as required, in obtaining all appropriateand applicable certification and documentation for 0
45

the ship, all necessary shipping documents, and allnecessary port and harbor information.
The Center for Naval Analysis Research Memorandum
on the reactivation process for the ships of the Ready
Reserve Force estimates reactivation costs to be
approximately $1.6 million per ship. [Ref. 30] The crew
costs will vary, depending upon whether Navy personnel,
Military Sealift Command personnel or private industry
merchant seaman crews are used. Navy and Military Sealift
Command crew costs are determined by military and
government service pay scales. If the ships are manned
with private industry merchant seamen, the Military Sealift
Command must honor the shipping agreements that the
maritime unions have obtained from private industry. [Ref.
30]
C. ACTIVATION PROCEDURES
1. Planning & Execution Procedures
During an exercise or crisis situation, many
commands and agencies are involved in developing an
operation order. The Joint Staff Officers Guide defines an
operation order as " a directive, usually formal, issued by
a commander to subordinate commanders for the purpose of
effecting coordinated execution of an operation." [Ref.
33] The efforts of each command need to be closely
coordinated so that supplies and other resources can be
phased into the theater of operation in an orderly manner.
46

The process that authorizes the Military Sealift Command to
bring ships out of the Ready Reserve Force involves a
number of agencies.
a. Joint Deployment Agency
As a result of problems exposed during the
Command Post Exercise Nifty Nugget of October 1979, the
Joint Chiefs of Staff established the Joint Deployment
Agency specifically to coordinate the planning and
execution of military deployments. [Ref. 30] During
peacetime, the Joint Deployment Agency participates in the
deliberate development and coordination of contingency
plans. During times of crisis, these plans are reviewed to
see if they are applicable. Additionally, the agency
coordinates and monitors time-sensitive planning and
execution of force and resupply movements for deployment of
CONUS-based Army and Air Force combat forces. It also
coordinates and monitors deployment planning for Navy and
Marine Corps forces.
b. Deliberate Planning Process
The ultimate result of the deliberate planning
process is the creation of an operation plan (OPLAN), i.e.,
a feasible plan of operation to meet a defind threat.
Plan development involves structuring the force list,
determining the resupply and transportation requirements,
and planning engineering and medical support. This process
includes the development of the Time-Phased Force
47

Deployment Data computer file. This file contains all the
information needed to describe a deployment. It lists what
cargo is to be transported and from what port of
embarkation to what port of debarkation, with a specified
earliest arrival date and latest arrival date.
c. Crisis Action System
The Crisis Action System develops response
actions during time-constrained operations. The time
factor is the one major difference between the Deliberate
Planning System and the Crisis Action System. During a
crisis, an existing operation plan from the Deliberate
Planning process may be applicable to the crisis after
appropriate modifications or expansion.
The Joint Chiefs of Staff will then issue a
warning order, a planning guidance message to the
appropriate commanders and agencies, with an information
copy to the Services. The order initiates an evaluation of
the course(s) of action, and requests that a Commander's
Estimate be submitted.
d. The Warning Order
The supported commander considers the possible
course of action within the warning order, as well as
courses of action developed locally. The limiting factors
for each course are evaluated. These limiting factors
include data about the major combat forces available and
the total transportation assets. At this point, the
48
SA

Transportation Operating Agencies are to provide closure
estimates for each course of action. These closure
estimates, produced by Military Sealift Command for the
sealift requirements, correspond to the deliberate planning
process's gross feasibility that is required by the Joint
Chiefs of Staff. After review by the Joint Chief of Staffs
and the National Command Authority, the supported commander
completes the force list using actual forces, origins, and
dates.
e. Execution Order
When an Execution Order is issued to initiate
the execution of the operation order, the Transportation
Operating Agencies develop detailed movement tables and
schedules. The Military Sealift Command, in turn,
determines if ships from the Ready Reserve Force are needed
to fulfill those requirements. [Ref. 30)
f. Activation of the Ready Reserve Force
One or more ships may be activated to meet a
sealift requirement. When the Commander, Military Sealift
Command, acting as the executive agent for the Secretary of
the Navy, determines that commercial and controlled fleet
resources provide inadequate shipping capability, Military
Sealift Command, informs the Chief of Naval Operation's
Strategic Sealift Division (OP-42) of the need to call up
the Ready Reserve Force vessels. OP-42 contacts the
Secretary of the Navy for activation approval.
49
'1

When the activation is approved, the Chief of
Naval Operations tells the Military Sealift Command to
activate particular ships. The Military Sealift Command
informs the Maritime Administration of the exact dates when
the ships are needed and when cargo loading is expected to
begin. The Maritime Administration then informs the
contract operators to begin the activation procedures.
Once the ships are activated, they are transferred to the
Military Sealift Command's administrative control and to
the fleet commander's operational control. In a crisis,
the specific Ready Reserve Force resource requirements
would depend upon the particular OPLAN in effect.
The Ready Reserve Force ships are generally
activated only pursuant to presidential Declaration of a
National Emergency. However, in guidance issued by the
Office of Management and Budget to the Department of
Defense [Ref. 26], it was stated that these ships may be
activated without this declaration and solely at the
request of the Department of Defense Single Manager for
Sealift for the following reasons:
(1) Testing for readiness and suitability for missionperformance, including participation in scheduledexercises with exercise equipment and on both anotice and no-notice bases.
(2) Supporting civil or military contingency operationsas directed by the National Command Authority.
50

(3) Utilizing unique capabilities to satisfy militaryrequirements which Department of Defense and theDepartment of Transportation agree cannot be met byavailable privately-owned commercial U.S. flagships.
2. Exercise - Breakout 87
a. Background
This exercise was the fourth MarAd Command Post
Exercise conducted to test procedures for activating the
Ready Reserve Force at mobilization. Each exercise has
focused on different aspects of the activation process, but
all are based on the premise that annual testing of the
Ready Reserve Force is necessary due to the dynamic nature
of the program; the continuing expansion, the new ship
types, the outporting of vessels and the changes in the
activation facility base.
The first exercise was held in conjunction with
the NATO exercise Wintex-Cimex 83, in February 83. The
Maritime Administration conducted a survey of facilities
and tugboat availability, and held a Ready Reserve Force
activation seminar in which 29 shipyard and 14 maritime
labor organizations participated. Problems uncovered in
the coordination and scheduling of activations were
discussed. A critique that followed confirmed that the
shipyards had adequate capacity, that seagoing manpower
requirements could be met, and that adequate capability
existed to distribute Ready Reserve Force ships in
accordance with the schedule. 0
51

The next exercise, Breakout 85, provided
interaction among the organizations involved in an Ready
Reserve Force activation in order to evaluate general
procedures and communications, as well as verify the
capability of the activation facilities and availability of
crews to man the activated ships. The crewing of the Ready
Reserve Force was a particularly significant concern. The
Maritime Administration regions and Ready Reserve Force
fleet sites, as well as general agents, actively
participated in the simulated activation processes. The
principal lesson learned from this exercise was the need
for improved communications.
Breakout 86 was conducted concurrently with
Joint Chief of Staff exercises to simulate activation
during a mobilization scenario. An analysis of activation
contractors and tugboat availability were conducted, and
potential problems were addressed in revised plans.
Manning requirements were calculated.
Breakout-87 was conducted from 26 October, 1987
to 6 November, 1987. It was designed to provide training
for Maritime Administration personnel with Ready Reserve
Force responsibilities, for testing the Maritime
* Administration's plans and procedures for managing a total
or large scale Ready Reserve Force activation, and to
implement lessons-learned and recommendations from
Breakout-86. [Ref. 34]
52

Table 3.8 shows the composition of the Ready
Reserve Force at the time of each Command Post Exercise.
During the span of these exercises, the net gain of the
Ready Reserve Force was 59 ships. The percentage of ships
distributed in the three regions drastically changed over
this period. Between 1983 and 1987, the percentage of
Ready Reserve Force ships distributed on the East Coast
declined from 70% to 41%, the percentage of the total
Ready Reserve Force distributed in the Gulf Coast increased
from 20% to 34%, and the Western region increased their
percentage of the total force by 13% The impact of this
changed distribution on the availability of activation
contractors and tugs was a prime concern for Breakout.
TABLE 8COMPOSITION OF READY RESERVE FORCE AT EACH COMMAND
POST EXERCISE[Ref. 34]
Total 5-Day Disposition by RegionFleet Status East Central West
BREAKOUT-87 89 53 37 31 2BREAKOUT-86 76 37 34 24 18BREAKOUT-85 69 32 32 21 16WINTEX-CIMEX 83 30 3 21 6 3
During this exercise, the Maritime
Administration tasked its Eastern, Central and Western
Regions to submit detailed Ready Reserve Force activation
plans for each area of responsibility. The regions were to
use the real-world status of each Ready Reserve Force
53

vessel at the time of notification. (Of the 89 vessels
at the commencement of the exercise, 17 were in the yards
undergoing repairs, 37 were at outports, 33 in fleet
anchorages, 1 operating and 1 new acquisition enroute under
tow. [Ref. 34]
The plans submitted by the regions took into
account real world factors such as:
(1) condition & status of the ship (C-rating)
(2) required repairs, inspections, survey, etc.
(3) current repair period, type and duration
(4) location of vessel
(5) environmental factors
These plans were then submitted to the Commander, Military
Sealift Command, who would subsequently order the
activation and allocation of Ready Reserve Force vessels to
specific missions. No actual Ready Reserve Force
activations were scheduled for this exercise, however, the
regions did track the activation progress of selected
ships by reporting daily on milestones such as arrival at
activation facility, crew aboard, plant on-line, dock and
sea trials and final ready-for-sea status.
b. Conclusions
The availability of activation contractors was
adequate, with 53 different contractors assigned in the
Maritime Administration's activation plans. The outporting
of ships and the on-berth activation offsets losses from
54
the shipyard base. Adequate tugboat resources were
available. Outporting positively affected this factor, as
only 53 ships out of the force of 89 required towing to
activation locations. [Ref. 34]
This exercise concluded that the most critical
element in an activation of the entire Ready Reserve Force
continues to be the availability of crew members. In the
exercise, it was not feasible to include maritime labor
participation, therefore the objective was to determine
Ready Reserve Force manning requirements for later
analysis. This was accomplished by having General Agents
submit updated manning lists for each of their vessels.
The resulting Ready Reserve Force manpower requirement
called for 3,563 seafarers on 89 ships [Ref. 34]. The
average crew size on a Ready Reserve Force ship increased
from 38.5 to 40.0 seafarers per ship [Ref. 20]. At the
same time, most of the modern ships in the U.S. fleet
regulariy sa2. -it, on-ly 21 to 24 man crews. Furthermore,
foreign competitors are testing ships that require as few
as 14 - 16 seafarers. [Ref. 4] This can only further
reduce the U.S. manning averages in the next few years.
55

IV. OUTPORTING
The Ready Reserve Force is the Department of Defense's
main source of quick response sealift in a contingency.
Since its inception in 1976, the programmed size of the
Ready Reserve Force has increased due to the shrinking size
of the U.S. flag fleet. As stated earlier, within eleven
years, the size of the Ready Reserve Force grew from 30 to
90 ships. Initially, the entire Ready Reserve Force was
berthed at the three fleet anchorages. As these sites
became more congested, it became apparent that it would not
be possible to concurrently activate the increased number
of ships. The anticipated improvement in early sealift
capability would not be realized if the ships could not
be rapidly activated.
A. BACKGROUND
Port congestion is an all too real possibility, as
history has shown. In the Spanish-American War, Tampa was
designated the chief port of embarkation. However, as army
historian James Huston noted, it was "hurry up and wait."
Port congestion reached a point where within a few weeks a
thousand railroad cars with military supplies "were backed
up on sidings as far away as Columbia, S.C." [Ref. 35] In
World War I, "two hundred ships lay in New York harbor
awaiting cargoes and fuel while 44,320 carloads of freight
56

(nearly two million tons) backed up on the Atlantic
seaboard as far west as Buffalo and Pittsburgh." [Ref. 35)
Since World War II was a two-ocean war in which all of the
nation's ports were used, congestion such as that
experienced by New York in World War I did not materialize
on a large scale. [Ref. 4]
Concern about the affect of port congestion on the
ability of the Ready Reserve Force to provide early sealift
capability was voiced in a 1986 General Accounting Office
[Ref. 17] report issued to the Assistant Secretary of the
Navy (Shipbuilding and Logistics). Recognizing that these
problems could only intensify as the Ready Reserve Force
grew in size, an outporting dispersal plan was developed.
This action was to correct or eliminate fleet congestion,
unberthing delays, and overburdening of shipyard labor
pools because ships would be dispersed at ports throughout
the United States.
B. OBJECTIVE
The outporting program was implemented to minimize the
time required for the United States to activate a ship in a
contingency, and to rapidly deliver U.S. fighting force
equipment overseas. The following continuum illustrates
the time sequence of events from the beginning of hostile
actions to the arrival of the ship in the theatre of
conflict.
57

DAY 0 5 6 7-10 GO TO XI I I IActivation Transit Load
Procedures Time RO/RO .. BBto
Loadout Port
A constraint placed on the activation process is that
actions cannot begin until the Mobilization Day has been
officially declared. The shipyard is not allowed to begin
gathering the crew until Day 0. The majority of the
outported Ready Reserve Force ships are in a five day
readiness status, and they would be among the first to be
marshalled after the decision to mobilize has been made.
The outporting program was designed to lessen the time
needed for a ship to traverse the above continuum and,
hence, decrease the closure time. Closure is defined to
occur when the last unit of required cargo arrives at its
destination. It is not simple to provide as there is no
standard military interpretation of exactly what the
definition of closure means. For example, consider the
term 'arrival time.' Is that when a ship arrives at the
harbor, when the ship is pierside, or when the cargo is
offloaded? Further, what is meant by the word 'last?'
Where is the line drawn for the last unit of required cargo
and that used for the sustainment of troops? If a tank
breaks down, does it mean the last unit never arrives?
There is no closure? How does one determine closure for
nonunit cargo, i.e., fuel? The Military Sealift Command
58

Headquarters uses a definition that rules that the unit of
cargo has arrived when the ship it is loaded on arrives at
the destination point. Closure is complete when 80% of the
cargo has arrived. [Ref. 36]
The 1986 GAO study recognized the negative impact the
berthing of all the Ready Reserve Force ships at one of
three fleet sites was having on the ability to activate the
ships in a timely manner. [Ref. 36) The study stated that
the Maritime Administration personnel estimated that the
James River Reserve Fleet could not activate more than
three ships a day when 25 ships were anchored there.
Recognizing these problems, the Maritime Administration
awarded contracts to 15 firms to relocate 51 Ready Reserve
Force ships, with most required to be activated in 5 days
at over 20 locations throughout the U.S.
C. COMPONENTS OF THE OUTPORTING PROGRAM
1. Resources
The specific ships and outported locations are
frequently changing. As new ships are brought into the
Ready Reserve Force, the older vessels are retired into the
National Defense Reserve Fleet. Appendix C identifies the
outported ships, as of 31 December 1987, by name, location,
0 type and deadweight ton capacity [Ref. 26]. At that
time, 48 Ready Reserve Force ships were outported at 23
various locations. The recent trend has been to increase
the percentage distribution of Ready Reserve Force ships in
59

the Western Region. Three tankers are now being outported
overseas, two in Japan and one in Hawaii.
The data presented in this chapter is valid as of
31 December 1987, when 48 Ready Reserve Force ships were
outported at 23 various ports. They were distributed as
follows: [Ref. 26]
7 -- West Coast Ports2 -- Overseas - Japan & Hawaii3 -- Gulf Coast Ports
11 -- East Coast Ports
The types of ships outported in the three regions, East,
Gulf, and West Coast, are itemized in Table 4.1.
TABLE 4.1TYPES OF OUTPORTED SHIPS BY REGION
[Ref. 36]
TOTAL OUTPORTED WEST GULF EAST TOTAL
BREAKBULK 7 14 21RO/RO 7 1 4 12TROOPSHIP 1 1TAC 2 2 4LASH 1 3 4SEABEE 3 3TANKER 3 3
TOTAL 20 7 21 48
The 48 ships that were outported as of 31 December
87 had a total deadweight ton capacity of 834,836 tons,
this is over half of the deadweight ton capacity provided
by the entire Ready Reserve Force. The average deadweight
ton capacity of the outported ships is larger than the
average for all the ships in the Ready Reserve Force,
60
-! u 60

17,392 and 16,357 respectively. As ships are cycled
through the Ready Reserve Force, it is the usually the
newer and subsequently larger ships that are selected for
outporting.
The dead weight tonnage of the outported ships is
distributed as follows:
TABLE 4.2TOTAL DEAD WEIGHT TON CAPACITY OF OUTPORTED SHIPS
[Ref. 18]
Number Type Total DWT Average DWTof ships
21 Breakbulks 273,731 13,03512 RO/RO 231,000 19,2501 Troopship 8,759 8,759*4 TACS 51,868 12,967*3 Tanker 13,866 4,6224 LASH 140,380 35,095*3 SEABEE 115,230 38,410*
*NOTE: All ships of this type in the Ready Reserve Forceare outported.
The Maritime Administration has divided the responsibility
for maintaining the ships in the outporting program among
three regions; the Eastern, Western and Gulf Regions. In
the event of an exercise, each region submits a detailed
activation plan for their area.
(1) Eastern Region. The largest percentage (44%) of theships outported, comes from this area, and over halfof the Ready Reserve Force ships maintained in thisregion are outported. The total amount of dead weightton capacity is 292,554 tons. The average age of aship in the Eastern Region is 23 years. A largenumber of breakbulk ships are outported in theEastern Region.
61
iS

(2) Western Region. There are 21 Ready Reserve Forceships assigned to the Western Region. Twenty ofthese ships are outported, leaving only one ship, a31 year old tanker, the Shoshone, berthed at theNational Defense Reserve Fleet anchorage. Thetotal amount of deadweight ton capacity provided byships assigned to the Western Region is 296,332 tons.The average age of ships in this region is 22 years.The slightly younger age is attributed to thequantity of Roll On/Roll Off's, which range in agefrom 9 to 30 years.
(3) Gulf Region. Although there are only seven ReadyReserve Force ships outported in the Gulf region,they provide 245,950 deadweight tons of capacity.The average age of these ships is 15 years. All ofthe older breakbulk ships assigned to this region, 3total of 17, are berthed at the fleet anchorage inBeaumont, Texas.
2. Benefits of Outporting Ships
With the exception of two breakbulk ships outported
in the Eastern Region and the three tankers outported
overseas, all outported Ready Reserve Force Ships are
maintained in a 5-day readiness status. Appendix D
compares the readiness status of the outported ships to
those berthed at the National Defense Reserve Fleet
anchorages.
Another benefit received through the outporting of
Ready Reserve Force ships is that it allows an increased
number of contractors to gain experience in the
reactivation process. Table 4.3 was developed during the
Breakout-87 exercise and shows the number of contractors
available to perform ship activations per port. This
exercise had a Ready Reserve Force ship base of 89 vessels.
62
i0mm m mm ~ l

TABLE 4.3SUMMARY OF VESSELS AND AVAILABLE CONTRACTORS BY PORT
[Ref. 34]
Location Vessels Contractois
Baltimore, MD 2 1Beaumont, 'X 17 (A) 1Buzzards Bay, MA 1 0Jacksonville, FL 1 3Mobile, AL 3 2Naragansett Bay, RI 3 (B) 4New Orleans, LA 4 4New York, NY 2 9Norfolk, VA 17 (C) 8Philadelphia, PA 4 2Portland, ME 1 2Portland, OR 5 3San Francisco, CA 4 (D) 7San Pedro, CA 2 2Tacoma, WA 2 1Yokohama 2 5
Total: 70 54
NOTE: Does not include 17 vessels ready in the shipyards,undergoing repair, 1 vessel operating and 1 vesselundertow.
(A) Beaumont Reserve Fleet(B) Includes Newport, Quonset Point, and Providence,
RI(C) Includes James River Reserve Fleet(D) Includes Suisun Bay Reserve Fleet
3. Costs
Funding for the Outporting Program falls under
the Maintenance & Operations category of the Maritime
Administration's Ready Reserve Force Program Budget. The
FY 88 to 92 planning guidance has projected an annual
outporting cost of approximately $10 million dollars [Ref.
26] The individual outporting costs per ships vary,
63

depending upon the specific location and type of ship.
Figures 9 and 10 compare the costs of outporting two ships;
the Cape Douglas, a 15 year old Roll On/Roll Off outported
in Jacksonville, FL.,to the Aide, a 28 year old breakbulk
outported in Quonset Point, RI.
F'ro.iected Annual Outporting Ccsts
Cape Doualas
READY RESERVE FORCE (RRF) PROGRAM
PROJECTED MAINTENANCE COST ESTIMATES
Vessel CAPE DOUGLAS Project OUTPORTING Status: Day
Location JACKSONVILLE, FL Design Type RO/ROkeglon E
Year 1987 1988 1 1989 1990 1991 j 1992
------------------------------------------------ ------------ -- ---------- ------- I-------Genera; Anz 0, 01 0 0: 01
G e.A gn 0 0 01 01 0Serv. Cnr7tl 1,03740 73740 173701 1737.0 173740 173740Supiv/Matrl O 71000 71000 710001 71000 7 1000 7 100ABS/USCO I/R) 0 O O0 0 CDrydocK O0 01 0 1 01 0Otnr MalntlR:0 0 0 0 G C1alting 0, 0, 0 0 0* 0
o -A 1 2 7 .01 2 -4 7 . 0 2u-740 i 2 7 4 2- 746! 2 -7k0
Figure 9Projected Annual Outporting Costs
Cape Douglas [Ref. 31]
R7ADv RESERVE FORCE (RRF) PR03RA.PR.h TE. N4AINTENANZ: C057 ES7IMATES
4esse A'DE Prcie: OLTPORTING S:aIu s Dhoca:ion QO'ONSET PDINT F: Design Type E B
year 1987 1988 : 1989 1991^ 1991 1992
---------------------------------------- ---------- ---------- -------------------------------- ----------Rsrve FLee u C1 0 0 CGeneral Aent' 0 01 0, 0: 0 6
Serv. Cntrct 16- 33 It--33 1880tb 164733, 16 733i 1647"_Sup v,Matri 13907 139001 13900 13903) 13900 139b LABS USC; I/R O 0i 0: 0: 0 0Dry oc, I 0 0 0 0 o, C,Othr Maint/R: C 01 0 0 0 0
Painting I C : 0 0, 0, 0
Total I 178633, 178633: 201966 i 1786331 1780331. 178633
Figure 10Projected Annual Outporting Costs
Aide [Ref. 31]
64

D. CONCLUSIONS
Under this period of austere financial cutbacks, the
$10 Million projected for the outporting program is
vulnerable to intense scrutiny. The composition of the
Ready Reserve Force, a continually increasing number of
smaller and older ships, dictates that numerous berths be
available for activation purposes. The three designated
National Defense Reserve Fleet anchorage sites cannot
concurrently activate this increased number of ships.
Therefore, the expanded program size of the Ready Reserve
Force will not significantly improve the early sealift
capability posture of the U.S. if progressively more
expansive and expensive measures, such as the Outporting
Ship program, are not implemented to guarantee ship
availability for surge shipping requirements.
656 l

V. SUMMARY & CONCLUSIONS
A. SUMMARY
Strategic Sealift is a vital component of the U.S.
national defense strategy, and a successful strategic
sealift program is dependent upon the availability of
ships. The continuing decline of the U.S. merchant marine
fleet has left many apprehensive about the ability of the
U.S. to acquire needed ships in the event of a contingency
or crisis. Particularly vulnerable in this situation is
the United States's early sealift capability.
The Government has balanced the decrease in the
civilian Merchant Marine fleet with an increase in the size
of the Government Owned Fleet. Initially, it was felt
that the private fleet would be able to accommodate surge
shipping requirements. The Government-owned National
Defense Reserve Fleet was viewed as a backup source of
shippi,'g capability. When the ability of the private fleet
to satisfy the surge shipping requirements became
doubtful, the concept of a Ready Reserve Force was
developed.
When the Ready Reserve Force was implemented in 1976,
the original end strength was 30 Victory Ships with a
30,000 deadweight ton capacity. This component of the
Strategic Sealift Program was to be the main source of
66

quick response in the event of a contingency. Programmed
growth has tripled since its inception in 1976.
As the quantity of ships in the Ready Reserve Force was
increased, the ability of the fleet anchorages to
concurrently activate the vessels became questionable. In
response to this concern, the outporting program was
implemented.
B. CONCLUSIONS
Outported ships are pierside in a stand-by status in
different harbors throughout the country. Dispersing the
ships in this manner may reduce activation and loading
time, but it increases the Ready Reserve Force funding
burden.
During these times of austere funding, all programs are
vulnerable to financial cutbacks. The financial
constraints placed on the decisions made pertaining to the
number of ships to purchase, the age of the ships and where
to outport them are influenced by the economic mood of the
country.
Are the costs incurred due to the outporting program in
times of peace offset by the benefits received in times of
hostile actions, specifically, the reduction in closure
time? Does outporting a Ready Reserve Force ship
significantly enhance strategic early sealift capability?
There are definitive benefits gained from outporting a
Ready Reserve Force ship. First and foremost, it
67
.. .. .. i mlm wwmmmm m m m m i m i mI

minimizes the congestion at the National Defense Reserve
Fleet anchorages. Secondly, it spreads the demand for
shipyard manpower. Third, it may eliminate the one day
transit time of a Ready Reserve Force ship to its loadout
point. Many outported ships are berthed at their
activation site, which is also their assigned loadout
point.
Once a ship is at its loadout point, it will take
between seven and ten days to load, depending on the type
of ship. The Roll On/Roll Off's load quickly, the
breakbulks take more time. The age of the outporfpd ships
has a big impact on their ability to provide early sealift
capability. The average age of the outported ships is 23
years; the average speed is 10 - 15 knots. The value of the
one day saved in the transit time to the loadout point is
questionable, as the ship will then slowly proceed to Point
X. Conversely, it could be argued that any time saved is
of value when getting the unit equipment to the destination
point.
Before deciding if the outporting program is
beneficial, it is necessary to decide what level of risk
the nation is willing to assume pertaining to strategic
sealift. The surest guarantee of ship availability is
government owned ships. However, in peacetime, this
detracts from government support of an active civilian
merchant marine. If the decision is made to build up the
68

government owned fleet, how developed should that fleet be?
The present Ready Reserve Force fleet is comprised of
older ships. Generally , it is the younger ships that are
outported, but they still have an average age of 23 years.
Newer, faster ships would have the potential to cut days
from the closure model. However, these ships would be
expensive to acquire, and their purchase would probably be
difficult to justify to the civilian merchant marine
industry.
Recent trends have been toward larger ships which have
three to four times more deadweight capacity than the
aging ships in the Ready Reserve Force. This means that
fewer ships could carry more tonnage, and less ships would
require fewer outporting sites.
There is not a simple answer. It depends on how much
capital the government is willing to invest to achieve what
level of risk.
C. AREAS FOR FUTURE STUDY
One area open for future study is the development of a
model to determine the effectiveness of outporting a Ready
Reserve Force ship versus berthing it at a National Defense
Reserve Fleet site. This analysis, based on quantitative
data, would determine if the closure estimates for the
movement of sealift requirements bctween two geographical
regions are significantly reduced through the outporting
69
0I

of ships? The model would take into account the following
characteristics:
(1) Age of Ships in the Ready Reserve Force
(2) Outported Berthing Locations
(3) Vessel Mix/Ship Characteristics
(4) Ship Load and Unload Times
(5) Distance between Ports of Embarkation
(6) Estimated Transit Times
The Military Traffic Management Command published a
pamphlet that provides transportation planning information
for use in strategic mobility planning. The booklet, The
Logistics Handbook for Strategic Mobility Planning, [Ref
37] published in 1986, provided the following tables.
(1) TABLE 5.1 - The U.S. flag dry cargo ship inventoryprovides the average ship characteristic data foreach class of ship in the Active and Ready ReserveForce.
(2) TABLE 5.2 - features the characteristics of shipsbest suited for unit deployment.
(3) TABLE 5.3 - presents data on ship load and unloadtimes (based on a 20-hour workday) by type ship forboth berth and logistics-over-the-shore (LOTS)operations.
(4) TABLE 5.4 - gives the distances from selected majorCONUS ports to the larger ports in most of thecoastal countries of the world in alphabetical orderby country. Actual sailing distances may vary fromdistances given as a result of varied routing andweather conditions.
(5) TABLE 5.5 - Estimated Transit Time, may be used inconjunction with Table 5.4 to make an estimation ofthe transit time between a CONUS port and overseasport at selected ship speeds. The speeds are givenin 8 - 30 knots; the distance is in nautical miles50 - 12,000.
70

MTMC Pam 700-1
-IJ
01-% In % M% toc aco# -c
4J
x " MMenJ fn 4E 0n)en enfe s-J
L
>-i 60-e I I %D Go co -4
.41 4 . 0a" = 4ua>J- or w -nc Afe
-ccLnLA
41.in f. 40 0 I S S' 4 - O
aP C: ca aw 00MtLn Ch .- o0 Co Sn In IlQLao a ao aQ al7 ne
LD
act u. CILA--
M %On to ~ ~ t U 00 knM - u Cq0,MCD0oC%'
L.3 L^LMV
A .- 6,0 os~
a-s ca-- --. ir
t7a1

MhC Pam 700-1
M~G 4.10in % $
00 I0% 41 In 0 CD n G
c' L, - %D vD 4A
0
41 C
0 0 4A
x O%4. 0. 1
uCI 06 4A GD n
0GD' >' C" C Ien en I
4) 0. 4_a,.10% C
L.)4 ou L- to -M Ir oW ASom~~G a," D C Io - L- g
GD w 40 41 0 ~0 0-GD
Ln 0. 0Y 61 .0C - G
n C 0 0. LLs.. CD- c% w.~ 6A4 L ~
L~ M alen C .uj >.% 0 CA 4' .:N -en lu w
CD GD Co w 3"x w - ..- 0- -
>-i GD 41 CL 4
4n 4j ~ n
GD~# 4A 0%o uL- G
L)0 4' 0 0 0% 0 IA GD0n4J 0 0. 4. 4nD D
G# 0 M0S. 0 C>41 4- c en #A Rn 0 v
0_ LI 4 = go IC G1- U. GD w 40 U. %-
w C 7 u C en on
L r_ C en - GAe0~~ C0 r~
I1U en 0 -0 gD 0%= a)
-~~& 410 DGD
o. c,. c- c- L L".
LA~s- a" V4) (T C
4' Ul I.-DL e C 0C- .. ' >D
0 ~ ~ ~~. 0 -G)i
U- 0 KGD ~ . . ~- U I- .CG 72

MTHC Pam 700-1
a I I ao aD Go a co ~ a
a a a a am , aD a %a a w
CoC
cz'
LA~i a n S0C a C> mamm a a4mammalws"CDC C wc a aDC )CpC o C
to aw C a M LA aD ar an aC aDC C
I- #A.-00 ~ o 0000MI-" O n -qC004M -e M LA el4 "4 -- 4 fn -l " -l M nf we
Cn-
w CMJ coC n40 l 4Q lr NO ~ T %Li. 4- nCDJ n n -CL0 ) pO O 3e
q( 0~~4 - Clj 0 M 0 M ~ %0 P-i o r M lCMIrIL NM M t ;1:1 1
a a:.60 a " a a ar aWc oC% kLL do ..j-- - - --
0i C004 s -- q .o r4--a 4
n C) ao a aT 6 a aY a~ a ~ a l a ~ a aa
L.
4 - GA 10-~~~ c,~a'
* ~ ~ V %A aaa0a a4j "D, 4A.a r' m .. 4A p..I
0 -M -w "14- c '. M M, 49-L- cocSO.MJo-c4j t <fu0c% Uf-)U -
G)0.n - L .)0 C1
r-% Z L %A
mi3 LA-I 41
.- L~ mA~f~ 73

o ouI
Cm o L
'- 4AIh I I.
cc le. W )0 r 0o
> C)a )ad
I. w,0 9- UC: III 4j
=) fa o n
oa J co C
c- Wr 4-1
0tRn
a TO ccI 0 A W 7
V)~ %Dr 0 c
to.- %A S.
00 0
Luu I. i
ot =ao1/)x L ~ or.
OL&A %6- U.J-
-j 0%C) .1r_ ) a fac o :" O -L
o0 -n Cn U . A 0Ii I-. 0) C f $P
LNJ G- ,q I-
-x a) k- nC
C)f 4)> 40 C)Cgal .01 vO tO
a 74

Table 5-3SHIP LOADING AND UNLOADING TIMES
TYPE AVERAGE LOADING TIMES UNLOADING TIMESSHIP MTON (DAYS) (DAYS)
Breakbulk/ContainerSlow SS 15,867 4 4Fast SS 15,341 5 5
BreakbulkS- ow 15,053 4 4Fast 18,891 4 4
ContainerSlow SS 18,684 1 1Fast SS 24,702 3 3Slow NSS 24,259 1 1Fast NSS 38,957 1 1
RORO/Container-ast SS 38,209 2 2Fast NSS 19,300 1 1
Roll-on/Roll-offSlow SS 26,758 1 1Fast SS 38,184 1 1Fast NSS 19,300 1 1
LASH/SEABEELASH 41,329 2 2SEABEE 46,501 1 1
Ex-Seatrain/TAKREx-Seatran 20,037 3 2TAKR 54,061 2 2
COMMENTS:
1. NSS denotes non-self-sustainingSS denotes self-sustaining
2. Workday consists of 20 hours
75

MTMC Pam 700-1
Table 5-4DISTA NCES BETWEEN PORTS
Port of Embarkation ( CONUS)
Mobile Jacksonville Norfolk New York
Port of Debarkation Alabama Florida Virginia New York
ALASKA, Kodiak 6,321 6,467 6,730 6,925
ALBANIA, Durres 5,844 5,089 4,688 4,540
ALGERIA, Oran 4,747 3,922 3,591 3,443
ARGENTIrJA, Buenos Aires 6.281 5,808 5,824 5,271
AUSTRALIA, Sydney 9,088 9,234 9,497 9,692
AZORES, Ponta Delgada 3,523 2,776 2,401 2,247
BAhGLACESH, Chittagong 11,177 10,422 10,021 9,873
BELGIUM., Antwerp 4,762 3,974 3,617 3,468
BEpMUDA, Har'ilton 1,637 956 683 697
BRAZIL, Rio de Janeiro 5,133 4,707 4,723 4,762
BRITISH HONDURAS, Belize 846 1,047 1,503 1,703
BURMA, Rangoon 11,161 10,406 10,005 9,857
CHILE, Valparaiso 4,053 4,176 4439 4,634
CHINA, Shanghai 10,213 10,208 10,471 10,666
COLUMBIA, Buenaventura 1,789 1,912 2,175 2,370
COSTA RICA, Limon 1,292 1,589 1,852 2,047
CRETE, Souda Bay 5,974 5,219 4,818 4,670
CUBA, Guantanamo 1,109 851 1,117 1,312
CYPRES, Famagusta 6,486 5,731 5,330 5,182
DENMAPK, Copenhagen 5,314 4.409 3,999 3,840
DIEGO GARCIA 9,954 9,057 8,656 8,5DB
IJ
76
- - -Im rm mmmm mu m.m m m I I

MTMC Pam 700-1
Table 5-4DISTANCES BETWEEN PORTS
Port of Embarkation (CO;US)
Mobile Jacksonville Norfolk New YorPort of Debarkation Alabama Florida Virginia New York
DOMINICAN PEPUBLIC,
Santo Domingo 1,487 1,166 1,329 1,489
EGYPT, Port Said 6,438 5.683 5,282 5,134
EL SALVADOR. Acajutla 2,270 2,493 2,656 2,851
EtNrLAND, Liverpool 4,610 3V,0 3,352 3,242
FRANCE, Le Havre 4,576 3,788 3,431 3,282
FRANCE, Marseilles 5,206 4,451 4,050 3.902
FINLAND, Helsinki 6,005 5,100 4,690 4,531
FRENCH GUIANA, Cayenne 2,648 2,294 2,394 2,447
GERMA NY, Bremerhaven 4,960 4,182 38,25 3,676
GREECE, Piraeus 6,003 5,240 4,847 4,699
GUAM, Apra 9,312 9,548 9,811 10,006
GUATEMALA, Puerto Barrios 950 1,144 1,603 1.804
GUIANA, Georgetown 2,404 1,980 20,90 2,217
HASAI I, Honolulu 6,099 6,245 6,508 6,703
ONG KONG, Hong Kong 10,681 10,755 11,018 11,213 S
HC;DURAS, Puerto Cortex 915 1,109 1,568 1,764
ICELAND, Reykjavik 4,001 2,565 2,677 2,495
INDIA. Bombay 9,487 8,751 8,350 8.202
IRAN, Bushehr 9,444 8,689 8,288 8,140
ISRAEL, Haifa 6,526 S,771 5,370 5,222
ITALY, Livorno (Leghorn) 5,382 4,627 4,226 4,078
77

MTMC Pam 700-1
Table 5-4DISTANCES BETWEEN POPTS
Port of Embarkation (CONUS)
Mobile Jacksonville Norfolk New YorkPort of Debarkation Alabama Florida Virginia New York
JAIAICA, Kingston 1,108 1,016 1,279 1,474
JAPAN, Yokohama 9,096 9,242 9,505 9,700
KENYA, Mombasa 9.444 8,689 8,288 8,140
K2-EA, Pusan 10,284 10,430 10,693 10,888
KU, AIT, Kuwait 9,676 8,921 8,520 8,372
LESANON, Beirut 6,529 5,774 5,373 5,225
MALAYSIA, Penang 11.171 10,416 10,015 9,867
FALTA, Marsaxlokk 5,512 4,757 4,356 4,208
MARSHALL ISLANDS, Jaluit 8,080 8,226 8,489 8,684
MEXICO, Veracruz 825 1,315 1,789 1,989
MOROCCO, Casablanca 4,495 3,740 3,339 3,191
,,ETHERLAN;S, Rotterdam 4,965 : .979 3,622 3,473
h:.- ZE4LANO, Auckland 7,930 8,076 8,339 8,534
N::APAGUA. Corinto 2,320 2,243 2,506 2,701
NoRAY, Oslo 5,257 4,333 3,923 3,764
PAKISTAN, Karachi 9,303 8,548 8,147 7,999
PANAMA CANAL ZONE, Colon 1,393 1,516 1,779 1,974
PERU. Callao 2,787 2.910 3,173 3,368
PHILIPPINES, Manila 10,784 10,930 11.193 11,388
pORTUGAL, Lisbon 4,302 3,541 3.147 2,988
puERTO RICO. San Juan 1,488 1,12: 1,252 1,399
78

MTMC Pam 700-1
Table 5-4DISTAINCES BEThEEN PORTS
Port of Embarkation (CONUS)
Mobile Jacksonville Norfolk New Yorkport of Debarkation Alabama Florida Virginia New York
REPUBLIC OF SOUTH AFRICA,
Capetown 7,255 6,862 6,802 6,801
RUSSIA, Leningrad 5,021 5,230 4,811 4,661
RYUKYU ISLANDS, Nakagusaki 9,935 10,081 10,344 10.539
SAUDI APRIA, Ad Dammam 9,580 8,S25 8,424 8.276
SINGAPORE 11,456 10,701 10,300 10,152
SOUTH YEMEN, Aden 7,838 7.083 6,682 6,534
SPAIN, Rota 4,475 3,740 3,339 3,191
S.'ECEN, Stockholm 5,883 4,26 4,416 4,257
TAIWAN, Tan-Shui 10,242 10,388 10,651 10,846
THAILA'?D, Ban Satlahip 11,870 11,115 10,714 10,566
TpINIDAD, Port of Spain 2,004 1,685 1,799 1,939
TUNISIA, Bizerte 5,264 4.509 4,108 3,960
TURKEY, Iskenderum 6,549 5,794 5,393 5,182
URUGUAY, Montevideo 6,115 5,727 5,710 5,753
VENEZUELA, LaGuaira 1,800 1,527 1,687 1,848
VIETNAM, Saigon 11,515 11,350 10,949 10,801
VIRGIN ISLANDS, St. Thomas 1,558 1,181 1,296 1,434
YUGOSLAVIA. Rijeka 6,183 5,388 4,987 4,839
79
m I !

a . U) .- r, P- C e~
-_ C) C) 000 01 Cl t7 0a.o1 C(-..a M %0 0",-,, - -Q j C' C
- a c 000:)C 0-- -(N (C%j Ln -~0 M L~ M ~ C a0 = - .-.- NJ (NJ C. (NJ a
A en CD 0 aCIa ON 0% c- fn
- L- M P~.- e(Nj rnO r - - W ff 0%Ln C
a0 000 Q C Ci e 0-.-1 .- rjN CC rn kr-. r c7%(N CLC..C
L. qTP (NjC"$. C C(NjC a.O- (NCfa- .- '..- *.0 -i 7.C .-UFa~ 0 000 0-- erJ(j 1 cNQ ll C o (NJr % (N ~ O C~j~f Li
CC - C(Nj (NJ CC> C,.1
I 4Aa a) ma -~ M0 C. 0C0 0% cc 0aA L qr CC) - C',J. fn - (\j .-. CO M Nj r to L -
-. -q - (NJ (Nj CC
0
La CL0 ~ '..
am. (N N a-
Li-a
I %A 00 CD 0 (NiCj ccVQ0 CDJ c x0viL U-(' r vCj %D(aJ CO C14N 0 W ~ N 0
- tao 000C C C14r% \c',en MRjl C4%0C V) C7,~ m~~ t- 6r C- - eCl i a 14r c~i q -r 6
%A %C -a(N V0 0%- - c % 10 a
'.,I l.O(N 7% J 7 7 7eC" fn an aw aw aN an 1a al a %C a) a a a
C" ,ni en mi~ V.. 0- Lr% 6;-.
Va1. 4A fn "T - l (ND -n CD N O N N11 )a . aQ a' an at aA al ac all a a a a a a
4w-
C
CDL 000 0DCD0 00CDCD0 00 00CD 0 000 0C0 0 C C)C-- Cf0 CD 00C0 00C 0 00CDC0 000- 0 C) C00 = 0
-~j 11-) cr~ U- .o r-. CO N 00 Coo CD ) o CD C' C) 0
80

MTHC Pam 700-1
ai L (J -. -(J N (.-q r, %0 " f_- - 00 C. -,j
I 1 :3 I I I I I I I
ot -4-- --- (NJ
a~ 0/ a'r 'CD~ CD ( D 0 -Ln~ 0oG D r Ul% o
(N. C) 000 0)( 000 C:) .- MtI0 viJ( IPON 0
LA I u" -7 LCICTC~ , 0h %0 41t C
V4 L "- - U' (7,~. - - ) - l - V ID - j (NJ - CJ (NJ -~1o C > = a 2 9 1 a a 1 # a a I I I
L C0 C-C-D ( DCien L (% ( f - -- - MN
4- ad . MN U 0" - NJ ., , - - ~ I- %D CO o' .oCNJN -
(N. 0 000D ( 00 C ~ I'T %4)~ M~ 0 .'f 9- -c 00 (OC nJ
If -M f- -D MN -t N ncJCl
(7 '~a 0v Cc". -ja7 ' -0JI 0N0r >,. = a a a a a a a a a 1 I 1
M ~ - I- CDD _ C 0 0 - ~ l a DC n% o Df " l
a' en - C r. nJ %Qr- O l.A .) C) -D CDJ CD C0D % C 0 C
v~~~~~~~~a~~c L., (C. N 0 N N - (j -(J
~ ~ a a a a a a a a a a a a a a a8

This data will allow one to develop an objective model
that can determine if it is more effective to outport a
Ready Reserve Force ship than it is to layberth the entire
fleet at the National Defense Reserve Fleet anchorage
sites. If the make-up of the Ready Reserve Force is to
remain the same, comprised of smaller and older ships
requiring numerous berths for activation purposes, and
financial considerations emphasize the minimization of
cost, then an examination of the reduction in closure time
gained through the outporting of a Ready Reserve Force ship
versus berthing it at an National Defense Reserve Fleet
site is appropriate.
82
0

APPENDIX A
SOURCE: NATIONAL DEFENSE RESERVE FLEET
SPECIAL SUMMARY REPORT - MARAD,SHIPS IN THE NATIONAL DEFENSE
RESERVE FORCE, AS OF
31 DECEMBER 1987
SUISON BAY
Name Type Name Type
ADELPHI VICTORY Freighter AMERICAN RACER FreighterALFRED VICTORY Freighter AMERICAN Freighter
RELIANCEBARNARD VICTORY Freighter BAY FreighterBARRE VICTORY Freighter PRESIDENT FreighterBEREA VICTORY Freighter LINCOLN FreighterBERKELEY VICTORY Freighter CAPE BORDA* FreighterBUCKNELL VICTORY Freighter CAPE BRETON* FreighterCENTRAL VICTORY Freighter CAPE BON* FreighterCOUNCIL BLUFFS Freighter CAPE BOVER* FreighterVICTORY
DEPAUW VICTORY Freighter CAPE BLANCO* FreighterEARLHAM VICTORY Freighter CALIFORNIA* FreighterGREAT FALLS Freighter AUSTRAL Lash
VICTORY LIGHTNING*GROVE CITY VICTORY Freighter AMERICAN VETERAN LashHAMILTON VICTORY Freighter CAPE DUCATO* RO/ROHANNIBAL VICTORY Freighter CAPE EDMONT* RO/RO
(ex-PARALLA)HOPE VICTORY Freighter CAPE HORN* RO/ROHUNTER VICTORY Freighter JUPITER* RO/ROLAHAINA VICTORY Freighter CAPE ISABEL* RO/ROLAKEWOOD VICTORY Freighter AMERICAN MONARCH Part.
Cont.LANE VICTORY Freighter AMERICAN Part.
SPITFIRE Cont.LAS VEGAS VICTORY Freighter AMERICAN TITAN Part. S
Cont.LINDENWOOD VICTORY Freighter SANTA MARIA Cont.
Pass.LOYOLA VICTORY Freighter CONNECTICUT TankerMALDEN VICTORY Freighter FLORENCE TankerMASSILLION VICTORY Freighter EXXON GETTYSBURG TankerMAYFIELD VICTORY Freighter SAGAMORE TankerMERCER VICTORY Freighter WYONDOT FreighterMEREDITH VICTORY Freighter COMET* FreighterMUHLENBERG VICTORY Freighter TULARE FreighterNASHUA VICTORY Freighter NORTHERN LIGHT* FreighterOCALA VICTORY Freighter METEOR* FreighterOCCIDENTAL VICTORY Freighter ALATNA* TankerPACIFIC VICTORY Freighter CHATTAHOOCHEE* Tanker
83

PAN AMERICAN Freighter NODAWAY* TankerVICTORY
PURDUE VICTORY Freighter MISSION SANTA TankerYNEZ
QUEENS VICTORY Freighter ASHTABULA TankerRED OAK VICTORY Freighter TALUGA TankerRIDER VICTORY Freighter SHOSHONE* TankerSIOUX FALLS Freighter GEN. JOHN HOPE TransportsVICTORY
ST. AUGUSTINE Freighter GEN. EDWIN D. TransportsVICTORY PATRICK
SWARTHMORE VICTORY Freighter COLONIAL LSDWINTHROP VICTORY Freighter TIOGA COUNTY LSTBRAZIL VICTORY Freighter WAHKIAKUM COUNTY LSTELMIRA VICTORY Freighter GLOMAR EXPLORER AGAMERICAN CHARGER Freighter BIDDLE DredgePIONEER CONTENDER Freighter GEM STATE* T-ACS-2PIONEER MOON Freighter GRAND CANYON T-ACS
STATE*
*Ready Reserve Force (RRF) Vessels
RO/RO - Roll-On/Roll-Off
84

JAMES RIVER
LAKE* Freighter NEW CASTLE Freighter
VICTORY
PRIDE* Freighter OBERLIN VICTORY Freighter
SCAN* Freighter OSHKOSH VICOTRY Freighter
MORMACGLEN Freighter RICE VICTORY Freighter
CAPE CANAVERAL* Freighter ROSWELL VICTORY Freighter
CAPE CANSO* Freighter SOUTHWESTERN FreighterVICTORY
CAPE CATOCHE* Freighter TULANE VICTORY Freighter
CAPE CARTHAGE* Freighter VANDERBILT FreighterVICTORY
AIDE* Freighter WAYNE VICTORY Freighter
AGENT* Freighter CARROLL VICTORY Freighter
ADVENTURER* Freighter JOPLIN VICTORY Freighter
AMBASSADOR* Freighter LOMA VICTORY Freighter
BANNER* Freighter SELMA VICTORY Freighter
BUILDER Freighter SHARON VICTORY Freighter
COURIER* Freighter JOHN W. BROWN Freighter
COMMERCE Freighter ARTHUR M. FreighterHUDDELL
EXPORT CHALLENGER Freighter CAPE DECISION* RO/RO
SANTA BARBARA* Freighter CAPE DIAMOND* RO/RO
SANTA CLARA* Freighter CAPE DOMINGO* RO/RO
SANTA CRUZ* Freighter CAPE DOUGLAS* RO/RO
SANTA ELENA* Freighter CAPE HENRY* RO/RO
SANTA ISABEL* Freighter CAPE HUDSON* RO/RO
SANTA LUCIA* Freighter CAPE LAMBERT* RO/RO
CRACKER STATE Freighter PATRIOT STATE* School
MARINER Ship
MORMACWAVE Freighter RANKIN Freighter
MORMACTIDE Freighter VERMILLION Freighter
MORMACSEA Freighter COMPASS ISLAND Freighter
MORMACSAGA Freighter YANCEY Freighter
AMERICAN Freighter MARINE FIDDLER Freighter
CHALLENGERAMERICAN CHIEFTAIN Freighter MIRFAK Freighter
AMERICAN CORSAIR Freighter GEN. HOYT S. FreighterVANDENBERG
CAPE ALAVA* Freighter SOUTHERN CROSS* Freighter
CAPE ALEXANDER* Freighter ALGOL Freighter
CAPE ANN* Freighter MULIPHEN Freighter
CAPE ARCHWAY* Freighter ADM. WM. M. FreighterCALLAGHAN*
CAPE AVINOF* Freighter SAUGATUCK Tanker
AMERICAN RANGER Freighter MARIAS Tanker
MORMACDAWN Freighter AUCILLA Tanker
MORMACMOON Freighter ATAKAPA Tug
SHIRLEY LYKES Freighter MOSOPELIA Tug
CAPE NOME* Freighter GEN. ALEXANDER TransportM. PATCH
85
d | | m

AMERICAN BANKER Freighter GEN. MAURICE TransportROSE
ALBION VICTORY Freighter GEN. NELSON M. TransportWALKER
AMERICAN VICTORY* Freighter GEN. SIMON B. TransportBUCKNER
ANCHORAGE VICTORY Freighter ALLENDALE TransportBEATRICE VICTORY Freighter GAGE TransportBESSEMER VICTORY Freighter LAUDERDALE TransportCATAWBA VICTORY Freighter LAURENS TransportC.C.N.Y. VICTORY Freighter LAVACA TransportCLARKSVILLE Freighter MOUNTRAIL Transport
VICTORYCORNELL VICTORY Freighter SANCTUARY AHDENISON VICTORY Freighter GOPHER STATE* T-ACSDUKE VICTORY Freighter KEYSTONE STATE* T-ACSDURANGO VICTORY Freighter KINGSPORT AGELKO VICTORY Freighter PROTECTOR AGRGREELEY VICTORY Freighter CASA GRANDE LSDGRETNA VICTORY Freighter DONNER LSDHALAULA VICTORY Freighter RUSHMORE LSDHARVARD VICTORY Freighter WOOD COUNTY LSTHOBART VICTORY Freighter WEST MILTON ARDLAFAYETTE VICTORY Freighter CRANDALL YHLCLAREDO VICTORY Freighter CRILLEY YHLCLYNN VICTORY Freighter ESSAYONS DredgeMANDERSON VICTORY Freighter GOETHALS Dredge
STURGIS MH-IA
*Ready Reserve Force (RRF) Vessels
RO/RO - Roll-On/Roll-Off
86
0l!I!!

BEAUMONT
JOHN HENRY Heavy Lift MEACHAM Tanker
CAPE* Freighter NAECO Tanker
GULF BANKER* Freighter PRIDE II Tanker
GULF FARMER* Freighter TEXACO MARYLAND Tanker
GULF MERCHANT* Freighter MT. WASHINGTON Tanker
GULF SHIPPER* Freighter MISSION TankerBEUNAVENTURE*
GULF TRADER* Freighter BEAUJOLAIS Tanker
CAPE CHALMERS* Freighter CHESAPEAKE Tanker
CAPE CHARLES* Freighter OCEANPORT Barge
CAPE CLEAR* Freighter HANNAH 6301 Barge
CAPE COD* Freighter KARA SEAL Offshore Supply
BUYER Freighter RED SEAL Offshore Supply
DEL MONTE* Freighter BLACK SEAL Offshore Supply
DEL VALLE* Freighter RED RIVER Offshore Supply
DEL VIENTO* Freighter STATE COMMAND Offshore Supply
SANTA ANA* Freighter TRINITY RIVER Offshore Supply
PIONEER COMMANDER* Freighter STATE EBONY Offshore SupplyPIONEER Freighter STATE HAWK Offshore Supply
CONTRACTOR*PIONEER CRUSADER* Freighter LEAM ALABAMA Offshore SupplyBRINTON LYKES Freighter LEAM CALIFORNIA Offshore SupplyAMERICAN ALTAIR Part. Cont. LEAM FLORIDA Offshore SupplyAMERICAN DRACO Part. Cont. LEAM LOUISIANA Offshore SupplyAMERICAN RESERVIST Part. Cont. LEAM MISSISSIPPI Offshore SupplyCAPE INSPRIPTION* RO/RO LEAM TEXAS Offshore SupplyCAPE FLORIDA* LASH MARSEA ONE Offshore SupplyCAPE MAY* SEABEE MARSEA TWO Offshore SupplyCAPE MENDOCINO* SEABEE MARSEA THREE Offshore SupplyCAPE MOHICAN* SEABEE MARSEA FOUR Offshore SupplyBENJAMIN HARRISON LAST MARSEA FIVE Offshore SupplyCAPE FAREWELL* LAST MARSEA SIX Offshore SupplyCAPE FLATTERY* LAST MARSEA SEVEN Offshore SupplyEDWARD RUTLEDGE LAST MARSEA NINE Offshore SupplyALLEGHENY VICTORY Freighter POINT CHRISTIE Offshore Supply
AMARILLO VICTORY Freighter POINT HOPE Offshore Supply
ASBURY VICTORY Freighter AGILE Offshore Supply
BATTLE CREEK Freighter LOUISE PELHAM Offshore Supply
VICTORYCANTON VICTORY Freighter LYNN PELHAM Offshore Supply
CITADEL VICTORY Freighter NOLA PELHAM Offshore Supply
DRAKE VICTORY Freighter TOP FLIGHT Offshore SupplyENID VICTORY Freighter FURMAN Freighter
HATTIESBURG Freighter SCHUYLKILL Tanker
VICTORY*HIGH POINT VICTORY Freighter AMERICAN Tanker
EXPLORER*PINE BLUFF VICTOR" Freighter YUKON TankerPRINCETON VICTORY Freighter POTOMAC* Tanker
87

SAN MATEO VICTORY Freighter MAUMEE TankerTUCSON VICTORY Freighter ACHOMAWI TugWHITTIER VICTORY Freighter CHIPPEWA TugBELGIUM VICTORY Freighter NARRAGANSETT TugGAINESVILLE Freighter WENATCHEE Tug
VICTORYWASHINGTON* Part. Cont. GERIG DredgeMAINE* Part. Cont. LANGFITT DredgeOHIO Part. Cont. BOWDITCH T-AGSAMERICAN OSPREY Tanker BRAZOS TankerCHANCELLORSVILLE Tanker
*Ready Reserve Force (RRF) Vessels
86S

APPENDIX BReady Reserve Fleet as of 31 December 1987
Location - Ship Types - Age - DWT[Ref. 18]
SUISUN BAY - Total 21
Name Type Age DWT
Cape Borda Breakbulk 21 14,662CapBreton Breakbulk 21 14,662Cape Bon Breakbulk 21 14,662Cape Bover Breakbulk 21 14,662Cape Blanco Breakbulk 22 14,662California Breakbulk 26 14,349Austral Lightning LASH 17 29,820Cape Ducato RO/RO 16 21,398Cape Edmont RO/RO 17 20,225
(ex-Paralla)Cape Horn RO/RO 9 20,870Jupiter RO/RO 12 20,160Cape Isabel RO/RO -- 20,160
0 Comet RO/RO 30 10,111Northern Light Breakbulk 27 12,537Meteor RO/RO 21 12,326ALatna Tanker 31 4,933Chattahoochee Tanker 31 4,933Nodaway Tanker 43 4,000Shoshone Tanker 31 26,943Gem State AUX Crane 22 13,600Grand Canyon State AUX Crane -- 13,600
BEAUMONT - Total 31Cape Catawba Breakbulk 28 12,673Gulf Banker Breakbulk 24 11,368Gulf Farmer Breakbulk 24 11,368Gulf Merchant Breakbulk 23 11,368Gulf Shipper Breakbulk 24 11,368
* Gulf Trader Breakbulk 24 11,368Cape Chalmers Breakbulk 25 11,368Cape Charles Breakbulk 25 12,684Cape Clear Breakbulk 25 12,684Cape Cod Breakbulk 25 12,684Del Monte Breakbulk 20 13,039
* Del Valle Breakbulk 20 13,039Del Viento Breakbulk 20 13,039Santa Ana Breakbulk 36 14,376Pioneer Commander Breakbulk 25 13,535Pioneer Contracter Breakbulk 25 13,535Pioneer Crusader Breakbulk 25 13,535
69

-eA M 2K AN NNATrON O THE OU POnTZIN SHIP pRGRAOuM1IWLEMENTED IN RESPONSE TO T.. (U) NfWL POSTGRADUATE
I FI SCHOOL NONE CA J N NCFRARND JUNULASFEEEEEEEEEEEEmmm1,mmd
Ii


113,2
_____ jj2.2
L1
I!
MICROCOPY RESOLUTION TEST CHARTNAf OWNL BAU olsA D S
I4
I Ill
I
w w w w w ww w

Cape Inscription RO/RO 12 20,160Cape Florida LASH 17 29,820Cape May SEABEE 16 38,410Cape Mendocino SEABEE 16 38,41.0Cape Mohican SEABEE 15 38,410Cape Farewell LASH 15 40,370Cape Flattery LASH 15 40,370Hattiesburg Victory Breakbulk 43 10,700Washington SEATRAIN 44 12,292Maine SEATRAIN 44 12,312American Osprey Tanker 30 34,723Mission Buenaventura Tanker 20 38,238American Explorer Tanker 29 24,226Potomac Tanker 31 27,467
JAMES RIVER - Total 38 SLake Breakbulk 27 12,476Pride Breakbulk 28 12,402Scan Breakbulk 27 12,483Cape Canaveral Breakbulk 24 12,684Cape Canso Breakbulk 25 12,684Cape Catoche Breakbulk 25 12,684Cape Carthage Breakbulk 25 12,684Aide Breakbulk 28 11,021Agent Breakbulk 27 11,089Adventurer Breakbulk 28 10,986Ambassador Breakbulk 28 10,986Banner Breakbulk 27 12,629Courier Breakbulk 27 12,705Santa Barbara Breakbulk 21 12,693Santa Clara Breakbulk 22 12,624Santa Cruz Breakbulk 22 12,631Santa Elena Breakbulk 21 12,678Santa Isabel Breakbulk 21 12,472Santa Lucia Breakbulk 20 12,693Cape Alava Breakbulk 26 12,728Cape Alexander Breakbulk 26 12,728Cape Ann Breakbulk 26 12,728Cape Archway Breakbulk 25 12,728Cape Avinof Breakbulk 25 12,728Cape Nome Breakbulk 19 15,690American Victory Breakbulk 43 10,700Cape Decision RO/RO 15 21,398Cape Diamond RO/RO 16 21,398Cape Domingo RO/RO 15 21,398Cape Douglas RO/RO 15 21,398Cape Henry RO/RO 9 20,870Cape Hudson RO/RO 9 20,870Cape Lambert RO/RO 15 19,803Patriot State Troopship 24 8,759Southern Cross Breakbulk 26 12,519
qr)
S
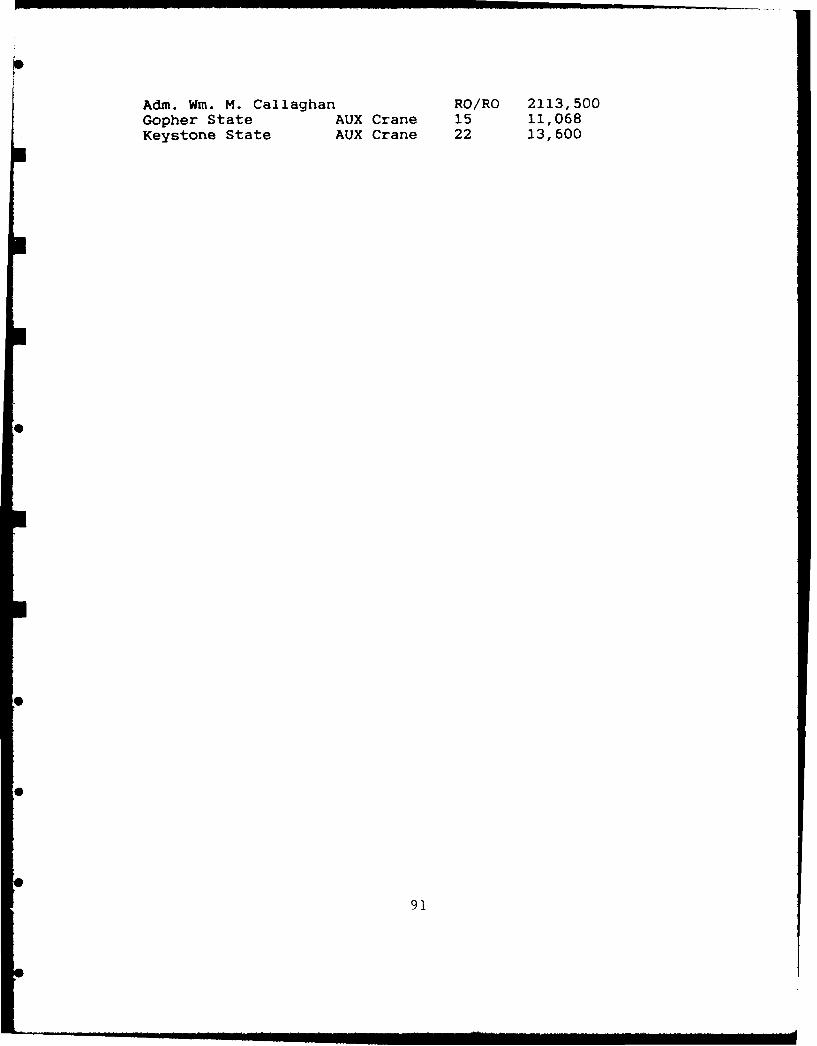
Adm. Wm. M. Callaghan RO/RO 2113,500Gopher State AUX Crane 15 11,068Keystone State AUX Crane 22 13,600
9
91

APPENDIX C
Name, Location, Type, Dwt Of Outported RRF Shipsas of 31 December 1987
[Ref. 26]
WEST COAST - TOTAL 20
NDRF site: Suisun Bay, California
Name Outported Location Type DWT
Cape Borda Richmond, CA BB 14,662Cape Breton San Francisco, CA BB 14,662Cape Bon San Pedro, CA BB 14,662Cape Bover Richmond, CA BB 14,662Cape Blanco Tacoma, WA BB 14,662California Alameda, CA BB 14,349Austral Lightning San Francisco, CA LASH 29,820Cape Ducato San Pedro, CA RO/RO 21,398Cape Edmond Portland, OR RO/RO 20,225Cape Horn San Francisco, CA RO/RO 20,870Jupiter Tacoma, WA RO/RO 20,160Cape Isabel Portland, OR RO/RO 20,160Comet Portland, OR RO/RO 10,111Northern Light Portland, OR BB 12,537Meteor Terminal Is., CA RO/RO 12,326Alatna Yokohama, Japan Tanker 4,933Chattahoochee Yokohama, Japan Tanker 4,933Nodaway Honolulu, HI Tanker 4,000Gem State Tacoma, WA TACS 13,600Grand Canyon State Portland, OR TACS 13,600
GULF COAST - TOTAL 7
NDRF site: Beaumont, Texas
Cape Inscription Violet, LA RO/RO 20,160Cape Florida Mobile, AL LASH 29,820Cape May Violet, LA SEABEE 38,410Cape Mendocino Violet, LA SEABEE 38,410Cape Mohican New Orleans, LA SEABEE 38,410
* Cape Farewell Mobile, AL LASH 40,370Cape Flattery Mobile, AL LASH 40,370
92

************* ********** ** *** ****************** ** ** *****
EAST COAST - TOTAL 21
NDRF site: James River
Name Outported Location Type DWTLake Philadelphia, PA BB 12,476Pride Philadelphia, PA BB 12,402Scan Philadelphia, PA BB 12,483Cape Canaveral Portland, ME BB 12,6R4Cape Canso Portsmouth, VA BB 12,684Cape Catoche Providence, RI BB 12,684Cape Carthage Melville, RI BB 12,684Aide Quonset Point, RI BB 11,021Ambassador Cheatham Annex, VA BB 10,986Cape Alexander Jacksonvill, FL BB 12,728Cape Ann Quonset Point, RI BB 12,728Cape Archway Baltimore, MD BB 12,728Cape Avinof Quonset Point, RI BB 12,728Cape Decision Baltimore, MD RO/RO 21,398Cape Diamond Brooklyn, NY RO/RO 21,398Cape Domingo Brooklyn, NY RO/RO 21,398Cape Douglas Jacksonville, FL RO/RO 21,398Patriot State Buzzards Bay, MA Troopship 8,759Southern Cross Philadelphia, PA BB 12,519Gopher State Cheatham Annex, VA TAC 11,068Keystone State Cheatham Annex, VA TAC 13,600
93

APPENDIX DReadiness Status of Outported RRF Ships
[Ref. 38]
West CoastName Location Readiness Status - Days
Cape Borda CA 5Cape Breton CA 5Cape Bon CA 5Cape Bover CA 5Cape Blanco WA 5California CA 5Austral Lightning CA 5Cape Ducato CA 5Cape Edmont OR 5Cape Horn CA 5Jupiter WA 5Cape Isabel OR 5Comet OR 5
6 Northern Light OR 5Meteor CA 5Alatna Japan 10Chattahoochee Japan 10Nodaway HI 10Gem State WA 5Grand Canyon State OR 5
NDRF SiteShoshone 10
GULF COAST
Cape Inscription LA 5Cape Florida AL 5Cape May LA 5Cape Mendocino LA 5Cape Mohican LA 5Cape Farewell AL 5Cape Flattery AL 5
* NDRF SiteCape Catawba 10Gulf Banker 10Gulf Farmer 10Gulf Merchant i0Gulf Shipper 5
94

Name Location Readiness Status - Days
Gulf Trader 5Cape Chalmers 10Cape Charles 10Cape Clear 10Cape Cod 10Del Monte 5Del Valle 10Del Viento 5Santa Ana 10Pioneer Commander 10Pioneer Contracter 10Pioneer Crusader 10Hattiesburg Victory 10Washington 10Maine 10American Osprey 5Mission Buenaventura 5American Explorex 10Potomac 5
EAST COAST
Lake PA 5Pride PA 5Scan PA 5Cape Canaveral ME 5Cape Canso VA 5Cape Catoche RI 5Cape Carthage RI 5Aide RI 10Ambassador VA 10Cape Alexander FL 5Cape Ann RI 5Cape Archway MD 5Cape Avinof RI 5Cape Decision MD 5Cape Diamond NY 5Cape Domingo NY 5Cape Douglas FL 5Patriot State MA 5Southern Cross PA 5Gopher State VA 5Keystone State VA 5
NDRF SiteAgent 5Adventurer 10
. ... ... ,-- I l a a B B i | . . ...

Name Location Readiness Status - Days
Banner 10Courier 10Santa Barbara 20Santa Clara 20Santa Cruz 20Santa Elena 20Santa Isabel 20Santa Lucia 20Cape Alava 5Cape Nome 5American Victory 10Cape Henry 5Cape Hudson 5Cape Lambert 5Adm. Wm. M. Callaghan 20
96

LIST OF REFERENCES
1. Association of the U.S. Army. Stroto.ic MLt: X (=
We Get There From Here - -in Tie&? WIi u,
2. Congressional Budget Office. U.S. C f
Shipbuilding: Trends • Policy Cholc A. P
3. United States Navy. Military sea.ivt Ccftfnn.(!Readiness: The MSC Strategic Sualitt ptc,2 ftL 'Component of America's Readiness.
4. Whitehurse. Clinton H.. Jr.. The Unstvw !!Iolo wott.aI.iMarine: In Serch of An Enduring mflts00o ~ la
I nstiiue-Press. Annapolis. Karylsftd. 1§4
5. Congressional Budget Office. U .Shi building: Trends & Policy CvbOsa|o A%#Ival .
6. Whitehurst, Clinton. H.. Jr., Amfte rgraho= ;
Sh i npi _ In AmerIcon Ships. Aswr tce -.Institue for Public Policy Reseateh, We+ic .1985.
7. Presentation by RADM Seeley. AoaIatlnl C''v=C= ''
the U.S. Navy. at the Nve) Pn.Igr.ieio ,-; '.April 1988.
8. Critical Decisions Series. A^erica's V@V01%1h4r 2 Mattcl ,!Mariners: Oignosis ProgheSies ar+ Prep tr"-fl ft
Strong National Defense. Tranportetlci on '
Springs, Maryland, October 1986.
9. "U.S. Lacks Needed Airlift. Sealift. CCrwgtPQ o 7r
Army Times, 2 May 1988.
10. "Learning How to Manage Sealift Capability'. trpfor,caManagement Journal, April 1975.
11. Office of the Chief of Naval Oper irnqn (rr-4;Strategic Sealift Division, 16 April 85.
12. Pamphlet, Readiness: The MSC Strategic Sea iffProgram: A Vital Component of Aperica's Pee11ccUnited States Navy Military Sealift Cc and, Was-hijn )r,D.C.
....imlm m~m -m mmmmm mm m

L OW 01. +*s 4.. + .
14 Z
0 40 #4- P.4 * i-. ~'I*09, )h4 4' . * h - -0s
*i q 9vr. '33- 100- Jp -4 4
law f - A 00K. ..Vj aO~' *%atm. * &.r'e'.

... b 4. .* ) " - ." ... * -. ' A*. - o J.. , ..b'- . .. .
, . ...-.
,, ,,, i .mam .m ao I *.... l HIM m

* - * . . ... * . -
- * - dry-

~9fL
/gpq