vulnerability of the natural coastal system … · ulithi atoll ... these profiles provide accurate...
TRANSCRIPT
U.S. DEPARTMENT OF THE INTERIOR GEOLOGICAL SURVEY
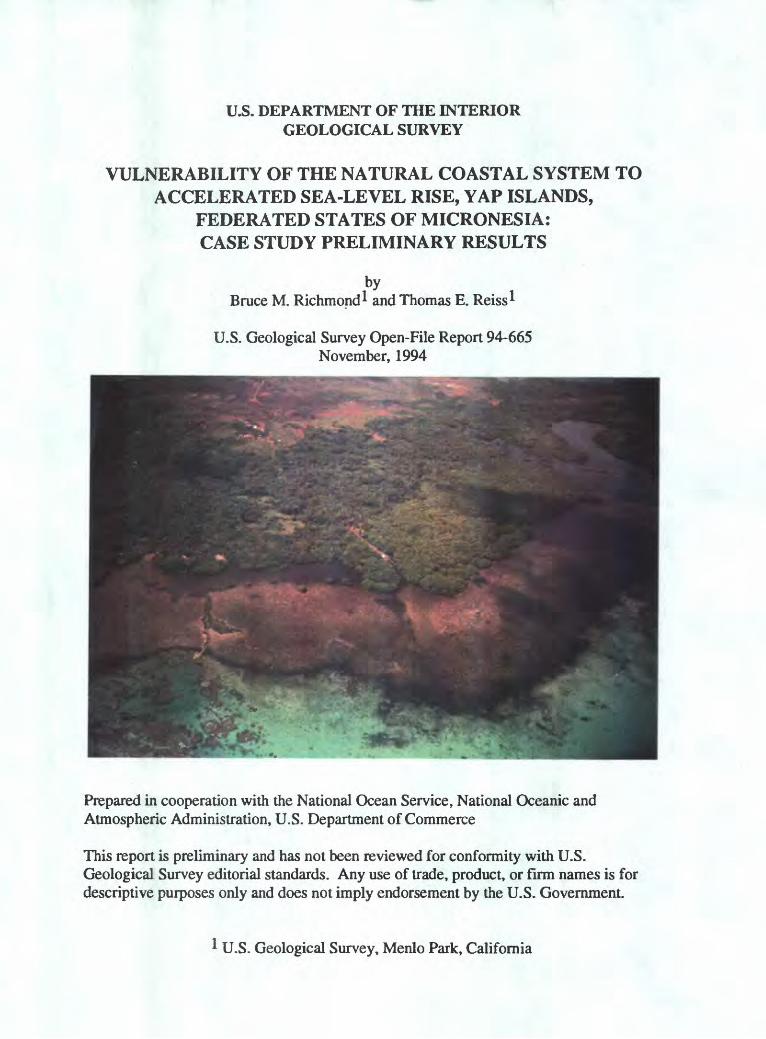
VULNERABILITY OF THE NATURAL COASTAL SYSTEM TOACCELERATED SEA-LEVEL RISE, YAP ISLANDS,
FEDERATED STATES OF MICRONESIA:CASE STUDY PRELIMINARY RESULTS
by Bruce M. Richmond * and Thomas E. Reiss*
U.S. Geological Survey Open-File Report 94-665 November, 1994
Prepared in cooperation with the National Ocean Service, National Oceanic and Atmospheric Administration, U.S. Department of Commerce
This report is preliminary and has not been reviewed for conformity with U.S. Geological Survey editorial standards. Any use of trade, product, or firm names is for descriptive purposes only and does not imply endorsement by the U.S. Government.
U.S. Geological Survey, Menlo Park, California
TABLE OF CONTENTS
Abstract............................................................................................................ 4
Introduction...................................................................................................... 5Methodology and Analysis Conditions .................................................. 5
Topographic Information.................................................................. 5Shoreline Characteristics.................................................................. 6Problems Encountered During Data Collection................................. 7
Inventory of Study Area Characteristics............................................................ 9Characteristics of the Natural System .................................................... 9
Islands of Yap State.......................................................................... 9Site Descriptions.................................................................................... 16
Identification of Non-Climate Change Development Factors............................. 18Natural Developments........................................................................... 18
Main Yap Islands.............................................................................. 18Ulithi Atoll....................................................................................... 19Fais................................................................................................... 20
Physical Changes and Natural Systems Responses............................................ 20Assessment of Physical Changes............................................................ 21
Colonia............................................................................................. 21Sand Coastal Plains .......................................................................... 21Mangrove Forests............................................................................. 22
Assessment of Natural System Responses and Remaining Damages...... 24
Conclusions and Recommendations .................................................................. 28Priority Setting on Vulnerable Areas ..................................................... 28Summary Statements............................................................................. 28Suggested Additional Studies ................................................................ 29
Acknowledgments............................................................................................. 30
References Cited............................................................................................... 30
Plates .............................................................................................................. 32
Appendix I. Coastal profiles from Colonia....................................................... 42
Appendix II. Coastal profiles from the main Yap Islands and Falalop,Ulithi.... 55

LIST OF FIGURES
Figure 1. Island locations of Yap State............................................................. 6Figure 2. Main Yap Islands and profile locations ............................................. 8FigureS. Map of Ulithi Atoll........................................................................... 12Figure 4. Map of Falalop Islet, Ulithi Atoll...................................................... 13Figure 5. Map of Fais Island............................................................................ 14Figure 6. Map showing Colonia profile locations............................................. 15Figure 7. Map of low-lying land of the main Yap Islands................................. 26Figure 8. Map of low-lying land of southern Yap Island.................................. 27
LIST OF TABLES
Table I. Islands of Yap State summary characteristics...................................... 7Table II. Physical characteristics of the Main Yap Islands shoreline................. 10Table III. Reef characteristics of the Main Yap Islands .................................... 10Table IV. Physical characteristics of Fais Island............................................... 10Table V. Physical characteristics of Falalop Islet, Ulithi Atoll.......................... 12Table VI. Summary of profile data for the Colonia area................................... 21Table VII. Summary "Bruun Rule" shoreline recession rates for sand coasts... 23 Table VIII. Summary shoreline change values for mangrove coasts................ 24Table IX. Estimated maximum areal change.................................................... 25
LIST OF PLATES
Plate 1. Oblique aerial photograph of Fais........................................................ 32Plate 2. Oblique aerial photograph of Falalop Islet........................................... 32Plate 3. Photographs of the Colonia shoreline.................................................. 33Plate 4. Photograph of site 2 shoreline, Wachaelaeb, Maap.............................. 34Plate 5. Photograph of site 3 shoreline, Wanyaan, Gagil-Tamil........................ 34Plate 6. Photograph of site 4 shoreline, Yyin, Yap........................................... 35Plate 7. Photograph of site 5 shoreline, Falalop, Ulithi..................................... 35Plate 8. Photograph of site 6 shoreline, Falalop, Ulithi..................................... 36Plate 9. Photograph of site 7 shoreline, Falalop, Ulithi..................................... 36Plate 10. Photograph of site 8 shoreline, Laey, Yap ......................................... 37Plate 11. Photograph of site 9 shoreline, Thabeeth, Yap................................... 37Plate 12. Photograph of site 10 shoreline, Qoon, Yap....................................... 38Plate 13. Photograph of site 11 shoreline, Taafniith, Yap................................. 38Plate 14. Photograph of site 12 shoreline, Kanif, Yap ...................................... 39Plate 15. Photograph of site 13 shoreline, Meqruur, Yap.................................. 39Plate 16. Photograph of site 14 shoreline, Gilfith, Yap..................................... 40Plate 17. Photograph of rusted W.W.II landing platform, Ulithi Atoll.............. 40Plate 18. Photograph of mangrove forests, Yap................................................ 41Plate 19. Photograph of traditional Yapese seawall.......................................... 41
ABSTRACT
Yap State in the Federated States of Micronesia consists of 16 islands spread over a distance of nearly 1,000 km across the western Pacific Ocean. Four island types are present in Yap State: 1) The main Yap Islands consist of four large , and several smaller, high volcanic islands surrounded by a fringing reef. 2) Ten atolls consisting of an annular reef rim enclosing a central lagoon which may be connected to the open ocean by deep passages. Low-lying coral islets are scattered on the upper surface of the reef rim. 3) There are four Reef Islands, which are low-lying coral islands developed on a small reef platform and devoid of a significant lagoon. 4) A single high limestone island (Fais) partially surrounded by a narrow fringing reef and the remainder of the island consisting of a cliffed-coast.
The present study concentrated on identifying and describing characteristic shoreline areas of the main Yap Islands. Coastal profile data were from eleven representative sites around the Yap islands shoreline. Three critical natural environments were identified: 1) Mangrove forests which comprise about 10% of the total land area and a distance of nearly 114 km along the shoreline. Mangrove area has been expanding throughout the Holocene and we suggest that under a rising sea level would expand in a landward direction as low-lying coastal land becomes intertidal. Shoreline erosion would probably be minimized due to mangrove protection. 2) Sand beaches and associated sand-rich coastal plains are limited in extent, occurring in exposed localities and comprising only about 0.25% of the total land area. However, they form important settlement sites and are critical to modern and traditional Yapese culture. Sand beaches are extremely vulnerable to accelerated erosion and a landward shift of the shoreline profile during a rising sea level can be expected. 3) Coral reefs surround the main Yap Islands and are a source of sediment for the beaches and adjacent fringing reefs. Reef response to accelerated sea-level rise is probably one of expanded vertical growth and increased carbonate production as shallow substrates are submerged.
Colonia, located near Tamil Harbor on Yap Island in the main Yap Islands, is the center of government and commerce for Yap State. Results of profiling along the Colonia shoreline suggests most of the important roads and buildings lie above predicted accelerated sea-level rise (ASLR) still-water levels (i.e. > 1 m above present MSL). However, storms and tsunamis can be expected to play a greater role in modifying the shoreline under higher sea level.
The low-lying atolls and reef islands of Yap State potentially can suffer severe consequences of accelerated sea-level rise. Maximum elevation of these islands is around 7 m and they probably average 3-4 m above MSL. Results from profiling on Falalop Islet in Ulithi Atoll indicates some shoreline erosion (18m maximum) would occur under higher sea level but the islet would probably still be inhabitable. However, there is no higher ground for relocation in the advent of severe land loss due to ASLR mediated erosion.
INTRODUCTION
Accelerated sea-level rise (ASLR) is one of a number of potential effects associated with predicted global warming trends. Low-lying coastal areas around the world may experience increased vulnerability to shoreline erosion and the catastrophic effects of extreme events. The Intergovernmental Panel on Climate Change (IPCC) was formed by the World Meteorological Organization (WMO) and the United Nations Environmental Program (UNEP) to evaluate response strategies to limit, or adapt to, climate change. As part of that effort a number of vulnerability assessment case studies were recommended using a common methodology (IPCC, 1991). This study examines the vulnerability of the natural coastal system of Yap as part of one IPCC case study.
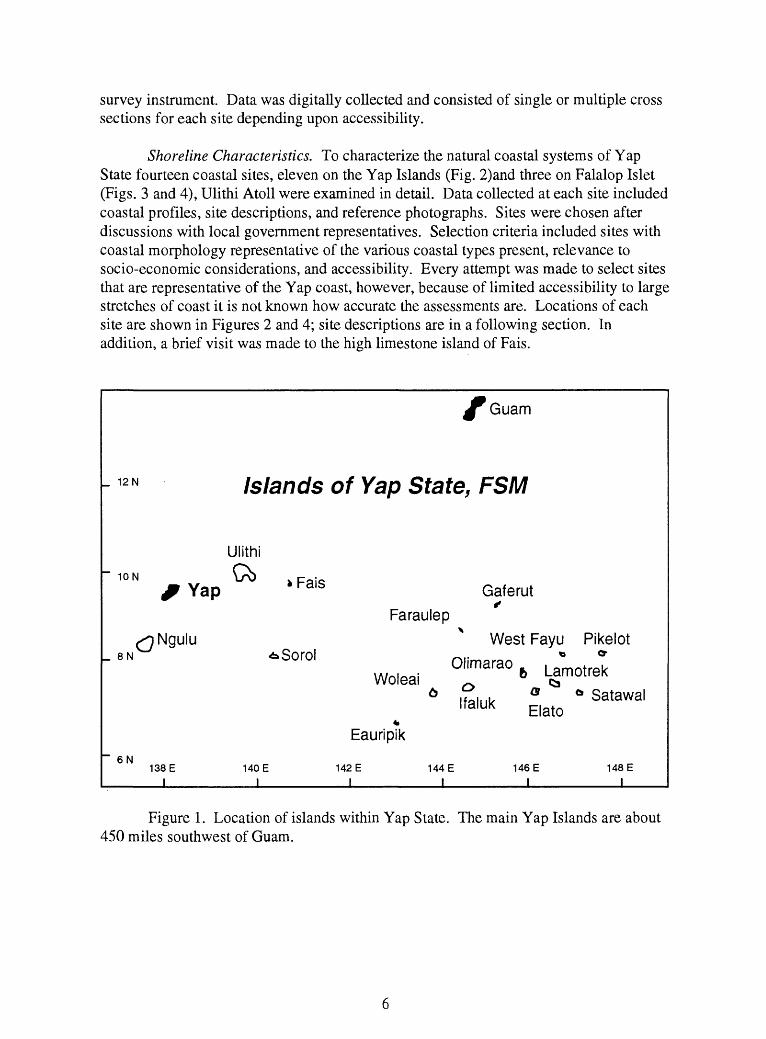
Yap State, in the western Pacific Ocean, is one of four states of the Federated States of Micronesia, the other states are Chuuk (Truk), Kosrae, and Pohnpei. The main islands of Yap consist of four major islands (Yap, Tamil-Gagil, Map, and Rumung) and several smaller ones. About 65% of the population of Yap State lives on the main islands which comprise about 84% of Yap State's total land mass. In addition to the main Yap Islands there are 10 atolls, 4 reef islands, and one high limestone island which extend nearly 1,000 km across the Pacific Ocean (Fig. 1; Table I). Field studies were conducted on the Yap Main Islands and Falalop Islet on Ulithi Atoll, and a brief visit was made to the emerged high limestone island of Fais.
Two distinct sets of boundary conditions for ASLR (accelerated sea-level rise) case studies are specified by the IPCC: a low value of +0.3 m above present mean sea level and a high value of +1.0 m by the year 2100. The physical boundaries used for this study extend from the 5 m topographic contour to the reef crest. The 5 m contour is the lowest contour on available topographic maps and the area between this contour and the shoreline generally represents the low-lying coastal land. The reef crest is the seaward- most easily identifiable feature that would most likely be affected by a rise in sea level.
Methodology and Analysis Conditions
Topographic information. Topographic information was gathered from analysis of published maps and from detailed coastal profiles collected in Yap as part of this study. Baseline topographic information for the Yap Islands (Waqab) was derived from the US Geological Survey 1:25,000 scale topographic map published in 1983. Shoreline position, mangrove areas, sand shorelines, and topographic contours (5, 25, 50 and 75 m) were digitized from the topographic map. Contour interval on the topographic map is 5 m, therefore, the area of concern in addressing sea-level rise is the zone between the shoreline and the first 5 m contour. Topographic information for the islet of Falalop in Ulithi Atoll was derived from a US Army Corps of Engineers , Army Map Service (Defense Mapping Agency) 1:25,000 scale map produced in 1954.
To supplement published topographic information, coastal profiles extending from the reef flat inland as far as logistically feasible were collected from selected sites along the Yap coast (Fig. 2). These profiles provide accurate elevation and coast profile shape information and are used to supplement elevation measurements derived from topographic maps.. The profiles were collected using a precision infra-red rangefinder
survey instrument. Data was digitally collected and consisted of single or multiple cross sections for each site depending upon accessibility.
Shoreline Characteristics. To characterize the natural coastal systems of Yap State fourteen coastal sites, eleven on the Yap Islands (Fig. 2)and three on Falalop Islet (Figs. 3 and 4), Ulithi Atoll were examined in detail. Data collected at each site included coastal profiles, site descriptions, and reference photographs. Sites were chosen after discussions with local government representatives. Selection criteria included sites with coastal morphology representative of the various coastal types present, relevance to socio-economic considerations, and accessibility. Every attempt was made to select sites that are representative of the Yap coast, however, because of limited accessibility to large stretches of coast it is not known how accurate the assessments are. Locations of each site are shown in Figures 2 and 4; site descriptions are in a following section. In addition, a brief visit was made to the high limestone island of Fais.
_ 12 N Islands of Yap State, FSM
Ulithi
10 NYap Gaferut
Faraulep
Woleai _6 ° * Satawal
xo Ngulu West Fayu Pikelot SN ^Sorol ^, : _ __ * °"
Lamotrek03
Elato
Eauripik
138 E 140 E 142 E 144 E 146 E USE
______I___________I___________I___________I__________I___________|__
Figure 1. Location of islands within Yap State. The main Yap Islands are about 450 miles southwest of Guam.
ISLAND
NguluYap
UlithiSorolFais
EauripikWoleaiIfalukFaraulepGaferutOlimaraoElatoLamotrekWest FayuSatawalPikelot
ISLAND TYPE
AtollHigh VolcanicAtollAtollHigh LimestoneAtollAtollAtollAtollReef IslandAtollAtollAtollAtollReef IslandReef Island
POPULA TION
<60-7,000
-750
<60-250
-150-750-400-150
00
<60-250
0-400
0
MAXIMUM DIMENSIONS
(km)25X3942X16
26X3512X3.11.4X3.2
?9.3 X 5.34.0X3.1
?0.5 X 0.9
?13 X 2.46.5 X 15
?0.9 X 2.3
?
MAXIMUM ELEVATION
(m)low170
6+low19
lowlow
5lowlowlowlowlowlow
7low
LAND AREA(km2)
?96
4.61.22.2
?4.41.0???
0.61.0?
1.3?
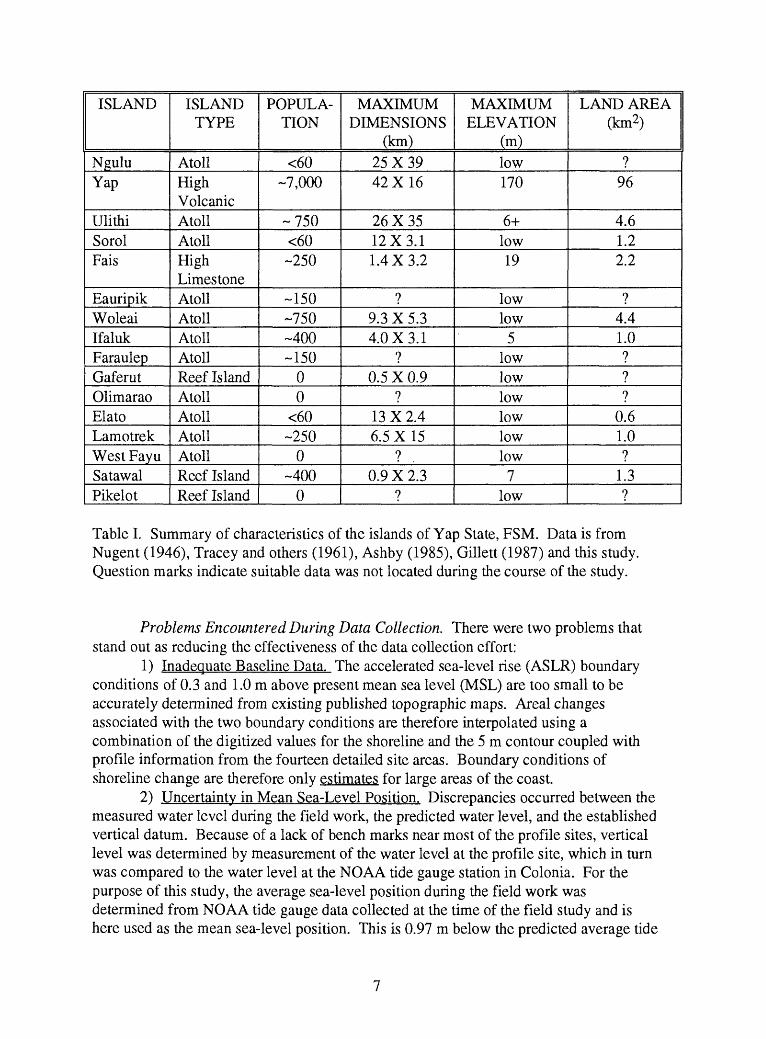
Table I. Summary of characteristics of the islands of Yap State, FSM. Data is from Nugent (1946), Tracey and others (1961), Ashby (1985), Gillett (1987) and this study. Question marks indicate suitable data was not located during the course of the study.
Problems Encountered During Data Collection. There were two problems that stand out as reducing the effectiveness of the data collection effort:
1) Inadequate Baseline Data. The accelerated sea-level rise (ASLR) boundary conditions of 0.3 and 1.0 m above present mean sea level (MSL) are too small to be accurately determined from existing published topographic maps. Areal changes associated with the two boundary conditions are therefore interpolated using a combination of the digitized values for the shoreline and the 5 m contour coupled with profile information from the fourteen detailed site areas. Boundary conditions of shoreline change are therefore only estimates for large areas of the coast.
2) Uncertainty in Mean Sea-Level Position. Discrepancies occurred between the measured water level during the field work, the predicted water level, and the established vertical datum. Because of a lack of bench marks near most of the profile sites, vertical level was determined by measurement of the water level at the profile site, which in turn was compared to the water level at the NOAA tide gauge station in Colonia. For the purpose of this study, the average sea-level position during the field work was determined from NOAA tide gauge data collected at the time of the field study and is here used as the mean sea-level position. This is 0.97 m below the predicted average tide
level (NOS tide tables) and 0.495 m and 0.515 m above two established bench mark mean sea-level position ("Tide 2" and "Pub" respectively) in the Colonia area. Preliminary interpretation of tide gauge data from Colonia suggests from 1976 relative sea-level has been rising at the rate of 6 mm/yr (unpub. data, TOGA Sea-Level Center, Univ. of Hawaii; in Anthony and Ikehara, 1993).
Main Yap Islands
Philippine Sea ' \
_9o30'
y
J\
agil-Tamil
/
5 km
Coastal Profile Locations: 1
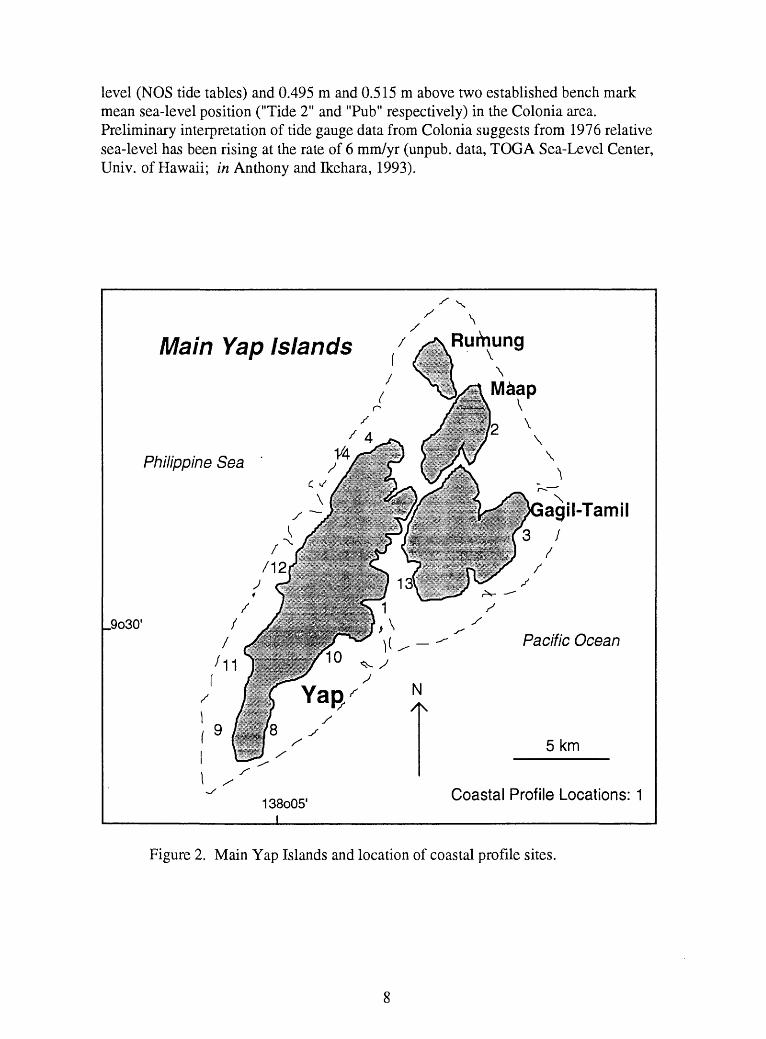
Figure 2. Main Yap Islands and location of coastal profile sites.
INVENTORY OF STUDY AREA CHARACTERISTICS
Characteristics of the Natural System.
Islands of Yap State.Three distinct island types occur within Yap State: 1) High islands of volcanic
and metamorphic rocks, 2) High limestone islands, and 3) Atolls and low-lying reef islands. This study focused on the Yap Islands (high volcanic/metamorphic islands) which are the population center and seat of government for the State of Yap. Distinct island types have differing coastal environments and can be expected to respond uniquely to changes in relative sea-level position.
1) High Islands of Metamorphic and Volcanic Rocks. The Yap Islands consist of four main high islands (Yap, Rumung, Gagil-Tamil, and Maap; Fig. 2) and numerous smaller islands composed primarily of metamorphic rocks with smaller amounts of sedimentary (breccia) and volcanic rocks. The platform upon which the islands lie is elongated in a northeasterly direction and roughly parallel to the axis of the Yap trench which lies to the east and is nearly 9,000 m deep. The Yap trench and island arc are part of an arcuate system of trenches and associated island arcs including the Bonin, Mariana, and Palau trenches. Although the Yap Islands appear like typical island arcs they are unusual in being formed of mostly metamorphic instead of volcanic rocks. There is no modern volcanism and there are few historic earthquakes on Yap (Hawkins and Batiza, 1977).
Coastal deposits of the Yap Islands are either beaches, mangrove swamp deposits, or alluvium. Beaches are formed from terrigenous, carbonate, or a mixed terrigenous- carbonate sediment and typically occupy more exposed locations such as S and NW Yap, E Gagil-Tamil, and E and N Maap. In contrast, mangroves inhabit the more protected environments where they often alluvial deposits. Remaining coasts are marked by cliffs. Characteristics of the Yap coastal zone are presented in Table II.
The Yap Islands are enclosed by a fringing reef which is broken by several deep reef passages. Numerous blue holes (steep-sided enclosed basins) characterize the reef flats. The reefs are described in more detail in Orcutt and others (1989) and reef characteristics are summarized in Table III.
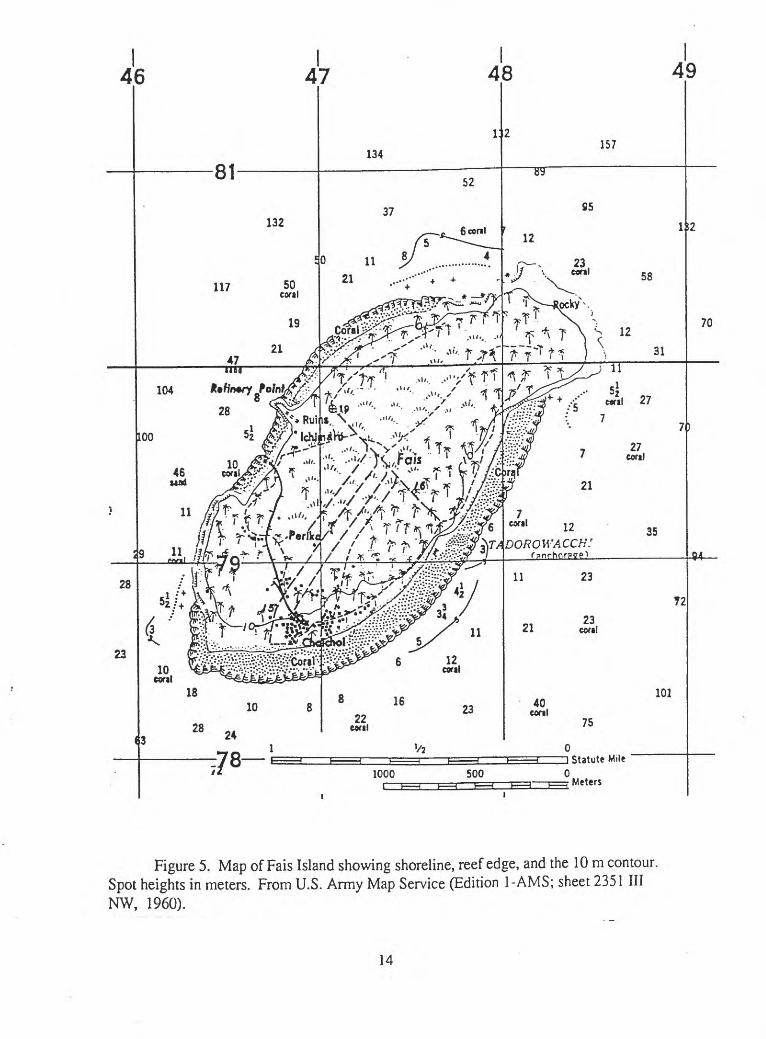
2) High Limestone IslandsThe high limestone island of Fais (Fig. 5, Plate 1) was briefly visited during this
study. It is about 75 km from Falalop, Ulithi and 250 km from Yap. The age of the limestone is unknown and presumably composed of uplifted reef deposits. The shoreline of Fais is either limestone cliffs or carbonate-sand beaches. The beaches are the seaward margins of narrow coastal plains backed by limestone cliffs. The largest village, Choichoi on the southcoast, is situated on the island's most extensive coastal plain which is only about 150 m wide. Elevation data of the beach deposits is not available; maximum elevation of the island is about 19 m. Fringing reefs, up to 150 m wide, are adjacent to the beaches whereas shallow reefs are poorly developed opposite the cliffed shorelines. Table IV lists some physical characteristics of Fais.

Total Area (km2)Area Above 5m (km2)Low-lying Coastal Area (km2)% Low-lying CoastMangrove Area (km2)% MangroveSand Beach Area (km2)% Sand BeachMangrove Shoreline Distance (km)Sand Shoreline Distance (km)
YAP
54.241.113.1
24.15.610.30.070.13
62.9
3.6
GAGIL- TAMIL27.421.95.5
20.12.910.80.020.09
31.4
1.4
MAAP
10.68.62.1
19.31.2
10.90.09
0.814.6
3.8
RUMUNG
4.03.40.6
15.40.26.00051.34.9
2.0
TOTAL
96.274.921.2
22.19.910.30.240.25
113.7
10.8
Table II. Physical characteristics of the main Yap Islands as determined from the USGS 1:25,000 scale topographic map. The low-lying coastal areas are those between the shoreline and the first map contour (5m).
Total Reef Area (km2)Reef Flat Area (km2)Deep Reef Passages (km2)Patch Reefs (km2)Blue Holes (km2)
YAP123.8993.0330.860.273.76
Table III. Reef characteristics for the main Yap Islands as determined from the USGS 1:25,000 scale topographic map.
Total Land Area (km2)Maximum Elevation (m)Coastal Plain Area (km2)Reef Flat Area (km2)
FAIS2.219
0.560.35
Table IV. Physical characteristics of Fais Island, Yap, as determined from AMS 1:25,000 scale map (1954).
10

3) Atolls and reef islandsAtolls are islands composed of an annular reef rim surrounding a central lagoon
often with small, low-lying islets of reef-derived sediment occurring scattered on the upper reef rim surface (Figs. 3,4; Plate 2). Ten of the outer islands of Yap State are atolls and four are single reef islands (low-lying islands composed of reef-derived sediment but without a significant lagoon ). The atoll islets and reef islands are Holocene in age and include a significant amount of storm deposits and possibly record deposition under a slightly higher than present (<2 m) mid-Holocene sea level.
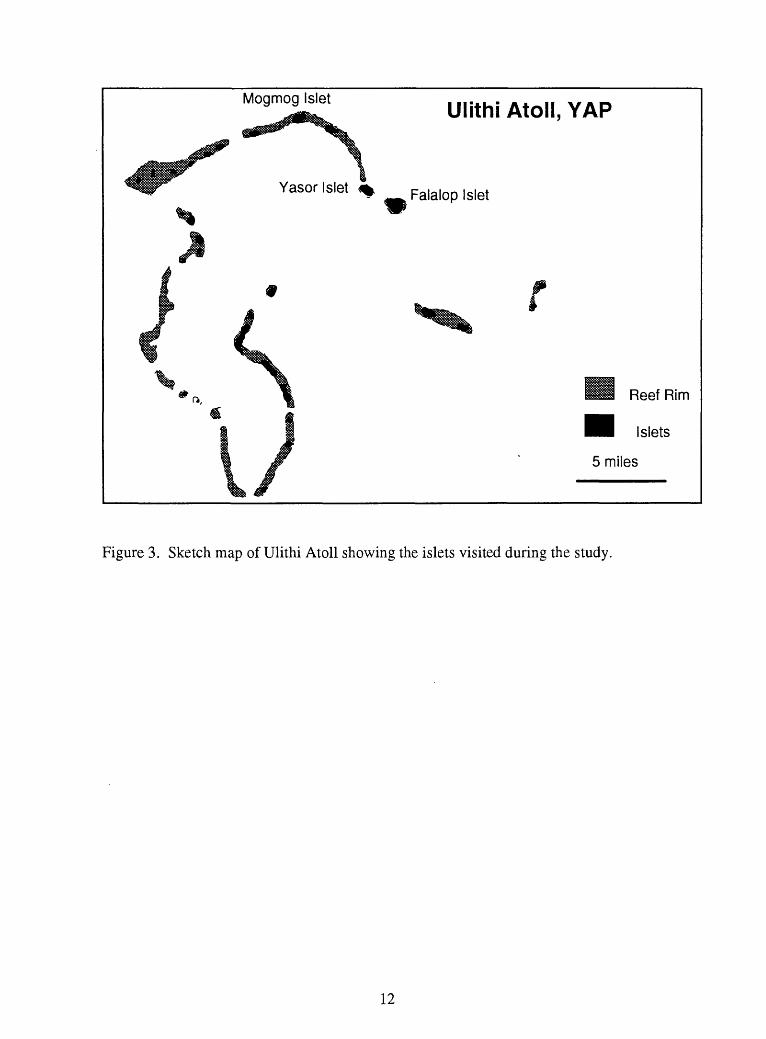
Ulithi Atoll, approximately 180 km from Yap, was visited during this study. Three sites were profiled on Falalop Islet (sites 5,6,7 described below) and brief visits were made to Mogmog and Yasor Islets. Falalop is one of the larger islets of the atoll, the center of government activities, the site of the atoll airstrip, and the most populated islet. It is triangular in plan shape, roughly equidimensional, and surrounded by a fringing reef up to 150 m wide. Extensive submerged reefs occur to the east and northeast of the islet. Maximum elevation is about 6m and therefore it is particularly susceptible to the effects of sea-level rise. Physical characteristics of Falalop are given in Table V. Without further study we do not know how representative Falalop is of the other atoll islets within Yap State.
Total Land Area (km2)Maximum Elevation (m)Total Reef Area (km2)Reef Flat Area (km2)Submerged Reef Area (km2)
FALALOP, ULITHI
1.06.3 +2.440.42.04
Table V. Physical characteristics of Falalop Islet, Ulithi Atoll, Yap, as determined from AMS 1:25,000 scale map (1954).
11
Mogmog IsletUlithi Atoll, YAP
Falalop Islet
Reef Rim
Islets
5 miles
Figure 3. Sketch map of Ulithi Atoll showing the islets visited during the study.
12

133
367 47/3Cy/ 358
Coastal Profile Locations
1000 500
METERS
Figure 4. Map of Falaop Islet, Ulithi Atoll showing the profile location sites. From U.S. Army Map Service (Edition 1-AMS; sheet 2152 II SW, 1959).
13
/' rtT^&^ye / t * * -\3r&®sr*i
Figure 5. Map of Fais Island showing shoreline, reef edge, and the 10 m contour. Spot heights in meters. From U.S. Army Map Service (Edition 1-AMS; sheet 2351 III NW, 1960).
14

Figure 6. Map showing the location of the Colonia coastal profiles. Base map is from the USGS 1:25,000 topographic map of the Yap Islands (Waqab), Federated States of Micronesia.
15

Site Descriptions.
Site 1: Colonia, Yap. Colonia (Tomil Harbor) is the main port of Yap and the site of important government and business buildings, roads, and infrastructure development. Physiographically, the greater Colonia area is sited at the head of a deep reef passage and includes a shallow protected lagoon bordered by a narrow low-lying coastal plain with mangroves surrounded by hills. Except for the area of mangroves in the upper harbor near Mulroq and Towaangiil, the Colonia shoreline is extensively modified by engineering structures (Plates 3a & 3b). Twelve profiles were collected in the Colonia area (Figure 6; Appendix I). Elevation of the coastal plain, revetments, seawalls, and roads of the profile sites surrounding Colonia range from 1.6 to 3.6 m above MSL (mean sea level), averaging about 2.3 m above MSL.
Site 2: Wachaelaeb, E Maap, Yap. This site is characterized by an east-facing, north-south trending coastal plain bordered by a shallow fringing reef that ranges between 1200 and 2300 m wide. The inner reef flat is characterized by extensive beds of sea grass (Plate 4). The narrow (less than 150 m) coastal plain consists of a carbonate sand beach and backbeach deposits fronting hills of conglomerate/breccia. This is a relatively high-energy site for Yap as indicated by the well-developed sand beach and absence of mangroves. Field evidence suggests a north-to-south net longshore transport direction. The coastal cross-section for site 2 and the remaining sites are presented in Appendix n.
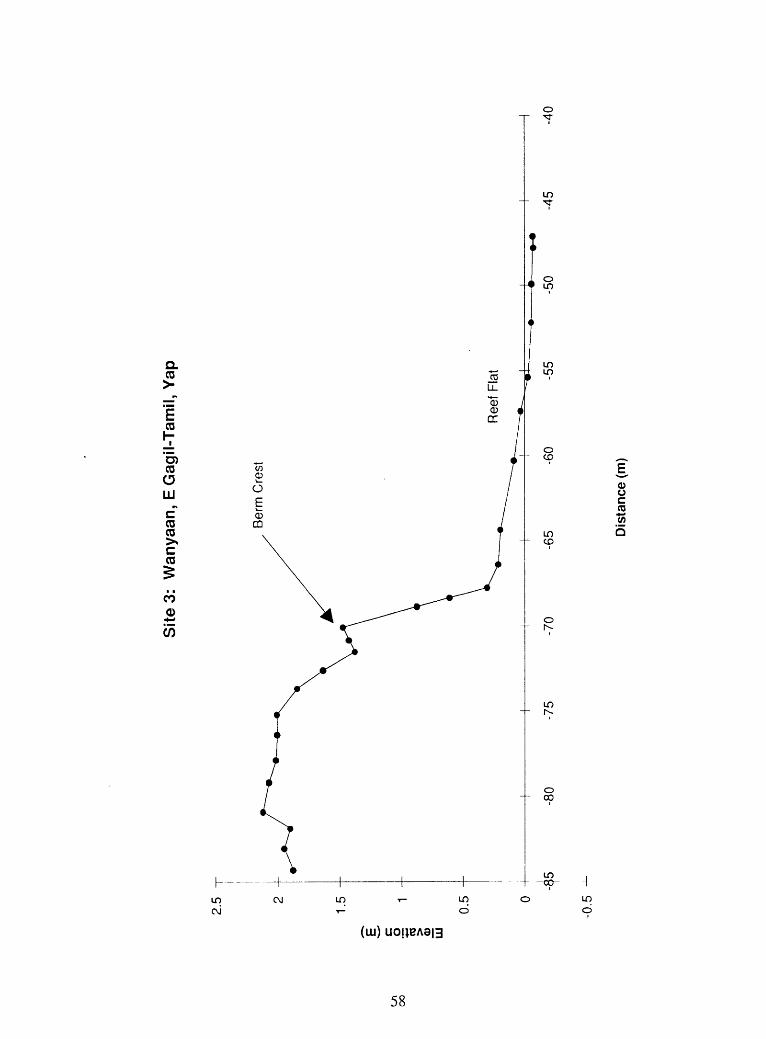
Site 3: Wanyaan, E Gagil-Tamil, Yap. Southeast-facing shoreline consisting of a carbonate sand beach to the north and mangrove forests to the south (Plate 5) characterizes this site. The profile site is an arcuate pocket beach at a small stream mouth and bounded by rock outcrops to the north and mangroves to the south. The coastal plain is mostly beach deposits with some alluvium and ranges in width from about 50 to over 300 m. The adjacent fringing reef is nearly 1700 m wide and is interrupted by several blue holes (steep-sided basins up to tens of meters deep enclosed by reef).
Site 4: Yyin, NW Fanif, Yap. A northeast-southwest trending relatively straight section of shoreline that faces to the northwest and consists of a carbonate sand beach developed at a stream mouth (Plate 6). The fringing reef is about 850 m wide and a small blue hole is located to the north in the middle of the reef flat. The coastal plain beach deposits are up to 120 m wide. The backbeach zone at the profile site appears to be an area where sand mining has occurred.
Site 5: N Falalop, Ulithi Atoll. The north coast of Falalop Islet lies on the exposed northeast rim of Ulithi Atoll. The adjacent reef flat is about 120 m wide and consists mostly of a hard algal-covered pavement and scattered thin sediment deposits. The shoreline is a beach composed of coarse reef debris piled into a large prominent ridge (Plate 7). At the time of profiling several erosional scarps were present and intermittent beachrock strands dotted the foreshore. Landward of the beachridge is a
16
relatively flat plain created during construction of the airstrip and the site of the Outer Island High School.
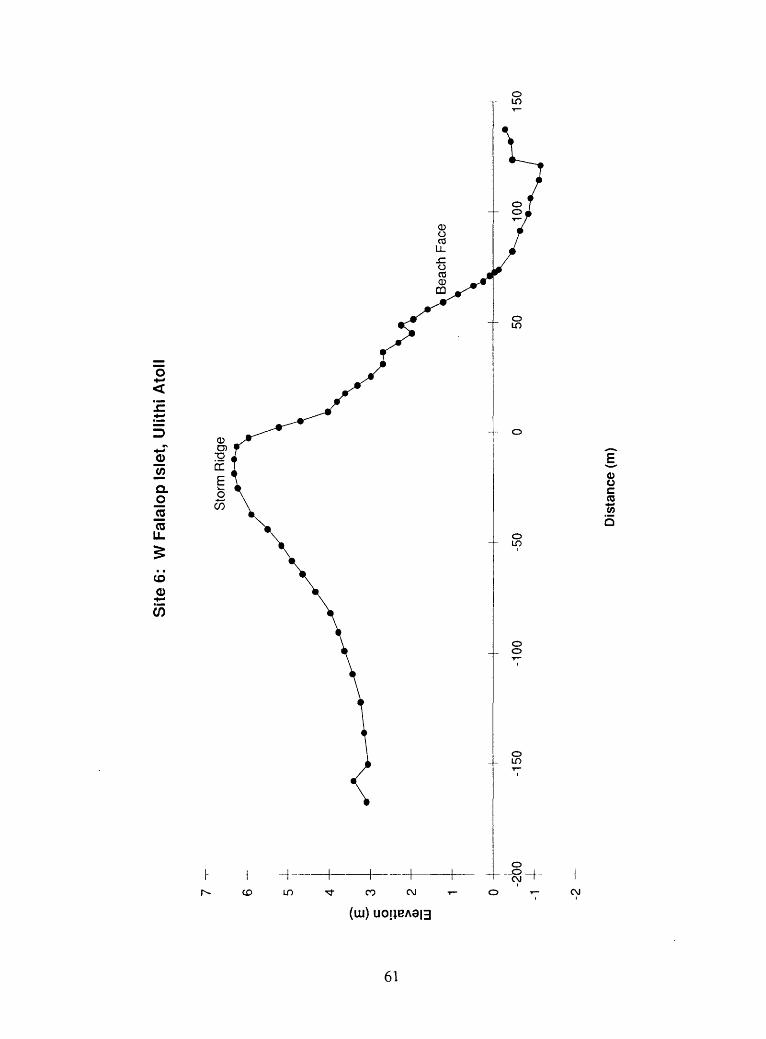
Site 6: W Falalop, Ulithi Atoll. The west coast of Falalop faces the atoll lagoon and is therefore relatively protected from large ocean swell. The reef flat is only about 80 m wide and just to the north of the profile site is a small blasted channel which provides the main boat anchorage for the islet. Extensive beachrock exposures occur between the profile site and the channel. The beach sediment is reef-derived coarse sand and fine gravel (Plate 8). This site is adjacent to the main village and population center of the islet which lie landward of a prominent beachridge.
Site 7: E Falalop, Ulithi Atoll. Eastern Falalop faces the open ocean resulting in a shoreline composed of a coral gravel beachridge. No beachrock was visible at the time of observations. The reef flat is nearly 140 m wide and is similar to Site 5 ~ a hard algal-encrusted pavement. Coral boulders are scattered over the surface (Plate 9). Landward of the beachridge is coconut woodland and the site of the island elementary school.
Site 8: Laey, SE Oilman, Yap. An east-facing, north-south trending stretch of coast located at the southern end of the main island of Yap. The shoreline is a mixture of sandy beach interrupted by mangroves, rudimentary seawalls and outcrops of volcanic rocks (Plate 10). The coastal plain in this vicinity is low-lying, broad (up to 250 m), and composed of subtle ridges of calcareous reef-derived sand. The reef does not parallel the coast here, but rather, it trends at an oblique angle in a northeast-southwest direction. Reef width ranges from about 450 m in the south to nearly 2,000 m further north, east of Likaay. This appears to be a low-energy site.
Site 9: Thabeeth, SW Oilman, Yap. This site occurs on a west-facing, north- south trending coast approximately on the opposite side of the southern peninsula from Site 8. The shoreline is dominated by mangroves which front a coastal plain of predominantly low-lying beach deposits (Plate 11). The extensive mangrove forests in this area suggest it is in a lower energy regime than the eastern side of the peninsula. The coastal plain is about 100 m wide and borders uplands of volcanic rocks. Locally built seawalls are scattered along the coast.
Site 10: Qoon, ERuul, Yap. Site 10 is a southeast-facing coastal segment on the south-central east coast of the main island of Yap. This is a low-energy site bordered by mangroves with locally built seawalls and land reclamation areas (Plate 12). The beach sediment is a carbonate/terrigenous sand mixture which becomes muddy a short distance offshore. The low-lying coast has shoreline deposits extending about 150 m inland. South of this site is an extensive area of mangrove swamp deposits. The fringing reef is about 2700 m wide in this area and is broken by a deep reef passage which passes about 450 m from the site.
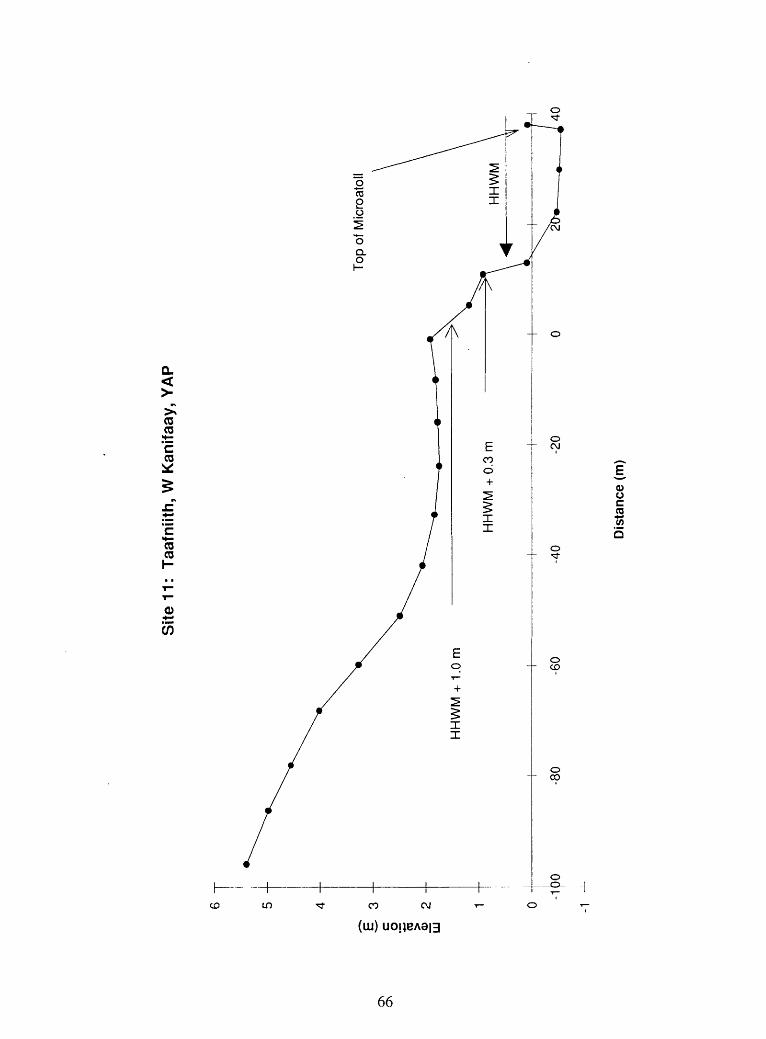
Site 11: Taafriiith, W Kanifaay, Yap. A southwest-facing site occurring along the southwest coast of the main island of Yap which is bordered mostly by mangroves (Plate
17

13). The narrow coastal plain deposits consist of coconut woodland, mangrove swamp and beachridges backed by hills of metamorphic rocks. The fringing reef is almost 1500 m wide here and trends northeast-southwest -- nearly normal to the site coastline. The reef is marked by several deep blue holes midway between the shoreline and the reef crest.
Site 12: Kanif, W Weeloey, Yap. A west-facing site on the western central coast of Yap Island composed of a low-lying coastal plain. The presence of some older beach deposits now bordered by extensive mangrove deposits (Plate 14) indicates a decrease in the energy level reaching the coast. Up to 200 m of coastal deposits flank inland metamorphic rocks. The northeast-southwest trending fringing reef is nearly 1400 m wide and is extensively riddled with blue holes (nearly 50% of the reef surface).
Site 13: Meqruur, SW Gagil-Tamil, Yap. Protected west-facing coast of Gagil- Tamil Island which faces the inner lagoon and the town of Colonia on the east coast of Yap. The shoreline consists mostly of mangrove deposits and man-made engineering structures (Plate 15). A solid-fill pier occurs at this site. The reef flat is about 200 m wide and flanks a deep reef passage. The 100-150 m wide coastal plain consists of a mixture of beach and mangrove deposits interspersed by reclaimed land.
Site 14: Gilfith, NW Fanif, Yap. This site occurs on the northwest-facing coast of northwest Yap Island. The coastal plain consists of beach deposits up to 140 m wide which alternate along the shoreline with locally constructed seawalls (Plate 16). Large mangrove forests occur to the south of the profile site. Inland of the beach, deposits are hills of metamorphic rocks. Much of the present shoreline appears to be land reclaimed by traditional methods ~ rectangular coral-block seawalls filled with earth materials. The fringing reef ranges from 800 to 1200 m wide and is characterized by a very irregular seaward margin.
IDENTIFICATION OF NON-CLIMATE CHANGE DEVELOPMENT FACTORS
Natural DevelopmentsMain Yap IslandsThere are three critical natural environments of the main Yap islands that have the
potential to be substantially affected by changes in relative sea-level position. These are: a) mangrove forests, b) beaches, and c) reefs.
A) Mangrove Forests. Mangroves generally grow intertidally in sheltered environments. They are associated with the accumulation of fine-grained sediment and are typically areas of high primary productivity. Mangroves provide a very important habitat for many reef fishes. Approximately 10 taxa (species and hybrids) of mangroves occur in Yap (Woodroffe, 1987) where they are distributed between deltas, embayments, and protected reef flats. Mangrove forests comprise about 10% of the total land area and extend along nearly 114 km of shoreline (Table I). The forests are probably stable features that have slowly expanded their territory throughout the late Holocene (the
18

period after sea level has been near its present position; approximately the last 6,000 years).
The landward extent of mangroves is the approximate spring high tide level and any potential rise in sea level would probably result in a landward expansion of the mangrove forest (Woodroffe, 1988). The change associated with a rising sea-level along mangrove shorelines is interpreted to be one of initial inundation followed by landward colonization and accompanied by minor or no erosion. A rising sea level may actually increase the area of mangrove forest if there are suitable low-lying areas landward for colonization.
B) Sand Beaches. Nearly 11 km of sand beach, mostly composed of reef-derived carbonate sediment, occurs along the shoreline of Yap. The beaches are restricted to the more exposed locations such as S and NW Yap, E Gagil-Tamil, and E and N Maap. Coastal beach deposits comprise a very small percentage of the total land area (0.25%) yet sand-rich coastal plains are the sites of most of the coastal villages. They are a very important, if not critical, component of traditional and modern settlements and culture. Because beaches are very susceptible to changes in sea-level position and are easily eroded under rising water levels, they are the most precarious natural environment on Yap in the event of accelerated sea-level rise.
C) Coral Reefs. Reefs are important for several reasons: they provide habitats for numerous fish and other food sources, they protect the coast from waves and severe storms, and, the continual natural breakdown of reefs provides sediment for beaches and other depositional systems. A number of inspection dives were made during the course of this study to examine the state of the coral reefs opposite the on-land profile sites. Visual observations indicate that overall the reefs of Yap contain healthy and diverse coral communities (see Orcutt and others, 1989, for a more complete discussion).
Coral reefs are unique in their ability to "grow" vertically under conditions of rising sea level. The rates of vertical growth for coral reefs with high coral/algal coverage can average 7 mm/yr which is adequate for them to keep pace with projected rates of sea-level rise (Buddemeir and Smith, 1988; Kinsey and Hopley, 1991). In other words, healthy reefs should be able to expand vertically with a rising sea level and perhaps extend their territory as substrates are submerged (assuming the rate of submergence is not too great or over very long time periods).
Ulithi AtollThe islets of Ulithi Atoll have the potential to be severely affected by ASLR
because of their open exposure and low elevations (they are generally less than 5 m above sea level). Unlike the main Yap Islands or the high limestone island of Fais there is no higher ground for relocation. However, atoll islets are constructed primarily through the action of extreme events which deposit reef debris above "normal" tidal limits, therefore an increase in storminess and/or an increase in carbonate productivity could lead to an increase in material available for islet building. If ASLR is below the rate at which reefs can sustain vertical growth, and it appears the IPCC scenarios are below this value, then it is possible that some atoll islets should be able to continue vertical accumulation. As noted by Richmond (in press), atoll islets may have varying
19

responses to ASLR depending upon their location within the atoll and geologic history. For example, islets formed at convex bends of the atoll reef rim are typically large with good soil development, they have relatively stable shorelines, they are the sites of the oldest and largest settlements, and importantly, they derive their sediment from a number of directions and sources within the atoll. Islets at convex bends may be more stable under rising sea levels than other islets within the atoll system.
Three islets were visited at Ulithi Atoll: Falalop, Mogmog, and Yasor. Coastal profiles and descriptions for three sites on Falalop are given in the site description section. Both Mogmog and Yasor Islets are asymmetrical in cross-section and sediment characteristics. They are composed of steep, high (5 + m), gravel beach ridges along their open ocean shores whereas lower sand beach ridges comprise their more protected lagoon shorelines. The settlements are located along the lagoon shores and it is estimated that they lie 2 m or more above the reef flat surface (approximate MSL position). Although many of the inhabitants were aware of potential sea-level rise, of more immediate concern to them is the presence of several rusting remnants of WWII landing platforms creating a safety hazard and possibly affecting longshore drift and increasing shoreline erosion (Plate 17).
FaisThe high limestone island of Fais was briefly visited - no inspection of the shore
was undertaken. As viewed from the air, the beaches appeared to be composed of carbonate sediment, presumably for the most part derived from the adjacent reefs rather than from breakdown of the limestone cliffs. The settlements are located on beach ridges of the narrow coastal plain and are therefore subject to potential land loss under ASLR scenarios. Although there is higher land available for relocation, the uplifted limestone is a markedly different foundation than the present coastal plain sediment. It is possible however, that reef expansion and subsequent coastal plain sedimentation and growth could continue under conditions of ASLR.
PHYSICAL CHANGES AND NATURAL SYSTEMS RESPONSES TO ASLR
Assessment of Physical ChangesColonia. The twelve coastal profiles collected from the Colonia area are used to
show the present mean sea-level position (the average MSL during the study period), the present level of the higher high tide level (HHTL), the projected spring high water levels at the 0.3 m and 1.0 m high sea-level positions (HHTL+0.3 and HHTL+l.OOm respectively), and the high water level under an arbitrarily chosen storm surge of 2.0 m (HHTL+2.00m). With the exception of one profile site (site 4: reclaimed land west of the police station), the projected ASLR scenario water levels do not overtop existing structures (Table VI). At site 4, a portion of the reclaimed land would be submerged at the +1.0 m sea level at high tide. It should be stressed that these water levels are "still water levels" and do not take into account any increased water levels due to the presence of waves, the passage of storms, or low-frequency variations in water level. Because most of the Colonia shoreline is stabilized by some type of engineering structure, "Bruun Rule" (Bruun, 1962) method of shoreline retreat due to erosion is inhibited or not strictly
20

applicable as originally proposed and simple inundation is the probable mechanism of change.
The freeboard (area above the high tide level) of existing structures under the +1.0 m sea-level scenario is very low, generally less than 1.0 m (Table VI). With this low amount of freeboard the effects of storms on coastal flooding and wave overtopping should be dramatically increased. Although most of the Colonia area appears to be above the projected +1 m stillwater msl, the effects of storms on shoreline erosion and coastal flooding can be expected to increase significantly.
COLONIA PROFILE
01234567891011
Range
ELEVATION RANGE(m above sea level)
2.05-2.0 - 2.9
2.3 - 2.951.75 - 2.251.4- 1.53.0-3.71.65- 1.82.3 - 2.5
1.91.7- 1.82.4 - 2.6
3.4+1.4-3.7
FREEBOARD AT+l.Omasl
0.50.4
0.750.2
-0.150.450.150.80.40.20.9
1.05+-0.15-1.05
SHORELINE RECESSION
(m)<1<12.52
324
1.54
1.5<1
1<1
<l-32
Table VI. Summary of profile elevation data for the Colonia area. The profiles are shown in Appendix I. The shoreline recession values are based on landward shift of shoreline position due to simple inundation of existing profiles under calm sea conditions.
Sand Coastal Plains. The low-lying coastal plains, which are the sites of many of the coastal settlements, are particularly vulnerable to sea-level rise. Beaches, which act as a natural buffer, protect the coast during storms through beachface erosion and transportation of sediment offshore. During a rising sea level, material is transported offshore from the beach and the shoreline recedes landward in an effort to maintain a profile of equilibrium (the "Bruun Rule"). The landward displacement of the shoreline is a complex function of the initial profile shape, grain size, and nearshore wave and current characteristics. Bruun's Rule theoretically applies to depositional coastlines where the bed material is movable to the maximum depth of sediment movement (Bruun, 1962; 1983) and therefore it does not strictly apply to reef environments where much of the nearshore bed is a coral/algal pavement. A simplified equation of the Bruun Rule for estimating the width of beach erosion (W) in the beach and nearshore zone is:
21
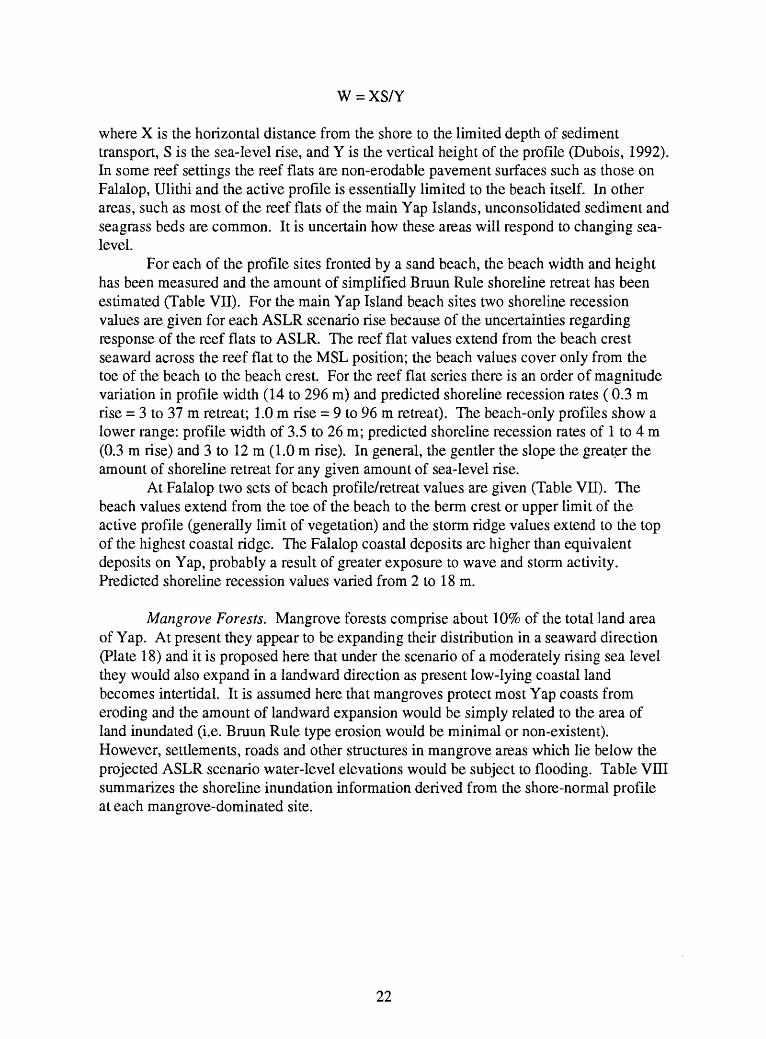
W = XS/Y
where X is the horizontal distance from the shore to the limited depth of sediment transport, S is the sea-level rise, and Y is the vertical height of the profile (Dubois, 1992). In some reef settings the reef flats are non-erodable pavement surfaces such as those on Falalop, Ulithi and the active profile is essentially limited to the beach itself. In other areas, such as most of the reef flats of the main Yap Islands, unconsolidated sediment and seagrass beds are common. It is uncertain how these areas will respond to changing sea- level.
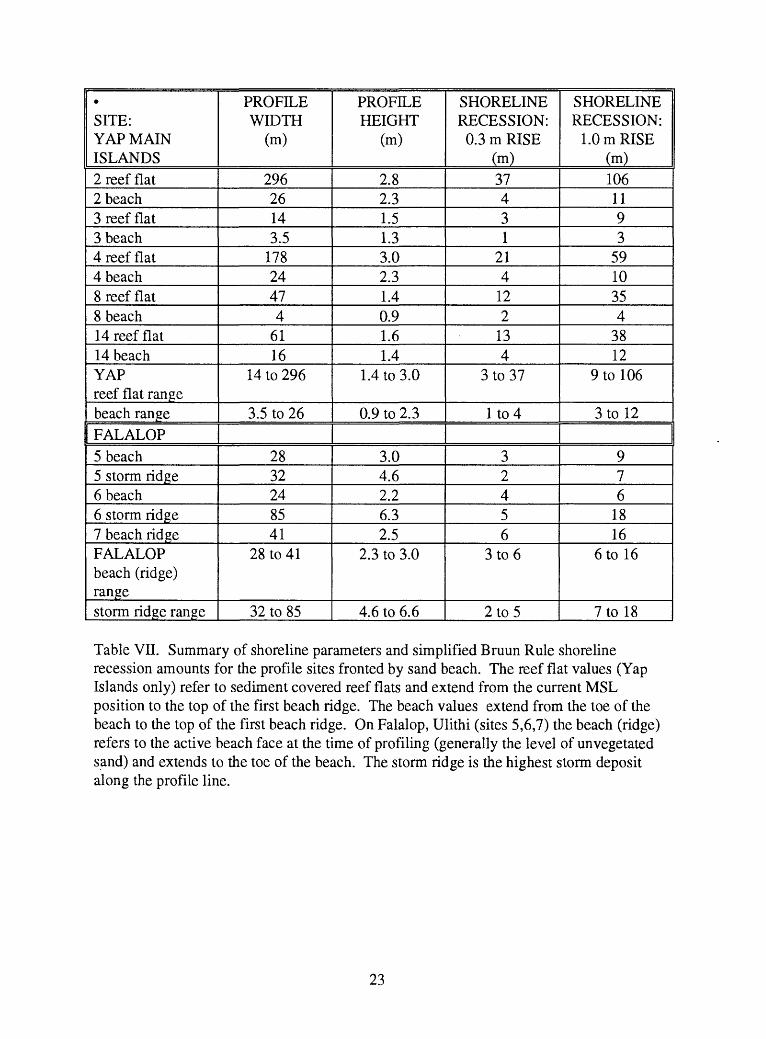
For each of the profile sites fronted by a sand beach, the beach width and height has been measured and the amount of simplified Bruun Rule shoreline retreat has been estimated (Table VII). For the main Yap Island beach sites two shoreline recession values are given for each ASLR scenario rise because of the uncertainties regarding response of the reef flats to ASLR. The reef flat values extend from the beach crest seaward across the reef flat to the MSL position; the beach values cover only from the toe of the beach to the beach crest. For the reef flat series there is an order of magnitude variation in profile width (14 to 296 m) and predicted shoreline recession rates (0.3 m rise = 3 to 37 m retreat; 1.0 m rise = 9 to 96 m retreat). The beach-only profiles show a lower range: profile width of 3.5 to 26 m; predicted shoreline recession rates of 1 to 4 m (0.3 m rise) and 3 to 12 m (1.0 m rise). In general, the gentler the slope the greater the amount of shoreline retreat for any given amount of sea-level rise.
At Falalop two sets of beach profile/retreat values are given (Table VII). The beach values extend from the toe of the beach to the berm crest or upper limit of the active profile (generally limit of vegetation) and the storm ridge values extend to the top of the highest coastal ridge. The Falalop coastal deposits are higher than equivalent deposits on Yap, probably a result of greater exposure to wave and storm activity. Predicted shoreline recession values varied from 2 to 18m.
Mangrove Forests. Mangrove forests comprise about 10% of the total land area of Yap. At present they appear to be expanding their distribution in a seaward direction (Plate 18) and it is proposed here that under the scenario of a moderately rising sea level they would also expand in a landward direction as present low-lying coastal land becomes intertidal. It is assumed here that mangroves protect most Yap coasts from eroding and the amount of landward expansion would be simply related to the area of land inundated (i.e. Bruun Rule type erosion would be minimal or non-existent). However, settlements, roads and other structures in mangrove areas which lie below the projected ASLR scenario water-level elevations would be subject to flooding. Table VIII summarizes the shoreline inundation information derived from the shore-normal profile at each mangrove-dominated site.
22
SITE: YAP MAIN ISLANDS2 reef flat2 beach3 reef flat3 beach4 reef flat4 beach8 reef flat8 beach14 reef flat14 beachYAP reef flat rangebeach rangeFALALOP5 beach5 storm ridge6 beach6 storm ridge7 beach ridgeFALALOPbeach (ridge) rangestorm ridge range
PROFILE WIDTH
(m)
29626143.5
17824474
6116
14 to 296
3.5 to 26
2832248541
28 to 41
32 to 85
PROFILE HEIGHT
(m)
2.82.31.51.33.02.31.40.91.61.4
1.4 to 3.0
0.9 to 2.3
3.04.62.26.32.5
2.3 to 3.0
4.6 to 6.6
SHORELINE RECESSION:
0.3 m RISE(m)37431
214
122
134
3 to 37
Ito4
32456
3 to 6
2 to 5
SHORELINE RECESSION:
1.0 m RISE(m)1061193
5910354
3812
9 to 106
3 to 12
976
1816
6 to 16
7 to 18
Table VII. Summary of shoreline parameters and simplified Bruun Rule shoreline recession amounts for the profile sites fronted by sand beach. The reef flat values (Yap Islands only) refer to sediment covered reef flats and extend from the current MSL position to the top of the first beach ridge. The beach values extend from the toe of the beach to the top of the first beach ridge. On Falalop, Ulithi (sites 5,6,7) the beach (ridge) refers to the active beach face at the time of profiling (generally the level of unvegetated sand) and extends to the toe of the beach. The storm ridge is the highest storm deposit along the profile line.
23

SITE: YAP MAIN ISLANDS
9 / Thabeeth10 / Qoon
11/Taafniith12 / Kanif
13/Meqruur
SHORELINE INUNDATION 0.3 m RISE (m)
-7-4-1
-130
SHORELINE INUNDATION 1.0m RISE (m)
-10-75-10-79-57
Table VIII. Estimated change in shoreline position (negative numbers indicate a landward shift) for the two ASLR scenarios based on inundation only - i.e.no erosion. These are the coastal sites which are dominated by mangroves. The zero value at site 13 is related to a vertical seawall in which no overtopping is predicted.
Assessment of Natural System Responses and Remaining Damages
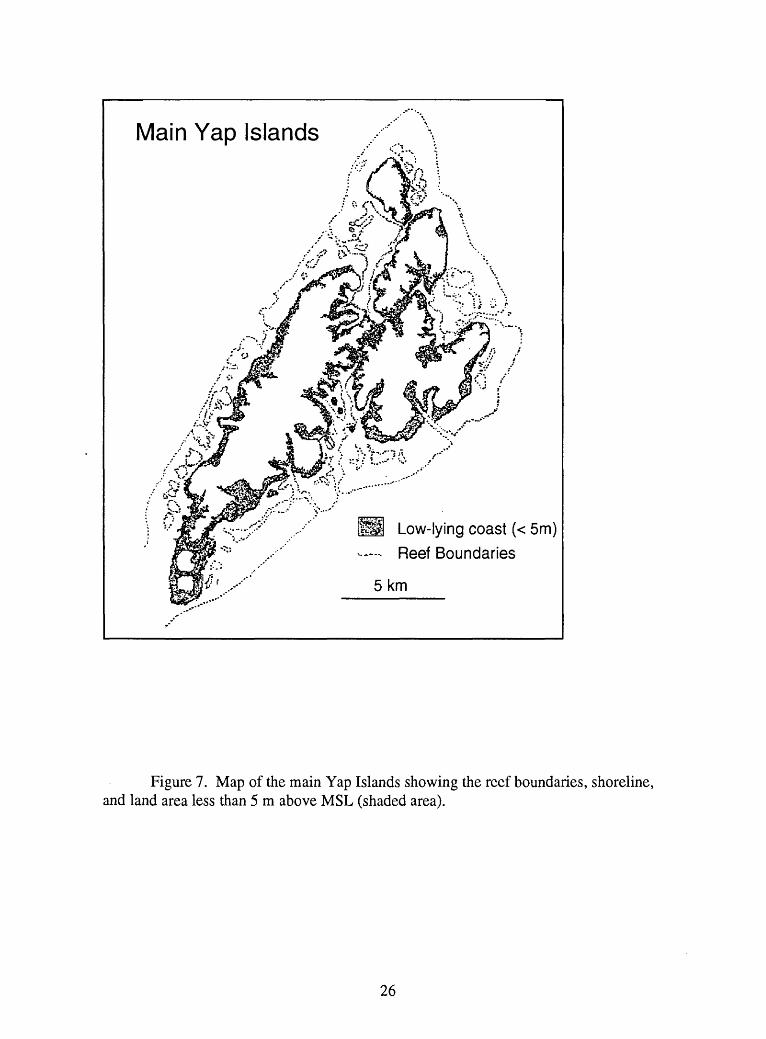
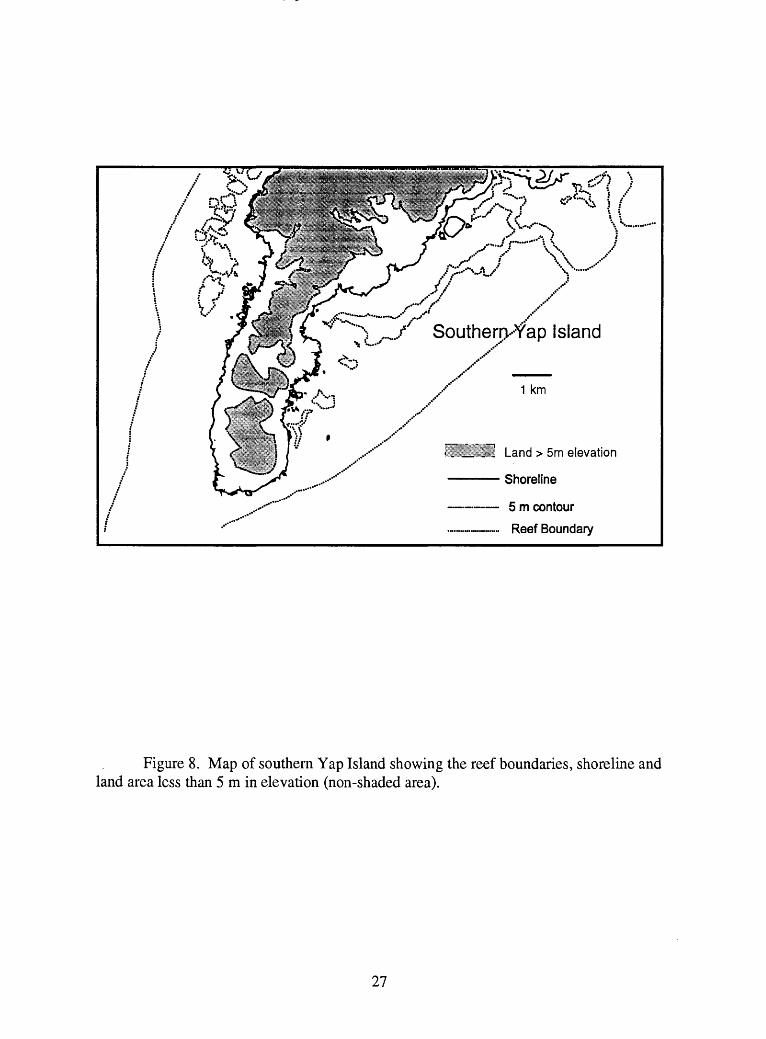
There are many unknowns regarding the potential effects of accelerated sea-level rise on natural systems. Table IX presents estimated maximum shoreline changes for mangrove and sand shorelines in Yap. These are considered maximum values because the maximum estimated recession value for each shoreline type was used, and, no landward limits of recession due to the presence of bedrock, engineering structures, or coastal plain extent are applied. Under our current state of knowledge these can be considered worst-case scenarios. Figure 7 shows the area of low-lying land (< 5 m) for the main Yap Islands and Figure 8 shows the low-lying southern portion of Yap Island, an area particularly susceptible to ASLR inundation.
The mangrove forests will, in all likelihood, expand landward under a rising sea level, therefore, even though the shoreline may recede the area of mangroves will increase assuming they do not erode on their seaward margins. The 15% and 91% estimated increase in mangrove forests (Table IX; ASLR scenario I and n respectively) above the present areas may be an overestimate by 50% or more primarily because there may not be low-lying land for the forests to advance over. In addition, it is not clear if mangrove forests can maintain their present seaward limit during rapid inundation. For example, it has been shown in the Bahamas under conditions of moderately rapid sea- level rise (>2.8 mm/yr), dieback and erosion of the seaward mangrove margin has occurred (Ellison, 1993). However, field evidence in Yap indicating extensive mangrove retreat, such as stranded stumps, dieback, and scarp formation was not observed during the course of this study. Until further research is conducted it is not clear what the response of the Yap mangrove forests will be to ASLR, but for the purposes of this study we are assuming there will be negligible dieback.
The potential loss of sand shoreline is a major concern because there is only a small amount present and they are the sites of many important coastal settlements. Local-based land reclamation and shoreline protection projects have been an ongoing activity within traditional Yapese settlements (Plate 19). Yapese men's houses are typically constructed on reclaimed land on the coast. Seawalls constructed of hand-fitted
24

coral blocks collected from adjacent reefs are commonplace. The sand shoreline recession values in Table IX are the maximum beach (toe of beach to top of the beach ridge) values for the beach sites in Table VII. The beach values are used here instead of the reef flat values because it is unclear how the reef flats will respond to a rising sea level whereas the beaches are expected to erode according to the Bruun Rule. The reef flats may aggrade vertically through increased carbonate production as substrates are submerged increasing the area available for carbonate-producing organisms.
Recent tide-gauge data from Colonia indicate a relative sea-level rise of 6 mm/yr from 1975 to 1990 (TOGA Sea-Level Center, Univ. of Hawaii, from written commun. S.S. Anthony, USGS, Honolulu, 1993) which is much higher than the Pacific Basin average of approximately 1 mm/yr (Wyrtki 1990). Most of this relative rise is probably due to tectonic subsidence of the main Yap Islands. Although caution should be exercised in extrapolating relatively short-term tide-gauge data to long-term tectonic trends because of potential errors caused by low-frequency sea-level variations which are not recorded in short records, morphologic evidence on Yap, such as extensive shallow submerged reef flats, drowned valleys, and armored shorelines is consistent with recent submergence. Based on rapid sea-level changes over the last 15 years, Yap may be an ideal natural laboratory where the effects of accelerated sea-level rise can be studied .
Shoreline Distance (km)
Maximum Recession with 0.3 m RiseMaximum Area Change (km2)Percent Change
Maximum Recession with 1.0m RiseMaximum Area Change (km2)Percent Change
YAP MANGROVE SHORELINE
114
-13
+1.48
+15%
-79
+9.01
+91%
YAP SAND SHORELINE
10.8
-4
-0.043
-18%
-12
-0.13
-54%
Table IX. Estimated maximum amounts of areal change under the two different ASLR scenarios. Although the shoreline is expected to recede in mangrove areas the actual size of mangrove forests is expected to increase (hence negative numbers for shoreline recession and positive numbers for areal change in mangroves). Shoreline recession along sand beaches is expected to result in a net land loss.
25
Main Yap Islands
Hi Low-lying coast (< 5m) - Reef Boundaries
5 km
Figure 7. Map of the main Yap Islands showing the reef boundaries, shoreline, and land area less than 5 m above MSL (shaded area).
26
^ ,./ Southerryfap Island
Land > 5m elevation
Shoreline
5 m contour
. Reef Boundary
Figure 8. Map of southern Yap Island showing the reef boundaries, shoreline and land area less than 5 m in elevation (non-shaded area).
21

CONCLUSIONS AND RECOMMENDATIONS
Priority Setting on Vulnerable AreasThere are three vulnerable areas that are considered priorities under ASLR
scenarios:1) Colonia lowlands. The largest and most important coastal infrastructure
development in Yap State is in the greater Colonia area. Although much of the Colonia shoreline is bordered by engineering structures, many of those structures are barely above ASLR scenario still-water levels and are likely to incur damage through direct wave attack, undermining, and overtopping. A number of construction types of variable quality occur --if a particular section of poorly built seawall should fail, adjacent sections could be subject to accelerated damage.
2) Sand Coastal Plains. The loss of low-lying coastal sand plains, which are typically fronted by sand beaches, could have a dramatic effect on current settlement patterns on the main Yap Islands. Unprotected sand beaches are considered highly vulnerable to ASLR and armoring of sand shorelines could lead to undesirable side- effects such as accelerated erosion of unprotected shorelines.
3) Outer island atoll islets and reef islands. The low-lying landmasses of the outer islands are particularly susceptible to ASLR because there is no higher ground available for relocation. The potential effects on these types of islands has been described by Woodroffe and McLean (1992) and can summarized as follows:
a) Bruun Rule response where sediment from the beach face is eroded and deposited offshore, in this case over the adjacent reef flat, resulting in an overall reduction in island size.
b) Equilibrium response which is similar to the Bruun response except that some sediment is transported landward to the beach ridges maintaining a balance in islet size.
c) Continued growth through increased sediment production of adjacent reefs and deposition of that sediment onto the islets.
At present it is not possible to quantify which of these responses is the most likely, but it is conceivable that each type of response can occur depending upon local conditions.
Summary Statements
1) Low-lying areas of Yap State can be expected to be adversely affected by ASLR, particularly the +1.0 m scenario. However, available baseline data and the small amount of data collected during the course of this study is not sufficient to adequately quantify ASLR effects and many of the conclusions reached here are best estimates based on current information.
2) Sand beaches and adjacent sand-rich coastal plains of the main Yap Islands are most likely to suffer the greatest amount of erosion, possibly losing up to 50% of their
28
current area under the +1.0 m ASLR scenario. Many of these coastal plains are the sites of existing villages and family housing.
3) Most shoreline engineering structures in the Colonia area appear to have enough still-water freeboard to remain above the ASLR scenario levels, however the negative effects of storms and tsunamis can be expected to be more frequent and severe under conditions of higher sea level. Poorly designed and constructed seawalls and revetments will most likely undergo significant modification.
4) It is proposed that Yap coastal mangrove forests will undergo little retreat and may actually expand their territory as low-lying land is inundated under rising sea-level (assuming there will be little or no dieback along their seaward margins).
5) Tide-gauge records for Colonia over the last 15 years indicates a relative sea- level rise of 6 mm/yr (2 mm/yr eustatic and 4 mm/yr tectonic; S.S. Anthony, USGS Honolulu, written commun., 1993). Any "greenhouse" induced ASLR would compound the effects of an existing local relative sea-level rise. Detailed studies of recent sea-level changes in the main Yap Islands could provide an improved understanding of the effects of sea-level rise on tropical shores.
6) Atoll islets and reef islands of Yap State are low-lying landforms with no high ground available for relocation in the event of significant coastal erosion. Possible responses of these reef-dominated coasts to ASLR include: accelerated Bruun Rule erosion, equilibrium condition of little net change, and continued growth due to increased carbonate production.
Suggested Additional Studies
In order to quantify potential changes associated with ASLR several types of data need to be collected, analyzed, and interpreted. Because the ASLR scenario changes are of relatively small amplitude (~ 1.0 m) detailed topographic information is required to adequately assess inundation areas. Currently available topographic maps for the main Yap Islands show the shoreline and the 5 m contour is the first contour. Topographic maps for the outer islands are not readily available or nonexistent. Problems regarding datums and absolute MSL position need to be resolved as well. The collection of accurate coastal profile data for 14 sites during this study greatly enhanced our ability to characterize the Yap coastal zone.
The response of natural systems to ASLR is highly speculative at present. Of particular importance to Yap State would be research into the response of mangrove forests and coral reefs to ASLR. An understanding of the Holocene history of these environments would provide the framework in which to examine past sea-level changes and the corresponding response of the natural system.
29

ACKNOWLEDGMENTS
Ben Mieremet of NOAA/NOS was instrumental in the logistic planning of the survey and assisted throughout much of the data collection effort. Stephen Anthony (USGS/WRD Honolulu) and Greg Ikehara (USGS/WRD Guam) provided information on the water resources and tides of Yap. John Sogalith, Chief of the Division of Planning in Colonia was our primary contact during the survey. Numerous people assisted with data collection and provided background information, these include: John Waayan and Sebastian L. Anefal from the Office of Planning and Budget; Martin Falanug and John Kentun of the Weather Service Office; Moses Ngirmekur surveyor for Land Resources; John lou and Barry Goldman from the Marine Resources Management Division of the Department of Resources and Development; James Gilmar, Director of the Department of Resources and Development; James Sarmog from PUC; and Kenmed from the Pilung Council. Accommodations and support on Falalop, Ulithi Atoll were kindly provided by John Rulmal and family. The above are greatly appreciated for their support and assistance to the survey team.
REFERENCES CITED
Ashby, G (ed.), 1985. Micronesian Customs and Beliefs. Rainy Day Press, Kolonia, Pohnpei, FSM, revised edition, 245 pp.
Bruun, P., 1962. sea-level rise as a cause of shore erosion. Am. Soc. Civ. Eng. Proc., Jour. Waterways and Harbors Div., 88:117-130.
Bruun, P., 1983. Review of conditions for uses of the Bruun rule of erosion. Coastal Engineering, 7:77-89.
Buddemeir, R.W. and Smith, S.V., 1988. Coral reef growth in an era of rapidly rising sea level: predictions and suggestions for long-term research. Coral Reefs, 7:51- 56.
Dubois, R.N., 1992. A re-evaluation of Bruun's Rule and supporting evidence. Jour. Coast. Res., 8:618-628.
Ellison, J.C., 1993. Mangrove retreat with rising sea-level. Estuarine, Coastal and Shelf Science, 37:75-87.
Gillett, R., 1987. Traditional tuna fishing: a study at Satawal, Central Caroline Islands. Bishop Museum Bull, in Anthropology 1,48 pp.
Hawkins, J., and Batiza, R., 1977. Metamorphic rocks of the Yap arc-trench system. Earth and Planetary Sci. Letters, 37:216-229.
30

Intergovernmental Panel on Climate Change, 1991. The seven steps to the assessment of the vulnerability of coastal areas to sea-level-rise a common methodology. Draft Report, Sept. 1991, 27 pp., 3 app.
Johnson, C., Alvis, R., Hetzler, R., and Blumenstock, D., 1960. Military geology of the Yap Islands, Caroline Islands. Intelligence Div., Office of the Engineer, H.Q., U.S. Army Pacific, APO 958, 160 pp.
Kinsey, D.W. and Hopley, D., 1991. The significance of coral reefs as global carbonsinks response to Greenhouse. Palaeogeog., Palaeoclim., Palaeoecol., 89:363- 377.
Nugent, L.E., 1946. Coral reefs in the Gilbert, Marshall, and Caroline Islands. Geol. Soc. Amer. Bull., 57:735-780.
Orcutt, A.E., Cordy, R., Rappa, P., and Smith, B., 1989. Yap proper coastal resource inventory. Prepared for U.S. Army Corps of Engineers, Pacific Ocean Division, Ft. Shafter, Hawaii, 356 pp.
Richmond, B.M., 1992. Development of atoll islets in the central Pacific. Proc. 7th International Coral Reef Symp., Agana Guam, pp 1185-1194.
Shade, P.J., Anthony, S.S., and Takasaki, K.J., 1992. Ground-water resourcesreconnaissance of the Yap Main Islands, Federated States of Micronesia. USGS Water Resources Invest. Rep. 90-4074, 70 pp.
Tracey, J.I., Abbott, D.P., and Arnow, T., 1961. Natural history of Ifaluk Atoll: Physical environment. Bernice P. Bishop Museum Bull. 222, 75 pp.
Woodroffe, C.D., 1987. Pacific island mangroves: Distribution and environmental settings. Pacific Science, 41:166-185.
Woodroffe, C.D., 1988. Mangroves and sedimentation in reef environments: indicators of past sea-level changes, and present sea-level trends? Proc. Sixth Int. Coral Reef Symp., 3: 535-539.
Woodroffe, C.D. and McLean, R.F., 1992. Kiribati vulnerability to accelerated sea-level rise: a preliminary study. Report using the IPCC Common Methodology for assessing vulnerability to sea-level rise. 82 pp.
Wyrtki, K., 1990. Sea level rise: the facts and the future. Pacific Science, 44:1-16.
31

Plate 1. Oblique aerial photograph of the high limestone island of Fais showing a shoreline alternating between carbonate sand beach and vertical limestone cliffs. View to the northeast.
^^^ ^^^^^^^^^^^M^^^^^^^^^^^^^^^^^^^^^^^^^^^^^^^^^^^^^^^^^^^^^^^^^^^^^^^^^^^^^^^^^^^^^^^^^^^^^^^^^^^^^^^^^^^^^H
Plate 2. Oblique aerial photograph of Falalop, an islet on the reef rim of Ulithi Atoll. The reef flats, reef crest (zone of breaking waves) and shallow submerged reef is clearly visible. View to the northwest.
32
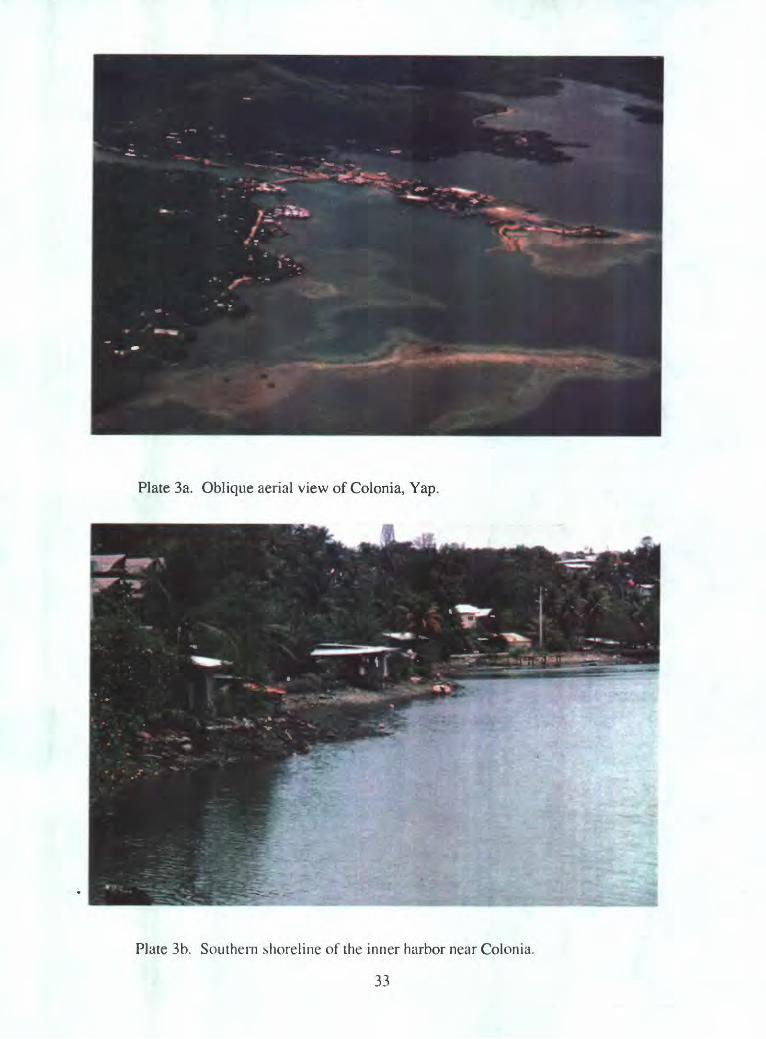
Plate 3a. Oblique aerial view of Colonia, Yap.
Plate 3b. Southern shoreline of the inner harbor near Colonia.
i 33

Plate 4. View from the reef flat towards the shoreline at Wachaelaeb, E Maap, Yap. Seagrass beds are in the foreground, a stone fish trap is in the middle, and the sandy shoreline and men's meeting house in the background.
Plate 5. Shoreline at site 3, Wanyaan, E Gagil-Tamil, Yap. View to the south showing carbonate sand beach in the foreground and mangroves in the background. A small delta extends across the reef flat opposite a small stream (Center).
34

Plate 6. Shoreline and inner reef flat at site 4, Yyin, NW Fan if, Yap. Carbonate sand beach with reef flats covered by sand (foreground) and seagrass (background). View to the south.
Plate 7. View to the east of site 5, N Falalop, Ulithi Atoll. Waves are breaking on the reef crest. The reef flat is mostly a hard pavement surface covered by an algal veneer. The toe of the beach appears to be a cemented storm-deposit remnant overlain by a beach face of coarse, reef-derived rubble.
35
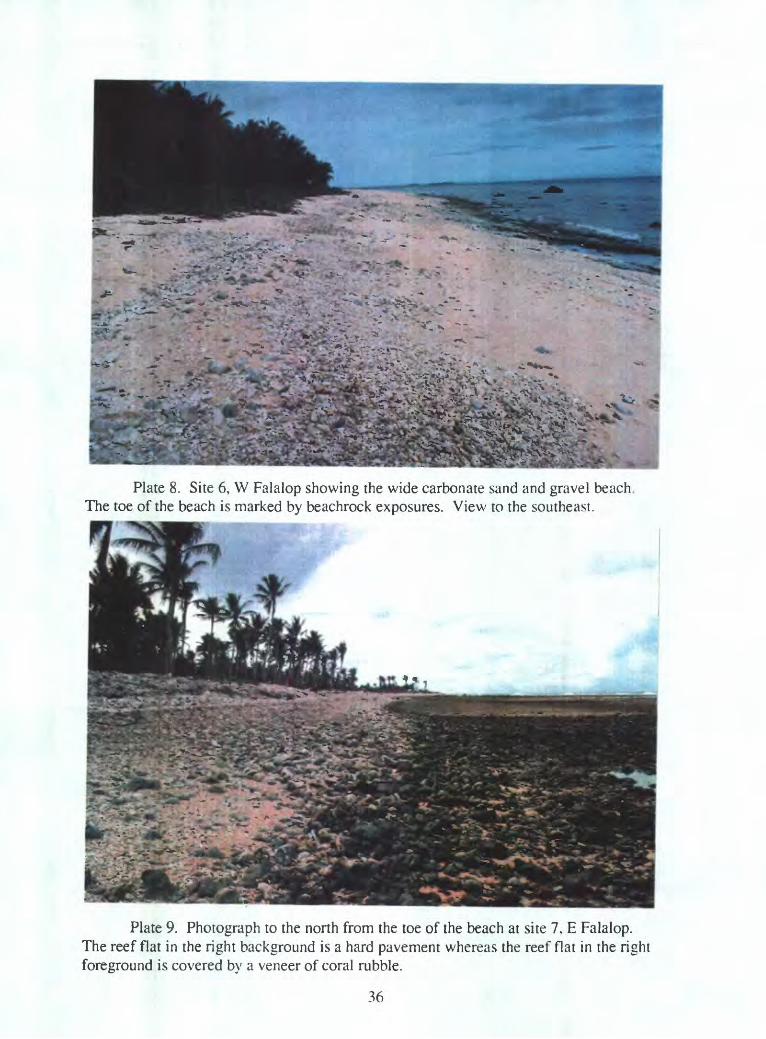
Plate 8. Site 6, W Falalop showing the wide carbonate sand and gravel beach. The toe of the beach is marked by beachrock exposures. View to the southeast.
Plate 9. Photograph to the north from the toe of the beach at site 7. E Falalop. The reef flat in the right background is a hard pavement whereas the reef flat in the right foreground is covered by a veneer of coral rubble.
36

Plate 10. Site 8, Laey, SE Oilman, Yap, showing a sandy shoreline bordered by a rudimentary rubble wall. View to the north.
Plate 11. Men's house foundation and general ground surface at 2 m above sea level at site 9, Thabeeth, SW Oilman, Yap. View to northwest.
37

Plate 12. Southeast view from the shoreline at site 10, Qoon, E Ruul. Yap. A locally built seawall is visible to the left and mangroves are present on the right and offshore. The shoreline sediment is mostly terrigenous.
Plate 13. Mangrove shoreline at site 11, Taafniith, W Kanifaay, Yap. View to southeast.
38
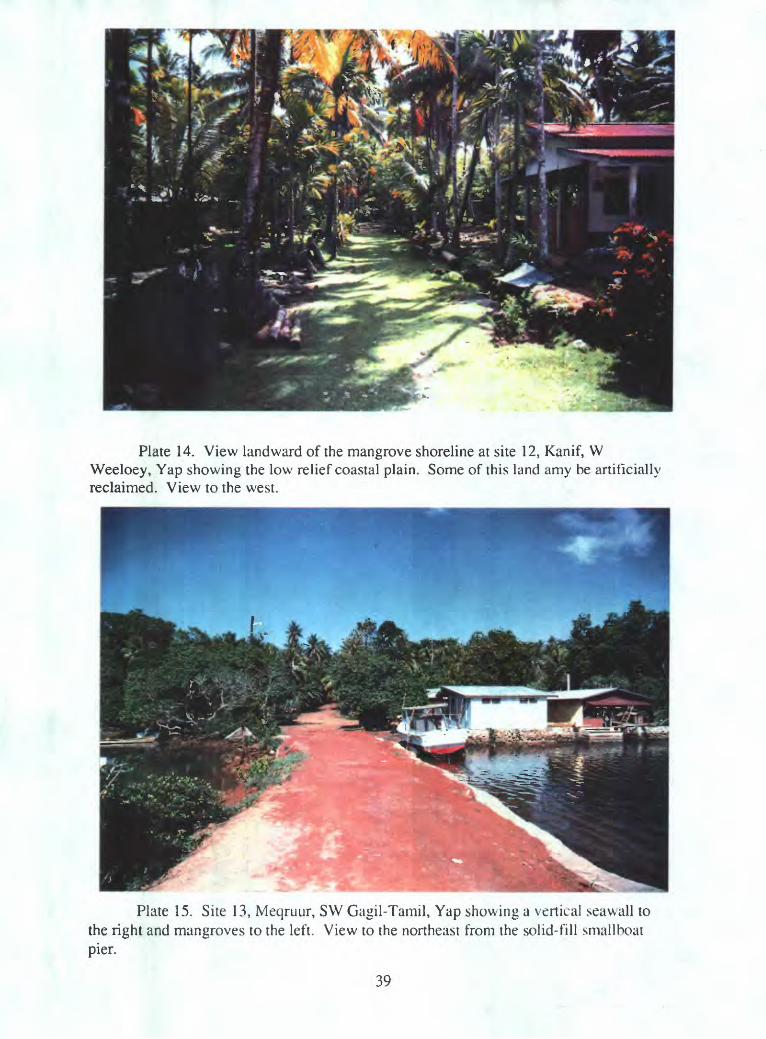
Plate 14. View landward of the mangrove shoreline at site 12, Kanif, W Weeloey, Yap showing the low relief coastal plain. Some of this land amy be artificially reclaimed. View to the west.
Plate 15. Site 13, Meqruur, SW Gagil-Tamil, Yap showing a vertical seawall to the right and mangroves to the left. View to the northeast from the solid-fill smallhoat pier.
39

Plate 16. View from the main coastal road toward the shoreline (sand beach) at site 14, Gilfith, NW Fanif, Yap.
Plate 17. Rusted remnant of a WW II landing platform along a lagoon shoreline, Ulithi Atoll. Note the unconsolidated carbonate beach sand and gravel to the east (foreground) and winnowed rubble pavement to the west (background) of the platform.
40 .
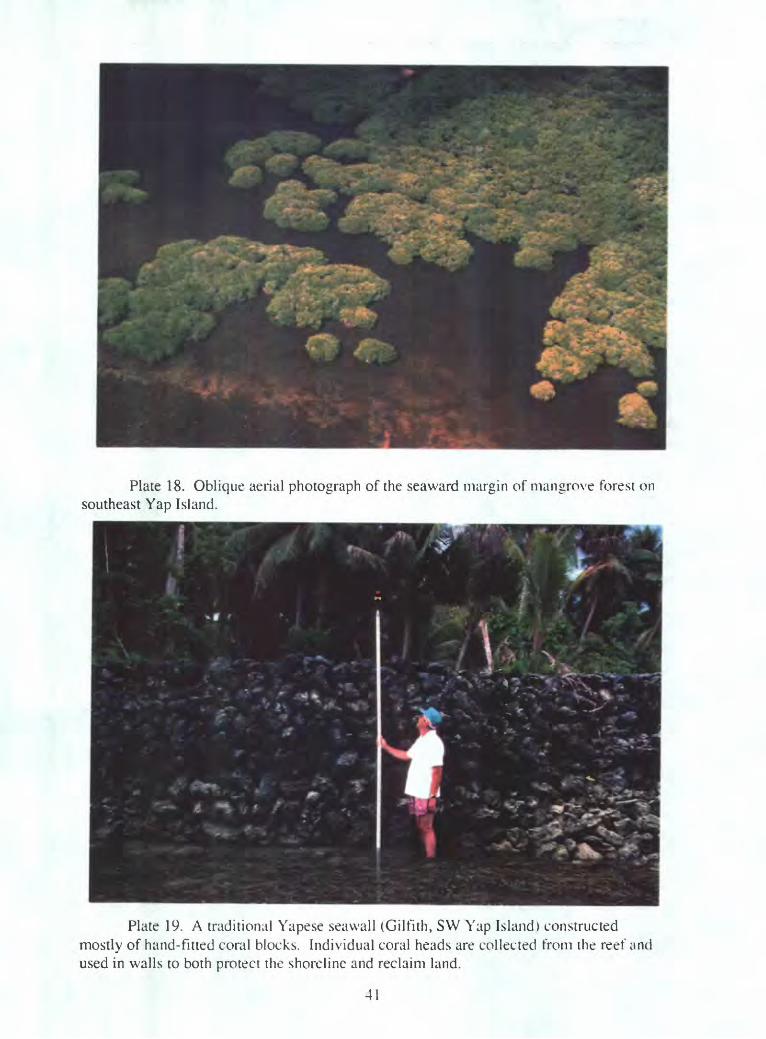
Plate 18. Oblique aerial photograph of the seaward margin of mangrove forest on southeast Yap Island.
Plate 19. A traditional Yapese seawall (Gilfith, SW Yap Island) constructed mostly of hand-fitted coral blocks. Individual coral heads are collected from the reef and used in walls to both protect the shoreline and reclaim land.
41
APPENDIX I
COLONIA COASTAL PROFILES
Plan view of all profile locations for Colonia; see Figure 6 for map locations. The X and Y coordinate values are arbitrary and based on the location of the profiling instrument at the time of surveying (coordinates X = 0, Y = 0: located on bridge).
Plan view and profile cross section for the 12 individual profiles. The small circles represent individual data points. The tide levels are determined from NOAA tide gauge data. MSL - mean sea level; HHTL = higher high tide level (spring tide level). The ASLR scenario water levels are shown as HHTL +0.3 m and HHTL + 1.0 m. The storm surge level is an arbitrary value illustrating a potential storm water level of + 2.0 m above HHTL.
42

800
700
Colonia, Yap, FSM 30 June, 1992
SN7
I ' ' ' I ' ' ' I ' ' ' I
SN6
60C
500 SN8
ed
400
300
200
100
SN9
SN5
SN4
SN3
0SN10\ Bridge
. SN2
-100
-200
-300
-400
SNll
I ... I ... I ... I
-500 -400 -300 -200 -100 0
X Values (meters)
43
\SN1
- SNO
100 200

Colonia Tide Gauge Station Profile Colonia, Yap, FSM
30 June, 1992C ~ A Planimetric View 370 i i i . i i . i i . . . i
cti
>
SNO
-369 r
-368 -
-367
-366
-365
-364
-363
-362
-361
360 l'i i . i I i . i . I i i i i I i . i I i . . i I i i i i I i i i i I i i i t I i i i I i i t I i i i i I i t I i i i i I i i i I i i i i"
82 83 84 85 86 87 88 89 90 91 92 93 94 95 96 97
X Values (meters)
Profile View
en
CO >
S
*t
3
^
1
0
1
_l . l . | , , l . , . l l l | , , , l , , l l , , , , , , | l l l | l l ,,,,.. , , l , l | , , , . | l , . , | , l ii | 1 1 r , | , ,
] HHTL -f 2.00m (storm surge)SNO
K- . . o
i / HHTL -f 1.00m
- i HHTL -f 0.3 ,m: HHTL
MTL
t VE=1X ~. . , . f , , , , l , , , , i , , , , i , , , , l , , , , l , , , , l , , , , l , , , , l , , , , l , , , , l , , , , l , , , , l , , , , l , ,
-
-~*
--
-
-
-14 -13 -12 -11 -10 -9 -8 -7 -6 -5 -4 -3 -2 -1 0
Distance Along Profile (meters)
44
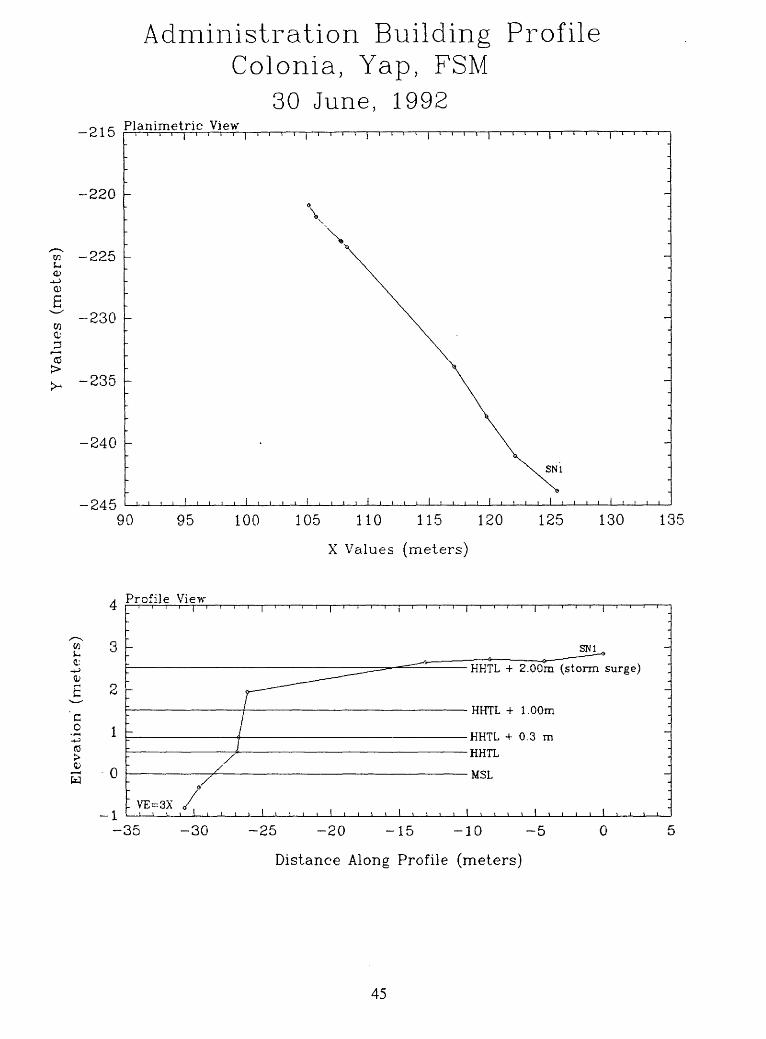
Administration Building Profile Colonia, Yap, FSM
30 June, 199201 f- Planimetric View
£ 1 O ( i i i i 1 i i i i I i i i
-220 -
-225 -
-230
-235
-240
-245
SNl
90 95 100 105 110 115 120
X Values (meters)
125 130 135
Profile View
w
-1
SNl
HHTL -f 2.00m (storm surge)
HHTL -f 1.00m
HHTL + 0.3 m
HHTL
MSL
. VE=3X
-35 -30 -25 -20 -15 -10 -5
Distance Along Profile (meters)
0
45
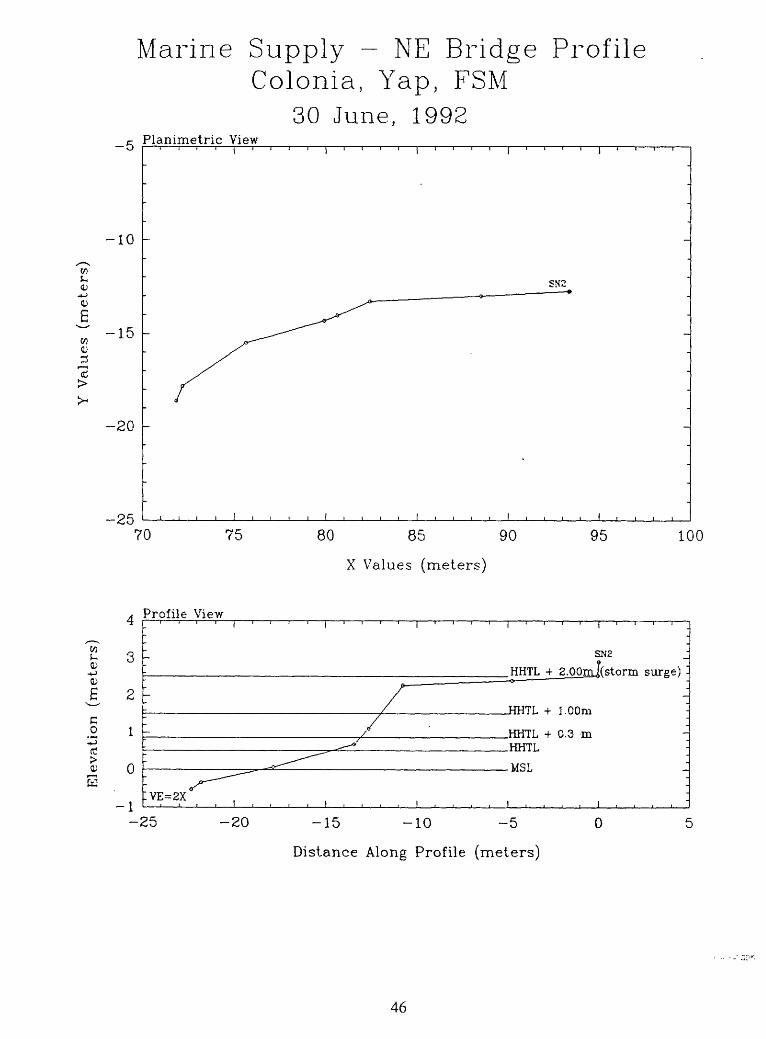
Marine Supply NE Bridge Profile Colonia, Yap, FSM
30 June, 1992-5 Planimetric View
-10
-15
-20
-25 J I I I 1 I I I I I I I I I I 1 -I I I I 1 I I L
70 75 80 85 90
X Values (meters)
95 100
Profile View*±
3
2
1
0
i
i i i i 1 i i i i 1 - i i r i - | T- i" -r i | i i i i | i r~
1 SN2
C HHTL + 2.00m|fstorm
- / HHTT. -4- 1 nnm
^ X ' HHTL + 0.3 mC ^-* HHTT.
: ̂___^=4--rr'~^ . . .,. , MSL
:VE=2X ° i , i 1 1 1 1 1 1 1 1 1 1 -1 1 __ L I-- L _L ___L ___ I _ 1 I ___ _L__1_I 1 1 II
,. .._ j .
surge) -
-
"
j i
-25 -20 -15 -10 -5
Distance Along Profile (meters)
0
46

Police Station Profile Colonia, Yap, FSM
30 June, 19921 nn Planimetric View1UU | i i r
95
90
85
80
T ! I I I 1 1 I 1 I I I ! I I T
40 45
Profile View
SN3
50 55 60
X Values (meters)
65 70
'-t
CO 3SM
0)-4-J
0)
E 2^^
c0 1* x "
to
"" /~\w 0
1
-
HHTL + 2 00m (storm surge)
^ ___ ̂ _^^ /^ HHTL + l.OCm
0// KHTI. + O.a- m
,/ HHTL
./ MSI,
" S VE=2X! . , , , I , , , , I , , , , 1
-20 -15 -10 -5
Distance Along Profile (meters)
0
47

Reclaimed Land Area Profile Colonia, Yap, FSM
30 June, 1992205 Planimetric View
200 -
195 -
£ 190
to185
180
175
170
165
SN4/
-80 -75 -70 -65 -60 -55 -50 -45 -40 -35 -30
X Values (meters)
Profile View
w
-1
.HHTL + 2.00m (storm surge)
HHTI. + 1.00m SN4
.HHTL + 0.3 m
.HHTL
.MSL._
-45 -40 -35 -30 -25 -20 -15 -10 -5 0
Distance Along Profile (meters)
48
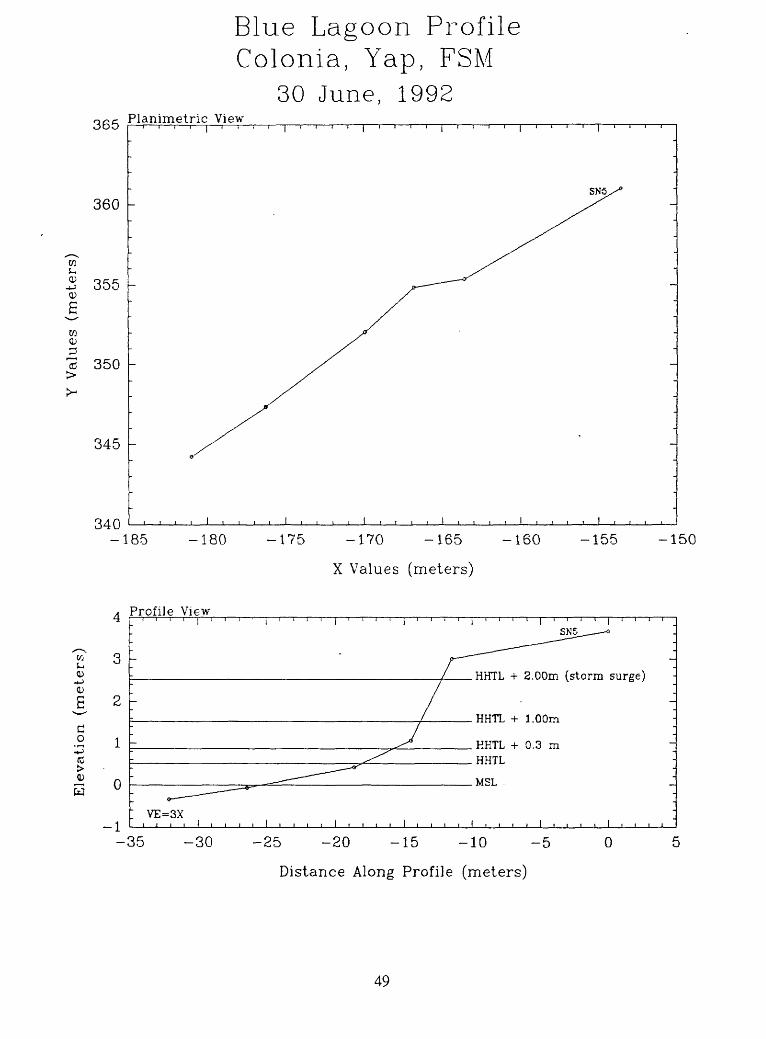
Blue Lagoon Profile Colonia, Yap, FSM
30 June, 1992Planimetric View
360 -
3 355
TO
350
345
340-185 -180
Profile View
-1! VE=3X
-i i i i i i r i i I i i i i I i i i r
175 -170 -165
X Values (meters)
-160 -155 -150
HPfTL + 2.00m (storm surge)
HHTL + 1.00m
KKTL + 0.3 zn HHTL
MSL .
-35 -30 -25 -20 -15 -10 -5
Distance Along Profile (meters)
0
49
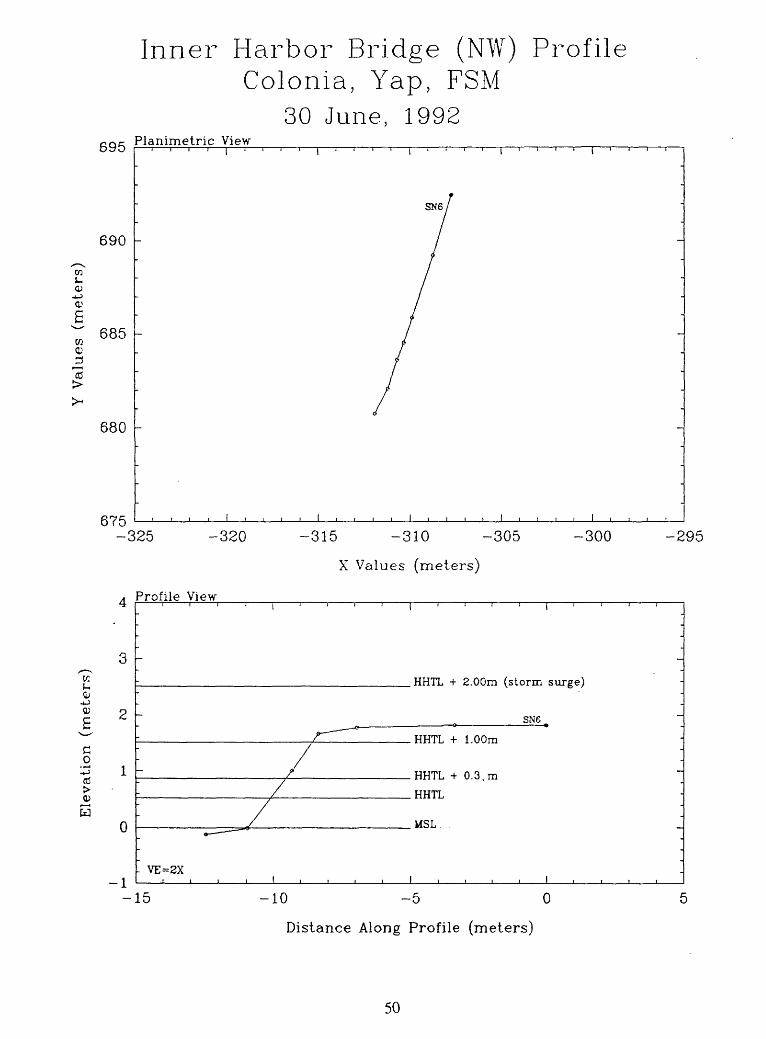
Inner Harbor Bridge (NW) Profile Coloma, Yap, FSM
30 June, 1992Planimetric View
690
685
680
675-325 -320
Profile View
3 -
J-,O
-4-5
2 -
0
-1- VE=2X
SN6,
-315 -310 -305
X Values (meters)
-300
HHTL + 2.00m (storm surge)
SN6
HHTL + 1.00m
HHTL + 0.3. m
HHTL
MSL. .
-15 -10 -5 0
Distance Along Profile (meters)
-295
50

Inner Harbor Road Junction Profile Colonia, Yap, FSM
30 June, 1992710 Planimetric View
705
o
700
695
690
L SN7
-380 -375 -370 -365 -360
X Values (meters)
-355 -350
Profile View
Elevation (meters)
1
o >-* ro co vf- SN7RHTI. + 2^00m
(storm surge)
- HHTI + 1,00m
mm. + 0.3 mHHTL
MSI-
! VE=2X
Q
'
"s~^-~-^___ ;^-- :
i , , , , i0 -5 -10
Distance Along Profile (meters)
-15 -20
51

Mechanics Shop Profile Colonia, Yap, FSM
30 June, 1992505 Planimetric View
CO500
495
SN8
-400 -395 -390
X Values (meters)
Profile View
3 -
cti >Q)
Eo
-i
HHTL + 2.00m. (storm surge)
HHTL + 1.00m.
HHTL + 0.3'm.
HHTL.
MSL.
.SN8
\
- VE=2X
0 -5 -10
Distance Along Profile (meters)
-385
-15
52
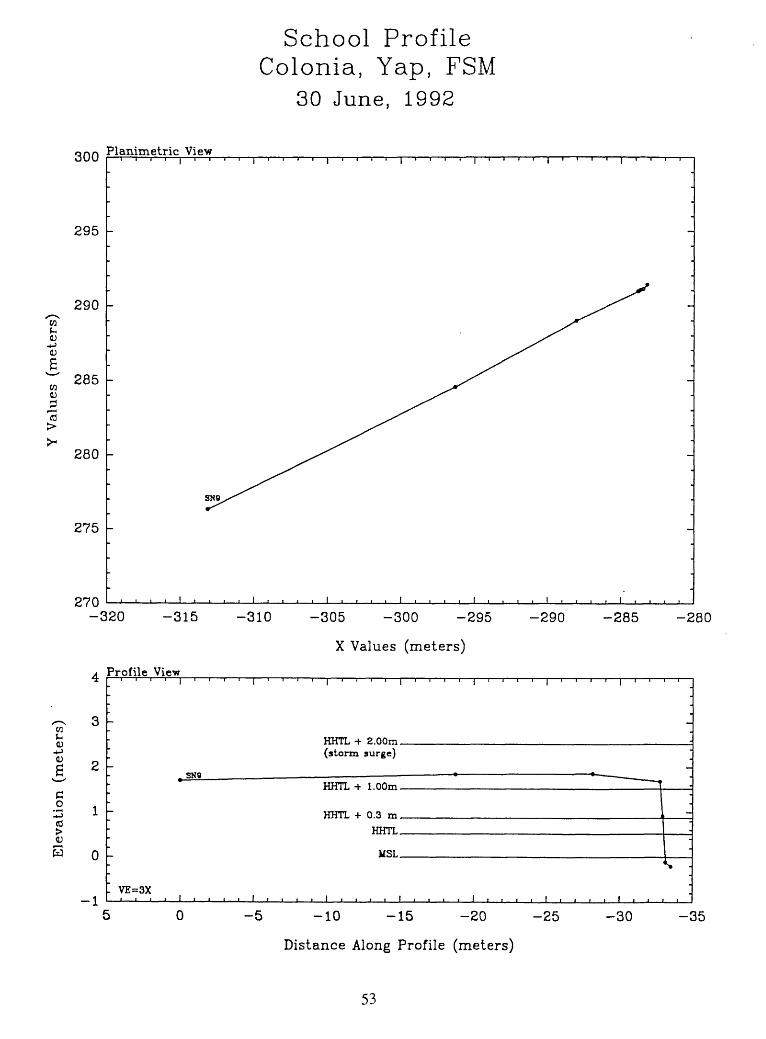
School ProfileColonia, Yap, FSM
30 June, 1992
300
295
290
285
280
275
270
View
SN8
-320 -315
Profile View
310 -305 -300 -295 -290 -285 -280
X Values (meters)
t
ow J-,0)
4-i
1 2*" '
C
3 1CO
S n
i
^ i i i i i i i . i . i i i i i i i i i i i i i i . i i i i i i i i i i i
mm, -»- 2 nom(storm surge)
mm. + 1 nnm
mm. 4- n a mmm.
UST.
VE=3X i i i i L j i i 1_. 1 i i i . 1 i i i i 1 t i i i 1 i i i i 1 i ,,, 1 , i
-
_
i '
5 -10 -15 -20 -25
Distance Along Profile (meters)
-30 -35
53
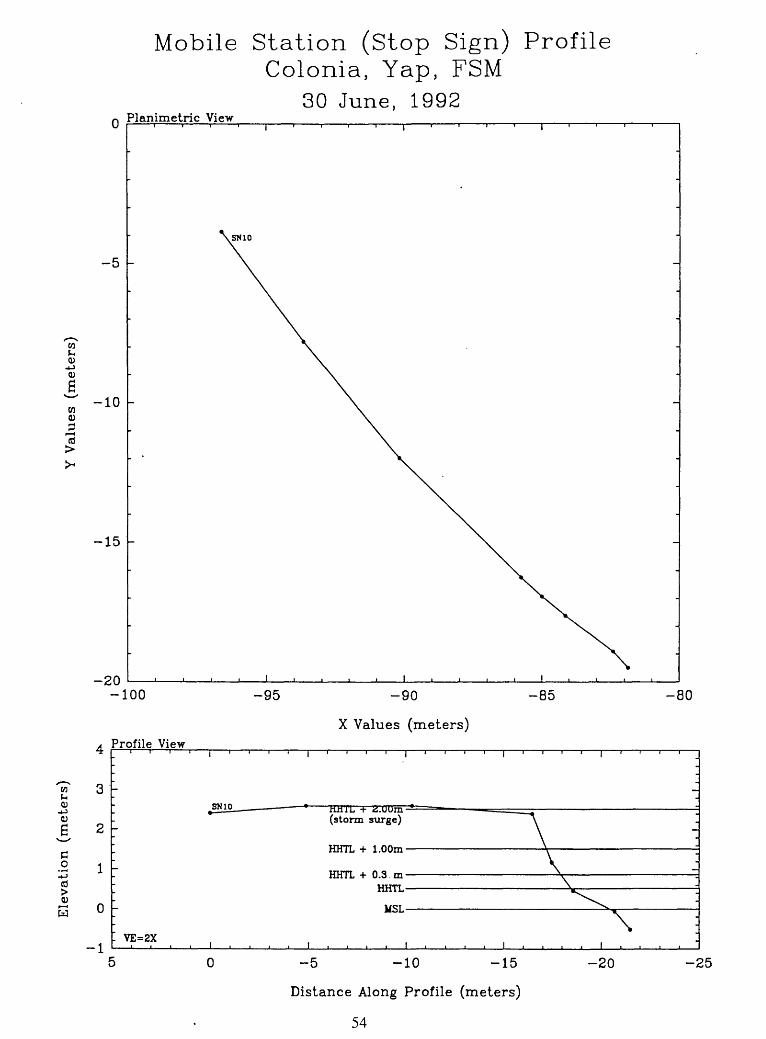
Mobile Station (Stop Sign) ProfileColonia, Yap, FSM
30 June, 1992Planimetric View
-5
COf~,<u
-1-3
u
£CO
^13
-10
-15
-20-100
Profile View
k SN10
-95 -90
X Values (meters)
-85 -80
V)tH
QJ<u
£C
_oed>(UP <
W
**
3
2
1
0
i
. i i . | i . i . | i , i , | , . . i | i ,,,,,..
sum - tLHTL I " UUm * (storm surge) A
TJTTTT _i_ 1 AAw% »
TTTT»rT _l_ f\ Q **« \ ~"
VTWTT \
1/<7T ., ^^^^
V?=2X ,.,....,....,.,.,,,.,.,,,,, :
-5 -10 -15
Distance Along Profile (meters)
54
-20 -25

Maedriich ProfileColonia, Yap, FSM
30 June, 1992
-245 Planimetric View
-250-205 -200
X Values (meters)
-195
Profile View
-1. VE=1X
HHTL + 2.00m
(storm surge)
HHTL + 1.00m
HHTL + 0.3 m
HHTL
MSL
,SN11
\
Distance Along Profile (meters)
-5
55

APPENDIX II
YAP AND FALALOP COASTAL PROFILES
Coastal profile cross sections for sites 2 through 14. Sites 2 - 4 and 8 - 14 are on the main Yap Islands (see Fig. 2 for locations) and sites 5 -7 are on Falalop Islet. Ulithi Atoll (see Fig. 4 for locations). Horizontal distance position is arbitrary; the zero point coincides with the location of the survey instrument. The MSL elevation (0 on the vertical axis) was determined by reference to the Colonia tide gauge at the time of profiling. HHWM = higher high water mark.
56

T -J-
2.5
'
-
2
Site
2:
Wac
hael
aeb,
E M
aap,
Yap
Bea
ch F
ace
--
1.5
-
1ro
_a> LU
-
0.5
-0.5
Ree
f Fl
at
-300
-350
Dis
tanc
e (m
)
Site
3:
Wan
yaan
, E
Gag
il-Ta
mil,
Yap
2.5
T
oo
Ber
m C
rest
-0.5
Dis
tanc
e (m
)
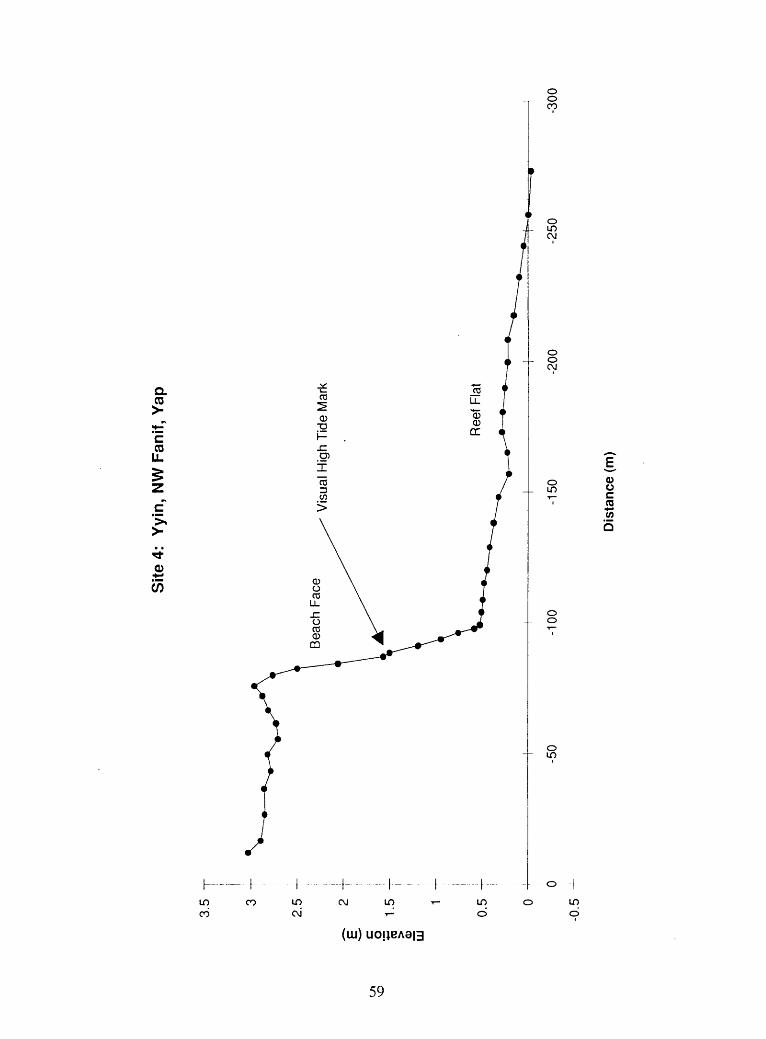
Site
4:
Yyi
n, N
W F
anif,
Yap
Vis
ual
Hig
h T
ide
Mar
k
-200
-250
-300
Dis
tanc
e (m
)

Site
5:
N F
alal
op I
slet
, U
lithi
Ato
ll
ON O
5 T
4 --
3 -
.2
2 +
*-
c-
co JD
LU
Wat
er P
ipes
Taro
Sw
amp
Sto
rm R
idge
-50
250
-1
Dis
tanc
e (m
)
Sit
e 6:
W
Fal
alop
Isl
et,
Ulit
hi A
toll
Sto
rm R
idge
150
r\
__
Dis
tanc
e (m
)

Site
7:
E Fa
lalo
p Is
let,
Ulit
hi A
toll
ON
to
3 --
Sto
rm R
idge
-50
-100
-150
-200
-400
-1
-
Dis
tanc
e (m
)

Site
8:
Laey
, S
E O
ilman
, Y
AP
ON
3 -r
2.5 -
1.5 -
LU
0.5
--
pSto
ne W
all
Hig
h W
ater
Mar
ks
-0.5
-120
-130
-140
-150
Dis
tanc
e (m
)

Site
9:
Th
abee
th,
SW
Oilm
an,
Yap
ON
Men
s H
ouse
Fou
ndat
ion
-0.5
Dis
tanc
e (m
)

-0.5
r
-1
Ston
e W
all
Site
10:
Q
oo
n,
E R
uul,
Yap
Roa
d
HH
WM
+0.
3 m H
HW
M
fSto
ne W
all
Dis
tanc
e (m
)
T
Site
11:
Ta
afni
ith,
W K
anifa
ay,
YA
P
ON
ON
5 --
4 --
3 -
c
o *^
CO > j3>
2 --
LU
HH
WM
+ 1
.0m
-80
-60
HH
WM
+ 0
.3 m
-40
-20
Top
of M
icro
atol
l
Dis
tanc
e (m
)

3.5
T
2.5
--
E
2 "
**-*
c
g I
1.5
Hr
LU
Site
12:
K
anif,
W W
eelo
ey,
YA
P
HH
WM
+ 0
.3 m
HH
WM
^^i
Sto
ne W
all
0 0
-20
-40
-60
-80
-100
-11
-0.5
Dis
tanc
e (m
)
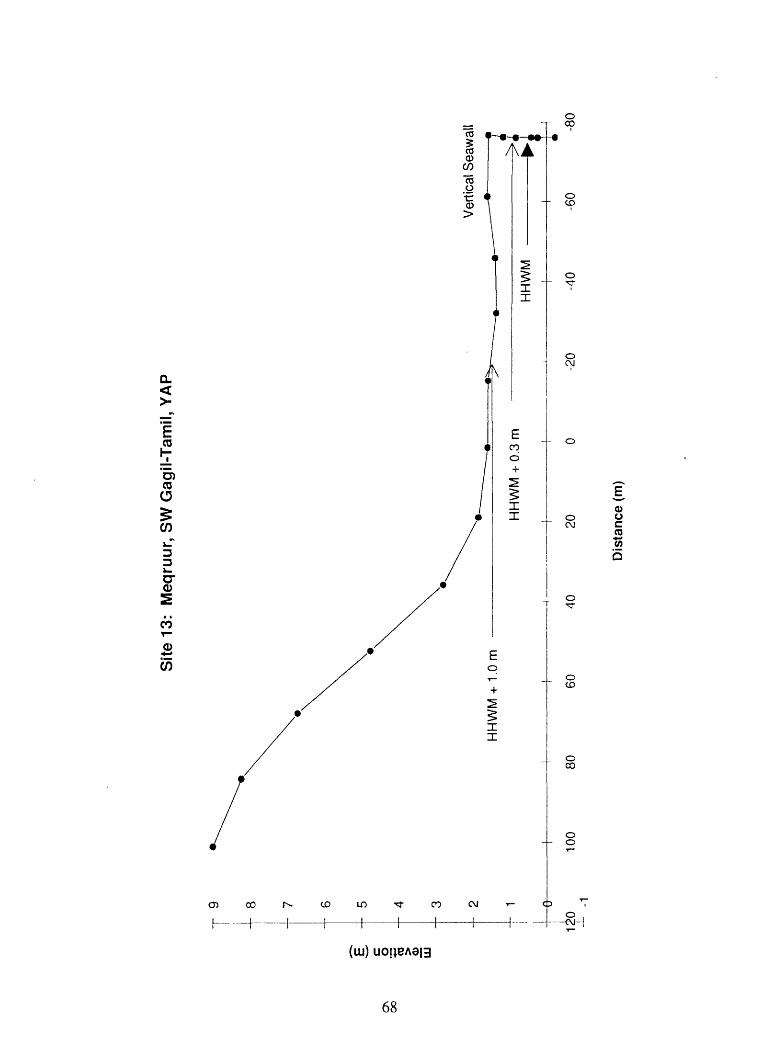
ON
oo
T9 8
-f
7
--
6
» »
»
§
--
5c
o TO
-
4
--
3
--
2
__
-i 6-
LU
120
-110
0
Site
13:
M
eqru
ur,
SW
Gag
il-T
amil,
YA
P
HH
WM
+ 1
.0m
8060
40
HH
WM
+ 0
.3 m
20
Ver
tical
Sea
wal
l
HH
WM
->
-20
-40
-60
-80
Dis
tanc
e (m
)
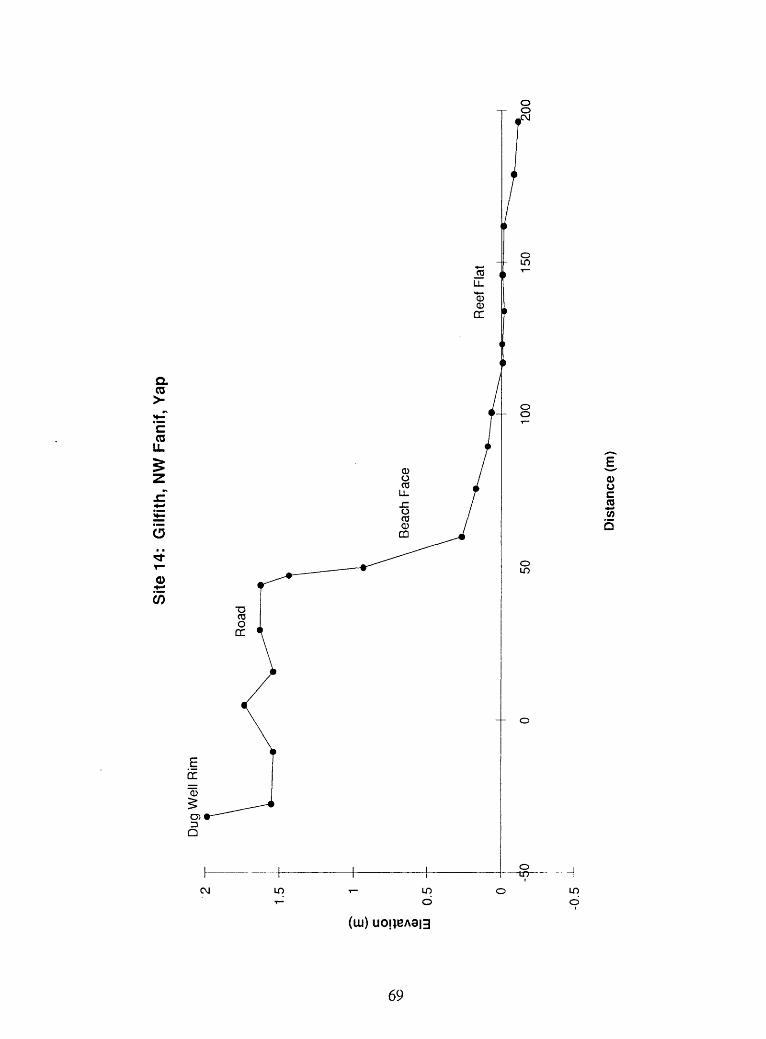
Site
14:
G
ilfith
, N
W F
anif,
Yap
O\
VO
2 -r
1.5
--
Dug
Wel
l R
im
0.5
-0.5
Dis
tanc
e (m
)