vulnerability of small island development states
TRANSCRIPT
VULNERABILITY OF SMALL ISLAND DEVELOPMENT STATES
Does good governance help?
MARTIN SJÖSTEDT
MARINA POVITKINA
WORKING PAPER SERIES 2015:12 QOG THE QUALITY OF GOVERNMENT INSTITUTE
Department of Political Science University of Gothenburg Box 711, SE 405 30 GÖTEBORG July 2015 ISSN 1653-8919 © 2015 by Martin Sjöstedt & Marina Povitkina. All rights reserved.
brought to you by COREView metadata, citation and similar papers at core.ac.uk
provided by Göteborgs universitets publikationer - e-publicering och e-arkiv

2
Vulnerability of Small Island Development States. Does good governance help? Martin Sjöstedt Marina Povitkina QoG Working Paper Series 2015:12 July 2015 ISSN 1653-8919
ABSTRACT
Small island states have in recent decades been identified as particularly vulnerable to natural disas-ters and climate change. Violent winds, floods, and draughts have had severe consequences for millions of people and currently present an increasingly significant challenge for development and poverty alleviation in small islands. However, although islands tend to have similar geographical features, natural hazards produce widely different outcomes in different island states, indicating great variation in resilience. While some islands seem to cope and adapt fairly well, others suffer tremendously. That is the impact of natural hazards of the same physical magnitude ranges from going more or less unnoticed or causing only small disturbances to resulting in severe catastrophes. The overall objective of this paper is to explore the suggested sources of this variation further. More specifically, with the point of departure in theories about how institutions and social con-tracts affect collective action and adaptive capacities, this paper sets out to investigate how political institutions such as democracy, corruption, and government effectiveness impact the overall resili-ence of island states. While claims over the importance of institutions are well abound in the litera-ture, there is a serious lack of systematic empirical accounts testing the validity of such claims. This shortcoming is addressed by this study’s quantitative, time series cross-sectional analysis using data from the International Disaster Risk database and the Quality of Government dataset.
Martin Sjöstedt The Quality of Government Institute Department of Political Science University of Gothenburg Martin.sjö[email protected]
Marina Povitkina The Quality of Government Institute Department of Political Science University of Gothenburg [email protected]

3
Introduction
Small island developing states (SIDS) are generally held to be particularly vulnerable to natural haz-
ards and disturbing weather events. Development challenges associated with exposure to natural
hazards – e.g., loss of lives, livelihoods and shelter – has even prompted the proclamation of 2014
as the year of SIDS. Due to their geographical location in hazard-prone regions, but also their rela-
tive isolation, limited physical size, and a concentration of population along coastal zones, policy
makers and scholars argue that SIDS require special attention and support in adapting to increas-
ingly severe weather events. However, despite a generally dismal outlook, similar natural hazards in
fact produce widely different outcomes in different countries, indicating great variation in vulnera-
bility. While some SIDS seem to cope and adapt fairly well, others suffer tremendously. That is, the
impact of natural hazards of the same physical magnitude ranges from going more or less unno-
ticed or causing only small disturbances to resulting in severe catastrophes (Adger et al., 2005). The
overall objective of this paper is to explore the sources of this variation further. This is done by
critically reviewing existing literature on island states and vulnerability, and then testing if the claims
put forward in this literature are empirically valid. While the empirical focus is on SIDS, the paper
certainly has the potential to also shed light on issues of disaster risk reduction and adaptive capaci-
ty more generally.
The paper proceeds as follows. The next section provides a brief overview of extant claims about
factors exacerbating or reducing the impacts from extreme weather events. The main drivers and
buffers are then summarized and scrutinized empirically. Controlling for the physical magnitude of
natural hazards, the empirical part investigates the association between the impacts of hazards
(number of people killed or affected) and the factors held to increase or reduce the risk of such
impacts. While the literature identifies a number of such factors, empirical tests are scarce.
Vulnerability and natural hazards
A natural hazard is normally defined as a potentially damaging physical event or weather phenome-
non that may cause the loss of life or injury, property damage, social and economic disruption or
environmental degradation. For example, hazards often result in disease outbreaks, weather-related
and geophysical events including floods, high winds, landslides, droughts or earthquakes, economic

4
volatility, or conflict-related shocks such as outbreaks of fighting or violence (DFID, 2011,
UNISDR, 2012). The impact of natural hazards on human wellbeing has in recent years been un-
precedented. Earthquakes, violent winds, floods, and droughts have had severe consequences for
millions of people worldwide, presenting an increasingly significant challenge for development and
poverty alleviation. For example, in 2010, natural hazards affected more than 200 million people,
caused nearly 270.000 deaths, and resulted in 110 billion USD in damages. In 2011, the first famine
of the 21st Century occurred as drought hit the Horn of Africa (DFID, 2011). Storms alone have in
the last decade killed roughly 175.000 people and affected approximately 400 million (ADW, 2012).
But how come hazards result in effects of so vastly differing scale in different countries? For exam-
ple, while the earthquake on March 22nd 2011 in Christchurch, New Zealand, with a moment mag-
nitude of 6.3, claimed the lives of 187 victims, an earthquake in Haiti at the beginning of 2010, with
a strength of 7, led to 220.000 casualties. Similarly, when Hurricane Andrew, a powerful category 5
storm, struck Florida in 1992, 23 people lost their lives. An equivalent tropical typhoon in Bangla-
desh in 1991, on the other hand, resulted in over 100.000 deaths (Adger et al., 2005). How can we
understand this?
In general, whether or not a hazard turns into a disaster, a “serious disruption of the functioning of
a community or a society causing widespread human, material, economic, or environmental losses
which exceed the ability of the affected community/society to cope using its own resources” is
argued to depend on the vulnerability of a system or society (IISD, 2006). There are certainly plenty
of definitions of vulnerability. In fact, already in 1981, Timmerman (1981) posited that “vulnerabil-
ity is a term of such broad use as to be almost useless for careful description at the present, except
as a rhetorical indicator of areas of greatest concern”. Similarly, Liverman (1990) argued that vul-
nerability “has been related or equated to concepts such as resilience, marginality, susceptibility,
adaptability, fragility, and risk”, and Füssel (2007) adds “exposure, sensitivity, coping capacity, criti-
cality, and robustness” to this list. Nevertheless, although turned into somewhat of a buzzword and
being subjected to significant conceptual stretching, definitions tend to converge around a defini-
tion similar to the one put forward by IPCC: ”The degree to which a system is susceptible to, or
unable to cope with, adverse effects of climate change, including climate variability and extremes.
Vulnerability is a function of the character, magnitude, and rate of climate variation to which a
system is exposed, its sensitivity, and its adaptive capacity”. In a similar vein, Wisner – a pioneering
scholar within risk management – argues that vulnerability is “the characteristics of a person or

5
group and their situation that influence their capacity to anticipate, cope with, resist and recover
from the impact of a natural hazard” (Wisner, 2004).
While several definitions exist, there is hence a general consensus that natural hazards do not cause
disasters by themselves. “It is the combination of an exposed, vulnerable, and ill-prepared popula-
tion or community with a hazard event that results in a disaster” (Shaw et al., 2010, p. 2). Disaster
vulnerability determines a society’s ability and capacity to cope with disturbances and moderate the
outcome to ensure benign or only small-scale negative consequences (Manyena, 2006). More than
discussing various definitions of the term vulnerability, a lot of research has focused on assessing
the factors determining levels of vulnerability. To start with, there has for quite some time been a
clear move towards trying to take the ‘naturalness’ out of natural disasters. And while the research
field still suffers from under-theorization and a lack of causal, much less predictive, factors, some
causal claims and roots of vulnerability have been suggested (Roe and Schulman, 2012).
First, there is a large literature suggesting that vulnerability is determined by social and structural
factors such as levels of inequality, marginalization, and social injustice. Schröter et al. (2005) illus-
trate this through the example of a famine, and argue that it is more informative to look at the so-
cial, economic, and political marginalization of individuals and groups as the causes of that famine
rather than focusing on the physical stress of the system as the cause for famine, such as drought.
This example in turn follows the work of Amartya Sen (1981, 1990), who initiated an influential
research agenda on the capacity of different political systems to deliver freedom from famine and
other disasters. According to this literature, a political contract model of disaster prevention in-
volves a political commitment from the government, recognition of the disaster as a political scan-
dal by the people, and lines of accountability from the government to the people that enable this
commitment to be enforced. In addition, repression of freedoms of expressions and association is
argued to prevent civil society organizations from mobilizing to protest against or prevent potential
disasters. It is also argued that the reverse case is clear: human rights abuses are invariably an inti-
mate part of disaster creation (De Waal, 1997).
According to Sen’s original argument about famines: “The diverse political freedoms that are avail-
able in a democratic state, including regular elections, free newspapers and freedom of speech, must
be seen as the real force behind the elimination of famines. Here again, it appears that one set of
freedoms – to criticize, publish and vote – are usually linked with other types of freedoms, such as

6
the freedom to escape starvation and famine mortality” (Sen, 1990). That is, democratic institutions
are held to ensure that credible information exists and that governments respond to this infor-
mation in a timely and effective manner. According to this logic, freedom of speech gives civil or-
ganizations a critical role calling to account those politicians and administrators who are failing to
respond. In turn, elected representatives are expected to have a powerful incentive to respond: their
positions depend upon popular support and a member of parliament who allows a famine or other
disasters to occur in his or her constituency is likely to face serious difficulties in getting re-elected
(De Waal, 1997).
Second, there is a lot of research on how environmental mismanagement and collective action fail-
ures severely worsen vulnerability. For example, research on ecosystem services shows that well-
managed ecosystems act as strong buffers against harsh weather events. On the contrary, loss of
biodiversity or environmental degradation increases the severity of natural hazards significantly.
The reasons for why some societies or communities manage their ecosystems more sustainable
than other in turn point to factors such as social capital and trust as crucial (Adger, 2003). Similarly,
the common property research tradition shows that norms of trust and reciprocity can seriously
reduce the risk of ending up in so called social dilemmas or tragedy of the commons situation
(Ostrom, 1990, Agrawal, 2001).
Insights from this research tradition in turn lead us to the third category of potential explanations to
variation in natural-hazard impact, i.e. governance and institutional and organizational features.
This category in fact captures many of the claims accounted for above. The common property re-
source tradition for example emphasizes the importance of social, political, and economic organiza-
tions with institutions as mediating factors that govern the relationship between social systems and
the ecosystems on which they depend (Dolésak and Ostrom, 2003). In addition, the research focus-
ing on social marginalization and injustice clearly highlight the importance of governance and func-
tioning political institutions. In the growing adaptive capacity literature, there is hence an emerging
consensus about the integral role that institutions, governance, and management play in determin-
ing a system’s ability to adapt to climate change and severe weather events (Yohe and Tol, 2002,
Ivey et al., 2004, Brooks et al., 2005, Haddad, 2005, Engle and Lemos, 2010, Agrawal, 2008, Brown
et al., 2010, Eakin and Lemos, 2006, Gupta et al., 2010). As Lebel et al. (2010, p. 132) put it, “reality
is often much more political than the technical descriptions of disaster”. Characteristics of the po-
litical system are hence said to reduce vulnerability, and thus directly affect the number of people

7
killed and affected by natural hazards (Adger et al., 2005). Micro-mechanisms such as individuals’
decisions to engage in long-term investment in housing and infrastructure as well as taking steward-
ship of ecosystem’s buffering capacities, and their ability for voice and participation are, for exam-
ple, held to depend on political order and institutional organization.
Taking our point of departure in this institutional argument, we aim to test the role of institutions
on vulnerability. Previous attempts to empirically investigate the influence of political institutions
on vulnerability are scant. Kahn (2005) finds that in countries with lower income inequality, higher
levels of democracy and good institutions, including high regulatory quality, voice and accountabil-
ity, rule of law and better control of corruption fewer people die as a result of natural and industrial
disasters. Similarly, Raschky (2008) shows that government stability and higher investment climate
result in lower human and economic losses.
Our hypothesis to test is:
H1. Higher institutional quality leads to fewer casualties as a result of natural disasters.
The next section spells out the empirical strategy for investigating how institutional features affect
vulnerability.
Data and method
In order to test the validity of the claims put forward in the existing literature, this study aims to
look closer at the association between the impact of natural hazards and factors held to act as a
buffer and moderate the effects. That is, the empirical analysis sets out to investigate whether or
not islands experiencing milder impacts are relatively well equipped in terms of the factors held to
reduce vulnerability? The choice of small developing island states is motivated by the fact that they
constitute a hard test of the explanatory power of previous claims. Many SIDS face special disad-
vantages associated with small size, insularity, remoteness, and proneness to natural disasters. In
some instances natural disasters threaten the very survival of some small islands. Investigating varia-
tion in impact within this natural-hazard prone group of countries hence gives us the leverage to
test the strength of the generic claims about adaptive capacity and vulnerability.

8
We keep the test simple and focus on establishing whether there is any association between the
proposed explanatory factors and outcomes in terms of number of people killed or affected by
natural hazards. In short, we will aim to find the evidence of whether countries with stronger insti-
tutions and more robust governance systems have fewer people killed or affected by adverse
weather events?
Of course, the validity of the results depends on how we measure and operationalize our concepts
of interest. As regards the dependent variables – number of people killed or affected by natural
hazards – we rely on the data from International Disaster Database, gathered by Centre for Re-
search on the Epidemiology of Disasters. The database is compiled from various sources, including
the UN agencies, non-governmental organisations, insurance companies, research institutes and
press agencies (EM-DAT, 2014).
Since the study is explorative, we test our hypothesis on all indicators available in the database:
number of people killed, injured, affected1 and remained homeless after the disaster, as well as total
number of people affected, which is a sum of all people injured, homeless and affected. We also
perform tests for the number of disasters overall, and a total damage from them, measured in thou-
sands US dollars. All dependent variables are log-transformed in order to improve distribution of
the residuals.
The explanatory variables include government effectiveness, developed by the World Bank2, the
level of democracy which is a combined score of measures by Freedom House and Polity IV, sug-
gested by Hadenius and Teorell (2005), GDP per capita and population, both taken from Penn
World Trade statistics (Heston et al., 2012), geographical position of a country from La Porta et al.
1 People coded as ”affected”, if they required urgent help during the emergency period, for example, needed food,
water, shelter, sanitation or medical assistance EM-DAT (2014) The OFDA/CRED Internatioanl Disaster Database: Université Catholique de Louvain, Brussels (Belgium). Available at: www.emdat.be (Accessed: 14 April 2014). 2 We also tested the results with the alternative measures of intuitional quality – International Country Risk Group indica-
tor of Quality of Government ICRG (2014) A Business Guide to Political Risk for International Decisions New York: The PRS Group. International Country Risk Guide. and World Bank’s Control of Corruption WB (2014) 'World Development Indicators, the World Bank' (Accessed: 26 March 2014).. However, the coverage of SIDS countries by ICRG data is rather narrow (the data are only available for 11 countries), which makes regression analysis problematic, while the Control of Corruption produced few significant results in the multivariate models. This can be explained by the fact that the measure of corruption is too narrow for making inferences about the capacity of government to reduce vulnerability.

9
(1999)3, amount of development aid received, taken from World Bank Development Indicators
(WB, 2014) and a time trend.
The main independent variable, government effectiveness, captures “perceptions of the quality of
public services, the quality of the civil service and the degree of its independence from political
pressures, the quality of policy formulation and implementation, and the credibility of the govern-
ment's commitment to such policies.” (Kaufmann et al., 1999). Therefore, apart from bureaucratic
quality and effectiveness of public administration the indicator includes outcomes of government
actions, such as provision of public goods. The measure of government effectiveness is often criti-
cized for being too broad and including outcome variables into the composed indicator. However,
in our case its use is appropriate, since it includes all the composites necessary to evaluate govern-
ments’ readiness to cope with natural disasters, protect its populations and provide public goods
that decrease vulnerability, such as, e.g. infrastructure.
Democracy indicator controls for freedom of expression, strength of civil society and human rights,
while GDP per capita captures economic abilities of the state to invest into the necessary infra-
structure, which can decrease vulnerability. Population size is expected to positively correlate with
vulnerability, while the measure of a country’s geographical position accounts for the proneness to
certain weather conditions as well as helps to control for the unobserved unit heterogeneity.
We use data available across countries and over time in order to increase sample size and obtain
more precise estimates4. By employing time series cross-section analysis we have to deal with a
number of problems inherent to panel data. Since we perform our analysis exclusively for the sam-
ple of vulnerable countries, adverse weather events happen more or less independently from previ-
ous occurrences and therefore, we expect little serial correlation within the data. Indeed, Langrage
multiplier tests confirmed that autocorrelation is not a problem in most of our models, except for
the models where numbers of people injured and killed are treated as dependent variables. This
indicates that the values of these variables are not independent from the values in previous disaster-
years. In the models where autocorrelation is not a problem and there is no need to include lagged
dependent variable, which complicates interpretation of the results, we can make use of the pooled
3 We also considered including other control variables into the model, namely inequality and levels of social trust. How-
ever, there are not enough observations on SIDS in the available data sources for these variables to produce any meaningful results. 4 Comparing to cross-section analysis

10
OLS approach with panel corrected standard errors suggested by Beck and Katz (1995). This
methodological technique uses all variation in the data for the analysis.
The equation to be estimated is:
𝑙𝑛𝑌𝑖𝑡 = 𝛼 + 𝛽𝑗𝑋𝑗𝑖𝑡 + 𝑒𝑖𝑡 (1)
where i denotes country, t – year, j – number of independent variables, 𝑙𝑛𝑌𝑖𝑡 is a natural logarithm
of the dependent variable, 𝛼 is an intercept, 𝑋𝑖𝑡 stands for the vector of independent variables and e
is an error term.
In the models for the number of people injured and killed as dependent variables, we perform
Prais-Winsten regressions with panel corrected standard errors, which corrects for first-order auto-
correlation in the data. All models successfully passed through standard regression diagnostic.
Results and Discussion
First, we run bivariate regressions between government effectiveness and various natural disaster
outcomes. The results are presented in Table 1 and show that government effectiveness is signifi-
cantly and negatively correlated with total number of people affected by the disasters (Model 1),
number of adverse events classified as natural disasters (Model 2), number of people affected by
the disasters (Model 5) and number of people remained homeless (Model 6). The results indicate
that countries with more effective governments have lower number of people affected by disasters,
lower number of people remained homeless and even lower number of adverse events classified as
natural disasters.

11
TABLE 1, THE EFFECT OF GOVERNMENT EFFECTIVENESS ON DISASTER OUTCOMES5
(1) (2) (3) (4) (5) (6) (7)
VARIABLES
Total affected
(log)
Number of
disasters
(log)
Number of
Killed (log)
Number of
Injured (log)
Number of
Affected (log)
Number of
Homeless
(log)
Damage in
USD (log)
Government
Effectiveness -0.507*** -0.301*** -0.086 -0.042 -0.493*** -0.142*** 0.225
(0.149) (0.037) (0.065) (0.094) (0.154) (0.044) (0.169)
Constant 1.709*** 0.384*** 0.040* 0.031 1.635*** 0.189*** 1.359***
(0.113) (0.027) (0.021) (0.031) (0.113) (0.057) (0.202)
Observations 194 194 194 194 194 194 194
R-squared 0.043 0.146 0.011 0.001 0.040 0.022 0.006
Number of coun-
tries 35 35 35 35 35 35 35
Panel corrected standard errors in parenthesis; *** p<0.01, ** p<0.05, * p<0.1. Models 3 and 4 are Prais-Winsten regression to correct for autocorrelation.
In the next step we investigate the results further, introducing explanatory factors into the model.
Table 2 shows that only some of the results are robust to the inclusion of control variables. Coun-
tries with higher government effectiveness seem to have lower number of people affected by natu-
ral disasters (Model 5 and 1) and lower number of adverse events classified as natural disasters. The
effect of government effectiveness on the number of people killed and remained homeless after the
disaster is also negative and significant. The number of people killed and injured seems to be in-
stead affected by the democracy levels. Higher democracy scores are associated with fewer fatalities
and less injuries as a result of disasters. More advanced democracies also experience less damage
from the natural adverse events, expressed in monetary terms.
While Models 2, 3 and 4 seem to be explained relatively well by the selected explanatory factors, R-
squared in Models 1, 5, 6 and 7 remains low, implying that there are also other factors explaining
variation in the dependent variables that are not included into the models.
5 In the robustness checks we ran the same models with the indicator Control of Corruption from the World Bank and
ICRG indicator of Quality of Government. For the indicator of Corruption control results remain similar as for govern-ment effectiveness, however it’s affect on the size of economic damage becomes negative and significant at 10%. As for the ICRG QoG indicators, the results were only significant in bivariate regressions and lost their statistical signifi-cance after the inclusion of control variables. However, these indicators are available for smaller number of countries than government effectiveness and therefore, insignificant results can be explained by smaller sample size.

12
TABLE 2, THE EFFECT OF GOVERNMENT EFFECTIVENESS ON DISASTER OUTCOMES
(1) (2) (3) (4) (5) (6) (7)
VARIABLES
Total
affected
(log)
Number of
disasters
(log)
Number of
Killed (log)
Number of
Injured (log)
Number of
Affected (log)
Number of
Homeless
(log)
Damage in
USD (log)
Government Effective-
ness -0.661** -0.307*** -0.069* -0.039 -0.684** -0.156* -0.396
(0.296) (0.063) (0.039) (0.041) (0.299) (0.082) (0.339)
Democracy -0.050 0.009 -0.018** -0.041*** -0.047 -0.026 -0.133*
(0.068) (0.016) (0.009) (0.014) (0.068) (0.046) (0.069)
GDP per capita (log) 0.451* 0.110** 0.136*** 0.178*** 0.455* 0.088 0.867***
(0.265) (0.051) (0.040) (0.050) (0.263) (0.070) (0.319)
Population (log) 0.277*** 0.186*** -0.072*** -0.127*** 0.272*** 0.088** -0.030
(0.080) (0.025) (0.024) (0.023) (0.082) (0.044) (0.094)
Latitude 3.325 1.091*** 0.164 0.258 3.667* 0.097 8.251***
(2.195) (0.325) (0.376) (0.396) (2.057) (0.619) (1.938)
Aid flows 1.648*** 0.421*** 1.928*** 2.418*** 1.467*** 0.159 1.504**
(0.503) (0.163) (0.292) (0.283) (0.561) (0.369) (0.675)
Year -0.003 0.011** -0.005 -0.003 0.007 -0.034*** -0.009
(0.034) (0.006) (0.005) (0.006) (0.036) (0.011) (0.038)
Constant 1.495 -24.965** 9.610 6.245 -19.198 67.432*** 12.547
(68.703) (11.467) (9.476) (10.928) (72.631) (22.681) (76.715)
Observations 176 176 176 176 176 176 176
R-squared 0.261 0.513 0.701 0.776 0.243 0.123 0.211
Number of ccode 34 34 34 34 34 34 34
Panel corrected standard errors in parenthesis, *** p<0.01, ** p<0.05, * p<0.1. Prais-Winsten regression in models 3 and 4 in order to correct for autocorrelation.
Although the correlation between government effectiveness and the number of disasters might
seem puzzling at first glance, the relationship can be explained by the nature of the disaster defini-
tion. In order for an adverse event to be classified as a disaster, it has to fulfill certain criteria: at
least 10 people have to be reported killed, 100 people reported affected, there should be a call for
international assistance or there should be a declaration of a state of emergency (EM-DAT, 2014).
Such effect of the adverse event depends to a certain extent on the vulnerability of the populations
and territories and the degree to which they are prepared to face the consequences of such adverse
events. Dangerous weather events might simply not be classified as disasters due to lower impact

13
exerted by them, while lower impact may be caused by better readiness to the event and higher
government effectiveness.
On the other hand, however, the correlation can simply reflect endogeneity problem between de-
pendent and independent variables. It is reasonable to expect, for instance, that higher number of
disasters and higher probability to get affected by a disaster can decrease the incentives for the po-
litical leaders to act long term and invest into high quality of institutions.
To explore the causality further, we run a number of stepwise regressions starting from the focal
relationship variable, and consequently adding relevant controls, which might potentially have an
effect on the government effectiveness.
In order to get closer to the solution of the reversed causality problem, we lag the value of natural
disasters by one year, making sure that disasters take place before the change in institutional quality
or government effectiveness, as we operationalize it. Here we utilize fixed effects and generalized
least squares random effects regression techniques in order to estimate the size of the effect. We
have chosen a different method for the models with government effectiveness as dependent varia-
ble, since in models estimated with panel corrected standard errors there is a necessity to control
for autocorrelation and introduce lagged dependent variable as explanatory factor, which absorbs
most of the explanatory power in the case of slow moving variables (such as institutional quality),
and complicates interpretation of results.
14
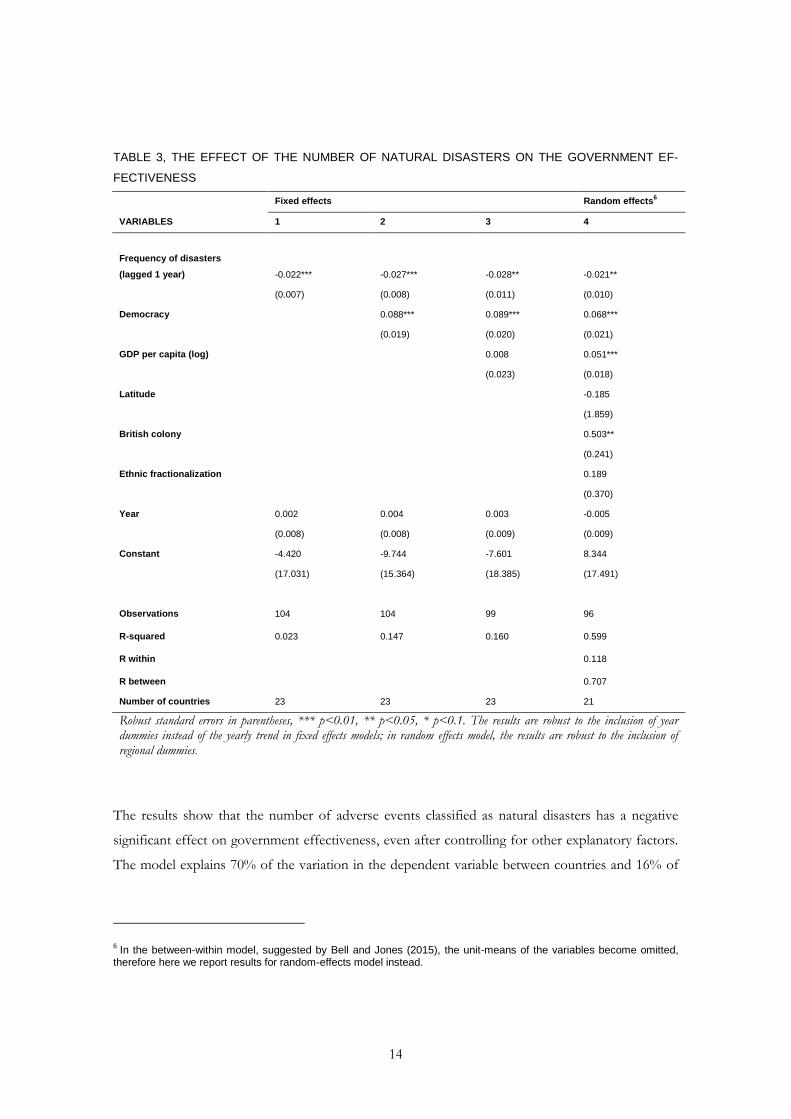
TABLE 3, THE EFFECT OF THE NUMBER OF NATURAL DISASTERS ON THE GOVERNMENT EF-
FECTIVENESS
Fixed effects Random effects6
VARIABLES 1 2 3 4
Frequency of disasters
(lagged 1 year) -0.022*** -0.027*** -0.028** -0.021**
(0.007) (0.008) (0.011) (0.010)
Democracy
0.088*** 0.089*** 0.068***
(0.019) (0.020) (0.021)
GDP per capita (log)
0.008 0.051***
(0.023) (0.018)
Latitude
-0.185
(1.859)
British colony
0.503**
(0.241)
Ethnic fractionalization
0.189
(0.370)
Year 0.002 0.004 0.003 -0.005
(0.008) (0.008) (0.009) (0.009)
Constant -4.420 -9.744 -7.601 8.344
(17.031) (15.364) (18.385) (17.491)
Observations 104 104 99 96
R-squared 0.023 0.147 0.160 0.599
R within
0.118
R between
0.707
Number of countries 23 23 23 21
Robust standard errors in parentheses, *** p<0.01, ** p<0.05, * p<0.1. The results are robust to the inclusion of year dummies instead of the yearly trend in fixed effects models; in random effects model, the results are robust to the inclusion of regional dummies.
The results show that the number of adverse events classified as natural disasters has a negative
significant effect on government effectiveness, even after controlling for other explanatory factors.
The model explains 70% of the variation in the dependent variable between countries and 16% of
6 In the between-within model, suggested by Bell and Jones (2015), the unit-means of the variables become omitted,
therefore here we report results for random-effects model instead.

15
the variation within countries. Thus the model mostly explains differences between nations, not
developments within states.
Conclusions
The aim of the paper has been to investigate whether those vulnerable countries that have higher
government effectiveness are better equipped to face the consequences from adverse events and
thus have lower number of people affected by the disasters than countries with low institutional
quality.
The results confirmed our expectations, indicating that countries with higher government effec-
tiveness tend to have lower number of people killed and affected by natural disasters and more
specifically, lower number of people remained homeless – a factor which is unambiguously de-
pendent on the ability of governments to mitigate the effect of an adverse event. The analysis also
led to an unexpected result, showing that more effective governments tend to have lower number
of adverse events classified as natural disasters on the whole.
This finding made us extend our tests to study endogeneity problem in a greater detail. The analysis
revealed that the number of disasters a country faces per year could in turn affect government ef-
fectiveness. This finding requires a deeper qualitative investigation of the mechanisms behind the
relationship, but our interpretation is that political leaders in countries constantly hit by natural
disasters have low incentives to invest into long-term projects, such as building the necessary infra-
structure, which could reduce vulnerability. Instead they tend to focus on short-term benefits they
can obtain from being in office and maximize their gains. Such behavior reduces institutional quali-
ty, capacity of governments to perform their tasks and, as a result, government effectiveness.
16
REFERENCES
Adger, W. N. (2003) 'Social Capital, Collective Action, and Adaptation to Climate Change', Economic
Geography, 79, pp. 4.
Adger, W. N., Hughes, T. P., Folke, C., Carpenter, S. R. and Rockström, J. (2005) 'Social-ecological
resilience to coastal disasters', Science, 309(5737), pp. 1036-1039.
ADW (2012) World Risk Report 2012. , Berlin: Alliance Development Works in cooperation with
United Nations University, UNU-EHS, and the Nature Conservancy. .
Agrawal, A. (2001) 'Common property institutions and sustainable governance of resources', World
development, 29(10), pp. 1649-1672.
Agrawal, A. (2008) 'The role of local institutions in adaptation to climate change. ', International
Forestry Resources and Institutions Program. , Working Paper No. W091-3.
Beck, N. and Katz, J. N. (1995) 'What to do (and not to do) with time-series cross-section data',
American political science review, 89(03), pp. 634-647.
Bell, A. and Jones, K. (2015) 'Explaining fixed effects: Random effects modeling of time-series
cross-sectional and panel data', Political Science Research and Methods, 3(01), pp. 133-153.
Brooks, N., Adger, W. N. and Kelly, P. M. (2005) 'The determinants of vulnerability and adaptive
capacity at the national level and the implications for adaptation', Global environmental change, 15(2),
pp. 151-163.
Brown, H. C. P., Nkem, J. N., Sonwa, D. J. and Bele, Y. (2010) 'Institutional adaptive capacity and
climate change response in the Congo Basin forests of Cameroon', Mitigation and Adaptation Strategies
for Global Change, 15(3), pp. 263-282.
De Waal, A. (1997) Famine crimes : politics & the disaster relief industry in Africa. African issues
Bloomington: Indiana University Press.
DFID (2011) Defining Disaster Resilience: A DFID Approach Paper. London: DFID.

17
Dolésak, N. and Ostrom, E. (2003) The commons in the new millennium : challenges and adaptation. Politics,
science, and the environment Cambridge, Mass.: MIT Press.
Eakin, H. and Lemos, M. C. (2006) 'Adaptation and the state: Latin America and the challenge of
capacity-building under globalization', Global environmental change, 16(1), pp. 7-18.
EM-DAT (2014) The OFDA/CRED Internatioanl Disaster Database: Université Catholique de
Louvain, Brussels (Belgium). Available at: http://www.emdat.be (Accessed: 14 April 2014).
Engle, N. L. and Lemos, M. C. (2010) 'Unpacking governance: building adaptive capacity to climate
change of river basins in Brazil', Global Environmental Change, 20(1), pp. 4-13.
Füssel, H.-M. (2007) 'Vulnerability: a generally applicable conceptual framework for climate change
research', Global environmental change, 17(2), pp. 155-167.
Gupta, J., Termeer, C., Klostermann, J., Meijerink, S., van den Brink, M., Jong, P., Nooteboom, S.
and Bergsma, E. (2010) 'The adaptive capacity wheel: a method to assess the inherent
characteristics of institutions to enable the adaptive capacity of society', Environmental Science &
Policy, 13(6), pp. 459-471.
Haddad, B. M. (2005) 'Ranking the adaptive capacity of nations to climate change when socio-
political goals are explicit', Global Environmental Change, 15(2), pp. 165-176.
Hadenius, A. and Teorell, J. (2005) 'Assessing Alternative Indices of Democracy', C&M Working
Papers 6, IPSA, August 2005.
Heston, A., Summers, R. and Aten, B. (2012) 'Penn World Table Version 7.1' (Accessed.
ICRG (2014) A Business Guide to Political Risk for International Decisions New York: The PRS Group.
International Country Risk Guide.
IISD (2006) Natural Disasters and Resource Rights: Building resilience, rebuilding lives, Winnipeg: IISD.
Ivey, J. L., Smithers, J., de Loë, R. C. and Kreutzwiser, R. D. (2004) 'Community capacity for
adaptation to climate-induced water shortages: linking institutional complexity and local actors',
Environmental management, 33(1), pp. 36-47.

18
Kahn, M. E. (2005) 'The Death Toll from Natural Disasters: The Role of Income, Geography, and
Institutions', Review of Economics and Statistics, 87(2), pp. 271-284.
Kaufmann, D., Kraay, A. and Zoido, P. (1999) 'Governance Matters', World Bank Policy Reserach
Working Paper No. 2196.
La Porta, R., Lopez-de-Silanes, F., Shleifer, A. and Vishny, R. (1999) 'The quality of government',
Journal of Law, Economics, and organization, 15(1), pp. 222-279.
Lebel, L., Tan Sinh, B. and Nikitina, E. (2010) 'Chapter 6 Adaptive governance of risks: climate,
water, and disasters', Climate Change Adaptation and Disaster Risk Reduction: Issues and Challenges, pp.
115-142.
Liverman, D. M. (1990) 'Vulnerability to global environmental change', in al., K.e. (ed.)
Understanding Global Environmental Change: The Contributions of Risk Analysis and Management.
Worcester: Clark Univeristy.
Manyena, S. B. (2006) 'The concept of resilience revisited', Disasters, 30(4), pp. 434-450.
Ostrom, E. (1990) Governing the commons : the evolution of institutions for collective action. The Political
economy of institutions and decisions Cambridge England ; New York: Cambridge University Press.
Raschky, P. A. (2008) 'Institutions and the losses from natural disasters', Nat. Hazards Earth Syst.
Sci., 8(4), pp. 627-634.
Roe, E. and Schulman, P. R. (2012) 'Toward a Comparative Framework for Measuring Resilience in
Critical Infrastructure Systems', Journal of Comparative Policy Analysis: Research and Practice, 14(2), pp.
114-125.
Schröter, D., Polsky, C. and Patt, A. G. (2005) 'Assessing vulnerabilities to the effects of global
change: an eight step approach', Mitigation and Adaptation Strategies for Global Change, 10(4), pp. 573-
595.
Sen, A. (1981) Poverty and famines : an essay on entitlement and deprivation. Oxford: Oxford University
Press.
Sen, A. (1990) Individual Freedom as a Social Commitment. New York Review of Books: 14 June.

19
Shaw, R., Pulhin, J. M. and Jacqueline Pereira, J. (2010) 'Chapter 1 Climate change adaptation and
disaster risk reduction: An Asian perspective', Climate Change Adaptation and Disaster Risk Reduction:
An Asian Perspective, pp. 1-18.
Timmerman, P. (1981) 'Vulnerability, Resilience and the collapse of Society.', A Review of Models and
Possible Climatic Applications. Toronto, Canada: Institute for Environmental Studies, University of Toronto.
UNISDR (2012) Reducing Vulnerability and exposure to disasters: Asia-Pacific disaster report, Geneva: UN.
WB (2014) 'World Development Indicators, the World Bank' (Accessed: 26 March 2014).
Wisner, B. (2004) At risk : natural hazards, people's vulnerability, and disasters. 2nd edn. London ; New
York: Routledge.
Yohe, G. and Tol, R. S. (2002) 'Indicators for social and economic coping capacity—moving
toward a working definition of adaptive capacity', Global Environmental Change, 12(1), pp. 25-40.
20
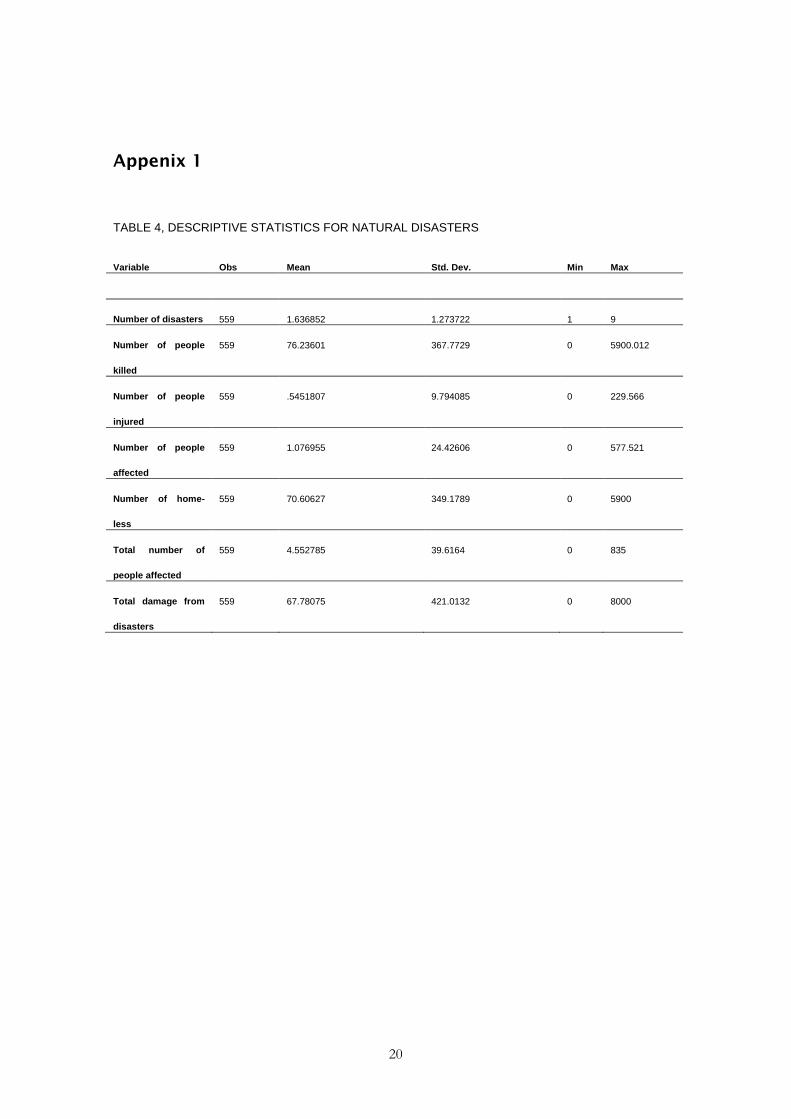
Appenix 1
TABLE 4, DESCRIPTIVE STATISTICS FOR NATURAL DISASTERS
Variable Obs Mean Std. Dev. Min Max
Number of disasters 559 1.636852 1.273722 1 9
Number of people
killed
559 76.23601 367.7729 0 5900.012
Number of people
injured
559 .5451807 9.794085 0 229.566
Number of people
affected
559 1.076955 24.42606 0 577.521
Number of home-
less
559 70.60627 349.1789 0 5900
Total number of
people affected
559 4.552785 39.6164 0 835
Total damage from
disasters
559 67.78075 421.0132 0 8000

21
TABLE 5, SUMMARY STATISTICS FOR INSTITUTIONAL VARIABLES
Variable Obs Mean Std. Dev. Min Max
Quality of Govern-
ment
188 .4458235 .1794442 .1018519 .9166667
Control of Corrupt-
ion
194 -.2036062 .8042136 -1.81587 2.355545
Government ef-
fectiveness
194 -.3688318 .7855291 -2.247716 2.170863
Democracy 461 6.893209 2.875027 .3042909 10

22
Appendix 2: The list of countries under investigation
1. Cape Verde 2. Micronesia 3. Barbados 4. Dominica 5. Bahamas 6. St Lucia 7. St Vincent and the Grenadines 8. Grenada 9. Dominican Republic 10. Vanuatu 11. Samoa 12. Jamaica 13. Trinidad and Tobago 14. Seychelles 15. Fiji 16. Papua New Guinea 17. Tonga 18. Guinea-Bissau 19. Haiti 20. Maldives 21. Cuba 22. Tuvalu 23. Nauru 24. Marshall Islands 25. St Kitts and Nevis 26. Mauritius 27. Kiribati 28. Palau 29. Belize 30. Antigua and Barbuda 31. Sao Tome and Principe 32. Suriname 33. Solomon Islands 34. Guyana 35. Timor-Leste 36. Comoros 37. Singapore