vulnerability analysis: methodologies, purpose, and policy application susanne milcher specialist,...
TRANSCRIPT

Vulnerability analysis:Methodologies, Purpose, and Policy Application
Susanne Milcher
Specialist, Poverty and Economic Development
UNDP Regional Centre
Bratislava
(14 June 2006)

Outline
The need of analysis and data for policy/project design and monitoring
Qualitative versus quantitative approach Examples of both approaches:
1. Semi-structured interviews/focus groups on people living with HIV/Aids
2. Household survey on Roma and the displaced

Need of vulnerability analysis
How can vulnerable groups, their causes of exclusion and particular needs be identified without disaggregated quantitative data (multidimensional aspects, double marginalisation)?
How can national-level policies that aim ensuring the sustainable inclusion of vulnerable groups be designed and resources be allocated without estimates of their size, problems and causes of problems?
How can priorities and sector capacity deficiencies be identified without complementary in-depth qualitative research?
How can policies be monitored and evaluated on their impact on vulnerable groups without data?
The need of analysis
What kind of analysis? Socioeconomic status Human rights aspects Legal aspects (frameworks)
Who elaborates it? The issue of trust and credibility Participation
Who is its target? Public en large National governments International organizations/partners

The role of data/indicators
Relevant profiles of vulnerability in the region are necessary for adequate programmatic and policy responses
Those most in need remain “hidden” behind the national averages Without a clear picture of the status and determinants of exclusion
and/or discrimination, actions are rather intuitive Can any analyses, resource allocation and policy be serious if not
backed by data? Setting targets, baselines Monitoring the progress Measuring the outcomes Assessing the impact

Quantitative versus qualitative approach
Quantitative approach
1. Theory, hypotheses (i.e. women are more vulnerable to poverty because they face higher unemployment, lower education, discrimination, etc.)
2. Indicators needed (employment rate, unemployment rate, poverty rate, educational attainments)
3. Data collection (labour force survey) – questions on employment activity, income in the last month, job search, educational attainments and enrolment – individual level data to be able to account for sex, age, ethnicity, etc.)
Goal => Status registration, correlations and causal links

Quantitative versus qualitative approach (cont.)
Qualitative approach
1. Social reality, social constructs
2. The meaning and reasons of human actions and decision-making result from interaction and therefore can only be observed through understanding the social structures determining these actions
3. Information/data collection (interviews, observation, focus groups) – e.g. information on the extent and types of discrimination, quality of social services, satisfaction of beneficiaries
4. Theory, hypotheses development
Goal => Perceptions and attitudes registration, priority identification

Representative and comparable Causal analysis, identification of inequalities Researcher pre-determines the communication
(close) Limited participation Hypotheses, questionnaires, (random) sampling,
fieldwork Objective and distanced analysis Conclusions based on a statistical logical analysis
(deductive)
Characteristics of quantitative research

Interactive and communicative Hypotheses developing Interpretative, understanding linkages Dynamic and flexible process Subjective Theoretical sampling Explanatory data analysis Conclusions based on repeated experiences
(inductive)
Characteristics of qualitative research

Criticism to both approaches
Qualitative:
- sample too small (1-5 people or single case study)
- analysis not representative, subjective
- cannot make generalizations
Quantitative:
- distance to reality
- reductive
- limited participation or dynamic interaction

Which approach to choose?
Choose the approach that better fits to the type of information you want to get (status or perceptions) and the need for this information (resource allocation, priority setting, causal analysis)
Combining both approaches for proper vulnerability analysis possible but time and cost-extensive
Better use existing data and research, proxies Both approaches have to be adapted to objective of research and
social reality (i.e. MDG indicators, questions to address gender or issues, sampling and fieldwork; focus group design, types of
questions asked, moderation)

Example: People living with HIV/Aids Type of information collected
Perceptions of people living with HIV/Aids and relevant stakeholders on the type of challenges for this group and the institutions in terms of access, quality and availability to health care, education, employment
Process
1. Identification of participants, close cooperation with NGOs working with target community
2. Develop focus groups/interviews sensitive and responsive to different sub-groups (IDUs, men having sex with men, sex workers and parental infected children)
3. Questions and moderation
4. Transcript processing and analysis

Example: Roma and displaced household survey (cont.)
Type of information collected
Status of Roma, displaced (IDPs/refugees) and majority living in close proximity and determinants of vulnerability
Process
1. Two separate questionnaires (status of the household and of each individual member)
2. Sampling – households in areas with compact Roma population (municipalities or neighborhoods with share of Roma population at and above the national average), majorities living in close proximity to Roma and IDPs/refugees where relevant
3. Fieldwork (interviewer training, Roma assistant interviewers)
4. Data clean up, processing and analysis

Example: Roma and displaced household survey (cont.) MDG indicators: poverty rate, enrolment rate, maternal and infant
mortality rate, access to water and sanitation Social exclusion indicators: (long-term) unemployment rate, ethnic
and gender ratio of unemployment, items in household, political participation, access to health and credit services, land
Vulnerability profiles of all members of the household (special needs of elderly, women, children, low educated, unemployed, poor)
Comparability across countries Comparability to national HBS and LFS could give an idea of the
distance from national averages Data on the status of “non-Roma living in close proximity” could
give an idea of the non-group related determinants of vulnerability
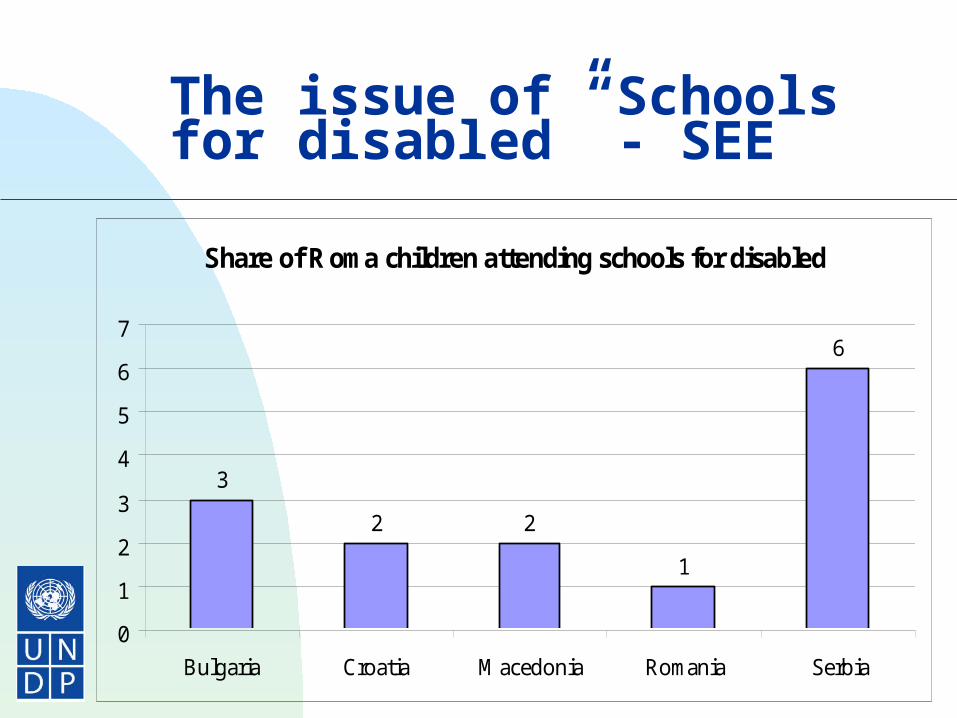
The issue of “Schools for disabled” - SEE
Share of Roma children attending schools for disabled
3
2 2
1
6
0
1
2
3
4
5
6
7
Bulgaria Croatia Macedonia Romania Serbia
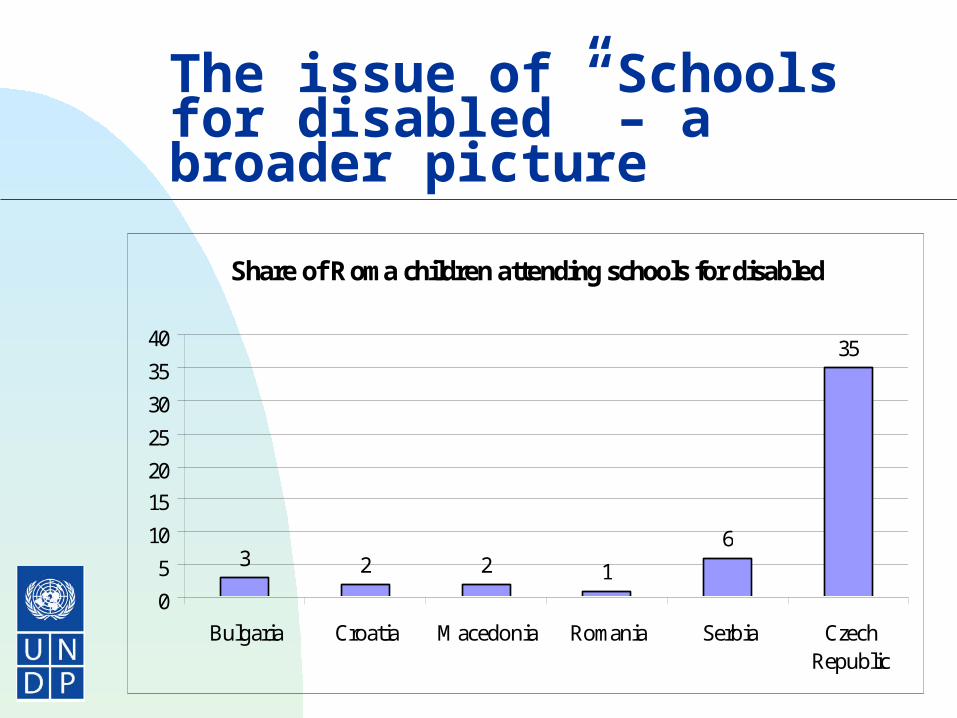
The issue of “Schools for disabled” – a broader picture
Share of Roma children attending schools for disabled
3 2 2 1
6
35
0
5
10
15
20
25
30
35
40
Bulgaria Croatia Macedonia Romania Serbia CzechRepublic
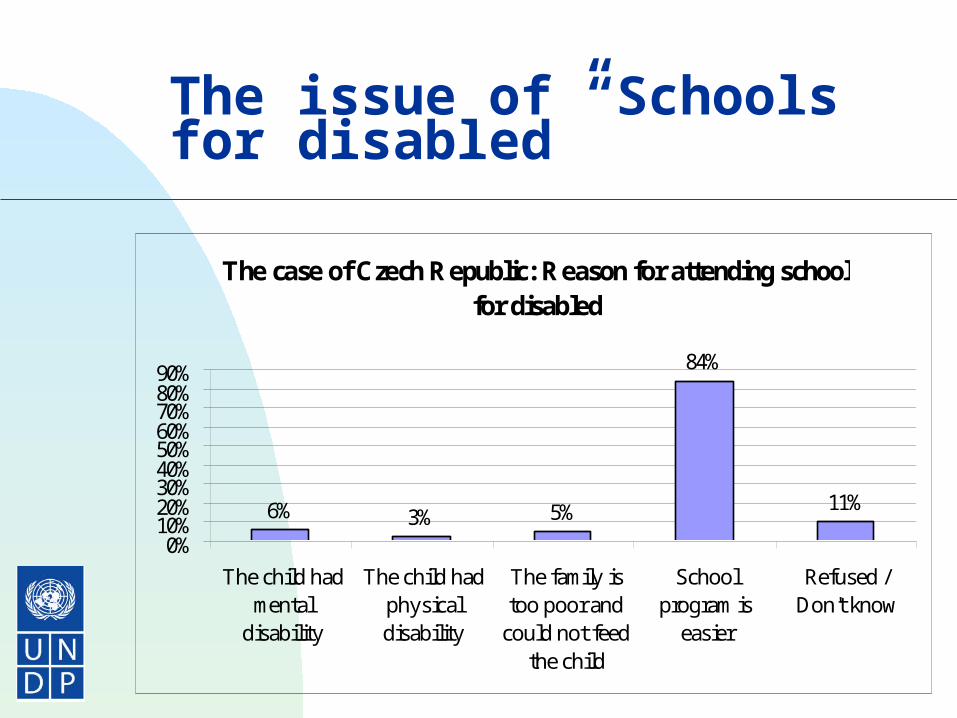
The issue of “Schools for disabled”
The case of Czech Republic: Reason for attending school for disabled
6% 3% 5%
84%
11%
0%10%20%30%40%50%60%70%80%90%
The child hadmental
disability
The child hadphysicaldisability
The family istoo poor and
could not feedthe child
Schoolprogram is
easier
Refused /Don't know

Thank you!
Bratislava Regional Center35 Grosslingova
81109 Bratislava, Slovak Republic
+421 2 59337 111www.undp.org/europeandcis
http://roma.undp.skhttp://vulnerability.undp.sk
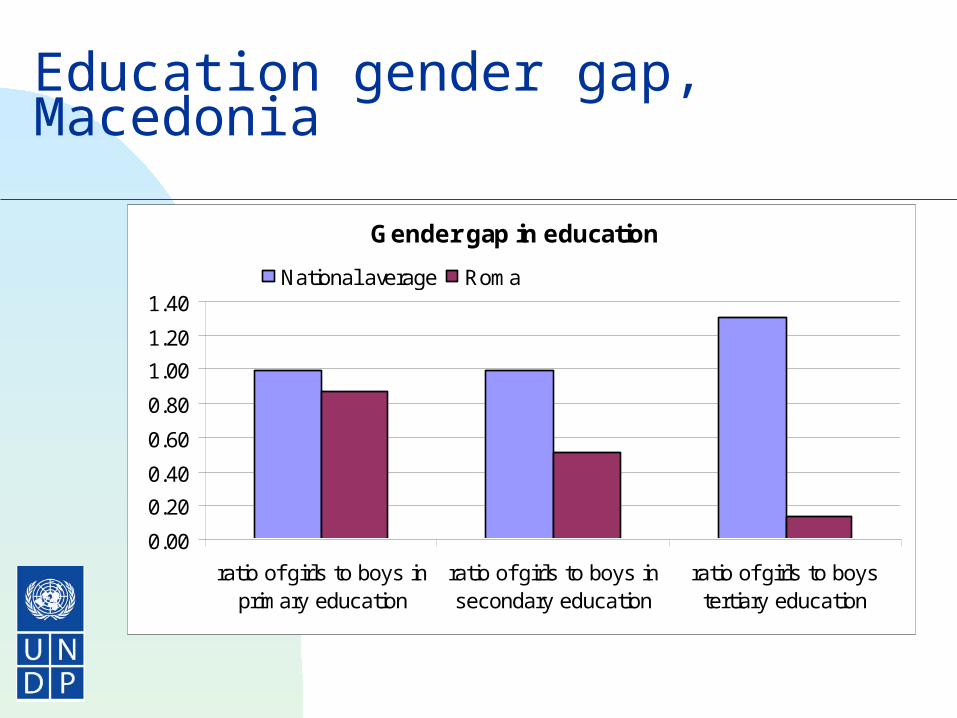
Education gender gap, Macedonia
Gender gap in education
0.00
0.20
0.40
0.60
0.80
1.00
1.20
1.40
ratio of girls to boys inprimary education
ratio of girls to boys insecondary education
ratio of girls to boystertiary education
National average Roma

Correlation between occupation and skill level
Figure 2: Type of occupation by education for Roma
0.00
10.00
20.00
30.00
40.00
50.00
60.00
70.00
80.00
None orincomplete
Primary Incompletesecondary
Secondary Higher
Skilled business occupation Skilled public sector occupation
Skilled rural occupation Semi or unskilled occupation
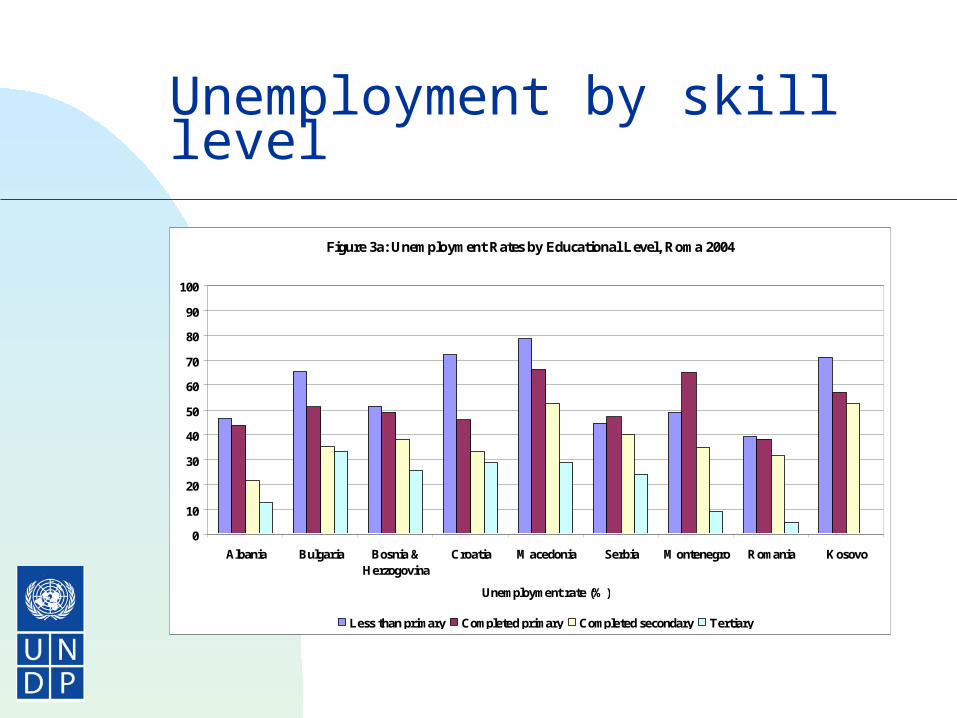
Unemployment by skill level
Figure 3a: Unemployment Rates by Educational Level, Roma 2004
0
10
20
30
40
50
60
70
80
90
100
Albania Bulgaria Bosnia &Herzogovina
Croatia Macedonia Serbia Montenegro Romania Kosovo
Unemployment rate (%)
Less than primary Completed primary Completed secondary Tertiary
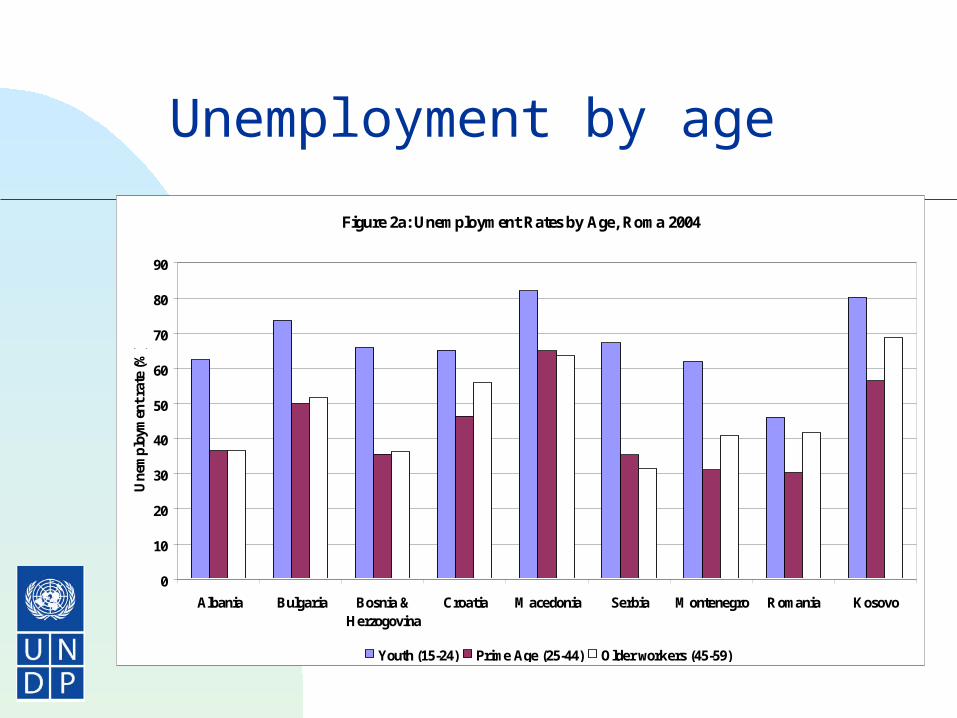
Unemployment by age
Figure 2a: Unemployment Rates by Age, Roma 2004
0
10
20
30
40
50
60
70
80
90
Albania Bulgaria Bosnia &Herzogovina
Croatia Macedonia Serbia Montenegro Romania Kosovo
Un
emp
loym
ent
rate
(%
)
Youth (15-24) Prime Age (25-44) Older workers (45-59)
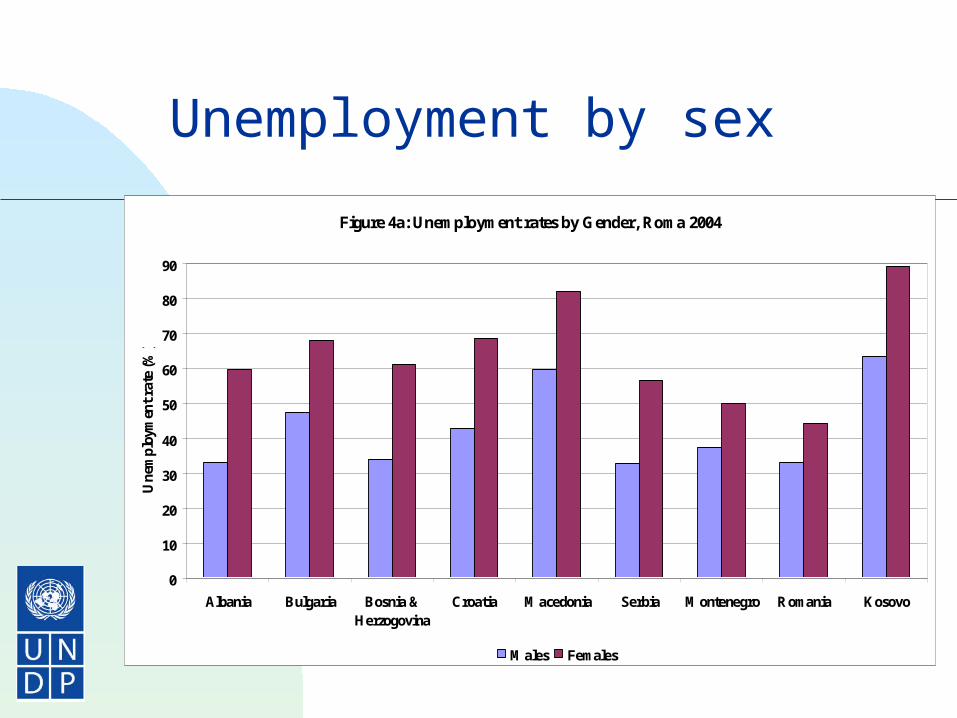
Unemployment by sex
Figure 4a: Unemployment rates by Gender, Roma 2004
0
10
20
30
40
50
60
70
80
90
Albania Bulgaria Bosnia &Herzogovina
Croatia Macedonia Serbia Montenegro Romania Kosovo
Un
emp
loym
ent
rate
(%
)
Males Females

Vicious circle of outstanding payments
Share of outstanding electricity payments out of total expenditures
0100200300400500600700800900
Non-Roma livingin close
proximity toRoma
Roma R & IDPs
Non-poor
Poor