vsl – staying in control - efmws.eu · aga 10 gpa 2145 sgerg88 gpa 2172 base conditions iso 6976...
TRANSCRIPT

VSL – Staying in control
“an introduction in uncertainty”
Remco van den BergRens van den Brink

Content
- Introduction: VSL, Remco, Rens
- Requirements of flow metering
- Mathematics in uncertainty calculation
- Real life applications
- Unraveling the complexity of the system
- Meeting the requirements

VSL

VSL tasks and services
Research and Development
- Development/maintenance national measurement standards
- International traceability assurance
- Research in metrology and measurement systems
Calibration and Reference materials
- Calibrations
- Reference materials
- Proficiency testing, inter-laboratory comparisons
Customized Applied Metrology
- Consultancy
- R&D Contracts
- International projects, Training

The calibration and test labs of VSL
Time and frequency
ElectricityTemperature and humidity
Length
Gas flow
Viscosity
OpticsChemistry Mass
Ionisingradiation
PressureLiquid flow and volume

Remco van den Berg
- Metrologist Flow & Volume
- 15 year in flow measurements
- Calibration of liquid, gas flow and volume meters
- Validation and certification of calibration facilities and metering systems and custody transfer
- Lab -> field ->Customized Metrology ->lab and field
- 45 years, married and two children
- Hobbies: running and

Rens van den Brink
- Metrologist at VSL Flow
- 18 years in flow measurements
- Calibration of gas flow meters (high and low pressure)
- Validation and evaluation of calibration facilities
- Maintenance and development of primary flow standards
- Training and consultancy

General requirements of metering and goals to achieve
- Conformity- To written standards, legal regulations
- Traceability- To (inter-)national measurement standards and
references
- Accuracy- Reduce systematic measurement error
- Precision- Achieve lowest possible
uncertainty

Conformity
- Select the applicable standards
- Agree on the standards with your supplier orcustomer
- Get to know the applicable standards

Written standards (1)
Organisations involved in writing standards (for natural
gas measurement):
API American Petroleum institute
AGA American Gas Association
GPA Gas Producers Association
ANSI American National Standards Institute
ASTM American Society of Testing Material
BS British Standard
EN European Norm
IP Institute of Petroleum (UK)
ISO International Organization for Standardization
OIML International Organization for Legal Metrology
10
GFM2011 Module 4B 11
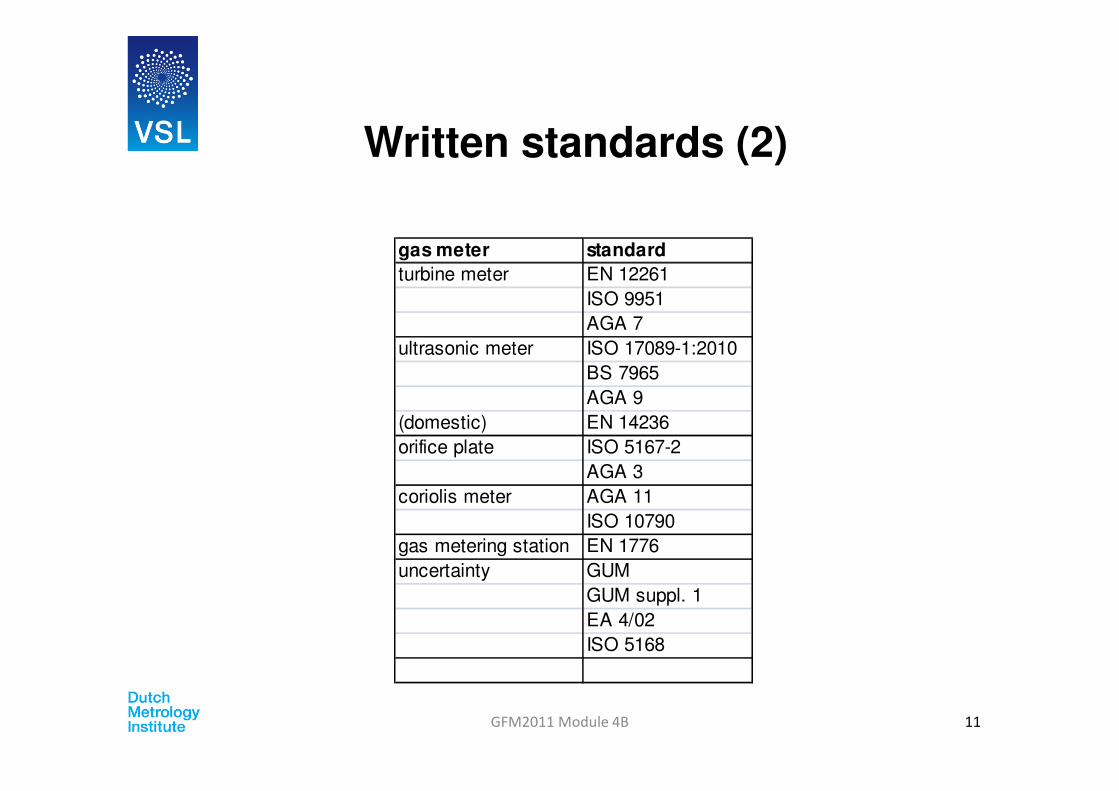
gas meter standard
turbine meter EN 12261
ISO 9951
AGA 7
ultrasonic meter ISO 17089-1:2010
BS 7965
AGA 9
(domestic) EN 14236
orifice plate ISO 5167-2
AGA 3
coriolis meter AGA 11
ISO 10790
gas metering station EN 1776
uncertainty GUM
GUM suppl. 1
EA 4/02
ISO 5168
Written standards (2)
GFM2011 Module 4B 12
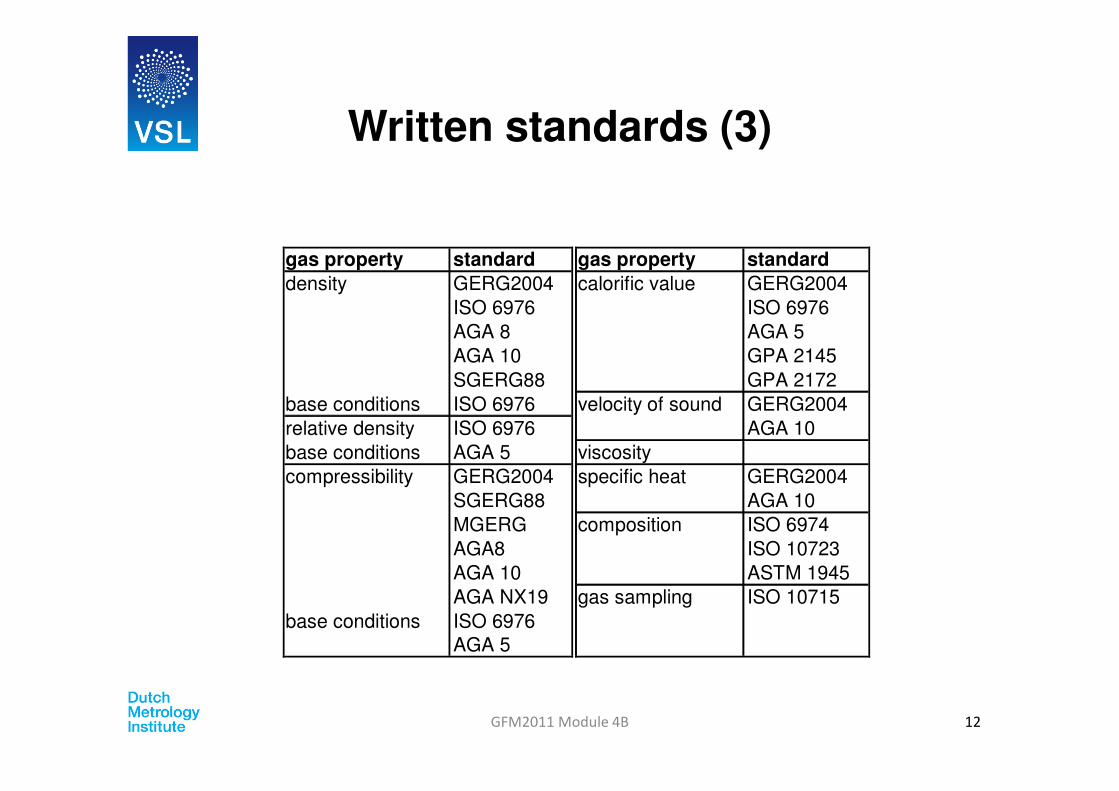
gas property standard gas property standard
density GERG2004 calorific value GERG2004
ISO 6976 ISO 6976
AGA 8 AGA 5
AGA 10 GPA 2145
SGERG88 GPA 2172
base conditions ISO 6976 velocity of sound GERG2004
relative density ISO 6976 AGA 10
base conditions AGA 5 viscosity
compressibility GERG2004 specific heat GERG2004
SGERG88 AGA 10
MGERG composition ISO 6974
AGA8 ISO 10723
AGA 10 ASTM 1945
AGA NX19 gas sampling ISO 10715
base conditions ISO 6976
AGA 5
Written standards (3)

Traceability
Proof it: Build the piramid:

Traceability
BIPM
VSL
Manufacturers
End users
Metrological traceability requires an established calibration hierarchy
VSL and/or
calibration
laboratoriesSI
SI
National/ Primary
Standards
Secondary / Working Standards
Instruments in the field
Calib
ratio
n h
iera
rchy
sm
all to
hig
he
r un
ce
rtain
ty
calibration hierarchy

VIM (1)

VIM (2)
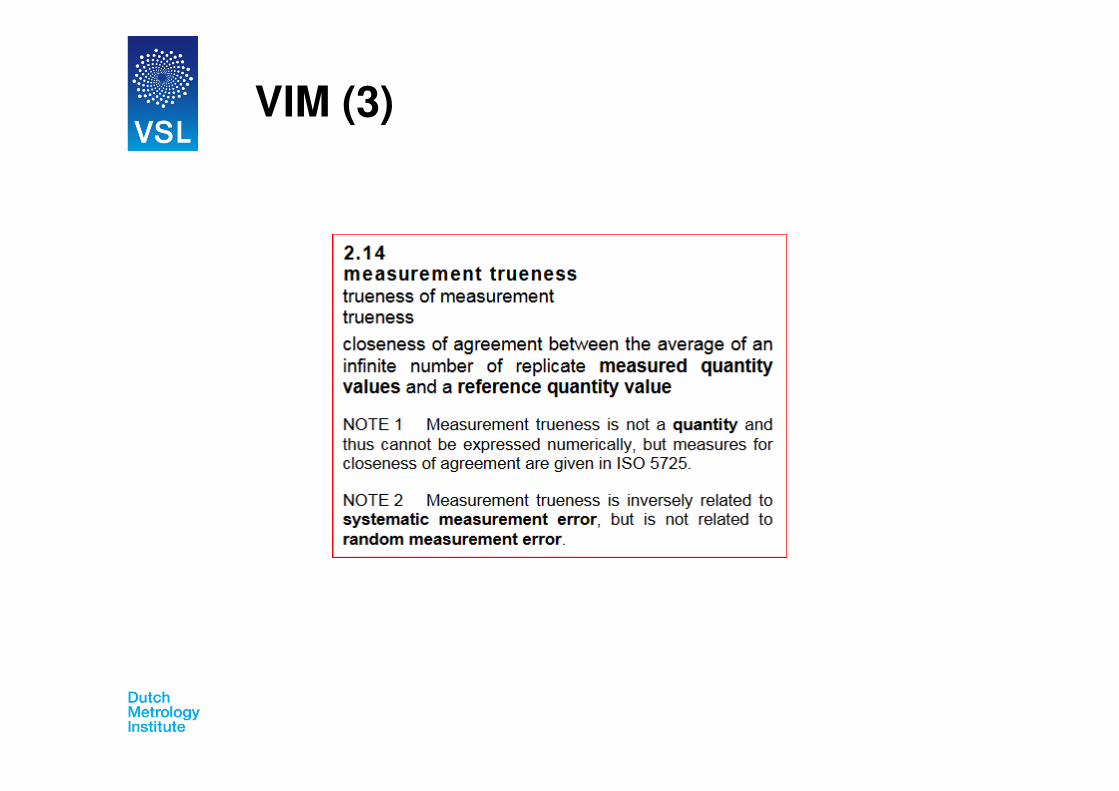
VIM (3)

VIM (4)

Accuracy and Precision!

Uncertainty: The recipe
1. Describe the measurement set-up
2. Determine the mathematical modelgive the relation between all input quantities and the measurement results (output quantity)
3. Determine for each input quantity:a. The value and its uncertainty
b. The distribution function and the standard uncertainty
c. How sensitive is the measurement result for a variation in this input quantity
d. The uncertainty contribution in the measurement result
Fill in the uncertainty table
4. Determine and present the result

Simpel Mathematical Model1-Measurement setup
2-Mathematical model
FT Energy
Energy (MJ) = Quantity (m3) x Quality (MJ/m3)

Adding uncertainties2-mathematical rules
Un
cert
ain
ty
System Configuration
Component A Component B Utotaal

Contribution of uncertainty sources
With: Uflow = 0.3% rel.
UH = 0.5% rel. Uenergy = 0.58% rel.
With: Uflow = 0.2% rel.
UH = 0.5% rel. Uenergy = 0.54% rel.
With: Uflow = 0.3% rel.
UH = 0.2% rel. Uenergy = 0.36% rel.

The GUM3-Uncertainty
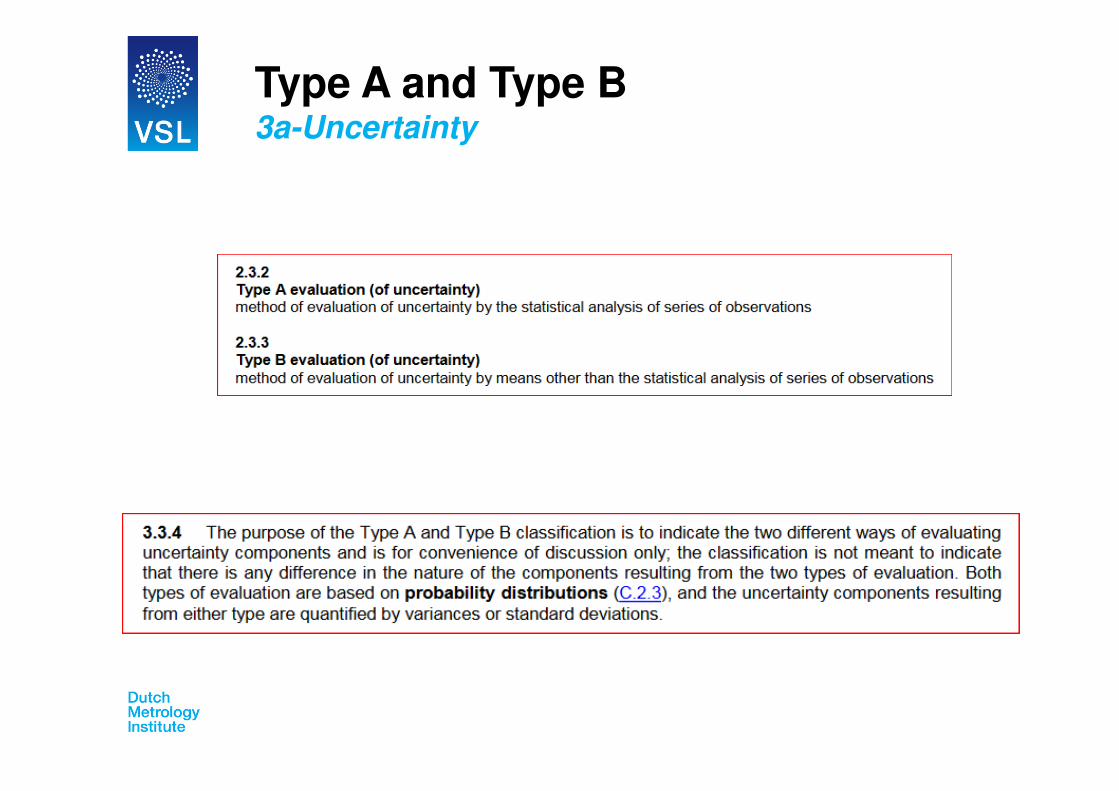
Type A and Type B3a-Uncertainty

Correlated and uncorrelated uncertaintysources3a-Uncertainty
Examples:
- Pressure and Z (compressibility)
- Fluctuating Flow (Reference and MUT)
- …
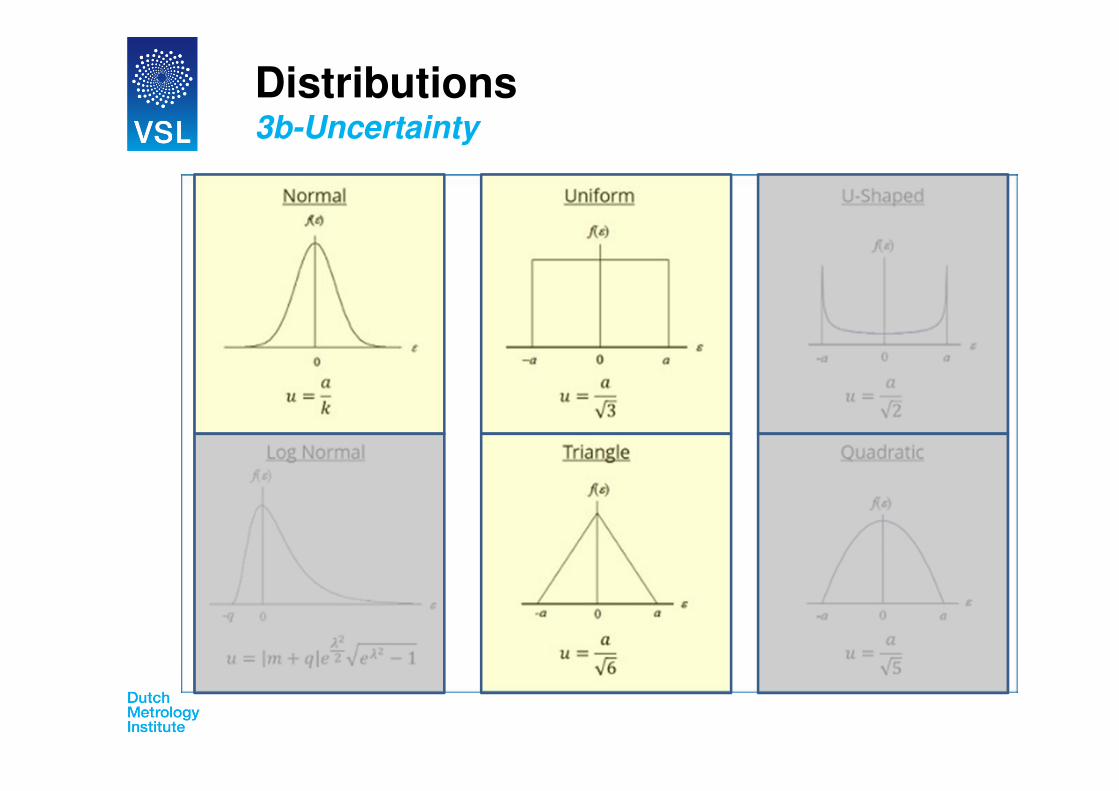
Distributions3b-Uncertainty
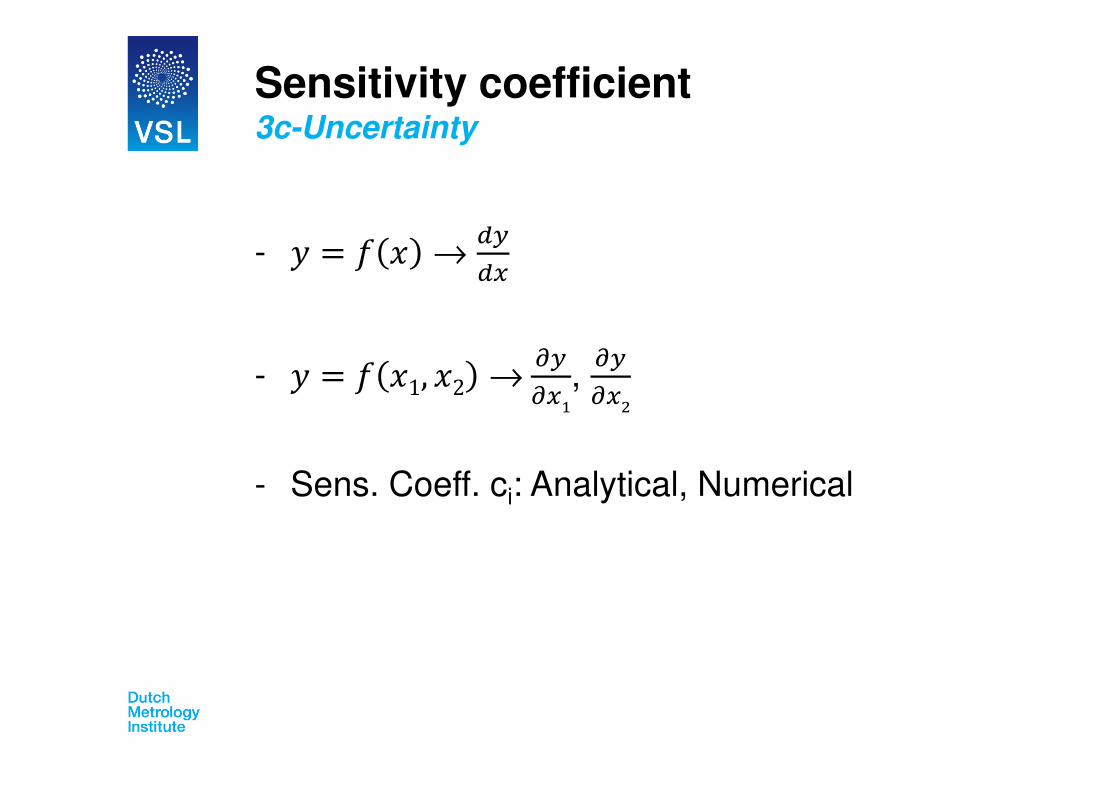
Sensitivity coefficient3c-Uncertainty
- = →
- = 1, 2 →
,
- Sens. Coeff. ci: Analytical, Numerical

Analytical examples
- = .
- =
- = ·
- = · 1+ · 2- = 2
- = √
- =
- =

Numerical examples
Math. model: Math. model:
y=x^2 y=exp(x) * sqrt(x) + (5 + x^2) / (5 + sin(x))
x 10.000 x 2.0000
dx 0.001 dx 0.0002
y (x) 100.00 y (x) 11.9727
y (x+dx) 100.02 y (x+dx) 11.9755
dy 0.02 dy 0.0028
Numerical: Numerical:
dy/dx 20.001 dy/dx 13.85 check by changing dx
Analytical: Analytical:
dy/dx = 2x 20.000 dy/dx = ???

Contribution3d-Uncertainty
- = ·
- ~
- ~
- ~!"!#

Uncertainty Table
Quantity Xi
Estimate xi Uncertaint
y
Probability distribution and k-factor
Standard deviation
u(xi)
Sensitivity coeffiicent
ci
[E/xi]
Uncertainty contribution
ui(∆E ) [E]
Uncertainty contribution
ui(∆E/∆E) [%]
∆Vn [m3] 6876 20.6 Normal
K=2 10.3 3.835E+07 7.91E+07 0.30
Hs [J.m-3] 3.835E+07 76700 Normal
K=2 38350
6.876E+03
5.27E+08 0.20
∆E [J] 2.637E+11
Expanded Uncertainty
(k=2): 1.55E+09 0.36
MODEL: Energy (J) = Quantity (m3) x Quality (J/m3)

Energy measurement systems (1)
GFM2011 Module 4B 33
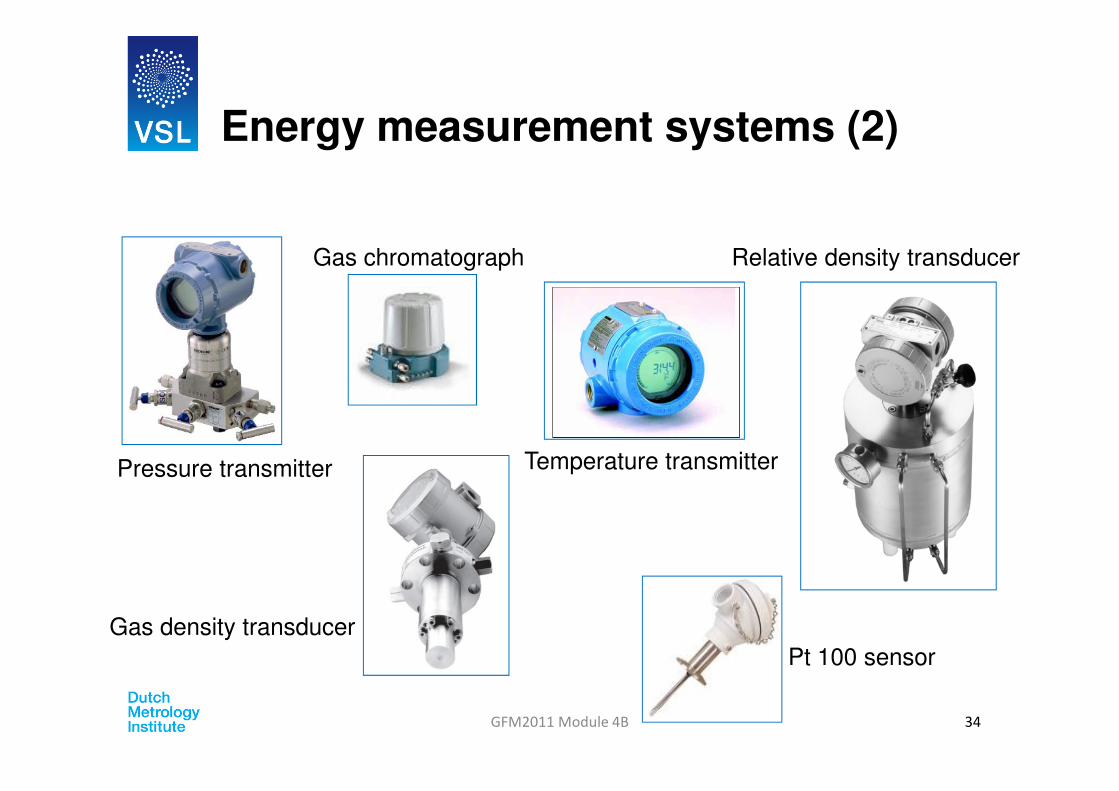
Energy measurement systems (2)
GFM2011 Module 4B 34
Pressure transmitter
Relative density transducer
Gas density transducer
Gas chromatograph
Temperature transmitter
Pt 100 sensor

Energy measurement systems (3)
GFM2011 Module 4B 35
Hydrocarbon dew point
analyser
Flow Computer
Turbine meter
Orifice plate
Ultrasonic meter

GFM2011 Module 4B 36
Adjustable temperature
Adjustable pressure
Reference sensors/
read out
Energy measurement systems (4)
CRMCertified
Reference
Material
VSL equipment:
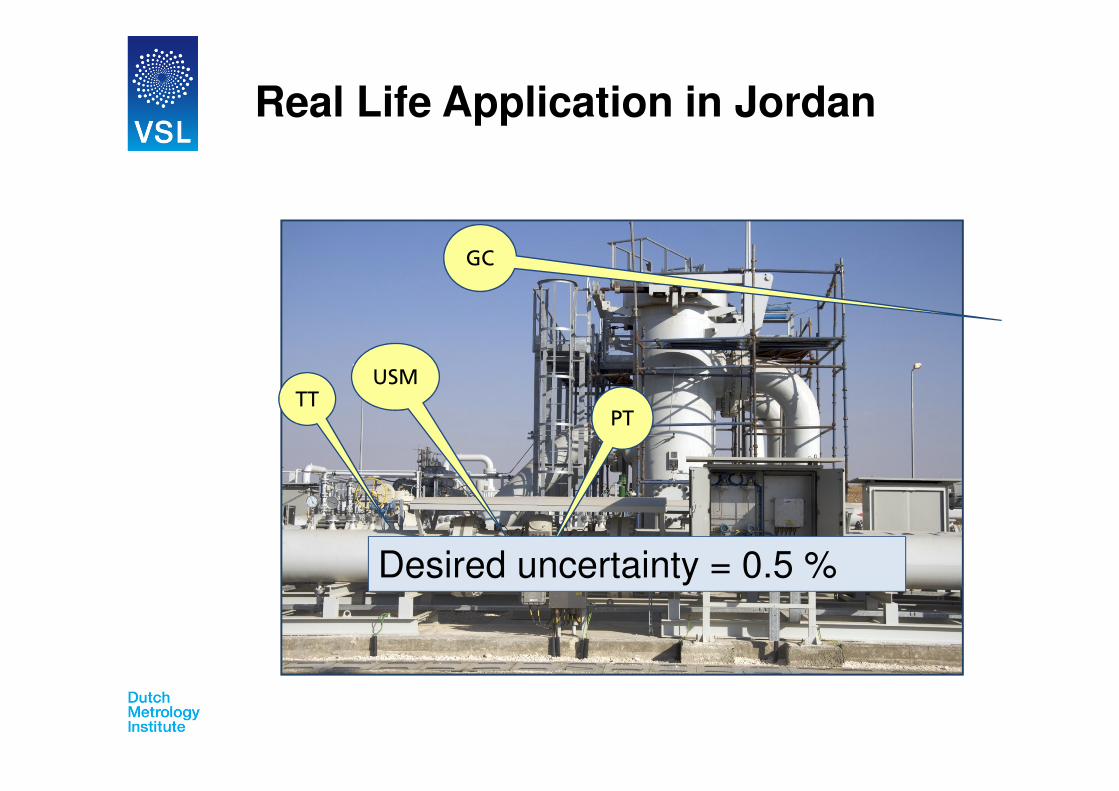
Real Life Application in Jordan
USM
PTTT
GC
Desired uncertainty = 0.5 %

Real Life App: Mathematical Model
- Real Gas
- Determination of measured Volume
$ =% ·& &%
·' '%· $% ·
1
1 + ()
- Determination of measured Energy
* =% ·& &%
·' '%· $% ·
1
1 + ()· +,
KZ
V
T
P
i
i
i
i=⋅

Real Life App: Uncertainty Budget
quantity estimate source of estimate uncertainty sensitivity uncertainty uncertainty
coefficient contribution contribution
X i x i U(x i ) c i U i ( ∆ V) U i ( ∆ V/ ∆ V)
(2s) [V/x i ] [V] [%]
P m [bar] 31 uncertainty calibration 0,0485 1,86E+02 9,04 0,16
P n [bar] 1,01325 standard pressure 0 -5,70E+03 0,00 0,00
T n [K] 288,15 standard temperature 0 2,01E+01 0,00 0,00
T m [K] 292,15 uncertainty calibration 0,20 -1,98E+01 3,96 0,07
V a [m3 ] 1,808E+02
totalisation of the flow
computer0 3,20E+01 0,00 0,00
e m [-] 0,0050 total uncertainty calibration 0,20% -5,75E+03 11,50 0,20
V n [m 3 ] 5,78E+03expanded uncertainty (k=2)
on volume measurement1,52E+01 0,26
quantity estimate source of estimate uncertainty sensitivity uncertainty uncertaintycoefficient contribution contribution
X i x i U(x i ) c i U i ( ∆ E) U i ( ∆ E/ ∆ E)[E/x i ] [E] [%]
H s [J.m-3
] 3,86E+07 uncertainty in calorific value 5,80E+04 5,78E+03 3,349E+08 0,15
E [J] 2,23E+11expanded uncertainty (k=2)
on energy measurement3,35E+08 0,30
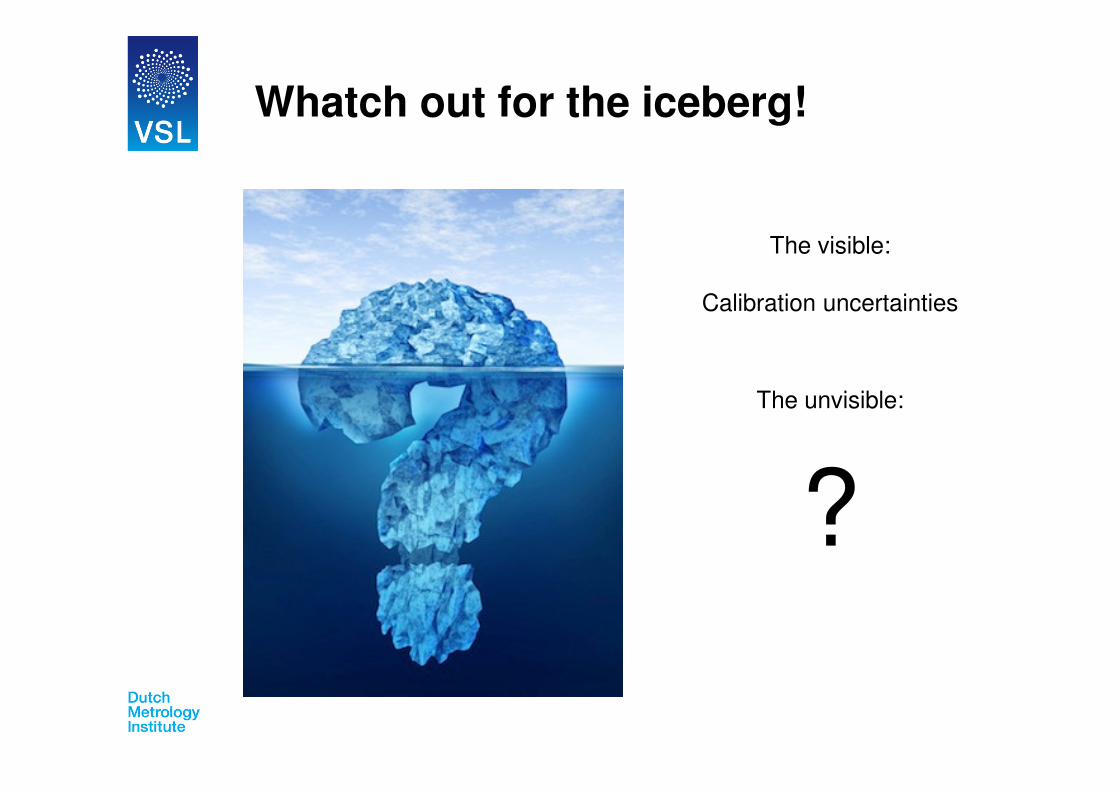
Whatch out for the iceberg!
The visible:
Calibration uncertainties
The unvisible:
?
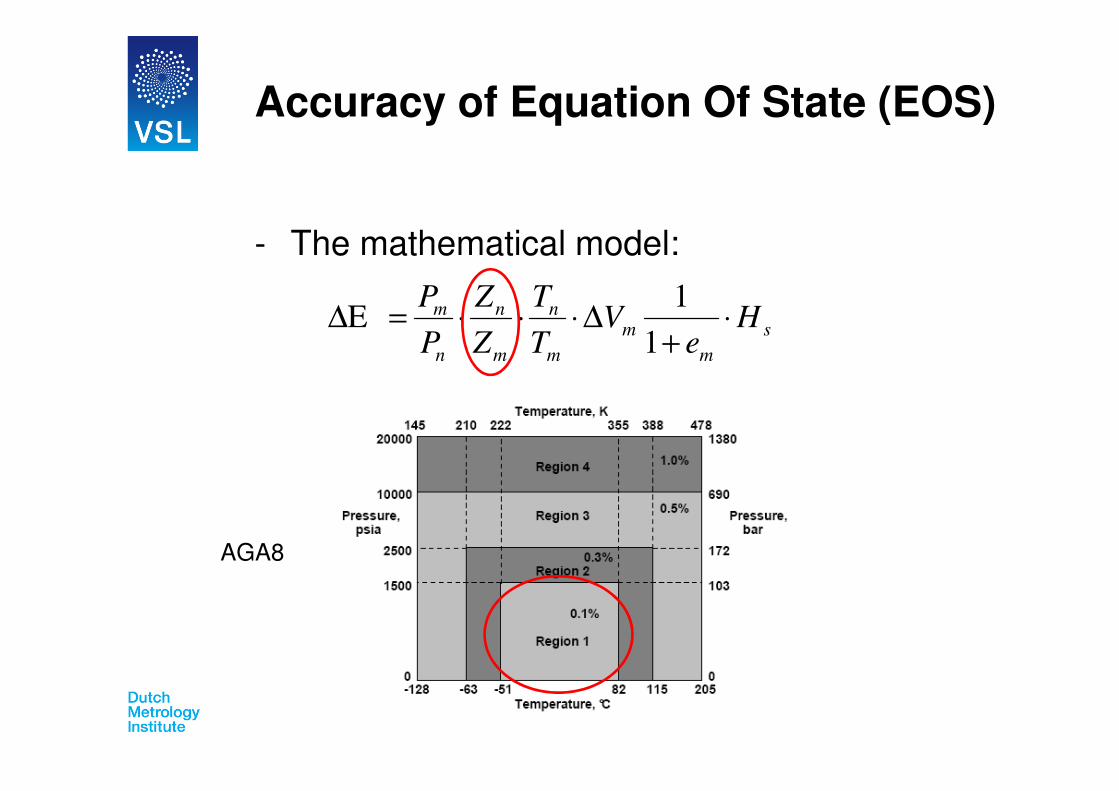
AGA8
Accuracy of Equation Of State (EOS)
- The mathematical model:
s
m
m
m
n
m
n
n
mH
eV
T
T
Z
Z
P
P⋅
+∆⋅⋅⋅=∆
1
1E

quantity estimate source of estimate uncertainty sensitivity sensitivity uncertainty uncertainty
coefficient coefficient contribution contribution
X i x i U(x i ) c i c i U i ( ∆ V) U i ( ∆ V/ ∆ V)
(2s) [V/x i ] [V/x i ] [V] [%]
P m [bar] 31 uncertainty calibration 0,0485 1,86E+02 1,86E+02 25,57 0,44
P n [bar] 1,01325 standard pressure 0 -5,70E+03 -5,19E+03 0,00 0,00
Z n [-] 0,997839 uncertainty of AGA8 algorithm 0,10% 5,79E+03 5,79E+03 5,78 0,10
Z m [-] 0,937705 uncertainty of AGA8 algorithm 0,09% -6,16E+03 -5,57E+03 5,78 0,10
T n [K] 288,15 standard temperature 0 2,01E+01 2,01E+01 0,00 0,00
T m [K] 292,15 uncertainty calibration 0,20 -1,98E+01 -1,98E+01 9,15 0,16
V a [m3 ] 1,808E+02
totalisation of the flow
computer0 3,20E+01 3,20E+01 0,00 0,00
e m [-] 0,0050 total uncertainty calibration 0,20% -5,75E+03 -5,23E+03 18,19 0,31
V n [m 3 ] 5,78E+03expanded uncertainty (k=2)
on volume measurement3,38E+01 0,58
quantity estimate source of estimate uncertainty sensitivity uncertainty uncertainty
coefficient contribution contribution
X i x i U(x i ) c i U i ( ∆ E) U i ( ∆ E/ ∆ E)
[E/x i ] [E] [%]
H s [J.m-3
] 3,86E+07 uncertainty in calorific value 5,80E+04 5,78E+03 3,349E+08 0,15
E [J] 2,23E+11expanded uncertainty (k=2)
on energy measurement3,35E+08 0,60
Add the Accuracy of EOS

Installation Effects
Pressure
Piping (flow profile)
Temperature
Etc…….
Vibrations
EMC
Fluid properties

- On Temperature Measurement
- On Pressure Measurement
- On Flow Meter
- On GC
Installation Effects

Inventarisation of the different
uncertainty sourcesIn practice, there are many possible sources of uncertainty in a measurement, including:
• a) incomplete definition of the measurand;
• b) imperfect reaIization of the definition of the measurand;
• c) nonrepresentative sampling — the sample measured may not represent the defined measurand;
• d) inadequate knowledge of the effects of environmental conditions on the measurement or imperfect
• measurement of environmental conditions;
• e) personal bias in reading analogue instruments;
• f) finite instrument resolution or discrimination threshold;
• g) inexact values of measurement standards and reference materials;
• h) inexact values of constants and other parameters obtained from external sources and used in the
• data-reduction algorithm;
• i) approximations and assumptions incorporated in the measurement method and procedure;
• j) variations in repeated observations of the measurand under apparently identical conditions.
GFM2011 Module 4B 45

Flip over
Give me your thoughts
GFM2011 Module 4B 46

Ambient Conditions

2-wire or 4-wire PT100
GFM2011 Module 4B 48
Distance 50m
Resistance of Copper cable 0.5 mm2 34,5Ω/km
Cable Ressitance (R0) 3,450Ω
Initial Temp (T0) 20°C
Temp Coeff (α) 0,0039Ω/°C
Actual Temp (T) 40°C
Actual Resistance (R) 3,719Ω
dR 0,269Ω
Difference in Temperature 0,70°C
- = -. 1 + / · ' − '.

Excel sheet
Where the magic happens
GFM2011 Module 4B 49

Long term Stability
-0.02
0.00
0.02
0.04
0.06
0.08
0.10
0.12
Un
cert
ain
ty [
%]
Long Term Stability @ calibration period of 2 year
(taken from Data sheet)

Flow Computer Selection
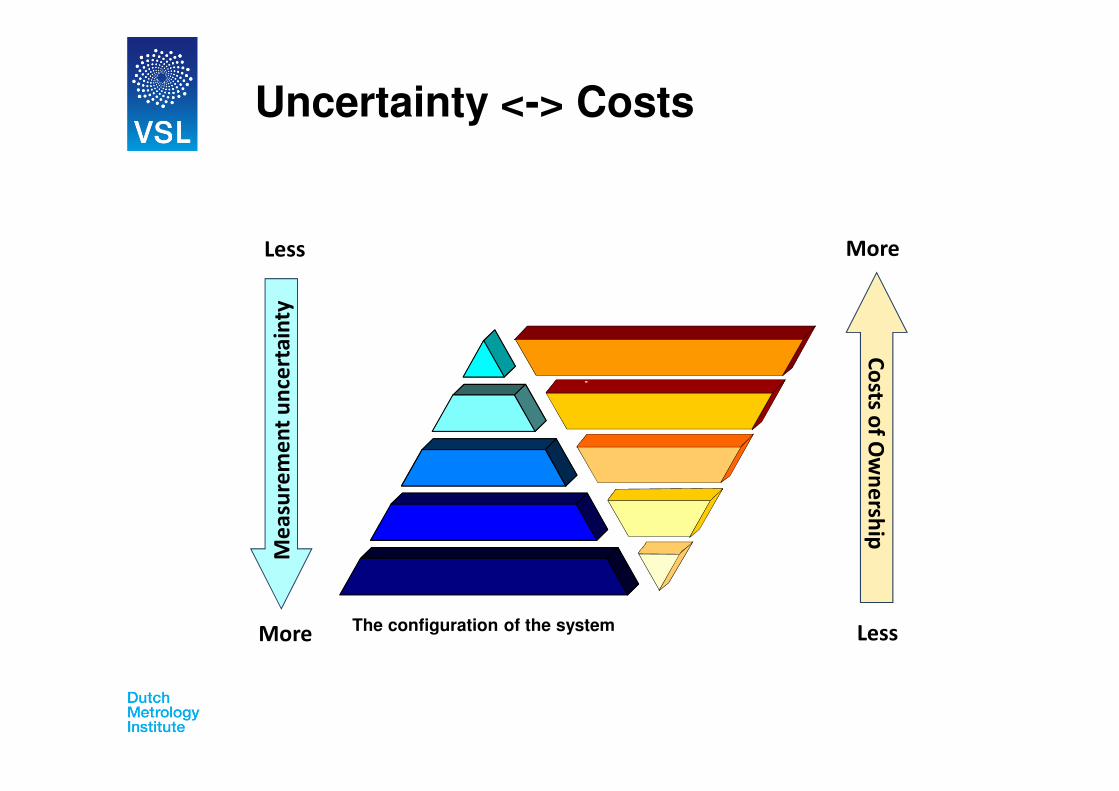
Uncertainty <-> Costs
-
The configuration of the system
Less
Me
asu
rem
en
t u
nce
rta
inty
More Less
Co
stso
f Ow
ne
rship
More
-

Maximum Profit
-20
-15
-10
-5
0
5
10
15
0 0.5 1 1.5 2 2.5 3
Mo
ne
y [
x1
0 k
€]
Uncertainty [%]
Investering in Meetsysteem Winst OmzetInvestment in system Profit Sales
Profit = f(Uncertainty)
Optimum

Where to put your Effort (=$ / € / ₽)
38%
0%8%
9%0%
13%
0%
27%
3% 2%Pm [bar]
Pn [bar]
Zn [-]
Zm [-]
Tn [K]
Tm [K]
Va [m3]
em [-]
Ct [-]
Cp [-]

More Balanced Uncertainty
27%
0%
11%
11%0%8%0%
36%
4% 3%Pm [bar]
Pn [bar]
Zn [-]
Zm [-]
Tn [K]
Tm [K]
Va [m3]
em [-]
Ct [-]
Cp [-]

Other Sources of Uncertainty or Error (1)
Flow computer Configuration
- Correct all input and output I/O’s that influence the outcome of the measurement
- Enough correction points for the I/O’S
- Use the correct formula’s
- Base conditions throughout the software

Other Sources of Uncertainty or Error (2)
Equipment
- Suitable ranges; input and output
- Suitable measurement technique
- Right I/O connections
User Errors
- During Maintenance
- During Replacement- Do not make assumptions!

VSLPO Box 6542600 AR DelftThe Netherlands
TFEI
Erik SmitsE
Remco van den BergE
+31 15 269 15 00+31 15 261 29 [email protected]
VSL group:http://lnkd.in/Bif3Sy
VSL Fluid Flow Metrology group:http://lnkd.in/DF2zJx
Questions ?
Rens van der BrinkE [email protected]