vomiting hhs public access dysrhythmia in patients with
TRANSCRIPT

13 March 2022
Loss of Interstitial Cells of Cajal and Patterns of Gastric Dysrhythmia in Patients With Chronic Unexplained Nausea andVomiting / Angeli, Tr; Cheng, Lk; Du, P; Wang, Th; Bernard, Ce; Vannucchi, M; Faussone-Pellegrini, Ms; Lahr, C;Vather, R; Windsor, Ja; Farrugia, G; Abell, Tl; O'Grady, G. - In: GASTROENTEROLOGY. - ISSN 0016-5085. -ELETTRONICO. - 49(2015), pp. 56-66.
Original Citation:
Loss of Interstitial Cells of Cajal and Patterns of Gastric Dysrhythmia in PatientsWith Chronic Unexplained Nausea and Vomiting.
Terms of use:
Publisher copyright claim:
(Article begins on next page)
La pubblicazione è resa disponibile sotto le norme e i termini della licenza di deposito, secondo quanto stabilito dallaPolicy per l'accesso aperto dell'Università degli Studi di Firenze (https://www.sba.unifi.it/upload/policy-oa-2016-1.pdf)
Availability:This version is available at: 2158/1014096 since: 2015-12-17T17:25:56Z
Questa è la Versione finale referata (Post print/Accepted manuscript) della seguente pubblicazione:
FLORERepository istituzionale dell'Università degli Studi di
Firenze
Open Access

Loss of Interstitial Cells of Cajal and Patterns of Gastric Dysrhythmia in Patients with Chronic Unexplained Nausea and Vomiting
Timothy R. Angeli1, Leo K. Cheng1,2, Peng Du1, Tim Hsu-Han Wang3, Cheryl E. Bernard4, Maria-Giuliana Vannucchi5, Maria Simonetta Faussone-Pellegrini5, Christopher Lahr6, Ryash Vather3, John A. Windsor3, Gianrico Farrugia4, Thomas L. Abell7, and Gregory O’Grady1,3,*
1Auckland Bioengineering Institute, University of Auckland, Auckland, New Zealand 2Department of Surgery, Vanderbilt University, Nashville, Tennessee, USA 3Department of Surgery, University of Auckland, Auckland, New Zealand 4Division of Gastroenterology and Hepatology, and Enteric Neurosciences Program, Mayo Clinic, Rochester, Minnesota, USA 5Histology and Embryology Research Unit, Department of Experimental and Clinical Medicine, University of Florence, Italy 6Department of Surgery, Mississippi Medical Center, Jackson, Mississippi, USA 7Department of Gastroenterology, University of Louisville, Louisville, Kentucky, USA
Abstract
Background & Aims—Chronic unexplained nausea and vomiting (CUNV) is a debilitating
disease of unknown cause. Symptoms of CUNV substantially overlap with those of gastroparesis,
so the diseases therefore may share pathophysiologic features. We investigated this hypothesis by
quantifying densities of interstitial cells of Cajal (ICCs) and mapping slow wave abnormalities in
patients with CUNV vs controls.
Methods—Clinical data and gastric biopsy specimens were collected from 9 consecutive patients
with at least 6 months of continuous symptoms of CUNV, but normal gastric emptying, treated at
the University of Mississippi Medical Center, and from 9 controls (individuals undergoing
bariatric surgery but free of gastrointestinal disease or diabetes). ICCs were counted and
ultrastructural analyses were performed on tissue samples. Slow-wave propagation profiles were
defined by high-resolution electrical mapping (256 electrodes; 36 cm2). Results from patients with
CUNV were compared to those of controls as well as patients with gastroparesis who were
previously studied by identical methods.
Results—Patients with CUNV had fewer ICCs than controls (mean 3.5 vs 5.6 bodies/field; P<.
05), with mild ultrastructural abnormalities in the remaining ICCs. Slow-wave dysrhythmias were
*Corresponding Author: Dr. Gregory O’Grady, Dept. of Surgery, University of Auckland, Private Bag 92019, Auckland, New Zealand, +64 (21) 422 2989 (phone); +64 9 367 7157 (fax), [email protected].
Author contributions: Study concept and design: GOG, TRA, LKC, TLA, GF. Data collection: TRA, GOG, CL, PD, JAW, RV, LKC, TLA. Data analysis and interpretation: TRA, GOG, TW, CEB, GF, TLA, LKC, MGV, MSFP. Drafting of manuscript: TRA, GOG. Critical review of manuscript: LKC, GF, TLA, JAW, RV, PD, TW, CEB, CL, MGV, MSFP.
Competing interests: No authors have any financial or other competing interests in relation to the material presented in this paper.
HHS Public AccessAuthor manuscriptGastroenterology. Author manuscript; available in PMC 2016 July 01.
Published in final edited form as:Gastroenterology. 2015 July ; 149(1): 56–66.e5. doi:10.1053/j.gastro.2015.04.003.
Author M
anuscriptA
uthor Manuscript
Author M
anuscriptA
uthor Manuscript

identified in all 9 subjects with CUNV vs only 1/9 controls. Dysrhythmias included abnormalities
of initiation (stable ectopic pacemakers, unstable focal activities) and conduction (retrograde
propagation, wave front collisions, conduction blocks, and re-entry), operating across
bradygastric, normal (range 2.4−3.7 cycles/min), and tachygastric frequencies; dysrhythmias
showed velocity anisotropy (mean 3.3 mm/s longitudinal vs 7.6 mm/s circumferential, P<.01).
ICCs were less depleted in patients with CUNV than those with gastroparesis (mean 3.5 vs 2.3
bodies/field; P<.05), but slow-wave dysrhythmias were similar between groups.
Conclusions—This study defined cellular and bioelectrical abnormalities in patients with
CUNV, including the identification of slow-wave re-entry. Pathophysiologic features of CUNV
were observed to be similar to those of gastroparesis, indicating that they could be spectra of the
same disorder. These findings offer new insights into the pathogenesis of CUNV and may help to
inform future treatments.
Keywords
slow wave; high-resolution mapping; gastroparesis; ICC
INTRODUCTION
Chronic unexplained nausea and vomiting (CUNV) is a relatively uncommon but
debilitating disease. The cause is currently unknown, with patients exhibiting chronic gastric
symptoms while demonstrating normal gastric emptying and lacking obstruction or obvious
structural abnormality.1,2
Pasricha et al. recently comprehensively reported the clinical features of CUNV.2 It was
found that the features of this disorder overlap substantially with gastroparesis, being almost
identical in terms of demographics, symptoms, disease duration, health care utilization, and
quality of life. Similar observations have also been reported elsewhere.3,4 Pasricha et al.
concluded that CUNV is poorly defined and not adequately categorized by Rome III criteria,
and that further research was needed to determine whether CUNV is part of a spectrum of
the same syndrome as gastroparesis, or represents a distinct disorder(s).2
There has been substantial recent progress in understanding the pathogenic mechanisms of
gastroparesis,5,6 and among several contributing factors, there is an increasing focus on the
role played by interstitial cells of Cajal (ICC). ICC depletion is now recognized as the
predominant cellular abnormality in gastroparesis.7–9 By contrast, few studies to date have
investigated the mechanisms underlying CUNV,10 and a role for ICC has not been
adequately evaluated.
ICC generate and propagate slow waves, which coordinate phasic gastric contractions, and
ICC loss in gastroparesis is known to be associated with dysrhythmic slow wave activity.9,11
In particular, a recent study, using new techniques of high-resolution (HR), multi-electrode
mapping,12 demonstrated a range of abnormal slow wave initiation and conduction patterns
in most patients with gastroparesis, which were not observed in controls.9 Gastric
dysrhythmias are associated with nausea and vomiting, potentially causing these symptoms,
Angeli et al. Page 2
Gastroenterology. Author manuscript; available in PMC 2016 July 01.
Author M
anuscriptA
uthor Manuscript
Author M
anuscriptA
uthor Manuscript

and could therefore be contributing to the pathophysiology and symptomatology of both
CUNV and gastroparesis.13,14
In this study, we hypothesized that ICC depletion and spatially-complex slow wave
dysrhythmias occur in CUNV, as has been found in gastroparesis. This hypothesis was
tested by performing ICC density and ultrastructural analyses, in combination with in-vivo
HR gastric mapping in a cohort of CUNV patients, with comparison to new controls and
gastroparetic patients previously investigated using identical methods.
METHODS
Ethical approval was granted by the New Zealand Regional Ethics Committee, and by the
Institutional Review Boards at The University of Mississippi and Mayo Clinic. All patients
provided informed consent.
Patients
CUNV Cohort: Consecutive patients with at least six months of continuous symptoms of
CUNV who were undergoing implantation of gastric electrical stimulation devices at the
University of Mississippi Medical Center were invited to participate. All patients had a
history, drug history, physical examination, upper endoscopy, and appropriate radiological
and laboratory investigations to exclude other causes of symptoms. Patients with cyclic
vomiting syndrome were excluded.15 Patients were also excluded if they had gastroparesis,
as diagnosed by scintigraphy testing according to a standardized test meal16 and consensus
recommendations (>60% retention at 2 hours and / or >10% gastric retention at 4 hours),2,17
or malignancy, primary eating disorders, or pregnancy. Hyperglycemia can induce
dysrhythmias,18 and blood glucose was kept within the normal range during the
perioperative period.
Demographic data, comorbidities, medical histories, and body mass index were recorded.
Total symptom scores were calculated by scoring five symptoms (pain, bloating / distension,
nausea, vomiting, and early satiety) on a five-point scale (0, absent; 4, severe).9
ICC Controls were age-matched patients undergoing bariatric surgery, who were free of
gastrointestinal diseases or diabetes. Obesity does not affect ICC numbers,7 but age
matching was performed because ICC decrease by approximately 13% per decade.19
HR mapping controls were patients undergoing elective upper-abdominal surgery. Patients
were excluded if they had previous gastric surgery, known gastric pathology, or a condition
in which dysrhythmic gastric activity has been described, including gastroparesis, gastric
tumors, pregnancy, anorexia nervosa, functional dyspepsia, atrophic gastritis, or hypo- or
hyperthyroidism.13,20 Control patients were not taking gastric prokinetics or medications
affecting gastric electrical activity.
A historical cohort of gastroparetic patients was utilized for further comparison.9 These
patients underwent HR gastric mapping and ICC density analysis using identical methods, at
the same institutions.
Angeli et al. Page 3
Gastroenterology. Author manuscript; available in PMC 2016 July 01.
Author M
anuscriptA
uthor Manuscript
Author M
anuscriptA
uthor Manuscript

ICC Density and Ultrastructural Analysis
Full-thickness gastric biopsy specimens were collected from the anterior stomach, midway
between the curvatures and approximately 9 cm proximal to the pylorus. This site is the
same as that chosen by the Gastroparesis Clinical Research Consortium (GpCRC) in their
studies of cellular defects in gastroparesis.7,8 ICC cell bodies in the circular muscle layer
were identified using a Kit antibody (mouse 1:400; Lab Vision MS-482-P; Thermo Fisher
Scientific, Waltham, MA) and a 4-,6-diamidino-2-phenylindole (DAPI) nucleus
counterstain, where co-localization of a DAPI-positive nucleus within a Kit-positive ICC
signified an ICC cell body. Using the methods described by Grover et al7,21 ICC density
was calculated by quantifying the number of cell bodies per field across 20 high-powered
fields per specimen. Electron microscopy studies of ICC were also performed on CUNV and
control tissues using previously described methodology.8
High-Resolution Electrical Mapping
HR mapping was performed using established and validated extracellular methods.9,22,23
Flexible printed circuit board (PCB) electrode arrays were used (96–256 electrodes; 4–5.2
mm interelectrode spacing; Figure 1A).24 All recordings were performed intraoperatively
after general anesthesia and laparotomy (Table 1). These anesthetic conditions are not
known to affect slow waves,22,25 except for the use of opiates, which may be associated
with myoelectrical abnormalities.26
Mapping was undertaken before organ handling or stimulator placement. The PCBs were
laid on the anterior serosa with reference to gastric landmarks.22 Warm saline-soaked gauze
was overlain, and the cables were allowed to move freely with respiration. Patients were
mapped for up to 15 minutes, over 1–3 gastric regions. Reference electrodes were placed on
the shoulders and unipolar signals were acquired at 512 Hz using an ActiveTwo System
(Biosemi, The Netherlands) modified for passive recordings.
Signal Processing, Analysis, and Interpretation
HR mapping data was analyzed in the Gastrointestinal Electrical Mapping Suite (GEMS), v.
1.5.27 Recordings were down-sampled (30 Hz) and filtered with moving-median and
Savitzky-Golay filters.28 Slow wave activation times were identified using the FEVT
algorithm,29 and were clustered into cycles using the REGROUPS algorithm,30 with manual
correction. Activation maps were calculated (e.g., Figure 1),30 and sites of conduction block
were identified. Slow wave propagation animations were generated.27
Frequency was calculated by averaging the cycle-to-cycle intervals between activation
times. The normal human gastric slow wave frequency was defined as 2.4 – 3.7 cycles/min
based on electrogastrography literature.31 Velocity was calculated using a finite difference
method with Gaussian-smoothing filter, and visualized using directional arrows on a color-
gradient speed map.32 In addition, velocity was secondarily averaged across regions of
circumferential and longitudinal propagation, to investigate conduction anisotropy.33
Amplitudes were calculated by applying a peak-to-trough detection algorithm.28
Angeli et al. Page 4
Gastroenterology. Author manuscript; available in PMC 2016 July 01.
Author M
anuscriptA
uthor Manuscript
Author M
anuscriptA
uthor Manuscript

All data were screened for dysrhythmias by isochronal mapping and animation.27
Dysrhythmias were identified, defined, and quantified by frequency, rhythm (stable vs
unstable), and spatial pattern (abnormalities of initiation and/or conduction), using
established methods.9,34,35 Data were expressed as a mean ± SD or SEM, or median and
range. Student’s t test was used for the statistical analyses, unless otherwise noted, with a
significance threshold of P < 0.05.
RESULTS
Study Populations
The CUNV cohort consisted of 9 consecutive patients (4 diabetic), with median 4-hour
gastric retention of 4% (range 2 – 9%) and median total symptom score of 16/20 (range 9.5–
20). The mean time from gastric emptying test to surgery was 2.1 ± 2.3 months. The HR
mapping controls also consisted of 9 patients, of comparable age to the CUNV cohort
(P=0.14). Table 1 compares the CUNV and HR mapping control populations, with
individual patient data provided in Supplementary Tables 1 and 2. The ICC control cohort
was appropriately age-matched to the CUNV cohort (paired mean difference 0.3 years;
P=0.8).
ICC Density and Ultrastructural Analysis
Tissue specimens were obtained from 7/9 CUNV patients. Figure 2 shows representative
images comparing ICC density and ultrastructural features between CUNV patients and
controls. Overall, average ICC density was reduced in CUNV patients compared to controls
(mean 3.5 ± 0.3 SEM vs 5.6 ± 0.5 cell bodies/field; P<0.05; Figure 3). There was no
difference between ICC densities from CUNV patients with diabetes versus without (P=0.9).
Individual ICC densities for the CUNV patients are reported in Supplementary Table 1
(range: 2.8 – 4.7 cell bodies/field).
The results for ICC density in CUNV patients were then compared with the historical
gastroparetic cohort (mean 2.3 ± 0.3 SEM bodies/field), collected and analyzed using
identical protocols.9 A one-way ANOVA between the CUNV, gastroparesis, and combined-
control cohorts showed that ICC density differed significantly across the three groups
(P<0.05). A Newman-Keuls post-hoc comparison between the three groups indicated that
the combined controls had higher ICC density than the CUNV (P<0.05; mean difference:
2.0 bodies/field) and gastroparesis (P<0.05; mean difference: 3.2 bodies/field) cohorts. In
addition, ICC density was higher in the CUNV than gastroparesis cohort (P<0.05; mean
difference: 1.2 bodies/field; Figure 3).
Ultrastructural analyses revealed abnormalities in the ICC of 5/7 sampled CUNV patients
compared to matched controls (Figure 2C,D). These abnormalities were less severe than
those previously reported in gastroparesis,8 primarily consisting of thickened basal lamina,
particularly near nerve endings, smooth muscle cells, and nerve fibers, as well as scattered
cytoplasmic anomalies including lamellar bodies, dilated reticulum, vacuoles, and myelin
bodies (Figure 2C).
Angeli et al. Page 5
Gastroenterology. Author manuscript; available in PMC 2016 July 01.
Author M
anuscriptA
uthor Manuscript
Author M
anuscriptA
uthor Manuscript

High-Resolution Electrical Mapping
Controls—A total of 11 recordings were performed on the 9 controls at the mid-to-lower
gastric corpus and antrum (Figure 1), with a mean recording duration of 10 ± 3 SD min/
patient. The mean slow wave frequency across the control cohort was 2.7 ± 0.1 SEM cycles/
min. In 8/9 patients, entirely normal gastric activation patterns were observed; slow wave
activity propagated exclusively in the antegrade direction with wavefronts oriented
orthogonal to the curvatures (Figure 1). In these 8 controls, all activity was consistent with
the established single pacemaker system of the normal human stomach (mean corpus
velocity 3.0 ± 0.3 SEM mm/s).22
In one control (ID #4 in Supplementary Table 2), dysrhythmic slow wave activity was
observed. At the time of mapping this patient, it was noted that the stomach was
significantly distended with air following pre-oxygenation and intubation. This dysrhythmia
occurred as a stable ectopic pacemaker in the mid-corpus, was present at the onset of
mapping, and persistent for 330 seconds before becoming entrained by normal antegrade
activity (Supplementary Figure 1).
CUNV Patients—A total of 18 recordings were performed on the corpus and antrum of the
9 CUNV patients, with a mean duration of 11 ± 5 SD min/patient, which was comparable to
the control recordings (P = 0.7). Dysrhythmic slow wave activity was observed in all 9/9
patients, and the observed dysrhythmias were classified as abnormalities of initiation (8/18
recordings; 6/9 patients) or abnormalities of conduction (11/18 recordings; 8/9 patients).
Abnormalities of initiation and conduction coexisted in 5/9 patients. These dysrhythmic
patterns were further classified according to the schema summarized in Figure 4.
Across all CUNV patients, the mean frequency during dysrhythmic slow wave activity was
3.3 ± 0.3 SEM cycles/min (range 2.0 – 5.1 cycles/min), which was similar to that of controls
(P > 0.05). Dysrhythmias occurred at normal frequency in 5/9 patients, bradygastric
frequency (<2.4 cycles/min) in 2/9 patients, and tachygastric frequency (>3.7 cycles/min) in
2/9 patients.
Slow wave activity propagated at a mean longitudinal velocity of 3.3 ± 0.6 SEM mm/s in the
dysrhythmic CUNV cohort, which was similar to that in controls (P = 0.7). Circumferential
propagation was also routinely observed during dysrhythmia and exhibited a highly
anisotropic velocity profile, whereby propagation occurred more rapidly in the
circumferential direction (mean 7.6 ± 1.5 SEM mm/s) than the longitudinal direction (P <
0.01). During longitudinal propagation, the extracellular slow wave amplitudes were
comparable between CUNV patients and controls (mean 0.30 ± 0.08 SEM vs 0.33 ± 0.05
mV; P = 0.7).
Abnormalities of Slow Wave Initiation—Abnormal initiation of slow wave activity
was identified in 8/18 recordings from 6/9 patients (Figure 5 and Supplementary Figure 2),
whereby slow wave activity was initiated from a location other than the normal gastric
pacemaker region (greater curvature, mid-to-upper corpus22). These abnormalities of
initiation were further classified as either stable (occurring consistently in the same location
over time) or unstable (transient focal activities occurring in variable locations). Stable
Angeli et al. Page 6
Gastroenterology. Author manuscript; available in PMC 2016 July 01.
Author M
anuscriptA
uthor Manuscript
Author M
anuscriptA
uthor Manuscript

ectopic initiation (ectopic pacemaking; e.g., Supplementary Figure 2) was the most
prevalent abnormality of initiation, observed in 4 patients, and occurring for a mean
captured duration of 109 ± 42 SD s, although all instances were either present at the
beginning, or persistent through the end, of the recording period. Unstable ectopic focal
activities were observed in 2 patients, and lasted for only 18 s (1 cycle) and 50 s (2 cycles;
Figure 5C, D), respectively.
Abnormal slow-wave initiation occurred at mean frequency of 3.1 ± 0.5 SEM cycles/min
(range 2.0 – 5.1 cycles/min), with individual ectopic events occurring at bradygastric (1
stable; 1 unstable), normal (3 stable), and tachygastric (1 unstable) frequencies. One patient
(Figure 5; ID #2, Supplementary Table 1) displayed unstable focal activity for two cycles at
bradygastric frequency (mean 2.0 ± 0.1 SD cycles/min; Figure 5C, D), which was then
entrained by a new stable ectopic pacemaker occurring at a normal frequency (mean 3.2 ±
0.2 SD cycles/min; Figure 5E, F) that continued to the end of the recording period.
Ectopic slow wave initiation was always associated with disorganized slow wave
propagation. These patterns were characterized as secondary abnormalities of conduction
and are described in the following section.
A third abnormality of slow wave initiation was observed in three recordings from a single
patient (ID #1, Supplementary Table 1), whereby a complete lack of slow wave initiation
and activity occurred across the entire mapped field of all three consecutive recordings. The
electrode signals from these recordings exhibited stable baseline activity with low noise, and
cardiac signal complexes were clearly distinguishable under modified filtering parameters
(Supplementary Figure 3), indicating that the electrodes were functioning and that
satisfactory contact with the serosal surface had been achieved.
Abnormalities of Slow Wave Conduction—Abnormalities of slow wave conduction
occurred in 11/18 recordings in 8/9 patients and included conduction blocks, re-entrant
activity, retrograde propagation, and colliding wavefronts.
Conduction blocks occurred in 4/9 patients, whereby slow wave activation terminated
abnormally. In one case (Figure 5), a complete conduction block manifested between
uncoupled slow wave activation propagating in opposite directions, where the block
extended the entire width of the mapped area. In the other three cases of observed
conduction blocks, the blocks were incomplete, inducing a wavelet that subsequently excited
the tissue region distal to the block (e.g., Supplementary Figure 4).
Re-entrant slow wave activity occurred in a single patient, whereby wavefronts propagated
in a complete loop around a line of unidirectional block, continuously re-activating the same
tissue circuit over successive cycles (Figure 6). Wavefronts emanated outward from the site
of re-entry (mean frequency 3.3 ± 0.2 SD cycles/min), establishing propagation in all
directions and resulting in wavefront collisions with antegrade-propagating wavefronts. In
addition, there was one further case of conduction block with looping propagation pattern
that was incompletely captured by the mapped field, and was therefore classified as being of
Angeli et al. Page 7
Gastroenterology. Author manuscript; available in PMC 2016 July 01.
Author M
anuscriptA
uthor Manuscript
Author M
anuscriptA
uthor Manuscript

indeterminate origin. This dysrhythmia operated at a tachygastric frequency (mean 4.3 ± 0.3
SD cycles/min).
In general, disorganized slow wave propagation occurred secondary to all of the previously
described abnormalities of initiation and conduction, and was quantified as retrograde
propagation and wavefront collisions. Retrograde propagation occurred in 10/18 recordings
across 8/9 patients, originating from ectopic pacemakers (5 recordings), sites of re-entry (1
recording), and unidentified sites outside the mapped field (4 recordings). Retrograde
propagation occurred at a mean velocity of 3.3 ± 0.7 SEM mm/s, which was comparable to
that of antegrade propagation in controls (mean 3.0 ± 0.3 SEM mm/s; P = 0.7) and CUNV
(mean 3.3 ± 0.6 SEM mm/s; P = 0.9), demonstrating directional velocity isotropy in the
longitudinal axis of the human stomach.
Wavefront collisions occurred in 7/18 recordings across 5/9 patients, where a retrograde or
circumferentially-propagating wavefront collided with opposing propagation (e.g., Figures 5
and 6, and Supplementary Figure 2). Wavefront collisions were associated with wavefronts
originating from ectopic pacemakers (4 recordings; e.g., Figure 5 and Supplementary Figure
2), unidentified sources located outside of the mapped field (2 recordings), and re-entry (1
recording; Figure 6).
Normal Slow Wave Propagation—Although all CUNV patients exhibited some form of
dysrhythmic activity during at least one of their recording periods, a subset of 4/18
recordings from 3/9 patients displayed a normal slow wave propagation pattern for the entire
recorded duration. This normal propagation occurred at a mean frequency of 2.8 ± 0.2 SEM
cycles/min (range 2.4 – 3.2 cycles/min) and propagated at a mean longitudinal velocity of
2.8 ± 0.6 SEM mm/s, both of which were similar to that of controls (P = 0.8 and 0.6,
respectively).
DISCUSSION
CUNV is accompanied by considerable morbidity, but has remained a poorly characterized
disorder of unknown etiology. This study quantified ICC numbers and ultrastructural
features, in combination with modern slow wave mapping techniques,12 to investigate
pathogenic mechanisms contributing to CUNV. It was found that CUNV patients had ICC
depletion and abnormal slow wave initiation and conduction, compared to controls. Further
comparison to a historic cohort of gastroparetic patients9 revealed that ICC depletion and
ultrastructural abnormalities were less severe in CUNV than in gastroparesis, but
abnormalities of slow wave initiation and conduction were similar. The cellular and
electrophysiological abnormalities observed in this study offer plausible contributing
mechanisms to the pathophysiology of CUNV.
This study was partly motivated by a recent report by Pasricha et al., which provided the
first comprehensive account of the demographic and clinical features of CUNV.2 CUNV
was shown to be clinically indistinguishable from gastroparesis over a one-year follow-up
period, which is consistent with other literature.3,4 Pasricha et al. concluded that further
research was needed to conclusively determine whether CUNV is part of a spectrum of the
Angeli et al. Page 8
Gastroenterology. Author manuscript; available in PMC 2016 July 01.
Author M
anuscriptA
uthor Manuscript
Author M
anuscriptA
uthor Manuscript

same syndrome as gastroparesis, or represents a distinct disorder(s).2 Both conclusions may
hold truth as CUNV is likely heterogeneous. However, our study does support the idea that
CUNV may, at least in part, be encompassed within the same disease spectrum as
gastroparesis, by demonstrating that these disorders share common cellular and bioelectrical
pathophysiologies.7,9 Of note, the ICC depletion and ultrastructural abnormalities in the
CUNV cohort were less marked than in previous gastroparesis cohorts analyzed by
equivalent methods,8,9 and the actual ICC densities are consistent with a previous
observation that depletion of less than 3 ICC bodies per field may represent a threshold
below which failure of gastric emptying becomes more likely.19 Gastric distension has been
ruled out as a confounding factor in ICC counts using comparative smooth muscle nuclei
counts.9
We focused on ICC because they are the predominant cellular abnormality in gastroparesis,7
and because ICC densities correlate with gastric emptying, unlike other markers.21
However, ICC, neuronal, and smooth muscle pathologies often co-exist, perhaps due to
cellular interdependence, and it is not always clear which changes hold primacy.36 Other
histologic abnormalities described in gastroparesis include an immune cell infiltrate typified
by CD45 and CD68 immunoreactivity, decreased nerve fibres,7 and ultrastructural
degradation of remaining ICC.8 These factors were not a focus of the present study, but
would be of interest in future studies of CUNV.
The HR mapping outcomes reported in this study corroborate and expand the known range
of dysrhythmic human slow wave patterns. These patterns have been accurately assessed in
only one previous study in gastroparetic patients,9 of which the results of the present study
are consistent. CUNV and gastroparesis both showed heterogeneous patterns of abnormal
initiation and conduction, including stable and unstable ectopic pacemaking, conduction
blocks, and secondary propagation abnormalities of retrograde propagation and colliding
wavefronts. It was also shown that human gastric dysrhythmias routinely occurred within a
frequency range considered normal, while normal activity could occur at frequencies
sometimes considered abnormal, challenging ‘normal’ frequency conceptions.31 These
results validate and reinforce that spatial mapping enables a substantially more accurate
method of dysrhythmia detection than classical electrogastrography, which mainly focused
on frequency31 and therefore likely underestimated the occurrence of slow wave
abnormalities. The results from the present study also facilitate an updated classification
schema for human gastric dysrhythmias, focused on spatial pattern.9 Furthermore, the
finding that a subset of 4/18 recordings exhibited normal activity demonstrated that multiple
recordings, or at least sustained recordings of greater than about five minutes, may be
necessary to consistently detect dysrhythmic activity.
This study described re-entrant slow wave activity in the human gut. Originally described by
Lammers et al. in 2008 in a canine model,37 and subsequently in several other invitro and
in-vivo animal models,34,35,38 re-entry is now a focus of considerable recent interest as a
mechanism of sustained gastrointestinal dysrhythmias.39 Based on our findings, re-entry is a
relatively uncommon dysrhythmia in the human stomach, likely because there is a narrow
excitable gap, or window, in which an aberrant stimulus can successfully invoke a re-entry,
based on the relative timing of the leading depolarizing edge and refractory tail.34,35,39 Re-
Angeli et al. Page 9
Gastroenterology. Author manuscript; available in PMC 2016 July 01.
Author M
anuscriptA
uthor Manuscript
Author M
anuscriptA
uthor Manuscript

entry is also an important finding because it is a potentially treatable form of dysrhythmia,
for example, by gastric pacing guided by mapping,40 as is routinely achieved in cardiology.
The fact that CUNV patients had normal gastric emptying despite pronounced dysrhythmia
is consistent with previous literature, which has shown an overall positive predictive value
of EGG abnormalities for abnormal gastric emptying of only ~65%.31 Significantly, gastric
emptying shows no correlation with nausea and vomiting, while dysrhythmia shows
consistent correlations with these symptoms across multiple disease states.2,13 It is therefore
evident that the stomach has compensatory mechanisms that may preserve emptying despite
dysrhythmias, including the rapid circumferential conduction evident in this study, which
may aid in restoring propulsive ring contractions distal to dysrhythmic events.9,33 Together
with dysrhythmias, other ICC abnormalities occurring in gastroparesis could cumulatively
be contributing to delayed emptying. For example, residual ICC in gastroparesis show
marked cellular damage, and may generate a reduced volume of current to excite smooth
muscle.8,9,13 ICC roles in modulating resting membrane gradients, neurotransmission, and
mechanotransduction could also be significant, but more research is needed. The presence of
a thickened basal lamina at the contact between ICC and nerve endings in CUNV patients is
suggestive of impairment in the crosstalk, which in turn could influence the ICC rhythmic
activity. Further studies are now required to investigate mechanisms by which ICC damage
causes dysrhythmia, and how dysrhythmia causes nausea and vomiting, with current
evidence suggesting such causal associations are plausible.13
One control subject exhibited dysrhythmic slow wave activity, characterized by tachygastric
ectopic pacemaking in the mid-corpus. This represents the only instance of slow wave
dysrhythmia in 21 normal controls mapped to date (9 in this study, 12 in a previous study22),
and may have occurred due to excessive gastric distension in this patient following
anesthetic induction and intubation. A similar type of dysrhythmic initiation has previously
been described with antral balloon distension in healthy humans.41 It may prove necessary
to exclude subjects showing gastric distension in future studies. It is also possible that
normal subjects have episodes of self-correcting dysrhythmia. The research implication of
this dysrhythmic finding in a control patient was that it provided an opportunity to quantify
circumferential conduction parameters in the healthy human stomach. The observed
conduction profile in this patient exhibited velocity anisotropy similar to that observed in the
ICC-depleted CUNV cohort, and also previously observed in animals and ICC-depleted
gastroparetic humans.9,33
The main limitation of this study was the relatively small sample size. However, the current
limited cohort is unique because intraoperative access is rare in CUNV patients, and the
operative gastric stimulator implantation that allowed surgical access for this study is
usually only offered for gastroparesis. Furthermore, this study also required the recruitment
of intra-operative mapping controls. Because the mapping in this study required surgical
access, it was performed in the anesthetized state; it would be desirable to investigate these
slow wave patterns in awake, fed, and fasted patients, when future technological advances
allow. While we chose the definition ‘CUNV’ following Pasricha et al.,2 such nomenclature
is not standardized. Alternative terms have included ‘gastroparesis-like syndrome’ and
Angeli et al. Page 10
Gastroenterology. Author manuscript; available in PMC 2016 July 01.
Author M
anuscriptA
uthor Manuscript
Author M
anuscriptA
uthor Manuscript

‘vomiting of unexplained etiology’, while the Rome III system introduced ‘chronic
idiopathic nausea’ and ‘functional vomiting’ within more restrictive scopes.
Methodological advances will be necessary to apply these findings to clinical diagnostics in
future, in order to reduce the invasiveness of current gastric HR mapping methods.
Significant technical hurdles must be overcome, including endoscopic device development,
reliable methods of automated real-time data analysis, and cost reductions in acquisition
equipment.12,13 In addition, therapeutic trials will ultimately be required, to assess whether
gastric dysrhythmias can be reversed in a way that meaningfully improves symptoms and
quality of life in affected patients.
In conclusion, ICC and bioelectrical abnormalities were found in CUNV patients, similar to
changes occurring in gastroparesis. These findings offer new pathogenic mechanisms
underlying CUNV, and may inform future therapies.
Supplementary Material
Refer to Web version on PubMed Central for supplementary material.
Acknowledgments
We thank the clinical research and operating room staff at the University of Mississippi Medical Center, and Mr Simon Bull and Ms Rachel Berry for their valued assistance.
TLA is a licensor, consultant, and investigator for Medtronic, Inc.
Funding
This work was supported by the New Zealand Health Research Council, National Institutes of Health and the Gastroparesis Clinical Research Consortium (R01 DK64775, DK57061, DK73983, DK74008, and U01 DK074007). GOG thanks the American Neurogastroenterology and Motility Society (ANMS) for the Young Investigator Clinical Research Grant that enabled this collaboration. PD was supported by the Rutherford Foundation Trust, and Marsden Fund.
Abbreviations
CUNV Chronic unexplained nausea and vomiting
GpCRC Gastroparesis Clinical Research Consortium
ICC Interstitial cells of Cajal
PCB Printed circuit board
SD Standard deviation
SEM Standard error of the mean
HR High-resolution
REFERENCES
1. Olden KW, Crowell MD. Chronic nausea and vomiting: new insights and approach to treatment. Curr. Treat Options Gastroenterol. 2005; 8:305–310. [PubMed: 16009031]
Angeli et al. Page 11
Gastroenterology. Author manuscript; available in PMC 2016 July 01.
Author M
anuscriptA
uthor Manuscript
Author M
anuscriptA
uthor Manuscript
2. Pasricha PJ, Colvin R, Yates K, et al. Characteristics of patients with chronic unexplained nausea and vomiting and normal gastric emptying. Clin. Gastroenterol. Hepatol. 2011; 9:567–576. e1–e4. [PubMed: 21397732]
3. Anaparthy R, Pehlivanov N, Grady J, et al. Gastroparesis and gastroparesis-like syndrome: response to therapy and its predictors. Dig. Dis. Sci. 2009; 54:1003–1010. [PubMed: 19277867]
4. Gourcerol G, Leblanc I, Leroi AM, et al. Gastric electrical stimulation in medically refractory nausea and vomiting. Eur. J. Gastroenterol. Hepatol. 2007; 19:29–35. [PubMed: 17206074]
5. Hasler WL. Gastroparesis: pathogenesis, diagnosis and management. Nat. Rev. Gastroenterol. Hepatol. 2011; 8:438–453. [PubMed: 21769117]
6. Kashyap P, Farrugia G. Diabetic gastroparesis: what we have learned and had to unlearn in the past 5 years. Gut. 2010; 59:1716–1726. [PubMed: 20871131]
7. Grover M, Farrugia G, Lurken MS, et al. Cellular changes in diabetic and idiopathic gastroparesis. Gastroenterology. 2011; 140(5):1575-85.e8. [PubMed: 21300066]
8. Faussone-Pellegrini MS, Grover M, Pasricha PJ, et al. Ultrastructural differences between diabetic and idiopathic gastroparesis. J. Cell. Mol. Med. 2012; 16:1573–1581. [PubMed: 21914127]
9. O’Grady G, Angeli TR, Du P, et al. Abnormal initiation and conduction of slow-wave activity in gastroparesis, defined by high-resolution electrical mapping. Gastroenterology. 2012; 143:589–598. e1–e3. [PubMed: 22643349]
10. Abell TL, Familoni B, Voeller G, et al. Electrophysiologic, morphologic, and serologic features of chronic unexplained nausea and vomiting: lessons learned from 121 consecutive patients. Surgery. 2009; 145:476–485. [PubMed: 19375605]
11. Lin Z, Sarosiek I, Forster J, et al. Association of the status of interstitial cells of Cajal and electrogastrogram parameters, gastric emptying and symptoms in patients with gastroparesis. Neurogastroenterol. Motil. 2010; 22:56–61. e10. [PubMed: 19614868]
12. Cheng LK, Du P, O’Grady G. Mapping and modeling gastrointestinal bioelectricity: from engineering bench to bedside. Physiology (Bethesda). 2013; 28:310–317. [PubMed: 23997190]
13. O’Grady G, Wang T, Du P, et al. Recent progress in gastric arrhythmia: pathophysiology, clinical significance and future horizons. Clin. Exp. Pharmacol. Physiol. 2014; 41:854–862. [PubMed: 25115692]
14. Koch KL. Gastric dysrhythmias: a potential objective measure of nausea. Exp. Brain Res. 2014; 232:2553–2561. [PubMed: 24916149]
15. Abell TL, Adams KA, Boles RG, et al. Cyclic vomiting syndrome in adults. Neurogastroenterol. Motil. 2008; 20:269–284. [PubMed: 18371009]
16. Abell TL, Camilleri M, Donohoe K, et al. Consensus recommendations for gastric emptying scintigraphy: a joint report of the American Neurogastroenterology and Motility Society and the Society of Nuclear Medicine. Am. J. Gastroenterol. 2008; 103:753–763. [PubMed: 18028513]
17. Tougas G, Eaker EY, Abell TL, et al. Assessment of gastric emptying using a low fat meal: establishment of international control values. Am. J. Gastroenterol. 2000; 95:1456–1462. [PubMed: 10894578]
18. Hasler WL, Soudah HC, Dulai G, et al. Mediation of hyperglycemia-evoked gastric slowwave dysrhythmias by endogenous prostaglandins. Gastroenterology. 1995; 108:727–736. [PubMed: 7875475]
19. Gomez-Pinilla PJ, Gibbons SJ, Sarr MG, et al. Changes in interstitial cells of Cajal with age in the human stomach and colon. Neurogastroenterol. Motil. 2011; 23:36–44. [PubMed: 20723073]
20. Koch, KL.; Stern, RM. Handbook of electrogastrography. Oxford: Oxford University Press; 2004.
21. Grover M, Bernard CE, Pasricha PJ, et al. Clinical-histological associations in gastroparesis: results from the Gastroparesis Clinical Research Consortium. Neurogastroenterol. Motil. 2012; 24:531–539. e249. [PubMed: 22339929]
22. O’Grady G, Du P, Cheng LK, et al. Origin and propagation of human gastric slow-wave activity defined by high-resolution mapping. Am. J. Physiol. Gastrointest. Liver Physiol. 2010; 299:G585–G592. [PubMed: 20595620]
23. Angeli TR, Du P, Paskaranandavadivel N, et al. The bioelectrical basis and validity of gastrointestinal extracellular slow wave recordings. J. Physiol. 2013; 591:4567–4579. [PubMed: 23713030]
Angeli et al. Page 12
Gastroenterology. Author manuscript; available in PMC 2016 July 01.
Author M
anuscriptA
uthor Manuscript
Author M
anuscriptA
uthor Manuscript

24. Du P, O’Grady G, Egbuji JU, et al. High-resolution mapping of in vivo gastrointestinal slow wave activity using flexible printed circuit board electrodes: methodology and validation. Ann. Biomed. Eng. 2009; 37:839–846. [PubMed: 19224368]
25. O’Grady, G.; Angeli, TR.; Lammers, WJEP. The principles and practice of gastrointestinal high-resolution electrical mapping. In: Cheng, LK.; Farrugia, G., editors. New Advances in Gastrointestinal Motility Research. Dordrecht: Springer Netherlands; 2013. p. 51-69.
26. Walldén J, Lindberg G, Sandin M, et al. Effects of fentanyl on gastric myoelectrical activity: a possible association with polymorphisms of the μ-opioid receptor gene? Acta anaesthesiol. Scand. 2008; 52:708–715. [PubMed: 18419726]
27. Yassi R, O’Grady G, Paskaranandavadivel N, et al. The gastrointestinal electrical mapping suite (GEMS): software for analyzing and visualizing high-resolution (multielectrode) recordings in spatiotemporal detail. BMC Gastroenterol. 2012; 12:60. [PubMed: 22672254]
28. Paskaranandavadivel N, O’Grady G, Du P, et al. Comparison of filtering methods for extracellular gastric slow wave recordings. Neurogastroenterol. Motil. 2013; 25:79–83. [PubMed: 22974243]
29. Erickson JC, O’Grady G, Du P, et al. Falling-edge, variable threshold (FEVT) method for the automated detection of gastric slow wave events in high-resolution serosal electrode recordings. Ann. Biomed. Eng. 2010; 38:1511–1529. [PubMed: 20024624]
30. Erickson JC, O’Grady G, Du P, et al. Automated gastric slow wave cycle partitioning and visualization for high-resolution activation time maps. Ann. Biomed. Eng. 2011; 39:469–483. [PubMed: 20927594]
31. Parkman HP, Hasler WL, Barnett JL, et al. Electrogastrography: a document prepared by the gastric section of the American Motility Society Clinical GI Motility Testing Task Force. Neurogastroenterol. Motil. 2003; 15:89–102. [PubMed: 12680908]
32. Paskaranandavadivel N, O’Grady G, Du P, et al. An improved method for the estimation and visualization of velocity fields from gastric high-resolution electrical mapping. IEEE. Trans. Biomed. Eng. 2012; 59:882–889. [PubMed: 22207635]
33. O’Grady G, Du P, Paskaranandavadivel N, et al. Rapid high-amplitude circumferential slow wave propagation during normal gastric pacemaking and dysrhythmias. Neurogastroenterol. Motil. 2012; 24:e299–e312. [PubMed: 22709238]
34. O’Grady G, Egbuji JU, Du P, et al. High-resolution spatial analysis of slow wave initiation and conduction in porcine gastric dysrhythmia. Neurogastroenterol. Motil. 2011; 23:e345–e355. [PubMed: 21714831]
35. Angeli TR, O’Grady G, Du P, et al. Circumferential and functional re-entry of in vivo slow-wave activity in the porcine small intestine. Neurogastroenterol. Motil. 2013; 25:e304–e314. [PubMed: 23489929]
36. Huizinga JD, Zarate N, Farrugia G. Physiology, injury, and recovery of interstitial cells of Cajal: basic and clinical science. Gastroenterology. 2009; 137:1548–1556. [PubMed: 19778538]
37. Lammers WJ, Ver Donck L, Stephen B, Smets D, Schuurkes JA. Focal activities and re-entrant propagations as mechanisms of gastric tachyarrhythmias. Gastroenterology. 2008; 135:1601–1611. [PubMed: 18713627]
38. Lammers WJEP, Stephen B, Karam SM. Functional reentry and circus movement arrhythmias in the small intestine of normal and diabetic rats. Am. J. Physiol. Gastrointest. Liver Physiol. 2012; 302:G684–G689. [PubMed: 22207580]
39. Lammers WJEP. Arrhythmias in the gut. Neurogastroenterol. Motil. 2013; 25:353–357. [PubMed: 23490042]
40. O’Grady G, Du P, Lammers WJEP, et al. High-resolution entrainment mapping of gastric pacing: a new analytical tool. Am. J. Physiol. Gastrointest. Liver Physiol. 2010; 298:G314–G321. [PubMed: 19926815]
41. Ladabaum U, Koshy SS, Woods ML, et al. Differential symptomatic and electrogastrographic effects of distal and proximal human gastric distension. Am. J. Physiol. 1998; 275:G418–G424. [PubMed: 9724252]
42. Kligfield P, Gettes LS, Bailey JJ, et al. Recommendations for the standardization and interpretation of the electrocardiogram, part I: the electrocardiogram and its technology. J. Am. Coll. Cardiol. 2007; 49:1109–1127. [PubMed: 17349896]
Angeli et al. Page 13
Gastroenterology. Author manuscript; available in PMC 2016 July 01.
Author M
anuscriptA
uthor Manuscript
Author M
anuscriptA
uthor Manuscript

Figure 1. Normal gastric slow wave propagation in a control. (A) Position of the array. (B)
Electrograms from positions indicated in C (frequency, 2.8 ± 0.1 SD cycles/min). (C)
Isochronal activation map of ‘Wave 1’ indicated in B, demonstrating normal antegrade
propagation. Black dots represent electrodes, with white dots outlined red representing
electrodes where activity was interpolated. Each color band shows the area of slow wave
propagation per 2 seconds. (D) Velocity map of Wave 1, showing the speed (color
spectrum) and direction (arrows) of the wavefront at each electrode. (E,F) Isochronal
activation and velocity field maps of ‘Wave 2’ in B, demonstrating consistency of the
antegrade propagation. See Supplementary Video 1 for animation.
Angeli et al. Page 14
Gastroenterology. Author manuscript; available in PMC 2016 July 01.
Author M
anuscriptA
uthor Manuscript
Author M
anuscriptA
uthor Manuscript

Figure 2. (A,B) Representative images showing depletion of the ICC network in the gastric smooth
muscle in a CUNV patient (A) compared to control (B). The red signal is Kit
immunoreactivity marking ICC; the blue signal is 4’,6’-diamidino-2-phenylindone
counterstain marking cellular nuclei. (C,D) Electron microscopy images showing mild
ultrastructural abnormalities in a CUNV patient (C) compared to control (D). Labeled
structural components: thick basal lamina (small astericks), nerve endings (NE), smooth
muscle cells (SMC), lamellar body (LB), ICC-SMC contact (arrows), and peg-and-socket
junction (large astericks).
Angeli et al. Page 15
Gastroenterology. Author manuscript; available in PMC 2016 July 01.
Author M
anuscriptA
uthor Manuscript
Author M
anuscriptA
uthor Manuscript

Figure 3. Comparison of ICC density between CUNV patients and healthy controls. Data from a
recent gastroparesis (GP) cohort9 (in grey) are also displayed for comparison.
Angeli et al. Page 16
Gastroenterology. Author manuscript; available in PMC 2016 July 01.
Author M
anuscriptA
uthor Manuscript
Author M
anuscriptA
uthor Manuscript

Figure 4. Classification and occurrence of slow wave dysrhythmias mapped in CUNV patients. ‘N’
signifies normal frequency. There was one additional case (ID #5) of tachygastria of
indeterminate origin, and a further case (ID #1) of apparent slow wave quiescence (see text).
Angeli et al. Page 17
Gastroenterology. Author manuscript; available in PMC 2016 July 01.
Author M
anuscriptA
uthor Manuscript
Author M
anuscriptA
uthor Manuscript
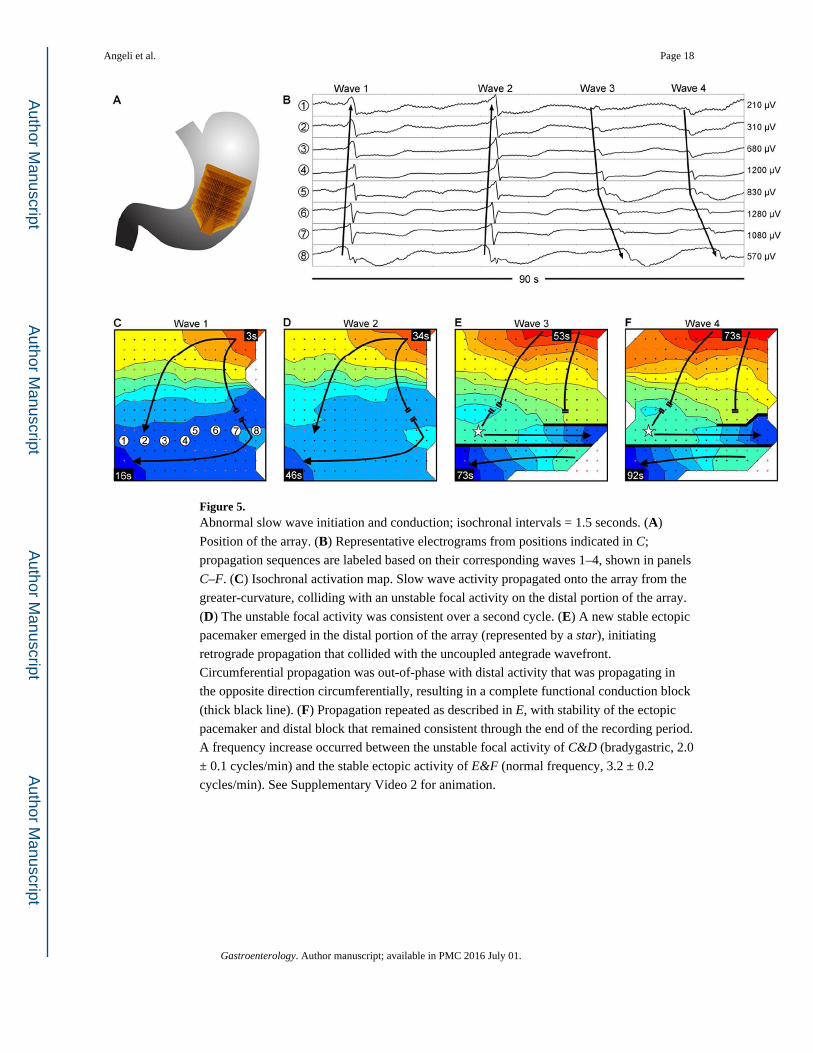
Figure 5. Abnormal slow wave initiation and conduction; isochronal intervals = 1.5 seconds. (A)
Position of the array. (B) Representative electrograms from positions indicated in C;
propagation sequences are labeled based on their corresponding waves 1–4, shown in panels
C–F. (C) Isochronal activation map. Slow wave activity propagated onto the array from the
greater-curvature, colliding with an unstable focal activity on the distal portion of the array.
(D) The unstable focal activity was consistent over a second cycle. (E) A new stable ectopic
pacemaker emerged in the distal portion of the array (represented by a star), initiating
retrograde propagation that collided with the uncoupled antegrade wavefront.
Circumferential propagation was out-of-phase with distal activity that was propagating in
the opposite direction circumferentially, resulting in a complete functional conduction block
(thick black line). (F) Propagation repeated as described in E, with stability of the ectopic
pacemaker and distal block that remained consistent through the end of the recording period.
A frequency increase occurred between the unstable focal activity of C&D (bradygastric, 2.0
± 0.1 cycles/min) and the stable ectopic activity of E&F (normal frequency, 3.2 ± 0.2
cycles/min). See Supplementary Video 2 for animation.
Angeli et al. Page 18
Gastroenterology. Author manuscript; available in PMC 2016 July 01.
Author M
anuscriptA
uthor Manuscript
Author M
anuscriptA
uthor Manuscript

Figure 6. Slow wave re-entry; isochronal intervals = 2 seconds. (A) Position of the array. (B)
Representative electrograms from positions indicated in C; electrode 1 is repeated at the
bottom of the electrograms to illustrate the continuity of the re-entrant circuit. (C–E)
Isochronal activation maps. Activation propagated in a circuit around a linear conduction
block (thick black line), re-activating that same circuit over successive cycles, thereby
establishing re-entry (frequency, 3.3 ± 0.2 cycles/min). Slow wave activity propagated
outward from the re-entrant circuit, in part colliding with an uncoupled antegrade-
propagating wavefront. See Supplementary Video 3 for animation.
Angeli et al. Page 19
Gastroenterology. Author manuscript; available in PMC 2016 July 01.
Author M
anuscriptA
uthor Manuscript
Author M
anuscriptA
uthor Manuscript

Author M
anuscriptA
uthor Manuscript
Author M
anuscriptA
uthor Manuscript
Angeli et al. Page 20
Table 1
Comparison of characteristics between the CUNV population and mapping controls. Methods of mapping and
data analysis were identical.
Characteristic CUNV cohort Control cohort
No. of patients 9 9
Median age, y (range) 50 (22–59)* 57 (25–74)*
Sex (female:male) 8:1 5:4
No. of recordings 18 11
Duration of mapping (mean ± SD) 11 ± 5 min/pt 10 ± 3 min/pt
Anesthetic regimen Prophylactic antibiotics, benzodiazepine premedication, a short-acting intravenous
opiate, muscle relaxants (suxamethonium or rocuronium), propofol, desflurane
Prophylactic antibiotics, benzodiazepine premedication, a short-acting intravenous opiate, muscle relaxant (atracurium or suxamethonium),
propofol, isoflurane, or sevoflurane. Eight also had epidural or spinal block.
Electrodes (type; tip diameter; no. of channels)
PCB24; 0.3 mm; 256 channels PCB24; 0.3 mm; 96–256 channels
Filtering methods Savitzky-Golay (1.7s window; polynomial order 9) and moving median (20s window) filters28
Analysis and isochronal activation mapping methods
FEVT, REGROUPS, and SIV algorithms performed in GEMS v1.5 with subsequent manual review27,29,30
Frequency, velocity, and amplitude calculation methods
Algorithms in GEMS v1.527
*P = 0.14.
Gastroenterology. Author manuscript; available in PMC 2016 July 01.