volvo car group annual report 2016 - assets.volvocars.com/media/united-kingdom/documents/... ·...
TRANSCRIPT

volvo car groupannual report 2016

OVERVIEW
1 This is Volvo Car Group
2 2016 in brief
4 CEO comment
6 Our year
8 Our world
10 Challenges and opportunities
STRATEGY
14 Corporate strategy
17 Brand strategy
18 People strategy
21 Sustainability commitment
22 Strategic focus areas
CREATING VALUE
24 Value chain
27 Design, Products and Technology
41 Purchasing, Manufacturing and Logistics
47 Consumer Experiences and Re-usage
52 Market Highlights
54 – Western Europe
56 – China
58 – The US
61 People
69 Society
73 Board of Directors’ report
82 Consolidated Financial Statements
88 Notes to the Consolidated Financial Statements
123 Parent Company Financial Statements
125 Notes to the Parent Company Financial Statements
130 Auditor’s Report
132 Board of Directors
134 Executive Management
136 Sustainability Management and Governance
140 Sustainability Scorecard
146 GRI Index
148 Our Heritage
TABLE OF CONTENTS

volvo car group
Our history dates back to 1927 when the Swedish company Volvo Car Corporation was founded and the fi rst Volvo car
rolled off the production line. Volvo Car Group is headquartered in Gothenburg, Sweden.
Volvo cars are produced at factories in Torslanda in Sweden, Ghent in Belgium, Chengdu and Daqing in China and Kuala
Lumpur in Malaysia. Volvo Car Group is owned by Zheijang Geely Holding Group Ltd. (Geely Holding) and three institutional inves-tors. In 2016, around 2,300 Volvo dealers sold 534,332 cars in more than 100 countries around the world. During 2016, Volvo
Car Group employed on average about 30,000 people.
Ever since we put the fi rst Volvo on the road back in 1927, we have continuously developed, creating world
changing innovations along the way.
“ The car industry is changing rapidly, and an agile Volvo Cars
has the possibility to take advantage of opportunities in areas like electrifi cation, new mobility concepts, and
autonomous driving. ”HÅKAN SAMUELSSON
PRESIDENT AND CEO, CEO COMMENTS PAGE 4
READ MORE ABOUT VOLVO CAR GROUP ON PAGE 73
1ANNUAL REPORT 2016 | VOLVO CAR GROUP

2016 in brief
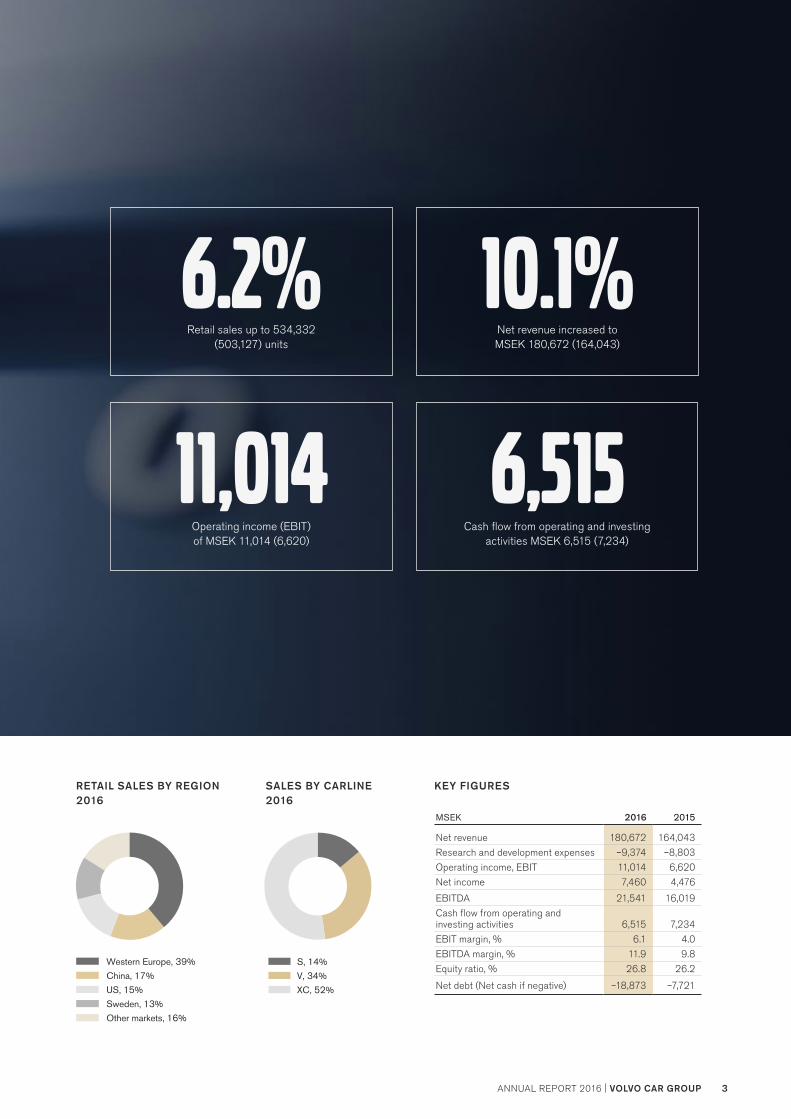
For the full year 2016, Volvo Car Group generated net revenue of MSEK 180,672 (164,043), an increase of 10.1 per cent compared to 2015.
NET REVENUE EBIT
In 2016, Volvo Cars reported retail sales of 534,332 (503,127) units, an increase of 6.2 per cent.
RETAIL SALES
UNITS
400,000
600,000
300,000
200,000
100,000
014 15 1612 13
500,000
MSEK
200,000
150,000
100,000
50,000
013 14 1512 16
MSEK
12,000
9,000
6,000
3,000
013 14 1512 16
Operating income (EBIT) increased to MSEK 11,014 (6,620), resulting in an operating margin of 6.1 (4.0) per cent.
2 VOLVO CAR GROUP | ANNUAL REPORT 2016
KEY FIGURES
MSEK 2016 2015
Net revenue 180,672 164,043
Research and development expenses –9,374 –8,803
Operating income, EBIT 11,014 6,620
Net income 7,460 4,476
EBITDA 21,541 16,019
Cash flow from operating and investing activities 6,515 7,234
EBIT margin, % 6.1 4.0
EBITDA margin, % 11.9 9.8
Equity ratio, % 26.8 26.2
Net debt (Net cash if negative) –18,873 –7,721
SALES BY CARLINE 2016
RETAIL SALES BY REGION 2016
XC, 52%
V, 34%
S, 14%
Other markets, 16%
Sweden, 13%
US, 15%
China, 17%
Western Europe, 39%
Retail sales up to 534,332 (503,127) units
6.2%
Operating income (EBIT) of MSEK 11,014 (6,620)
11,014
Net revenue in creased to MSEK 180,672 (164,043)
10.1%
Cash flow from operating and investing activities MSEK 6,515 (7,234)
6,515
VOLVO CAR GROUP | ANNUAL REPORT 2016 3ANNUAL REPORT 2016 | VOLVO CAR GROUP

CEO COMMENT
ceo commentVolvo Cars continued the global transformation as the company launched new cars and new technologies, reinforcing leadership in safety and autonomous driving.
The result was a third consecutive year of record sales, with over 534,000 units sold. Revenue grew by 10 per cent, resulting in a significantly increased operating profit of 11 BSEK. I am particu-larly pleased that we managed a positive cash flow despite ongoing heavy investments in future products and technologies. This is a good reflection of all of our employees’ strong efforts throughout the year.
In 2016 we reported growth in all three regions. We confirmed our very positive development in the US, while a strong perfor-mance in the last six months led to double-digit growth in China. In Europe we also reported continued growth, especially in important key markets such as the United Kingdom and Germany.
bonds in the company’s history. We also issued preference shares to three institutional investors, further widening our funding base.
The car industry is changing rapidly, and an agile Volvo Cars has the possibility to take advantage of opportunities in areas like electrification, new mobility concepts, and autonomous driving. Rather than being disrupted, we choose to be part of this transfor-mation. Throughout 2016 we forged new partnerships that posi-tion us at the forefront of the change underway in the industry.
An important focus is our three-pillar autonomous driving strat-egy. Firstly, we co-operate with Uber to develop a car with all the backup systems necessary for autonomous driving. Secondly, we are establishing a joint venture with Autoliv – Zenuity – developing the software for autonomous driving. Finally, we are considering the consumer perspective through Drive Me, an advanced and ambitious autonomous vehicle test. This year, we will start the roll out of autonomous XC90s to approximately 100 families in Goth-enburg, Sweden. They will use the cars in their everyday life, pro-viding feedback to our engineers.
Sustainability is a central part of our strategy and thereby key to our future success. This was reflected in the launch of the Sustain-ability Programme, Omtanke, which includes our commitment to bring 1 million electrified vehicles to the roads by 2025. Our pur-pose as a company is to provide safe, sustainable and convenient mobility, creating an attractive organisation and making a positive contribution to society. From that perspective, I’m pleased to reit-erate Volvo Cars’ support for the UN Global Compact, of which Volvo Cars is one of the founding members.
We will continue our transformation in 2017. After the complete introduction of the 90 series SPA cars the stage is set for further launches of 60 and 40 cars as well as business concepts to com-mercialise new technologies.
2016 was a positive milestone year for Volvo Cars’ development and I would like to thank all employees for their valuable contribu-tions, developing Volvo Cars as a true player in the premium car segment.
Håkan SamuelssonPresident and Chief Executive Officer
“ 2016 was a positive mile-stone year for Volvo Cars ”HÅKAN SAMUELSSON
PRESIDENT AND CHIEF EXECUTIVE OFFICER
On the production side, we changed model lines in the Torslanda plant at the same time as we increased capacity and ramped up volumes. Combined with very strong demand for our new 90 cars, this affected our delivery times. To further expand capacity, we are building our first ever manufacturing plant in the US, in Charleston, South Carolina, which is planned for completion in 2018. We also expanded our manufacturing in China with the start of the S90 production in Daqing. We are developing China into a global man-ufacturing and export hub.
We have also taken further steps to increase our financial flexibility. Our continued success allowed us to access the capital markets in 2016 and successfully issue the first two corporate
CEO COMMENT
4 VOLVO CAR GROUP | ANNUAL REPORT 2016VOLVO CAR GROUP | ANNUAL REPORT 2016

Transformation continues
Volume and profit improvement
Product renewal
FOCUS 2016
Record volume and revenue
Industrial transformation continues
New product launches – the XC60 and XC40
Maintained strong profit level
FOCUS 2017
VOLVO CAR GROUP | ANNUAL REPORT 2016 5ANNUAL REPORT 2016 | VOLVO CAR GROUPVOLVO CAR GROUP | ANNUAL REPORT 2016 5ANNUAL REPORT 2016 | VOLVO CAR GROUP
CEO COMMENT

2016 – Executing on strategyWe completed the renewal of our top-of-the-line range – the 90 Series – and started operating two plants producing these models based on our Scalable Product Architecture (SPA). The new models were well-received, with the XC90 driving our overall sales growth. We also announced partnerships with Uber and Autoliv in autonomous driving and revealed our target of selling up to 1 million electrified cars by 2025.
FEBRUARY
Our premium Estate – the V90, was revealed in Stockholm
Our exclusive four-seat XC90 Excellence made its European debut at the Geneva Motor Show
JUNE
We received the Brand Design Language Award 2016
The first V90s rolled off the production line at our Torslanda plant
New route for 2017 – 2018 Volvo Ocean Race was announced
APRIL
Omtanke, our new sustainability programme was launched
We announced a target of selling up to 1 million electrified cars by 2025
The S90 Excellence was unveiled at the Beijing Auto Show
MAY
We accessed capital markets and issued a MEUR 500 bond
We unveiled two new concept cars for our new range of smaller cars
MARCH
Our XC90 was awarded SUV of the Year at the UK Car of the Year Awards
We called on the automotive industry to standardise electric car charging
JAN FEB MAR MAY JUNAPR
JANUARY
Our premium Sedan, the S90, was launched at the North American International Auto Show in Detroit
The XC90 was crowned North American Truck of the Year
OUR YEAR
6 VOLVO CAR GROUP | ANNUAL REPORT 2016
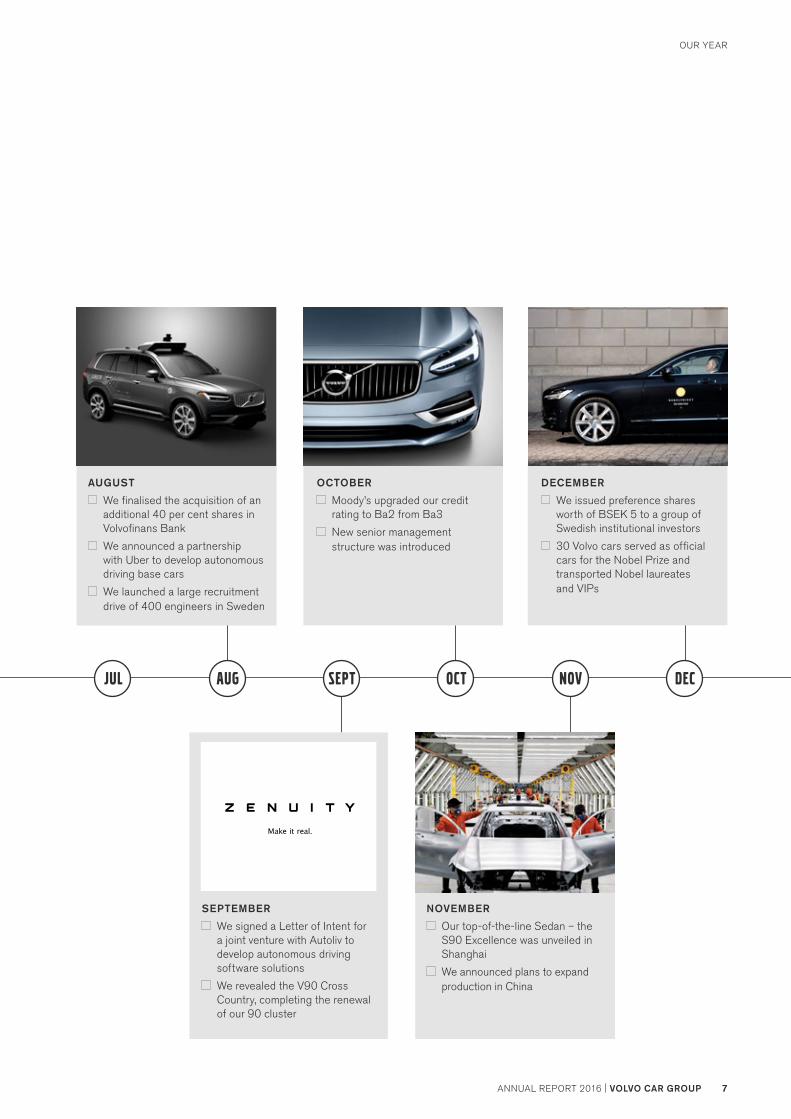
DECEMBER
We issued preference shares worth of BSEK 5 to a group of Swedish institutional investors
30 Volvo cars served as official cars for the Nobel Prize and transported Nobel laureates and VIPs
AUGUST
We finalised the acquisition of an additional 40 per cent shares in Volvofinans Bank
We announced a partnership with Uber to develop autonomous driving base cars
We launched a large recruitment drive of 400 engineers in Sweden
OCTOBER
Moody’s upgraded our credit rating to Ba2 from Ba3
New senior management structure was introduced
SEPTEMBER
We signed a Letter of Intent for a joint venture with Autoliv to develop autonomous driving software solutions
We revealed the V90 Cross Country, completing the renewal of our 90 cluster
NOVEMBER
Our top-of-the-line Sedan – the S90 Excellence was unveiled in Shanghai
We announced plans to expand production in China
JUL AUG SEPT OCT DECNOV
OUR YEAR
VOLVO CAR GROUP | ANNUAL REPORT 2016 7ANNUAL REPORT 2016 | VOLVO CAR GROUP
REGIONAL HEADQUARTERS
GLOBAL HEADQUARTER
CAR PRODUCTION
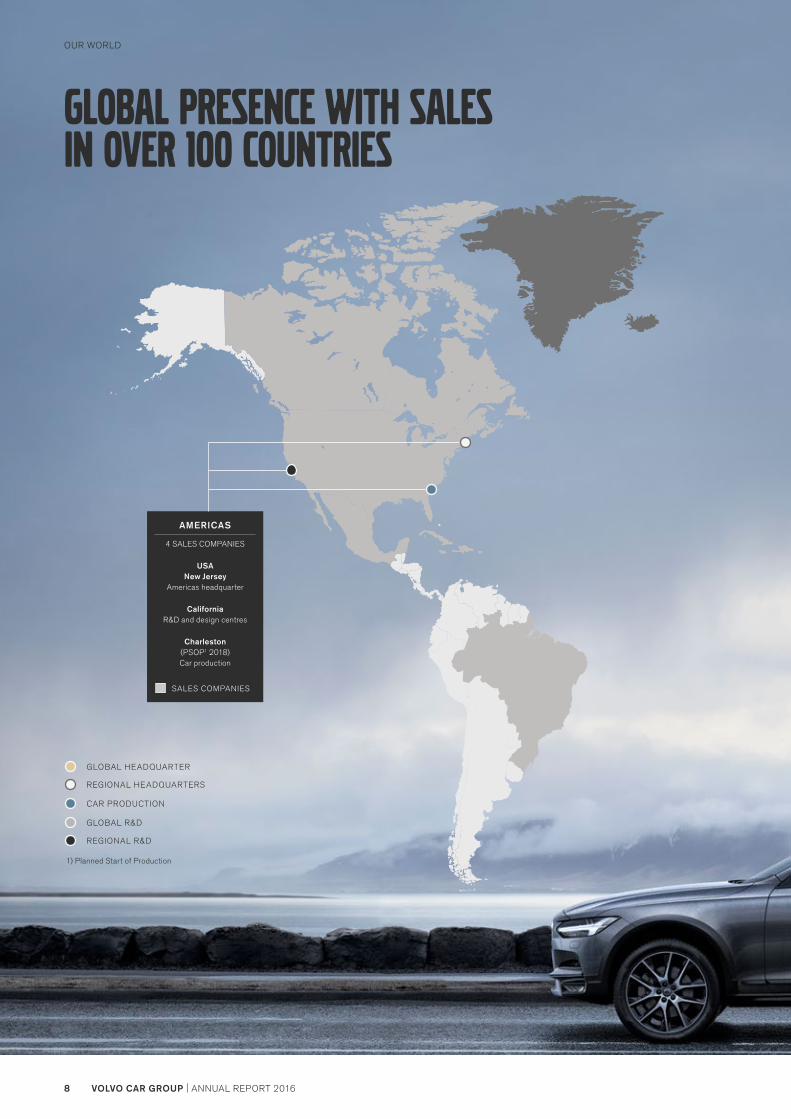
AMERICAS
4 SALES COMPANIES
USANew Jersey
Americas headquarter
CaliforniaR&D and design centres
Charleston (PSOP1 2018)Car production
Global presence with sales in over 100 countries
GLOBAL R&D
REGIONAL R&D
1) Planned Start of Production
SALES COMPANIES
OUR WORLD
8 VOLVO CAR GROUP | ANNUAL REPORT 2016

EMEA
22 SALES COMPANIES
SWEDENGothenburg (HQ)EMEA headquarter
R&D and design centreCar production
BELGIUMGent
Car production
APAC
8 SALES COMPANIES
CHINAShanghai
APAC headquarterR&D centre
ChengduCar production
DaqingCar production
Luqiao (PSOP1 2019)
Contract manufacturer
MALAYSIA Shah Alam
Assembly factory
V90 CROSS COUNTRY
OSMIUM GREY
SALES COMPANIES
SALES COMPANIES
OUR WORLD
VOLVO CAR GROUP | ANNUAL REPORT 2016 9ANNUAL REPORT 2016 | VOLVO CAR GROUP

CHALLENGES AND OPPORTUNITIES
The World around Volvo Cars by 2030 Looking ahead up to 2030, the automotive industry outlook is positive, and the development will be fuelled by strong growth in emerging markets. The industry is likely to experience an increase in sales of shared cars, which is expected to have a marginal impact on the premium segment.
A breakthrough of shared cars that are both electric and fully autonomous will happen once the technologies, legislation and infrastructure mature. And we expect that to occur ahead of 2030.
The automotive industry is currently under strong disruption due to changing customer behaviours, technology shifts, and new entrants. Based on our knowledge today, we foresee several major trends gathering pace in the automotive industry.
New customers are emergingA new customer group – the ‘millennials’ are emerging. They tend to have significantly different expectations on interactions and like to adopt innovative approaches for car ownership and mobility solutions.
L4 = cars with steering wheel – system executes all driving tasks in certain modes, even if driver does not respond to request to intervene
L5 = cars without steering wheel – system executes all driving tasks under all conditions that can be managed by a human driver
Highly and fully autonomous cars are the futureToday we see three main technical barriers towards achieving highly (L4) and fully (L5) autonomous driving (AD).
• Technological development has not reached the level of serial production, but we already start seeing pilots on public roads initiated by a number of players
• Regulatory constrains (legality and liability questions) need to be overcome. We expect legislative bodies and policy makers to be supportive in the long run due to the potential social benefits
• Customers will need to learn and trust automated cars and their safety
By 2030, we expect cars with L4 AD capabilities to have a double digit penetration, with higher penetration in the premium segment. L5 AD cars will most likely end up with single digit penetration rates.
The ‘millennials’ will make up an important share of our customers by 2030. They grow up with the internet and have high expecta-tions for digital interactions. Their purchasing behaviour differs from previous generations as they place more value on experi-ences and the sustainability of products, as well as a company’s ethical and environmental approach. They also prefer convenient services that are available anywhere and anytime, for which they expect seamless integration with their cars.
We anticipate that car sharing will be an attractive mobility option for this new customer group. We also need to show publicly that we are aware of their demands for the sustainability of prod-ucts, and will meet them.
CHALLENGES AND OPPORTUNITIES
10 VOLVO CAR GROUP | ANNUAL REPORT 2016

Sales of full electric and hybrid cars will be on the riseThe industry interest in diesel engines has been declining. We expect more stringent regulations and a gradual phasing-out of advantages for diesel vehicles. Pure electric (BEV) and twin engine (PHEV) vehicles will be vital for the industry to meet the increasingly demanding emission requirements worldwide.
Market projections on electric vehicle (EV) penetration by 2030 are highly uncertain. This is driven by three factors:
• Battery costs and charging infrastructure – battery costs need to drop significantly from today’s levels to bring down the total cost of car ownership to the level of non-EVs (excluding subsidies). Also the charging infrastructure is far from being sufficiently available to support a large amount of EVs.
• Regulations and subsidies – subsidies could steer and incentivise consumers to purchase BEVs or PHEVs. It remains unclear whether they will have a long-lasting impact on consumer behaviours.
• Consumer interest in alternative mobility solutions – we currently see increasing consumer interests in more convenient and sustainable mobility solutions.
Digitalisation will continue transforming car usageOur cars are becoming increasingly con-nected as the telecommunications industry progresses. Long before 2030, all cars will be connected – connectivity will only be a hygiene factor.
We expect to see higher levels of digitali-sation in the automotive industry. The cars will be part of the Internet of Things (IOT) eco-system – connecting all consumer devices and the supporting systems, such as the home-automation systems, Siri, Alexa and the service systems for their cars. The increased speed of innovation will entail faster software developments.
We anticipate that smartphones will be on top of the digital food-chain, with the majority of consumer interactions occuring digitally, including (parts of) the car pur-chasing process.
CHALLENGES AND OPPORTUNITIES
VOLVO CAR GROUP | ANNUAL REPORT 2016 11ANNUAL REPORT 2016 | VOLVO CAR GROUP

Shared mobilityToday, consumers use their cars as ‘all-purpose’ vehicles, be it commuting alone to work or taking the whole family to the beach. In the future, they may prefer the flexibility to choose the best solu-tion for a specific transportation need.
Changing consumer preferences and technological break-throughs will bring about fundamental shifts in the ways people own and use cars. The traditional business model of car sales will be complemented by a range of on-demand mobility solutions, such as e-hailing, carpooling and shared ownership, especially in densely populated urban areas.
Shifting markets, channels and playersThe automotive industry is experiencing an overall paradigm shift towards becoming providers of mobility solutions (cars) and services. New entrants to the industry are emerging from multiple fronts – new car manufacturers such as Tesla and BYD, mobility services providers such as Didi Chuxing and Uber or software engineering powerhouses such as Apple and Google. These new players are reinventing the business model and making the com-petitive landscape more complex. Inevitably, they will also force established manufacturers to compete and collaborate on multiple fronts.
Established automakers are also likely to work on capturing a larger portion of the vehicles’ total value. As new manufacturers move to establish their own points of contact with buyers to further capture the aftersales revenue streams, traditional automotive players, will feel the squeeze from the continuous pressure to reduce costs and become more capital-efficient. This may lead to shifted market positions, industry consolidations and new forms of partnerships among the current competitors.
CHALLENGES AND OPPORTUNITIES
12 VOLVO CAR GROUP | ANNUAL REPORT 2016

V90 CROSS COUNTRY PRO
OSMIUM GREY METALLIC
CHALLENGES AND OPPORTUNITIES
VOLVO CAR GROUP | ANNUAL REPORT 2016 13ANNUAL REPORT 2016 | VOLVO CAR GROUP
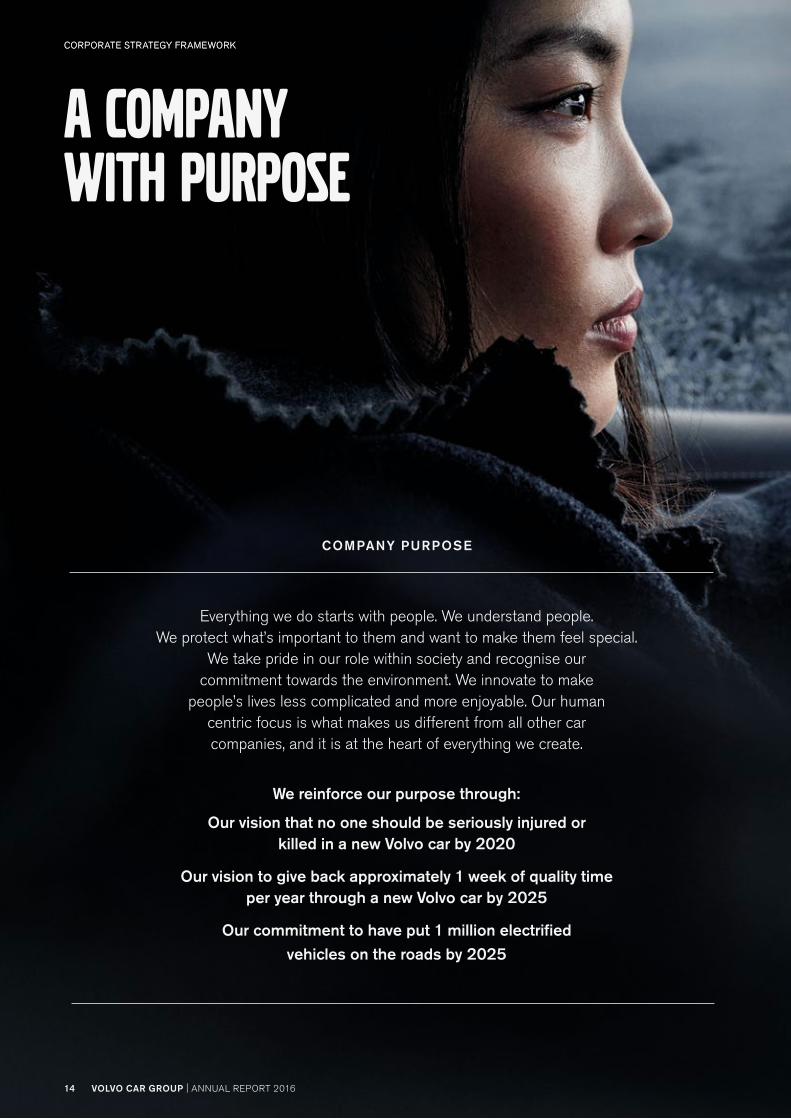
a company with purpose
CORPORATE STRATEGY FRAMEWORK
Everything we do starts with people. We understand people. We protect what’s important to them and want to make them feel special.
We take pride in our role within society and recognise our commitment towards the environment. We innovate to make
people’s lives less complicated and more enjoyable. Our human centric focus is what makes us different from all other car companies, and it is at the heart of everything we create.
We reinforce our purpose through:
Our vision that no one should be seriously injured or killed in a new Volvo car by 2020
Our vision to give back approximately 1 week of quality time per year through a new Volvo car by 2025
Our commitment to have put 1 million electrified vehicles on the roads by 2025
COMPANY PURPOSE
CORPORATE STRATEGY FRAMEWORK
14 VOLVO CAR GROUP | ANNUAL REPORT 2016
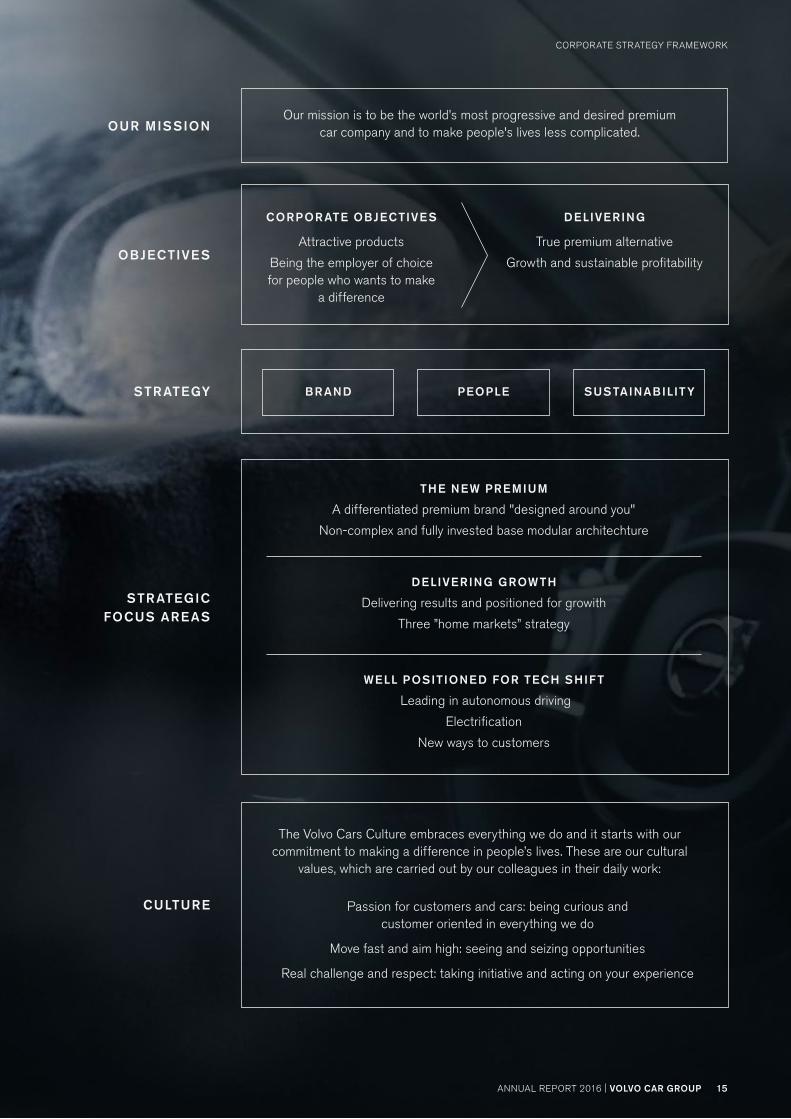
STR ATEGY
STR ATEGIC FOCUS ARE AS
THE NE W PREMIUM
A differentiated premium brand "designed around you"
Non-complex and fully invested base modular architechture
DELIVERING GROW TH
Delivering results and positioned for growith
Three ”home markets” strategy
WELL POSITIONED FOR TECH SHIF T
Leading in autonomous driving
Electrification
New ways to customers
CULTURE
The Volvo Cars Culture embraces everything we do and it starts with our commitment to making a difference in people’s lives. These are our cultural
values, which are carried out by our colleagues in their daily work:
Passion for customers and cars: being curious and customer oriented in everything we do
Move fast and aim high: seeing and seizing opportunities
Real challenge and respect: taking initiative and acting on your experience
OUR MISSIONOur mission is to be the world’s most progressive and desired premium
car company and to make people's lives less complicated.
OBJECTIVE S
CORPOR ATE OBJECTIVE S
Attractive products
Being the employer of choice for people who wants to make
a difference
BR AND PEOPLE SUSTAINABIL IT Y
DELIVERING
True premium alternative
Growth and sustainable profitability
CORPORATE STRATEGY FRAMEWORK
VOLVO CAR GROUP | ANNUAL REPORT 2016 15ANNUAL REPORT 2016 | VOLVO CAR GROUP
CORPORATE STRATEGY FRAMEWORK
16 VOLVO CAR GROUP | ANNUAL REPORT 2016
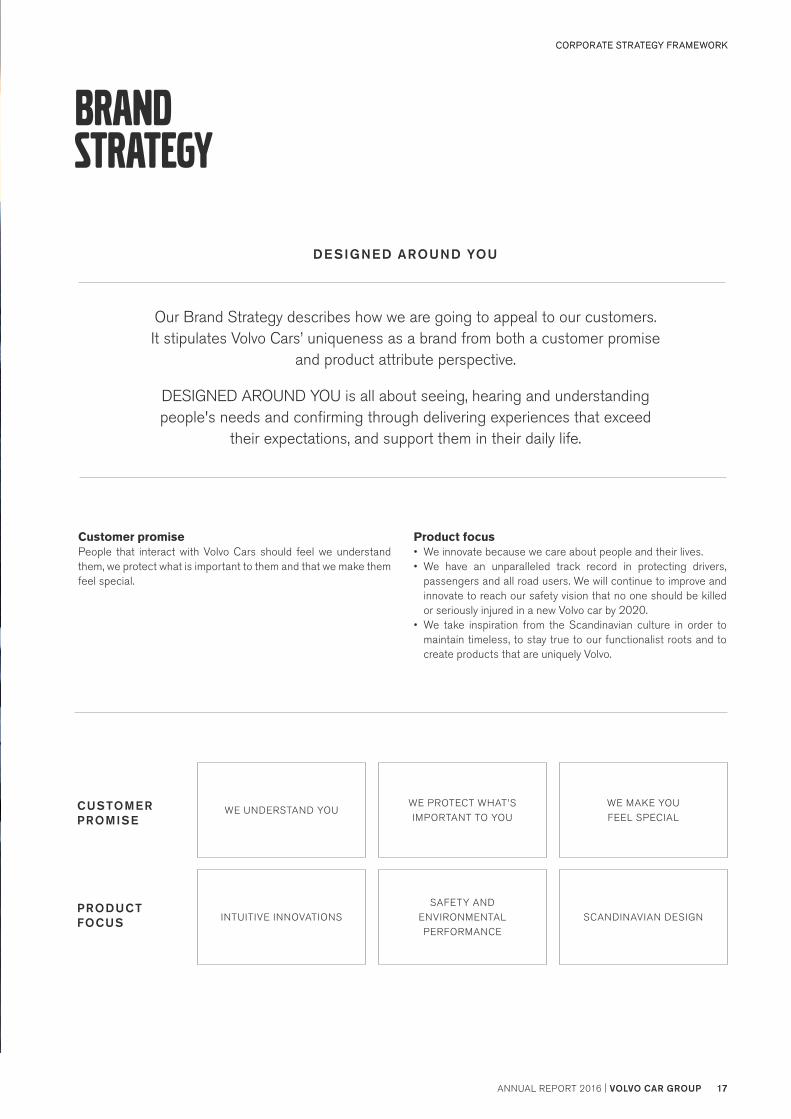
DE SIGNED AROUND YOU
Our Brand Strategy describes how we are going to appeal to our customers. It stipulates Volvo Cars’ uniqueness as a brand from both a customer promise
and product attribute perspective.
DESIGNED AROUND YOU is all about seeing, hearing and understanding people's needs and confirming through delivering experiences that exceed
their expectations, and support them in their daily life.
Customer promisePeople that interact with Volvo Cars should feel we understand them, we protect what is important to them and that we make them feel special.
Product focus• We innovate because we care about people and their lives.• We have an unparalleled track record in protecting drivers,
passengers and all road users. We will continue to improve and innovate to reach our safety vision that no one should be killed or seriously injured in a new Volvo car by 2020.
• We take inspiration from the Scandinavian culture in order to maintain timeless, to stay true to our functionalist roots and to create products that are uniquely Volvo.
WE UNDERSTAND YOU
INTUITIVE INNOVATIONS
WE PROTECT WHAT’S IMPORTANT TO YOU
SAFETY AND ENVIRONMENTAL PERFORMANCE
WE MAKE YOU FEEL SPECIAL
SCANDINAVIAN DESIGN
CUSTOMERPROMISE
PRODUCTFOCUS
brand strategy
CORPORATE STRATEGY FRAMEWORK
VOLVO CAR GROUP | ANNUAL REPORT 2016 17ANNUAL REPORT 2016 | VOLVO CAR GROUP
CORPORATE STRATEGY FRAMEWORK
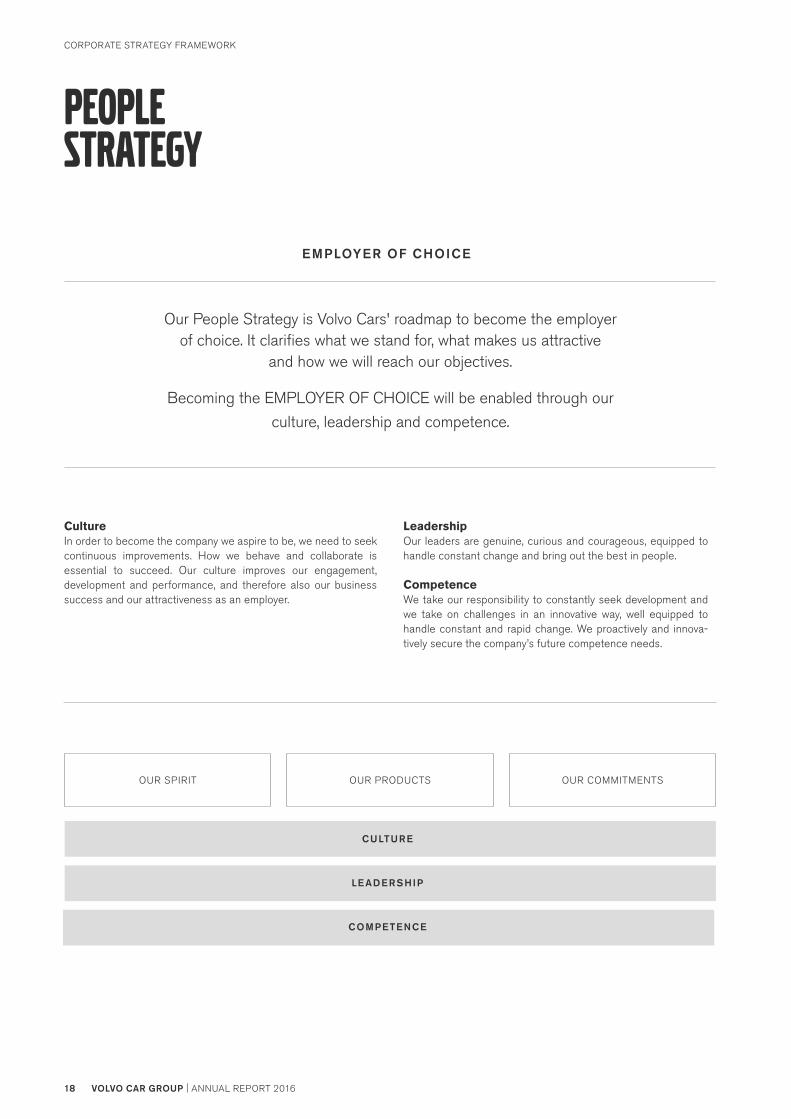
people strategy
OUR SPIRIT OUR PRODUCTS OUR COMMITMENTS
CultureIn order to become the company we aspire to be, we need to seek continuous improvements. How we behave and collaborate is essential to succeed. Our culture improves our engagement, development and performance, and therefore also our business success and our attractiveness as an employer.
LeadershipOur leaders are genuine, curious and courageous, equipped to handle constant change and bring out the best in people.
CompetenceWe take our responsibility to constantly seek development and we take on challenges in an innovative way, well equipped to handle constant and rapid change. We proactively and innova-tively secure the company’s future competence needs.
CULTURE
LE ADE RSHIP
COMPE TE NCE
Our People Strategy is Volvo Cars' roadmap to become the employer of choice. It clarifies what we stand for, what makes us attractive
and how we will reach our objectives.
Becoming the EMPLOYER OF CHOICE will be enabled through our
culture, leadership and competence.
EMPLOYER OF CHOICE
CORPORATE STRATEGY FRAMEWORK
18 VOLVO CAR GROUP | ANNUAL REPORT 2016

CORPORATE STRATEGY FRAMEWORK
VOLVO CAR GROUP | ANNUAL REPORT 2016 19ANNUAL REPORT 2016 | VOLVO CAR GROUP

CORPORATE STRATEGY FRAMEWORK
20 VOLVO CAR GROUP | ANNUAL REPORT 2016

OMTANKE
UN SUSTAINABLE DEVELOPMENT GOALSThe UN Sustainable Development Goals (SDGs) are a series of 17 goals agreed on by world leaders in 2015 which aim to help end all forms of poverty, reduce inequality and tackle climate change. Governments, civil society and business will work towards meeting them over the next 15 years. The SDGs act as our guide, with 12 out of the 17 directly relevant to our sustainability work.
SUSTAINABLE PROFITABILITY AND GROWTH
RESOURCE EFFICIENT BUSINESSClimate neutral operations by 2025
sustainability commitment
Protecting what’s important to you is at the core of our business and of our approach to sustainability.
“OMTANKE” is a Swedish word that means “caring” and “consideration”, but also importantly “to think again”. It is the name of our sustainability programme.
Our commitment is to re-think our sustainability approach, and ensure its impact is felt beyond our operations and products, and into society.
Our sustainability themes are clean, safe and responsible. We focus on nine topics, each containing a clear commitment. Working on these topics contributes
to the sustainable profitability and growth of the company.
OUR COMPANY IMPACTS THE IMPACT OF OUR PRODUCTS OUR ROLE IN SOCIETY
SUSTAINABLE WORK LIFENo fatalities or serious injuries at
Volvo Cars
DIVERSE & INCLUSIVE CULTURE35% internationally diverse leaders and 35% female leaders by 2020
LIFE-CYCLE PERFORMANCE1 million electrified vehicles sold by 2025
REAL-LIFE SAFETYOur vision is that by 2020, no one should be seriously injured or killed in a new Volvo car
CUSTOMER EXPERIENCECleanZone leadership
PARTNER IN SUSTAINABLE DEVELOPMENT
Engage in corporate partnerships
SAFER BY SHARINGKnowledge sharing to improve
traffic safety
EMBODYING ETHICS AND HUMAN RIGHTS
Ethical leadership for responsible business
CLEAN
SAFE
RESPONSIBLE
CORPORATE STRATEGY FRAMEWORK
21ANNUAL REPORT 2016 | VOLVO CAR GROUPVOLVO CAR GROUP | ANNUAL REPORT 2016

strategic focus areas
Volvo Cars is a premium car manufacturer with focus on people, advanced technology, safety, the environment and Scandinavian design. We believe that our competitive strengths are built upon
our firm commitment to the corporate objectives and our continuous delivery upon the key strategic focus areas.
CORPOR ATE OBJECTIVES
DELIVERING
True premium alternative
Growth and sustainable profitability
Attractive products
Being the employer of choice for people who wants to
make a difference
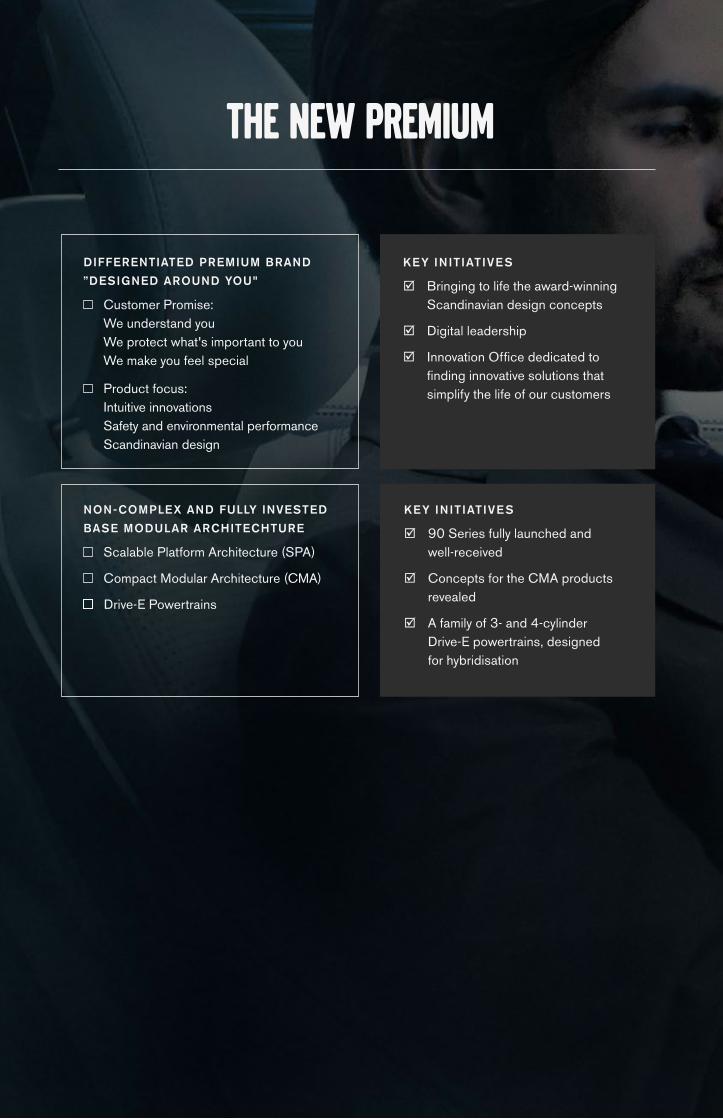
Bringing to life the award-winning Scandinavian design concepts
Digital leadership
Innovation Office dedicated to finding innovative solutions that
simplify the life of our customers
KE Y INIT IATIVE SDIFFERENTIATED PREMIUM BRAND
”DESIGNED AROUND YOU"
Customer Promise: We understand you We protect what's important to you We make you feel special
Product focus: Intuitive innovations Safety and environmental performance Scandinavian design
the new premium
90 Series fully launched and well-received
Concepts for the CMA products revealed
A family of 3- and 4-cylinder Drive-E powertrains, designed for hybridisation
KE Y INIT IATIVE SNON-COMPLEX AND FULLY INVESTED
BASE MODULAR ARCHITECHTURE
Scalable Platform Architecture (SPA)
Compact Modular Architecture (CMA)
Drive-E Powertrains
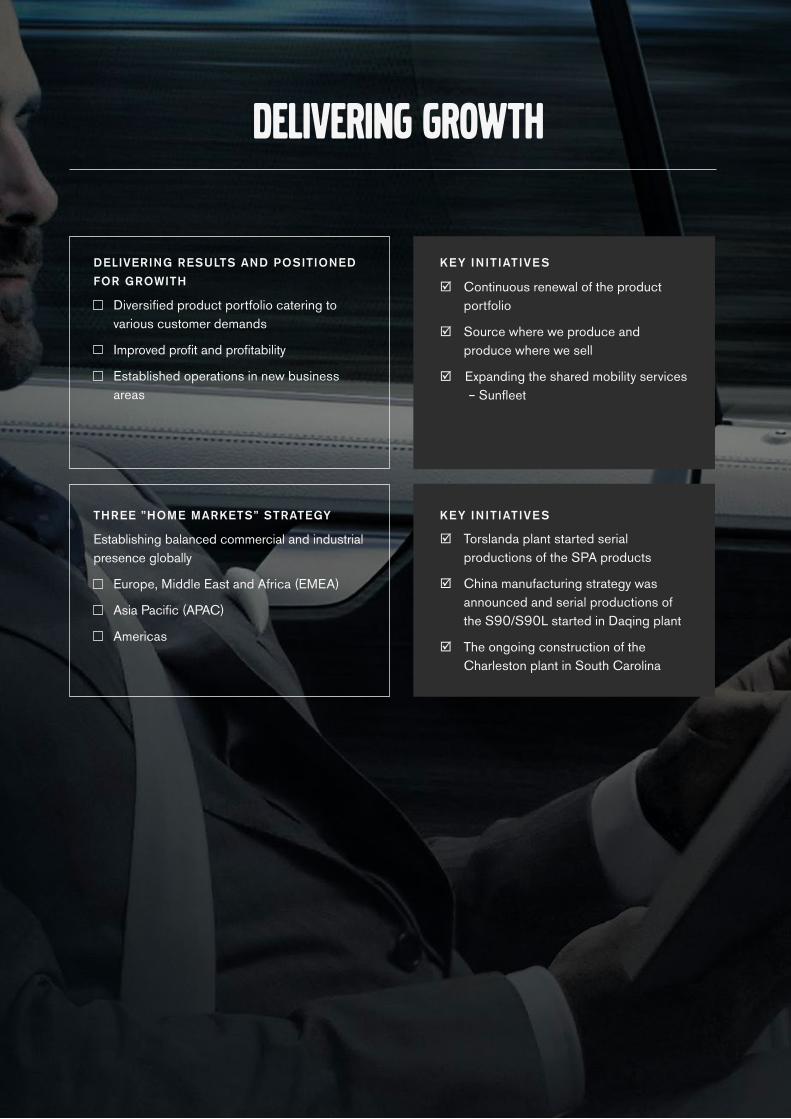
Continuous renewal of the product portfolio
Source where we produce and produce where we sell
Expanding the shared mobility services – Sunfleet
KE Y INIT IATIVE S
Torslanda plant started serial productions of the SPA products
China manufacturing strategy was announced and serial productions of the S90/S90L started in Daqing plant
The ongoing construction of the Charleston plant in South Carolina
KE Y INIT IATIVE S
delivering growth
DELIVERING RESULTS AND POSITIONED
FOR GROWITH
Diversified product portfolio catering to various customer demands
Improved profit and profitability
Established operations in new business areas
THREE ”HOME MARKETS” STRATEGY
Establishing balanced commercial and industrial presence globally
Europe, Middle East and Africa (EMEA)
Asia Pacific (APAC)
Americas
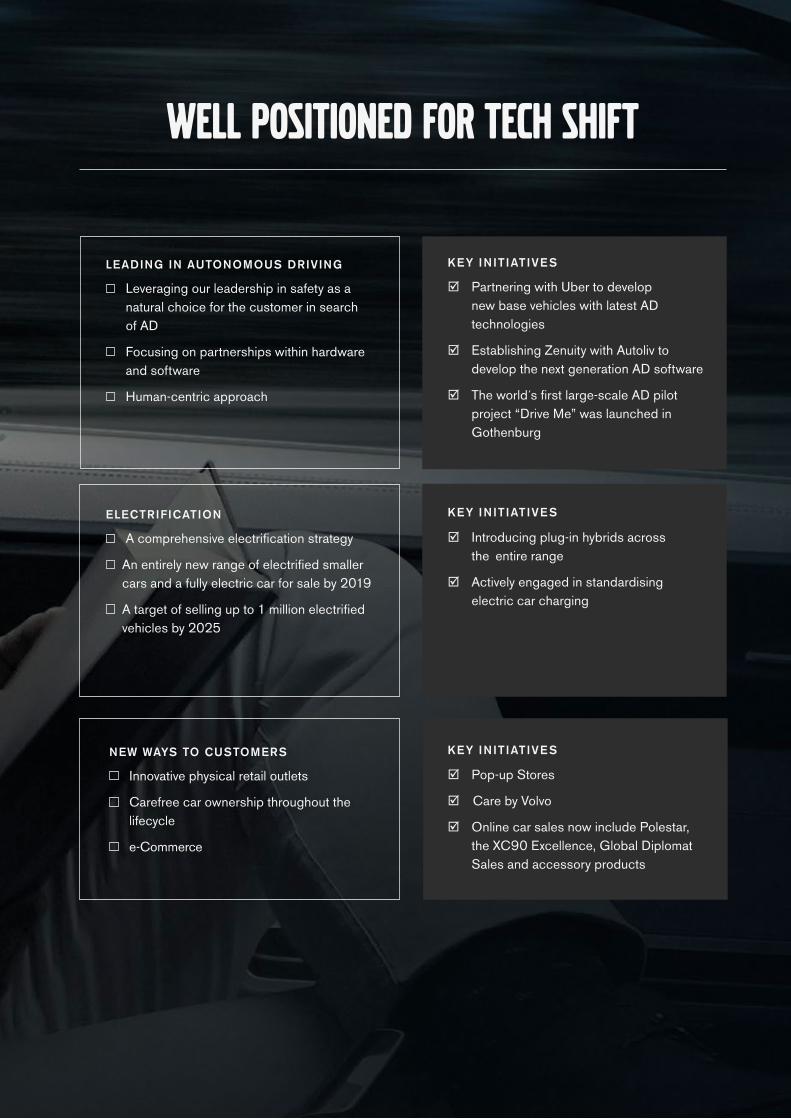
well positioned for tech shift
Introducing plug-in hybrids across the entire range
Actively engaged in standardising electric car charging
KE Y INIT IATIVE S
Partnering with Uber to develop new base vehicles with latest AD technologies
Establishing Zenuity with Autoliv to develop the next generation AD software
The world´s first large-scale AD pilot project “Drive Me” was launched in Gothenburg
KE Y INIT IATIVE S
Pop-up Stores
Care by Volvo
Online car sales now include Polestar, the XC90 Excellence, Global Diplomat Sales and accessory products
KE Y INIT IATIVE S
LEADING IN AUTONOMOUS DRIVING
Leveraging our leadership in safety as a natural choice for the customer in search of AD
Focusing on partnerships within hardware and software
Human-centric approach
ELECTRIFICATION
A comprehensive electrification strategy
An entirely new range of electrified smaller cars and a fully electric car for sale by 2019
A target of selling up to 1 million electrified vehicles by 2025
NEW WAYS TO CUSTOMERS
Innovative physical retail outlets
Carefree car ownership throughout the lifecycle
e-Commerce

2010: Volvo Cars acquired by Zhejiang Geely Holding Group
2011: Strategic re-positioning initiated and largest investment programme in our history commenced
2013: New Drive-E powertrain family introduced
reaching our corporate objectives
PHASE I 2010 – 2015
STRATEGIC TRANSFORMATION
2014: The all-new XC90 unveiled – first product on the SPA platform
2015: New record unit sales of 500K and improved profitability achieved
PHASE I I 2016 AND BEYOND
PROFITABLE GROWTH
Roll-out of fully renewed product range. Leading the way in Autonomous Driving and leveraging Volvo Cars’ experience in new ventures
1.
Further footprint optimi-sation and new plant in the US2.
Efficiency and flexibility through modularity with new SPA, CMA and Drive-E platforms
3.
New Ways to Customers by e-commerce, car shar-ing, down town studios and service products
4.
CORPOR ATE OBJECTIVE S
Attractive products
Being the employer of choice for people who wants to make a difference
DELIVERING
True premium alternative
Growth and sustainable profitability

DESIGN, PRODUCTS AND TECHNOLOGY
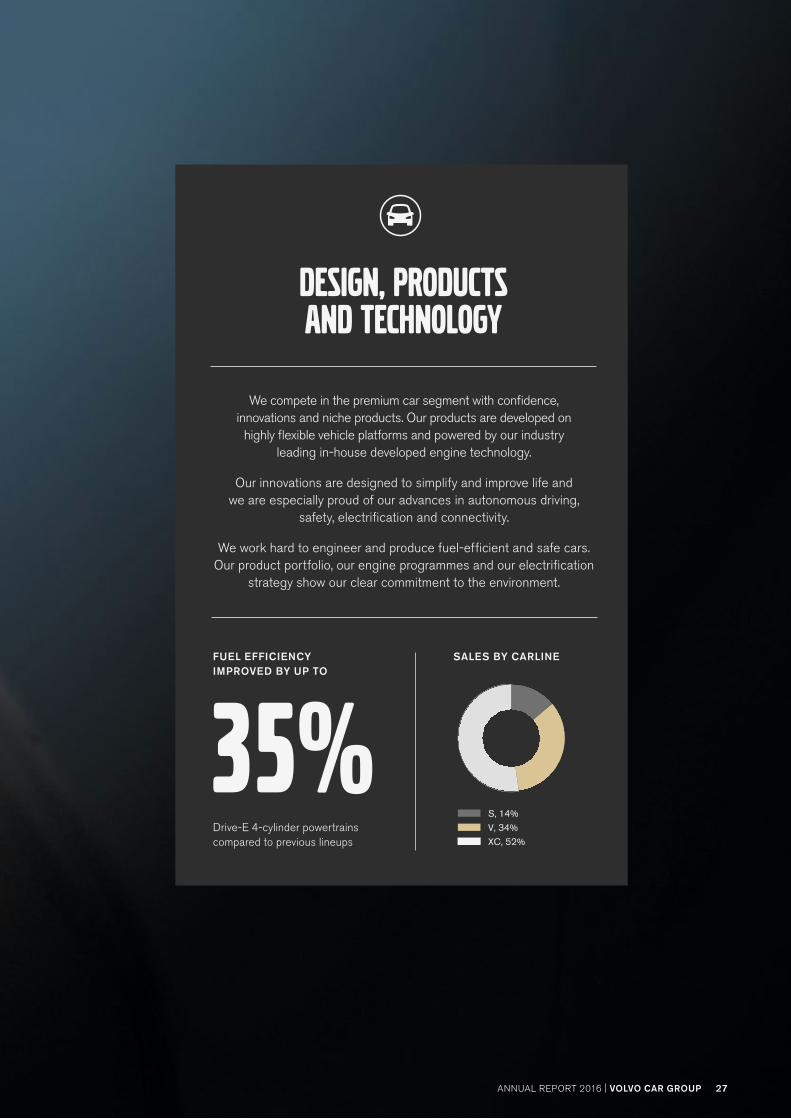
We compete in the premium car segment with confi-dence, innovations and niche products. Our products are developed on highly flexible vehicle platforms and powered by our industry leading in-house developed engine technology.
Our innovations are designed to simplify and improve life and we are especially proud of our advances in autonomous driving, safety, electrification and con-nectivity.
We work hard to engineer and produce fuel- efficient and safe cars. Our product portfolio, our engine programmes and our electrification strategy show our clear commitment to the environment.
We aim to sell 1 million electrified vehicles by 2025, and have an equally ambitious safety vision – no one should be seriously injured or killed in a new Volvo car by 2020.
We enhance our customer experiences by being a leader in health related care for customers through class-leading interior air quality and materials, which we call CleanZone Leadership.
INVE STME NTSWe are continuously investing in product development to secure our position of offering industry leading tech-nologies to our customers. In addition, we also invest in our manufacturing facilities to ensure our production quality and capacity.
Creating sustainable value and growth
READ MORE ON PAGE 27–39
We are committed to having no work-related fatalities or serious injuries involving any of our employees or contractors. Also, by 2020, we aim to have 35% internationally diverse leaders and 35% female leaders. We will continue to operate based on our Code of Conduct and further develop our compliance programme. We believe these commitments protect our own people, as well as enhance creativity, innovation, productivity and profitability.
PEOPLE
READ MORE ON PAGE 61–67
We work towards contributing to a better society and protecting people and our planet by creating partnerships for sustainable development and promoting traffic safety in the car industry together with local and international organisations. We also encourage responsible business practices throughout our value chain by promoting ethical leadership and human rights.
SOCIETY
READ MORE ON PAGE 69–71
VALUE CHAIN
24 VOLVO CAR GROUP | ANNUAL REPORT 2016
PURCHASING, MANUFACTURING AND LOGISTICS
We have approximately 600 business partners deliver-ing production materials for serial production and roughly 3,500 preferred suppliers delivering indirect products and services. The majority of the components used in our vehicles are manufactured by our suppliers, therefore our relationships are of vital importance to us.
We work actively with our suppliers to ensure supply chain sustainability and we aim to source where we produce. We integrate sustainability activities into our day-to-day processes and tools and rolled out a spe-cific Code of Conduct for Business Partners.
We are establishing a global industrial footprint. We apply the Volvo Car Manufacturing Systemin all our plants to ensure the high quality standards of our products.
By using our resources efficiently, we are committed to minimising the environmental impact of our operations. We not only focus on water, energy, waste and air emis-sions, but also set ambitious targets such as being cli-mate neutral in all our manufacturing operations by 2025.
We manage the logistics of our production materials and our vehicles in-house, and are constantly reviewing and improving the efficiency of our logistics operations.
CONSUMER EXPERIENCES AND RE-USAGE
We make life easy for our customers and are deter-mined to provide the most intuitive purchasing experi-ences for our customers, through digital leadership of our website and e-commerce. We are also experi-menting with new retail concepts such as Popup Stores and Volvo Studios.
We market and sell our products and services in a fair and honest manner. We issue Volvo Cars Corporate Marketing Instructions to provide guidance on the preparation and documentation of our advertising materials, for our sales companies worldwide.
We take good care of our customers, and provide carefree ownership experiences through offering Care by Volvo and personalised technical services.Beyond the new car sales, we also offer a global used car programme – Volvo Selekt, offering a more affordable entry to our brand.
READ MORE ON PAGE 41–45 READ MORE ON PAGE 47–59
SUSTAINABLE PROFITABIL IT Y AND GROW TH
VALUE CHAIN
VOLVO CAR GROUP | ANNUAL REPORT 2016 25ANNUAL REPORT 2016 | VOLVO CAR GROUP

THE CMA-BASED
VOLVO CONCEPT 40.2
26 VOLVO CAR GROUP | ANNUAL REPORT 2016
We compete in the premium car segment with confidence, innovations and niche products. Our products are developed on
highly flexible vehicle platforms and powered by our industry leading in-house developed engine technology.
Our innovations are designed to simplify and improve life and we are especially proud of our advances in autonomous driving,
safety, electrification and connectivity.
We work hard to engineer and produce fuel- efficient and safe cars. Our product portfolio, our engine programmes and our electrification
strategy show our clear commitment to the environment.
FUEL EFFICIENCY IMPROVED BY UP TO
SALES BY CARLINE
XC, 52%
V, 34%
S, 14%
Drive-E 4-cylinder powertrains compared to previous lineups
35%
design, products and Technology
VOLVO CAR GROUP | ANNUAL REPORT 2016 27ANNUAL REPORT 2016 | VOLVO CAR GROUP

Creating modern Scandinavian experiencesOur Design Language channels the origins of the Volvo brand and other Scandinavian sources of inspiration. Being the Scandinavian car brand, we aim to create the most beautiful proportions possible for our cars while maintaining functionality.
V90 T6 AWD INSCRIPTION BRIGHT SILVER METALLIC
We have outlined our design strategy with three themes that guide our designs: Scandinavian Authority, Scandinavian Activity and Scandinavian Creativity. The core of our design strategy is human centricity. This is brought to our customers by paying detailed attention to our modern Scandinavian design.
Design strategy is brought to lifeWe completed the launch of the entire 90 line-up with the V90 and V90 Cross Country, the models joining the XC90 and S90. This cluster of cars has brought to life our design strategy. While the 90 cluster cars exhibit our latest design signatures, including the T-shaped ‘Thor’s Hammer’ daytime running lights, the expressive floating grille and a lit crystal gear shifter from Orrefors, they also
have their own personality. With the completion of our 90 cluster, we successfully established our models as truly premium and rep-resenting bespoke Scandinavian aesthetics.
Our designs are recognisedWe were awarded with the coveted Brand Design Language Award 2016, for our work on offering a consistent brand form lan-guage over the entire product range.
Following the footsteps of the XC90, our S90 was credited with Red Dot Design Product Design Award, for combining a plain but elegant exterior and a generous, high-grade interior with smart assis-tance systems which enhance safety and increase driving comfort.
DESIGN
28 VOLVO CAR GROUP | ANNUAL REPORT 2016

Interiors that redefine modern luxuryThe interior design of new Volvo cars has received a lot of attention lately, for the serene nature of the design and the use of key design elements, exemplified by the elegant air blades and control surfaces. Our distinctive approach to interior design aims to deliver a luxurious and calming experience. We believe that the art of Scandinavian design is all about enhancing the life experience, and Volvo Cars does this the best.
New design concept for compact modelsWe revealed the design concept for our future compact models to be developed on the Compact Modular Architecture (CMA) plat-form. Each member of our product family will have its own distinct character. From the sophisticated elegance of our flagship 90 Series to the youthful, energetic future compact models – and every point in between – our focus remains on creating the ideal expression of modern Scandinavian lifestyle for each segment.
THE CMA-BASED VOLVO CONCEPT 40.2
THE LOUNGE CONSOLE OF S90 EXCELLENCE
DESIGN
VOLVO CAR GROUP | ANNUAL REPORT 2016 29ANNUAL REPORT 2016 | VOLVO CAR GROUP
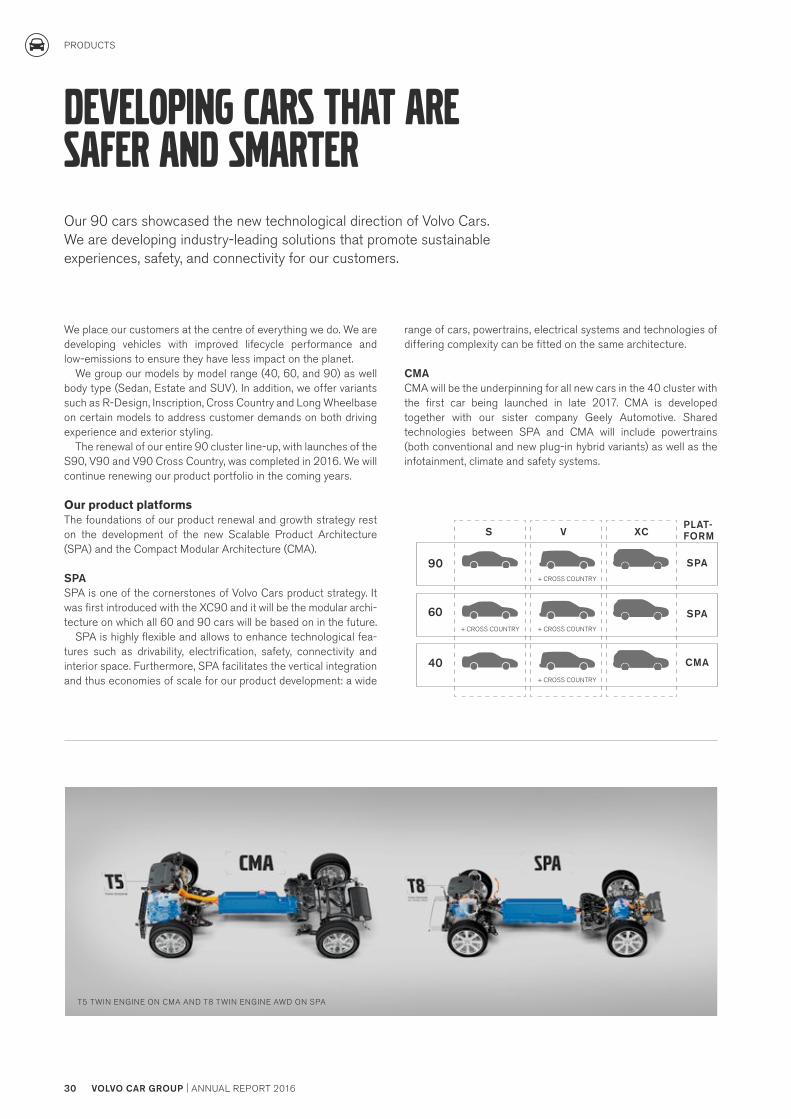
We place our customers at the centre of everything we do. We are developing vehicles with improved lifecycle performance and low-emissions to ensure they have less impact on the planet.
We group our models by model range (40, 60, and 90) as well body type (Sedan, Estate and SUV). In addition, we offer variants such as R-Design, Inscription, Cross Country and Long Wheelbase on certain models to address customer demands on both driving experience and exterior styling.
The renewal of our entire 90 cluster line-up, with launches of the S90, V90 and V90 Cross Country, was completed in 2016. We will continue renewing our product portfolio in the coming years.
Our product platformsThe foundations of our product renewal and growth strategy rest on the development of the new Scalable Product Architecture (SPA) and the Compact Modular Architecture (CMA).
SPASPA is one of the cornerstones of Volvo Cars product strategy. It was first introduced with the XC90 and it will be the modular archi-tecture on which all 60 and 90 cars will be based on in the future.
SPA is highly flexible and allows to enhance technological fea-tures such as drivability, electrification, safety, connectivity and interior space. Furthermore, SPA facilitates the vertical integration and thus economies of scale for our product development: a wide
Developing cars that are safer and smarterOur 90 cars showcased the new technological direction of Volvo Cars. We are developing industry-leading solutions that promote sustainable experiences, safety, and connectivity for our customers.
range of cars, powertrains, electrical systems and technologies of differing complexity can be fitted on the same architecture.
CMACMA will be the underpinning for all new cars in the 40 cluster with the first car being launched in late 2017. CMA is developed together with our sister company Geely Automotive. Shared technologies between SPA and CMA will include powertrains (both conventional and new plug-in hybrid variants) as well as the infotainment, climate and safety systems.
90
60
40
S V
+ CROSS COUNTRY
+ CROSS COUNTRY+ CROSS COUNTRY
+ CROSS COUNTRY
XC
SPA
CMA
PLAT-FORM
SPA
T5 TWIN ENGINE ON CMA AND T8 TWIN ENGINE AWD ON SPA
PRODUCTS
30 VOLVO CAR GROUP | ANNUAL REPORT 2016

Our powertrain familyOur non-complex powertrain family consists of 3- and 4- cylinder Drive-E powertrains. Our powertrain technology is focused on delivering responsive power, clean efficiency and an exceptional driving experience. Based on the modularity principle, the compact engines can be effectively combined with driveline electrification on our new platforms.
Responsive powerOur powertrains come with advanced boosting technology and state-of-art transmissions. They deliver responsive power through turbo and supercharging. They consist of one common rail diesel and one direct-injected petrol version. The diesels range from 120 to 235 hp, while petrol versions go from 122 hp all the way up to 320 hp. This allows us to respond to customers who demand high power and torque without compromising the driving experiences.
Clean efficiencyAll of our powertrains are designed to improve fuel economy and reduce emissions. Our Drive-E four-cylinder powertrains have improved fuel efficiency by up to 35 per cent compared to our previous powertrain line-up while reducing weight by up to 45 kg.
Hybridisation – Twin Engine We firmly believe that hybridisation and electrification is the way forward. Twin Engine technology will be available on all of our future product archtectures. Our Twin Engine set-up positions the high voltage battery in the tunnel console for maximum safety, improving the weight distribution while providing an enhanced driving experience.
We will offer the T8 Twin Engine variant for the cars based on SPA and the T5 Twin Engine for the cars based on CMA.
DRIVE–E 3 CYLINDER PETROL – MODULAR DESIGN
PRODUCTS
VOLVO CAR GROUP | ANNUAL REPORT 2016 31ANNUAL REPORT 2016 | VOLVO CAR GROUP

VERIFICATION PROTOTYPE
PR
OD
UC
TIO
N
REAL WORLD DATA SAFETY REQUIREMENTS
PROD
UC
T DE
VELO
PMEN
T
Real-life safetyVolvo Cars has a hard-earned reputation for producing safe vehi-cles on the road. This has partly been secured through our indus-try-leading approach to real-life safety. By using real-life data to solve traffi c safety issues, we get to the root cause of road inci-dents and contribute to safer roads. The working process that was established at Volvo Cars is based on an effective interplay between researchers and designers.
Real-life dataThe Traffi c Accident Research function was established in 1970. The data we have collected over the decades gives us unique insights and detailed knowledge of factors behind crashes, vehicle responses and injuries. This is how we have identifi ed priorities for safety, and focused on protecting lives. We have collected statisti-cal accident data involving Volvo cars in Sweden for over 43,000 accidents involving 72,000 occupants.
The knowledge gained from accident analyses forms the basis for internal safety requirements. We develop pioneering test methods to refl ect different situations and analyse crash data. Designers at Volvo Cars work with these requirements in mind when developing cars, including subsystems and components. Our cars are tested in the lab, with approximately 20,000 computer simulated crash tests and no less than 60 physical crash tests per model, so we are ready to fulfi ll the requirements even before production. When the new products are on the road our Accident Research Team follows up and the process continues, improving constantly.
An important part of the working process is to have the possibil-ity to correlate real world crash data with laboratory data. This ena-
bles the evaluation of possible system solutions in the early stage of the development process, and a forecast of real-world out-comes. At Volvo Cars, we push technological boundaries and have reduced the risk for Volvo drivers and passengers of being seri-ously injured in an accident by 50 per cent over a 10-year period.
NORMALDRIVING
DEVIATION FROM NORMAL
EMERGING SITUATION
CRITICAL SITUATION
CRASH UNAVOIDABLE
CRASH POSTCRASH
STATE OF THE DRIVER AND TRAFFIC ENVIRONMENT
VEHICLE CONFLICT SITUATION
DRIVER UNABLE TO AVOID CRASH, CAR STILL ABLE TO AVOID CRASH
DRIVER AND CAR UNABLE TO AVOID, REDUCE SEVERITY AND PREPARE TO CRASH
CRASH PROTECTION
SOS AND VOLVO ON CALL
TIME: 2–3 SECONDS 1 SECOND 0 SECOND
THE HOLISTIC APPROACH TO SAFETY
PRODUCTS
32 VOLVO CAR GROUP | ANNUAL REPORT 2016
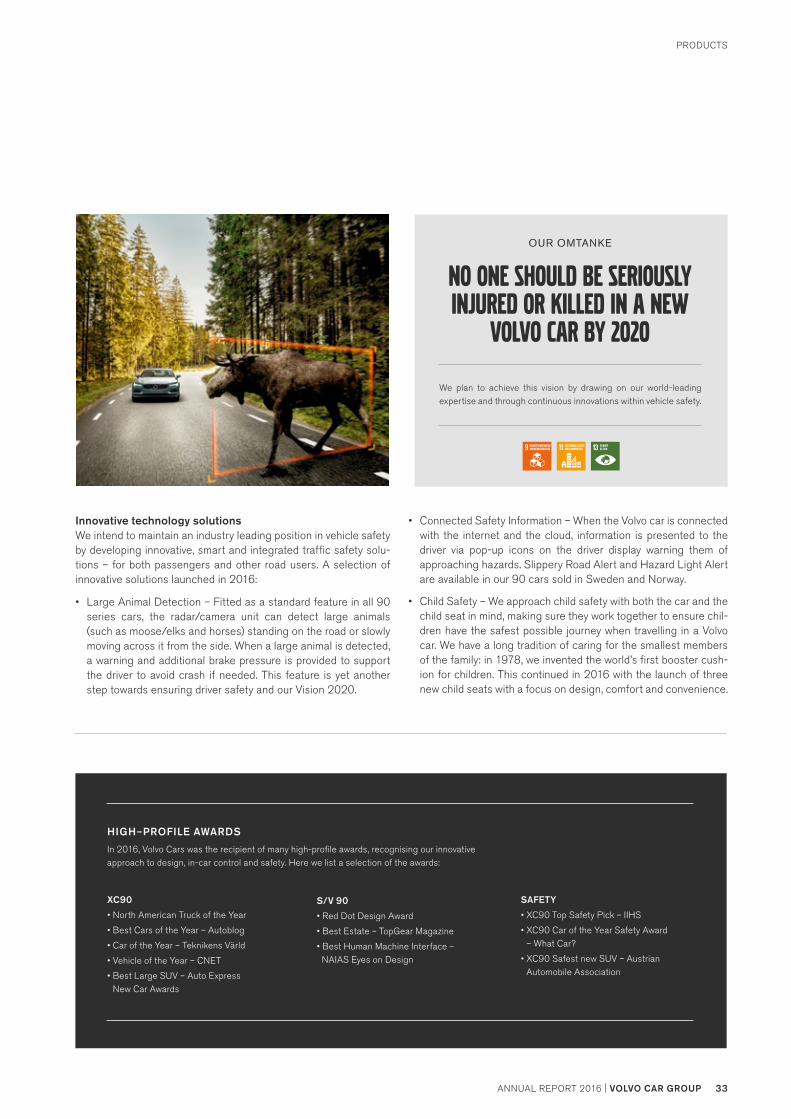
Innovative technology solutionsWe intend to maintain an industry leading position in vehicle safety by developing innovative, smart and integrated traffic safety solu-tions – for both passengers and other road users. A selection of innovative solutions launched in 2016:
• Large Animal Detection – Fitted as a standard feature in all 90 series cars, the radar/camera unit can detect large animals (such as moose/elks and horses) standing on the road or slowly moving across it from the side. When a large animal is detected, a warning and additional brake pressure is provided to support the driver to avoid crash if needed. This feature is yet another step towards ensuring driver safety and our Vision 2020.
XC90
• North American Truck of the Year
• Best Cars of the Year – Autoblog
• Car of the Year – Teknikens Värld
• Vehicle of the Year – CNET
• Best Large SUV – Auto Express New Car Awards
HIGH–PROFILE AWARDS
In 2016, Volvo Cars was the recipient of many high-profile awards, recognising our innovative approach to design, in-car control and safety. Here we list a selection of the awards:
SAFETY
• XC90 Top Safety Pick – IIHS
• XC90 Car of the Year Safety Award – What Car?
• XC90 Safest new SUV – Austrian Automobile Association
S/V 90
• Red Dot Design Award
• Best Estate – TopGear Magazine
• Best Human Machine Interface – NAIAS Eyes on Design
• Connected Safety Information – When the Volvo car is connected with the internet and the cloud, information is presented to the driver via pop-up icons on the driver display warning them of approaching hazards. Slippery Road Alert and Hazard Light Alert are available in our 90 cars sold in Sweden and Norway.
• Child Safety – We approach child safety with both the car and the child seat in mind, making sure they work together to ensure chil-dren have the safest possible journey when travelling in a Volvo car. We have a long tradition of caring for the smallest members of the family: in 1978, we invented the world’s first booster cush-ion for children. This continued in 2016 with the launch of three new child seats with a focus on design, comfort and convenience.
We plan to achieve this vision by drawing on our world-leading expertise and through continuous innovations within vehicle safety.
OUR OMTANKE
no one should be seriously injured or killed in a new
volvo car by 2020
PRODUCTS
VOLVO CAR GROUP | ANNUAL REPORT 2016 33ANNUAL REPORT 2016 | VOLVO CAR GROUP

PRODUCTS
34 VOLVO CAR GROUP | ANNUAL REPORT 2016
CO2 g/km
150
100
50
013 14 1512 16
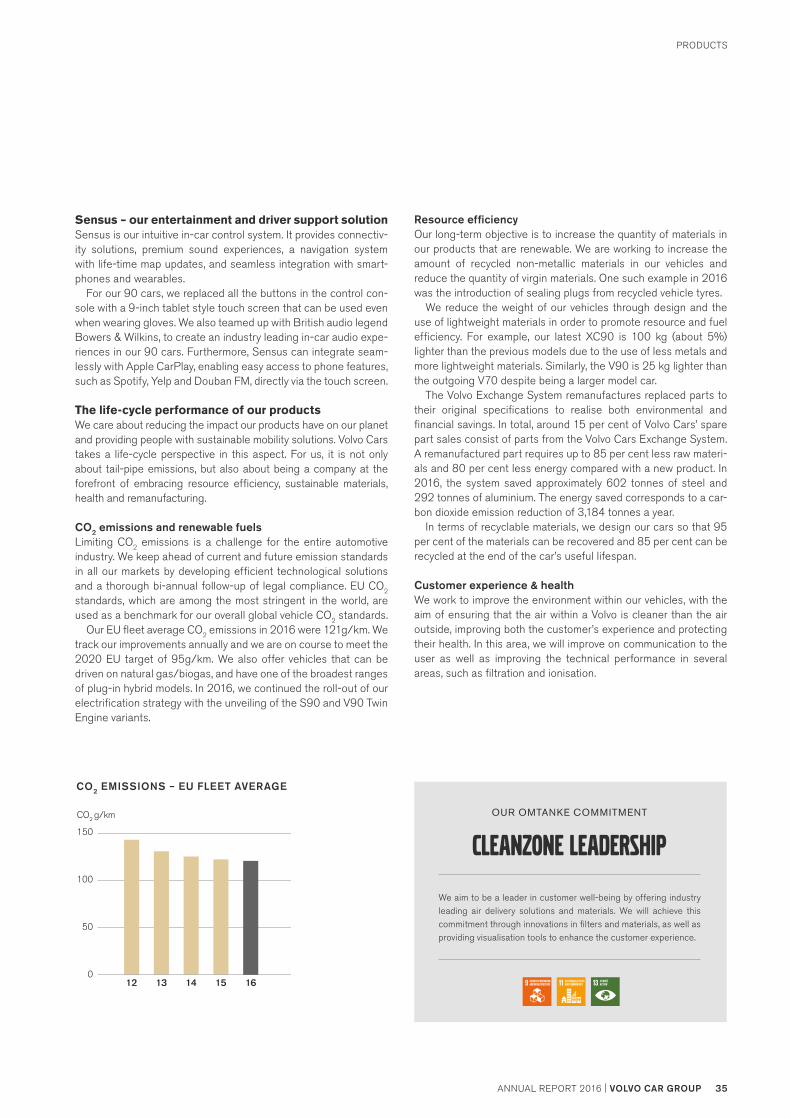
CO2 EMISSIONS – EU FLEET AVERAGE
Sensus – our entertainment and driver support solution Sensus is our intuitive in-car control system. It provides connectiv-ity solutions, premium sound experiences, a navigation system with life-time map updates, and seamless integration with smart-phones and wearables.
For our 90 cars, we replaced all the buttons in the control con-sole with a 9-inch tablet style touch screen that can be used even when wearing gloves. We also teamed up with British audio legend Bowers & Wilkins, to create an industry leading in-car audio expe-riences in our 90 cars. Furthermore, Sensus can integrate seam-lessly with Apple CarPlay, enabling easy access to phone features, such as Spotify, Yelp and Douban FM, directly via the touch screen.
The life-cycle performance of our productsWe care about reducing the impact our products have on our planet and providing people with sustainable mobility solutions. Volvo Cars takes a life-cycle perspective in this aspect. For us, it is not only about tail-pipe emissions, but also about being a company at the forefront of embracing resource efficiency, sustainable materials, health and remanufacturing.
CO2 emissions and renewable fuelsLimiting CO2 emissions is a challenge for the entire automotive industry. We keep ahead of current and future emission standards in all our markets by developing efficient technological solutions and a thorough bi-annual follow-up of legal compliance. EU CO2 standards, which are among the most stringent in the world, are used as a benchmark for our overall global vehicle CO2 standards.
Our EU fleet average CO2 emissions in 2016 were 121g/km. We track our improvements annually and we are on course to meet the 2020 EU target of 95g/km. We also offer vehicles that can be driven on natural gas/biogas, and have one of the broadest ranges of plug-in hybrid models. In 2016, we continued the roll-out of our electrification strategy with the unveiling of the S90 and V90 Twin Engine variants.
We aim to be a leader in customer well-being by offering industry leading air delivery solutions and materials. We will achieve this commitment through innovations in filters and materials, as well as providing visualisation tools to enhance the customer experience.
OUR OMTANKE COMMITMENT
cleanzone leadership
Resource efficiencyOur long-term objective is to increase the quantity of materials in our products that are renewable. We are working to increase the amount of recycled non-metallic materials in our vehicles and reduce the quantity of virgin materials. One such example in 2016 was the introduction of sealing plugs from recycled vehicle tyres.
We reduce the weight of our vehicles through design and the use of lightweight materials in order to promote resource and fuel efficiency. For example, our latest XC90 is 100 kg (about 5%) lighter than the previous models due to the use of less metals and more lightweight materials. Similarly, the V90 is 25 kg lighter than the outgoing V70 despite being a larger model car.
The Volvo Exchange System remanufactures replaced parts to their original specifications to realise both environmental and financial savings. In total, around 15 per cent of Volvo Cars’ spare part sales consist of parts from the Volvo Cars Exchange System. A remanufactured part requires up to 85 per cent less raw materi-als and 80 per cent less energy compared with a new product. In 2016, the system saved approximately 602 tonnes of steel and 292 tonnes of aluminium. The energy saved corresponds to a car-bon dioxide emission reduction of 3,184 tonnes a year.
In terms of recyclable materials, we design our cars so that 95 per cent of the materials can be recovered and 85 per cent can be recycled at the end of the car’s useful lifespan.
Customer experience & healthWe work to improve the environment within our vehicles, with the aim of ensuring that the air within a Volvo is cleaner than the air outside, improving both the customer’s experience and protecting their health. In this area, we will improve on communication to the user as well as improving the technical performance in several areas, such as filtration and ionisation.
PRODUCTS
VOLVO CAR GROUP | ANNUAL REPORT 2016 35ANNUAL REPORT 2016 | VOLVO CAR GROUP
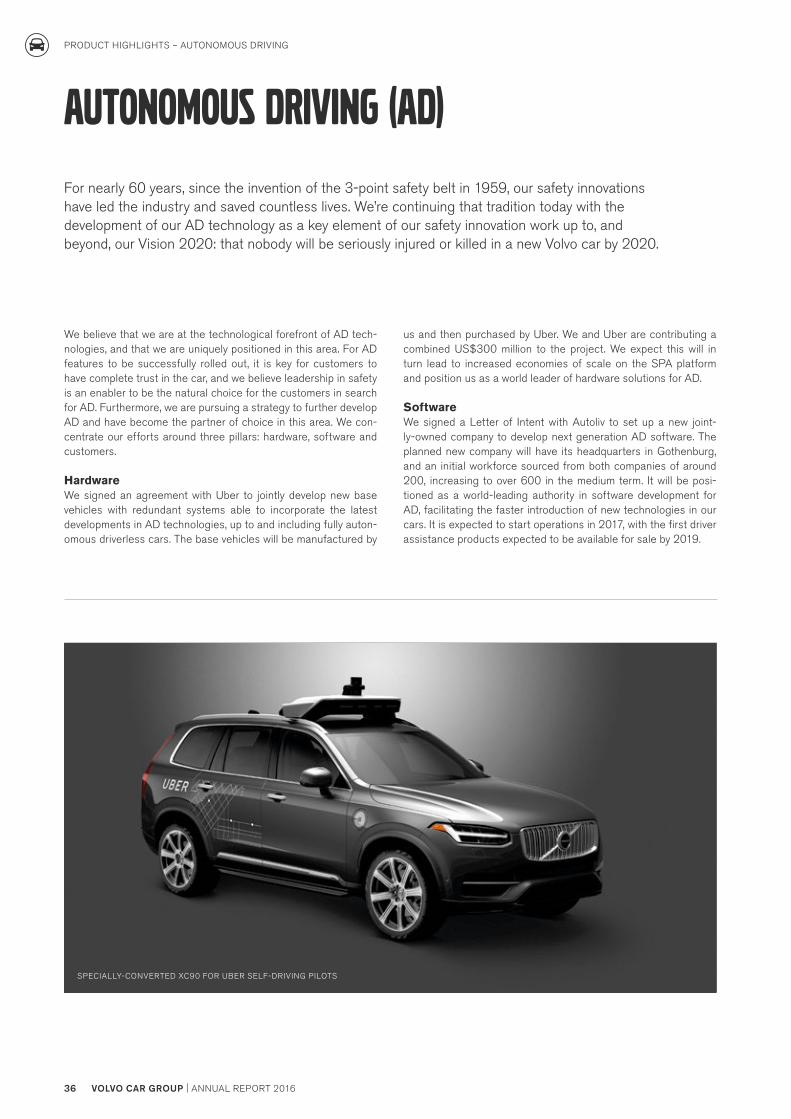
us and then purchased by Uber. We and Uber are contributing a combined US$300 million to the project. We expect this will in turn lead to increased economies of scale on the SPA platform and position us as a world leader of hardware solutions for AD.
SoftwareWe signed a Letter of Intent with Autoliv to set up a new joint-ly-owned company to develop next generation AD software. The planned new company will have its headquarters in Gothenburg, and an initial workforce sourced from both companies of around 200, increasing to over 600 in the medium term. It will be posi-tioned as a world-leading authority in software development for AD, facilitating the faster introduction of new technologies in our cars. It is expected to start operations in 2017, with the first driver assistance products expected to be available for sale by 2019.
We believe that we are at the technological forefront of AD tech-nologies, and that we are uniquely positioned in this area. For AD features to be successfully rolled out, it is key for customers to have complete trust in the car, and we believe leadership in safety is an enabler to be the natural choice for the customers in search for AD. Furthermore, we are pursuing a strategy to further develop AD and have become the partner of choice in this area. We con-centrate our efforts around three pillars: hardware, software and customers.
HardwareWe signed an agreement with Uber to jointly develop new base vehicles with redundant systems able to incorporate the latest developments in AD technologies, up to and including fully auton-omous driverless cars. The base vehicles will be manufactured by
Autonomous driving (AD)
For nearly 60 years, since the invention of the 3-point safety belt in 1959, our safety innovations have led the industry and saved countless lives. We’re continuing that tradition today with the development of our AD technology as a key element of our safety innovation work up to, and beyond, our Vision 2020: that nobody will be seriously injured or killed in a new Volvo car by 2020.
SPECIALLY-CONVERTED XC90 FOR UBER SELF-DRIVING PILOTS
PRODUCT HIGHLIGHTS – AUTONOMOUS DRIVING
36 VOLVO CAR GROUP | ANNUAL REPORT 2016
PILOT ASSIST – STANDARD SEMI-AD FEATURE ON OUR 90 CARS
The system supports the driver through taking some con-trol of steering, distance, and speed in situations ranging from slow moving traffic jams to free flowing long distance driving on motorways in speeds up to 130 km/h. However, the driver is expected to actively participate in the driving and remain responsible for all operation of the vehicle and the monitoring of the road environment.
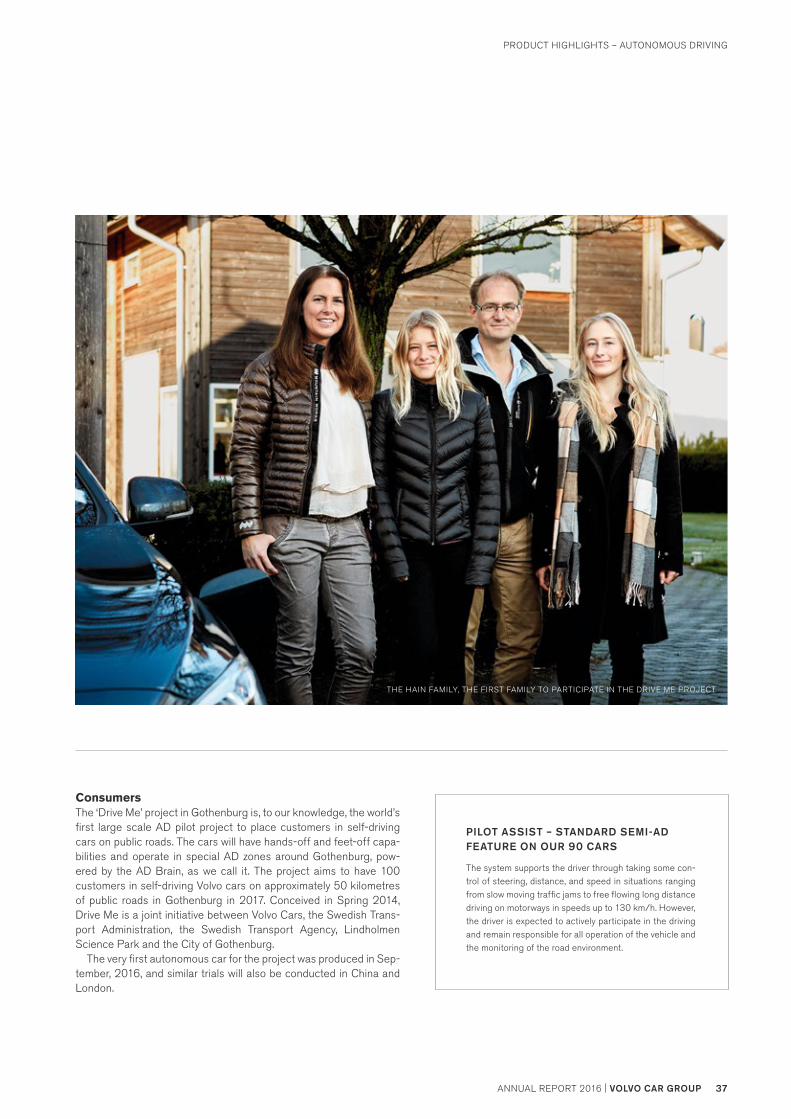
ConsumersThe ‘Drive Me’ project in Gothenburg is, to our knowledge, the world’s first large scale AD pilot project to place customers in self-driving cars on public roads. The cars will have hands-off and feet-off capa-bilities and operate in special AD zones around Gothenburg, pow-ered by the AD Brain, as we call it. The project aims to have 100 customers in self-driving Volvo cars on approximately 50 kilometres of public roads in Gothenburg in 2017. Conceived in Spring 2014, Drive Me is a joint initiative between Volvo Cars, the Swedish Trans-port Administration, the Swedish Transport Agency, Lindholmen Science Park and the City of Gothenburg.
The very first autonomous car for the project was produced in Sep-tember, 2016, and similar trials will also be conducted in China and London.
THE HAIN FAMILY, THE FIRST FAMILY TO PARTICIPATE IN THE DRIVE ME PROJECT
PRODUCT HIGHLIGHTS – AUTONOMOUS DRIVING
VOLVO CAR GROUP | ANNUAL REPORT 2016 37ANNUAL REPORT 2016 | VOLVO CAR GROUP
Volvo Cars is well-positioned to lead electrification in the auto-motive industry. As one of the largest manufacturers of plug-in hybrid electric cars in Europe, we are committed to meeting the European Union fleet emissions targets. We believe that our strategy of focusing on 3- and 4-cylinder powertrains – which were prepared for electrification – and SPA and CMA, supporting both plug-in and pure electric powertrain configurations, will ensure that we keep ahead of emissions regulations while meet-ing changing consumer demands.
Our electrification strategy In October 2015, we launched our comprehensive Electrification Strategy. The focus point of this strategy is the introduction of plug-in hybrid variants across the entire range of SPA- and CMA-based cars. The first car launched as part of this strategy is the top-of-the-range XC90 T8 Twin Engine variants, and a fully elec-tric car will be launched by 2019.
During 2016, around 16 per cent of all the XC90s sold were the T8 Twin Engine plug-in hybrid.
Actively engaged in standardising electric car chargingWe see that a shift towards fully electric cars is already underway, as battery technology improves. But the charging infrastructure is still limited. We believe that the global automotive industry should strive towards a standardised charging infrastructure for electric cars.
To support this drive, we joined the Charging Interface Initiative (CII), a consortium of stakeholders founded to establish a Com-bined Charging System as the standard for charging battery- powered vehicles. The CII is currently drawing up requirements for the evolution of charging-related standards and certification for use with car makers around the globe.
Well-positioned for electrification
Our aim is to have put up to 1 million electrified vehicles on the road by 2025. This is an accumulated figure for all our plug-in hybrids and battery electric vehicles sold over time. The milestone will be achieved by offering new electric vehicles, a broader plug-in hybrid offer and by promoting market acceptance.
OUR OMTANKE COMMITMENT
1 MILLION ELECTRIFIED VEHICLES SOLD BY 2025
OUR FIRST PROTOTYPE ELECTRIC CARS
Volvo started experimenting with developing electric cars over 40 years ago, and built its first two fully electric prototype cars in 1976. They were also tested in regular traffic in Gothenburg.
They weighed approx. 1,100 kg, of which batteries took up one third. They could last for approx. 2 hours, and reach a top speed of 70km/h.
One of the cars is currently on display at the Volvo Museum in Gothenburg.
PRODUCT HIGHLIGHTS – ELECTRIFICATION
38 VOLVO CAR GROUP | ANNUAL REPORT 2016
XC90 TWIN ENGINE T8 AWD INSCRIPTION
CRYSTAL WHITE PEARL
PRODUCT HIGHLIGHTS – ELECTRIFICATION
VOLVO CAR GROUP | ANNUAL REPORT 2016 39ANNUAL REPORT 2016 | VOLVO CAR GROUP

V90 CROSS COUNTRY PRO
OSMIUM GREY METALLIC
40 VOLVO CAR GROUP | ANNUAL REPORT 2016
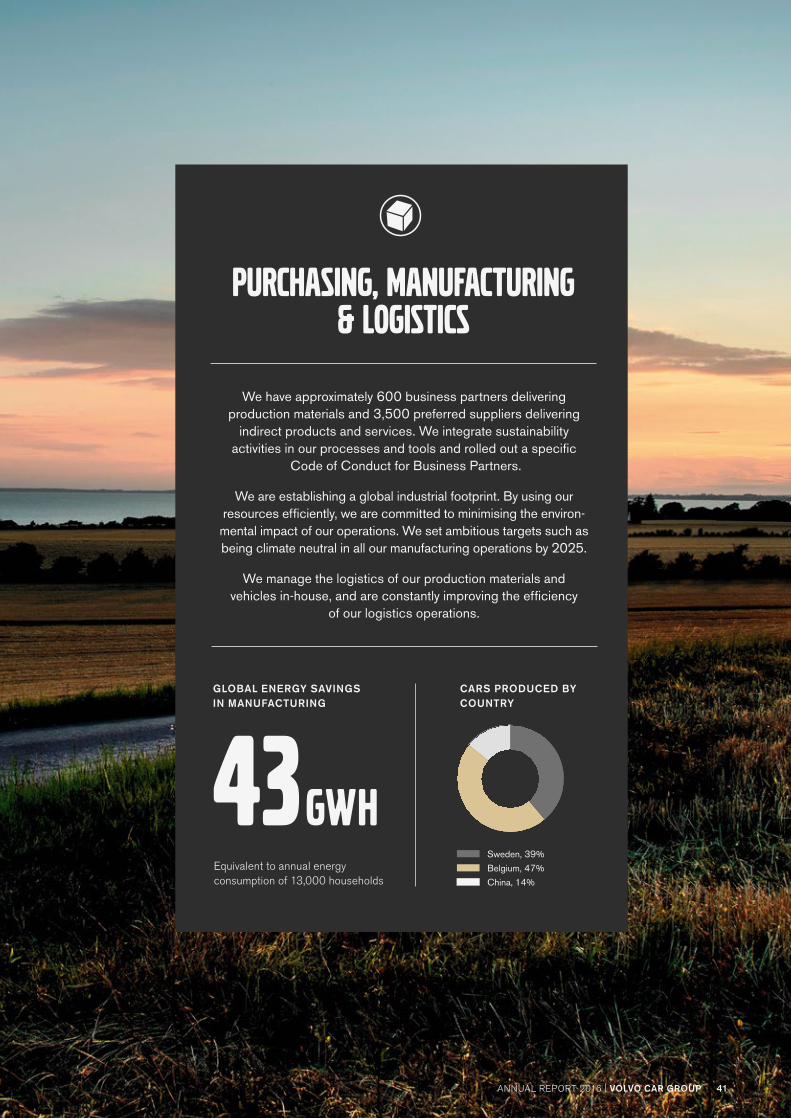
We have approximately 600 business partners delivering production materials and 3,500 preferred suppliers delivering
indirect products and services. We integrate sustainability activities in our processes and tools and rolled out a specific
Code of Conduct for Business Partners.
We are establishing a global industrial footprint. By using our resources efficiently, we are committed to minimising the environ-mental impact of our operations. We set ambitious targets such as being climate neutral in all our manufacturing operations by 2025.
We manage the logistics of our production materials and vehicles in-house, and are constantly improving the efficiency
of our logistics operations.
GLOBAL ENERGY SAVINGS IN MANUFACTURING
CARS PRODUCED BY COUNTRY
China, 14%
Belgium, 47%
Sweden, 39%Equivalent to annual energy consumption of 13,000 households
43GWh
Purchasing, Manufacturing & logistics
41ANNUAL REPORT 2016 | VOLVO CAR GROUPVOLVO CAR GROUP | ANNUAL REPORT 2016
Our global manufacturing footprint requires a globally-integrated supply chain, based on the overall principle ‘build where we sell and source where we build’. This strategy allows for just-in-time delivery, and production flexibility securing responsiveness to meet market and business demands.
Purchasing Our suppliers play a significant role in driving the future growth, innovation, profitability, continuous improvement and improved product sustainability of Volvo Cars. In 2016, we bought goods and services at a total value of approximately SEK150 bn from our sup-pliers, and more than 4,000 preferred suppliers delivered parts and services to us.
SourcingBefore becoming a supplier to Volvo Cars, all suppliers have to go through our supplier assessment programme, which evaluate the technical and development capabilities, as well as the quality standards and daily operations. In line with our sustainability focus, suppliers also need to meet social and environmental standards and are subject to a sustainability review of their supply chain.
Supplier Quality Management (SQM)Quality is one of our Core Values. SQM secures that the supplier base can produce and deliver parts within specification to the required volume. We use the Volvo Quality Excellence Award (VQE) to evaluate the supplier base. The VQE Award is a set of fundamental quality and manufacturing disciplines that ensure a supplier's success. We measure and evaluate our suppliers against the following requirements:
• Capable systems (ISO/TS 16949 and ISO 14001)• Capable manufacturing process • Ongoing performance • Customer Plant Impact
Supply chain management, risk and sustainability The majority of the components used in our vehicles are manufac-tured by third parties. We work together with our supply chain to ensure business continuity and effectiveness, and improve social and environmental performance. The foundation of our purchasing operations strategy is to adapt constantly, incorporating sustaina-bility activities into our day-to-day purchasing processes and tools.
We expect our suppliers to abide by the same or similar princi-ples as those set out in our Code of Conduct (Read more on Page 65), and we verify their compliance through self-assessments and audits. We ask our suppliers to complete sustainability Self- Assessment Questionnaires (SAQs), which cover areas such as
Expanding our industrial capacityWe continue expanding our industrial footprint and capacity around the world.
their social, environmental and sub-supplier responsibilities as well as business ethics. In addition to the SAQ, we also conduct audits. The criteria of our supplier sustainability audit assessment are based on our Working Conditions and Environment Audit Check-list. We cover labour conditions, business ethics, health and safety (including risk management and emergency preparedness), envi-ronmental protection, compliance and management system. In addition, all new suppliers are evaluated in our Supplier Evaluation Model, which covers parameters on a company-wide scope. This is to ensure that all new suppliers meet our standards and demands.
In order to mitigate potential risks that might threaten the overall health of our business, we also established risk management teams to monitor specific areas, such as suppliers’ financial health, suppliers in high-risk countries or regions, environmental and social responsibilities, and the availability and price fluctuations of raw material commodities.
ManufacturingWe aim to establish a balanced commercial and operational pres-ence in all of our three home markets – EMEA, Asia Pacific and the Americas, and continued the expansion of our industrial footprint globally during 2016. Going forward, this structure enables us to more easily leverage our production bases, and flexibly shift our production between domestic manufacturing and exports to respond to different levels of demand.
KEY OPERATIONAL DEVELOPMENT INITIATIVES
Suppliers involved in specification By involving the suppliers in the development of a new Volvo car model in the product specification process, we gather insights from our supplier network and identify the suppliers best positioned to meet our specific requirements.
Volvo Cars Award of Excellence Volvo Cars Award of Excellence is an annual award that acknowledges top-performing suppliers who have gone the extra mile together with us. And winners are announced for the following categories – Environmental and Social Responsibility, Technology, Quality and Cost Competitiveness.
Supply chain financing This program increases transparency and efficiency of the common financial supply chain between the suppliers and Volvo Cars, and has been well-received among our supply base.
PURCHASING, MANUFACTURING & LOGISTICS
42 VOLVO CAR GROUP | ANNUAL REPORT 2016

EMEA – increasing capacity for the SPA carsSwedenOur Torslanda plant received the Swedish Quality Award from the Swedish Institute for Quality (SIQ) in a ceremony attended by the King Carl XVI Gustaf of Sweden. 2016 was also the last produc-tion year for the S80, V70 and XC70. From now on, the plant will only build models based on the SPA platform.
The increasing production volume in the Torslanda plant created more demand on our Body Component plant in Olofström as well as our engine plant in Skövde, which turned 25 years in September.
BelgiumOur Ghent plant continued to produce the classic models such as the XC60, S60, S60 Cross Country, V40 and V40 Cross Country, while preparing for kicking off the production of CMA cars in 2017. As part of the preparation, our Ghent plant started the in-house assembly of instrument panels, aiming to increase the efficiency of the industrialization process. In addition, a hot water pipeline was installed to link the facility with the neighbouring Stora Enso paper mill, reducing the CO2 emissions by 40 per cent.
Asia Pacific (APAC) – expanding industrial footprintChinaMore than 170,000 cars have already been built in our Chengdu plant, since its inauguration in 2013. The plant is currently produc-
ing the S60L and XC60 as well as the S60 Inscription, which is exported to the US. Going forward, the 60 cars on the SPA plat-form will be produced in Chengdu, making it the second SPA plant in the APAC region.
The production of the S90 kicked off in Daqing, our first SPA plant in the region, establishing another milestone of our industrial footprint in China.
Our Zhangjiakou engine plant scaled up and began producing the new generation of Drive-E engines as a fully autonomous plant. We also announced the construction of a new plant to pro-duce 40 series cars in Luqiao.
Americas – investing for the futureWith the establishment of our industrial operations in South Caro-lina US, we are investing to increase our manufacturing capacity in the coming years, and support long-term growth targets. The new plant will start producing the cars based on SPA platforms in late 2018. It will be capable of producing up to 100,000 cars per year, and is expected to employ up to 2,000 people over the next decade. This investment fulfils our ambition of becoming a truly global car maker and also showcases our long-term commitment to the US market.
PRE-PRODUCTION OF THE S90 IN THE DAQING PLANT
PURCHASING, MANUFACTURING & LOGISTICS
VOLVO CAR GROUP | ANNUAL REPORT 2016 43ANNUAL REPORT 2016 | VOLVO CAR GROUP
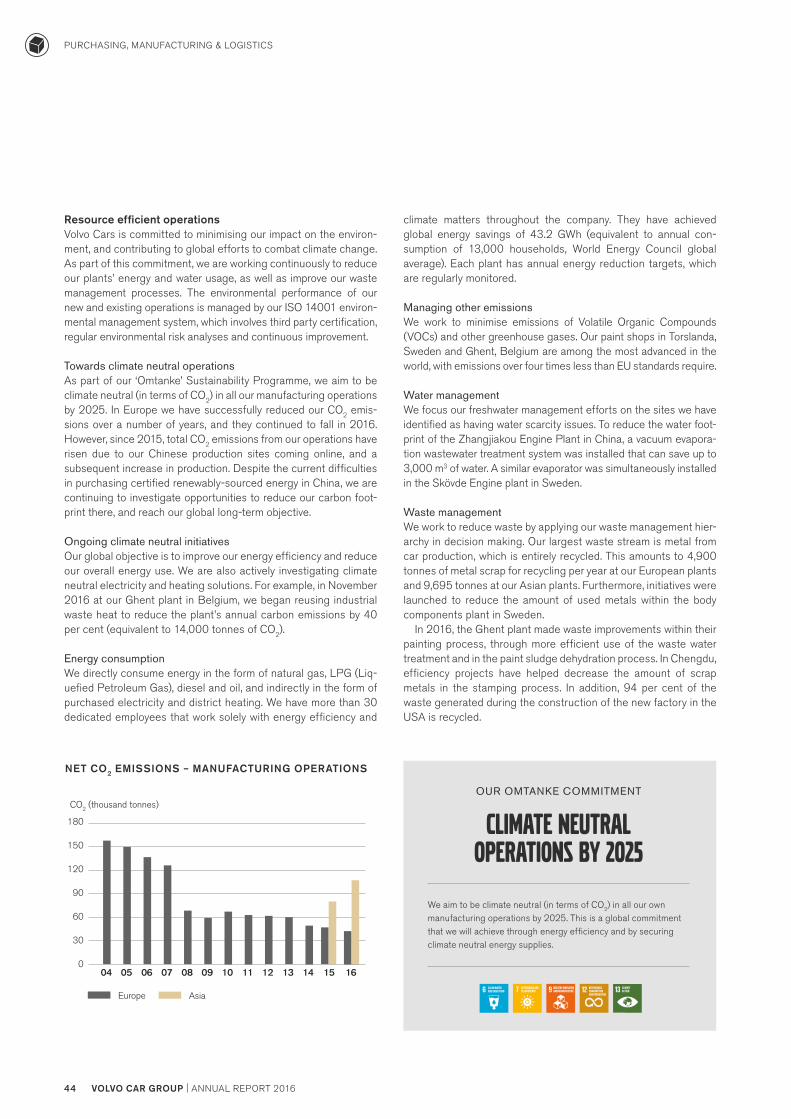
We aim to be climate neutral (in terms of CO2) in all our own manufacturing operations by 2025. This is a global commitment that we will achieve through energy efficiency and by securing climate neutral energy supplies.
OUR OMTANKE COMMITMENT
CLIMATE NEUTRAL OPERATIONS BY 2025
Resource efficient operationsVolvo Cars is committed to minimising our impact on the environ-ment, and contributing to global efforts to combat climate change. As part of this commitment, we are working continuously to reduce our plants’ energy and water usage, as well as improve our waste management processes. The environmental performance of our new and existing operations is managed by our ISO 14001 environ-mental management system, which involves third party certification, regular environmental risk analyses and continuous improvement.
Towards climate neutral operations As part of our ‘Omtanke’ Sustainability Programme, we aim to be climate neutral (in terms of CO2) in all our manufacturing operations by 2025. In Europe we have successfully reduced our CO2 emis-sions over a number of years, and they continued to fall in 2016. However, since 2015, total CO2 emissions from our operations have risen due to our Chinese production sites coming online, and a subsequent increase in production. Despite the current difficulties in purchasing certified renewably-sourced energy in China, we are continuing to investigate opportunities to reduce our carbon foot-print there, and reach our global long-term objective.
Ongoing climate neutral initiativesOur global objective is to improve our energy efficiency and reduce our overall energy use. We are also actively investigating climate neutral electricity and heating solutions. For example, in November 2016 at our Ghent plant in Belgium, we began reusing industrial waste heat to reduce the plant’s annual carbon emissions by 40 per cent (equivalent to 14,000 tonnes of CO2).
Energy consumptionWe directly consume energy in the form of natural gas, LPG (Liq-uefied Petroleum Gas), diesel and oil, and indirectly in the form of purchased electricity and district heating. We have more than 30 dedicated employees that work solely with energy efficiency and
climate matters throughout the company. They have achieved global energy savings of 43.2 GWh (equivalent to annual con-sumption of 13,000 households, World Energy Council global average). Each plant has annual energy reduction targets, which are regularly monitored.
Managing other emissionsWe work to minimise emissions of Volatile Organic Compounds (VOCs) and other greenhouse gases. Our paint shops in Torslanda, Sweden and Ghent, Belgium are among the most advanced in the world, with emissions over four times less than EU standards require.
Water managementWe focus our freshwater management efforts on the sites we have identified as having water scarcity issues. To reduce the water foot-print of the Zhangjiakou Engine Plant in China, a vacuum evapora-tion wastewater treatment system was installed that can save up to 3,000 m3 of water. A similar evaporator was simultaneously installed in the Skövde Engine plant in Sweden.
Waste managementWe work to reduce waste by applying our waste management hier-archy in decision making. Our largest waste stream is metal from car production, which is entirely recycled. This amounts to 4,900 tonnes of metal scrap for recycling per year at our European plants and 9,695 tonnes at our Asian plants. Furthermore, initiatives were launched to reduce the amount of used metals within the body components plant in Sweden.
In 2016, the Ghent plant made waste improvements within their painting process, through more efficient use of the waste water treatment and in the paint sludge dehydration process. In Chengdu, efficiency projects have helped decrease the amount of scrap metals in the stamping process. In addition, 94 per cent of the waste generated during the construction of the new factory in the USA is recycled.
CO2 (thousand tonnes)
180
90
60
30
0
120
150
08 100604 12 1409 110705 13 15 16
AsiaEurope
NET CO2 EMISSIONS – MANUFACTURING OPERATIONS
PURCHASING, MANUFACTURING & LOGISTICS
44 VOLVO CAR GROUP | ANNUAL REPORT 2016
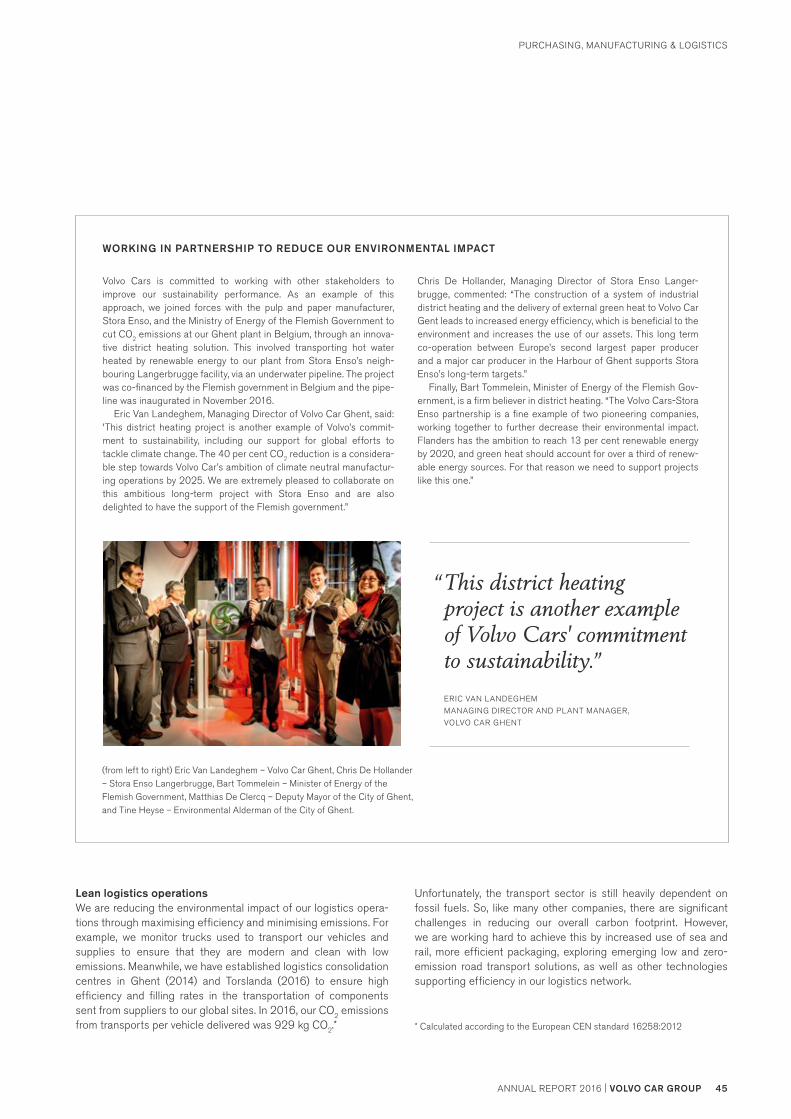
Volvo Cars is committed to working with other stakeholders to improve our sustainability performance. As an example of this approach, we joined forces with the pulp and paper manufacturer, Stora Enso, and the Ministry of Energy of the Flemish Government to cut CO2 emissions at our Ghent plant in Belgium, through an innova-tive district heating solution. This involved transporting hot water heated by renewable energy to our plant from Stora Enso’s neigh-bouring Langerbrugge facility, via an underwater pipeline. The project was co-financed by the Flemish government in Belgium and the pipe-line was inaugurated in November 2016.
Eric Van Landeghem, Managing Director of Volvo Car Ghent, said: 'This district heating project is another example of Volvo’s commit-ment to sustainability, including our support for global efforts to tackle climate change. The 40 per cent CO2 reduction is a considera-ble step towards Volvo Car’s ambition of climate neutral manufactur-ing operations by 2025. We are extremely pleased to collaborate on this ambitious long-term project with Stora Enso and are also delighted to have the support of the Flemish government.”
Chris De Hollander, Managing Director of Stora Enso Langer-brugge, commented: “The construction of a system of industrial district heating and the delivery of external green heat to Volvo Car Gent leads to increased energy efficiency, which is beneficial to the environment and increases the use of our assets. This long term co-operation between Europe’s second largest paper producer and a major car producer in the Harbour of Ghent supports Stora Enso’s long-term targets.”
Finally, Bart Tommelein, Minister of Energy of the Flemish Gov-ernment, is a firm believer in district heating. “The Volvo Cars-Stora Enso partnership is a fine example of two pioneering companies, working together to further decrease their environmental impact. Flanders has the ambition to reach 13 per cent renewable energy by 2020, and green heat should account for over a third of renew-able energy sources. For that reason we need to support projects like this one.”
WORKING IN PARTNERSHIP TO REDUCE OUR ENVIRONMENTAL IMPACT
Lean logistics operationsWe are reducing the environmental impact of our logistics opera-tions through maximising efficiency and minimising emissions. For example, we monitor trucks used to transport our vehicles and supplies to ensure that they are modern and clean with low emissions. Meanwhile, we have established logistics consolidation centres in Ghent (2014) and Torslanda (2016) to ensure high efficiency and filling rates in the transportation of components sent from suppliers to our global sites. In 2016, our CO2 emissions from transports per vehicle delivered was 929 kg CO2.*
Unfortunately, the transport sector is still heavily dependent on fossil fuels. So, like many other companies, there are significant challenges in reducing our overall carbon footprint. However, we are working hard to achieve this by increased use of sea and rail, more efficient packaging, exploring emerging low and zero- emission road transport solutions, as well as other technologies supporting efficiency in our logistics network.
* Calculated according to the European CEN standard 16258:2012
“ This district heating project is another example of Volvo Cars' commitment to sustainability.”
ERIC VAN LANDEGHEM
MANAGING DIRECTOR AND PLANT MANAGER,
VOLVO CAR GHENT
(from left to right) Eric Van Landeghem – Volvo Car Ghent, Chris De Hollander – Stora Enso Langerbrugge, Bart Tommelein – Minister of Energy of the Flemish Government, Matthias De Clercq – Deputy Mayor of the City of Ghent, and Tine Heyse – Environmental Alderman of the City of Ghent.
PURCHASING, MANUFACTURING & LOGISTICS
VOLVO CAR GROUP | ANNUAL REPORT 2016 45ANNUAL REPORT 2016 | VOLVO CAR GROUP

46 VOLVO CAR GROUP | ANNUAL REPORT 2016

We make life easy for our customers, through digital leadership of our website and e-commerce. We are also experimenting with
new retail concepts such as Pop-up Stores.
We market and sell our products and services in a fair and honest manner. We issue Volvo Cars Corporate Marketing Instructions to
provide guidance on the preparation and documentation of our advertising materials, for our sales companies worldwide.
We take good care of our customers, and provide carefree ownership experiences through offering Care by Volvo and personalised technical services. Beyond the new car sales, we also offer a global used car programme – Volvo Selekt.
RECORD SALES SALES BY REGION
US, 15%
Sweden, 13%Other Markets, 16%
China, 17%
Western Europe, 39%
With 534,332 cars sold, 2016 set a new annual sales record
534K
consumer experiences and re-usage
47ANNUAL REPORT 2016 | VOLVO CAR GROUPVOLVO CAR GROUP | ANNUAL REPORT 2016

We constantly review and improve the consumer journey, carefully balancing our brand and business priorities. Our revitalised sales model, testing of innovative ownership solutions and enhanced service offerings, all aim to improve our customers’ ownership experience.
Our revitalised sales modelOur objective is to make life easy for our customers and we are determined to provide the most innovative experiences throughout their journey with Volvo Cars. We will achieve this by advancing on digitisation and experimenting new retail concepts.
Progressive digitisationDigital commerce is one of Volvo Cars’ strategic focus areas. We successfully took the first step in selling 1,927 first-edition XC90s (2014) and Polestar cars online (2015) in selected markets. During 2016, we further expanded our online portfolio to include the XC90 Excellence, global Diplomat Sales and accessory products such as child seats. We also launched an online leasing campaign in Norway, where lease contracts bundled with trouble-free convenience services can be purchased online. This offer will be rolled out globally within the next few years.
New ways to customersWe aim to make the lives of our customers less complicated. We do this by focusing on a seamless consumer journey in both digital and physical channels.
Another key element of the digital experiences with Volvo Cars is the Car Configurator. The tool enables our customers to personal-ise their unique Volvo car online and is an important driver for sales. In 2016, we launched the next-generation Car Configurator in the US. In addition to improved image quality, share functions and simplified user experiences, it also integrates shopping tools. The tool offers leasing and financing calculators, details about service contracts and insurance options, and available inventory at dealers. The new configurator will be available in more than 30 markets in 2017.
Experimenting new retail conceptsInspired by the roadshow concept, we see Popup Stores as an innovative way to increase the brand awareness. We started to showcase our brand in mobile showrooms at recreational, cultural and athletic events around the world, with the goal of attracting more visitors and meeting them outside of the usual showrooms setting. In addition to the exhibition of cars and technology, our pop-up stores were also supplemented with a modern Scandina-vian living room, to anchor the Nordic elements of our brand.
CONSUMER EXPERIENCES AND RE-USAGE
48 VOLVO CAR GROUP | ANNUAL REPORT 2016
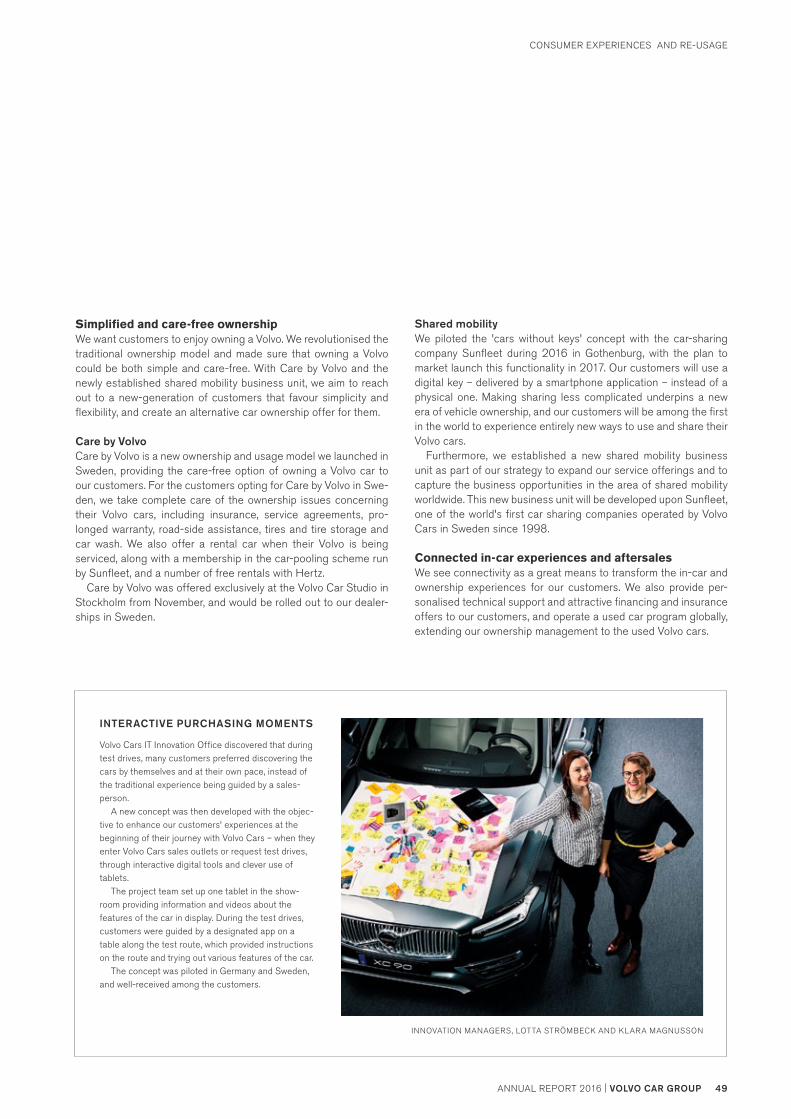
Simplified and care-free ownershipWe want customers to enjoy owning a Volvo. We revolutionised the traditional ownership model and made sure that owning a Volvo could be both simple and care-free. With Care by Volvo and the newly established shared mobility business unit, we aim to reach out to a new-generation of customers that favour simplicity and flexibility, and create an alternative car ownership offer for them.
Care by VolvoCare by Volvo is a new ownership and usage model we launched in Sweden, providing the care-free option of owning a Volvo car to our customers. For the customers opting for Care by Volvo in Swe-den, we take complete care of the ownership issues concerning their Volvo cars, including insurance, service agreements, pro-longed warranty, road-side assistance, tires and tire storage and car wash. We also offer a rental car when their Volvo is being serviced, along with a membership in the car-pooling scheme run by Sunfleet, and a number of free rentals with Hertz.
Care by Volvo was offered exclusively at the Volvo Car Studio in Stockholm from November, and would be rolled out to our dealer-ships in Sweden.
Shared mobilityWe piloted the 'cars without keys' concept with the car-sharing company Sunfleet during 2016 in Gothenburg, with the plan to market launch this functionality in 2017. Our customers will use a digital key – delivered by a smartphone application – instead of a physical one. Making sharing less complicated underpins a new era of vehicle ownership, and our customers will be among the first in the world to experience entirely new ways to use and share their Volvo cars.
Furthermore, we established a new shared mobility business unit as part of our strategy to expand our service offerings and to capture the business opportunities in the area of shared mobility worldwide. This new business unit will be developed upon Sunfleet, one of the world's first car sharing companies operated by Volvo Cars in Sweden since 1998.
Connected in-car experiences and aftersalesWe see connectivity as a great means to transform the in-car and ownership experiences for our customers. We also provide per-sonalised technical support and attractive financing and insurance offers to our customers, and operate a used car program globally, extending our ownership management to the used Volvo cars.
INTERACTIVE PURCHASING MOMENTS
Volvo Cars IT Innovation Office discovered that during test drives, many customers preferred discovering the cars by themselves and at their own pace, instead of the traditional experience being guided by a sales-person.
A new concept was then developed with the objec-tive to enhance our customers' experiences at the beginning of their journey with Volvo Cars – when they enter Volvo Cars sales outlets or request test drives, through interactive digital tools and clever use of tablets.
The project team set up one tablet in the show-room providing information and videos about the features of the car in display. During the test drives, customers were guided by a designated app on a table along the test route, which provided instructions on the route and trying out various features of the car.
The concept was piloted in Germany and Sweden, and well-received among the customers.
INNOVATION MANAGERS, LOTTA STRÖMBECK AND KLARA MAGNUSSON
VOLVO CAR GROUP | ANNUAL REPORT 2016 49ANNUAL REPORT 2016 | VOLVO CAR GROUP
CONSUMER EXPERIENCES AND RE-USAGE
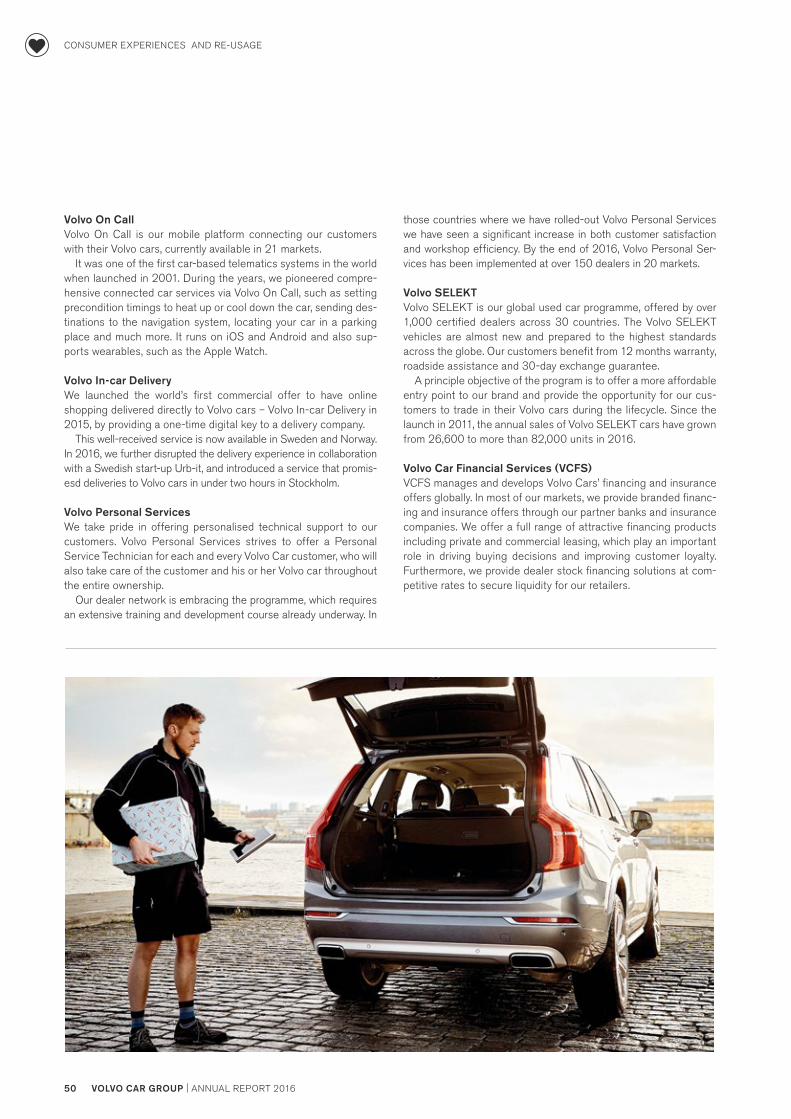
Volvo On CallVolvo On Call is our mobile platform connecting our customers with their Volvo cars, currently available in 21 markets. It was one of the first car-based telematics systems in the world when launched in 2001. During the years, we pioneered compre-hensive connected car services via Volvo On Call, such as setting precondition timings to heat up or cool down the car, sending des-tinations to the navigation system, locating your car in a parking place and much more. It runs on iOS and Android and also sup-ports wearables, such as the Apple Watch.
Volvo In-car DeliveryWe launched the world’s first commercial offer to have online shopping delivered directly to Volvo cars – Volvo In-car Delivery in 2015, by providing a one-time digital key to a delivery company. This well-received service is now available in Sweden and Norway. In 2016, we further disrupted the delivery experience in collaboration with a Swedish start-up Urb-it, and introduced a service that promis-esd deliveries to Volvo cars in under two hours in Stockholm.
Volvo Personal ServicesWe take pride in offering personalised technical support to our customers. Volvo Personal Services strives to offer a Personal Service Technician for each and every Volvo Car customer, who will also take care of the customer and his or her Volvo car throughout the entire ownership.
Our dealer network is embracing the programme, which requires an extensive training and development course already underway. In
those countries where we have rolled-out Volvo Personal Services we have seen a significant increase in both customer satisfaction and workshop efficiency. By the end of 2016, Volvo Personal Ser-vices has been implemented at over 150 dealers in 20 markets.
Volvo SELEKTVolvo SELEKT is our global used car programme, offered by over 1,000 certified dealers across 30 countries. The Volvo SELEKT vehicles are almost new and prepared to the highest standards across the globe. Our customers benefit from 12 months warranty, roadside assistance and 30-day exchange guarantee.
A principle objective of the program is to offer a more affordable entry point to our brand and provide the opportunity for our cus-tomers to trade in their Volvo cars during the lifecycle. Since the launch in 2011, the annual sales of Volvo SELEKT cars have grown from 26,600 to more than 82,000 units in 2016.
Volvo Car Financial Services (VCFS)VCFS manages and develops Volvo Cars’ financing and insurance offers globally. In most of our markets, we provide branded financ-ing and insurance offers through our partner banks and insurance companies. We offer a full range of attractive financing products including private and commercial leasing, which play an important role in driving buying decisions and improving customer loyalty. Furthermore, we provide dealer stock financing solutions at com-petitive rates to secure liquidity for our retailers.
CONSUMER EXPERIENCES AND RE-USAGE
50 VOLVO CAR GROUP | ANNUAL REPORT 2016
CONSUMER EXPERIENCES AND RE-USAGE
VOLVO CAR GROUP | ANNUAL REPORT 2016 51ANNUAL REPORT 2016 | VOLVO CAR GROUP
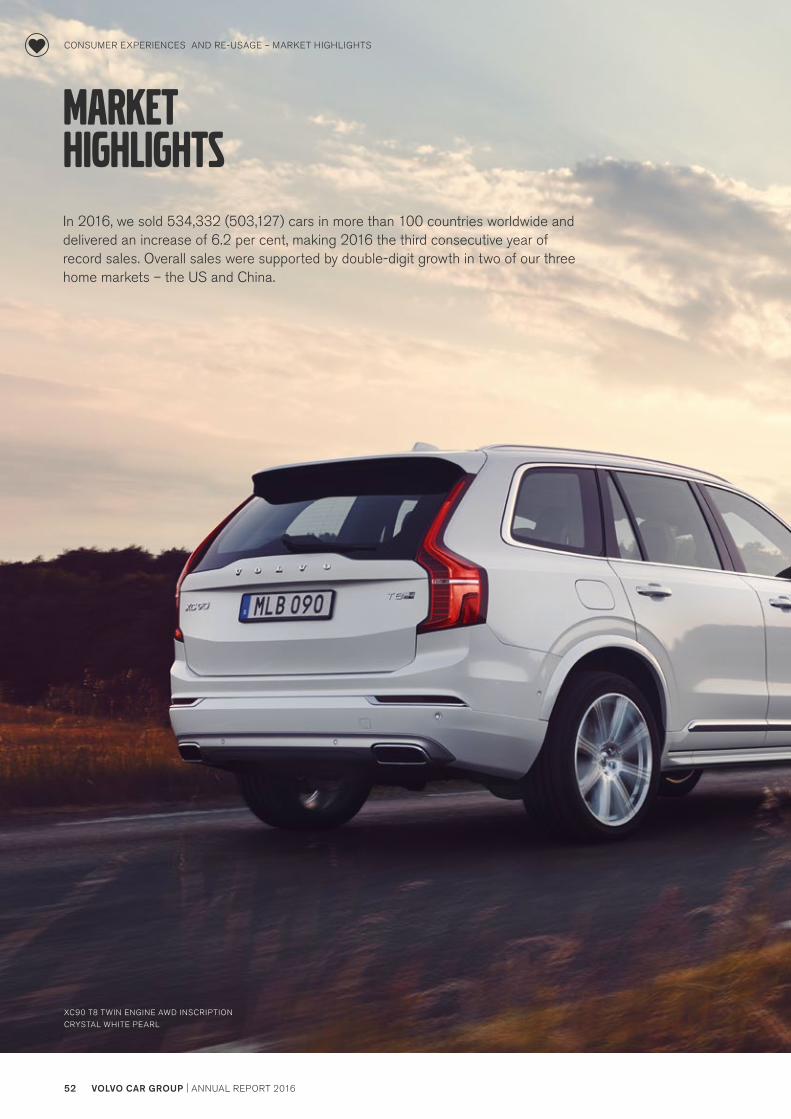
S90
MUSSEL BLUE METALLIC
markethighlightsIn 2016, we sold 534,332 (503,127) cars in more than 100 countries worldwide and delivered an increase of 6.2 per cent, making 2016 the third consecutive year of record sales. Overall sales were supported by double-digit growth in two of our three home markets – the US and China.
XC90 T8 TWIN ENGINE AWD INSCRIPTION
CRYSTAL WHITE PEARL
CONSUMER EXPERIENCES AND RE-USAGE – MARKET HIGHLIGHTS
52 VOLVO CAR GROUP | ANNUAL REPORT 2016

CONSUMER EXPERIENCES AND RE-USAGE – MARKET HIGHLIGHTS
VOLVO CAR GROUP | ANNUAL REPORT 2016 53ANNUAL REPORT 2016 | VOLVO CAR GROUP
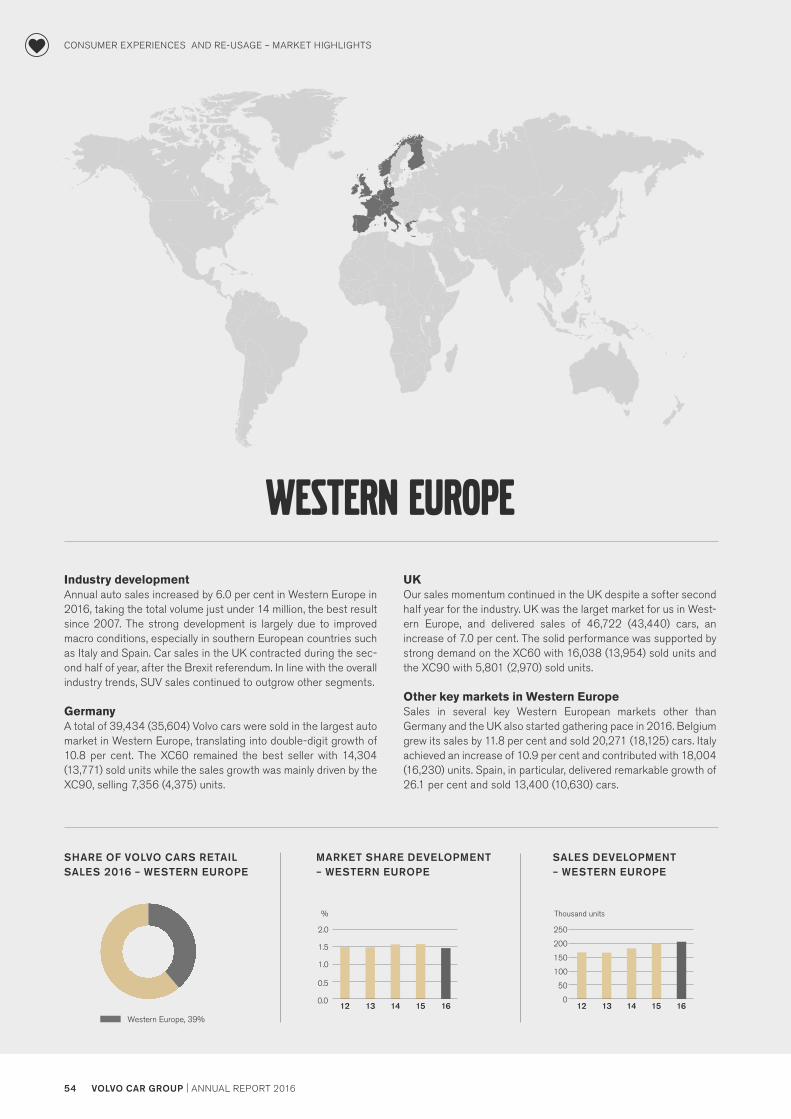
Western Europe
Industry developmentAnnual auto sales increased by 6.0 per cent in Western Europe in 2016, taking the total volume just under 14 million, the best result since 2007. The strong development is largely due to improved macro conditions, especially in southern European countries such as Italy and Spain. Car sales in the UK contracted during the sec-ond half of year, after the Brexit referendum. In line with the overall industry trends, SUV sales continued to outgrow other segments.
GermanyA total of 39,434 (35,604) Volvo cars were sold in the largest auto market in Western Europe, translating into double-digit growth of 10.8 per cent. The XC60 remained the best seller with 14,304 (13,771) sold units while the sales growth was mainly driven by the XC90, selling 7,356 (4,375) units.
UKOur sales momentum continued in the UK despite a softer second half year for the industry. UK was the larget market for us in West-ern Europe, and delivered sales of 46,722 (43,440) cars, an increase of 7.0 per cent. The solid performance was supported by strong demand on the XC60 with 16,038 (13,954) sold units and the XC90 with 5,801 (2,970) sold units.
Other key markets in Western EuropeSales in several key Western European markets other than Germany and the UK also started gathering pace in 2016. Belgium grew its sales by 11.8 per cent and sold 20,271 (18,125) cars. Italy achieved an increase of 10.9 per cent and contributed with 18,004 (16,230) units. Spain, in particular, delivered remarkable growth of 26.1 per cent and sold 13,400 (10,630) cars.
SHARE OF VOLVO CARS RETAIL SALES 2016 – WESTERN EUROPE
MARKET SHARE DEVELOPMENT – WESTERN EUROPE
SALES DEVELOPMENT – WESTERN EUROPE
0.0
0.5
1.0
1.5
2.0
1615141312
%
MARKET SHARE DEVELOPMENT− WESTERN EUROPE
0
50
100
150
250
200
1615141312
Thousand units
SALES DEVELOPMENT− WESTERN EUROPE
Western Europe, 39%
CONSUMER EXPERIENCES AND RE-USAGE – MARKET HIGHLIGHTS
54 VOLVO CAR GROUP | ANNUAL REPORT 2016
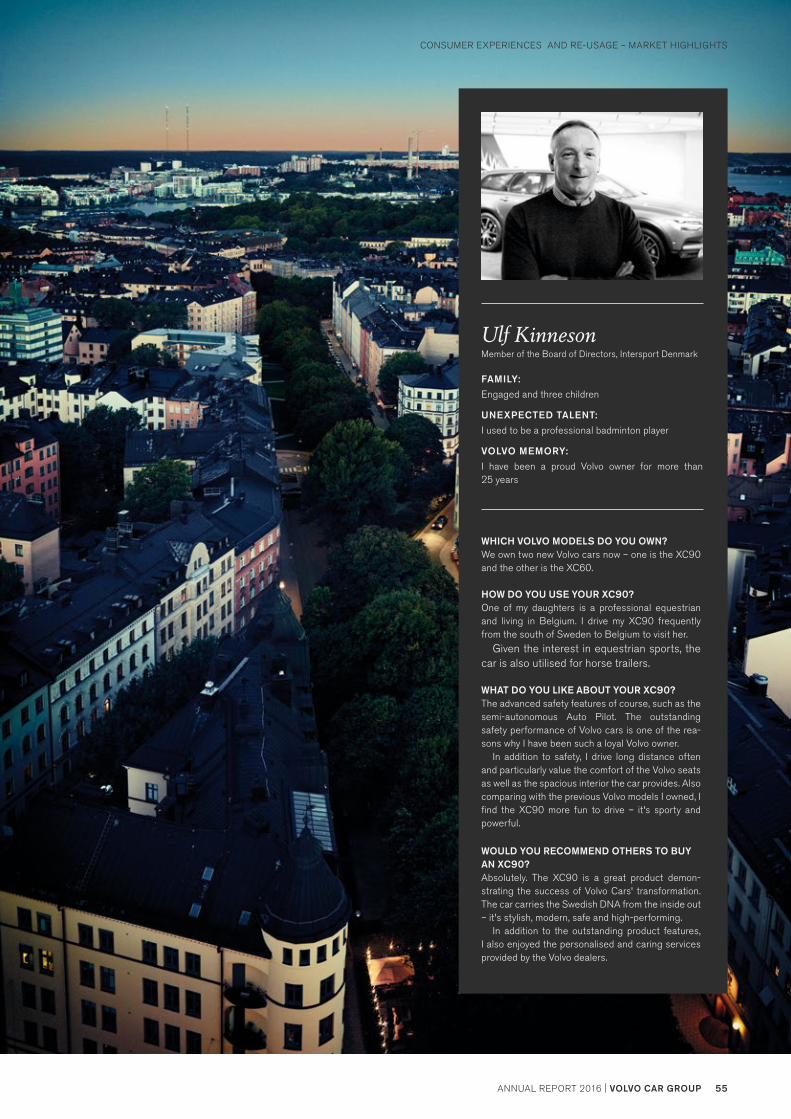
Ulf KinnesonMember of the Board of Directors, Intersport Denmark
FAMILY:
Engaged and three children
UNEXPECTED TALENT:
I used to be a professional badminton player
VOLVO MEMORY:
I have been a proud Volvo owner for more than 25 years
WHICH VOLVO MODELS DO YOU OWN?We own two new Volvo cars now – one is the XC90 and the other is the XC60.
HOW DO YOU USE YOUR XC90?One of my daughters is a professional equestrian and living in Belgium. I drive my XC90 frequently from the south of Sweden to Belgium to visit her.
Given the interest in equestrian sports, the car is also utilised for horse trailers.
WHAT DO YOU LIKE ABOUT YOUR XC90?The advanced safety features of course, such as the semi-autonomous Auto Pilot. The outstanding safety performance of Volvo cars is one of the rea-sons why I have been such a loyal Volvo owner. In addition to safety, I drive long distance often and particularly value the comfort of the Volvo seats as well as the spacious interior the car provides. Also comparing with the previous Volvo models I owned, I find the XC90 more fun to drive – it's sporty and powerful.
WOULD YOU RECOMMEND OTHERS TO BUY AN XC90?Absolutely. The XC90 is a great product demon-strating the success of Volvo Cars' transformation. The car carries the Swedish DNA from the inside out – it's stylish, modern, safe and high-performing. In addition to the outstanding product features, I also enjoyed the personalised and caring services provided by the Volvo dealers.
CONSUMER EXPERIENCES AND RE-USAGE – MARKET HIGHLIGHTS
VOLVO CAR GROUP | ANNUAL REPORT 2016 55ANNUAL REPORT 2016 | VOLVO CAR GROUP
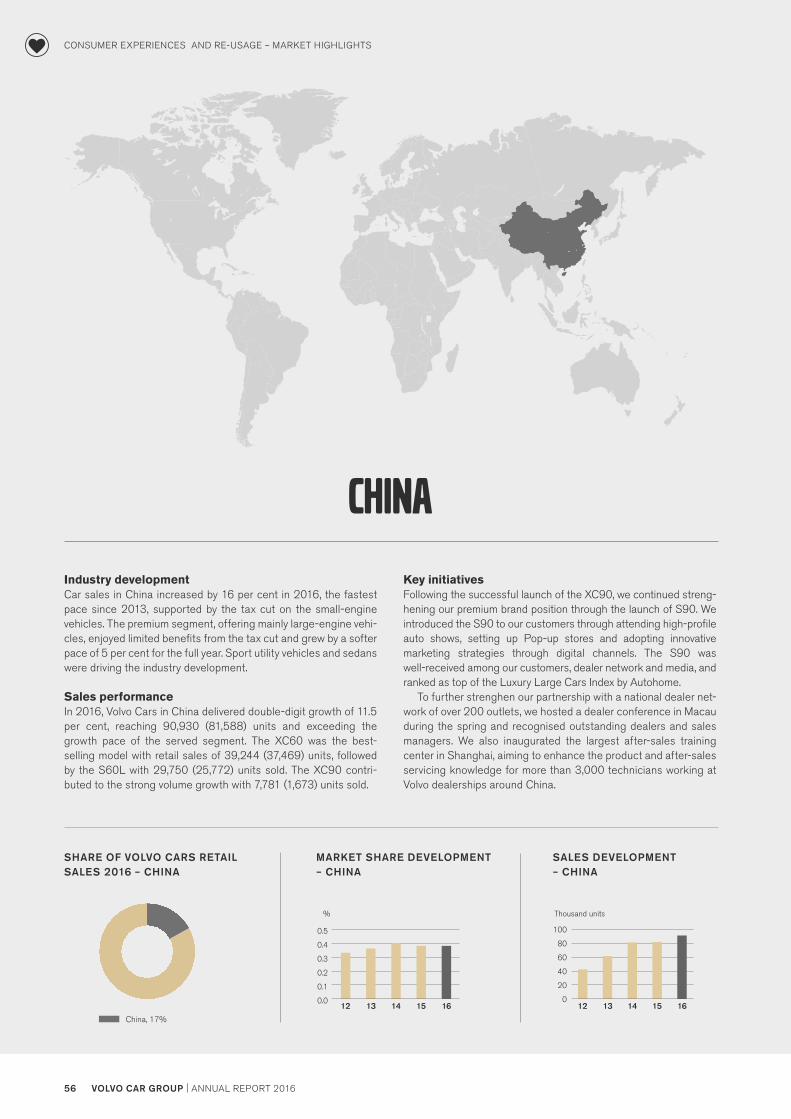
China
Industry developmentCar sales in China increased by 16 per cent in 2016, the fastest pace since 2013, supported by the tax cut on the small-engine vehicles. The premium segment, offering mainly large-engine vehi-cles, enjoyed limited benefits from the tax cut and grew by a softer pace of 5 per cent for the full year. Sport utility vehicles and sedans were driving the industry development.
Sales performanceIn 2016, Volvo Cars in China delivered double-digit growth of 11.5 per cent, reaching 90,930 (81,588) units and exceeding the growth pace of the served segment. The XC60 was the best- selling model with retail sales of 39,244 (37,469) units, followed by the S60L with 29,750 (25,772) units sold. The XC90 contri-buted to the strong volume growth with 7,781 (1,673) units sold.
Key initiativesFollowing the successful launch of the XC90, we continued streng-hening our premium brand position through the launch of S90. We introduced the S90 to our customers through attending high-profile auto shows, setting up Pop-up stores and adopting innovative marketing strategies through digital channels. The S90 was well- received among our customers, dealer network and media, and ranked as top of the Luxury Large Cars Index by Autohome.
To further strenghen our partnership with a national dealer net-work of over 200 outlets, we hosted a dealer conference in Macau during the spring and recognised outstanding dealers and sales managers. We also inaugurated the largest after-sales training center in Shanghai, aiming to enhance the product and after-sales servicing knowledge for more than 3,000 technicians working at Volvo dealerships around China.
SHARE OF VOLVO CARS RETAIL SALES 2016 – CHINA
MARKET SHARE DEVELOPMENT – CHINA
SALES DEVELOPMENT – CHINA
0.0
0.1
0.2
0.3
0.4
0.5
1615141312
%
MARKET SHARE DEVELOPMENT− CHINA
0
20
40
60
80
100
1615141312
Thousand units
SALES DEVELOPMENT− CHINA
China, 17%
CONSUMER EXPERIENCES AND RE-USAGE – MARKET HIGHLIGHTS
56 VOLVO CAR GROUP | ANNUAL REPORT 2016

Dong WeiVice President, Alibaba Mobile Business Group
FAMILY:
I live with my wife, my parents and two sons in Beijing
UNEXPECTED TALENT:
Music – I have lots of contacts with various musicians and producers through work, and am picky about in-car stereo experiences
VOLVO MEMORY:
I bought my first Volvo – a V60, in 2013
HOW DO YOU USE YOUR XC90?I bought the XC90 T6 Inscription in September 2016. During work days, both my driver and myself drive the car. During weekends, I drive the whole family to our villa in the suburbs. Just a few days after buying the car, I, together with my family, drove over 5,000 kms across China from Beijing to Sichuan and back. The trip lasted nearly two weeks but the XC90 made it highly enjoy-able. I was particularly amazed by the great stereo performance and the autopilot features of the XC90.
WHAT DO YOU LIKE ABOUT YOUR XC90?Human-centricity of the product. The smell of the cabin was relatively light for a new car, and my son who suffers from anaphylactic rhinitis could finally enjoy sitting in a car. Auto pilot. In face of an emergency situation, the car reacts gently as if driven by an actual person. It makes excellent judgement of speed limits. Engine. I enjoy driving in a smooth manner, and my XC90 never feels heavy to steer regardless the num-ber of passengers in it. I'm very satisfied with this.
Stereo. I have very high standards when it comes to stereos, and the XC90 is just amazing, especially when it plays guitar or piano tunes.
WOULD YOU RECOMMEND OTHERS TO BUYAN XC90?In fact, three of my friends became XC90 owners fol-lowing my recommendations. For us working in Tech, we look for innovations, human centricity and superb safety performances in our cars. And the Volvo XC90 provides them all.
CONSUMER EXPERIENCES AND RE-USAGE – MARKET HIGHLIGHTS
VOLVO CAR GROUP | ANNUAL REPORT 2016 57ANNUAL REPORT 2016 | VOLVO CAR GROUP

The Us
Industry developmentVehicle sales in the US started showing signs of reaching a growth plateau during 2016 but remained at a historically high level, driven by strong consumer confidence, low oil prices and accessible credit. Segments such as the crossover SUVs and pickups contin-ued to grow.
Sales performanceDuring 2016, Volvo Cars sold 82,726 (70,047) cars and achieved substantial growth of 18.1 per cent in this competitive market, outperforming the industry. This strong performance was largely on the back of the XC90, with 32,527 (12,664) units sold and 39.3 per cent of the total retail volume.
Key initiativesWe increased our marketing spend in the US, which weighted to focus more on strategic regions and in turn increased our share of voice. In particular, we adopted an innovative data-driven media strategy and focused on addressing multiple platforms, including the traditional TV Commercials as well as digital channels. The XC90, the main brand carrier and volume driver in the US, enjoyed popularity among customers as well as industry experts. In 2016, it was awarded several most prestigious auto awards in the US, including North American Truck of the Year. To elevate customer experiences with Volvo Cars, we also started rolling out a three-year training program for all frontline customer facing staff at the dealers (over 3,000).
SHARE OF VOLVO CARS RETAIL SALES 2016 – THE US
MARKET SHARE DEVELOPMENT – THE US
SALES DEVELOPMENT – THE US
0.0
0.1
0.2
0.3
0.4
0.6
1615141312
%
MARKET SHARE DEVELOPMENT− US
0
20
40
60
100
80
1615141312
Thousand units
SALES DEVELOPMENT− US
US, 15%
CONSUMER EXPERIENCES AND RE-USAGE – MARKET HIGHLIGHTS
58 VOLVO CAR GROUP | ANNUAL REPORT 2016
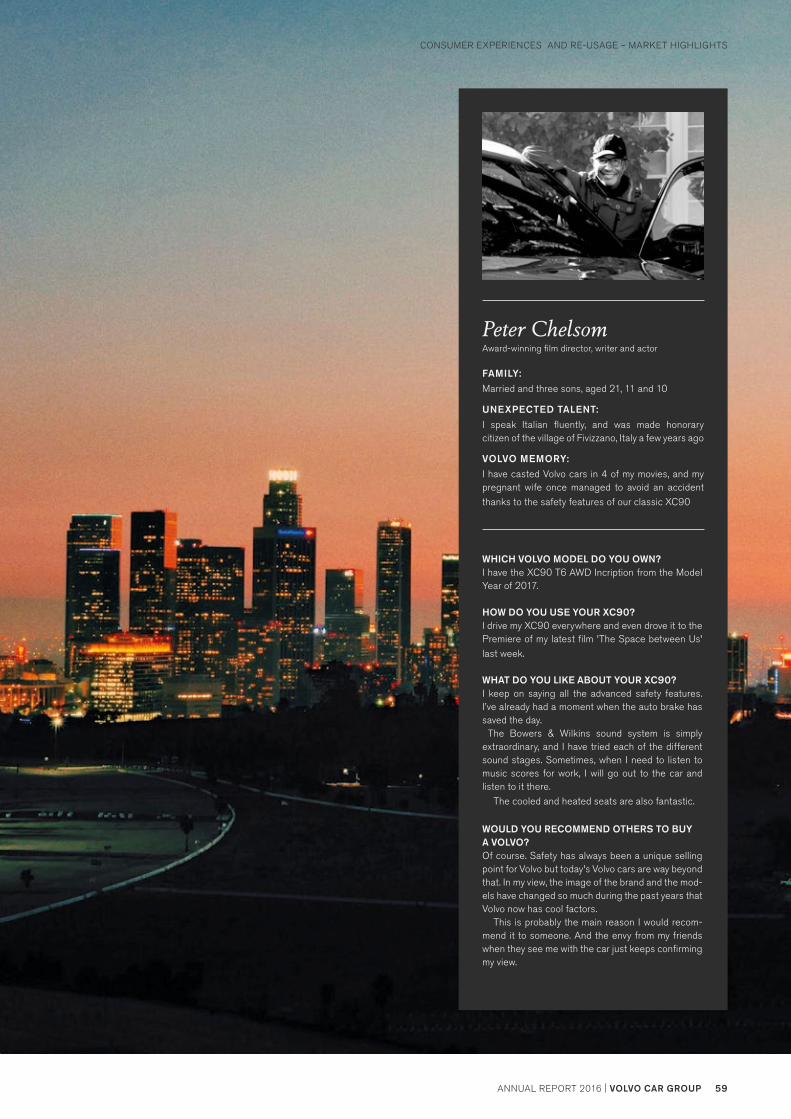
Peter ChelsomAward-winning film director, writer and actor
FAMILY:
Married and three sons, aged 21, 11 and 10
UNEXPECTED TALENT:
I speak Italian fluently, and was made honorary citizen of the village of Fivizzano, Italy a few years ago
VOLVO MEMORY:
I have casted Volvo cars in 4 of my movies, and my pregnant wife once managed to avoid an accident thanks to the safety features of our classic XC90
WHICH VOLVO MODEL DO YOU OWN?I have the XC90 T6 AWD Incription from the Model Year of 2017.
HOW DO YOU USE YOUR XC90?I drive my XC90 everywhere and even drove it to the Premiere of my latest film 'The Space between Us' last week.
WHAT DO YOU LIKE ABOUT YOUR XC90?I keep on saying all the advanced safety features. I’ve already had a moment when the auto brake has saved the day. The Bowers & Wilkins sound system is simply extraordinary, and I have tried each of the different sound stages. Sometimes, when I need to listen to music scores for work, I will go out to the car and listen to it there. The cooled and heated seats are also fantastic.
WOULD YOU RECOMMEND OTHERS TO BUY A VOLVO?Of course. Safety has always been a unique selling point for Volvo but today's Volvo cars are way beyond that. In my view, the image of the brand and the mod-els have changed so much during the past years that Volvo now has cool factors. This is probably the main reason I would recom-mend it to someone. And the envy from my friends when they see me with the car just keeps confirming my view.
CONSUMER EXPERIENCES AND RE-USAGE – MARKET HIGHLIGHTS
VOLVO CAR GROUP | ANNUAL REPORT 2016 59ANNUAL REPORT 2016 | VOLVO CAR GROUP

60 VOLVO CAR GROUP | ANNUAL REPORT 2016

WOMEN IN LEADING POSITIONS
EMPLOYEES BY PRESENCE
China, 14%
Other, 9%
Belgium, 15%
Sweden, 62%
26%
We are committed to having no work-related fatalities or serious injuries involving any of our employees or contractors.
Also, by 2020, we aim to have 35% internationally diverse leaders and 35% female leaders. We will continue to implement our
compliance program and Code of Conduct. We believe these commitments protect our own people, as well as enhance
creativity, innovation, productivity and profitability.
People
61ANNUAL REPORT 2016 | VOLVO CAR GROUPVOLVO CAR GROUP | ANNUAL REPORT 2016
Volvo Cars is a global employer of about 30,000 people. Our global presence and ambitious goals offer great opportunities for talents to grow and thrive. Our People Strategy ensures that we are all provided with development opportunities, that health and safety is promoted, and that diversity is encouraged. This approach supports our objective of being the employer of choice for people who want to make a difference.
The Volvo Cars Culture & Employer of ChoiceThe Volvo Cars Culture embraces everything we do and it starts with our commitment to making a difference in people’s lives. These are our cultural values, which are carried out by our colleagues in their daily work:
• Passion for customers and cars: Being curious and customer oriented in everything we do.
• Move fast and aim high: Seeing and seizing opportunities.• Real challenge and respect: Taking initiative and acting on your
experience.
We attract and retain new employees through our spirit, our prod-ucts and our commitments. We firmly believe in the importance of attracting top talent, supporting us to continuously innovate and develop cutting-edge technologies. Therefore, we have made it a strategic corporate objective to become Employer of Choice.
Volvo Cars is recognised as an attractive employer globally and has been credited with several awards. In 2016, Volvo Cars was recognised as the 47th most attractive employer in the world amongst MSc engineering/IT students (Universum), and as the 2nd in Sweden. Notably, Volvo Cars has also made a strong leap amongst Business Professionals in Sweden, moving from the 43rd (2014) to the 6th place (Universum).
Sustainable work lifeAs a human-centric company, our aim is to offer a safe, motivating and attractive workplace where people are able to grow and con-tribute to the company’s development. Sustainable work life is about addressing the life balance and occupational health for everyone working at Volvo Cars to ensure that we are motivated in our work and can retire with a healthy mind and body.
Passionate about making a differenceWe believe that Volvo Cars’ future success is shaped by our passionate colleagues.
Employee engagementThe Global People Survey (GPS) is a survey measuring the level of employee engagement and all employees are invited to provide their view on the working conditions and team collaboration. In 2016, more than 27,000 employees took part in the survey, and the results showed that our colleagues are engaged and custom-er-oriented, and have good knowledge of the corporate culture and ethical issues.
Bonus scheme for employeesWe highly value the engagement of our employees. In 2011, a bonus scheme for employees was initiated. Upon reaching the tar-gets for 2016, our employees, regardless of location and position, will receive a bonus.
Harassment and discriminationWe have zero tolerance towards employee harassment and dis-crimination as defined in our People Policy. All our plants have designated employees who are trained to provide harassment anddiscrimination support. In 2016, one case of suspected discrimina-tion and 24 cases of harassment were reported globally. All cases were investigated, and proper corrective and supportive actions were taken in all instances.
“ We develop people's strengths and match them to our future challenges. ”HANNA FAGER
SENIOR VICE PRESIDENT, HUMAN RESOURCES
PEOPLE
62 VOLVO CAR GROUP | ANNUAL REPORT 2016VOLVO CAR GROUP | ANNUAL REPORT 2016

VOLVO CAR GROUP | ANNUAL REPORT 2016 63ANNUAL REPORT 2016 | VOLVO CAR GROUP
PEOPLE
VOLVO CAR GROUP | ANNUAL REPORT 2016 63ANNUAL REPORT 2016 | VOLVO CAR GROUP

Serious injuries or fatalities
16
12
8
4
013 14 1512 16
Injuries (LTCR)
0.8
0.6
0.4
0.2
0
FatalitiesSerious injuries
Injuries (LTCR)
%
30
20
15
10
0
25
5
13 14 1512 16
Women in leading positions
Internationally diverse leaders
Health and safetyRegardless of geographic location, health and safety transcends our entire organisation. All our operations, employees and contrac-tors are governed by universal standards. Corporate and divisional health and safety specialists work strategically with health and safety, which is also integrated into our Business Management Systems through the Volvo Cars Work Environment Directive and Work Environment Committee.
In 2016, we implemented the Volvo Cars Health & Safety Global Procedures in our Chinese and US Operations, and introduced the proactive KPIs on risk observation and safe behaviour. Further initiatives include the promotion of our safety culture through Lean Leadership training, the global implementation of our online accident and incident reporting tool, as well as factoring in health and safety considerations in the early phases of car development projects.
Finally, a new global health promotion programme based on our People Strategy was developed in 2016 and is planned to be implemented during 2017.
SICK LEAVE PER AVAILABLE HOURS
% 2010 2011 2012 2013 2014 2015 2016
Sweden 3.7% 3.6% 3.5% 3.6% 4.0% 4.2% 4.2%
Sweden + Belgium 4.5% 4.4% 4.4% 4.5% 4.5% 4.7% 4.8%
Diverse and inclusive cultureWe have a unique and open culture and strive to be a truly global and diverse company by promoting inclusiveness and leading by example. Diversity and inclusion is about attracting and leveraging people with different competencies, backgrounds, culture, gender, experience and personalities. This helps build an innovative, ethical and inclusive global culture and organisation.
FATALITIES AND INJURIES DIVERSITY IN LEADERSHIP POSITIONS
Diversity governanceVolvo Cars People Policy outlines the values and expectations that we have for diversity and equal opportunities and our Global Diver-sity and Inclusion Councils in each function serve as the govern-ance bodies to ensure continuous improvement.
2016 was the start of the Global Diversity & Inclusion plan for 2016 – 2018, which was developed and approved, in close coop-eration with union representatives in all business units. Also in 2016, the Discrimination, Harassment and Bullying (DHB) Directive was reviewed to ensure global applicability.
We are committed to ensuring there are no work-related fatalities or serious injuries involving any of our employees or contractors.We will achieve this commitment by implementing proactive tools and initiatives, and by promoting a greater safety culture.
OUR OMTANKE COMMITMENT
NO FATALITIES OR SERIOUS INJURIES AT VOLVO CARS
GENDER DISTRIBUTION – ALL EMPLOYEES
Men, 74%
Women, 26%
PEOPLE
64 VOLVO CAR GROUP | ANNUAL REPORT 2016

OUR OMTANKE COMMITMENT
35% internationally diverse leaders
35% female leaders by 2020
Promoting inclusiveness, gender balance and international experienceWe work actively in promoting inclusiveness so that everyone working at Volvo Cars is respected for who they are. We are also working to improve our gender balance by attracting new female employees through our career site, targeted job adverts and recruitment events. Internally, we are developing strategic succes-sion planning, female leadership mentoring programmes and strengthening our internal and external communication on diver-sity and inclusion.
We are dedicated to creating a diverse and multi-cultural top management team where international experience brings a global perspective with varied competencies, backgrounds and cultures that are valued in industryleading, innovative and customer focused teams. We encourage diversity and international experience through recruitment, job rotation, exchange programmes and international assignments.
At the end of 2016, about 27 per cent of our top 300 managers are non-Swedish nationals, and 26.2 per cent of our leading positions are held by females. Furthermore, women account for 40 per cent of our Research and Development Management Team.
Fair and equal treatmentAn important aspect of diversity is to ensure fair and equal treat-ment of all employees. We have implemented clear remuneration principles and a structured salary process to ensure fair and equal pay. According to our People Policy, wages and benefits shall always be at least equivalent to legal or industry standards.
Labor rightsOur global expansion with the establishment of new manufactur-ing plants outside Europe means that we are exporting our way of working with labour rights as we ensure that all our plants apply our People Policy.
Freedom of association and collective bargainingOur People Policy and Code of Conduct clearly state that all employees have the right to form or join labour organisations of their choosing and to bargain collectively. Approximately 80 per cent of our workforce is covered by collective labour agreements. For many years, union representatives have been on the Volvo Cars Board of Directors, showing our commitment to our employ-ees and their labour rights. In China, a trade union employee labour dispute mechanism has been introduced to strengthen labour rights within our operations.
Embodying ethics & human rightsEmbodying Ethics & Human Rights is a broad expression of our contribution to society and to responsible business conduct. Our heritage and culture are the foundation for our approach to ethical leadership, care for the environment, fighting corruption, protect-
ing human rights and promoting responsible business conduct throughout the value chain.
We have a Compliance and Ethics programme that manages initiatives and controls to prevent and detect corruption and miti-gate other legal and ethical risks, covering areas such as anti-trust, privacy and export control. The Compliance and Ethics Office pro-vides support and guidance on how to act to ensure compliance with our Code of Conduct and applicable laws when doing busi-ness.
Code of ConductThe Volvo Cars Code of Conduct, which is based on the relevant international conventions and standards, combines our business objectives with ethics, rules and regulations, and governs and guides the actions of all our employees and our business partners. The Code of Conduct is available both on the intranet and publicly at: www.volvocars.com/sustainability
In 2016, we launched a specific Code of Conduct for Business Partners that outlines requirements and guiding principles, in par-ticular with regards to basic working conditions, human rights, car-ing for the environment and business integrity.
Reported Code of Conduct violations in 201652 suspected violations, mainly against our Anti-corruption Policy, were reported to our Compliance & Ethics Office. Following inves-tigations, 19 of these reports were substantiated, and disciplinary actions were taken in 17 cases, including employee dismissals and termination of supplier contracts.
PEOPLE
VOLVO CAR GROUP | ANNUAL REPORT 2016 65ANNUAL REPORT 2016 | VOLVO CAR GROUP

Compliance & Ethics Training Training and internal communications are vital in embedding our ethical business approach. During the past year, the Compliance and Ethics Office and its networks have conducted a number of trainings on topics such as Business Ethics, Information Security, Data Privacy, Export Control, Compeitition Law, People Policy, Anti-corruption & Fraud Prevention and Conflict of Interest.
Our training concept, “Code of Conduct – the way we act”, has been successfully rolled out throughout the organization. This mandatory training has been a part of the induction process for newly hired salaried employees since its introduction in 2014.
A training package for our production employees was launched in 2016. The training provided an introduction to the Code of Con-duct, the Tell Us-Reporting Line, and the responsibilities con-nected to being an employee at Volvo Cars. So far approximately 8,500 production employees in Sweden have been trained. Fur-ther roll-out to our plants in Ghent and Asia Pacific is planned for the beginning of 2017.
Moreover, we deliver targeted training for specific groups at all levels of the company. In 2016, we have conducted training in the areas of (i) Export Control for EMT and relevant management teams and other specific groups within GCE and Business Region EMEA, 71 employees received this training, (ii) Anti-Trust focusing on the rules and regulations connected to the interaction with competitors, 795 employees received the training in 2016 as well as general awareness training conducted at 12 sales companies and regional management teams, (iii) Data Privacy for specific
We are committed to responsible business conduct and fighting corruption wherever we operate through ethical leadership. This involves our leaders setting the standard and being role models for ethical behaviour and professional integrity.
OUR OMTANKE COMMITMENT
Ethical leadership for responsible business
groups mainly within IT operations, including HR, and relevant management teams and (iv) Conflict of Interest where an e-learn-ing was launched during 2016 as mandatory for all non-production employees, and 71.2 per cent has completed the training so far. Ethical Leadership training is included in our internal Leadership programmes. 431 managers received the training in 2016.
PEOPLE
66 VOLVO CAR GROUP | ANNUAL REPORT 2016

EMPLOYEE INTERVIE WS
WHEN DID YOU JOIN VOLVO CARS AND WHY?
I started at Volvo Cars as an intern in June, 2015, and really enjoyed working with my colleagues here. I chose to join Volvo Cars because I wanted to be part of the amazing journey of producing and exporting world-class luxury cars from Daqing.
WHAT DO YOU LIKE THE MOST ABOUT WORKING AT VOLVO CARS?
The highly collaborative working culture and good relationships with my colleagues.
WHAT DO YOU WORK WITH IN OUR DAQING PLANT?
Daqing Plant is currently producing the S90 and I'm working as a Team Leader, Trim, Chassis and Final.
WHICH VOLVO MODEL IS YOUR FAVORITE AND WHY?
The S90, of course! I work with the car every day and witnessed its birth at our plant. I'm very proud of what we have achieved.
Xiaohang ZhuTeam Leader, Volvo Cars Daqing Plant
WHEN DID YOU JOIN VOLVO CARS AND WHY?
I joined Volvo Cars in 1995 because the company had the reputa-tion of being both friendly and innovative.
WHAT DO YOU WORK WITH?
I am a Powertrain Project Leader, leading the development of systems such as engines and gearboxes.
THE POWERPULSE PROJECT LED BY YOU WAS THE WINNER OF THE 2016 VOLVO CARS TECHNOLOGY AWARD – WHAT IS THE TECHNOLOGY ABOUT?
PowerPulse reduces/eliminates turbo delay by dumping com-pressed air from a tank into the exhaust manifold. It spins up the compressor rapidly and generates boost pressure, while a small electric compressor refills the tank.
This patented technology improves take-off acceleration, driva-bility and fuel efficiency.
WHICH VOLVO MODEL IS YOUR FAVORITE AND WHY?
The V90, because of its distinct yet gorgeous design and advanced premium features, such as the HMI and Powertrain.
Martin WedelProject Leader, R&D
PeoPLe
VOLVO CAR GROUP | ANNUAL REPORT 2016 67ANNUAL REPORT 2016 | VOLVO CAR GROUP

68 VOLVO CAR GROUP | ANNUAL REPORT 2016
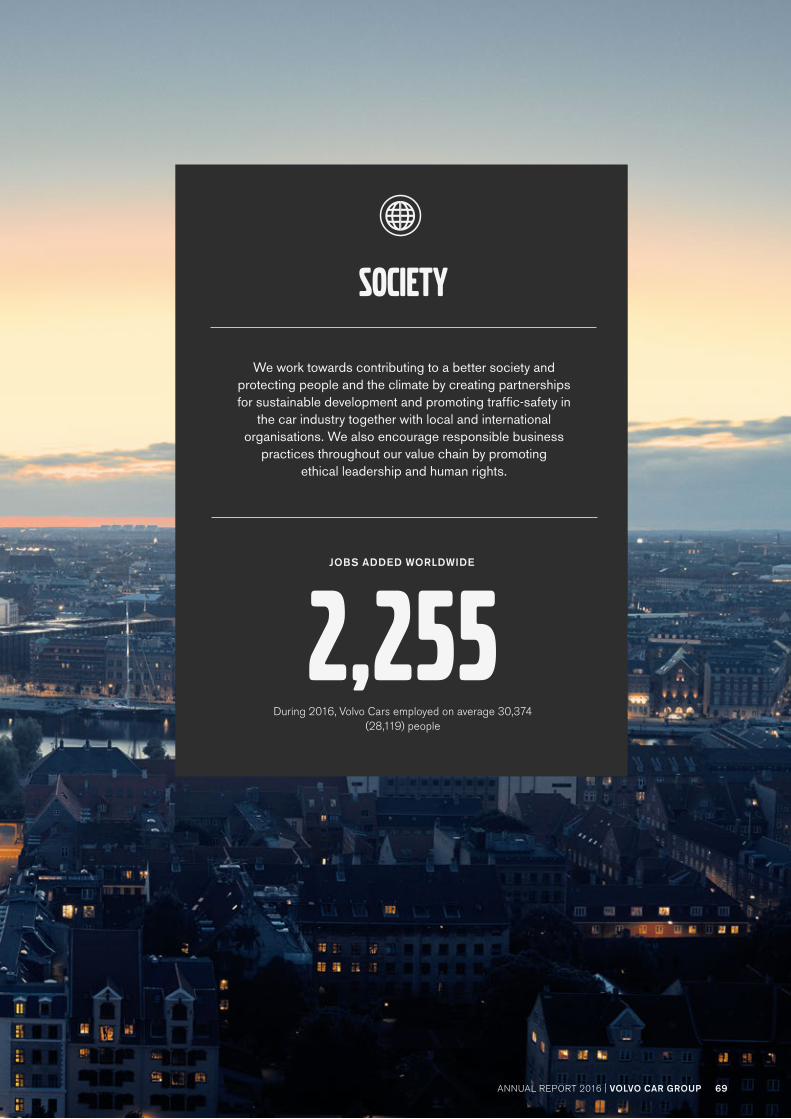
We work towards contributing to a better society and protecting people and the climate by creating partnerships for sustainable development and promoting traffic-safety in
the car industry together with local and international organisations. We also encourage responsible business
practices throughout our value chain by promoting ethical leadership and human rights.
JOBS ADDED WORLDWIDE
During 2016, Volvo Cars employed on average 30,374 (28,119) people
2,255
society
69ANNUAL REPORT 2016 | VOLVO CAR GROUPVOLVO CAR GROUP | ANNUAL REPORT 2016

Our Sustainability Programme, Omtanke, also aims at contributing towards a better and more prosperous society, as well as protect-ing people and our climate by creating partnerships with national and international organisations. This is strengthened through good citizenship projects at a local level.
Focused on our wider impactWe are working to ensure that our company contributes to global and national efforts to improve societal, environmental and economic conditions.
We will continue to cooperate and partner with key organisations on a global or national level with the objective of promoting sus-tainable development.
OUR OMTANKE COMMITMENT
ENGAGE IN CORPORATE PARTNERSHIPS
Maria Hemberg, General Counsel & SVP, Group Legal and Corporate Gov-ernance, speaking at the UN Global Compact Leaders' Summit in New York.
Partner in sustainable developmentWe want to help create a better world, but we are limited in what we can achieve by ourselves. By forming partnerships with global organisations, like the UN, we can increase the impact of our efforts. In 2016, we continued to strengthen our global partnerships.
• UN Global Compact – we are a founding member of the Compact, the UN agency responsible for guiding corporate sustainability. Volvo Cars is an active member of the Global Compact’s Nordic Network.
• Caring for Climate – at the UN Global Compact Leaders’ Summit in New York in June 2016, we announced our support for the UN’s Caring for Climate initiative. Later in the year, we became a sponsoring Friend of Caring for Climate. The initiative aims to mobilise responsible businesses to provide support to global climate change efforts.
• Transparency International – we joined the organisation through their Swedish office in the spring of 2016 following a due diligence exercise. This underlined our zero tolerance for corruption, and will strengthen our understanding of the issue.
SOCIETY
70 VOLVO CAR GROUP | ANNUAL REPORT 2016
GOOD CITIZENSHIP PROJECTS
We support projects, initiatives and events in areas that are related to our operations and vision, and that strengthen the Volvo Cars brand. Projects are managed directly by our businesses in different markets and typi-cally concern education and research, traffic safety and children’s welfare (often in relation to safety and educa-tion issues). Three examples of our projects are:
Volvo Experience Programme (VEP) – a 7-month work experience internship programme open to long-term unemployed people in Sweden between the ages of 18 and 24. So far, nearly 150 young people have participated in the programme.
Mitt Liv mentor programme – is a social enterprise that supports recent immigrants to Sweden by help-ing them to integrate into the local job market. The programme has been active since 2011 and we allocated 10 mentors in 2015.
In 2015, Volvo Cars launched an initiative with the Chinese Office of the UN Decade of Action for Road Safety (CATARC) to raise awareness of child car safety and promote the use of child car seats in China. This Volvo Cars-funded initiative is directed at families with babies and young children aged 0–6 years old, and engages with parents from pregnancy. So far, 6,800 Chinese families have taken part in this initiative.
We will continue to actively cooperate and partner with key organisations and society that help to share our knowledge on traffic safety.
OUR OMTANKE COMMITMENT
KNOWLEDGE SHARING TO IMPROVE TRAFFIC SAFETY
Safer by sharingOur work with traffic safety goes beyond the occupants in our cars and other road users, such as pedestrians and cyclists. It is also about knowledge transfer. We share our real-life safety perspec-tive, our experiences and our unique way of working in partnership with stakeholders. Our approach benefits both international and national authorities as well as the societies that have a need for development in this area.
Building on our long history of close collaboration with the Swedish Transport Administration (Trafikverket), we intensified our work to share our industry-leading traffic safety expertise. Through this collaboration, we have been able to further deepen our engagement with the World Health Organisation (WHO) and their Decade of Action for Road Safety organisation, as well as partici-pate in the recently launched “Vision Zero” ambitions in the US. Additionally, we became a partner company of the OECD's International Transport Forum.
Creating jobs worldwideVolvo Cars launched a large recruitment drive of 400 engineers primarily in the area of software development, for our R&D func-tions in Gothenburg. To address the increasing production demand, we added 450 agency placements at our assembly plant in Ghent.
In China, we continued to ramp up our local production at both Zhangjiakou and Daqing, which resulted in 1,000 new employ-ees joining Volvo Cars during the year.
In the US, we recruited over 100 new employees to support us establishing our industrial footprint in Charleston.
Furthermore, our expansion of operations is expected to gen-erate even more local jobs, at our joint ventures, our suppliers and other local businesses.
SOCIETY
VOLVO CAR GROUP | ANNUAL REPORT 2016 71ANNUAL REPORT 2016 | VOLVO CAR GROUP
S90
MUSSEL BLUE
72 VOLVO CAR GROUP | ANNUAL REPORT 2016

The Volvo Car GroupVolvo Car AB (publ.), with its registered office in Gothenburg, is majority owned (99%) by Geely Sweden Holdings AB, a subsidiary of Shanghai Geely Zhaoyuan International Investment Co., Ltd., registered in Shanghai, China, with ultimate majority ownership held by Zhejiang Geely Holding Group Co., Ltd, registered in Hangzhou, China.
Volvo Car AB (publ.) holds shares in its subsidiary Volvo Car Corporation and provides the Group with certain financing solu-tions. Volvo Car AB (publ.) indirectly, through Volvo Car Corpora-tion and its subsidiaries, operates in the automotive industry with business relating to the design, development, manufacturing, marketing and sales of cars and thereto related services. Volvo Car Group and its global operations are referred to as “Volvo Cars”.
Volvo Cars sales development During the full year 2016, Volvo Cars sold 534,332 (503,127) cars, an increase of 6.2 per cent, making 2016 the third consecutive year of record sales for Volvo Cars. Overall sales were supported by strong double-digit growth in two of Volvo Cars’ three home markets – the US and China. As part of the planned portfolio renewal, two Volvo models – the V70 and XC70 were discontinued, while two new SPA carlines – the S90/S90L and V90/V90 Cross Country were added to the product lineup and started gradually reaching customers worldwide during the second half of the year.
The XC60 remained the most popular model during the year with 161,092 (159,617) units sold. The second best-selling carline was the V40/V40 Cross Country with sales of 101,380 (106,631) units, followed by the XC90 with 91,522 (40,621) units sold world-wide. The S90/S90L and V90/V90 Cross Country contributed with 7,383 (—) and 7,674 (—) units.
Western Europe For the full year, Western Europe delivered a 4.1 per cent increase in sales and reported retail sales of 206,144 (198,049) units. Key markets, including Germany, UK and Belgium, all delivered solid growth, while sales in Spain were a highlight growing 26.1 per cent and reached 13,400 (10,630) units. The XC60 was the best-selling model with retail sales of 61,148 (56,073), while the XC90 strongly supported the overall solid sales performance with 29,086 (16,615) units sold.
ChinaIn 2016, car sales in China increased by 16.0 per cent, the largest increase since 2013, supported by the tax cut on the small-engine vehicles. The premium segment, offering mainly large engines, enjoyed limited benefits from the tax cut and grew by a softer pace of 5.0 per cent. Both sport utility vehi-cles and sedans were driving the industry development.
For the full year, Volvo Cars in China delivered double-digit growth of 11.5 per cent, reaching 90,930 (81,588) units and exceeding the growth pace of the served segment. The XC60 was the best-selling model with retail sales of 39,244 (37,469) units, followed by the S60L with 29,750 (25,772) units sold. The XC90 contributed to the strong volume growth with 7,781 (1,673) units sold.
SwedenThe Swedish car market delivered record sales in 2016, with an increase of 8.0 per cent. The strong demand on vehicles is explained by the robust economic situation and low inter-est rate.
BOARD OF DIRECTORS REPORT
Key ratios, MSEK Full year 2016 Full year 2015
Full year 20142) Full year 20131) Full year 20121)
Net revenue 180,672 164,043 137,590 122,245 124,547
Operating income, EBIT 11,014 6,620 2,128 1,919 66
Net Income 7,460 4,476 508 960 –542
EBITDA 21,541 16,019 9,491 9,057 8,082
Operating and investing cash flow 6,515 7,234 –4,766 109 –4,929
EBIT margin, % 6.1 4.0 1.5 1.6 0.1
EBITDA margin, % 11.9 9.8 6.9 7.4 6.5
Equity ratio, % 26.8 26.2 27.8 28.1 28.5
Net cash3) –18,873 –7,721 856 2,607 2,240
1) Not restated after the acquisitions of the Chinese industrial entities in 2015.2) The comparative figures for 2014 are restated to include the new Volvo Car Group structure including the acquired Chinese industrial entities.
For further descriptions refer to the Volvo Car Group’s annual report 2015.3) If negative, the performance measure is referred to as net cash and if positive the performance measure is referred to as net debt
73ANNUAL REPORT 2016 | VOLVO CAR GROUP
BOARD OF DIRECTORS REPORT
VOLVO CAR GROUP | ANNUAL REPORT 2016
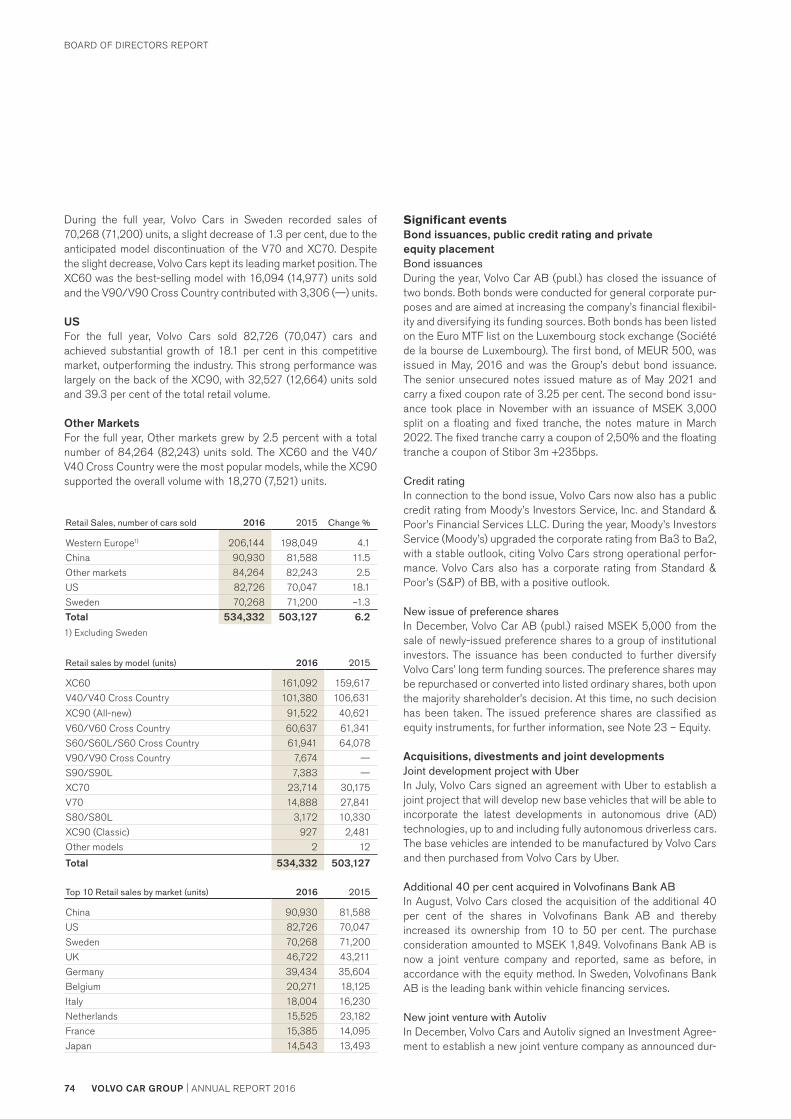
During the full year, Volvo Cars in Sweden recorded sales of 70,268 (71,200) units, a slight decrease of 1.3 per cent, due to the anticipated model discontinuation of the V70 and XC70. Despite the slight decrease, Volvo Cars kept its leading market position. The XC60 was the best-selling model with 16,094 (14,977) units sold and the V90/V90 Cross Country contributed with 3,306 (—) units.
USFor the full year, Volvo Cars sold 82,726 (70,047) cars and achieved substantial growth of 18.1 per cent in this competitive market, outperforming the industry. This strong performance was largely on the back of the XC90, with 32,527 (12,664) units sold and 39.3 per cent of the total retail volume.
Other MarketsFor the full year, Other markets grew by 2.5 percent with a total number of 84,264 (82,243) units sold. The XC60 and the V40/V40 Cross Country were the most popular models, while the XC90 supported the overall volume with 18,270 (7,521) units.
Retail Sales, number of cars sold 2016 2015 Change %
Western Europe1) 206,144 198,049 4.1
China 90,930 81,588 11.5
Other markets 84,264 82,243 2.5
US 82,726 70,047 18.1
Sweden 70,268 71,200 –1.3
Total 534,332 503,127 6.2
1) Excluding Sweden
Retail sales by model (units) 2016 2015
XC60 161,092 159,617
V40/V40 Cross Country 101,380 106,631
XC90 (All-new) 91,522 40,621
V60/V60 Cross Country 60,637 61,341
S60/S60L/S60 Cross Country 61,941 64,078
V90/V90 Cross Country 7,674 —
S90/S90L 7,383 —
XC70 23,714 30,175
V70 14,888 27,841
S80/S80L 3,172 10,330
XC90 (Classic) 927 2,481
Other models 2 12
Total 534,332 503,127
Top 10 Retail sales by market (units) 2016 2015
China 90,930 81,588
US 82,726 70,047
Sweden 70,268 71,200
UK 46,722 43,211
Germany 39,434 35,604
Belgium 20,271 18,125
Italy 18,004 16,230
Netherlands 15,525 23,182
France 15,385 14,095
Japan 14,543 13,493
Significant eventsBond issuances, public credit rating and private equity placementBond issuancesDuring the year, Volvo Car AB (publ.) has closed the issuance of two bonds. Both bonds were conducted for general corporate pur-poses and are aimed at increasing the company’s financial flexibil-ity and diversifying its funding sources. Both bonds has been listed on the Euro MTF list on the Luxembourg stock exchange (Société de la bourse de Luxembourg). The first bond, of MEUR 500, was issued in May, 2016 and was the Group’s debut bond issuance. The senior unsecured notes issued mature as of May 2021 and carry a fixed coupon rate of 3.25 per cent. The second bond issu-ance took place in November with an issuance of MSEK 3,000 split on a floating and fixed tranche, the notes mature in March 2022. The fixed tranche carry a coupon of 2,50% and the floating tranche a coupon of Stibor 3m +235bps.
Credit ratingIn connection to the bond issue, Volvo Cars now also has a public credit rating from Moody’s Investors Service, Inc. and Standard & Poor’s Financial Services LLC. During the year, Moody’s Investors Service (Moody’s) upgraded the corporate rating from Ba3 to Ba2, with a stable outlook, citing Volvo Cars strong operational perfor-mance. Volvo Cars also has a corporate rating from Standard & Poor’s (S&P) of BB, with a positive outlook.
New issue of preference sharesIn December, Volvo Car AB (publ.) raised MSEK 5,000 from the sale of newly-issued preference shares to a group of institutional investors. The issuance has been conducted to further diversify Volvo Cars’ long term funding sources. The preference shares may be repurchased or converted into listed ordinary shares, both upon the majority shareholder’s decision. At this time, no such decision has been taken. The issued preference shares are classified as equity instruments, for further information, see Note 23 – Equity.
Acquisitions, divestments and joint developmentsJoint development project with UberIn July, Volvo Cars signed an agreement with Uber to establish a joint project that will develop new base vehicles that will be able to incorporate the latest developments in autonomous drive (AD) technologies, up to and including fully autonomous driverless cars. The base vehicles are intended to be manufactured by Volvo Cars and then purchased from Volvo Cars by Uber.
Additional 40 per cent acquired in Volvofinans Bank ABIn August, Volvo Cars closed the acquisition of the additional 40 per cent of the shares in Volvofinans Bank AB and thereby increased its ownership from 10 to 50 per cent. The purchase consideration amounted to MSEK 1,849. Volvofinans Bank AB is now a joint venture company and reported, same as before, in accordance with the equity method. In Sweden, Volvofinans Bank AB is the leading bank within vehicle financing services.
New joint venture with AutolivIn December, Volvo Cars and Autoliv signed an Investment Agree-ment to establish a new joint venture company as announced dur-
74 VOLVO CAR GROUP | ANNUAL REPORT 2016
BOARD OF DIRECTORS REPORT

ing the autumn 2016. The joint venture company is named Zenuity AB and will develop software for autonomous driving and driver assistance systems. Operations are expected to start after obtain-ing approvals from relevant competition authorities.
Acquisition of First Rent A Car ABIn December, Volvo Cars called an option to acquire the remaining 55 per cent of the shares in First Rent A Car AB. First Rent A CarGroup, with its subsidiaries, operates within car rentals under the Hertz brand, car sharing under the Sunfleet brand, fleet manage-ment services. It is also a 50 per cent owner of the Swedish dealer group Bra Bil. The finalisation of the transaction is pending upon final approvals from relevant authorities, which are expected to be received during the first quarter 2017. During the period from sign-ing to approval from authorities, First Rent A Car Group will con-duct as previously. For further information regarding the acquisi-tion, see Note 31 – Business combinations.
Changes in Board of Directors and the Executive Management TeamNew Board member appointed As of January 1, 2016, Betsy Atkins has been appointed new member of the Board of Directors of Volvo Car AB (publ.). Ms. Atkins joined the board from Silicon Valley where she has been a leading entrepreneur building global technology companies in Internet Infra-structure, Big Data Analytics, Mobile Enablement and E-commerce.
New appointments to the Executive Management TeamDuring the year the following appointments to the Executive Man-agement Team have been made;• Hanna Fager was appointed Senior Vice President Human
Resources, effective October 1, 2016• Henrik Green was appointed Senior Vice President Research &
Development, effective December 7, 2016.• Javier Varela was appointed Senior Vice President Manufactur-
ing, effective November 1, 2016.• Atif Rafiq was appointed Senior Vice President IT and Chief
Digital Officer, effective January 2, 2017.
Other significant events during the yearLaunch and production start of S90 and V90 The S90 premium sedan was launched at the Detroit Motor Show in January. A month later, Volvo launched the V90, a premium large estate. Production started for the two new models during the second quarter in the Torslanda plant, Sweden. This means that all new mod-els in the top-of-the line 90 series, based on Volvo’s in-house devel-oped modular vehicle architecture SPA, are now being produced.
Large recruitment of engineersAt the end of August, Volvo Cars launched a large engineering recruitment drive in Sweden. Volvo Cars plans to recruit around 400 engineers in the next twelve months, primarily in the area of software development. The majority of these new recruits will be based at the R&D headquarters in Gothenburg, Sweden.
The “Drive Me” pilot was kicked offIn September, Volvo Cars built the first XC90 in a series of cars with autonomous drive that will be handed over to families in
Gothenburg to be driven on public roads. The Drive Me pilot project in Gothenburg is the first in a number of planned public trials. The pilot is scheduled to start in 2017.
Significant events after the reporting periodNew appointment to the Executive Management TeamIn January 2017, Xiaolin Yuan was appointed Senior Vice Presi-dent for the Asia Pacific, replacing Lars Danielson who will retire. Mr Yuan brings local knowledge and experience to a role that will be central to Volvo Cars’ continuing global development as he leads the company’s continued growth in this key region.
Research and developmentVolvo Car Group continues to invest steadily in research and devel-opment in order to strengthen the product portfolio to meet cus-tomer demand and stricter legislation. The technical centre for research and development is located in Gothenburg, where about 6,300 people work, most of them qualified engineers. Thanks to world-leading R&D capabilities Volvo Cars has developed its own platform technology and three and four-cylinder engine family.
Volvo Cars is leading in safety and autonomous driving technol-ogy and is introducing several of these safety features as standard in the coming cars as a step towards the vision that no one shall be killed or seriously injured in a new Volvo car by 2020. In co-opera-tion with other companies and institutions Volvo Cars is also devel-oping a new platform for the C-segment, a three-cylinder engine, new connectivity and on-demand solutions.
CooperationsContinuous common development activities with CEVTIn 2014, Volvo Car Corporation entered into an agreement with Ningbo Geely Automotive Research & Development Co., Ltd, a wholly owned subsidiary to Zhejiang Geely Automobile Co., Ltd regarding certain common development activities. Volvo Cars is working closely with CEVT (China – Euro Vehicle Technology AB), which is a Gothenburg-based subsidiary of Ningbo Geely Automo-tive Research & Development Co., Ltd), on projects which include the development of a next-generation C-segment vehicle platform called CMA (Compact Modular Architecture).
EnvironmentVolvo Cars has a longstanding commitment in being a responsible company with a clear focus on sustainable development. This commitment is reflected throughout the Annual Report in line with international reporting guidelines set out in the Global Reporting Initiatives (GRI). All our businesses have permits regu-lating the environmental impact of their operations. Continuous reporting on this impact is undertaken according to guidelines and requirements submitted by local and national environmental authorities.
EmployeesVolvo Car Group employed on average 30,374 (28,119) full time employees in 2016 which is an increase of 2,255 employees com-pared with 2015. The group employed on average 4,190 (3,380) consultants in 2016. The increased number of consultants and employees are mainly related to higher production volumes and the continuing development of future models.
VOLVO CAR GROUP | ANNUAL REPORT 2016 75ANNUAL REPORT 2016 | VOLVO CAR GROUP
BOARD OF DIRECTORS REPORT

Enterprise Risk Management The automotive industry is going through a transformation. The future will bring: new products and services, new types of interac-tions with customers, new co-operations, a complex value chain and significant investments. The transformation will have strategic implications on areas such as: competence, business models, financial models, brand & value and funding.
The current evolvement of the automotive industry offers oppor-tunities and based on their uncertainties and their individual timing a number of risks. The main areas of risk and opportunity identified
are: connectivity, electrification, autonomous drive, shared mobility, new industry entrants and sustainability regulations and policies.
Enterprise risk management is used to help develop and confirm strategies. And to meet objectives through seizing opportunities and mitigating risks. Should a risk materialise, that could not be mitigated, we aim to be well prepared. Through 2016 continuous risk identification and risk mitigation activities have taken place on a short (rolling 12 months), medium (1–5 years) and long (longer than 5 years) term basis.
Risk Risk description Comment
Our future success depends on our continued ability to introduce our next generation of cars.
Our launch plan for the coming years is intense. Our ability to realise expected returns on these investments will depend in large part on our ability to complete our car launch schedule.
In order to meet our sales goals, we have invested heavily in car and powertrain design, engineering and manufacturing. We undertake significant market research and testing prior to developing and launching new cars or upgraded variants of our existing models. Nevertheless, market acceptance of our cars depends on a number of factors, some of which are outside of our control and require us to anticipate con-sumer preferences and competitive products several years in advance.
Privacy concerns are increasing, which may result in new legisla-tion, negative public perception and/or user behaviour that negatively affect our business.
Some of our cars are designed, and most of our future cars will be designed, with built-in data connectivity, such as Apple CarPlay, Android Auto and Volvo on Call. Our collec-tion, use, retention, security and transfer of information of our customers is subject to consumer and data protection laws in the jurisdictions in which we operate. The consumer and data protection laws become more demanding and many requirements are challenging to apply.
Given that this is an evolving and unsettled area of regula-tion, new significant restrictions or technological require-ments could subject us to potential liability or restrict our present business practices, which, in turn, could have an adverse effect on our business, results of operations and financial condition. Compliance with any applicable laws could also delay or impede the development of new prod-ucts, increase our operating costs, or subject us to inquiries or investigations, claims or other remedies, including fines or demands that we modify or cease existing business practices. New procedures and ways of working to meet the evolving legal requirements are gradually put in place.
Interest rate, currency and exchange rate fluctuations could adversely affect our results of operations.
We have both interest-bearing assets (including cash balances) and interest-bearing liabilities, certain of which bear interest at variable rates. We are therefore exposed to changes in interest rates.
Our operations are also subject to fluctuations in exchange rates with reference to countries in which we operate.
Additionally, we generate production costs and cost of raw materials in a variety of currencies, in particular Euros and Chinese renminbi. As a result, we have significant exposure to movements of the Chinese renminbi, US dollar and Euro relative to the Swedish krona.
Management revisit the financial and interest rate arrange-ments in light of changes to the size or nature of our opera-tions and the debt market situation.
We seek to manage our foreign exchange exposure through the use of certain hedging agreements, including options, forwards and other financial instruments. We are, however, exposed to the risk that appropriate hedging lines for the type of risk exposures we are subject to may not be available at a reasonable cost or at all.
Moreover, there are risks associated with the use of such hedging instruments. Whilst mitigating to some degree our exposure to fluctuations in currency exchange rates, we potentially forgo benefits that might result from market fluctuations in currency exposures.
For further information see Note 21 – Financial risks and financial instruments.
New or changing laws, regula-tions and government policies regarding improved fuel econ-omy, reduced greenhouse gas and other emissions, and car safety may have a significant effect on our cost of operations and how we do business.
Our products are subject to comprehensive and constantly changing laws, regulations and policies. In Europe and the United States governmental regulation is primarily driven by concerns about the environment (including greenhouse gas emissions), fuel economy, energy security and car safety.
Evolving regulatory requirements could significantly affect our product development plans, sales and product mix as well as our business and financial result.
To comply with future environmental regulations, our opera-tional and financial plans might be subject to change.
There is a need for resources, current and new, within the auto-motive industry.
A competence expansion is taking place.
Our success depends upon our ability to attract, retain and motivate highly skilled employees, including those with experience in software engineering, to help us adapt to these technological changes. Due to several factors, including the rapid growth of autonomous drive pro-grammes and the increasing number of companies entering the automotive industry, there is large competition for expe-rienced engineers.
We compete intensely with other companies to recruit and hire from this limited pool. If we cannot attract, train and retain qualified personnel, we may be unable to expand our business in line with our strategy, compete for new custom-ers or retain existing customers, which could adversely affect our business, results of operations and financial condition.
VOLVO CAR GROUP | ANNUAL REPORT 201676
BOARD OF DIRECTORS REPORT
VOLVO CAR GROUP | ANNUAL REPORT 2016 77ANNUAL REPORT 2016 | VOLVO CAR GROUP
BOARD OF DIRECTORS REPORT
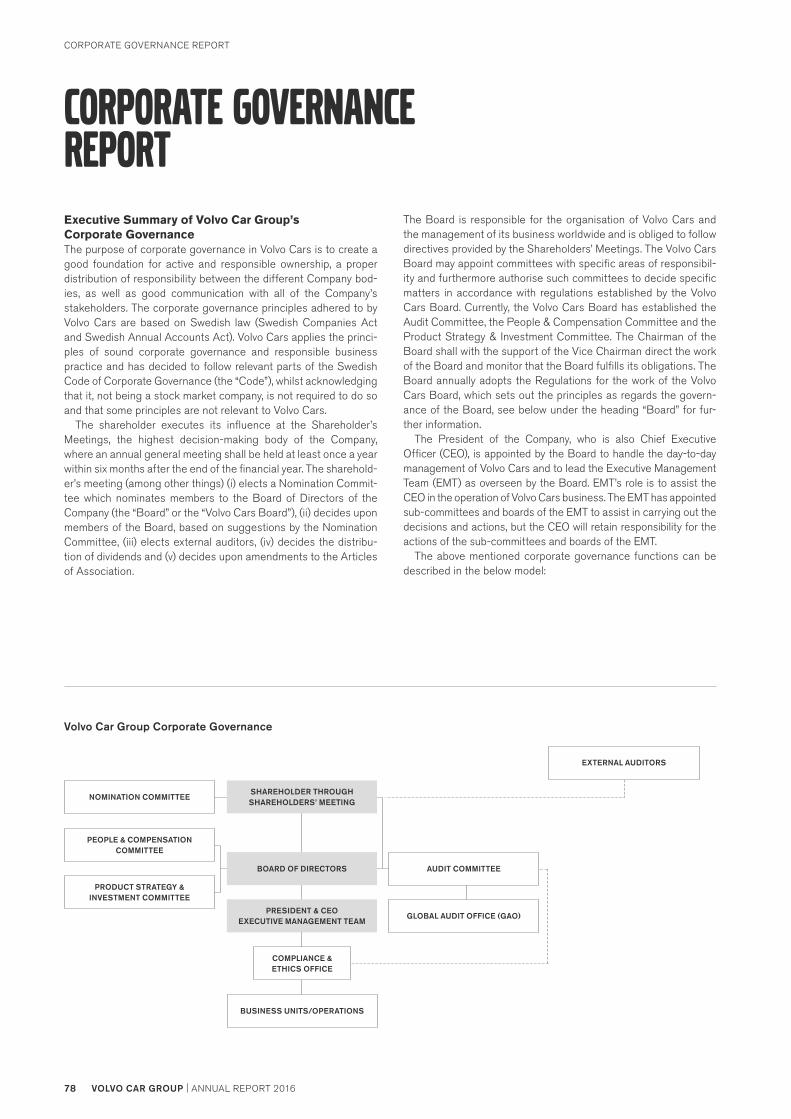
Corporate Governance ReportExecutive Summary of Volvo Car Group’s Corporate Governance The purpose of corporate governance in Volvo Cars is to create a good foundation for active and responsible ownership, a proper distribution of responsibility between the different Company bod-ies, as well as good communication with all of the Company’s stakeholders. The corporate governance principles adhered to by Volvo Cars are based on Swedish law (Swedish Companies Act and Swedish Annual Accounts Act). Volvo Cars applies the princi-ples of sound corporate governance and responsible business practice and has decided to follow relevant parts of the Swedish Code of Corporate Governance (the “Code”), whilst acknowledging that it, not being a stock market company, is not required to do so and that some principles are not relevant to Volvo Cars.
The shareholder executes its influence at the Shareholder’s Meetings, the highest decision-making body of the Company, where an annual general meeting shall be held at least once a year within six months after the end of the financial year. The sharehold-er’s meeting (among other things) (i) elects a Nomination Commit-tee which nominates members to the Board of Directors of the Company (the “Board” or the “Volvo Cars Board”), (ii) decides upon members of the Board, based on suggestions by the Nomination Committee, (iii) elects external auditors, (iv) decides the distribu-tion of dividends and (v) decides upon amendments to the Articles of Association.
The Board is responsible for the organisation of Volvo Cars and the management of its business worldwide and is obliged to follow directives provided by the Shareholders’ Meetings. The Volvo Cars Board may appoint committees with specific areas of responsibil-ity and furthermore authorise such committees to decide specific matters in accordance with regulations established by the Volvo Cars Board. Currently, the Volvo Cars Board has established the Audit Committee, the People & Compensation Committee and the Product Strategy & Investment Committee. The Chairman of the Board shall with the support of the Vice Chairman direct the work of the Board and monitor that the Board fulfills its obligations. The Board annually adopts the Regulations for the work of the Volvo Cars Board, which sets out the principles as regards the govern-ance of the Board, see below under the heading “Board” for fur-ther information.
The President of the Company, who is also Chief Executive Officer (CEO), is appointed by the Board to handle the day-to-day management of Volvo Cars and to lead the Executive Management Team (EMT) as overseen by the Board. EMT’s role is to assist the CEO in the operation of Volvo Cars business. The EMT has appointed sub-committees and boards of the EMT to assist in carrying out the decisions and actions, but the CEO will retain responsibility for the actions of the sub-committees and boards of the EMT.
The above mentioned corporate governance functions can be described in the below model:
SHAREHOLDER THROUGH SHAREHOLDERS’ MEETING
BOARD OF DIRECTORS
PRESIDENT & CEO EXECUTIVE MANAGEMENT TEAM
AUDIT COMMITTEE
GLOBAL AUDIT OFFICE (GAO)
EXTERNAL AUDITORS
Volvo Car Group Corporate Governance
PEOPLE & COMPENSATION COMMITTEE
NOMINATION COMMITTEE
PRODUCT STRATEGY & INVESTMENT COMMITTEE
COMPLIANCE & ETHICS OFFICE
BUSINESS UNITS/OPERATIONS
78 VOLVO CAR GROUP | ANNUAL REPORT 2016
CORPORATE GOVERNANCE REPORT
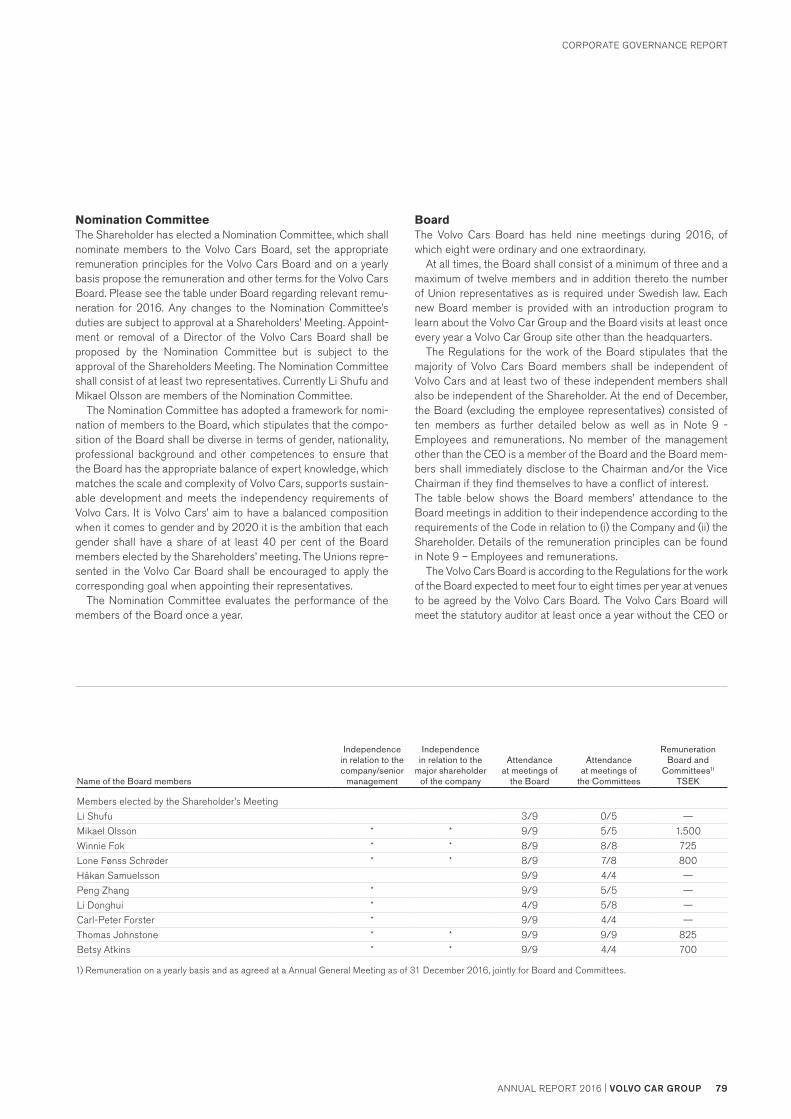
Nomination CommitteeThe Shareholder has elected a Nomination Committee, which shall nominate members to the Volvo Cars Board, set the appropriate remuneration principles for the Volvo Cars Board and on a yearly basis propose the remuneration and other terms for the Volvo Cars Board. Please see the table under Board regarding relevant remu-neration for 2016. Any changes to the Nomination Committee’s duties are subject to approval at a Shareholders’ Meeting. Appoint-ment or removal of a Director of the Volvo Cars Board shall be proposed by the Nomination Committee but is subject to the approval of the Shareholders Meeting. The Nomination Committee shall consist of at least two representatives. Currently Li Shufu and Mikael Olsson are members of the Nomination Committee.
The Nomination Committee has adopted a framework for nomi-nation of members to the Board, which stipulates that the compo-sition of the Board shall be diverse in terms of gender, nationality, professional background and other competences to ensure that the Board has the appropriate balance of expert knowledge, which matches the scale and complexity of Volvo Cars, supports sustain-able development and meets the independency requirements of Volvo Cars. It is Volvo Cars’ aim to have a balanced composition when it comes to gender and by 2020 it is the ambition that each gender shall have a share of at least 40 per cent of the Board members elected by the Shareholders’ meeting. The Unions repre-sented in the Volvo Car Board shall be encouraged to apply the corresponding goal when appointing their representatives.
The Nomination Committee evaluates the performance of the members of the Board once a year.
Board The Volvo Cars Board has held nine meetings during 2016, of which eight were ordinary and one extraordinary.
At all times, the Board shall consist of a minimum of three and a maximum of twelve members and in addition thereto the number of Union representatives as is required under Swedish law. Each new Board member is provided with an introduction program to learn about the Volvo Car Group and the Board visits at least once every year a Volvo Car Group site other than the headquarters.
The Regulations for the work of the Board stipulates that the majority of Volvo Cars Board members shall be independent of Volvo Cars and at least two of these independent members shall also be independent of the Shareholder. At the end of December, the Board (excluding the employee representatives) consisted of ten members as further detailed below as well as in Note 9 - Employees and remunerations. No member of the management other than the CEO is a member of the Board and the Board mem-bers shall immediately disclose to the Chairman and/or the Vice Chairman if they find themselves to have a conflict of interest. The table below shows the Board members’ attendance to the Board meetings in addition to their independence according to the requirements of the Code in relation to (i) the Company and (ii) the Shareholder. Details of the remuneration principles can be found in Note 9 – Employees and remunerations.
The Volvo Cars Board is according to the Regulations for the work of the Board expected to meet four to eight times per year at venues to be agreed by the Volvo Cars Board. The Volvo Cars Board will meet the statutory auditor at least once a year without the CEO or
Name of the Board members
Independencein relation to the company/senior
management
Independencein relation to the
major shareholder of the company
Attendance at meetings of
the Board
Attendance at meetings of
the Committees
Remuneration Board and
Committees1) TSEK
Members elected by the Shareholder’s Meeting
Li Shufu 3/9 0/5 —
Mikael Olsson * * 9/9 5/5 1.500
Winnie Fok * * 8/9 8/8 725
Lone Fønss Schrøder * * 8/9 7/8 800
Håkan Samuelsson 9/9 4/4 —
Peng Zhang * 9/9 5/5 —
Li Donghui * 4/9 5/8 —
Carl-Peter Forster * 9/9 4/4 —
Thomas Johnstone * * 9/9 9/9 825
Betsy Atkins * * 9/9 4/4 700 1) Remuneration on a yearly basis and as agreed at a Annual General Meeting as of 31 December 2016, jointly for Board and Committees.
VOLVO CAR GROUP | ANNUAL REPORT 2016 79ANNUAL REPORT 2016 | VOLVO CAR GROUP
CORPORATE GOVERNANCE REPORT

any other member of EMT present. In addition, the Volvo Cars Board will hold non-executive meetings with regular intervals.
The Board continuously monitors Volvo Cars’ performance, eval-uates Volvo Cars’ strategic direction and business plan as well as other aspects such as Volvo Cars’ adherence to responsible busi-ness conduct, sustainability and its Code of Conduct. During 2016, the Board furthermore approved the sustainability strategy for Volvo Cars.
The Board conducts a yearly survey regarding its board work. Based on the result of the survey the Board will evaluate the per-formance and identify possible areas of improvements. In addition, the Vice Chairman conducts meetings with the individual board members during the year.
Audit CommitteeThe Board of Volvo Cars has assigned an Audit Committee to oversee the corporate governance, financial reporting, risks and compliance with external and internal regulations. The Audit Com-mittee has held eight meetings during 2016, whereof four ordinary and four extraordinary interim meetings.
The Audit Committee is responsible for identifying and report-ing relevant issues to the Volvo Cars Board within the Audit Com-mittee’s areas of responsibility. The Audit Committee shall monitor the integrity of Volvo Cars’ financial reporting system, internal con-trols, operation procedure and risk management framework, rec-ommend to the Volvo Cars Board the appointment, removal and remuneration for the Statutory Auditors (subject to approval at the Shareholders’ Meeting) in accordance with the Companies Act, monitor the independence of the Statutory Auditors and review the effectiveness of the internal audit and compliance function. Lone Fønss Schrøder (Chairman), Winnie Fok and Li Donghui are cur-rently members of the Audit Committee.
People & Compensation CommitteeThe Board has assigned a People & Compensation Committee to determine the remuneration to the CEO and the EMT members. The People & Compensation Committee has held five meetings during 2016, whereof five ordinary.
The duties of the People & Compensation Committee are to prepare, propose and/or decide and present to the Volvo Cars Board matters related to remuneration, remuneration principles, performance and succession planning of the CEO and the execu-tive management and other matters related thereto. Mikael Olsson (Chairman), Li Shufu, Peter Zhang and Thomas Johnstone are cur-rently members of the People & Compensation Committee.
Product Strategy & Investment CommitteeThe Board has assigned a Product Strategy & Investment Commit-tee to oversee Volvo Car Group’s product strategy and the invest-ments linked to it. The Product Strategy & Investment Committee has held four meetings during 2016, whereof four ordinary.
The duties of the Product Strategy & Investment Committee are to ensure that the changes in society, peoples view on mobility and cars as well as changes in the automotive market are reflected in
the Group’s strategic product plans and when choosing technolo-gies. Thomas Johnstone (Chairman), Carl-Peter Forster, Betsy Atkins together with Håkan Samuelsson are part of the Product Strategy and Investment Committee.
Global Audit OfficeVolvo Cars has an independent Internal Audit department with the assignment to determine whether Volvo Cars governance, internal control and risk management processes, as designed, operated and represented by management, are adequate and effective. The scope for the internal audit is determined by means of a risk assessment process and any additional requirements by the Board. The head of the Internal Audit function reports to the Audit Committee.
Corporate Compliance & Ethics OfficeVolvo Cars has a Corporate Compliance & Ethics Office that sup-ports the business operations in conducting business in a respon-sible and ethical manner, in line with the Volvo Cars’ Code of Con-duct and Corporate Policies. Volvo Cars’ Global Compliance & Ethics Program framework consists of ten program areas or steps built on the models described as “effective compliance program” and “adequate procedures” by for example SCCE (Society of Cor-porate Compliance & Ethics), FCPA (Foreign Corrupt Practises Act), US sentencing Guidelines and the UK Bribery Act Guidance and Anti-Trust Offices throughout Europe. The program includes corporate policies, procedures and actions within a process to help prevent, detect and respond to violations of laws and regula-tions. It covers several risk areas such as corruption, anti-compet-itive behaviour, data privacy and export control matters as well as other Code of Conduct related matters. All compliance activities should be risk based; everything starts with a compliance risk assessment, which is done at least yearly.
The Chief Compliance & Ethics Officer reports to the SVP Group Legal and Corporate Governance and further continuously reports on compliance issues to the Global Compliance Commit-tee. The Chief Compliance & Ethics Officer also reports to the Audit Committee of the Board of Directors and provides compli-ance training to the Board of Directors..
External AuditorsVolvo Car Group’s external auditors are elected by the Annual General Meeting. Deloitte AB was appointed auditor for the Volvo Car Group in the financial year 2010. The Annual General Meeting has then re-elected Deloitte AB, and the current audit engage-ment period will end at the 2017 Annual General Meeting. Lead Audit Partner is the authorized public accountant Jan Nilsson. The external auditors discuss the external audit plan, audit findings and risk management with the Audit Committee. The auditors present their findings from their review for the period January 1 to Septem-ber 30 to the Audit Committee, and their findings from the finan-cial year audit to the Audit Committee and the Board of Directors at meetings after year-end. The auditors review the interim report for the period January 1 to September 30 and audit the Annual
80 VOLVO CAR GROUP | ANNUAL REPORT 2016
CORPORATE GOVERNANCE REPORT

Report of the parent company and the consolidated financial statements. When Deloitte is asked to provide services other than the external audit, it is done in accordance with general independ-ency rules. Annually Deloitte assures its impartiality and inde-pendence in writing to the Audit Committee in accordance with the Swedish Companies Act and ISA 260.
Internal control over financial reportingAccording to the Swedish Companies Act, the Board is ultimately responsible for ensuring that an effective internal control system exists within the Group. In order to assist the Board and manage-ment in their internal control responsibilities, Volvo Cars has imple-mented an internal control function over financial reporting, with the purpose to ensure that the financial reporting is reliable and that the financial reports follow generally accepted accounting principles.
Volvo Cars builds its internal control on the framework for inter-nal control issued by the Committee of Sponsoring Organisations of the Treadway Commission (COSO) and its five components; Control Environment, Risk Assessment, Control Activities, Infor-mation & Communication and Monitoring activities.
Control Environment The foundation of Volvo Cars’ control environment is the Volvo Cars’ Code of Conduct, which is the guiding principle of Volvo Cars and consists of the Group’s corporate policies, directives and guidelines. The foundation of the control environment over finan-cial reporting are further based upon functional policies, directives and guidelines including Roles and Responsibilities and the Authority directive.
Risk assessmentEach entity and function performs risk assessments. Identified risks are consolidated and reported within the Enterprise Risk Management process, see page 76. On a yearly basis, the func-tions of Internal Control, Internal Audit and Corporate Compliance & Ethics Office jointly perform a risk assessment to evaluate and determine if and how risks identified and reported should be addressed for the coming year.
Control activities Each entity and function carries out control activities and monitors the local internal control environment within its area of responsibil-ity, in order to manage risk and to detect and correct errors in the financial processes. Group functions are monitoring from a group level perspective.
The Internal Control function performs specific internal control reviews and coordinates evaluation activities in the Internal Con-trol Program through self-assessments on process controls at transaction level and for IT controls.
Information and communicationPolicies, procedures and the Internal Control Program relating to financial reporting are updated and communicated on a regular basis through formal and informal channels. Risk, focus areas and result from the Internal Control Program are reported to the Audit Committee.
VOLVO CAR GROUP | ANNUAL REPORT 2016 81ANNUAL REPORT 2016 | VOLVO CAR GROUP
CORPORATE GOVERNANCE REPORT
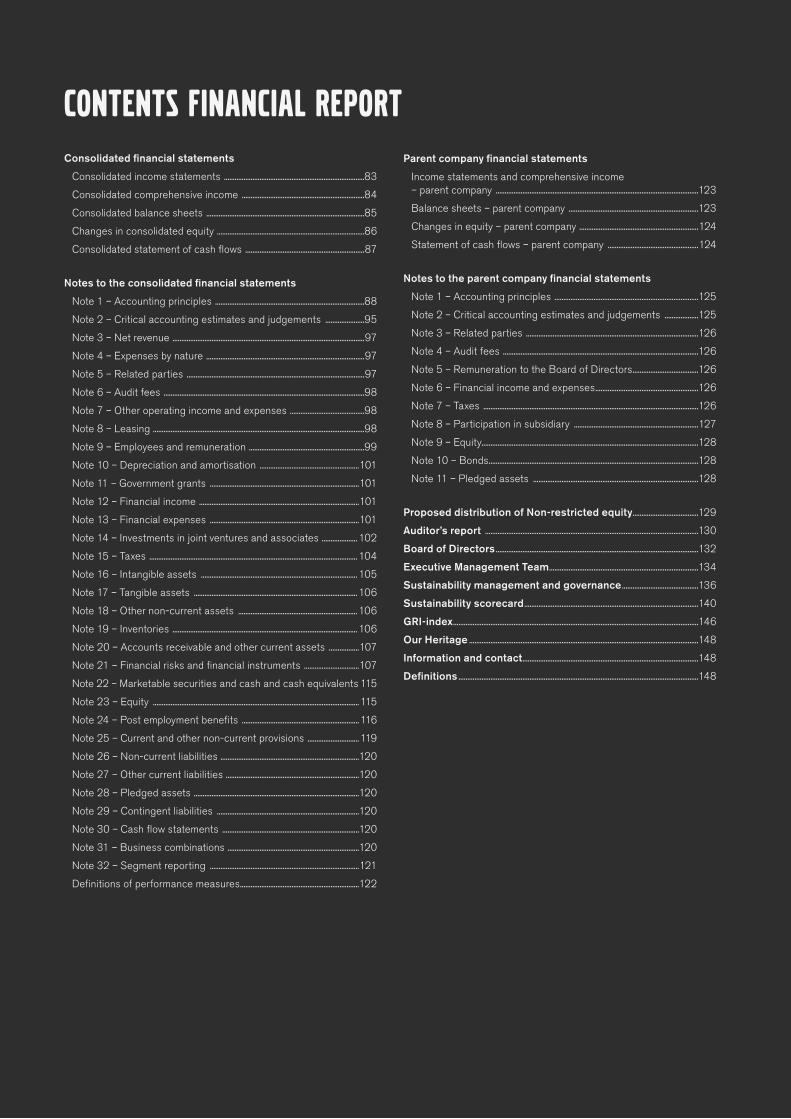
Consolidated financial statements
Consolidated income statements ...............................................................................83
Consolidated comprehensive income .....................................................................84
Consolidated balance sheets .........................................................................................85
Changes in consolidated equity ...................................................................................86
Consolidated statement of cash flows ...................................................................87
Notes to the consolidated financial statements
Note 1 – Accounting principles ....................................................................................88
Note 2 – Critical accounting estimates and judgements ......................95
Note 3 – Net revenue ............................................................................................................97
Note 4 – Expenses by nature .........................................................................................97
Note 5 – Related parties ....................................................................................................97
Note 6 – Audit fees .................................................................................................................98
Note 7 – Other operating income and expenses ..........................................98
Note 8 – Leasing .......................................................................................................................98
Note 9 – Employees and remuneration .................................................................99
Note 10 – Depreciation and amortisation ........................................................101
Note 11 – Government grants ....................................................................................101
Note 12 – Financial income ..........................................................................................101
Note 13 – Financial expenses ....................................................................................101
Note 14 – Investments in joint ventures and associates .................... 102
Note 15 – Taxes ..................................................................................................................... 104
Note 16 – Intangible assets ........................................................................................ 105
Note 17 – Tangible assets ............................................................................................ 106
Note 18 – Other non-current assets ................................................................... 106
Note 19 – Inventories ........................................................................................................ 106
Note 20 – Accounts receivable and other current assets .................107
Note 21 – Financial risks and financial instruments ...............................107
Note 22 – Marketable securities and cash and cash equivalents 115
Note 23 – Equity .................................................................................................................... 115
Note 24 – Post employment benefits .................................................................. 116
Note 25 – Current and other non-current provisions ............................. 119
Note 26 – Non-current liabilities ..............................................................................120
Note 27 – Other current liabilities ...........................................................................120
Note 28 – Pledged assets .............................................................................................120
Note 29 – Contingent liabilities ................................................................................120
Note 30 – Cash flow statements .............................................................................120
Note 31 – Business combinations ..........................................................................120
Note 32 – Segment reporting ....................................................................................121
Definitions of performance measures ...................................................................122
Contents Financial ReportParent company financial statements
Income statements and comprehensive income – parent company ..................................................................................................................123
Balance sheets – parent company .........................................................................123
Changes in equity – parent company ...................................................................124
Statement of cash flows – parent company ...................................................124
Notes to the parent company financial statements
Note 1 – Accounting principles .................................................................................125
Note 2 – Critical accounting estimates and judgements ...................125
Note 3 – Related parties .................................................................................................126
Note 4 – Audit fees ..............................................................................................................126
Note 5 – Remuneration to the Board of Directors .....................................126
Note 6 – Financial income and expenses ..........................................................126
Note 7 – Taxes .........................................................................................................................126
Note 8 – Participation in subsidiary ......................................................................127
Note 9 – Equity ..........................................................................................................................128
Note 10 – Bonds ......................................................................................................................128
Note 11 – Pledged assets .............................................................................................128
Proposed distribution of Non-restricted equity .....................................129
Auditor’s report ........................................................................................................................130
Board of Directors ..................................................................................................................132
Executive Management Team ....................................................................................134
Sustainability management and governance ...........................................136
Sustainability scorecard ..................................................................................................140
GRI-index ..........................................................................................................................................146
Our Heritage .................................................................................................................................148
Information and contact ...................................................................................................148
Definitions .......................................................................................................................................148
CONSOLIDATED FINANCIAL STATEMENTS
82 VOLVO CAR GROUP | ANNUAL REPORT 2016
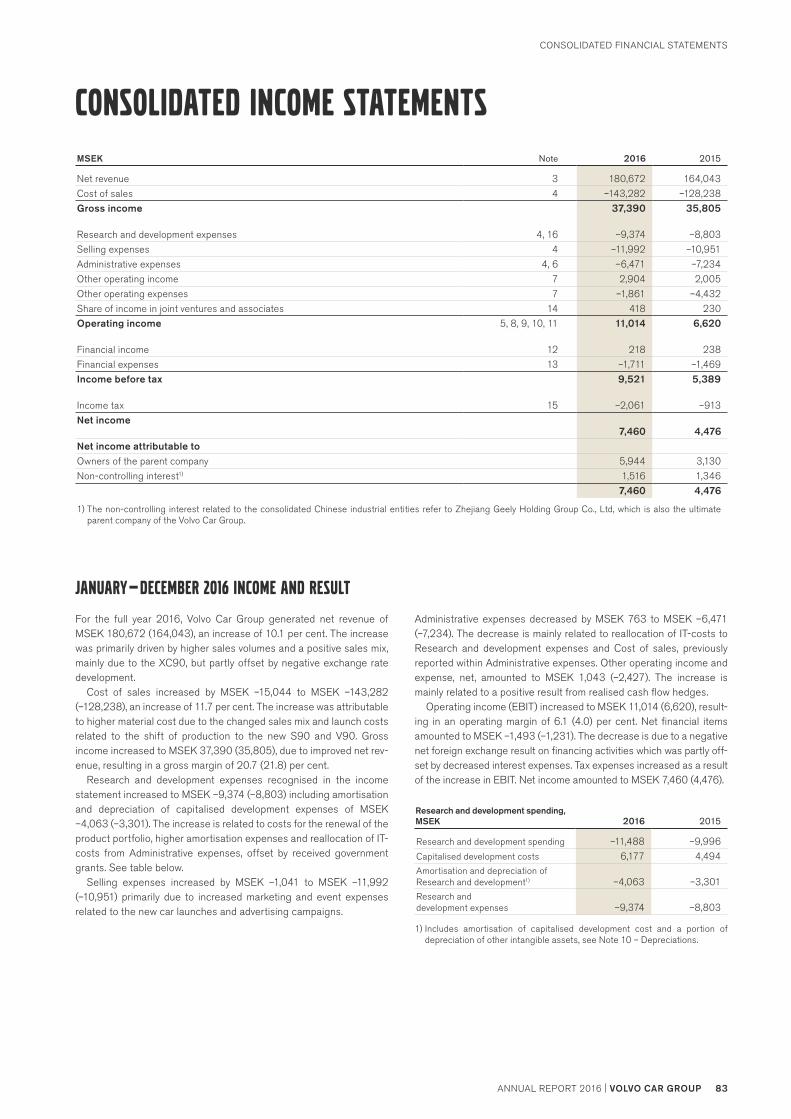
MSEK Note 2016 2015
Net revenue 3 180,672 164,043
Cost of sales 4 –143,282 –128,238
Gross income 37,390 35,805
Research and development expenses 4, 16 –9,374 –8,803
Selling expenses 4 –11,992 –10,951
Administrative expenses 4, 6 –6,471 –7,234
Other operating income 7 2,904 2,005
Other operating expenses 7 –1,861 –4,432
Share of income in joint ventures and associates 14 418 230
Operating income 5, 8, 9, 10, 11 11,014 6,620
Financial income 12 218 238
Financial expenses 13 –1,711 –1,469
Income before tax 9,521 5,389
Income tax 15 –2,061 –913
Net income7,460 4,476
Net income attributable toOwners of the parent company 5,944 3,130
Non-controlling interest1) 1,516 1,346
7,460 4,476
1) The non-controlling interest related to the consolidated Chinese industrial entities refer to Zhejiang Geely Holding Group Co., Ltd, which is also the ultimate parent company of the Volvo Car Group.
CONSOLIDATED INCOME STATEMENTS
For the full year 2016, Volvo Car Group generated net revenue of MSEK 180,672 (164,043), an increase of 10.1 per cent. The increase was primarily driven by higher sales volumes and a positive sales mix, mainly due to the XC90, but partly offset by negative exchange rate development.
Cost of sales increased by MSEK –15,044 to MSEK –143,282 (–128,238), an increase of 11.7 per cent. The increase was attributable to higher material cost due to the changed sales mix and launch costs related to the shift of production to the new S90 and V90. Gross income increased to MSEK 37,390 (35,805), due to improved net rev-enue, resulting in a gross margin of 20.7 (21.8) per cent.
Research and development expenses recognised in the income statement increased to MSEK –9,374 (–8,803) including amortisation and depreciation of capitalised development expenses of MSEK –4,063 (–3,301). The increase is related to costs for the renewal of the product portfolio, higher amortisation expenses and reallocation of IT- costs from Administrative expenses, offset by received government grants. See table below.
Selling expenses increased by MSEK –1,041 to MSEK –11,992 (–10,951) primarily due to increased marketing and event expenses related to the new car launches and advertising campaigns.
Administrative expenses decreased by MSEK 763 to MSEK –6,471 (–7,234). The decrease is mainly related to reallocation of IT-costs to Research and development expenses and Cost of sales, previously reported within Administrative expenses. Other operating income and expense, net, amounted to MSEK 1,043 (–2,427). The increase is mainly related to a positive result from realised cash flow hedges.
Operating income (EBIT) increased to MSEK 11,014 (6,620), result-ing in an operating margin of 6.1 (4.0) per cent. Net financial items amounted to MSEK –1,493 (–1,231). The decrease is due to a negative net foreign exchange result on financing activities which was partly off-set by decreased interest expenses. Tax expenses increased as a result of the increase in EBIT. Net income amounted to MSEK 7,460 (4,476).
Research and development spending, MSEK 2016 2015
Research and development spending –11,488 –9,996
Capitalised development costs 6,177 4,494Amortisation and depreciation of Research and development1) –4,063 –3,301Research and development expenses –9,374 –8,803
1) Includes amortisation of capitalised development cost and a portion of depreciation of other intangible assets, see Note 10 – Depreciations.
JANUARY — DECEMBER 2016 INCOME AND RESULT
CONSOLIDATED FINANCIAL STATEMENTS
VOLVO CAR GROUP | ANNUAL REPORT 2016 83ANNUAL REPORT 2016 | VOLVO CAR GROUP

MSEK Note 2016 2015
Net income for the year 7,460 4,476
Other comprehensive income, net of income taxItems that will not be reclassified subsequently to income statement:Remeasurements of provisions for post-employment benefits –1,157 1,321
Items that may be reclassified subsequently to income statement:Translation difference on foreign operations 514 –175
Translation difference of hedge instruments of net investments in foreign operations –124 100
Change in cash flow hedge 23 –3,074 1,617
Other comprehensive income, net of income tax –3,841 2,863Total comprehensive income for the year 3,619 7,339
Total comprehensive income attributable toOwners of the parent company 2,070 6,005
Non–controlling interest 1,549 1,334
3,619 7,339
CONSOLIDATED COMPREHENSIVE INCOME
Cash flow from operating and investing activities amounted to MSEK 6,515 (7,234) for the year.
Cash flow from operating activities increased to MSEK 26,861 (22,576). The improvement is due to an increased operating income as well as a positive working capital development. The cash flow from working capital is mainly related to the increase in accounts payable and provisions, primarily related to increased production volumes. This is slightly offset by the increase in inventories as a result of the increased production volumes during the year.
Cash flow from investing activities amounted to MSEK –20,346 (–15,342), which includes the investment in Volvofinans Bank AB of MSEK –1,849. Investments in tangible assets amounted to MSEK –12,669 (–8,677), primarily due to the ongoing construction of the US manufacturing plant as well as special tool investments related to new car models based on the SPA platform, such as the S90 and V90. Investments in intangible assets amounted to MSEK –6,394 (–4,715) as a result of continuous investments in upcoming new car models.
Cash flow from financing activities amounted to MSEK 5,792 (1,445), and is attributable to the proceeds from the new bonds of MSEK 7,579 (—) and the issuance of preference shares of MSEK 4,979 (—), offset by repayment of liabilities to credit institutions of MSEK –7,634 (–6,626).
Cash and cash equivalents including marketable securities increased to MSEK 43,373 (29,135). The revolving credit facility of MEUR 660 remains undrawn. Net cash increased to MSEK –18,873 (–7,721).
Total equity increased by MSEK 8,675 to MSEK 43,310 (34,635), resulting in an equity ratio of 26.8 (26.2) per cent. The change in equity is related to the positive net income of MSEK 7,460 and pro-ceeds from the issuance of preference shares of MSEK 5,000, offset by negative effects in other comprehensive income, related to change in cash flow hedge reserves of MSEK –3,074 and remeasurement of post-employment benefits of MSEK –1,157.
NET FINANCIAL POSITION AND LIQUIDITY
CONSOLIDATED FINANCIAL STATEMENTS
84 VOLVO CAR GROUP | ANNUAL REPORT 2016

MSEK Note Dec 31, 2016 Dec 31, 2015
ASSETSNon-current assetsIntangible assets 16 25,368 22,834
Property, plant and equipment 8, 17 45,468 37,428
Assets held under operating leases 8, 17 2,483 2,172
Receivables on parent company 54 —
Investments in joint ventures and associates 14 2,498 701
Other long-term securities holdings 79 15
Deferred tax assets 15 4,112 3,841
Other non-current assets 18 2,013 1,326
Total non-current assets 82,075 68,317
Current assetsInventories 19 21,198 20,306
Accounts receivable 5, 20 8,717 8,805
Receivables on parent company 20 — 54
Current tax assets 293 307
Other current assets 20 5,757 5,393
Marketable securities 22 4,738 3,512
Cash and cash equivalents 22 38,635 25,623
Total current assets 79,338 64,000TOTAL ASSETS 161,413 132,317
EQUITY & LIABILITIESEquity 23
Equity attributable to owners of the parent company 39,536 32,550
Non-controlling interests 3,774 2,085
Total equity 43,310 34,635
Non-current liabilitiesProvisions for post-employment benefits 24 6,348 4,701
Deferred tax liabilities 15 1,209 1,768
Other non-current provisions 25 6,995 5,909
Liabilities to credit institutions 26 13,910 15,168
Bonds 21, 26 7,699 —
Other non-current liabilities 5, 26 5,818 2,927
Total non-current liabilities 41,979 30,473
Current liabilitiesCurrent provisions 25 15,371 12,456
Liabilities to credit institutions 26 2,813 6,246
Advance payments from customers 652 534
Accounts payable 5 30,508 26,282
Current tax liabilities 626 446
Other current liabilities 27 26,154 21,245
Total current liabilities 76,124 67,209TOTAL EQUITY & LIABILITIES 161,413 132,317
CONSOLIDATED BALANCE SHEETS
CONSOLIDATED FINANCIAL STATEMENTS
VOLVO CAR GROUP | ANNUAL REPORT 2016 85ANNUAL REPORT 2016 | VOLVO CAR GROUP

MSEK Share
capital1) Share
premium
Other contributed
capital
Currency translation
reserveOther
reserves2)Retained earnings
Attributable to owners of
the parent
Non-controlling
interest Total
Balance at January 1, 2015 — 6,509 12,809 –256 –746 14,488 32,804 1,464 34,268
Net income for the year — — — — — 3,130 3,130 1,346 4,476
Other comprehensive incomeRemeasurements of provision for post-employment benefits — — — — — 1,705 1,705 — 1,705
Translation difference on foreign operations — — — –163 — — –163 –12 –175
Translation difference of hedge instruments of net investments in foreign operations — — — 128 — — 128 — 128
Change in cash flow hedge, recognised in other comprehensive income — — — — 2,073 — 2,073 — 2,073
Tax attributable to items recognised in other comprehensive income — — — –28 –456 –384 –868 — –868
Other comprehensive income — — — –63 1,617 1,321 2,875 –12 2,863Total comprehensive income — — — –63 1,617 4,451 6,005 1,334 7,339
Transactions with ownersGroup contributions3) — — –8,767 — — — –8,767 — –8,767
Unconditional shareholders’ contribution — — 3,992 — — — 3 992 — 3,992
Capital transaction under common control — — — — — –1,484 –1,484 –713 –2,197
Transactions with owners — — –4,775 — — –1,484 –6,259 –713 –6,972
Balance at December 31, 2015 — 6,509 8,034 –319 871 17,455 32,550 2,085 34,635
Net income for the year — — — — — 5,944 5,944 1,516 7,460
Other comprehensive incomeRemeasurements of provision for post-employment benefits — — — — — –1,422 –1,422 — –1,422
Translation difference on foreign operations — — — 481 — — 481 33 514
Translation difference of hedge instruments of net investments in foreign operations — — — –159 — — –159 — –159
Change in cash flow hedge, recognised in other comprehensive income — — — — –3,941 — –3,941 — –3,941
Tax attributable to items recognised in other comprehensive income — — — 35 867 265 1,167 — 1,167
Other comprehensive income — — — 357 –3,074 –1,157 –3,874 33 –3,841Total comprehensive income — — — 357 –3,074 4,787 2,070 1,549 3,619
Transactions with ownersAcquisition of non-controlling interest4) — — — — — — — 140 140
Bonus issue 50 –50 — — —
New issue of preference shares5) 1 4,915 — — — — 4,916 — 4,916
Transactions with owners 51 4,915 — — — –50 4,916 140 5,056
Balance at December 31, 2016 51 11,424 8,034 38 –2,203 22,192 39,536 3,774 43,310
1) Share capital amounts to SEK 50,500,000 (100,000).2) For specification of Other reserves, see Note 23 – Equity.3) Group contribution before tax amounted to MSEK — (–11,240).4) For further information, see Note 31 – Business combinations.5) For further information, see Note 23 – Equity.
CHANGES IN CONSOLIDATED EQUITY
CONSOLIDATED FINANCIAL STATEMENTS
86 VOLVO CAR GROUP | ANNUAL REPORT 2016

MSEK Note 2016 2015
OPERATING ACTIVITIESOperating income 11,014 6,620
Depreciation and amortisation of non-current assets 10 10,527 9,399
Interest and similar items received 218 141
Interest and similar items paid –953 –1,022
Other financial items –418 –176
Income tax paid –1,705 –1,645
Adjustments for items not affecting cash flow 30 522 –235
19,205 13,082
Movements in working capitalChange in inventories –231 –1,742
Change in accounts receivable 730 –994
Change in accounts payable 4,023 7,658
Change in items relating to repurchase commitments –342 29
Change in provisions 3,497 1,979
Change in other working capital assets/liabilities –21 2,564
Cash flow from movements in working capital 7,656 9,494Cash flow from operating activities 26,861 22,576
INVESTING ACTIVITIESInvestments in shares and participations, net 14, 31 –1,462 –2,239
Dividends received from joint ventures and associates 14 187 26
Investments in intangible assets –6,394 –4,715
Investments in property, plant and equipment –12,669 –8,677
Disposal of property, plant and equipment — 263
Other –8 —
Cash flow from investing activities –20,346 –15,342Cash flow from operating and investing activities 6,515 7,234
FINANCING ACTIVITIESProceeds from credit institutions 26 1,696 5,935
Proceeds from bond issuance 21 7,579 —
Proceeds from issuance of preference shares 23 4,979 —
Repayment of liabilities to credit institutions 26 –7,634 –6,626
Received shareholders’ contribution 23 — 3,992
Investments in marketable securities, net 22 –1,189 –2,488
Other 30 361 632
Cash flow from financing activities 5,792 1,445Cash flow for the year 12,307 8,679
Cash and cash equivalents at beginning of year 22 25,623 17,002Exchange difference on cash and cash equivalents 705 –58
Cash and cash equivalents at end of year 38,635 25,623
CONSOLIDATED STATEMENT OF CASH FLOWS
CONSOLIDATED FINANCIAL STATEMENTS
VOLVO CAR GROUP | ANNUAL REPORT 2016 87ANNUAL REPORT 2016 | VOLVO CAR GROUP

NOTE 1 – ACCOUNTING PRINCIPLES
Basis of preparationThe financial statements of Volvo Car AB (publ.) and its subsidiaries (the “Volvo Car Group”) have been prepared in compliance with the International Financial Reporting Standards (IFRS) issued by the Inter-national Accounting Standards Board (IASB), as adopted by the Euro-pean Union. This Annual Report is prepared in accordance with IAS 1 Presentation of Financial Statements and the Swedish Annual Accounts Act. In addition, RFR 1 Supplementary Rules for Groups has been applied, which is issued by the Swedish Financial Reporting Board. RFR 1 specifies mandatory additions to the IFRS disclosure requirements in accordance with the Swedish Annual Accounts Act.
The consolidated financial statements have been prepared on the historical cost basis except for certain financial instruments that are carried at fair value, as explained in the accounting principles below.
Preparing the financial reports in compliance with IFRS requires that Management makes judgements and estimates as well as assumptions that affect the application of accounting principles and amounts recognised. Areas involving a higher degree of judgement or complexity, or areas where assumptions and estimates have signifi-cant impact on the consolidated financial statements are disclosed in Note 2 – Critical accounting estimates and judgements.
As required by IAS 1, the Group companies apply uniform account-ing rules, irrespective of national legislation, as defined in the Group Finance Manual, which is in compliance with IFRS. The principles stated below have been applied consistently for all periods, unless otherwise indicated below.
For information on new standards, see the section below on new and amended standards adopted by the Group.
Basis of consolidationThe consolidated accounts have been prepared based on the princi-ples set forth in IFRS 10 – Consolidated financial statements. The Volvo Car Group includes Volvo Car AB (publ.) and its’ subsidiaries. Subsidiaries are all entities (including structured entities) over which the Group has control. The Group controls an entity when the Group is exposed to, or has rights to, variable returns from its involvement with the entity and has the ability to affect those returns through its power over the entity. Subsidiaries are fully consolidated from the date on which control is transferred to the Group. They are deconsolidated from the date that control ceases.
Business combinations – IFRS 3Volvo Car Group applies IFRS 3, Business Combinations, for acquisi-tions. All business combinations, except for common control transac-tions, are recognised in accordance with the acquisition method. Volvo Car Group measures acquired identifiable assets and liabilities at fair value. Any surplus amount from the purchase price, possible minority interest and fair value of previously held equity interests at the acquisi-tion date compared to the Volvo Car Group’s share of acquired net assets is recognised as goodwill. Any deficit amount (bargain pur-chase), so called negative goodwill, is directly recognised as income in the income statement. In step acquisitions, a business combination occurs only on the date control is achieved. Transactions with the minority are recognised as equity as long as control of the subsidiary is retained.
NOTES TO THE CONSOLIDATED FINANCIAL STATEMENTSAll amounts are in MSEK unless otherwise stated. Amounts in brackets refer to the preceding year.
All acquisition-related costs are expensed. Companies acquired are consolidated as of the date of acquisition. Companies that have been divested are included in the consolidated financial statements up to and including the date of the divestment. Intercompany transactions, balances and unrealised gains or losses on transactions between group companies are eliminated.
Common control transactionsOn June 25, 2015, Volvo Car Group gained control over the Chinese industrial entities Daqing Volvo Car Manufacturing Co., Ltd, Zhangjiakou Volvo Car Engine Manufacturing Co., Ltd and Shanghai Volvo Car Research and Development Co., Ltd through an acquisition of an addi-tional 20 per cent, creating a 50 per cent ownership in these compa-nies. Additionally, Daqing Volvo Car Manufacturing Co., Ltd acquired 100 per cent in three other companies, among them Volvo Car (Asia Pacific) Investment Holding Co., Ltd which holds 100 per cent of Zhongjia Automobile Manufacturing (Chengdu) Co., Ltd. After the acquisitions, Volvo Car Group holds 50 per cent of Volvo Car’s Chinese industrial entities and has gained the power to control these entities. Those entities are therefore classified as subsidiaries within Volvo Car Group and thus fully consolidated.
These acquisitions are common control transactions. Common con-trol transactions are not explicitly regulated under IFRS and therefore the company needs to apply a principle which is considered to best reflect the transaction. Volvo Car Group has elected to apply predeces-sor accounting, meaning that the acquirer incorporates predecessor carrying value. These are the carrying values that are related to the acquired entity from the consolidated financial statements of the high-est entity that has common control for which consolidated financial statements are prepared.
When applying predecessor accounting Volvo Car Group has chosen to include acquired entities under common control for the entire period 2015. This means that the consolidated financial statements include the acquired entity’s results as if both entities (acquirer and acquiree) had always been combined. The consolidated financial statements will reflect both entities’ full year’s results, even though the business combi-nation have occurred part way through the previous year. The effect in the opening balance of the comparative period due to this application of predecessor accounting is accounted for directly in equity.
Balances and transactions with Zhejiang Geely Holding Group Co., Ltd and its subsidiaries, companies that are not part of the Volvo Car Group, are classified in the consolidated financial statements as bal-ances and transactions with related companies.
Joint ventures and associated companies Joint ventures refer to joint arrangements whereby the Volvo Car Group together with one or more parties that have joint control, have rights to the net assets of the arrangements.
Associated companies are companies in which Volvo Car Group has a significant but not controlling influence, which generally is when Volvo Car Group holds between 20 and 50 per cent of the shares, but it also includes investments with less participation if significant influ-ence is proven.
Investments in joint ventures and associated companies are reported in accordance with the equity method and are initially recognised at acquisition cost. The Group’s share of post acquisition profit or loss is recognised in the income statement, and its share of post acquisition
NOTES TO THE CONSOLIDATED FINANCIAL STATEMENTS
88 VOLVO CAR GROUP | ANNUAL REPORT 2016

movements in other comprehensive income is recognised in other com-prehensive income, with a corresponding adjustment to the carrying amount of the investment. When the Group’s share of losses in an associate equals or exceeds its interest in the associate, the group does not recognise further losses unless it has incurred legal or con-structive obligations in relation to the associate or joint venture.
Foreign currencyTranslation of foreign group entitiesThe primary economic environment is the one in which a group company primarily generates and expends cash. Normally the functional currency is the currency of the country where the company is located. Volvo Car Group’s and Volvo Car AB’s (publ.) presentation currency is SEK.
In preparing the consolidated financial statements, items in the income statements of foreign subsidiaries (except for subsidiaries in hyperinflationary economies) are translated to SEK using monthly average exchange rates. Currently none of the entities within Volvo Car Group operates in a hyperinflationary economy. Balance sheet items are translated into SEK using exchange rates at year-end (clos-ing rate). Exchange differences arising are recognised in consolidated comprehensive income and accumulated in equity.
The accumulated translation differences related to a certain sub-sidiary, joint venture or associated company are reversed to the income statement as a part of the gain/loss arising from disposal of such a company.
Receivables and liabilities in foreign currencyReceivables and liabilities in currencies other than the functional cur-rency (foreign currencies) are translated to the functional currency using the balance sheet closing rate. Exchange rate differences aris-ing from translation of currencies are reported in the income state-ment, except when deferred in other comprehensive income as net investment hedges.
Translation differences on operating assets and liabilities are rec-ognised in operating income, while translation differences arising in financial assets and liabilities are recognised in financial income and expenses. The main exchange rates applied are shown in the table below:
Exchange ratesAverage rate Close rate
Country Currency 2016 2015 2016 2015
China CNY 1.29 1.34 1.30 1.29
Euro zone EUR 9.44 9.35 9.55 9.17
Great Britain GBP 11.65 12.85 11.19 12.43
United States USD 8.54 8.39 9.06 8.40
Japan JPY 0.08 0.07 0.08 0.07
Segment reportingOperating segments are defined as components of the Group about which separate financial information is available that is evaluated regu-larly by the chief operating decision maker, or decision making group, in deciding how to allocate resources and in assessing performance.
Volvo Car Group, as a whole, operates in the automotive business. The automotive business includes all activities related to development, design, manufacturing, assembly and sale of vehicles, as well as sale of related parts and accessories from which the Group derives its revenues.
The regional organization implemented in 2015 is not considered to constitute reporting segments. The main purpose of the regional organization is to emphasize the responsibility for the regional market earnings as a whole, and mainly from a sales perspective with an increased focus on sales with more direct involvement from Group Management. All decisions regarding allocation of resources as well as the assessment of the performance is based on the group as a whole. Therefore Volvo Car Group is considered to have only one
operating segment, why no separate segment report is given. For further information see Note 32 – Segment reporting.
Accounting principlesRevenue recognitionVolvo Car Group’s recognised net revenue mainly consists of sales of goods and services. Gross revenue is reduced by discounts and returned goods. Revenue from the sale of goods is recognised when substantially all risks and rewards are transferred to the customer (generally dealers and distributors). However, if the sale of vehicles is combined with a repurchase agreement, the transactions are accounted for as operating lease contracts. Revenues related to an operating lease arrangement are recognised straight-line over the lease period.
Revenue from sale to an external party, subject to a subsequent issuance of a residual value guarantee to an independent financing provider, is recognised at the time of sale and a provision is made for the estimated residual value risk, provided that significant risks related to the vehicle have been transferred to the customer.
When extended services have been contractually agreed with the customer in addition to the sale of a vehicle, such as warranty exten-sions over a fixed period, the related revenue is recorded on a linear basis in the income statement over the contract period.
Interest income is recognised using the effective interest method. The calculation is made on the basis of the return on underlying assets in accordance with the effective interest method. Dividend income is recognised when the right to receive dividend is obtained. Royalties are recognised in accordance with the substance of the relevant agreement, generally on an accrual basis.
LeasesAny lease agreements in which the risks and rewards associated with ownership have been essentially transferred to the related company are classified as a finance lease. Other leased assets where owner-ship is retained by the lessor are classified as operating leases.
Volvo Car Group as lessorVolvo Car Group currently has no finance leases as a lessor per the closing date. Transactions that include repurchase agreements (see above section Revenue recognition) are recorded as operating leases. Operating lease contracts with a term of twelve months or less are classified as inventory. Assets related to contracts with a term exceed-ing twelve months are classified as tangible assets as assets under operating lease.
Revenue from operating leases is recognised on a straight-line basis over the leasing period. Depreciation of the asset occurs on a straight-line basis under the terms of the commitment and the residual values are adjusted to conform to the estimated realisable value when the commitment expires. The estimated realisable value at the com-mitment termination is evaluated continuously.
Volvo Car Group as lesseeIn the case of finance leases, the asset is recognised at the inception of the lease period as a current or non-current asset at the lower of fair value or the present value of the minimum lease payments. The asset is depreciated using the straight-line method over the asset’s useful life or over the term of the lease if this is shorter. The commitment to pay future lease payments are discounted to net present value and recorded as a current or non-current liability in the balance sheet. The lease payments made are allocated between amortisation of liabilities and interest expense.
For operating leases, i.e., when the risks and rewards associated with the ownership of the asset have not been transferred to Volvo Car Group, lease and rental payments are expensed as arised on a straight-line basis over the lease contract period.
NOTES TO THE CONSOLIDATED FINANCIAL STATEMENTS
VOLVO CAR GROUP | ANNUAL REPORT 2016 89ANNUAL REPORT 2016 | VOLVO CAR GROUP

As stipulated in IFRIC 4, an arrangement that is not in the legal form of a lease is still accounted for as a lease, if the arrangement conveys the right to control the use of the underlying asset.
Government grantsA government grant is recognised when there is reasonable assurance that Volvo Car Group will comply with the conditions attached to the grant and that the grant will be received. Government grants are recorded in the financial statements in accordance with their purpose, either as reduction of expense or a reduction of the cost of the capital investment. Government grants are recognised in the income state-ment on a systematic basis over the periods necessary to match them with the related expenses that they are intended to compensate. Gov-ernment grants related to assets are deducted from the carrying amount of the asset and are recognised in the Income statement over the life of a depreciable asset as a reduced depreciation expense. In cases where the received government grant is not intended to com-pensate any expenses or acquisition of assets the grant is recognised as other income. Government grants for future expenses are recorded as deferred income.
Income taxesVolvo Car Group’s tax expense consists of current tax and deferred tax. Taxes are recognised in the income statement except when the underlying transaction is recognised directly in equity or other com-prehensive income, whereupon related taxation is also recognised in equity or other comprehensive income.
Current tax is tax that must be paid or will be received for the current year. Current tax also includes adjustments to current tax attributable to previous periods.
Deferred tax is calculated according to the balance sheet method for all temporary differences, with the exception of goodwill, that arise between the tax value and the carrying amount of assets and liabili-ties. Deferred tax assets and liabilities are measured at the nominal amount and at the tax rates that are expected to apply when the asset is realised or the liability is settled, using the tax rates and tax rules that have been enacted or substantively enacted at the balance sheet date.
Deferred tax assets relating to deductible temporary differences and loss carry-forwards are recognised to the extent it is probable that they will be utilised in the future. Deferred tax assets and deferred tax liabilities are offset when they are attributable to the same taxation authority on either the same taxable entity or different taxable entities where there is an intention to settle the balances on a net basis and the affected company has a legally enforceable right to offset tax assets against tax liabilities.
Tax laws in Sweden and in certain other countries allow companies to defer tax payments through allocation to untaxed reserves. These items are treated as temporary differences in the consolidated bal-ance sheet where the untaxed reserves are divided between deferred tax liability and equity. In the consolidated income statement an alloca-tion to, or withdrawal from, untaxed reserves is divided between deferred taxes and net income for the year.
Classification of current and non-current assets and liabilities An asset is classified as a current asset when it is held primarily for the purpose of trading, is expected to be realised within twelve months after the balance sheet date or consists of cash or cash equivalents, provided it is not subject to any restrictions. All other assets are clas-sified as non-current assets. A liability is classified as a current liability when it is held primarily for the purpose of trading or is expected to be settled within twelve months after the balance sheet date. All other liabilities are classified as non-current liabilities.
Non-current assets held for sale and discontinued operations Volvo Car Group applies IFRS 5, Non-current Assets Held for Sale and Discontinued Operations. When the criteria for being classified as a
non-current asset held for sale are fulfilled and the asset or group of assets are of significant value, the asset or group of assets and the related liabilities are recognised on a separate line in the balance sheet. The asset or group of assets are tested for impairment and, if impaired, measured at fair value after deductions for selling expenses. As of December 31 2016, there are no such assets.
Intangible assetsAn intangible asset is recognised when the asset is identifiable, the Volvo Car Group controls the asset and it is expected to yield future economic benefits. Intangible assets comprise product development, licenses and patents, trademarks, goodwill, dealer network and invest-ments in IT-systems and software. Intangible assets such as trade-marks, goodwill and dealer networks are normally identified and meas-ured at fair value in connection with business combinations.
Both acquired and internally generated intangible assets are recog-nised at acquisition cost, less accumulated amortisation (with the exception of goodwill and trademark) and any impairment loss. When applicable, internal costs directly related to the development of intan-gible assets are included in the value of the intangible asset. Borrow-ing costs are included in the cost of assets that take a substantial period of time to get ready for its intended use. Subsequent expendi-ture on intangible assets increases the cost only if it is likely that the Volvo Car Group will have future economic benefit from the subse-quent expenditure. All other subsequent expenditure is recognised as an expense in the period in which it is incurred.
Capitalised product development costsVolvo Car Group’s research and development activities are divided into a concept phase and a product development phase. Costs incurred during the concept phase are normally research costs for developing new products at an early stage, where the outcome of the project is still uncertain and where for example different options and alternatives are still evaluated. Research costs during the concept phase are expensed as incurred.
When a research and development project has developed to the extent that there is a definable future product that are assessed to gen-erate future economic benefits, the project is considered to be in the development phase. In practise, this means that capitalisation of costs starts at the time a project reaches Program Approval. Costs for develop-ment of new products, production systems and software are recognised as an asset if certain conditions under IAS 38 – Intangible Assets are met. Capitalised development costs comprise all expenditures that can be directly attributed to the development phase and that serve to prepare the asset for use. All other development costs are expensed as incurred.
Development costs previously recognised as an expense are not recognised as an asset in a subsequent period.
Development costs incurred by the Volvo Car Group that are con-tractually shared with other parties and where the Volvo Car Group remain in control of a share of the developed product, either through a license or through ownership of patents, are accounted for as intangi-ble assets, reflecting the relevant proportion of Volvo Car Group inter-ests, to the extent they are: part of the asset controlled by the Volvo Car Group, are incurred in the product development phase and the conditions for capitalisation are met.
Development costs that are incurred on behalf of another party, charged to the other party including a margin, and do not constitute the share of the developed product controlled by the Volvo Car Group are accounted for as service revenue. The revenue is presented as Other operating income in the income statement since it is not consid-ered part of the course of the ordinary activities of the Group, such as are presented in the item Net revenue. Development costs that will be charged to another party as other operating income are accounted for as R&D expenses. The income from the development services con-tract is recognised through the percentage of completion method. The degree of completion is based on costs incurred to date.
NOTES TO THE CONSOLIDATED FINANCIAL STATEMENTS
90 VOLVO CAR GROUP | ANNUAL REPORT 2016
Amortisation methods for intangible assetsIntangible assets with definite useful life are amortised on a straight-line basis in the income statement over their respective expected use-ful life and are tested for impairment whenever there is an indication that the intangible asset may be impaired. The amortisation period for contractual rights such as licenses does not exceed the contract period. All intangible assets are considered to have a definite useful life, with the exception of goodwill and trademarks. Trademarks are assumed to have indefinite useful lives since the Volvo Car Group has the right and the intention to continue to use the trademarks for the foreseeable future, while generating net positive cashflows for the Volvo Car Group.
The useful lives are to a large extent based on historical experience, expected application as well as other individual characteristics of the asset. The following useful lives are applied:
Dealer network 30 years
Software, mainframe 8 years
Product development costs 3–10 years
Patents, licences and similar rights 3–10 years
Software, PC 3 years
Amortisation is included in cost of sales, research and development expenses as well as selling or administrative expenses depending on where the assets have been used.
Property, plant and equipmentThe Volvo Car Group applies the cost method for measurement of tangible assets. Cost includes expenditure that can be directly attrib-uted to the acquisition. Borrowing costs are included in the acquisition value of an asset that takes more than twelve months of time to get ready for its intended use or sale, a so called qualifying asset. Tangible assets are recognised at acquisition cost, less accumulated deprecia-tion and potential impairment loss.
Subsequent expenditure on property, plant and equipment increases the acquisition value only if it is probable that the Volvo Car Group will have future economic benefit from the subsequent expend-iture. Carrying amount of the replaced part is derecognised. All other repairs and maintenance are charged to the income statement during the financial period in which they are incurred.
Depreciation methods for tangible assetsDepreciation according to plan is based on the acquisition value. Tan-gible assets are systematically depreciated over the expected useful life of the asset.
Each part of an item of property, plant and equipment, with a cost that is significant in relation to the total cost of the item, is depreci-ated separately when the useful life for the part differs from the use-ful life of the other parts of the item. Land is assumed to have an indefinite useful life and is not depreciated. The following useful lives are applied:
Buildings 14.5–50 years
Land improvements 30 years
Machinery 8–30 years
Equipment 3–20 years
Depreciation is included in cost of sales, research and development expenses as well as selling or administrative expenses depending on where the assets have been used.
Impairment of assetsThe carrying amounts of intangible and tangible assets as well as all shareholding investments are tested regularly to assess whether there is an indication of impairment. Intangible assets that have an indefinite useful life, as well as assets that are not yet available for use, are not
subject for amortisation and are tested for impairment annually or whenever there is an indication of decline in value. The carrying amount of tangible and intangible assets with definite useful lives is tested whenever events or changes in circumstances indicate that the value of the asset is reduced and there might be an impairment loss.
In performing this impairment test, the asset’s recoverable amount is calculated. The recoverable amount is the higher of an asset’s fair value less costs to sell or value in use. Value in use is defined as the present value of the future cash flows expected to be derived from an asset. For the purpose of assessing impairment, assets are grouped in cash-generating units (CGUs).
When an indication of impairment is confirmed, an impairment loss is recognised to the extent that the carrying amount exceeds its recov-erable amount. Previously recognised impairment loss is reversed, with the exception of goodwill, if reasons for the earlier impairment no longer exist. An impairment loss is reversed only to the extent that the asset’s carrying amount after reversal does not exceed the carrying amount, net of amortisation, which would have been reported if no impairment loss had been recognised in prior years.
Financial assets and liabilitiesFinancial instruments are any form of contract that gives rise to a financial asset in one company and a financial liability or equity instru-ment in another company. For further information regarding financial instruments see Note 21 – Financial risks and financial instruments.
Financial assets in the consolidated balance sheet encompass interest-bearing investments (marketable securities), trade receiva-bles, other financial assets, derivative assets and cash and cash equiv-alents. Derivative instruments include forwards, options and swaps used to cover exposure for currency risks, interest risks and price fluc-tuations on electricity.
Financial liabilities in the consolidated balance sheet mostly consist of liabilities to credit institutions, issued bonds, trade payables, other financial liabilities and derivative liabilities, including issued warrants related to share-based incentive program (see Note 9 – Employees and remuneration).
Classification of financial assets and liabilitiesThe Group classifies its financial assets in below categories. Classifi-cation takes place at initial recognition. • Financial assets carried at fair value through profit and loss• Loans & receivables• Held to maturity investments. Currently there are no such assets
within Volvo Car Group.• Available–for-sale assets. Refers to Other long-term securities hold-
ings, MSEK 79 (15). Recorded at cost with reference to IAS 39 AG 81.
The Group classifies its financial liabilities in below categories. Clas-sification takes place at initial recognition • Financial liabilities carried at fair value through profit and loss• Other financial liabilities
Initial recognition and final derecognition of financial assets and liabilitiesFinancial assets and liabilities are recognised in the balance sheet when the Volvo Car Group becomes a party to the contractual terms and conditions, i.e at the transaction date.
A financial asset or a portion of a financial asset is derecognised in the balance sheet when all significant risks and benefits linked to the asset have been transferred to a third party. Where Volvo Car Group concludes that all significant risks and benefits have not been trans-ferred, the portion of the financial assets corresponding to Volvo Car Group’s continuous involvement continues to be recognised.
A financial liability or a portion of a financial liability is derecognised from the balance sheet when the obligation in the contract has been fulfilled, cancelled or has expired.
NOTES TO THE CONSOLIDATED FINANCIAL STATEMENTS
VOLVO CAR GROUP | ANNUAL REPORT 2016 91ANNUAL REPORT 2016 | VOLVO CAR GROUP
Financial assets are initially recognised at fair value plus transaction costs, except for those financial assets carried at fair value through the income statement. Financial assets carried at fair value through the income statement are initially recognised at fair value, and transaction costs are expensed in the income statement.
Financial liabilities are initially recognised at fair value less transac-tion costs, except for those financial liabilities carried at fair value through the income statement. Financial liabilities carried at fair value through the income statement are initially recognised at fair value, and transaction costs are expensed in the income statement.
Invoiced sales are sometimes subject to contracts for factoring with a third party (bank or financial institution). This enables Volvo Car Group to receive payment for its accounts receivable within a few days after billing and thus free liquidity at an earlier stage. If the criteria for derecognition of accounts receivable are not fulfilled, the receivable remains on the balance sheet.
Financial assets and liabilities carried at fair value through profit and lossIn Volvo Car Group’s balance sheet, financial instruments reported at fair value through profit or loss consists of derivatives, including issued warrants related to share-based incentive program (see Note 9 – Employees and remuneration), and marketable securities.
Changes in fair value of these instruments are recognised in the income statement. Based on the purpose of the contract, changes in fair value are reported either under operating income/expense or as financial income/expense. If a derivative instrument has been desig-nated to a hedge accounting relationship, changes in fair value are reported either in profit or loss or in consolidated comprehensive income, depending on the substance of the hedge. In the case of cash flow hedges, changes in fair value are reported in consolidated com-prehensive income as long as there is no underlying receivable/paya-ble recorded in the balance sheet. Derivatives with positive fair values (unrealised gains) are recognised as other current, or non-current assets. Derivatives with negative fair values (unrealised losses) are recognised as other current, or non-current liabilities.
Fair value is generally determined by reference to official market quotes in an active market. When market quotes are not available the fair value is determined using generally accepted valuation methods such as discounted future cash flows.
Financial instruments are classified within level 1–3 based on the degree that market data have been utilised when measuring fair value. All financial instruments measured at fair value held by Volvo Car Group are classified as level 2, for further details see Note 21 – Finan-cial risks and financial instruments. In level 2, valuation of financial instruments is based on market conditions using quoted market data existing at each balance sheet date. For these financial instruments no quoted prices on identical instruments in active markets exist.
Loans & receivablesNon-derivative financial assets with fixed or determinable payments that are not quoted in an active market, for example accounts receiv-able and loan receivables, are assigned to this category. Cash and cash equivalents are also assigned to this category.
Loans and receivables are recognised in the balance sheet at fair value plus transaction costs and subsequently measured at amortised cost. Amortised cost is calculated using the effective interest method, where any premiums or discounts and directly attributable transaction costs are capitalised over the contract period using the effective inter-est rate. Accounts receivable are recognised at the amount expected to be received, i.e. after deduction of bad debts allowance. A bad debt allowance is incurred when there has been a triggering event for the customer’s inability to pay. The bad debts on accounts receivable are recognised as operating expenses.
Other financial liabilitiesFinancial liabilities to credit institutions, issued bonds, trade payables and other financial liabilities are assigned to this category. These liabilites are reported as either current or non-current liabilites.
Other financial liabilities are recognised in the balance sheet at fair value less transaction costs and subsequently measured at amortised cost. Amortised cost is calculated using the effective interest method, where any premiums or discounts and directly attributable transaction costs are capitalised over the contract period using the effective inter-est rate.
Hedge accountingIn applying hedge accounting, derivatives are initially recognised at fair value at trade date and subsequently re-measured at fair value. The Group designates certain derivatives as either: a) Fair value hedges: a hedge of the fair value of recognised liabilities;b) Net investment hedges: a hedge of a net investment in a foreign
operation;c) Cash flow hedges: a hedge of currency risk in future commercial
cash flows.Hedge accounting is adopted for derivative instruments that are
included in a documented hedge relationship. For hedge accounting to be applied, a direct connection between the hedge and the hedged item is required. At the inception of the hedge, the Group documents the relationship between hedging instruments and hedged items, as well as its risk management objectives and strategy for undertaking various hedging transactions. The Group also documents its assess-ment, both at hedge inception and on an ongoing basis, of whether the derivatives that are used in hedging transactions are highly effective in offsetting changes in fair values or cash flows of the hedged items.
The fair value of a hedging derivative is classified as a non-current asset or liability when the remaining maturity of the derivative instru-ment is more than 12 months, and as a current asset or liability when the remaining maturity of the hedged item is less than 12 months.
a) Fair value hedgesThe purpose of fair value hedges is to hedge the variability in the recorded fair value adjustment of fixed-rate debt (issued bond) from changes in the relevant benchmark yield curve for its entire term by converting fixed interest payments to a floating rate (e.g. STIBOR or LIBOR) by using interest rate swaps (IRS). The credit risk is not hedged. The fixed leg of the IRS is matched against the cash flows of the hedged loan/bond. Hereby, the fixed-rate bond is converted into a floating-rate debt. Changes in the fair value of derivatives that are des-ignated and qualify as fair value hedges are recorded in the income statement, together with any changes in the fair value adjustment related to the interest component of the hedged liability (issued bond) that are attributable to the hedged risk, when hedge accounting is applied. The Group only applies fair value hedge accounting for hedg-ing fixed interest risk on borrowings. Both gains and losses relating to the interest rate swaps hedging fixed rate borrowings and the changes in the fair value of the hedged fixed rate borrowings attributable to interest rate risk are recognised in the income statement within Finan-cial expenses. If the hedge no longer meets the criteria for hedge accounting, the adjustment to the carrying amount of a hedged item for which the effective interest method is used is amortised to the income statement over the remaining period to maturity.
b) Net investment hedgesVolvo Car Group applies hedge accounting of net investments in for-eign operations. Hedging of net investments in foreign operations refers to hedges held to reduce the effect of changes in the value of a net investment in a foreign operation due to changes in foreign exchange rates. The foreign currency gains and losses on hedging
NOTES TO THE CONSOLIDATED FINANCIAL STATEMENTS
92 VOLVO CAR GROUP | ANNUAL REPORT 2016
instruments are recognised in the consolidated comprehensive income. A gain or loss relating to an ineffective portion is recognised immedi-ately in the income statement within Financial income or expense.
In the event of a divestment, the accumulated result from the hedge is immediately transferred from the hedge reserve in equity to the income statement. For further information regarding accounting treat-ment related to foreign currency, see section Foreign currency. See also Note 21 – Financial risks and financial instruments for more infor-mation regarding financial instruments.
c) Cash flow hedgesHedge accounting is applied for derivative instruments that are acquired for the purpose of hedging expected future commercial cash flows in foreign currencies against currency rate risks. In cash flow hedge accounting, the derivative is recognised in the balance sheet at fair value, and changes in the fair value is recognised in consolidated comprehensive income and accumulated in the other reserves in equity. Fair value accumulated in other reserves in equity is recycled to the income statement in the same period as an underlying sales/cost of sales transaction is being entered in the income statement.
The hedging relationship is regularly tested up until its maturity date. If the identified relationships are no longer deemed effective, the fluctuation in fair value on the hedging instrument from the last period the instrument was considered effective is recognised in the income statement. If the hedged transaction is no longer expected to occur, the hedge’s accumulated changes in value are immediately trans-ferred from comprehensive income to the income statement and are included in operating income.
InventoryInventories of raw material, consumables and supplies, semi-manufac-tured goods, work in progress, finished goods and goods for resale are reported in inventories and carried at the lower of cost and net realis-able value at the reporting date. Assets held under operating lease, with a maturity less or equal to twelve months, are also reported as inventory. Costs of inventories comprise costs of purchase, production charges and other expenditures incurred in bringing the inventories to their present location and condition. The cost of inventories of similar assets is established using the first-in, first-out method (FIFO) and is based on the standard cost method. The standard costs are updated annually and adjustments are made at the turn of the model year. Net realisable value is calculated as the selling price in the ordinary course of business less estimated costs of completion and selling costs. For groups of similar products a group valuation method is applied. Physi-cal stock counts are carried out annually or more often where appro-priate in order to verify the records.
Cash and cash equivalentsCash and cash equivalents consist of cash and bank balances as well as short-term liquid investments with a maturity of maximum 90 days, which are subject to an insignificant risk of fluctuations in value. Cash and cash equivalents are stated at nominal value.
EquityAn equity instrument is any contract that evidences a residual interest in the assets of an entity after deducting all of its liabilities.
In 2016, Volvo Car AB (publ.) has issued preference shares, included in equity. Preference shares are equity instruments as long as funda-mental criteria for classification as equity is fulfilled, as stipulated in IAS 32. Preference shares have a preferential status compared to ordinary shares, in terms of priority to dividends and priority to net assets in case of a liquidation. However, preference shares are subordinated to finan-cial liabilities. See further information in Note 23 – Equity.
Group contributions and unconditional shareholders’ contributionsDistributed group contributions to the parent company are recorded in equity, along with the tax effect. Group contributions received from the parent company and the tax effect on these contributions are recog-nised in equity in accordance with the principles for shareholders’ con-tributions.
Unconditional shareholders’ contributions received from the parent company are recognised in equity.
Post-employment benefitsVolvo Car Group has both defined contribution plans and defined ben-efit plans. Under a defined contribution plan, Volvo Car Group pays fixed contributions into a separate external legal entity and will have no legal obligation to pay further contributions if the fund does not hold sufficient assets to pay all employee benefits. The contributions are recognised as employee benefit expenses in the income statement when earned by the employee. Some defined contribution plans com-bine the promise to make periodic payments with a promise of a guar-anteed minimum return on investments. Such plans are accounted for as defined benefit plans.
A defined benefit plan is a pension plan that defines the amount of post-employee benefit an employee will receive upon retirement, usually dependent on one or more factors such as age, years of service and compensation. Volvo Car Group has the obligation for the future bene-fits. For the funded defined benefits plans, the assets have been sepa-rated, with the majority invested in pension foundations. The net pension provision or asset recognised in the balance sheet in respect of defined benefit pension plans is the present value of the defined benefit obli-gation at the balance sheet date less the fair value of plan assets.
The calculation of the present value of defined benefit pension undertakings is performed according to the Projected Unit Credit method, which also considers future earnings. The calculation is per-formed by independent actuaries. The present value of the defined benefit obligation is determined by discounting the estimated future cash outflows using interest rates of high-quality corporate, or when data is not available, government bonds that are denominated in the currency in which the benefits will be paid, and that have terms to maturity approximating to the terms of the related pension liability. The discount rate for the Swedish pension obligation is determined by ref-erence to mortgage bonds. The most important actuarial assumptions are stated in Note 24 – Post-employment benefits.
Actuarial gains and losses arising from experience adjustments and changes in actuarial assumptions are charged or credited to consoli-dated comprehensive income in the period in which they arise. Past service costs are recognised immediately in the income statement when the settlement occurs.
The net interest cost is calculated by applying the discount rate to the net balance of the defined benefit obligation and the fair value of plan assets.
Termination benefits are payable when employment is terminated by the Group before the normal retirement date, or whenever an employee accepts voluntary redundancy in exchange for these benefits. The Group recognises termination benefits at the earlier of the following dates: (a) when the Group can no longer withdraw the offer of those benefits and (b) when the entity recognises costs for a restructuring that is within the scope of IAS 37 and involves payment of termination benefits.
Share-based paymentsVolvo Car Group applies IFRS 2, Share-based payments, for long-term share-based incentive programs (LTVP-program, see also Note 9 – Employee and remunerations). IFRS 2 distinguishes between cash-settled and equity-settled payments. The Volvo Car Group LTVP include a cash-settled part only.
NOTES TO THE CONSOLIDATED FINANCIAL STATEMENTS
VOLVO CAR GROUP | ANNUAL REPORT 2016 93ANNUAL REPORT 2016 | VOLVO CAR GROUP

The fair value of the cash-settled payments is determined at the grant date, and revalued at each balance sheet date, and is recognised as an expense during the vesting period and as a liability. An assessment whether the terms for allotment will be fulfilled is made continuously. Based on such assessment, expense might be adjusted.
The fair value is based on the share price reduced by dividends con-nected with the share during the vesting period. As Volvo Car Corpora-tion is not listed, no official market value is available. Hence, the LTVP program is based on a synthetic share price derived from variables known to determine the value of an automotive OEM.
Additional social costs are reported as a liability, revalued at each balance sheet date in accordance with UFR 7, issued by the Swedish Financial Reporting Board.
In 2015, another incentive program was implemented. In connection to this a number of members of top management and Board of Direc-tors have been offered to purchase warrants that give a future right to subscribe for shares in the subsidiary Volvo Car Corporation. Conse-quently Volvo Car Corporation issued warrants during 2015. This incentive program has been considered as a cash-settled program. During the duration of the program the participants, at certain prede-termined periods, during 2016 to 2021, have an option to sell the war-rants at fair value to the parent company. The warrants have been acquired by the participants at fair value, why the program will not result in any personnel costs in accordance with IFRS 2.
The fair value of the warrants in this cash-settled program is deter-mined at the grant date, and is recognised as a financial liability. The liability is revalued at each balance sheet date and changes of the fair value is recognised in the income statement as a financial expense or income. For further information about the share-based payment pro-gram see Note 9 – Employee and remuneration.
ProvisionsProvisions are recognised in the balance sheet when a legal or con-structive obligation exists as a result of a past event and it is deemed more likely than not that an outflow of resources will be required to settle the obligation and the amount can be reliably estimated. The amount recognised as provision is the best estimate of the expendi-ture required to settle the present obligation at the balance sheet date. Provisions are regularly reviewed and adjusted as further information becomes available or circumstances change.
If the effect is material, non-current provisions are recognised at present value by discounting the expected future cash flows at a pre-tax rate reflecting current market assessments of the time value of money. The discount rate does not reflect such risks that are taken into consideration in the estimated future cash flow.
Revisions to estimated cash flows (both amount and likelihood) are allocated as operating cost. Changes to present value due to the pas-sage of time and revisions of discount rates to reflect prevailing cur-rent market conditions are recognised as a financial cost.
Warranty provisions include the Group’s cost of satisfying the cus-tomers with specific contractual warranty obligations, as well as other costs not covered by contractual commitments. All warranty provisions are recognised at the sale of the vehicles or spare parts. The initial calculations of the reserves are based on historical warranty statistics considering known quality improvements, costs for remedy of defaults etc. The provisions for campaigns booked at point of sale are adjusted as campaign decisions for specific quality problems are made. On a quarterly basis the provisions are adjusted to reflect latest available data such as actual spend, exchange rates, discounting rates etc. The provisions are reduced by virtually certain warranty reimbursements from suppliers.
Contingent liabilitiesWhen a commitment does not meet the criteria for recognition of a liability or provision in the balance sheet it may be disclosed as a con-tingent liability. These possible obligations derive from past events and
their existence will be confirmed only when one or several uncertain future events, which are not entirely within the Volvo Car Group’s con-trol, take place or fail to take place. A contingent liability could also exist for a present obligation where an outflow of resources is not likely or when the amount of the obligation cannot be measured with sufficient reliability.
Changes in accounting principles and disclosuresNew accounting principles for 2016There are no new accounting principles and interpretations that came into effect as of January 1, 2016 that significantly effect the Volvo Car Group’s financial statements.
New accounting principles for 2017 and later When preparing the consolidated financial statements as of December 31, 2016, a number of standards, interpretations and amendments have been published, but have not yet become effective.
IFRS 9 – Financial instrumentsIFRS 9 is divided into three parts: Classification and Measurement, Impairment and Hedge Accounting, and will replace the current stand-ard IAS 39. IFRS 9 establishes three primary measurement categories for financial assets: amortised cost, fair value through consolidated comprehensive income and fair value through profit and loss. The basis for classification depends on the entity’s business model and the contractual cash flow characteristics of the financial asset. For finan-cial liabilities the only change relates to recognition of changes in own credit risk in consolidated comprehensive income, for liabilities desig-nated at fair value through profit and loss. IFRS 9 aborts the hedge effectiveness tests. Instead, there is a requirement of an economic relationship between the hedged item and hedging instrument and for the ‘hedged ratio’ to be the same as the one management actually uses for risk management purposes. The standard was endorsed by the EU in November 2016 and is effective for accounting periods beginning on or after January 1, 2018. Early adoption is permitted.
Volvo Car Group is currently analysing the financial impact of the three parts of IFRS 9 and is yet to assess IFRS 9’s full impact. Our preliminary assessment is that the financial impact of implementation of IFRS 9 will be very limited.
No financial impact is anticipated when it comes to Classification and Measurement, and only insignificant impact is anticipated in terms of Hedge Accounting.
In relation to Impairment, whereas IAS 39 incurred credit losses model is to be replaced by the IFRS 9 expected credit losses model, there will be a very limited effect on the financial statements. In all material aspects, receivables in Volvo Car Group relevant for IFRS 9 impairment analysis is related to accounts receivables with a duration of less than a year. The majority of the accounts receivables is related to transactions with dealers, retailers and distributors, with whom Volvo Car Group has experienced stable business relationships over many years. Customer financing is, in all material aspects, outsourced to independent financing providers, where also the credit risk for the customer financing receivables generally rest.
In addition, Volvo Car Group actively strives to transfer credit risk embedded in accounts receivables to third-party financial institutions in the form of various guarantees, securities and credit insurances. Addi-tionally, invoiced sales are sometimes subject to factoring arrangements with a third party (bank or other financial institution). This enables Volvo Car Group to receive payment for its accounts receivables within a few days after billing and thus free liquidity at an earlier stage, while also transferring the credit risk for the invoices. Occasionally, Volvo Car Group also requires customer prepayment prior to delivery of cars.
These factors, independently or combined, help to explain the very limited historical receivable write-offs (see also Note 20 – Accounts re ceivable and other current assets), and also help to explain why the effects of the IFRS 9 expected loss model is anticipated to be very limited.
NOTES TO THE CONSOLIDATED FINANCIAL STATEMENTS
94 VOLVO CAR GROUP | ANNUAL REPORT 2016
IFRS 15 – Revenue from contracts with customers IFRS 15 represents a new framework for recognising revenue with additional disclosure requirements. The framework establishes princi-ples about the nature, amount, timing and uncertainty of revenue and cash flow arising from an entity’s contracts with customers. Revenue is recognised when a customer obtains control of a good or service and thus has the ability to direct the use and obtain the benefits from the good or service. IFRS 15 will replace the current standards IAS 11 Construction contracts and IAS 18 Revenue. The standard was endorsed by the EU in September 2016 and is effective for accounting periods beginning on or after January 1, 2018. Early adoption is per-mitted, though Volvo Cars will not apply IFRS 15 until January 1, 2018. Volvo Car Group has analysed all material revenue streams and reviewed significant contracts with customers, in order to understand the impact on revenue recognition caused by implementation of IFRS 15. As a backbone for the analysis, IFRS 15 five-step model has been used, whereby areas like bundle of goods and services, identification of performance obligations, repurchase agreements, variable consid-erations and timing of transfer of control to customer have been included in the analysis, areas that are relevant to consider for Volvo Car Group in an IFRS 15 review.
Based on our review procedures, our preliminary assessment is that the financial impact of implementation of IFRS 15 will be limited. Full IFRS 15 impact is yet to be concluded upon.
IFRS 16 – Leases IFRS 16 was published in January 2016 and is effective for accounting periods beginning on or after January 1, 2019. The standard has not yet been endorsed by the EU. It replaces current leasing accounting standard, IAS 17 Leases. The new standard provides guidance for les-see accounting on how to bring lease commitments, previously treated off balance, onto the balance sheet. Volvo Car Group is yet to assess the impact of IFRS 16.
In addition to IFRS 9, 15 and 16, there are amendments to IFRS standards not yet effective. These are not expected to have a material impact on the Group.
NOTE 2 – CRITICAL ACCOUNTING ESTIMATES AND JUDGEMENTS
Preparation of the financial statements in accordance with IFRS requires the Company’s Executive Management and Board of Direc-tors to make estimations and assessments as well as to make assump-tions that affect application of the accounting principles and the reported assets, liabilities, income and expenses. Estimates are, typi-cally, based on historical experience and assumptions that are deemed reasonable and realistic in the circumstances. The results of these estimations and assessments are used to establish the reported val-ues of assets and liabilities that are not otherwise clearly documented from other sources. The actual outcome may differ from these esti-mates and assessments. The estimates and underlying assumptions are reviewed on a regular basis. Changes are recognised in the period of the change and future periods if the change affects both. The esti-mations and assessments described below are those that are deemed to be the most important for an understanding of Volvo Car Group’s financial reports, taking into account the degree of materiality and uncertainty. Changes in estimates used in these and other items could have a material impact on Volvo Car Group’s financial statements.
Residual value guarantees and repurchase agreementsIn the course of its operations, Volvo Car Group is exposed to residual value risks partly through sales to external rental companies combined with repurchase agreements and partly through sales subject to resid-ual value guarantees.
Residual value risks are reflected in different ways in the consolidated financial statements depending on the extent to which the risk of a sold car remains with the Group. In cases where significant risks per-taining to vehicles remain with Volvo Car Group, which may be the case when the sale of vehicles is combined with a repurchase agreement (the right, or in a few cases the obligation, for Volvo Car Group to buy back the car), the vehicles are recognised in the balance sheet as assets under operating leases or inventory, depending on the maturity of the lease contract. Accumulated depreciation on these vehicles reduces the value of the vehicles from their original acquisition value to their expected residual value, being the estimated net realisable value, at the end of the lease term. See Note 1 – Accounting principles for a description of Volvo Car Group’s revenue recognition policy relat-ing to operating lease contracts.
Vehicles sold to an external party, subject to a subsequent issuance of a residual value guarantee to an independent financing provider, are derecognised from the balance sheet, provided that significant risks related to the vehicle has been transferred to the customer. A provi-sion is recorded for the residual value risk related to the guarantee.
In both these cases, estimated residual value is based upon estima-tions of the used products’ future net realisable values. The estimated net realisable value of the products at the end of the commitment is monitored individually on a continuing basis and is estimated by evalu-ating recent car auction values, future price deterioration due to expected change of market conditions, marketing incentive plans, vehicle quality data and repair and reconditioning costs etc. High inventories in the vehicle industry and low demand may have a nega-tive impact on the prices of new and used vehicles. A decline in prices of the vehicles may negatively affect the consolidated income.
Deferred tax assets The calculation of deferred tax assets requires assumptions to be made with regard to the level of future taxable income and the timing of recovery of deferred tax assets. These assumptions take into con-sideration forecasted taxable income. The measurement of deferred tax assets is subject to uncertainty and the actual result may diverge from judgements due to future changes in business climate, altered tax laws, etc. An assessment is made at each closing date of the likeli-hood that the deferred tax asset will be utilised. If needed the carrying amount of the deferred tax asset will be altered. The judgements that have been made may affect net income both positively and negatively. See Note 15 – Taxes for the presentation of carrying values and fur-ther information on deferred tax assets.
Impairment, amortisation and depreciation of non-current assets Volvo Car Group has substantial values reported in the balance sheet as tangible as well as intangible non-current assets. Tangible and intangible assets with a definite useful life are depreciated on a straight-line basis over their estimated useful lives; see Note 1 – Accounting principles. Management regularly reassesses the useful life of all significant assets. If circumstances change such that the estimated useful life has to be revised, additional depreciation expense could be the result in future periods.
The carrying amounts of non-current tangible and intangible assets are tested for impairment in accordance with the accounting principles described in Note 1 – Accounting principles. An impairment is recog-nised if the carrying value of the asset exceeds the recoverable amount. The recoverable amount is the higher of the asset’s net selling price and its value in use. For these calculations, certain estimations must be made regarding future cash flows, required return on invest-ments and other adequate assumptions. The estimated future cash flows are based on assumptions that represent management’s best estimate of the economic conditions that will exist during the asset’s remaining lifetime, and are based on internal business plans or fore-
NOTES TO THE CONSOLIDATED FINANCIAL STATEMENTS
VOLVO CAR GROUP | ANNUAL REPORT 2016 95ANNUAL REPORT 2016 | VOLVO CAR GROUP

casts. Future cash flows are determined on the basis of long-term planning, which is approved by Management and which is valid at the date of preparation of the impairment test. This planning is based on expectations regarding future market share, the market growth as well as the products’ profitability. See Note 16 – Intangible assets and Note 17 – Tangible assets for the presentation of carrying values and fur-ther information of impairment of non-current assets.
Post-employment benefitsThe value of pension obligations for defined benefit obligations is determined through actuarial calculations performed by independent actuaries based on assumptions about the discount rate, future salary increases, inflation, mortality rates and demographic conditions. Changes in these assumptions affect the calculated value of the post-employee benefits obligations. The discount rate, which is the most critical assumption, is based on market return on high-quality corpo-rate or government bonds that are denominated in the currency in which the benefits will be paid and with maturities corresponding to the related pension liability. The discount rate for the Swedish pension obligation is determined by reference to mortgage bonds. A lower dis-count rate increases the present value of post-employee benefits obli-gations while a higher discount rate has the reverse effect. Changing market and economic conditions may lead to significant changes in post-employment benefit obligations. See Note 24 – Post- employ-ment benefits for the presentation of carrying values and further infor-mation on pension provisions.
InventoriesInventories are measured at the lower of cost, less deductions for any obsolescence, and their net realisable value. Net realisable value is based on the most reliable evidence of the amount the Volvo Car Group expects to realise from vehicles and components on future sales trends or needs (for components) and also takes into account items that are wholly or partially obsolete. A future unexpected wors-ening in market conditions could result in an adjustment in future expected sales, requirements and in estimated selling prices assump-tions, which may require an adjustment to the carrying amount of inventories. See Note 19 – Inventories for the presentation of carrying values and further information of inventories.
Warranties The recognition and measurement of provisions for product warranties is generally connected with estimates. Estimated costs for product warranties are charged to cost of sales when the products are sold. Estimated warranty costs include contractual warranty, warranty cam-paigns (recalls and buy-backs) and warranty cover in excess of con-tractual warranty or campaigns, which is accepted as a matter of policy or normal practice in order to maintain a good business relation with the customer. Warranty provisions are estimated based on historical claims statistics and the warranty period. Quality index improvements based on historical patterns have been reflected in all categories of warranty. Refunds from suppliers that decrease Volvo Car Group’s warranty costs are recognised to the extent these are considered to be virtually certain. See Note 25 – Current and other non-current pro-visions for presentation of carrying values and further information of warranty provisions.
Legal proceedingsCompanies within the Volvo Car Group may at times be involved in legal proceedings. Such proceedings may cover a range of different matters in various jurisdictions. These include, but are not limited to, commercial disputes such as alleged breach of contract, insufficient supplies of goods or services, product liability, patent infringement or infringement of other intangible rights. The various matters raised are often of a difficult and complex nature and often legally complicated. It is therefore difficult to predict the final outcome of such matters. The companies within Volvo Car Group work closely with legal advisors and other experts in the various matters in each jurisdiction. A provision is made when it is determined that an adverse outcome is more likely than not and the amount of the loss can be reasonably estimated. In instances where these criteria are not met, a contingent liability has been disclosed provided the risk qualifies as such liability. See Note 29 – Contingent liabilities for disclosure of values related to legal claims.
Tax processes Volvo Car Group is, like other global companies, at times involved in tax processes of varying scope and in various stages. These tax processes are evaluated regularly and provisions are made according to the accounting principles, i.e., when it is more likely than not that additional tax must be paid and the outcome can be reliably estimated. If it is not probable that the additional tax will be paid but the risk is more than remote, such amounts are shown as contingent liabilities. See Note 29 – Contingent liabilities for disclosure of values related to tax claims.
NOTES TO THE CONSOLIDATED FINANCIAL STATEMENTS
96 VOLVO CAR GROUP | ANNUAL REPORT 2016

NOTE 3 – net revenue
The Net revenue allocated to geographical regions: 2016 2015
China 32,499 29,060
US 30,643 25,839
Sweden 23,523 22,997
Western Europe1) 64,166 60,141
of which Germany 12,930 10,824
of which United Kingdom 12,081 12,200
Other markets 29,841 26,006
of which Russia 2,212 2,557
of which Japan 5,222 3,897
Total 180,672 164,043
1) Austria, Belgium, Denmark, Finland, France, Germany, Greece, Ireland, Italy, Netherlands, Norway, Portugal, Spain, Switzerland and UK.
For each significant category of revenue, see additional information in the Board of Directors report.
NOTE 4 – EXPENSES BY NATURE2016 2015
Material cost incl. freight, distribution and warranty –120,629 –108,587
Personnel –24,686 –21,537
Amortisation/depreciation –10,527 –9,399
Other –15,277 –15,703
Total –171,119 –155,226
Capitalised product development costs as well as received govern-ment grants have reduced the amounts presented as personnel and other. See Note 11 – Government grants.
NOTE 5 – RELATED PARTies
During the year, Group companies entered into the following trading transactions with related parties which are not consolidated in the Volvo Car Group. The information in the table below includes all trading assets and liabilities to related parties. Besides from other non- current liabilities of MSEK 1,383 (941) all assets and liabilities are current.
Sales of goods, services and other
Purchases of goods, services
and other
2016 2015 2016 2015
Related companies1) 1,738 1,034 –1,241 –864
Joint ventures and associated companies 2) 162 105 –926 –616
Receivables Payables
Dec 31, 2016
Dec 31, 2015
Dec 31, 2016
Dec 31, 2015
Related companies1) 3,486 4,213 –3,726 –4,377
Joint ventures and associated companies2) 780 484 –127 –153
1) Related companies are companies outside the Volvo Car Group but within the Geely sphere of companies.
2) For joint ventures and associated companies, see Note 14 – Investments in joint ventures and associates. In 2016, the method of computing sales and purchase transactions from associated companies has been refined, with a similar method being applied to 2015 comparative figures.
Significant related party transactions In August, Volvo Car Group was allowed to close the acquisition of the additional 40 per cent of the shares in Volvofinans Bank AB and thereby increased its ownership from 10 to 50 per cent. The purchase consideration amounted to MSEK 1,849.
In December 2016, Volvo Car Group called an option to acquire the remaining 55 per cent of the shares in its associated company First Rent A Car AB. The finalisation of the transaction depends upon final approvals from relevant authorities, which are expected to be received during the first quarter 2017. Volvo Cars has assessed to have the power of control, from an accounting perspective, of the First Rent A Car Group as of December 31, 2016 and therefore the acquired com-panies are consolidated in the Volvo Car Group. For further information regarding the acquisition, see Note 31 – Business combinations.
Volvo Car Group has entered into agreements with Asia-Europe Automobile Manufacturing (Taizhou) Co., Ltd, the Luqiao plant, that will produce the new range of smaller 40-series CMA-based cars. The Luqiao plant is owned by Zhejiang Geely Holding Group Co., Ltd but will be operated by Volvo Car Group. The agreements cover IT manufactur-ing licenses and service agreements and have resulted in an income of MSEK 298 (87). Furthermore, Volvo Car Group has sold IT licenses and implementation services of after-market systems related to the Luqiao plant to Ningbo Geely Automotive Research & Development Co., Ltd resulting in an income of MSEK 44.
Zhejiang Haoqing Automobile Manufacturing Co., Ltd, a company owned by Zhejiang Geely Holding Group Co., Ltd, conducts final testing of all Volvo vehicles produced in the Chengdu plant by Zhongjia Auto-mobile Manufacturing (Chengdu) Co., Ltd. The vehicles produced in the Chengdu plant are thereafter sold to the Volvo Car Group sales entities in China from Zhejiang Haoqing Automobile Manufacturing Co., Ltd and Zhejiang Haoqing Automobile Manufacturing Co., Ltd is compensated for the cost of performing final testing of the vehicles.
In 2014, Volvo Car Group signed an agreement with London Taxi Co., Ltd, a wholly owned subsidiary to Zhejiang Geely Holding Group Co., Ltd, regarding development, technical support and component sales, which has resulted in an income of MSEK 154 (104).
In 2014, Volvo Car Group entered into an agreement with Ningbo Geely Automotive Research & Development Co., Ltd, a wholly owned subsidiary to Zhejiang Geely Automobile Co., Ltd regarding certain com-mon development activities. Volvo Car Group is working closely with Geely through its wholly owned subsidiary China - Euro Vehicle Technol-ogy AB (CEVT), regarding for example the next-generation C-segment vehicle platform CMA. The accounting principles for these types of agreement are described in Note 1 – Accounting principles, Capitalised product development costs. The agreement has resulted in an income related to sale of licenses of MSEK 175 (188), other income of MSEK 346 (324) and capitalised intangible assets of MSEK 570 (616).
During 2015, Volvo Car Corporation received an unconditional share-holders’ contribution from Shanghai Geely Zhaoyuan International Investment Co., Ltd. Further group contributions to Geely Sweden Hold-ings AB amounted to MSEK – (–11,240) before tax.
Volvo Car Group does not engage in any transactions with Board Members or senior executives except remuneration for services and the share-based program as described in Note 9 – Employees and remuneration.
NOTES TO THE CONSOLIDATED FINANCIAL STATEMENTS
VOLVO CAR GROUP | ANNUAL REPORT 2016 97ANNUAL REPORT 2016 | VOLVO CAR GROUP
NOTE 6 – AUDIT FEES2016 2015
Deloitte
Audit fees –28 –27
Audit-related fees –4 –2
Tax services –2 –1
Other services –8 –14
Total –42 –44
Audit fees involve audit of the Annual Report, financial accounts and the administration by the Board of Directors and the Managing Direc-tors. The audit also includes advice and assistance as a result of the observations made in connection with the audit.
Audit-related fees refer to other assignments to ensure quality in the financial statements including consultations on reporting require-ments and internal control.
Tax services include tax-related consultancy.
All other work performed by the auditor is defined as other services.
NOTE 7 – OTHER OPERATING INCOME AND EXPENSES2016 2015
Other operating income
Licences 239 699
Foreign exchange gain 643 —
Sold services 1,072 770
Other 950 536
Total 2,904 2,005
2016 2015
Other operating expenses
Amortisation and depreciation of intangible and tangible assets –31 –31
Foreign exchange loss — –2,592
Royalty –710 –465
Restructuring costs –5 –3
Property tax –105 –116
Other –1,010 –1,225
Total –1,861 –4,432
For further information, see Note 5 − Related parties. For information regarding the treatment of ineffective hedge contracts, see Note 21 – Financial risks and financial instruments.
NOTE 8 – LEASING
Volvo Car Group as lessorOperational lease contracts with a maturity less or equal to twelve months are recognised as inventory in the balance sheet and mainly relate to vehicles sold with repurchase agreements. The difference between the original sales price and the repurchase price is recog-nised in the income statement as revenue on a straight-line basis over the lease term. The remaining lease revenue yet to be recognised in income is presented as part of current and non-current liabilities in the balance sheet, see Note 26 – Non-current liabilities and Note 27 – Other current liabilities. The repurchase obligation is considered to be a financial liability and is presented as part of current and non-current liabilities. Volvo Car Group does currently not have any finance lease engagements as a lessor.
Future lease revenue of operating lease contracts Rental income 2016 2015
No later than 1 year 917 777
Later than 1 year and no later than 5 years 372 533
Later than 5 years — —
Total 1,289 1,310
Volvo Car Group as lesseeOperating lease contractsThe operating lease contracts Volvo Car Group holds are mainly con-tracts for premises and office equipment around the world. Also some production equipment such as forklifts for the factories are under operating lease contracts.
Operating lease expenses 2016 2015
Minimum lease payments –1,150 –1,101
Contingent rents –67 –70
Less subleases 4 15
Total –1,213 –1,156
Operating lease commitments per Dec 31, 2016
Minimum lease
paymentsLess
subleases Total
Present value of operating
lease commit-ments less subleases
No later than 1 year 1,172 6 1,167 1,154
Later than 1 year and no later than 5 years 2,228 25 2,203 2,015
Later than 5 years 1,403 112 1,290 1,090
Total 4,803 143 4,660 4,259
Finance lease contractsVolvo Car Group holds finance lease contracts for production equip-ment and for some buildings used in production. The assets will be owned by Volvo Car Group at the end of the lease contracts at no additional cost. All leases are fixed terms with fixed payments.
Finance lease assetsBuildings and land
Machinery and
equipment
Acquisition cost
Balance at January 1, 2015 94 9
Effect of foreign currency exchange differences –3 —
Balance at December 31, 2015 91 9
Additions — 68
Effect of foreign currency exchange differences 4 –2
Balance at December 31, 2016 95 75
Accumulated depreciation
Balance at January 1, 2015 –60 –2
Depreciation expense –8 —
Effect of foreign currency exchange differences 2 —
Balance at December 31, 2015 –66 –2
Reclassification –10 —
Depreciation expense — –2
Effect of foreign currency exchange differences –3 —
Balance at December 31, 2016 –79 –4
Net balance at December 31, 2015 25 7
Net balance at December 31, 2016 16 71
NOTES TO THE CONSOLIDATED FINANCIAL STATEMENTS
98 VOLVO CAR GROUP | ANNUAL REPORT 2016
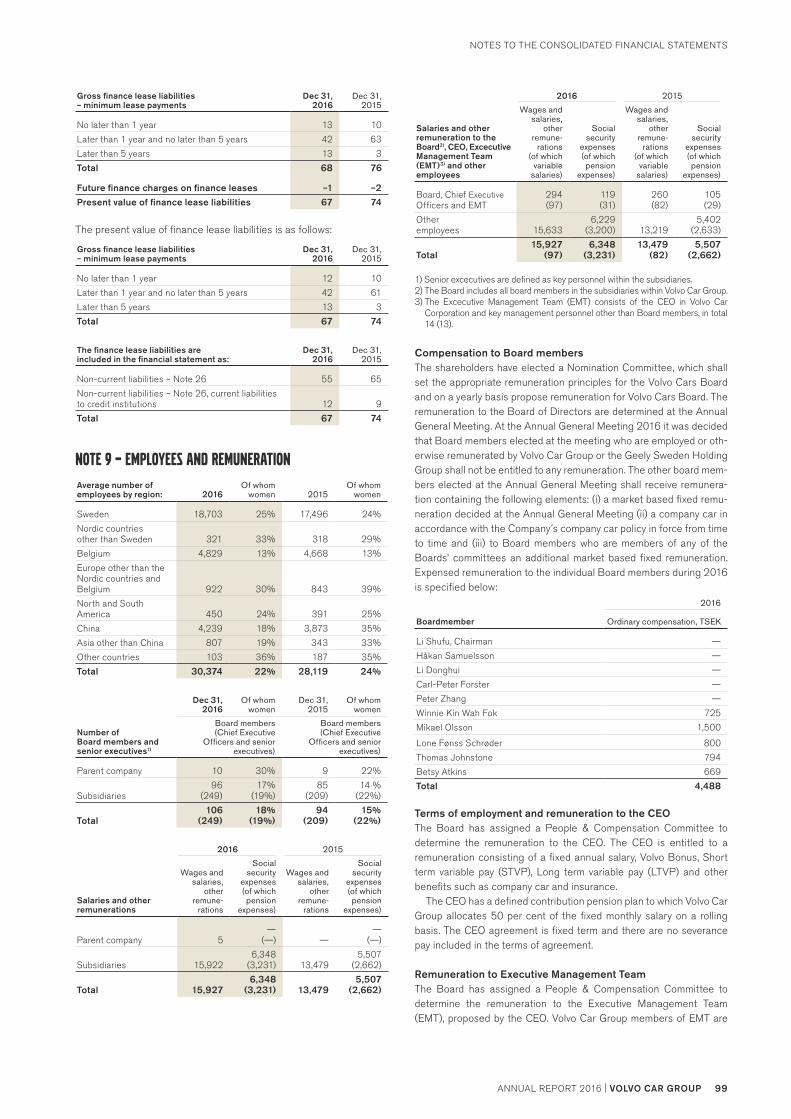
Gross finance lease liabilities – minimum lease payments
Dec 31, 2016
Dec 31, 2015
No later than 1 year 13 10
Later than 1 year and no later than 5 years 42 63
Later than 5 years 13 3
Total 68 76
Future finance charges on finance leases –1 –2
Present value of finance lease liabilities 67 74
The present value of finance lease liabilities is as follows:
Gross finance lease liabilities – minimum lease payments
Dec 31, 2016
Dec 31, 2015
No later than 1 year 12 10
Later than 1 year and no later than 5 years 42 61
Later than 5 years 13 3
Total 67 74
The finance lease liabilities are included in the financial statement as:
Dec 31, 2016
Dec 31, 2015
Non-current liabilities – Note 26 55 65
Non-current liabilities – Note 26, current liabilities to credit institutions 12 9
Total 67 74
NOTE 9 – EMPLOYEES AND REMUNERATION
Average number of employees by region: 2016
Of whom women 2015
Of whom women
Sweden 18,703 25% 17,496 24%
Nordic countries other than Sweden 321 33% 318 29%
Belgium 4,829 13% 4,668 13%
Europe other than the Nordic countries and Belgium 922 30% 843 39%
North and South America 450 24% 391 25%
China 4,239 18% 3,873 35%
Asia other than China 807 19% 343 33%
Other countries 103 36% 187 35%
Total 30,374 22% 28,119 24%
Dec 31, 2016
Of whom women
Dec 31, 2015
Of whom women
Number of Board members and senior executives1)
Board members (Chief Executive
Officers and senior executives)
Board members (Chief Executive
Officers and senior executives)
Parent company 10 30% 9 22%
Subsidiaries 96
(249)17%
(19%)85
(209)14 %
(22%)
Total106
(249)18%
(19%)94
(209)15%
(22%)
2016 2015
Salaries and other remunerations
Wages and salaries,
other remune-
rations
Social security
expenses (of which pension
expenses)
Wages and salaries,
other remune-
rations
Social security
expenses (of which pension
expenses)
Parent company 5—
(—) ——
(—)
Subsidiaries 15,9226,348
(3,231) 13,4795,507
(2,662)
Total 15,9276,348
(3,231) 13,4795,507
(2,662)
2016 2015
Salaries and other remuneration to the Board2), CEO, Excecutive Management Team (EMT)3) and other employees
Wages and salaries,
other remune-
rations (of which
variable salaries)
Social security
expenses (of which pension
expenses)
Wages and salaries,
other remune-
rations (of which
variable salaries)
Social security
expenses (of which pension
expenses)
Board, Chief Executive Officers and EMT
294 (97)
119 (31)
260 (82)
105 (29)
Other employees 15,633
6,229 (3,200) 13,219
5,402 (2,633)
Total15,927
(97)6,348
(3,231)13,479
(82)5,507
(2,662)
1) Senior excecutives are defined as key personnel within the subsidiaries. 2) The Board includes all board members in the subsidiaries within Volvo Car Group.3) The Excecutive Management Team (EMT) consists of the CEO in Volvo Car
Corporation and key management personnel other than Board members, in total 14 (13).
Compensation to Board membersThe shareholders have elected a Nomination Committee, which shall set the appropriate remuneration principles for the Volvo Cars Board and on a yearly basis propose remuneration for Volvo Cars Board. The remuneration to the Board of Directors are determined at the Annual General Meeting. At the Annual General Meeting 2016 it was decided that Board members elected at the meeting who are employed or oth-erwise remunerated by Volvo Car Group or the Geely Sweden Holding Group shall not be entitled to any remuneration. The other board mem-bers elected at the Annual General Meeting shall receive remunera-tion containing the following elements: (i) a market based fixed remu-neration decided at the Annual General Meeting (ii) a company car in accordance with the Company´s company car policy in force from time to time and (iii) to Board members who are members of any of the Boards’ committees an additional market based fixed remuneration. Expensed remuneration to the individual Board members during 2016 is specified below:
Boardmember
2016
Ordinary compensation, TSEK
Li Shufu, Chairman —
Håkan Samuelsson —
Li Donghui —
Carl-Peter Forster —
Peter Zhang —
Winnie Kin Wah Fok 725
Mikael Olsson 1,500
Lone Fønss Schrøder 800
Thomas Johnstone 794
Betsy Atkins 669
Total 4,488
Terms of employment and remuneration to the CEOThe Board has assigned a People & Compensation Committee to determine the remuneration to the CEO. The CEO is entitled to a remuneration consisting of a fixed annual salary, Volvo Bonus, Short term variable pay (STVP), Long term variable pay (LTVP) and other benefits such as company car and insurance.
The CEO has a defined contribution pension plan to which Volvo Car Group allocates 50 per cent of the fixed monthly salary on a rolling basis. The CEO agreement is fixed term and there are no severance pay included in the terms of agreement.
Remuneration to Executive Management TeamThe Board has assigned a People & Compensation Committee to determine the remuneration to the Executive Management Team (EMT), proposed by the CEO. Volvo Car Group members of EMT are
NOTES TO THE CONSOLIDATED FINANCIAL STATEMENTS
VOLVO CAR GROUP | ANNUAL REPORT 2016 99ANNUAL REPORT 2016 | VOLVO CAR GROUP
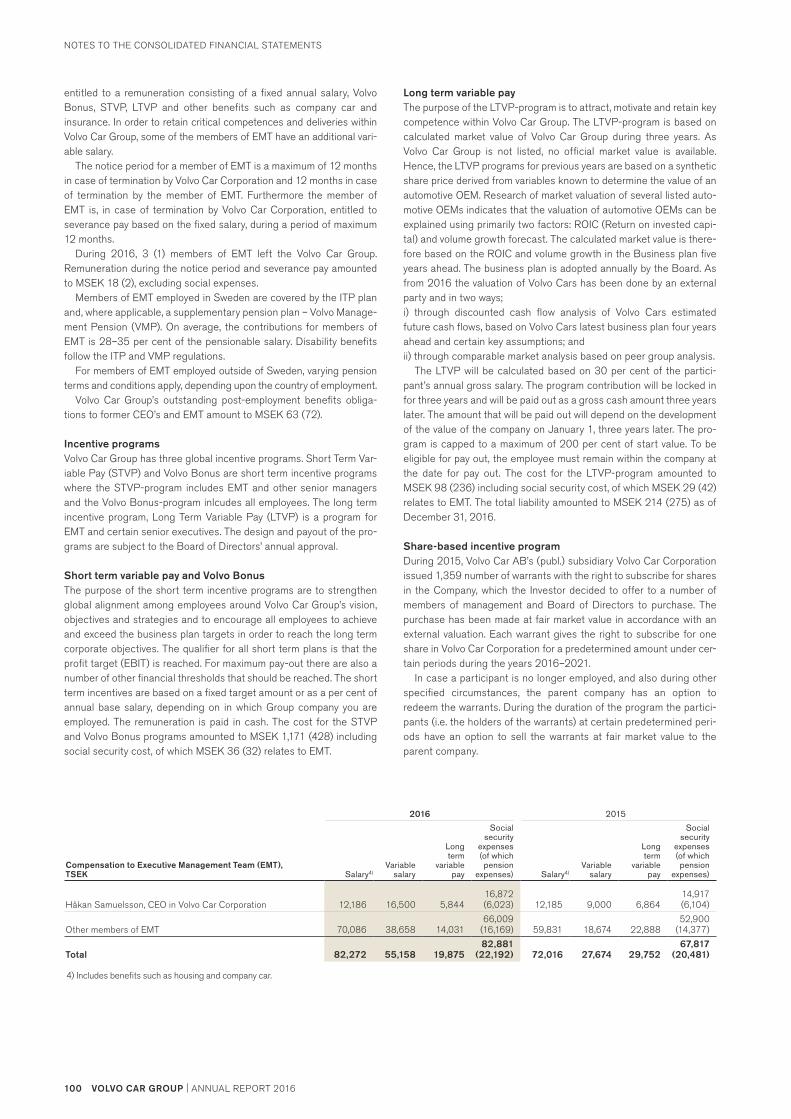
entitled to a remuneration consisting of a fixed annual salary, Volvo Bonus, STVP, LTVP and other benefits such as company car and insurance. In order to retain critical competences and deliveries within Volvo Car Group, some of the members of EMT have an additional vari-able salary.
The notice period for a member of EMT is a maximum of 12 months in case of termination by Volvo Car Corporation and 12 months in case of termination by the member of EMT. Furthermore the member of EMT is, in case of termination by Volvo Car Corporation, entitled to severance pay based on the fixed salary, during a period of maximum 12 months.
During 2016, 3 (1) members of EMT left the Volvo Car Group. Remuneration during the notice period and severance pay amounted to MSEK 18 (2), excluding social expenses.
Members of EMT employed in Sweden are covered by the ITP plan and, where applicable, a supplementary pension plan – Volvo Manage-ment Pension (VMP). On average, the contributions for members of EMT is 28–35 per cent of the pensionable salary. Disability benefits follow the ITP and VMP regulations.
For members of EMT employed outside of Sweden, varying pension terms and conditions apply, depending upon the country of employment.
Volvo Car Group’s outstanding post-employment benefits obliga-tions to former CEO’s and EMT amount to MSEK 63 (72).
Incentive programsVolvo Car Group has three global incentive programs. Short Term Var-iable Pay (STVP) and Volvo Bonus are short term incentive programs where the STVP-program includes EMT and other senior managers and the Volvo Bonus-program inlcudes all employees. The long term incentive program, Long Term Variable Pay (LTVP) is a program for EMT and certain senior executives. The design and payout of the pro-grams are subject to the Board of Directors’ annual approval.
Short term variable pay and Volvo BonusThe purpose of the short term incentive programs are to strengthen global alignment among employees around Volvo Car Group’s vision, objectives and strategies and to encourage all employees to achieve and exceed the business plan targets in order to reach the long term corporate objectives. The qualifier for all short term plans is that the profit target (EBIT) is reached. For maximum pay-out there are also a number of other financial thresholds that should be reached. The short term incentives are based on a fixed target amount or as a per cent of annual base salary, depending on in which Group company you are employed. The remuneration is paid in cash. The cost for the STVP and Volvo Bonus programs amounted to MSEK 1,171 (428) including social security cost, of which MSEK 36 (32) relates to EMT.
Long term variable payThe purpose of the LTVP-program is to attract, motivate and retain key competence within Volvo Car Group. The LTVP-program is based on calculated market value of Volvo Car Group during three years. As Volvo Car Group is not listed, no official market value is available. Hence, the LTVP programs for previous years are based on a synthetic share price derived from variables known to determine the value of an automotive OEM. Research of market valuation of several listed auto-motive OEMs indicates that the valuation of automotive OEMs can be explained using primarily two factors: ROIC (Return on invested capi-tal) and volume growth forecast. The calculated market value is there-fore based on the ROIC and volume growth in the Business plan five years ahead. The business plan is adopted annually by the Board. As from 2016 the valuation of Volvo Cars has been done by an external party and in two ways;i) through discounted cash flow analysis of Volvo Cars estimated future cash flows, based on Volvo Cars latest business plan four years ahead and certain key assumptions; and ii) through comparable market analysis based on peer group analysis.
The LTVP will be calculated based on 30 per cent of the partici-pant’s annual gross salary. The program contribution will be locked in for three years and will be paid out as a gross cash amount three years later. The amount that will be paid out will depend on the development of the value of the company on January 1, three years later. The pro-gram is capped to a maximum of 200 per cent of start value. To be eligible for pay out, the employee must remain within the company at the date for pay out. The cost for the LTVP-program amounted to MSEK 98 (236) including social security cost, of which MSEK 29 (42) relates to EMT. The total liability amounted to MSEK 214 (275) as of December 31, 2016.
Share-based incentive programDuring 2015, Volvo Car AB’s (publ.) subsidiary Volvo Car Corporation issued 1,359 number of warrants with the right to subscribe for shares in the Company, which the Investor decided to offer to a number of members of management and Board of Directors to purchase. The purchase has been made at fair market value in accordance with an external valuation. Each warrant gives the right to subscribe for one share in Volvo Car Corporation for a predetermined amount under cer-tain periods during the years 2016–2021.
In case a participant is no longer employed, and also during other specified circumstances, the parent company has an option to redeem the warrants. During the duration of the program the partici-pants (i.e. the holders of the warrants) at certain predetermined peri-ods have an option to sell the warrants at fair market value to the parent company.
2016 2015
Compensation to Executive Management Team (EMT), TSEK Salary4)
Variable salary
Long term
variable pay
Social security
expenses (of which pension
expenses) Salary4)Variable
salary
Long term
variable pay
Social security
expenses (of which pension
expenses)
Håkan Samuelsson, CEO in Volvo Car Corporation 12,186 16,500 5,84416,872 (6,023) 12,185 9,000 6,864
14,917 (6,104)
Other members of EMT 70,086 38,658 14,03166,009
(16,169) 59,831 18,674 22,88852,900
(14,377)
Total 82,272 55,158 19,87582,881
(22,192) 72,016 27,674 29,75267,817
(20,481)
4) Includes benefits such as housing and company car.
NOTES TO THE CONSOLIDATED FINANCIAL STATEMENTS
100 VOLVO CAR GROUP | ANNUAL REPORT 2016

The term of the agreement is from 2016 to 2021 and will thereafter
be prolonged as long as none of the parties terminates the agreement.
The warrants have been valued at fair market value by an external
party. The valuation has been made based on all material conditions
in the agreement in accordance with the Black & Scholes model. The
valuation has been made based on the following assumptions: • Market value of the warrants has been determined to SEK 100,921
as per December 31, 2016.• The duration for the warrants have been determined to six years.• The volatility has been determined as 30 per cent.• Assessed risk free interest has been determined to –0,24 per cent.
The purpose of the program is that the participants should have the possibility to purchase shares in the company in the future. Consider-ing a weighted assessment of the conditions in the agreement the program is accounted for as a share-based payment that will be cash-settled and is therefore accounted for as a financial liability at fair value through the income statement.
As the participants have been offered to purchase the warrants at fair market value based on all material conditions in the agreement, the program will not result in any personnel costs in accordance with IFRS 2.
TSEKNumber of
warrantsAssessed fair market value
At the beginning of the year 1,359 64,425
Issued during the year — —
Used/redeemed — —
Overdue — —
Change in valuation — 72,726
At the end of the year 1,359 137,151
As the accounting is made at fair value, there are no differences between book value and fair value. Valuation at fair value is made con-tinuously based on external valuations.
Specification of warrant programNumber of
warrants
CEO and Board of Directors 577
Other members of group management 782
Total 1,359
Other long-term benefitsApart from the compensation accounted for under Incentive programs, EMT do not have any other long-term benefits.
NOTE 10 – DEPRECIATION AND AMORTISATION
Operating income includes depreciation and amortisation as specified below: 2016 2015
Software –44 –264
Capitalised product development cost –3,025 –2,263
Other intangible assets –1,223 –1,245
Buildings and land improvements –582 –535
Machinery and equipment –5,277 –4,755
Assets under operating leases –376 –337
Total –10,527 –9,399
Depreciation and amortisation according to plan by function: 2016 2015
Cost of sales1) –5,782 –5,340
Research and development expenses –4,379 –3,619
Selling expenses –90 –113
Administrative expenses –245 –296
Other income and expense –31 –31
Total –10,527 –9,399
1) Of which impairment loss MSEK –3 (—).
NOTE 11 – GOVERNMENT GRANTS
Volvo Car Group receives grants from the Swedish Government. Grants are also received in the US, China, Belgium and from the EU. In 2016, the government grants received amounted to MSEK 1,078 (200) and the government grants realised in the income statement amounted to MSEK 974 (188). In US, MSEK 151 (—) of the grants has reduced the carrying amount of the asset relating to the construction of the manufacturing site, of which MSEK 89 has been paid out as of year end.
Non-monetary government grants have been received in China in the form of rent free office and factory premises and in the US in the form of reduced lease fees related to office premises and manufacturing site.
NOTE 12 – FINANCIAL INCOME2016 2015
Net foreign exchange gain on financing activities — 97
Interest income on bank deposits 218 141
Total 218 238
NOTE 13 – FINANCIAL EXPENSES2016 2015
Net foreign exchange loss on financing activities –165 —
Interest effect from the measurement of repurchase obligations –215 –170
Interest expenses related to provisions for post-employment benefits –145 –165
Expenses for credit facilities –107 –100
Interest expenses to related companies –4 –53
Interest expenses –815 –900
Other financial expenses –260 –81
Total –1,711 –1,469
NOTES TO THE CONSOLIDATED FINANCIAL STATEMENTS
VOLVO CAR GROUP | ANNUAL REPORT 2016 101ANNUAL REPORT 2016 | VOLVO CAR GROUP

Investments in joint ventures and associates Dec 31, 2016 Dec 31, 2015
At beginning of the year/acquired acquisition value 701 612
Share of net income 418 230
Investment in Volvofinans Bank AB2) 1,852 —
Investment in VCFS Germany GmbH3) — —
Investment in VCIS Germany GmbH4) — —
Reclassification from associates to subsidiaries5) –76 —
Increase through acquisition6) — —
Capital repayment V2 Plug-In Hybrid Vehicle Partnership HB1) –210 –115
Dividends –187 –26
Total 2,498 701
Volvo Car Group’s carrying amount on investments in joint ventures and associates: Corp. ID no.
Country of incorporation % interest held Dec 31, 2016 Dec 31, 2015
Joint ventures
Volvo Trademark Holding AB 556567-0428 Sweden 50 5 5
V2 Plug-In Hybrid Vehicle Partnership HB1) 969741-9175 Sweden 50 174 230
Volvofinans Bank AB2) 556069-0967 Sweden 50 2,250 344
VH Systems AB 556820-9455 Sweden 50 35 37
VCFS Germany GmbH3) HRB 85091 Germany 50 — —
VCIS Germany GmbH4) HRB 86800 Germany 50 — —
Associated companies
First Rent A Car AB5) 556434-7820 Sweden — — 55
VCC Tjänstebilar KB 969673-1950 Sweden 50 2 2
VCC Försäljnings KB 969712-0153 Sweden 50 1 1
Volvohandelns PV-Försäljnings KB 916839-7009 Sweden 50 16 13
Volvohandelns PV-Försäljnings AB 556430-4748 Sweden 50 10 10
Volvo Event Management Corporation 444517742 Belgium 33 1 1
Trio Bilservice AB6) 556199-1059 Sweden 33 — —
Göteborgs Tekniska College AB 556570-6768 Sweden 26 4 3
Leiebilservice AS6) 879 548 632 Norway 20 — —
Carrying amount, participation in joint ventures and associates 2,498 701
1) V2 Plug-In Hybrid Vehicle Partnership HB is a joint venture and reported in accordance with the equity method since none of the holding companies, Volvo Cars PHEV Holding AB or Vattenfall PHEV Holding AB, has the deci-sion-making power over the operation. Volvo Car Group and Vattenfall have together developed the world’s first diesel-powered hybrid car, which can be driven as an ordinary diesel car, as a hybrid, or as a fully electric car. The car is available on the market since the first quarter of 2013. During 2016, V2 Plug-In Hybrid Vehicle Partnership HB provided a repayment of MSEK 210 (115) to Volvo Car PHEV Holding AB.
2) In August 2016, Volvo Car Corporation was allowed to close the acquisition of the additional 40 per cent of the shares in Volvofinans Bank AB and thereby increased its ownership from 10 to 50 per cent. Volvofinans Bank AB is now a joint venture company and reported in accordance with the equity method since none of the holding companies, Volvo Car Corporation or AB Volverkinvest, has the decision-making power over the operation. In Sweden, Volvofinans Bank AB is the leading bank within vehicle financing services.
3) In July 2015, the joint venture company VCFS Germany GmbH was estab-lished between Volvo Car Corporation and Santander Consumer Bank AG. The purpose of the company is to provide financial services in the German market and improve dealer and customer satisfaction. VCFS Germany GmbH is reported in accordance with the equity method since none of the holding companies has the decision-making power over the operation.
4) In January 2016, the joint venture company VCIS Germany GmbH was estab-lished between Volvo Car Germany GmbH and AVS Automotive Versi-cherungsService GmbH. The purpose of the company is to provide insurance services in the German market and improve dealer and customer satisfac-tion. VCIS Germany GmbH is reported in accordance with the equity method since none of the holding companies has the decision-making power over the operation.
5,6) In December 2016, Volvo Personvagnar Norden AB acquired the remaining 55 per cent of the shares in First Rent A Car AB which included the associ-ated companies Trio Bilservice AB and Leiebilservice AS. See Note 31 – Business combinations for further information.
The share of voting power corresponds to holdings in per cent as per above. All of the above joint ventures and associates are accounted for using the equity method in these consolidated financial statements.
For practical reasons, some of the joint ventures and associates are included in the consolidated financial statements with a certain time lag, normally one month.
nOTE 14 – INVESTMENTS IN joint ventures and ASSOCIATES
2016 2015
Share of income in joint ventures 394 212
Share of income in associates 24 18
Total 418 230
Share of income in joint ventures and associates is specified below: 2016 2015
V2 Plug-In Hybrid Vehicle Partnership HB1) 336 212
Volvofinans Bank AB2) 59 28
Other companies 23 –10
Total 418 230
NOTES TO THE CONSOLIDATED FINANCIAL STATEMENTS
102 VOLVO CAR GROUP | ANNUAL REPORT 2016

The following tables present summarised financial information for the Volvo Car Group’s material joint ventures.
V2 Plug-In Hybrid Vehicle Partnership HB1) Volvofinans Bank AB2) 9)
Summarised balance sheets 2016 2015 2016 2015
Percentage voting/ownership 50 50 50 10
Non-current assets 278 350 30,515 26,881
Cash and cash equivalents 82 120 1,157 1,613
Other current assets 172 219 3,408 2,579
Total assets 532 689 35,080 31,073
Equity7) 467 612 3,764 3,520
Non-current liabilities7) 8) 45 52 29,373 25,793
Current liabilities 20 25 1,943 1,760
Total equity and liabilities 532 689 35,080 31,073
7) Equity and Non-current liabilities are adjusted with the portion of untaxed reserves where appropriate. 8) In Volvofinans Bank AB, the non-current liability includes a financial liability of MSEK 28,747 (25,247). 9) Volvofinans Bank AB’s equity share in the Volvo Car Group is included with a time lag of one month.
V2 Plug-In Hybrid Vehicle Partnership HB1) Volvofinans Bank AB2)
Summarised income statements 2016 2015 2016 2015
Net sales 705 465 4,172 3,747
Profit/loss from continuing operations10) 11) 661 382 359 351
Profit (loss) for the year 661 382 359 351
Other comprehensive income for the year — — — —
Total comprehensive income for the year 661 382 359 351
Dividends received from joint ventures during the year 182 — 5 26
10) In V2 Plug-In Hybrid Vehicle Partnership HB the profit for the year includes depreciation of MSEK –73 (–73).11) In Volvofinans Bank AB the profit for the year includes depreciation of MSEK –3 (–2).
Reconcilation of the summarised financial information presented to the carrying amount of its interest in joint ventures.V2 Plug-In Hybrid Vehicle
Partnership HB1) Volvofinans Bank AB2)
Reconciliation of summarised financial information 2016 2015 2016 2015
Net asset of the joint venture 467 612 3,764 3,520
Proportion of the Group's ownership in the joint venture 50% 50% 50% 10%
Adjustments for differences in accounting principles –60 –76 — —
Goodwill — — 376 —
Other adjustments — — –8 –8
Carrying amount of the Group´s interest in joint ventures 174 230 2,250 344
NOTES TO THE CONSOLIDATED FINANCIAL STATEMENTS
VOLVO CAR GROUP | ANNUAL REPORT 2016 103ANNUAL REPORT 2016 | VOLVO CAR GROUP

NOTE 15 – TAXES
Income tax recognised in income statement 2016 2015
Current income tax for the year –1,631 –1,558
Current income tax for previous years –5 8
Deferred taxes –386 598
Other taxes –39 39
Total –2,061 –913
Information regarding current year tax expense compared to tax expense based on the applicable Swedish tax rate 2016 2015
Income before tax for the year 9,521 5,389
Tax according to applicable Swedish tax rate, 22% –2,095 –1,185
Operating income/costs, non-taxable –48 –156
Other taxes, non-taxable –39 39
Capital gains or losses, non-taxable –43 —
Effect of different tax rates 119 344
Tax effect on deferred tax due to change of tax rate 9 –24
Revaluation of previously non-valued losses and other temporary differences 38 42
Other –2 27
Total –2,061 –913
Income tax recognised in other comprehensive income 2016 2015
Deferred tax
Tax effects on cash flow hedge reserve –867 456
Tax effect of remeasurement of provisions for post-employment benefits –265 384
Tax effects on translation difference, hedge instru-ments of net investments in foreign operations –35 28
Total –1,167 868
Income tax recognised directly in equity 2016 2015
Deferred tax
Tax effects on group contributions — –2,473
Total — –2,473
Specification of deferred tax assetsDec 31,
2016Dec 31,
2015
Goodwill arising from the purchase of the net assets of a business 347 48
Provision for employee benefits 1,473 1,070
Unutilised tax loss carry-forwards 5,558 5,625
Reserve for unrealised income in inventory 64 73
Provision for warranty 233 253
Fair value of derivative instruments 637 229
Other temporary differences 3,185 2,171
Total deferred tax assets 11,497 9,469
Netting of assets/liabilities –7,385 –5,628
Total deferred tax assets, net 4,112 3,841
Specification of deferred tax liabilitiesDec 31,
2016Dec 31,
2015
Fixed assets 6,216 5,480
Untaxed reserves 909 909
Auto lease portfolio 1,102 1,007
Other temporary differences 367 —
Total deferred tax liabilities 8,594 7,396
Netting of assets/liabilities –7,385 –5,628
Total deferred tax liabilities, net 1,209 1,768
Deferred tax assets and deferred tax liabilitites are offset when the item relates to income taxes levied by the same taxation authority on either the same taxable entity or different taxable entities which intend either to settle current tax liabilities and assets on a net basis, or to realise the assets and settle the liabilities simultaneously.
Deferred tax assets are only recognised in countries where Volvo Car Group expects to be able to generate corresponding taxable income in the future to benefit from tax reductions. Significant tax loss carry-forwards are related to countries with long or undefinite periods of utilisation, mainly Sweden and US. Of the total MSEK 5,558 (5,625) recognised deferred tax assets related to tax loss carry-forwards, MSEK 4,555 (4,553) relates to Sweden with indefinite periods of uti-lisation. MSEK 938 (926) relates to US where tax loss carry-forwards are expected to be utilised before expiration date. The assessement is that Volvo Car Group will be able to generate sufficient income in the coming years to also utilise the remaining part of the recognised amounts.
Deferred tax that may arise on distribution of remaining unrestricted earnings of foreign subsidiaries has not been booked, hence they can be distributed free of tax or Volvo Car Group may consider them per-manently reinvested in the subsidiaries.
Changes in deferred tax assets and liabilities during the reporting period
Dec 31, 2016
Dec 31, 2015
Net book value of deferred taxes at January 1 2,073 –230
Deferred tax income/expense recognised through income statement –386 598
Change in deferred taxes recognised directly in equity — 2,473
Change in deferred taxes recognised directly in other comprehensive income 1,167 –868
Exchange rate impact 49 100
Net book value of deferred taxes at December 31 2,903 2,073
Deferred tax assets regarding tax loss carry-forwards are reported to the extent that realisation of the related tax benefit through future taxable profits is probable also when considering the period during which these can be utilised, as described below.
Deferred tax assets have been considered on all tax losses carry forward as per 2015 and as of December 31, 2016, the recognised tax loss carry-forwards amounted to MSEK 23,332 (23,626). The tax value of these tax loss carry-forwards is reported as an asset. The final years in which the recognised loss carry-forwards can be utilised are shown in the following table.
Tax-loss carry-forwards; year of expirationDec 31,
2016Dec 31,
2015
Due date
2017 — —
2018 — —
2019 — 322
2020 — —
2021 24 —
2022– 23,308 23,304
Total 23,332 23,626
NOTES TO THE CONSOLIDATED FINANCIAL STATEMENTS
104 VOLVO CAR GROUP | ANNUAL REPORT 2016

NOTE 16 – INTANGIBLE ASSETS
Capitalised product development cost1) Software
Trademark and
goodwill2)Other intangible
assets3) Total
Aquisition cost
Balance at January 1, 2015 14,714 3,919 3,624 9,949 32,206
Additions 4,494 300 — 530 5,324
Acquired through business combinations — — 507 — 507
Divestments and disposals — –856 — — –856
Reclassifications — –289 — 289 —
Effect of foreign currency exchange differences — 7 — 31 38
Balance at December 31, 2015 19,208 3,081 4,131 10,799 37,219
Additions 6,177 327 — 350 6,854
Acquired through business combinations — 7 2 5 14
Divestments and disposals — –306 — — –306
Reclassifications — –164 — 354 190
Effect of foreign currency exchange differences — 8 — 17 25
Balance at December 31, 2016 25,385 2,953 4,133 11,525 43,996
Accumulated amortisation and impairment
Balance at January 1, 2015 –3,528 –2,432 — –5,597 –11,557
Amortisation expense –2,263 –264 — –1,245 –3,772
Divestments and disposals — 839 — –4 835
Reclassifications — 61 — –61 —
Effect of foreign currency exchange differences — 104 — 5 109
Balance at December 31, 2015 –5,791 –1,692 — –6,902 –14,385
Amortisation expense –3,025 –44 — –1,223 –4,292
Divestments and disposals — 58 — — 58
Reclassifications — –1 — 1 —
Effect of foreign currency exchange differences 1 –4 — –6 –9
Balance at December 31, 2016 –8,815 –1,683 — –8,130 –18,628
Net balance at December 31, 2015 13,417 1,389 4,131 3,897 22,834
Net balance at December 31, 2016 16,570 1,270 4,133 3,395 25,368
1) Volvo Car Group has capitalised borrowing costs related to product development of MSEK 120 (85). A capitalisation rate of 3.6 (3.9) per cent was used to determine the amount of borrowing costs eligible for capitalisation.
2) Of the total Net balance at December 31 2016, Goodwill amounts to MSEK 509 (509).3) Other intangible assets refers to licences, dealer network, patents, land-use rights and similar rights.
Intangible assets with indefinite useful lives, i.e. trademark, goodwill, and other intangible assets not yet ready for use, are tested for impair-ment annually as well as if there are any indications of need for impair-ment. Assets with definite useful lives are tested if there are any indi-cations of need for impairment.
An impairment test is made by calculating the recoverable value. If the recoverable value is less than the carrying value, the asset is writ-ten down to its recoverable value. The recoverable amounts are based on a discounted cash flow model, with Volvo Car Group as one single Cash Generating Unit.
Assumption of future market share, market growth and Volvo Car Group’s expected performance in this environment is the basis for the valuation.
Management’s business plan for 2017–2021 and volume programs for 2022–2025 are used as a basis for the calculation. The available future volume programs are considered in the calculation for increased precision. In the model, Volvo Car Group is expected to maintain stable efficiency over time and the estimates for the cash flows following the end of the planning period are based on the same growth rate and
cash flow as for the last year in the calculation onwards in perpetuity. The business plan and volume programs are an integral part of Volvo Car Group’s financial planning process and represents management’s best estimate of the economic conditions that will exist during the asset’s remaining lifetime.
The business plan process is based on the historic and current financial performance and financial position of the company, i.e. assumptions for margin development, fixed cost and new investments are based on current year financials and balanced towards what is containable given the projection of exogenous factors. Exogenous factors as industry and segment volumes, exchange rates, raw mate-rial etc. are based on external assessments from analyst companies and banks.
In 2016, the discounted cash flow exceeded the carrying amount and no impairment loss was recognised. A sensitivity test has been performed whether a negative adjustment of one percentage point to the margin development or in the discount rate would result in impair-ment. The discount rate before tax was 12.1 (12.7) per cent. No impair-ment loss was recognised as a result of this test.
NOTES TO THE CONSOLIDATED FINANCIAL STATEMENTS
VOLVO CAR GROUP | ANNUAL REPORT 2016 105ANNUAL REPORT 2016 | VOLVO CAR GROUP

NOTE 17 – TANGIBLE ASSETSBuildings
and land1) 2) 3)Machinery and
equipment1) 2) 3) 4)Construction
in progressAssets under
operating leases Total
Aquisition cost
Balance at January 1, 2015 15,488 71,255 4,807 2,294 93,844
Additions 442 3,105 3,917 1,436 8,900
Divestments and disposals –319 –3,061 — –1,212 –4,592
Reclassification 10 4,537 –4,547 — —
Effect of foreign currency exchange differences –17 –201 –53 — –271
Balance at December 31, 2015 15,604 75,635 4,124 2,518 97,881
Additions 319 8,257 5,211 1,315 15,102
Acquired through business combinations 261 225 1 259 746
Divestments and disposals –64 –2,597 –6 –1,199 –3,866
Reclassification 27 2,108 –2,325 — –190
Effect of foreign currency exchange differences 206 413 –96 — 523
Balance at December 31, 2016 16,353 84,041 6,909 2,893 110,196
Accumulated depreciation and impairment
Balance at January 1, 2015 –7,198 –48,230 — –352 –55,780
Depreciation expense –535 –4,755 — –337 –5,627
Divestments and disposals 181 2,305 — 343 2,829
Effect of foreign currency exchange differences 61 236 — — 297
Balance at December 31, 2015 –7,491 –50,444 — –346 –58,281
Depreciation expense –582 –5,277 — –376 –6,235
Divestments and disposals 37 2,311 — 312 2,660
Effect of foreign currency exchange differences –108 –281 — — –389
Balance at December 31, 2016 –8,144 –53,691 — –410 –62,245
Net balance at December 31, 2015 8,113 25,191 4,124 2,172 39,600
Net balance at December 31, 2016 8,209 30,350 6,909 2,483 47,951
1) Buildings and land include finance leases of MSEK 16 (25) and Machinery and equipment includes finance leases of MSEK 71 (7). For further information regarding finance leases, see Note 8 – Leasing.
2) Depreciation expense include impairment loss of MSEK –3 (—). For further information regarding depreciations, see Note 10 – Depreciation and amortisation.3) Volvo Car Group has no mortgages in property, plant and equipment. For further information regarding pledged assets, see Note 28 – Pledged assets. 4) Machinery and equipment includes capitalised borrowing costs of MSEK 49 (68).
NOTE 18 – OTHER NON-CURRENT ASSETSDec 31,
2016Dec 31,
2015
Restricted cash 107 99
Endowment insurance for pensions 262 289
Rental deposition 51 44
Derivative assets, non-current 406 465
Other receivables, non-current 960 221
Other non-current assets 227 208
Total 2,013 1,326
Change in other non-current assets during the year 2016 2015
Balance at January 1 1,326 11,656
Group contribution — –10,574
Change in restricted cash 8 –325
Change in endowment insurance for pensions –27 98
Change in derivative assets –59 465
Other changes 765 6
Balance at December 31 2,013 1,326
For further information see Note 21 – Financial risks and financial instruments.
NOTE 19 – INVENTORIESDec 31,
2016Dec 31,
2015
Raw materials and consumables 143 149
Products in progress 4,507 3,737
Current assets held under operating lease 4,731 4,478
Finished goods and goods in resale 11,817 11,942
21,198 20,306
Of which value adjustment reserve: –350 –358
The cost of inventories recognised as an expense and included in cost of sales amounted to MSEK 137,739 (124,668).
The cost of inventories recognised as an expense includes MSEK – (46) in respect of write-downs of inventory to net realisable value. Current assets held under operating lease consists of a sale of vehi-cles combined with a repurchase agreement with a maturity less or equal to twelve months.
NOTES TO THE CONSOLIDATED FINANCIAL STATEMENTS
106 VOLVO CAR GROUP | ANNUAL REPORT 2016
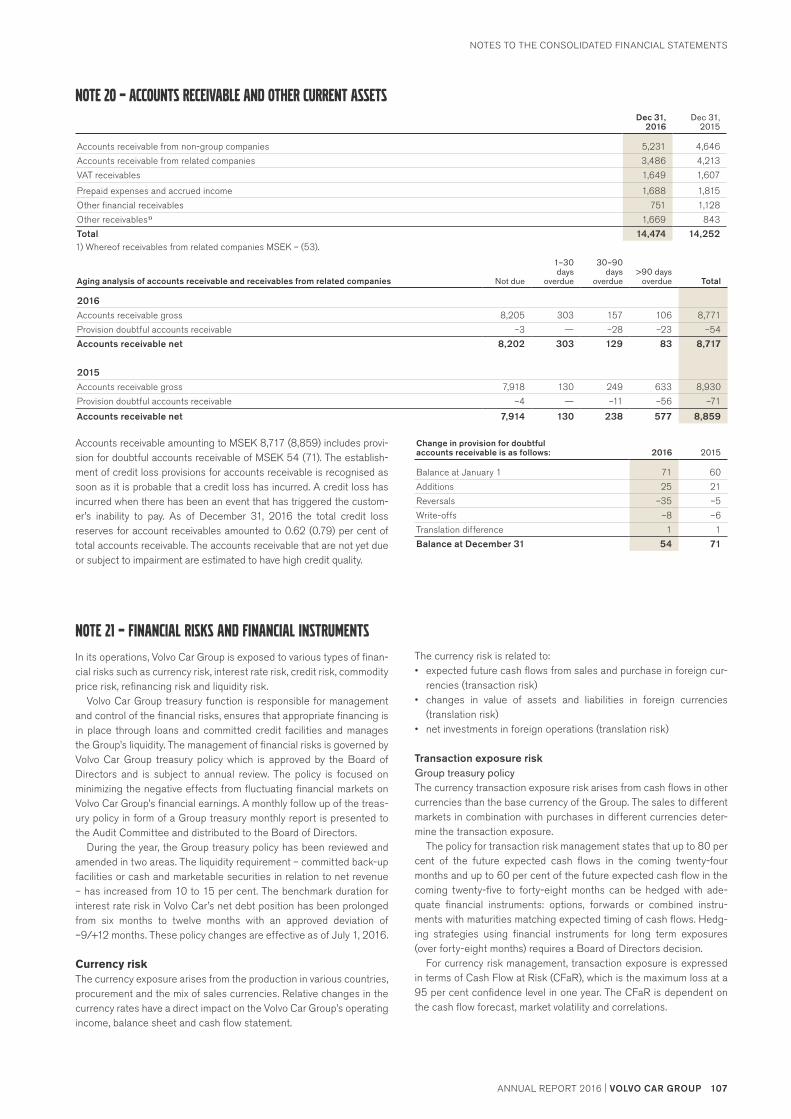
Accounts receivable amounting to MSEK 8,717 (8,859) includes provi-sion for doubtful accounts receivable of MSEK 54 (71). The establish-ment of credit loss provisions for accounts receivable is recognised as soon as it is probable that a credit loss has incurred. A credit loss has incurred when there has been an event that has triggered the custom-er’s inability to pay. As of December 31, 2016 the total credit loss reserves for account receivables amounted to 0.62 (0.79) per cent of total accounts receivable. The accounts receivable that are not yet due or subject to impairment are estimated to have high credit quality.
NOTE 21 – FINANCIAL RISKS AND FINANCIAL INSTRUMENTS
In its operations, Volvo Car Group is exposed to various types of finan-cial risks such as currency risk, interest rate risk, credit risk, commodity price risk, refinancing risk and liquidity risk.
Volvo Car Group treasury function is responsible for management and control of the financial risks, ensures that appropriate financing is in place through loans and committed credit facilities and manages the Group’s liquidity. The management of financial risks is governed by Volvo Car Group treasury policy which is approved by the Board of Directors and is subject to annual review. The policy is focused on minimizing the negative effects from fluctuating financial markets on Volvo Car Group’s financial earnings. A monthly follow up of the treas-ury policy in form of a Group treasury monthly report is presented to the Audit Committee and distributed to the Board of Directors.
During the year, the Group treasury policy has been reviewed and amended in two areas. The liquidity requirement – committed back-up facilities or cash and marketable securities in relation to net revenue – has increased from 10 to 15 per cent. The benchmark duration for interest rate risk in Volvo Car’s net debt position has been prolonged from six months to twelve months with an approved deviation of –9/+12 months. These policy changes are effective as of July 1, 2016.
Currency riskThe currency exposure arises from the production in various countries, procurement and the mix of sales currencies. Relative changes in the currency rates have a direct impact on the Volvo Car Group’s operating income, balance sheet and cash flow statement.
The currency risk is related to:• expected future cash flows from sales and purchase in foreign cur-
rencies (transaction risk)• changes in value of assets and liabilities in foreign currencies
(translation risk)• net investments in foreign operations (translation risk)
Transaction exposure riskGroup treasury policyThe currency transaction exposure risk arises from cash flows in other currencies than the base currency of the Group. The sales to different markets in combination with purchases in different currencies deter-mine the transaction exposure.
The policy for transaction risk management states that up to 80 per cent of the future expected cash flows in the coming twenty-four months and up to 60 per cent of the future expected cash flow in the coming twenty-five to forty-eight months can be hedged with ade-quate financial instruments: options, forwards or combined instru-ments with maturities matching expected timing of cash flows. Hedg-ing strategies using financial instruments for long term exposures (over forty-eight months) requires a Board of Directors decision.
For currency risk management, transaction exposure is expressed in terms of Cash Flow at Risk (CFaR), which is the maximum loss at a 95 per cent confidence level in one year. The CFaR is dependent on the cash flow forecast, market volatility and correlations.
Change in provision for doubtful accounts receivable is as follows: 2016 2015
Balance at January 1 71 60
Additions 25 21
Reversals –35 –5
Write-offs –8 –6
Translation difference 1 1
Balance at December 31 54 71
NOTE 20 – ACCOUNTS RECEIVABLE AND OTHER CURRENT ASSETSDec 31,
2016Dec 31,
2015
Accounts receivable from non-group companies 5,231 4,646
Accounts receivable from related companies 3,486 4,213
VAT receivables 1,649 1,607
Prepaid expenses and accrued income 1,688 1,815
Other financial receivables 751 1,128
Other receivables1) 1,669 843
Total 14,474 14,2521) Whereof receivables from related companies MSEK – (53).
Aging analysis of accounts receivable and receivables from related companies Not due
1–30 days
overdue
30–90 days
overdue>90 days
overdue Total
2016
Accounts receivable gross 8,205 303 157 106 8,771
Provision doubtful accounts receivable –3 — –28 –23 –54
Accounts receivable net 8,202 303 129 83 8,717
2015
Accounts receivable gross 7,918 130 249 633 8,930
Provision doubtful accounts receivable –4 — –11 –56 –71
Accounts receivable net 7,914 130 238 577 8,859
NOTES TO THE CONSOLIDATED FINANCIAL STATEMENTS
VOLVO CAR GROUP | ANNUAL REPORT 2016 107ANNUAL REPORT 2016 | VOLVO CAR GROUP

A steering model with a benchmark level of CFaR is decided and a stipulated mandate to deviate from that benchmark is given to Group Treasury. The hedging strategy is proposed by Group Treasury and approved by the CEO/CFO. The hedging strategy is expressed as a strategic hedge level in terms of currency exposure expressed as CFaR. Group Treasury is given a tactical mandate to deviate from the strategic hedge level in terms of timing. The hedging strategy is revised at least quarterly.
Status at year endSales to markets other than Sweden generate transaction exposure. For the majority of the sales Volvo Cars invoices the national sales companies in their local currencies. The total currency inflow and out-flow was distributed according to below table:
Inflow Outflow
2016 2015 2016 2015
CNY 21% 24% 15% 17%
EUR 29% 24% 61% 61%
GBP 8% 9% 3% 4%
JPY 3% 3% 6% 6%
USD 21% 20% 10% 6%
Other 18% 20% 5% 6%
Maturities of cash flow hedges (forwards and call options), nominal amounts in millions, local currency
Maturity EUR GBP USD CNH RUB NOK JPY AUD CHF CAD PLN
0–24 months 1,460 –935 –4,413 –364 –3,303 –3,338 10,400 –433 –90 –427 –140
25–48 months 133 –149 –1,520 — — –400 — –80 — –126 —
The average duration of the portfolio was 22 (15) months. The fair value of the outstanding derivatives as at December 31, 2016 amounted to MSEK –2,898 (1,133).
The CFaR at year end for the cash flows in one year, excluding hedges and the Chinese industrial entities, was approximately SEK 5 (8) bil-lion. The CFaR at year end for the Chinese industrial entities was MSEK 2,423 (882).
Forward contracts and options are used to hedge the currency risk in expected future cash flows from sales and purchase in foreign cur-rencies excluding the Chinese industrial entities. No hedging is per-formed for the exposure in the Chinese industrial entities due to restrictive regulations of financial derivatives and the relative size of the exposure. The table below shows the percentage of the fore-casted nominal cash flows that were hedged expressed both in nom-inal terms and in CFaR. CFaR has a higher percentage hedge than the nominal cash flow because it leverages the correlation between currencies.
0–24 months 25–48 months
2016 2015 2016 2015
Nominal hedge % 37 36 7 3
CFaR incl hedges % 48 50 13 5
Hedge accounting – cash flow hedgeHedge accounting is applied for cash flow hedging of currency risk. Gains and losses on the effective portions of derivatives designated under cash flow hedge accounting are recognised in other compre-hensive income.
The highly probable forecast transactions in foreign currencies that are hedged are expected to occur at various dates during the next forty-eight months. Gains and losses recognised in other comprehen-sive income and accumulated in other reserves in equity on forward foreign exchange contracts as of December 31, 2016 are recognised in the income statement in the periods when the hedged forecast transaction affects the income statement, which are shown in the maturity table above.
The sensitivity in the portfolio of cash flow hedges measured as a one per cent change in the Swedish krona (SEK) against major curren-cies has a net impact of MSEK 634 (489) on other comprehensive income.
The cash flow hedge reserve, included in other reserves, in share-holders’ equity as at December 31, 2016 amounts to MSEK –2,843 (1,118) before tax. The fluctuation from December 31, 2015 to Decem-ber 31, 2016 within the hedge reserve that has had an impact on other comprehensive income in 2016 is MSEK –3,961 (2,073) before tax. The balance of MSEK –2,843 (1,118) represents the fair value of deriv-atives used for cash flow hedging per December 31, 2016, along with time value in options and ineffective contracts, the latter two items recorded in the income statement, which builds up the total fair value of MSEK –2,898 (1,133). The ineffectiveness in the cash flow hedges that has affected net income amounts to MSEK 2 (–183), of which MSEK — (–2) relates to fair value of ineffective contracts in the exist-ing portfolio per December 31, 2016.
Fair value of derivatives for cash flow hedging 2016 2015
Hedge reserve –2,843 1,118
Recognised in other comprehensive income –2,843 1,118
Time value in options –55 17
Ineffective contracts — –2
Recognised in other operating income and expenses –55 15
Total fair value –2,898 1,133
Translation exposure riskGroup treasury policyTranslation risk in Volvo Car Group relates to the translation of net investments in foreign operations. This exposure can generate a posi-tive or negative impact on other comprehensive income. Translation risk of assets and liabilities in foreign currencies related to the opera-tions, as accounts receivable, accounts payable and warranty provi-sions, will generate an impact on the income statement in other oper-ating income. All translation of assets and liabilities to credit institutions and intercompany loans and deposits are reflected in the financial income and expenses.
The translation risk is primarily covered by matching the currency composition of debt with the composition of assets.
The translation risk management is managed on the following levels:• Exposure related to the translation effects on financial asset and
liabilities is managed via natural hedging or via financial derivatives.• Exposure related to translation effects on operational items in the
balance sheet is managed via financial derivatives.
NOTES TO THE CONSOLIDATED FINANCIAL STATEMENTS
108 VOLVO CAR GROUP | ANNUAL REPORT 2016
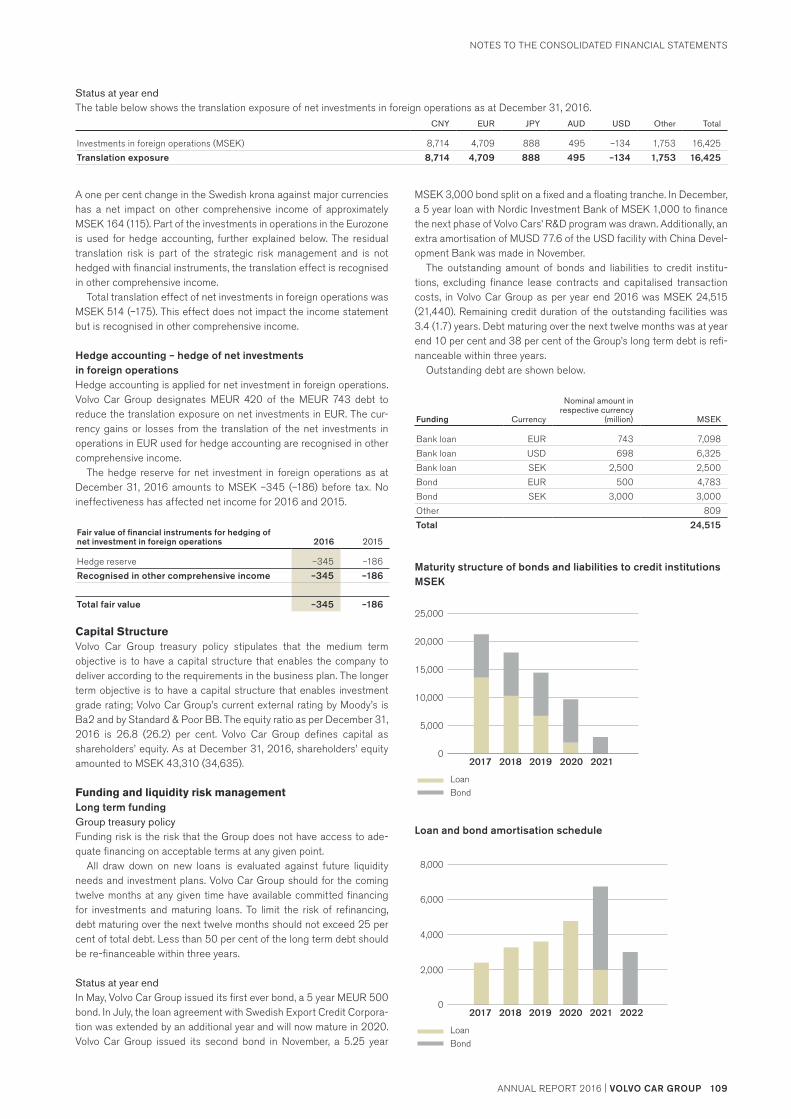
Status at year endThe table below shows the translation exposure of net investments in foreign operations as at December 31, 2016.
CNY EUR JPY AUD USD Other Total
Investments in foreign operations (MSEK) 8,714 4,709 888 495 –134 1,753 16,425
Translation exposure 8,714 4,709 888 495 –134 1,753 16,425
A one per cent change in the Swedish krona against major currencies has a net impact on other comprehensive income of approximately MSEK 164 (115). Part of the investments in operations in the Eurozone is used for hedge accounting, further explained below. The residual translation risk is part of the strategic risk management and is not hedged with financial instruments, the translation effect is recognised in other comprehensive income.
Total translation effect of net investments in foreign operations was MSEK 514 (–175). This effect does not impact the income statement but is recognised in other comprehensive income.
Hedge accounting – hedge of net investments in foreign operationsHedge accounting is applied for net investment in foreign operations. Volvo Car Group designates MEUR 420 of the MEUR 743 debt to reduce the translation exposure on net investments in EUR. The cur-rency gains or losses from the translation of the net investments in operations in EUR used for hedge accounting are recognised in other comprehensive income.
The hedge reserve for net investment in foreign operations as at December 31, 2016 amounts to MSEK –345 (–186) before tax. No ineffectiveness has affected net income for 2016 and 2015.
Fair value of financial instruments for hedging of net investment in foreign operations 2016 2015
Hedge reserve –345 –186
Recognised in other comprehensive income –345 –186
Total fair value –345 –186
Capital StructureVolvo Car Group treasury policy stipulates that the medium term objective is to have a capital structure that enables the company to deliver according to the requirements in the business plan. The longer term objective is to have a capital structure that enables investment grade rating; Volvo Car Group’s current external rating by Moody’s is Ba2 and by Standard & Poor BB. The equity ratio as per December 31, 2016 is 26.8 (26.2) per cent. Volvo Car Group defines capital as shareholders’ equity. As at December 31, 2016, shareholders’ equity amounted to MSEK 43,310 (34,635).
Funding and liquidity risk managementLong term fundingGroup treasury policy Funding risk is the risk that the Group does not have access to ade-quate financing on acceptable terms at any given point.
All draw down on new loans is evaluated against future liquidity needs and investment plans. Volvo Car Group should for the coming twelve months at any given time have available committed financing for investments and maturing loans. To limit the risk of refinancing, debt maturing over the next twelve months should not exceed 25 per cent of total debt. Less than 50 per cent of the long term debt should be re-financeable within three years.
Status at year endIn May, Volvo Car Group issued its first ever bond, a 5 year MEUR 500 bond. In July, the loan agreement with Swedish Export Credit Corpora-tion was extended by an additional year and will now mature in 2020. Volvo Car Group issued its second bond in November, a 5.25 year
MSEK 3,000 bond split on a fixed and a floating tranche. In December, a 5 year loan with Nordic Investment Bank of MSEK 1,000 to finance the next phase of Volvo Cars’ R&D program was drawn. Additionally, an extra amortisation of MUSD 77.6 of the USD facility with China Devel-opment Bank was made in November.
The outstanding amount of bonds and liabilities to credit institu-tions, excluding finance lease contracts and capitalised transaction costs, in Volvo Car Group as per year end 2016 was MSEK 24,515 (21,440). Remaining credit duration of the outstanding facilities was 3.4 (1.7) years. Debt maturing over the next twelve months was at year end 10 per cent and 38 per cent of the Group’s long term debt is refi-nanceable within three years.
Outstanding debt are shown below.
Funding Currency
Nominal amount in respective currency
(million) MSEK
Bank loan EUR 743 7,098
Bank loan USD 698 6,325
Bank loan SEK 2,500 2,500
Bond EUR 500 4,783
Bond SEK 3,000 3,000
Other 809
Total 24,515
Maturity structure of bonds and liabilities to credit institutions MSEK
LoanBond
Outstanding debt MSEK
0
5,000
10,000
15,000
20,000
25,000
20212020201920182017
Loan and bond amortisation schedule
LoanBond
Amortization Schedule MSEK
0
2,000
4,000
6,000
8,000
2020201920182017 20222021
NOTES TO THE CONSOLIDATED FINANCIAL STATEMENTS
VOLVO CAR GROUP | ANNUAL REPORT 2016 109ANNUAL REPORT 2016 | VOLVO CAR GROUP
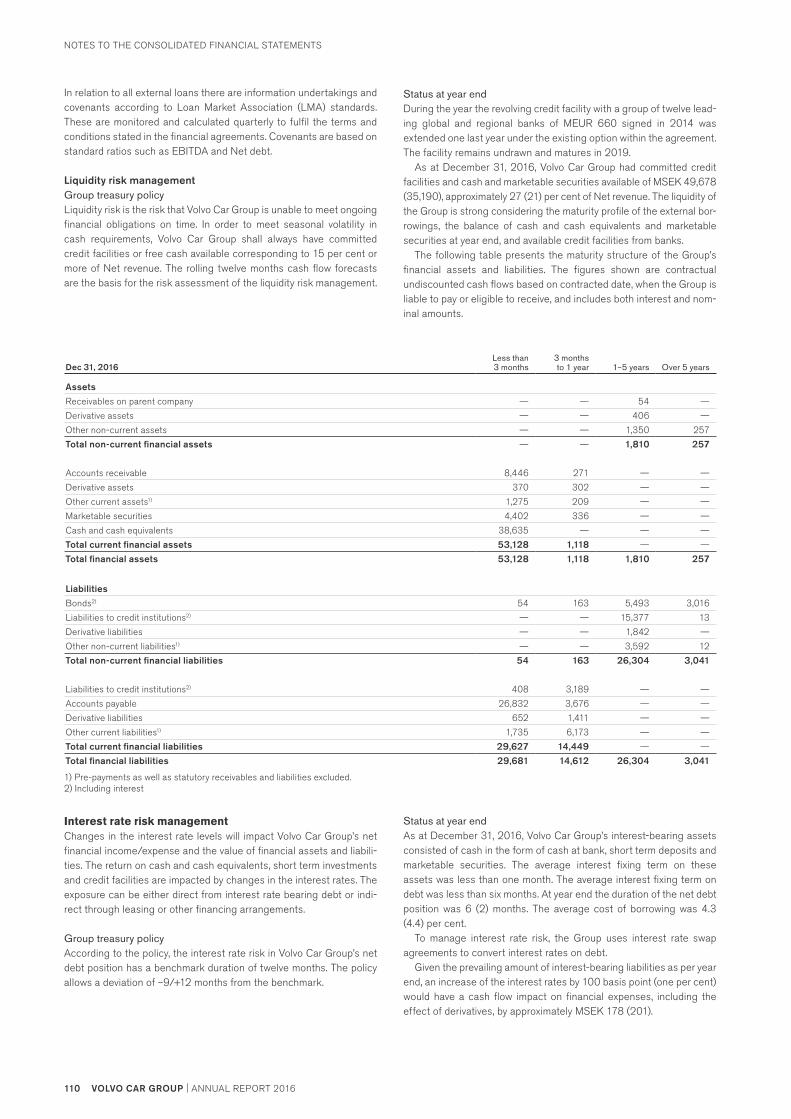
Dec 31, 2016Less than 3 months
3 months to 1 year 1–5 years Over 5 years
Assets
Receivables on parent company — — 54 —
Derivative assets — — 406 —
Other non-current assets — — 1,350 257
Total non-current financial assets — — 1,810 257
Accounts receivable 8,446 271 — —
Derivative assets 370 302 — —
Other current assets1) 1,275 209 — —
Marketable securities 4,402 336 — —
Cash and cash equivalents 38,635 — — —
Total current financial assets 53,128 1,118 — —
Total financial assets 53,128 1,118 1,810 257
Liabilities
Bonds2) 54 163 5,493 3,016
Liabilities to credit institutions2) — — 15,377 13
Derivative liabilities — — 1,842 —
Other non-current liabilities1) — — 3,592 12
Total non-current financial liabilities 54 163 26,304 3,041
Liabilities to credit institutions2) 408 3,189 — —
Accounts payable 26,832 3,676 — —
Derivative liabilities 652 1,411 — —
Other current liabilities1) 1,735 6,173 — —
Total current financial liabilities 29,627 14,449 — —
Total financial liabilities 29,681 14,612 26,304 3,041
1) Pre-payments as well as statutory receivables and liabilities excluded.2) Including interest
Interest rate risk managementChanges in the interest rate levels will impact Volvo Car Group’s net financial income/expense and the value of financial assets and liabili-ties. The return on cash and cash equivalents, short term investments and credit facilities are impacted by changes in the interest rates. The exposure can be either direct from interest rate bearing debt or indi-rect through leasing or other financing arrangements.
Group treasury policyAccording to the policy, the interest rate risk in Volvo Car Group’s net debt position has a benchmark duration of twelve months. The policy allows a deviation of –9/+12 months from the benchmark.
Status at year endAs at December 31, 2016, Volvo Car Group’s interest-bearing assets consisted of cash in the form of cash at bank, short term deposits and marketable securities. The average interest fixing term on these assets was less than one month. The average interest fixing term on debt was less than six months. At year end the duration of the net debt position was 6 (2) months. The average cost of borrowing was 4.3 (4.4) per cent.
To manage interest rate risk, the Group uses interest rate swap agreements to convert interest rates on debt.
Given the prevailing amount of interest-bearing liabilities as per year end, an increase of the interest rates by 100 basis point (one per cent) would have a cash flow impact on financial expenses, including the effect of derivatives, by approximately MSEK 178 (201).
In relation to all external loans there are information undertakings and covenants according to Loan Market Association (LMA) standards. These are monitored and calculated quarterly to fulfil the terms and conditions stated in the financial agreements. Covenants are based on standard ratios such as EBITDA and Net debt.
Liquidity risk managementGroup treasury policyLiquidity risk is the risk that Volvo Car Group is unable to meet ongoing financial obligations on time. In order to meet seasonal volatility in cash requirements, Volvo Car Group shall always have committed credit facilities or free cash available corresponding to 15 per cent or more of Net revenue. The rolling twelve months cash flow forecasts are the basis for the risk assessment of the liquidity risk management.
Status at year endDuring the year the revolving credit facility with a group of twelve lead-ing global and regional banks of MEUR 660 signed in 2014 was extended one last year under the existing option within the agreement. The facility remains undrawn and matures in 2019.
As at December 31, 2016, Volvo Car Group had committed credit facilities and cash and marketable securities available of MSEK 49,678 (35,190), approximately 27 (21) per cent of Net revenue. The liquidity of the Group is strong considering the maturity profile of the external bor-rowings, the balance of cash and cash equivalents and marketable securities at year end, and available credit facilities from banks.
The following table presents the maturity structure of the Group’s financial assets and liabilities. The figures shown are contractual undiscounted cash flows based on contracted date, when the Group is liable to pay or eligible to receive, and includes both interest and nom-inal amounts.
NOTES TO THE CONSOLIDATED FINANCIAL STATEMENTS
110 VOLVO CAR GROUP | ANNUAL REPORT 2016
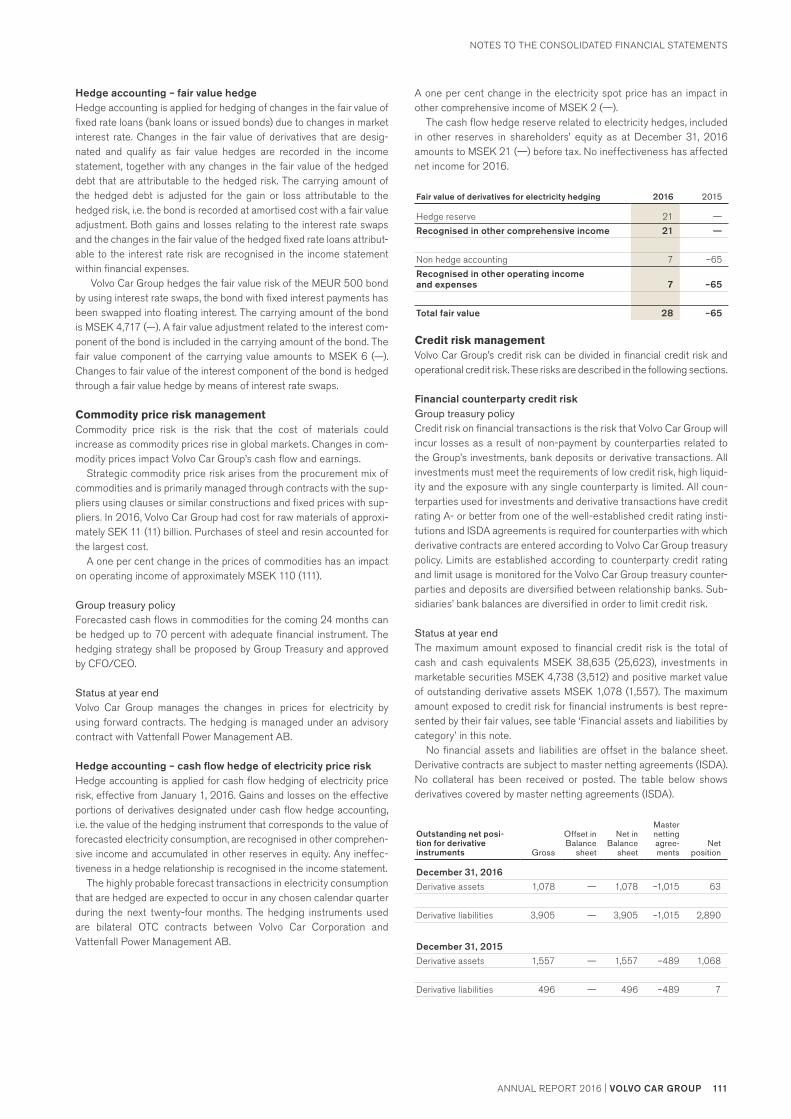
Hedge accounting – fair value hedgeHedge accounting is applied for hedging of changes in the fair value of fixed rate loans (bank loans or issued bonds) due to changes in market interest rate. Changes in the fair value of derivatives that are desig-nated and qualify as fair value hedges are recorded in the income statement, together with any changes in the fair value of the hedged debt that are attributable to the hedged risk. The carrying amount of the hedged debt is adjusted for the gain or loss attributable to the hedged risk, i.e. the bond is recorded at amortised cost with a fair value adjustment. Both gains and losses relating to the interest rate swaps and the changes in the fair value of the hedged fixed rate loans attribut-able to the interest rate risk are recognised in the income statement within financial expenses. Volvo Car Group hedges the fair value risk of the MEUR 500 bond by using interest rate swaps, the bond with fixed interest payments has been swapped into floating interest. The carrying amount of the bond is MSEK 4,717 (—). A fair value adjustment related to the interest com-ponent of the bond is included in the carrying amount of the bond. The fair value component of the carrying value amounts to MSEK 6 (—). Changes to fair value of the interest component of the bond is hedged through a fair value hedge by means of interest rate swaps.
Commodity price risk managementCommodity price risk is the risk that the cost of materials could increase as commodity prices rise in global markets. Changes in com-modity prices impact Volvo Car Group’s cash flow and earnings.
Strategic commodity price risk arises from the procurement mix of commodities and is primarily managed through contracts with the sup-pliers using clauses or similar constructions and fixed prices with sup-pliers. In 2016, Volvo Car Group had cost for raw materials of approxi-mately SEK 11 (11) billion. Purchases of steel and resin accounted for the largest cost.
A one per cent change in the prices of commodities has an impact on operating income of approximately MSEK 110 (111).
Group treasury policyForecasted cash flows in commodities for the coming 24 months can be hedged up to 70 percent with adequate financial instrument. The hedging strategy shall be proposed by Group Treasury and approved by CFO/CEO.
Status at year end Volvo Car Group manages the changes in prices for electricity by using forward contracts. The hedging is managed under an advisory contract with Vattenfall Power Management AB.
Hedge accounting – cash flow hedge of electricity price riskHedge accounting is applied for cash flow hedging of electricity price risk, effective from January 1, 2016. Gains and losses on the effective portions of derivatives designated under cash flow hedge accounting, i.e. the value of the hedging instrument that corresponds to the value of forecasted electricity consumption, are recognised in other comprehen-sive income and accumulated in other reserves in equity. Any ineffec-tiveness in a hedge relationship is recognised in the income statement.
The highly probable forecast transactions in electricity consumption that are hedged are expected to occur in any chosen calendar quarter during the next twenty-four months. The hedging instruments used are bilateral OTC contracts between Volvo Car Corporation and Vattenfall Power Management AB.
A one per cent change in the electricity spot price has an impact in other comprehensive income of MSEK 2 (—).
The cash flow hedge reserve related to electricity hedges, included in other reserves in shareholders’ equity as at December 31, 2016 amounts to MSEK 21 (—) before tax. No ineffectiveness has affected net income for 2016.
Fair value of derivatives for electricity hedging 2016 2015
Hedge reserve 21 —
Recognised in other comprehensive income 21 —
Non hedge accounting 7 –65
Recognised in other operating income and expenses 7 –65
Total fair value 28 –65
Credit risk managementVolvo Car Group’s credit risk can be divided in financial credit risk and operational credit risk. These risks are described in the following sections.
Financial counterparty credit riskGroup treasury policyCredit risk on financial transactions is the risk that Volvo Car Group will incur losses as a result of non-payment by counterparties related to the Group’s investments, bank deposits or derivative transactions. All investments must meet the requirements of low credit risk, high liquid-ity and the exposure with any single counterparty is limited. All coun-terparties used for investments and derivative transactions have credit rating A- or better from one of the well-established credit rating insti-tutions and ISDA agreements is required for counterparties with which derivative contracts are entered according to Volvo Car Group treasury policy. Limits are established according to counterparty credit rating and limit usage is monitored for the Volvo Car Group treasury counter-parties and deposits are diversified between relationship banks. Sub-sidiaries’ bank balances are diversified in order to limit credit risk.
Status at year endThe maximum amount exposed to financial credit risk is the total of cash and cash equivalents MSEK 38,635 (25,623), investments in marketable securities MSEK 4,738 (3,512) and positive market value of outstanding derivative assets MSEK 1,078 (1,557). The maximum amount exposed to credit risk for financial instruments is best repre-sented by their fair values, see table ‘Financial assets and liabilities by category’ in this note.
No financial assets and liabilities are offset in the balance sheet. Derivative contracts are subject to master netting agreements (ISDA). No collateral has been received or posted. The table below shows derivatives covered by master netting agreements (ISDA).
Outstanding net posi-tion for derivative instruments Gross
Offset in Balance
sheet
Net in Balance
sheet
Master netting agree-ments
Net position
December 31, 2016
Derivative assets 1,078 — 1,078 –1,015 63
Derivative liabilities 3,905 — 3,905 –1,015 2,890
December 31, 2015
Derivative assets 1,557 — 1,557 –489 1,068
Derivative liabilities 496 — 496 –489 7
NOTES TO THE CONSOLIDATED FINANCIAL STATEMENTS
VOLVO CAR GROUP | ANNUAL REPORT 2016 111ANNUAL REPORT 2016 | VOLVO CAR GROUP
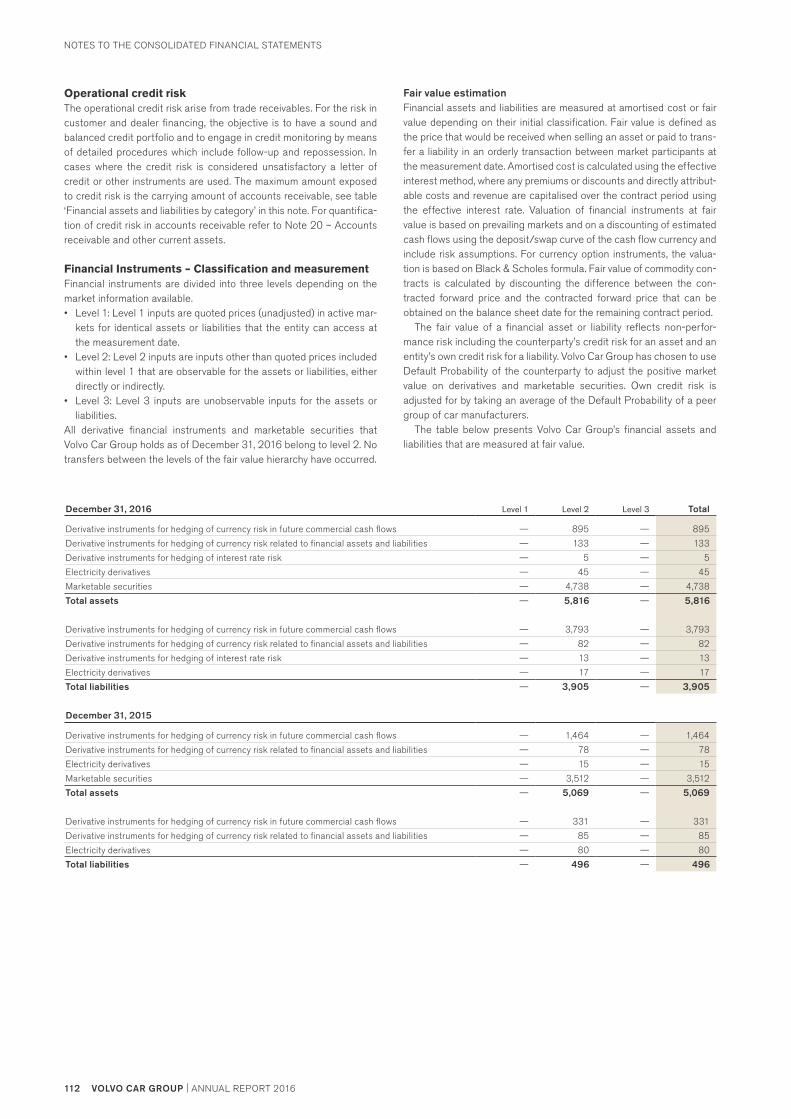
December 31, 2016 Level 1 Level 2 Level 3 Total
Derivative instruments for hedging of currency risk in future commercial cash flows — 895 — 895
Derivative instruments for hedging of currency risk related to financial assets and liabilities — 133 — 133
Derivative instruments for hedging of interest rate risk — 5 — 5
Electricity derivatives — 45 — 45
Marketable securities — 4,738 — 4,738
Total assets — 5,816 — 5,816
Derivative instruments for hedging of currency risk in future commercial cash flows — 3,793 — 3,793
Derivative instruments for hedging of currency risk related to financial assets and liabilities — 82 — 82
Derivative instruments for hedging of interest rate risk — 13 — 13
Electricity derivatives — 17 — 17
Total liabilities — 3,905 — 3,905
December 31, 2015
Derivative instruments for hedging of currency risk in future commercial cash flows — 1,464 — 1,464
Derivative instruments for hedging of currency risk related to financial assets and liabilities — 78 — 78
Electricity derivatives — 15 — 15
Marketable securities — 3,512 — 3,512
Total assets — 5,069 — 5,069
Derivative instruments for hedging of currency risk in future commercial cash flows — 331 — 331
Derivative instruments for hedging of currency risk related to financial assets and liabilities — 85 — 85
Electricity derivatives — 80 — 80
Total liabilities — 496 — 496
Operational credit riskThe operational credit risk arise from trade receivables. For the risk in customer and dealer financing, the objective is to have a sound and balanced credit portfolio and to engage in credit monitoring by means of detailed procedures which include follow-up and repossession. In cases where the credit risk is considered unsatisfactory a letter of credit or other instruments are used. The maximum amount exposed to credit risk is the carrying amount of accounts receivable, see table ‘Financial assets and liabilities by category’ in this note. For quantifica-tion of credit risk in accounts receivable refer to Note 20 – Accounts receivable and other current assets.
Financial Instruments – Classification and measurementFinancial instruments are divided into three levels depending on the market information available.• Level 1: Level 1 inputs are quoted prices (unadjusted) in active mar-
kets for identical assets or liabilities that the entity can access at the measurement date.
• Level 2: Level 2 inputs are inputs other than quoted prices included within level 1 that are observable for the assets or liabilities, either directly or indirectly.
• Level 3: Level 3 inputs are unobservable inputs for the assets or liabilities.
All derivative financial instruments and marketable securities that Volvo Car Group holds as of December 31, 2016 belong to level 2. No transfers between the levels of the fair value hierarchy have occurred.
Fair value estimationFinancial assets and liabilities are measured at amortised cost or fair value depending on their initial classification. Fair value is defined as the price that would be received when selling an asset or paid to trans-fer a liability in an orderly transaction between market participants at the measurement date. Amortised cost is calculated using the effective interest method, where any premiums or discounts and directly attribut-able costs and revenue are capitalised over the contract period using the effective interest rate. Valuation of financial instruments at fair value is based on prevailing markets and on a discounting of estimated cash flows using the deposit/swap curve of the cash flow currency and include risk assumptions. For currency option instruments, the valua-tion is based on Black & Scholes formula. Fair value of commodity con-tracts is calculated by discounting the difference between the con-tracted forward price and the contracted forward price that can be obtained on the balance sheet date for the remaining contract period.
The fair value of a financial asset or liability reflects non-perfor-mance risk including the counterparty’s credit risk for an asset and an entity’s own credit risk for a liability. Volvo Car Group has chosen to use Default Probability of the counterparty to adjust the positive market value on derivatives and marketable securities. Own credit risk is adjusted for by taking an average of the Default Probability of a peer group of car manufacturers.
The table below presents Volvo Car Group’s financial assets and liabilities that are measured at fair value.
NOTES TO THE CONSOLIDATED FINANCIAL STATEMENTS
112 VOLVO CAR GROUP | ANNUAL REPORT 2016

The carrying amount essentially equals the fair value for all current items. For liabilities to credit institutions, the carrying amount is a good estimate of the fair value. The interest rates in existing loan agree-ments were on December 31, 2016 estimated to be in par with credit market interest rates, and the fair value therefore corresponds, in every significant respect, with the carrying amount.
For aging analysis regarding accounts receivable refer to Note 20 – Accounts receivable and other current assets. For aging analysis regarding liabilities to credit institutions refer to Funding and liquidity risk management section in this note. Accounts payables are for the most part due within 60 days.
Financial instruments at fair value through profit and loss
Financial assets and liabilities by category
Instruments held for trading
Derivatives used in hedge
accountingFinancial liabilities
Loans and receivables
Financial liabilities at amortised
cost Total Fair value
December 31, 2016
Receivables on parent company — — — 54 — 54 54
Other non-current assets — — — 1,607 — 1,607 1,607
Accounts receivable — — — 8,717 — 8,717 8,717
Derivative assets 159 919 — — — 1,078 1,078
Other current assets1) — — — 1,484 — 1,484 1,484
Marketable securities 4,738 — — — — 4,738 4,738
Cash and cash equivalents — — — 38,635 — 38,635 38,635
Total financial assets 4,897 919 — 50,497 — 56,313 56,313
Bonds — — — — 7,699 7,699 7,699
Liabilities to credit institutions — — — — 16,723 16,723 16,723
Other non-current liabilities1) — — 137 — 3,467 3,604 3,604
Accounts payable — — — — 30,508 30,508 30,508
Derivative liabilities 163 3,742 — — — 3,905 3,905
Other current liabilities1) — — — — 7,908 7,908 7,908
Total financial liabilities 163 3,742 137 — 66,305 70,347 70,347
December 31, 2015
Other non-current assets — — — 862 — 862 862
Accounts receivable — — — 8,859 — 8,859 8,859
Derivative assets 120 1 437 — — — 1,557 1,557
Other current assets1) — — — 705 — 705 705
Marketable securities 3,512 — — — — 3,512 3,512
Cash and cash equivalents — — — 25,623 — 25,623 25,623
Total financial assets 3,632 1,437 — 36,049 — 41,118 41,118
Liabilities to credit institutions — — — — 21,414 21,414 21,414
Other non-current liabilities1) — — 65 — 2,211 2,276 2,276
Accounts payable — — — — 26,282 26,282 26,282
Derivative liabilities 177 319 — — — 496 496
Other current liabilities1) — — — — 6,652 6,652 6,652
Total financial liabilities 177 319 65 — 56,559 57,120 57,120
1) Pre-payments as well as statutory receivables and liabilities excluded.
NOTES TO THE CONSOLIDATED FINANCIAL STATEMENTS
VOLVO CAR GROUP | ANNUAL REPORT 2016 113ANNUAL REPORT 2016 | VOLVO CAR GROUP

Dec 31, 2016 Dec 31, 2015
Nominal amounts and fair values of derivative instrumentsNominal amount Fair value
Nominal amount Fair value
Derivative instruments for hedging of currency risk related to financial assets and liabilities
Foreign exchange swaps and forward contracts
– receivable position1) 7,612 133 6,714 78
– payable position2) 6,839 –82 7,960 –85
Subtotal 14,451 51 14,674 –7
Derivative instruments for hedging of currency risk in future commercial cash flows
Foreign exchange swaps and forward contracts
– receivable position1) 22,965 885 43,690 1,430
– payable position2) 68,319 –3,676 21,341 –320
Currency options
– receivable position1) 2,892 10 2,313 34
– payable position2) 3,417 –117 1,716 –11
Subtotal 97,593 –2,898 69,060 1,133
Derivative instruments for hedging of interest rate risk
Interest rate swaps
– receivable position1) 750 5 — —
– payable position2) 4,777 –13 — —
Subtotal 5,527 –8 — —
Derivative instruments for hedging of electricity price risk
Forward contracts
– receivable position1) 201 45 46 15
– payable position2) 101 –17 291 –80
Subtotal 302 28 337 –65
Total 117,873 –2,827 84,071 1,061
1) Financial instruments included in the balance sheet under other non-current assets and other current assets.2) Financial instruments included in the balance sheet under other non-current liabilities and other current liabilities.
The table below shows how gains and losses as well as interest income and expenses have affected the income statement divided on the different categories of financial instruments.
Net gains/losses, interest income and expenses related to financial instruments 2016 2015
Recognised in operating income Gains/ losses
Interest income
Interest expenses
Gains/ losses
Interest income
Interest expenses
Financial assets and liabilities at fair value through profit and loss
Derivative instruments for hedging of currency risk in future commer-cial cash flows rerouted from the hedge reserve, including time value in options and inefficiency 366 — — –2,338 — —
Electricity derivatives 72 — — –41 — —
Other financial liabilities, loans and receivables
Accounts receivable/accounts payable1),2) 211 — — –278 — —
Effect on operating income 649 — — –2,657 — —
Recognised in financial items
Financial assets and liabilities at fair value through profit and loss
Derivative instruments for hedging of currency risk related to financial assets and liabilities 540 32 — 161 — —
Derivative instruments for hedging of interest rate risk –14 — –3 — — —
Marketable securities –14 3 — –30 6 —
Other financial liabilities, loans and receivables
Loans and receivables1) –200 — — — — —
Cash and cash equivalents1) 406 180 — –229 132 —
Financial liabilities at amortised cost including currency effects1) –738 — –984 –377 — –1,039
Effect on financial items –20 215 –987 –475 138 –1,039
1) The total income and expenses from items that are not measured at fair value through profit and loss amounts to MSEK 797 (132) and MSEK –1,922 (–1,923) respectively.
2) Unrealised and realised foreign exchange effect on accounts receivable and accounts payable
NOTES TO THE CONSOLIDATED FINANCIAL STATEMENTS
114 VOLVO CAR GROUP | ANNUAL REPORT 2016
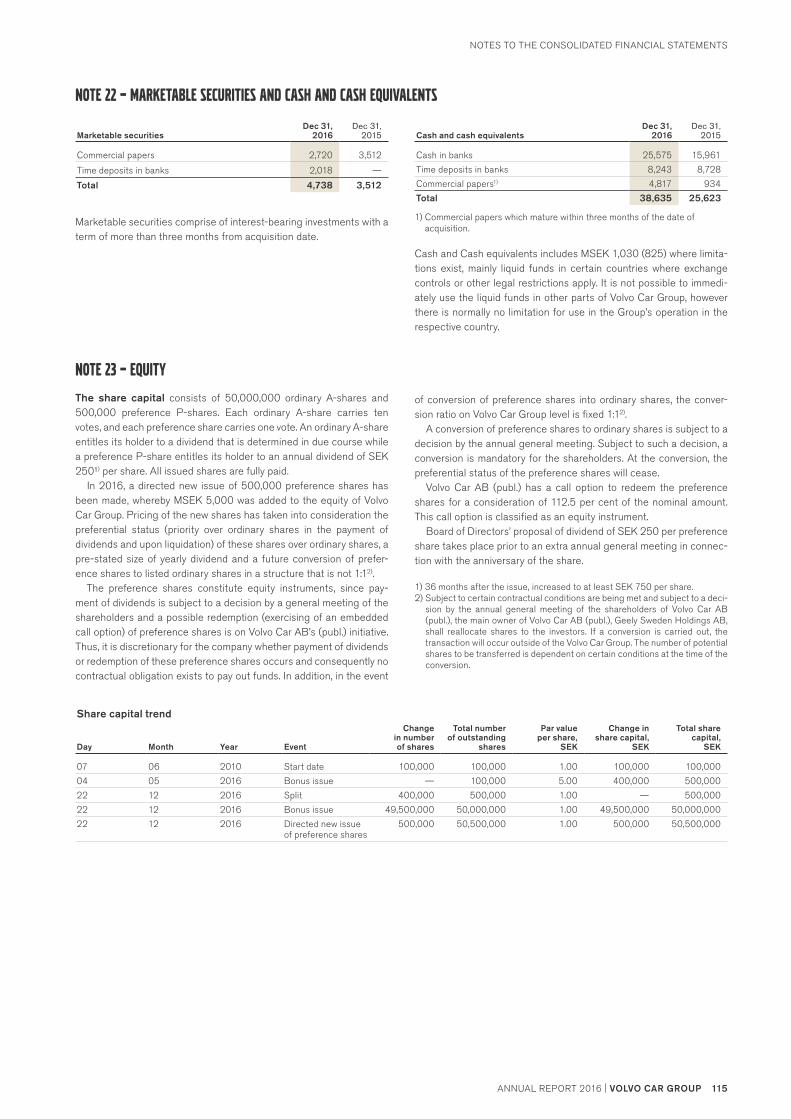
Marketable securitiesDec 31,
2016Dec 31,
2015
Commercial papers 2,720 3,512
Time deposits in banks 2,018 —
Total 4,738 3,512
Marketable securities comprise of interest-bearing investments with a term of more than three months from acquisition date.
NOTE 23 – EQUITY
The share capital consists of 50,000,000 ordinary A-shares and 500,000 preference P-shares. Each ordinary A-share carries ten votes, and each preference share carries one vote. An ordinary A-share entitles its holder to a dividend that is determined in due course while a preference P-share entitles its holder to an annual dividend of SEK 250¹) per share. All issued shares are fully paid. In 2016, a directed new issue of 500,000 preference shares has been made, whereby MSEK 5,000 was added to the equity of Volvo Car Group. Pricing of the new shares has taken into consideration the preferential status (priority over ordinary shares in the payment of dividends and upon liquidation) of these shares over ordinary shares, a pre-stated size of yearly dividend and a future conversion of prefer-ence shares to listed ordinary shares in a structure that is not 1:12).
The preference shares constitute equity instruments, since pay-ment of dividends is subject to a decision by a general meeting of the shareholders and a possible redemption (exercising of an embedded call option) of preference shares is on Volvo Car AB’s (publ.) initiative. Thus, it is discretionary for the company whether payment of dividends or redemption of these preference shares occurs and consequently no contractual obligation exists to pay out funds. In addition, in the event
Share capital trend
Day Month Year Event
Change in number of shares
Total number of outstanding
shares
Par value per share,
SEK
Change in share capital,
SEK
Total share capital,
SEK
07 06 2010 Start date 100,000 100,000 1.00 100,000 100,000
04 05 2016 Bonus issue — 100,000 5.00 400,000 500,000
22 12 2016 Split 400,000 500,000 1.00 — 500,000
22 12 2016 Bonus issue 49,500,000 50,000,000 1.00 49,500,000 50,000,000
22 12 2016 Directed new issue of preference shares
500,000 50,500,000 1.00 500,000 50,500,000
Cash and cash equivalentsDec 31,
2016Dec 31,
2015
Cash in banks 25,575 15,961
Time deposits in banks 8,243 8,728
Commercial papers1) 4,817 934
Total 38,635 25,623
1) Commercial papers which mature within three months of the date of acquisition.
Cash and Cash equivalents includes MSEK 1,030 (825) where limita-tions exist, mainly liquid funds in certain countries where exchange controls or other legal restrictions apply. It is not possible to immedi-ately use the liquid funds in other parts of Volvo Car Group, however there is normally no limitation for use in the Group’s operation in the respective country.
of conversion of preference shares into ordinary shares, the conver-sion ratio on Volvo Car Group level is fixed 1:12).
A conversion of preference shares to ordinary shares is subject to a decision by the annual general meeting. Subject to such a decision, a conversion is mandatory for the shareholders. At the conversion, the preferential status of the preference shares will cease.
Volvo Car AB (publ.) has a call option to redeem the preference shares for a consideration of 112.5 per cent of the nominal amount. This call option is classified as an equity instrument.
Board of Directors’ proposal of dividend of SEK 250 per preference share takes place prior to an extra annual general meeting in connec-tion with the anniversary of the share.
1) 36 months after the issue, increased to at least SEK 750 per share.2) Subject to certain contractual conditions are being met and subject to a deci-
sion by the annual general meeting of the shareholders of Volvo Car AB (publ.), the main owner of Volvo Car AB (publ.), Geely Sweden Holdings AB, shall reallocate shares to the investors. If a conversion is carried out, the transaction will occur outside of the Volvo Car Group. The number of potential shares to be transferred is dependent on certain conditions at the time of the conversion.
NOTE 22 – MARKETABLE SECURITIES AND CASH AND CASH EQUIVALENTS
NOTES TO THE CONSOLIDATED FINANCIAL STATEMENTS
VOLVO CAR GROUP | ANNUAL REPORT 2016 115ANNUAL REPORT 2016 | VOLVO CAR GROUP
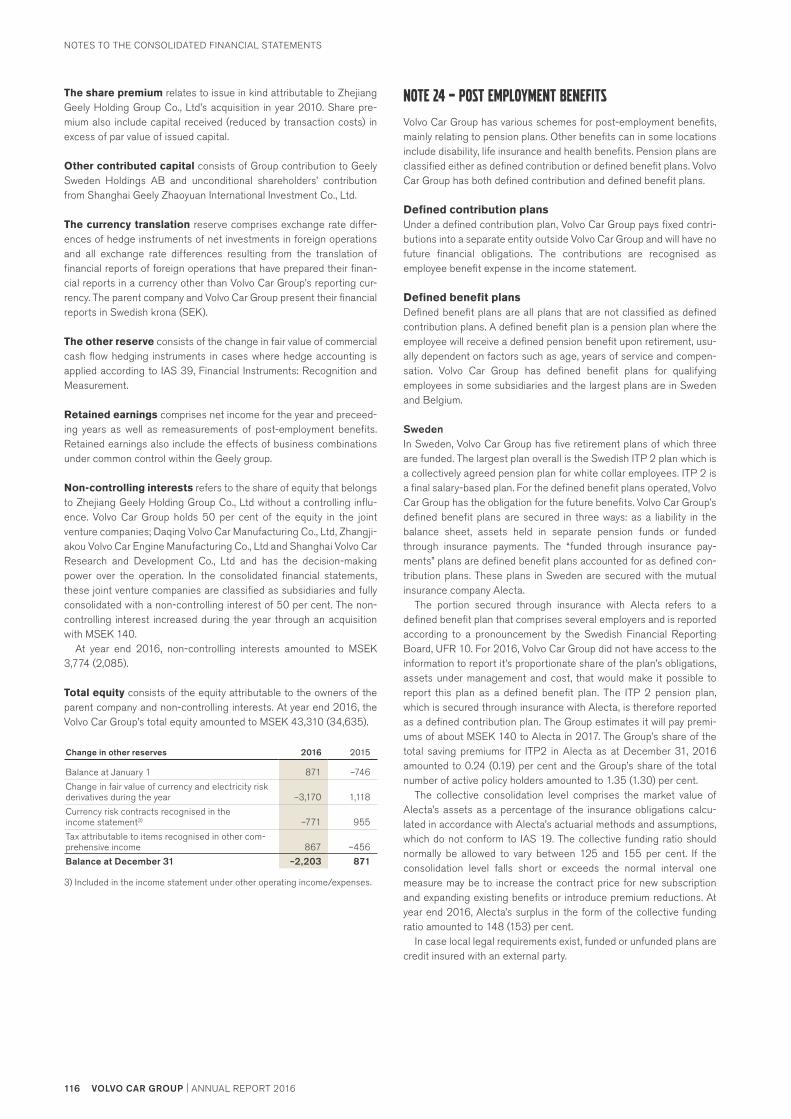
NOTE 24 – POST EMPLOYMENT BENEFITS
Volvo Car Group has various schemes for post-employment benefits, mainly relating to pension plans. Other benefits can in some locations include disability, life insurance and health benefits. Pension plans are classified either as defined contribution or defined benefit plans. Volvo Car Group has both defined contribution and defined benefit plans.
Defined contribution plansUnder a defined contribution plan, Volvo Car Group pays fixed contri-butions into a separate entity outside Volvo Car Group and will have no future financial obligations. The contributions are recognised as employee benefit expense in the income statement.
Defined benefit plansDefined benefit plans are all plans that are not classified as defined contribution plans. A defined benefit plan is a pension plan where the employee will receive a defined pension benefit upon retirement, usu-ally dependent on factors such as age, years of service and compen-sation. Volvo Car Group has defined benefit plans for qualifying employees in some subsidiaries and the largest plans are in Sweden and Belgium.
SwedenIn Sweden, Volvo Car Group has five retirement plans of which three are funded. The largest plan overall is the Swedish ITP 2 plan which is a collectively agreed pension plan for white collar employees. ITP 2 is a final salary-based plan. For the defined benefit plans operated, Volvo Car Group has the obligation for the future benefits. Volvo Car Group’s defined benefit plans are secured in three ways: as a liability in the balance sheet, assets held in separate pension funds or funded through insurance payments. The “funded through insurance pay-ments” plans are defined benefit plans accounted for as defined con-tribution plans. These plans in Sweden are secured with the mutual insurance company Alecta.
The portion secured through insurance with Alecta refers to a defined benefit plan that comprises several employers and is reported according to a pronouncement by the Swedish Financial Reporting Board, UFR 10. For 2016, Volvo Car Group did not have access to the information to report it’s proportionate share of the plan’s obligations, assets under management and cost, that would make it possible to report this plan as a defined benefit plan. The ITP 2 pension plan, which is secured through insurance with Alecta, is therefore reported as a defined contribution plan. The Group estimates it will pay premi-ums of about MSEK 140 to Alecta in 2017. The Group’s share of the total saving premiums for ITP2 in Alecta as at December 31, 2016 amounted to 0.24 (0.19) per cent and the Group’s share of the total number of active policy holders amounted to 1.35 (1.30) per cent.
The collective consolidation level comprises the market value of Alecta’s assets as a percentage of the insurance obligations calcu-lated in accordance with Alecta’s actuarial methods and assumptions, which do not conform to IAS 19. The collective funding ratio should normally be allowed to vary between 125 and 155 per cent. If the consolidation level falls short or exceeds the normal interval one measure may be to increase the contract price for new subscription and expanding existing benefits or introduce premium reductions. At year end 2016, Alecta’s surplus in the form of the collective funding ratio amounted to 148 (153) per cent.
In case local legal requirements exist, funded or unfunded plans are credit insured with an external party.
The share premium relates to issue in kind attributable to Zhejiang Geely Holding Group Co., Ltd’s acquisition in year 2010. Share pre-mium also include capital received (reduced by transaction costs) in excess of par value of issued capital.
Other contributed capital consists of Group contribution to Geely Sweden Holdings AB and unconditional shareholders’ contribution from Shanghai Geely Zhaoyuan International Investment Co., Ltd.
The currency translation reserve comprises exchange rate differ-ences of hedge instruments of net investments in foreign operations and all exchange rate differences resulting from the translation of financial reports of foreign operations that have prepared their finan-cial reports in a currency other than Volvo Car Group’s reporting cur-rency. The parent company and Volvo Car Group present their financial reports in Swedish krona (SEK).
The other reserve consists of the change in fair value of commercial cash flow hedging instruments in cases where hedge accounting is applied according to IAS 39, Financial Instruments: Recognition and Measurement.
Retained earnings comprises net income for the year and preceed-ing years as well as remeasurements of post-employment benefits. Retained earnings also include the effects of business combinations under common control within the Geely group.
Non-controlling interests refers to the share of equity that belongs to Zhejiang Geely Holding Group Co., Ltd without a controlling influ-ence. Volvo Car Group holds 50 per cent of the equity in the joint venture companies; Daqing Volvo Car Manufacturing Co., Ltd, Zhangji-akou Volvo Car Engine Manufacturing Co., Ltd and Shanghai Volvo Car Research and Development Co., Ltd and has the decision-making power over the operation. In the consolidated financial statements, these joint venture companies are classified as subsidiaries and fully consolidated with a non-controlling interest of 50 per cent. The non-controlling interest increased during the year through an acquisition with MSEK 140.
At year end 2016, non-controlling interests amounted to MSEK 3,774 (2,085).
Total equity consists of the equity attributable to the owners of the parent company and non-controlling interests. At year end 2016, the Volvo Car Group’s total equity amounted to MSEK 43,310 (34,635).
Change in other reserves 2016 2015
Balance at January 1 871 –746
Change in fair value of currency and electricity risk derivatives during the year –3,170 1,118
Currency risk contracts recognised in the income statement3) –771 955
Tax attributable to items recognised in other com-prehensive income 867 –456
Balance at December 31 –2,203 871
3) Included in the income statement under other operating income/expenses.
NOTES TO THE CONSOLIDATED FINANCIAL STATEMENTS
116 VOLVO CAR GROUP | ANNUAL REPORT 2016

The actuarial assumptions comprise the most significant assumptions applied when calculating defined benefit obligations at the balance sheet date. The company determines the discount rate based on AA-rated corporate bonds and mortage bonds that match the duration of the obligations. If no such corporate bonds and mortgage bonds are available, government bonds are used.
Inflation assumptions are based on a combination of central banks targets, implicit market expectations and long-term analyst forecasts.
Assumptions regarding future mortality experience are set based on actuarial advice in accordance with published statistics and experi-ence in each territory. Mortality assumptions for Sweden are based on the DUS14 (white collar) mortality study, and the DUS14 (white collar) mortality table is generational. Mortality assumptions in Belgium is not significant, since there are lump sum payments.
The actuarial assumptions are annually reviewed by the Volvo Car Group and modified when deemed appropriate to do so.
Total of which Sweden of which Belgium Total of which Sweden of which Belgium
Financial year ending on Dec 31, 2016 Dec 31, 2016 Dec 31, 2016 Dec 31, 2015 Dec 31, 2015 Dec 31, 2015
Amounts recognised in the statement of financial position
Defined benefit obligation 18,420 11,252 3,558 17,145 10,126 3,132
Fair value of plan assets 12,072 7,343 2,261 12,444 7,316 2,085
Funded status 6,348 3,909 1,297 4,701 2,810 1,047
Net liability (asset) as recorded in the balance sheets 6,348 3,909 1,297 4,701 2,810 1,047
Principal actuarial assumptions
Weighted average assumptions to determine benefit obligations
Discount rate 2.62% 2.90% 1.63% 3.08% 3.30% 2.14%
Rate of salary increase 3.14% 3.00% 3.17% 3.12% 3.00% 3.00%
Rate of price inflation 1.82% 1.50% 2.00% 1.79% 1.50% 2.00%
Rate of pension indexation 1.76% 1.50% N/A 1.73% 1.50% N/A
BelgiumIn Belgium, Volvo Car Group has three retirement − indemnity plans, all are funded. All three are based on the Collective Labor Agreement applicable to the company. The pension plan for white collar employ-ees and the closed plan for blue collar employees who were in service before 2009 are defined benefit plans. The benefits are based on the final salary and the seniority within the company. The pension plan for blue collars who are in service as from 2009 is a defined contribution plan. The pension obligations are secured through a transfer of the required funds to a separate pension fund. The funding of the obliga-tions under these defined benefit and defined contribution pension plans is fully externalised through a number of pension funds and through insurance contracts.
In Belgium, the Volvo Car Group also has early retirement arrange-ments (termination benefits − bridge plans) as well as seniority premi-ums (other long-term benefits). The early retirement arrangements are unfunded and the seniority premiums are funded.
Summary of provision for post-employment benefitsThe obligations for post-employment benefits have been recorded in the balance sheet as follows:
Dec 31, 2016
Dec 31, 2015
Post-employment benefits 6,348 4,701
Other provisions (Note 25) 262 288
Closing balance 6,610 4,989
The tables below show the Group’s obligations for post-employment benefits, the assumptions used to determine these obligations and the assets relating to these obligations for employee benefits, as well as the amounts recognised in the income statement and balance sheet. The Group’s reported pension liability totals MSEK 6,610 (4,989), which sum includes endowment insurances and similar undertakings totalling MSEK 262 (288) in respect of defined premium pension plans in Sweden.
Total of which Sweden of which Belgium Total of which Sweden of which Belgium
Financial year ending on Dec 31, 2016 Dec 31, 2016 Dec 31, 2016 Dec 31, 2015 Dec 31, 2015 Dec 31, 2015
Change in defined benefit obligation
Defined benefit obligation at end of prior year 17,145 10,126 3,132 18,271 11,018 3,185
Service cost 597 370 173 628 421 172
Interest expense 502 330 68 473 283 64
Cash flows –1,236 –248 –85 –552 –243 –104
Remeasurements 1,356 674 133 –1,627 –1,353 –80
Effect of changes in foreign exchange rates 56 — 137 –48 — –105
Defined benefit obligation at end of year 18,420 11,252 3,558 17,145 10,126 3,132
NOTES TO THE CONSOLIDATED FINANCIAL STATEMENTS
VOLVO CAR GROUP | ANNUAL REPORT 2016 117ANNUAL REPORT 2016 | VOLVO CAR GROUP
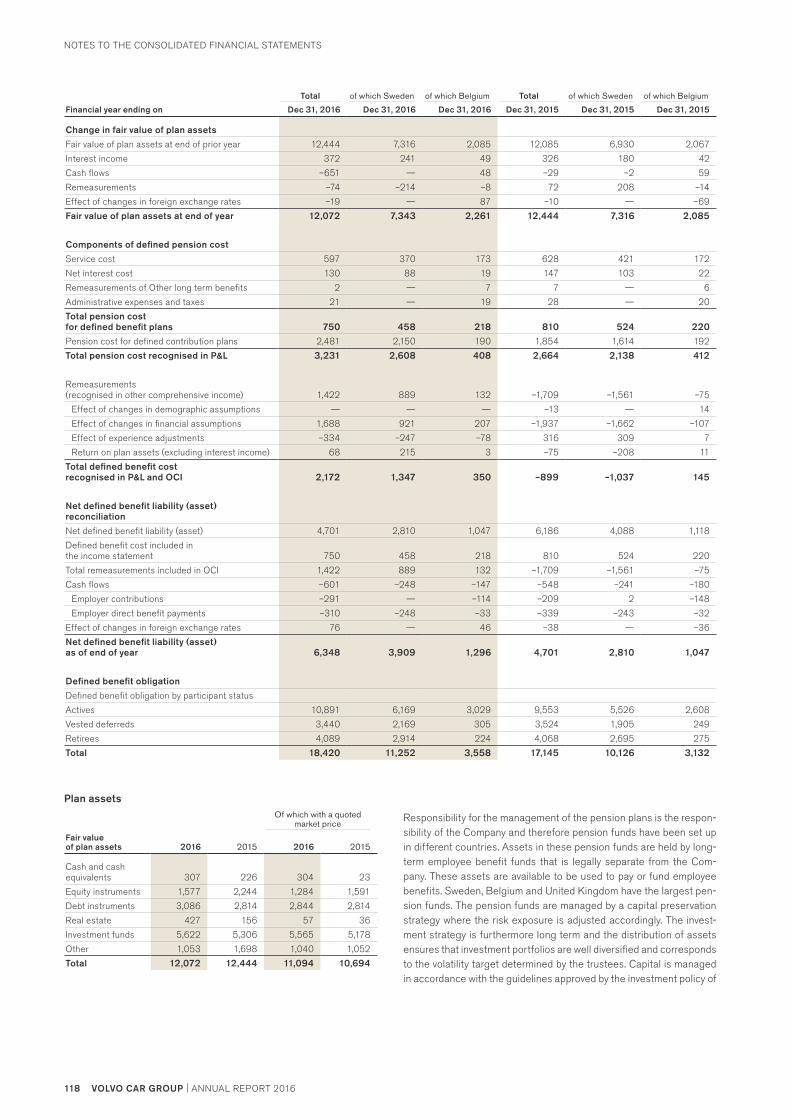
Plan assetsOf which with a quoted
market price
Fair value of plan assets 2016 2015 2016 2015
Cash and cash equivalents 307 226 304 23
Equity instruments 1,577 2,244 1,284 1,591
Debt instruments 3,086 2,814 2,844 2,814
Real estate 427 156 57 36
Investment funds 5,622 5,306 5,565 5,178
Other 1,053 1,698 1,040 1,052
Total 12,072 12,444 11,094 10,694
Total of which Sweden of which Belgium Total of which Sweden of which Belgium
Financial year ending on Dec 31, 2016 Dec 31, 2016 Dec 31, 2016 Dec 31, 2015 Dec 31, 2015 Dec 31, 2015
Change in fair value of plan assets
Fair value of plan assets at end of prior year 12,444 7,316 2,085 12,085 6,930 2,067
Interest income 372 241 49 326 180 42
Cash flows –651 — 48 –29 –2 59
Remeasurements –74 –214 –8 72 208 –14
Effect of changes in foreign exchange rates –19 — 87 –10 — –69
Fair value of plan assets at end of year 12,072 7,343 2,261 12,444 7,316 2,085
Components of defined pension cost
Service cost 597 370 173 628 421 172
Net interest cost 130 88 19 147 103 22
Remeasurements of Other long term benefits 2 — 7 7 — 6
Administrative expenses and taxes 21 — 19 28 — 20
Total pension cost for defined benefit plans 750 458 218 810 524 220
Pension cost for defined contribution plans 2,481 2,150 190 1,854 1,614 192
Total pension cost recognised in P&L 3,231 2,608 408 2,664 2,138 412
Remeasurements (recognised in other comprehensive income) 1,422 889 132 –1,709 –1,561 –75
Effect of changes in demographic assumptions — — — –13 — 14
Effect of changes in financial assumptions 1,688 921 207 –1,937 –1,662 –107
Effect of experience adjustments –334 –247 –78 316 309 7
Return on plan assets (excluding interest income) 68 215 3 –75 –208 11
Total defined benefit cost recognised in P&L and OCI 2,172 1,347 350 –899 –1,037 145
Net defined benefit liability (asset) reconciliation
Net defined benefit liability (asset) 4,701 2,810 1,047 6,186 4,088 1,118
Defined benefit cost included in the income statement 750 458 218 810 524 220
Total remeasurements included in OCI 1,422 889 132 –1,709 –1,561 –75
Cash flows –601 –248 –147 –548 –241 –180
Employer contributions –291 — –114 –209 2 –148
Employer direct benefit payments –310 –248 –33 –339 –243 –32
Effect of changes in foreign exchange rates 76 — 46 –38 — –36
Net defined benefit liability (asset) as of end of year 6,348 3,909 1,296 4,701 2,810 1,047
Defined benefit obligation
Defined benefit obligation by participant status
Actives 10,891 6,169 3,029 9,553 5,526 2,608
Vested deferreds 3,440 2,169 305 3,524 1,905 249
Retirees 4,089 2,914 224 4,068 2,695 275
Total 18,420 11,252 3,558 17,145 10,126 3,132
Responsibility for the management of the pension plans is the respon-sibility of the Company and therefore pension funds have been set up in different countries. Assets in these pension funds are held by long-term employee benefit funds that is legally separate from the Com-pany. These assets are available to be used to pay or fund employee benefits. Sweden, Belgium and United Kingdom have the largest pen-sion funds. The pension funds are managed by a capital preservation strategy where the risk exposure is adjusted accordingly. The invest-ment strategy is furthermore long term and the distribution of assets ensures that investment portfolios are well diversified and corresponds to the volatility target determined by the trustees. Capital is managed in accordance with the guidelines approved by the investment policy of
NOTES TO THE CONSOLIDATED FINANCIAL STATEMENTS
118 VOLVO CAR GROUP | ANNUAL REPORT 2016

NOTE 25 – CURRENT AND OTHER NON–CURRENT PROVISIONS
Warranties Service contractsOther sales generated
obligations Other provisions Total
Balance at January 1, 2016 5,184 3,587 7,157 2,437 18,365
Provided for during the year 6,667 6,152 18,415 8,504 39,738
Utilised during the year –5,483 –5,803 –17,241 –7,644 –36,171
Reversal of unutilised amounts –25 — –99 –107 –231
Translational differences and other 72 114 208 271 665
Balance at December 31, 2016 6,415 4,050 8,440 3,461 22,366
Of which current 2,817 1,459 8,440 2,655 15,371
Of which non-current 3,598 2,591 — 806 6,995
WarrantiesWarranty provisions include the cost for the company of satisfying the customers with specific contractual warranty obligations, as well as other costs not covered by contractual commitments. The provision comprise of confirmed claims and estimated future obligations.
Service contractsVolvo Car Group is on some markets offering service contracts for customers, this is normally referred to as Extended Service Business. The customer sign up for regular services, paid for upfront or by monthly payments. The contracts can also be a marketing promotion.
Other sales generated obligationsProvisions for sales revenue generated obligations not effectuated at the closing date, all variable marketing programs.
Other provisionsOther provisions cover a wide range of identified risks and uncertain obligations such as incentive programs and residual value guarantee issued to independent financing providers. For residual value guaran-tees a provision is recorded for the residual value risk related to the guarantee based upon estimations of the used products’ future net realisable values. For additional information regarding accounting principles for provisions and the related risks, see Note 1 - Accounting principles and Note 2 – Critical accounting estimates and judgements.
the pension funds, said policy is reviewed and updated on a yearly basis. Continuous monitoring is done by the trustees on a monthly basis to ensure that capital is allocated and managed according to the guidelines set forth. In Sweden the minimum funding target is decided by PRI Pensionsgaranti, this is mandatory in order to stay in the system and receive insurance for the pension liability.
Volvo Car Group has a wholly-owned subsidiary, VCG Investment Management AB (“VCGIM”) to manage the Group´s pension fund assets. Volvo Cars shared-services approach to Group pension fund management aims to strengthen the control over Group pension assets and VCGIM have a strategic advisory role and run a central cross-border investment management and advisory services to Volvo Cars pension funds based in Europe or elsewhere. VCGIM is author-ised and regulated by the Swedish Financial Services Authority as Investment Advisor and Discretionary Portfolio Management and is furthermore also licensed to operate in the United Kingdom and Bel-gium to perform the services mentioned above.
The in-house management of group pension assets on a global basis, benefit from investment accountability, consolidation of capital allocation, risk management and cost efficiency. The investment man-agement model for pension assets is focused on risk adjusted returns and alpha generation and has dramatically reduced the dependence on marketable securities beta.
The actual return on plan assets amounts to MSEK 298 (399).
Risks There are mainly three categories of risks related to defined benefit obligations and pension plans. The first category relates to risks affecting the actual pension payments. Increased longevity and infla-tion of salary and pensions are the principle risks that may increase the future pension payments and hence, increase the pension obliga-tion. The second category relates to investment return. Pension plan assets are invested in a variety of financial instruments and are exposed to market fluctuations. Poor investment return may reduce the value of investments and render them insufficient to cover future pension payments. The final category relates to measurement and affects the accounting for pensions. The discount rate used for meas-uring the present value of the obligation may fluctuate which impacts the valuation of the defined benefit obligation. The discount rate also impacts the size of the interest income and expense that is reported in the financial items and the service cost. The risk related to pension obligations, i.e. mortality exposure, discount rate and inflation, are monitored on an ongoing basis.
Sensitivity analysis on defined benefit obligation Sweden Belgium
Discount rate +0,5% –1,137 –196
Discount rate –0,5% 1,300 215
The weighted average duration of the obligation is 21.6 years for Swe-den and 11.5 years for Belgium.
NOTES TO THE CONSOLIDATED FINANCIAL STATEMENTS
VOLVO CAR GROUP | ANNUAL REPORT 2016 119ANNUAL REPORT 2016 | VOLVO CAR GROUP

NOTE 29 – CONTINGENT LIABILITIESDec 31,
2016Dec 31,
2015
Guarantees to insurance company FPG 133 127
Legal claims1) 271 42
Tax claims1) 2) 88 108
Other contingent liabilities3) 204 135
Total 696 412
1) Legal proceedings and tax processes are further explained in Note 2 – Critical accounting estimates and judgements.
2) In addition to the contingent liabilities related to tax claims there are also tax related contingent assets amounting to MSEK 39 (36).
3) Apart from the above contingent liabilities, there are other commitments and guarantees that are not recognised since the likelihood of an outflow of resources is very low.
NOTE 30 – CASH FLOW STATEMENTS2016 2015
Adjustments for items not affecting cash flow consist of:
Capital gains/losses on sale of tangible and intangible assets 758 126
Share of income in joint ventures and associates –418 –230
Interest effect from the measurement of repurchase obligations –215 –170
Provision for variable pay 348 —
Other non-cash items 49 39
Total 522 –235
“Other” under cash flow from financing activitites is attributable to realised result from financial instruments MSEK 481 (482) and change in other non-current liablitities MSEK –120 (150).
NOTE 31 – BUSINESS COMBINATIONS
First Rent A Car On December 28, 2016 Volvo Car Group, through one of its wholly owned subsidiaries Volvo Personvagnar Norden AB, exercised a call option and entered into an agreement to acquire the remaining 55 per cent of the shares in the car hire company First Rent A Car AB, the Swedish license holder to Hertz International Ltd. At the same time the terms of the option was finally negotiated and agreed with the seller. The finalisation of the transaction is depending on an approval from the European Commission, which is expected during the first quarter 2017. At finalisation of the transaction, Volvo Car Group will have a 100 per cent shareholding in First Rent A Car AB. Based on the agreement with the selling party, Volvo Cars has assessed to have the power of control, from an accounting perspective, of First Rent A Car AB from the time of the agreement and hence, First Rent A Car Group has been consolidated into Volvo Car Group as of December 31, 2016.
Apart from the parent company, First Rent A Car Group consists of the wholly owned subsidiaries First Rent Invest AB (with 50 per cent interest in Bra Bil Sverige AB), First Rent Holding Group (including the wholly owned subsidiaries, First Rent A Car Norway AS and First Rent A Car A/S, Denmark), Sunfleet Carsharing AB and the Biltween Group.
After the acquisition, Volvo Car Group holds, through the First Rent A Car Group, 50 per cent of the shares in Bra Bil Group. First Rent A Car Group is assessed to have the power of control over Bra Bil Group, through its 50 per cent ownership in combination with a shareholder agreement. As a result, Bra Bil Group is classified as subsidiary and fully consolidated into Volvo Car Group, as a part of First Rent A Car Group, with a non-controlling interest of 50 per cent. During the period from signing to approval from the European Commission, First Rent A Car Group will conduct as previously.
NOTE 26 – NON–CURRENT LIABILITIESDec 31,
2016Dec 31,
2015
Bonds
Bonds 7,699 —
Total 7,699 —
Dec 31, 2016
Dec 31, 2015
Non-current liabilities to credit institutions
Bank loans 13,855 15,103
Liabilities related to finance lease contracts 55 65
Total 13,910 15,168
Current liabilities to credit institutions 2,813 6,246
Liabilities to credit institutionsIn 2015, the shares of Volvo Car Corporation were pledged for the liabilities to credit institutions amounting to MSEK — (14,469), in 2016 this share pledge was released. Details of the Group’s exposure to risks arising from current and non-current borrowings are set out in Note 21 – Financial risks and financial instruments.
Volvo Car Group has the following undrawn committed credit facilities:
Dec 31, 2016
Dec 31, 2015
Floating rate
– Expiring after one year but within five years 6,305 6,055
Total 6,305 6,055
Dec 31, 2016
Dec 31, 2015
Other non-current liabilities
Liabilities related to repurchase agreements 941 797
Deferred leasing revenue 372 533
Derivative liabilities 1,843 117
Other liabilities1) 2,662 1,480
Total 5,818 2,927
1) Whereof liabilities to related parties MSEK 1,383 (941). For further informa-tion regarding related parties, see Note 5 – Related parties.
NOTE 27 – OTHER CURRENT LIABILITIESDec 31,
2016Dec 31,
2015
Accrued expenses and prepaid income 9,055 7,309
Liabilities related to repurchase agreements 5,818 5,237
Personnel related liabilities 4,571 3,937
VAT liabilities 2,343 2,454
Hedging instruments 2,063 379
Deferred leasing revenue 917 777
Other liabilities 1,387 1,152
Total 26,154 21,245
NOTE 28 – PLEDGED ASSETSDec 31,
2016Dec 31,
2015
Shares in subsidiaries — 25,687
Restricted cash 107 99
Inventory 367 318
Real estate mortgages 161 —
Floating charges 149 —
Other pledged assets 273 —
Total 1,057 26,104
NOTES TO THE CONSOLIDATED FINANCIAL STATEMENTS
120 VOLVO CAR GROUP | ANNUAL REPORT 2016

assumed and collateral pledged, arising from the acquisition, amounted to MSEK 584. The fair value of the acquired receivables (which primar-ily comprises account receivables) corresponds to the gross contrac-tual value and amounts to MSEK 684. All receivables are expected to be collectible.
The acquired business has not contributed to any net revenue or net income in the Group during the period December 28 to December 31, 2016. The total cost of combination and fair values have been deter-mined provisionally, thus, the acquisition analyses may be subject to adjustment during a twelve months period.
Note 32 – SEGMENT REPORTING
Operating segments are defined as components of the Group about which separate financial information is available that is evaluated regu-larly by the chief operating decision-maker, or decision-making group, in deciding how to allocate resources and in assessing performance. Volvo Car Group is managed by the Executive management team (EMT) with fourteen members, led by the CEO and overseen by the Board of Directors. EMT takes all significant operating decisions and members of EMT have the responsibility for implementation of deci-sions in their respective areas. The operating decision-making is at EMT level as a whole and Volvo Car Group consider the EMT to be the Chief operating decision-making body.
Volvo Car Group, as a whole, operates in the automotive business. The automotive business includes all activities related to development, design, manufacturing, assembly and sale of vehicles, as well as sale of related parts and accessories from which the Group derives its rev-enues. All decisions regarding allocation of resources as well as the assessment of the performance is based on the Group as a whole. Volvo Car Group only has one operating segment, so no separate seg-ment report is given.
For further information of the geographic spread of Net revenue, see Note 3 – Net revenue. The geographic spread of non-current assets is disclosed below.
Sweden ChinaRest of
the World
Dec 31, 2016
Non-current assets 73% 15% 12%
Dec 31, 2015
Non-current assets 76% 13% 11%
The acquisition of First Rent A Car is in-line with Volvo Car Group’s strategy to strengthen its customer focus and meet new changing consumer expectations around how to own and engage with cars. First Rent A Car’s product offering of on-demand mobility solutions is highly complementary with Volvo Car’s product portfolio and will enhance, but also provide an opportunity to expand, the Group’s car ownership models.
Purchase price
Purchase consideration 15
Fair value of investment in associated company held before the business combination 76
Total cost of the combination 91
Acquired assets and liabilities at fair value
Intangible assets 14
Tangible assets 746
Financial assets 927
Inventories 230
Current receivables 684
Other current assets 45
Cash and cash equivalents 177
Non-controlling interest –140
Deferred tax liabilities –38
Other non-current liabilities –1 480
Current liabilities –961
Total fair value of net assets 204
Negative goodwill –113
Cash effect on business combination
Cash paid for acquisitions during the year —
Acquired cash and cash equivalents 177
Change in cash and cash equivalents due to acquisitions 177
Volvo Car Groups’ assessment is that the carrying value, of the previ-ously held equity interest, is a reasonable estimate of the fair value and as a consequence no adjustments have been made. The business combination results in a negative goodwill of MSEK 113, since the fair value of the acquired net assets exceeds the total cost of the combina-tion. Volvo Car Group has recognised the gain in other operating income. The negative goodwill on the acquisition is primarly related to the exercise of a call option where the purchase price of the shares has been finally determined in negotiations connected with the call of the option. Acquisition-related costs amounted to MSEK 1 and have been recognised as administration costs. Contingent liabilities
NOTES TO THE CONSOLIDATED FINANCIAL STATEMENTS
VOLVO CAR GROUP | ANNUAL REPORT 2016 121ANNUAL REPORT 2016 | VOLVO CAR GROUP
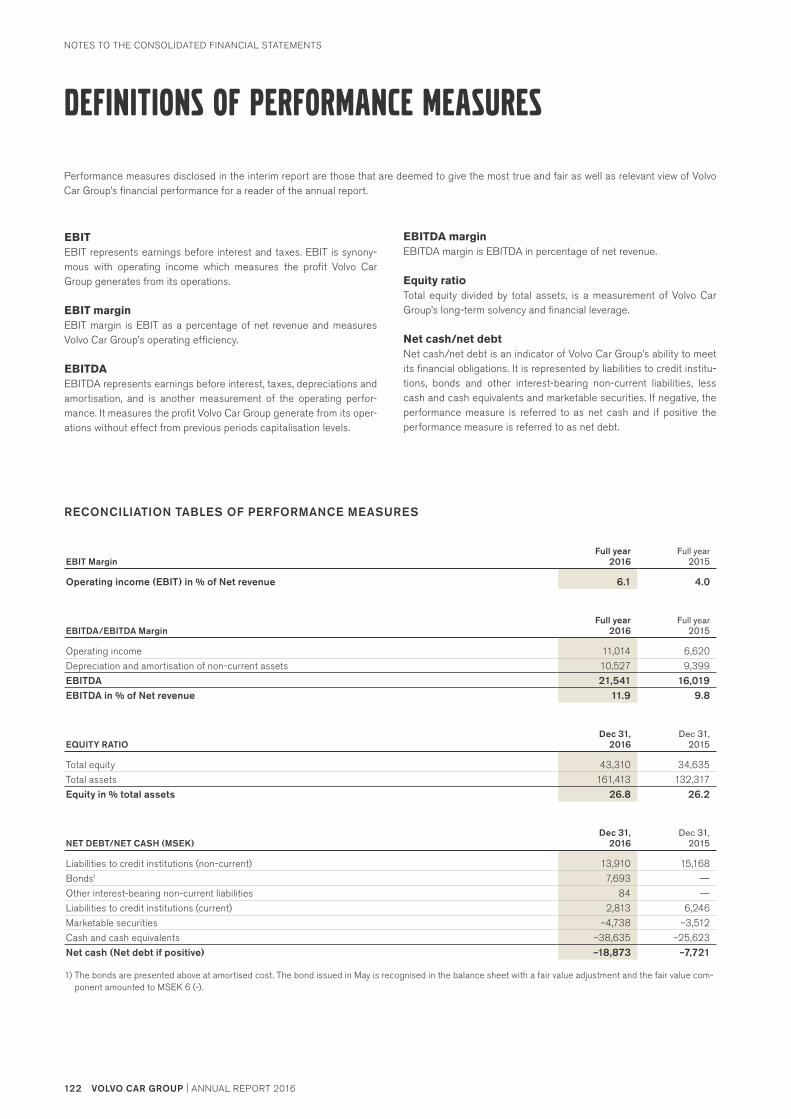
EBITEBIT represents earnings before interest and taxes. EBIT is synony-mous with operating income which measures the profit Volvo Car Group generates from its operations.
EBIT marginEBIT margin is EBIT as a percentage of net revenue and measures Volvo Car Group’s operating efficiency.
EBITDAEBITDA represents earnings before interest, taxes, depreciations and amortisation, and is another measurement of the operating perfor-mance. It measures the profit Volvo Car Group generate from its oper-ations without effect from previous periods capitalisation levels.
EBITDA marginEBITDA margin is EBITDA in percentage of net revenue.
Equity ratioTotal equity divided by total assets, is a measurement of Volvo Car Group’s long-term solvency and financial leverage.
Net cash/net debtNet cash/net debt is an indicator of Volvo Car Group’s ability to meet its financial obligations. It is represented by liabilities to credit institu-tions, bonds and other interest-bearing non- current liabilities, less cash and cash equivalents and marketable securities. If negative, the performance measure is referred to as net cash and if positive the performance measure is referred to as net debt.
Performance measures disclosed in the interim report are those that are deemed to give the most true and fair as well as relevant view of Volvo Car Group’s financial performance for a reader of the annual report.
DEFINITIONS OF PERFORMANCE MEASURES
RECONCILIATION TABLES OF PERFORMANCE MEASURES
EBIT MarginFull year
2016Full year
2015
Operating income (EBIT) in % of Net revenue 6.1 4.0
EBITDA/EBITDA MarginFull year
2016Full year
2015
Operating income 11,014 6,620
Depreciation and amortisation of non-current assets 10,527 9,399
EBITDA 21,541 16,019EBITDA in % of Net revenue 11.9 9.8
EQUITY RATIODec 31,
2016Dec 31,
2015
Total equity 43,310 34,635
Total assets 161,413 132,317
Equity in % total assets 26.8 26.2
NET DEBT/NET CASH (MSEK)Dec 31,
2016Dec 31,
2015
Liabilities to credit institutions (non-current) 13,910 15,168
Bonds1 7,693 —
Other interest-bearing non-current liabilities 84 —
Liabilities to credit institutions (current) 2,813 6,246
Marketable securities –4,738 –3,512
Cash and cash equivalents –38,635 –25,623
Net cash (Net debt if positive) –18,873 –7,721
1) The bonds are presented above at amortised cost. The bond issued in May is recognised in the balance sheet with a fair value adjustment and the fair value com-ponent amounted to MSEK 6 (-).
NOTES TO THE CONSOLIDATED FINANCIAL STATEMENTS
122 VOLVO CAR GROUP | ANNUAL REPORT 2016

MSEK Note Dec 31, 2016 Dec 31, 2015
ASSETSNon-current assetsParticipation in subsidiary 8 10,267 10,267
Deferred tax assets 7 2,104 2,033
Receivables from group companies 3 7,729 —
Total non-current assets 20,100 12,300
Current assetsReceivables from group companies 3 5,021 —
Total current assets 5,021 —
TOTAL ASSETS 25,121 12,300
EQUITY AND LIABILITIESEquity 9
Restricted equityShare capital (50,500,000 shares with par value of 1 SEK) 51 —
51 —Non-restricted equityShare premium reserve 11,424 6,509
Retained earnings –3,564 –3,514
Net income –246 —
7,614 2,995Total equity 7,665 2,995
Non-current liabilitiesBonds 10 7,728 —
Non-current liabilities to group companies 3 9,473 9,240
Other non-current liabilities 137 65
Total non-current liabilities 17,338 9,305
Current liabilitiesLiabilities to group companies 3 33 —
Accrued expenses and prepaid income 85 —
Total current liabilities 118 —TOTAL EQUITY AND LIABILITIES 25,121 12,300
BALANCE SHEETS – PARENT COMPANY
MSEK Note 2016 2015
Administrative expenses 4 –10 —
Operating income 3,5 –10 —
Financial income 6 107 —
Financial expenses 6 –414 —
Income before tax –317 —
Income tax 7 71 —
Net income –246 —
Other comprehensive income and net income are consistent since there are no items in other comprehensive income.
INCOME STATEMENTS AND COMPREHENSIVE INCOME – PARENT COMPANY
PARENT COMPANY FINANCIAL STATEMENTS
VOLVO CAR GROUP | ANNUAL REPORT 2016 123ANNUAL REPORT 2016 | VOLVO CAR GROUP

Restricted equity Non-restricted equity
MSEK Share capital1)
Share premium
reserve
Other contributed
capitalRetained earnings Total
Balance at January 1, 2015 — 6,509 3,693 — 10,202Net income for the year — — — — —
Transactions with ownersGroup contributions2) — — –7,207 — –7,207
Balance at December 31, 2015 — 6,509 –3,514 — 2,995Net income for the year — — — –246 –246
Transactions with ownersBonus issue 50 — –50 — —
New issue of preference shares 1 4,915 — — 4,916
Balance at December 31, 2016 51 11,424 –3,564 –246 7,665
1) Share capital amounts to SEK 50,500,000 (100,000)2) Group contribution before tax amounted to MSEK — (9,240).
CHANGES IN EQUITY – PARENT COMPANY
STATEMENT OF CASH FLOWS – PARENT COMPANYMSEK Note 2016 2015
OPERATING ACTIVITIESMovements in working capitalChange of current recievable group companies 3 –5,021 —
Change of current liabilities 45 —
Cash flow from movements in working capital –4,976 —Cash flow from operating activities –4,976 —
Cash flow from investing activities — —Cash flow from operating and investing activities — —
FINANCING ACTIVITIESBonds 10 7,621 —
Change of non current recievable group companies 3 –7,624 —
Issue preference share 9 4,979 —
Cash flow from financing activities 4,976 —Cash flow for the year — —
Cash and cash equivalents at beginning of year — —Cash and cash equivalents at end of year — —
PARENT COMPANY FINANCIAL STATEMENTS
124 VOLVO CAR GROUP | ANNUAL REPORT 2016

NOTE 1 – ACCOUNTING PRINCIPLES
Basis of preparationThe Parent Company has prepared its financial statements in accord-ance with the Swedish Annual Accounts Act (1995:1554) and RFR 2, Accounting for Legal entities. According to RFR 2, the Parent Com-pany shall apply all the International Financial Reporting Standards endorsed by the EU as far as this is possible within the framework of the Swedish Annual Accounts Act. Changes in RFR 2 applicable to the fiscal year beginning January 1, 2016, have had no material impact on the financial statements of the Parent Company.
RFR 2 in the Parent Company was implemented in 2015. This has had no material impact on the financial statements in relation to the comparative figures.
The accounting principles applied by the Volvo Car Group are described in Note 1 – Accounting principles, to the consolidated financial statements. The main deviations between the accounting policies applied by the Volvo Car Group and the Parent Company are described below.
Shares and participations in Group companies Shares and participations in Group companies are recognised at cost in the Parent Company’s balance sheet and test for impairment is per-formed annually. Dividends are recognised in the income statement. All shares and participations are related to business operations and profit and loss from these are reported within Operating income.
Transaction costs directly attributable to acquisitions of shares and participations in Group companies are accounted for as an increase in the carrying amount of the shares.
Distributed group contributions to subsidiaries are reported as an increase of investments in these subsidiaries. A review is made whether or not there is an impairment need on the shares of the sub-sidiaries having received the group contributions. Tax effect of these distributed group contributions are reported in accordance with RFR 2 IAS 12 in the income statement. Distributed group contributions to parent company are recorded in equity, along with the tax effect.
Received group contributions from subsidiaries are recorded as financial income. Tax effect on these received group contributions are reported in accordance with RFR 2, IAS 12 in the income statement. Received group contributions from parent company are recorded in equity, along with the tax effect.
Distributed shareholders’ contributions are recognised in shares in subsidiaries and as such they are subject to impairment testing.
Mergers of subsidiaries (100% ownership) are recorded according to BFNAR 1999:1 (recommendation 1999:1 from the Swedish Accounting Standards Board). Downstream mergers are recorded in accordance with RedR9 (recommendation 9 from the Swedish Insti-tute of Authorized Public Accountants).
NOTES TO THE parent company FINANCIAL STATEMENTSAll amounts are in MSEK unless otherwise stated. Amounts in brackets refer to the preceding year.
Financial guaranteesThe Parent Company applies the exception in the application of IAS 39 which concerns accounting and measurement of financial con-tracts of guarantee in favour of subsidiaries and associated compa-nies. The Parent Company recognises the financial contracts of guar-antee as contingent liabilities.
Post-employment benefitsAccording to RFR 2, application of the regulations in IAS 19 regarding defined benefit plans is not mandatory for legal entities. However, IAS 19 shall be adopted regarding supplementary disclosures when appli-cable. RFR 2 refers to the Swedish law on safeguarding of pension commitments (“tryggandelagen”) regarding recording of “Provisions for post-employment benefits” in the balance sheet and of plan assets in pension foundations. In neither 2016 nor 2015 are there any employees in the parent company.
Income taxesDeferred tax liability on untaxed reserves are included in untaxed reserves in the parent company.
EquityIn accordance with the Swedish Annual Accounts Act, equity is split between restricted and non-restricted equity.
NOTE 2 – CRITICAL ACCOUNTING ESTIMATES AND JUDGEMENTS
Preparation of the financial statements in accordance with the Swedish Annual Accounts Act (1995:1554) and RFR 2 requires the Company’s Executive Management and Board of Directors to make estimations and assessments as well as to make assumptions that affect applica-tion of the accounting policies and the reported assets, liabilities, income and expenses. Critical accounting estimates and judgements applied by the Volvo Car Group are described in Note 2 – Critical accounting estimates and judgements, to the consolidated financial statements. None of these critical accounting estimates are applicable to the parent company, with the exception of impairment. Shares and participations in Group companies recognised at cost in the Parent Company are being tested for impairment annually.
NOTES TO THE PARENT COMPANY FINANCIAL STATEMENTS
VOLVO CAR GROUP | ANNUAL REPORT 2016 125ANNUAL REPORT 2016 | VOLVO CAR GROUP
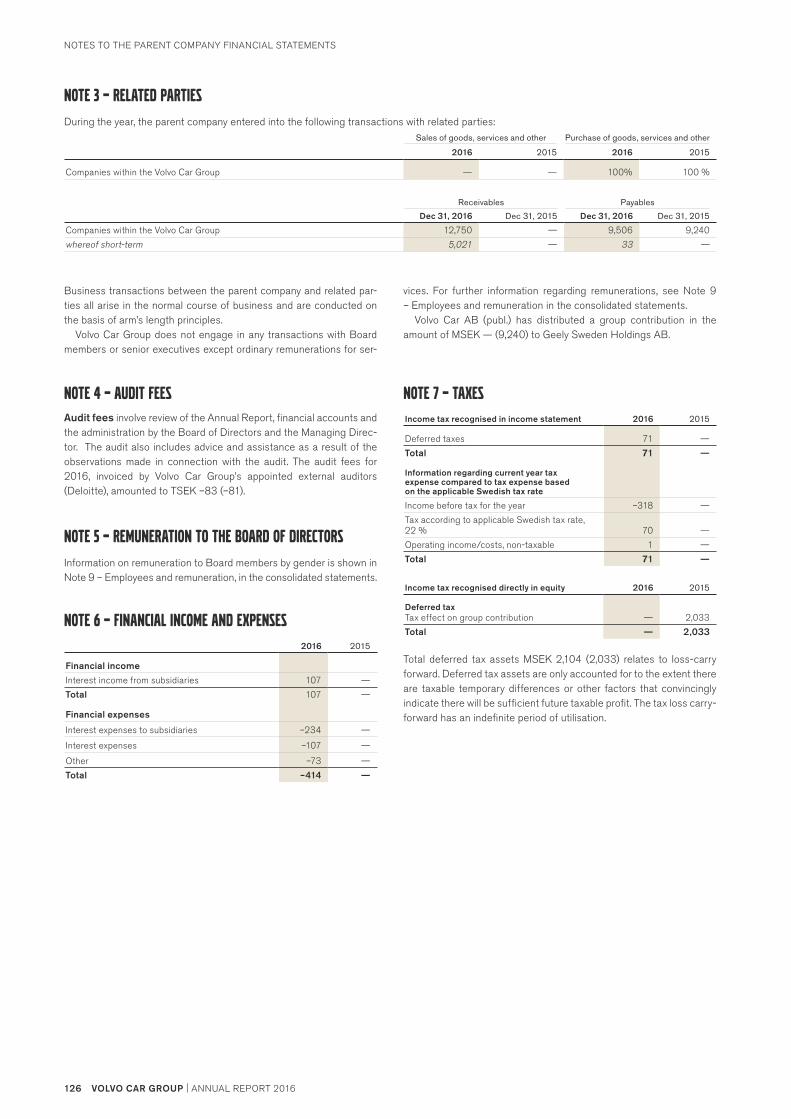
NOTE 4 – AUDIT FEESAudit fees involve review of the Annual Report, financial accounts and the administration by the Board of Directors and the Managing Direc-tor. The audit also includes advice and assistance as a result of the observations made in connection with the audit. The audit fees for 2016, invoiced by Volvo Car Group’s appointed external auditors (Deloitte), amounted to TSEK –83 (–81).
NOTE 5 – REMUNERATION TO THE BOARD OF DIRECTORS
Information on remuneration to Board members by gender is shown in Note 9 – Employees and remuneration, in the consolidated statements.
NOTE 6 – FINANCIAL INCOME AND EXPENSES
2016 2015
Financial income
Interest income from subsidiaries 107 —
Total 107 —
Financial expenses
Interest expenses to subsidiaries –234 —
Interest expenses –107 —
Other –73 —
Total –414 —
NOTE 7 – TAXES
Income tax recognised in income statement 2016 2015
Deferred taxes 71 —
Total 71 —
Information regarding current year tax expense compared to tax expense based on the applicable Swedish tax rate
Income before tax for the year –318 —
Tax according to applicable Swedish tax rate, 22 % 70 —
Operating income/costs, non-taxable 1 —
Total 71 —
Income tax recognised directly in equity 2016 2015
Deferred taxTax effect on group contribution — 2,033
Total — 2,033
Total deferred tax assets MSEK 2,104 (2,033) relates to loss-carry forward. Deferred tax assets are only accounted for to the extent there are taxable temporary differences or other factors that convincingly indicate there will be sufficient future taxable profit. The tax loss carry- forward has an indefinite period of utilisation.
NOTE 3 – related parties
During the year, the parent company entered into the following transactions with related parties:Sales of goods, services and other Purchase of goods, services and other
2016 2015 2016 2015
Companies within the Volvo Car Group — — 100% 100 %
Receivables Payables
Dec 31, 2016 Dec 31, 2015 Dec 31, 2016 Dec 31, 2015
Companies within the Volvo Car Group 12,750 — 9,506 9,240
whereof short-term 5,021 — 33 —
Business transactions between the parent company and related par-ties all arise in the normal course of business and are conducted on the basis of arm’s length principles.
Volvo Car Group does not engage in any transactions with Board members or senior executives except ordinary remunerations for ser-
vices. For further information regarding remunerations, see Note 9 – Employees and remuneration in the consolidated statements.
Volvo Car AB (publ.) has distributed a group contribution in the amount of MSEK — (9,240) to Geely Sweden Holdings AB.
NOTES TO THE PARENT COMPANY FINANCIAL STATEMENTS
126 VOLVO CAR GROUP | ANNUAL REPORT 2016
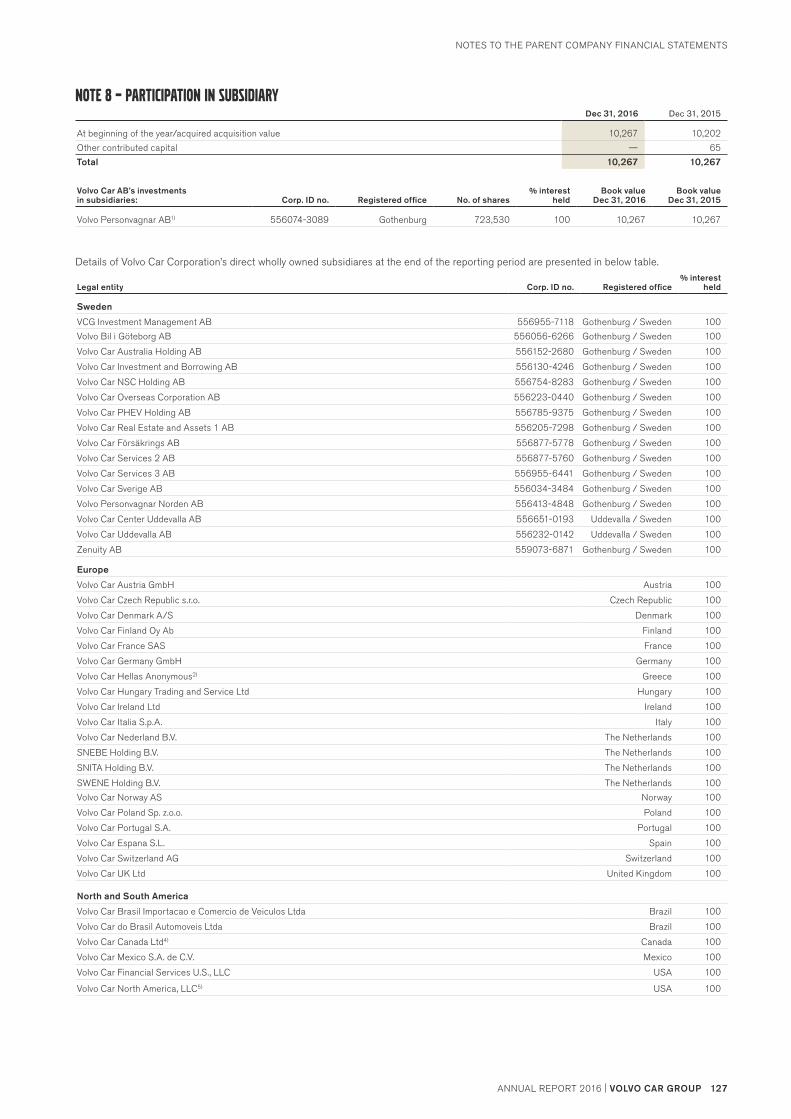
NOTE 8 – PARTICIPATION IN SUBSIDIARYDec 31, 2016 Dec 31, 2015
At beginning of the year/acquired acquisition value 10,267 10,202
Other contributed capital — 65
Total 10,267 10,267
Volvo Car AB’s investments in subsidiaries: Corp. ID no. Registered office No. of shares
% interest held
Book value Dec 31, 2016
Book value Dec 31, 2015
Volvo Personvagnar AB1) 556074-3089 Gothenburg 723,530 100 10,267 10,267
Details of Volvo Car Corporation’s direct wholly owned subsidiares at the end of the reporting period are presented in below table.
Legal entity Corp. ID no. Registered office% interest
held
Sweden
VCG Investment Management AB 556955-7118 Gothenburg / Sweden 100
Volvo Bil i Göteborg AB 556056-6266 Gothenburg / Sweden 100
Volvo Car Australia Holding AB 556152-2680 Gothenburg / Sweden 100
Volvo Car Investment and Borrowing AB 556130-4246 Gothenburg / Sweden 100
Volvo Car NSC Holding AB 556754-8283 Gothenburg / Sweden 100
Volvo Car Overseas Corporation AB 556223-0440 Gothenburg / Sweden 100
Volvo Car PHEV Holding AB 556785-9375 Gothenburg / Sweden 100
Volvo Car Real Estate and Assets 1 AB 556205-7298 Gothenburg / Sweden 100
Volvo Car Försäkrings AB 556877-5778 Gothenburg / Sweden 100
Volvo Car Services 2 AB 556877-5760 Gothenburg / Sweden 100
Volvo Car Services 3 AB 556955-6441 Gothenburg / Sweden 100
Volvo Car Sverige AB 556034-3484 Gothenburg / Sweden 100
Volvo Personvagnar Norden AB 556413-4848 Gothenburg / Sweden 100
Volvo Car Center Uddevalla AB 556651-0193 Uddevalla / Sweden 100
Volvo Car Uddevalla AB 556232-0142 Uddevalla / Sweden 100
Zenuity AB 559073-6871 Gothenburg / Sweden 100
Europe
Volvo Car Austria GmbH Austria 100
Volvo Car Czech Republic s.r.o. Czech Republic 100
Volvo Car Denmark A/S Denmark 100
Volvo Car Finland Oy Ab Finland 100
Volvo Car France SAS France 100
Volvo Car Germany GmbH Germany 100
Volvo Car Hellas Anonymous2) Greece 100
Volvo Car Hungary Trading and Service Ltd Hungary 100
Volvo Car Ireland Ltd Ireland 100
Volvo Car Italia S.p.A. Italy 100
Volvo Car Nederland B.V. The Netherlands 100
SNEBE Holding B.V. The Netherlands 100
SNITA Holding B.V. The Netherlands 100
SWENE Holding B.V. The Netherlands 100
Volvo Car Norway AS Norway 100
Volvo Car Poland Sp. z.o.o. Poland 100
Volvo Car Portugal S.A. Portugal 100
Volvo Car Espana S.L. Spain 100
Volvo Car Switzerland AG Switzerland 100
Volvo Car UK Ltd United Kingdom 100
North and South America
Volvo Car Brasil Importacao e Comercio de Veiculos Ltda Brazil 100
Volvo Car do Brasil Automoveis Ltda Brazil 100
Volvo Car Canada Ltd4) Canada 100
Volvo Car Mexico S.A. de C.V. Mexico 100
Volvo Car Financial Services U.S., LLC USA 100
Volvo Car North America, LLC5) USA 100
NOTES TO THE PARENT COMPANY FINANCIAL STATEMENTS
VOLVO CAR GROUP | ANNUAL REPORT 2016 127ANNUAL REPORT 2016 | VOLVO CAR GROUP

1) Refered to as Volvo Car Corporation 2) Legal name in full: Volvo Car Hellas Anonymous and Industrial company of car and spare parts imports and trade 3) Prior name: Volvo Car Asia Pacific (PTE) Ltd
The Executive Management has made the decision to create a coherent name structure globally in order to build the brand and corporate identity around Volvo Car. As a consequence some subsidiaries has changed name during the year. Below is the prior name stated.4) Prior name: Volvo Car of Canada Ltd.5) Prior name: Volvo Cars of North America, LLC
The share of voting power corresponds to holdings in per cent as per above. The countries where the subsidiaries are registered are also where their main operations are carried out.
Significant restrictionsFor some subsidiaries there are restrictions on the Volvo Car Group’s ability to access or use cash from these subsidiaries, for more informa-tion on cash that is not available or with other limitations, see Note 22 – Marketable securities and cash and cash equivalents in the consoli-dated financial statements.
NOTE 9 – EquityIn December, Volvo Car AB (publ.) directed a new issue of 500,000 preference shares to a group of institutional investors, whereby MSEK 5,000 (reduced by transaction costs) was added to equity. The prefer-ence shares may be repurchased or converted into listed ordinary shares, both upon the majority shareholder’s decision. At year end, no such decision has been taken. The issued preference shares are clas-sified as equity instruments, for further information, see Note 23 – Equity in the consolidated financial statements.
NOTE 10 – Bonds During the year, Volvo Car AB (publ.) has closed the issuance of two bonds. The first bond, a 5 year MEUR 500 bond was issued in May. The senior unsecured notes issued mature as of May 2021 and carry a fixed coupon rate of 3.25 per cent. The second bond was issued in November, a 5.25 year MSEK 3,000 bond split on a floating and fixed
Legal entity Corp. ID no. Registered office% interest
held
Africa and Asia
Volvo Cars (China) Investment Co., Ltd.6) China 100
Volvo Cars Technology (Shanghai) Co., Ltd. China 100
Volvo Auto India Pvt. Ltd India 100
Volvo Car Japan Ltd Japan 100
Volvo Car Korea Co., Ltd Korea 100
Volvo Car Manufacturing Malaysia Sdn Bhd Malaysia 100
Volvo Car Taiwan Ltd Taiwan 100
Volvo Car Turkey Otomobil Ltd Sirketi Turkey 100
Volvo Car Singapore PTE Ltd3) Singapore 100
Volvo Car South Africa Pty Ltd South Africa 100
tranche. The fixed tranche carry a coupon of 2.50 per cent and the floating tranche a coupon of Stibor 3m +235bps. The notes mature in March 2022. Both bonds have been listed on the Euro MTF list on the Luxumbourg stock exchange (Sociéte de la bourse de Luxembourg). For more information see Note 21 – Financial risks and financial instruments in the consolidated statements.
NOTE 11 – PLEDGED ASSETSDec 31, 2016 Dec 31, 2015
Shares in Volvo Car Corporation — 10,267
Total — 10,267
Pledged shares in subsidiaries at December 31, 2015, refer to a loan in the Volvo Car Corporation. In 2016, this loan has been re-negotiated whereby the assets pledged to this loan were released.
Registered office
% held by Zhejiang Geely
Holding Group Co., Ltd.Profit allocated to
non-controlling interestsAccumulated
non-controlling interests
Legal entity:Dec 31,
2016Dec 31,
2015Dec 31,
2016Dec 31,
2015Dec 31,
2016Dec 31,
2015
Daqing Volvo Car Manufacturing Co., Ltd. China 50 50 1,475 1,301 2,638 1,135
Zhangjiakou Volvo Car Engine Manufacturing Co., Ltd. China 50 50 39 45 892 849
Shanghai Volvo Car Research and Development Co., Ltd. China 50 50 2 — 104 101
Total non-controlling interests 1,516 1,346 3,634 2,085
Details of non-wholly owned subsidiaries that have material non-controlling interests6)
On June 25, 2015 Volvo Car Group has, through one of its wholly owned subsidiaries, Volvo Cars (China) Investment Co., Ltd, acquired an additional 20 per cent in Volvo Cars’ Chinese joint venture compa-nies. In the consolidated financial statements, these joint venture com-panies are classified as subsidiaries and fully consolidated with a non-controlling interest of 50 per cent since Volvo Car Group has the decision-making power over the operations. Additionally, Daqing Volvo Car Manufacturing Co., Ltd has acquired 100 per cent of the shares in Volvo Car (Asia Pacific) Investment Holding Co., Ltd which holds 100 per cent of Zhongjia Automobile Manufacturing (Chengdu) Co., Ltd and Shanghai Zhawo Auto Sales Co., Ltd.
The table below shows details of non-wholly owned subsidiaries of the Group that have material non-controlling interests.
NOTES TO THE PARENT COMPANY FINANCIAL STATEMENTS
128 VOLVO CAR GROUP | ANNUAL REPORT 2016

PROPOSED DISTRIBUTION OF Non-restricted equity
Gothenburg, March 16, 2017
Li ShufuChairman of the board
Håkan Samuelsson Mikael OlssonBoard member and CEO Board member
Dr Peng Zhang Li DonghuiBoard member Board member
Lone Føns Schrøder Carl Peter ForsterBoard member Board member
Betsy Atkins Winnie K.W. FokBoard member Board member
Thomas Johnstone Marko PeltonenBoard member Employee representative
Jörgen Olsson Glenn BergströmEmployee representative Employee representative
Our audit report was submitted on March 16, 2017Deloitte AB
Jan NilssonAuthorized Public Accountant
The parent companyThe following funds are at the disposal of Annual General Meeting (AGM):
Share premium reserve SEK 11,424,824,648
Retained earnings brought forward SEK –3,564,046,506
Net income for the year SEK –246,652,842
At the disposal of the AGM SEK 7,614,125,300
The Board proposes the following allocations of funds:
Carried forward SEK 7,614,125,300
VOLVO CAR GROUP | ANNUAL REPORT 2016 129ANNUAL REPORT 2016 | VOLVO CAR GROUP
PROPOSED DISTRIBUTION OF NON-RESTRICTED EQUITY
AUDITOR’S REPORT
This auditor’s report is a translation of the Swedish language original. In the events of any differences between this translation and the Swedish original the latter shall prevail.
To the general meeting of the shareholders of Volvo Car AB (publ)corporate identity number 556810–8988
Report on the annual accounts and consolidated accountsOpinionsWe have audited the annual accounts and consolidated accounts of Volvo Car AB for the financial year 2016-01-01–2016-12-31. The annual accounts and consolidated accounts of the company are included on pages 73–129 in this document.
In our opinion, the annual accounts have been prepared in accord-ance with the Annual Accounts Act and present fairly, in all material respects, the financial position of parent company as of 31 December 2016 and its financial performance and cash flow for the year then ended in accordance with the Annual Accounts Act. The consolidated accounts have been prepared in accordance with the Annual Accounts Act and present fairly, in all material respects, the financial position of the group as of 31 December 2016 and their financial performance and cash flow for the year then ended in accordance with International Financial Reporting Standards (IFRS), as adopted by the EU, and the Annual Accounts Act. The statutory administration report is consistent with the other parts of the annual accounts.
We therefore recommend that the general meeting of shareholders adopts the income statement and balance sheet for the parent com-pany and the group.
Basis for OpinionsWe conducted our audit in accordance with International Standards on Auditing (ISA) and generally accepted auditing standards in Sweden. Our responsibilities under those standards are further described in the Auditor’s Responsibilities section. We are independent of the parent company and the group in accordance with professional ethics for accountants in Sweden and have otherwise fulfilled our ethical responsibilities in accordance with these requirements.
We believe that the audit evidence we have obtained is sufficient and appropriate to provide a basis for our opinions.
Other Information than the annual accounts and consolidated accountsThe Board of Directors and the Managing Director are responsible for the other information. The other information is found on pages 1–72 and 132–149 but does not include the annual accounts, consolidated accounts and our auditor’s report thereon.
Our opinion on the annual accounts and consolidated accounts does not cover this other information and we do not express any form of assurance conclusion regarding this other information.
In connection with our audit of the annual accounts and consoli-dated accounts, our responsibility is to read the information identified above and consider whether the information is materially inconsistent with the annual accounts and consolidated accounts. In this procedure we also take into account our knowledge otherwise obtained in the audit and assess whether the information otherwise appears to be materially misstated.
If we, based on the work performed concerning this information, con-clude that there is a material misstatement of this other information, we are required to report that fact. We have nothing to report in this regard.
Responsibilities of the Board of Directors and the Managing DirectorThe Board of Directors and the Managing Director are responsible for the preparation of the annual accounts and consolidated accounts and that they give a fair presentation in accordance with the Annual Accounts Act and, concerning the consolidated accounts, in accord-ance with IFRS as adopted by the EU. The Board of Directors and the Managing Director are also responsible for such internal control as they determine is necessary to enable the preparation of annual accounts and consolidated accounts that are free from material mis-statement, whether due to fraud or error.
In preparing the annual accounts and consolidated accounts, The Board of Directors and the Managing Director are responsible for the assessment of the company’s and the group’s ability to continue as a going concern. They disclose, as applicable, matters related to going concern and using the going concern basis of accounting. The going concern basis of accounting is however not applied if the Board of Directors and the Managing Director intends to liquidate the company, to cease operations, or has no realistic alternative but to do so.
Auditor’s responsibilityOur objectives are to obtain reasonable assurance about whether the annual accounts and consolidated accounts as a whole are free from material misstatement, whether due to fraud or error, and to issue an auditor’s report that includes our opinions. Reasonable assurance is a high level of assurance, but is not a guarantee that an audit conducted in accordance with ISAs and generally accepted auditing standards in Sweden will always detect a material misstatement when it exists. Mis-statements can arise from fraud or error and are considered material if, individually or in the aggregate, they could reasonably be expected to influence the economic decisions of users taken on the basis of these annual accounts and consolidated accounts.
As part of an audit in accordance with ISAs, we exercise profes-sional judgment and maintain professional scepticism throughout the audit. We also:• Identify and assess the risks of material misstatement of the annual
accounts and consolidated accounts, whether due to fraud or error, design and perform audit procedures responsive to those risks, and obtain audit evidence that is sufficient and appropriate to provide a basis for our opinions. The risk of not detecting a material misstate-ment resulting from fraud is higher than for one resulting from error, as fraud may involve collusion, forgery, intentional omissions, mis-representations, or the override of internal control.
• Obtain an understanding of the company’s internal control relevant to our audit in order to design audit procedures that are appropriate in the circumstances, but not for the purpose of expressing an opin-ion on the effectiveness of the company’s internal control.
• Evaluate the appropriateness of accounting policies used and the reasonableness of accounting estimates and related disclosures made by the Board of Directors and the Managing Director.
• Conclude on the appropriateness of the Board of Directors’ and the Managing Director’s use of the going concern basis of accounting in preparing the annual accounts and consolidated accounts. We also draw a conclusion, based on the audit evidence obtained, as to
130 VOLVO CAR GROUP | ANNUAL REPORT 2016
AUDITOR’S REPORT
whether any material uncertainty exists related to events or condi-tions that may cast significant doubt on the company’s and the group’s ability to continue as a going concern. If we conclude that a material uncertainty exists, we are required to draw attention in our auditor’s report to the related disclosures in the annual accounts and consolidated accounts or, if such disclosures are inadequate, to modify our opinion about the annual accounts and consolidated accounts. Our conclusions are based on the audit evidence obtained up to the date of our auditor’s report. However, future events or conditions may cause a company and a group to cease to continue as a going concern.
• Evaluate the overall presentation, structure and content of the annual accounts and consolidated accounts, including the disclo-sures, and whether the annual accounts and consolidated accounts represent the underlying transactions and events in a manner that achieves fair presentation.
• Obtain sufficient and appropriate audit evidence regarding the financial information of the entities or business activities within the group to express an opinion on the consolidated accounts. We are responsible for the direction, supervision and performance of the group audit. We remain solely responsible for our opinions.
We must inform the Board of Directors of, among other matters, the planned scope and timing of the audit. We must also inform of signifi-cant audit findings during our audit, including any significant deficien-cies in internal control that we identified.
Report on other legal and regulatory requirementsOpinionsIn addition to our audit of the annual accounts and consolidated accounts, we have also audited the administration of the Board of Directors and the Managing Director of Volvo Car AB for the financial year 2016-01-01 – 2016-12-31 and the proposed appropriations of the company’s profit or loss.
We recommend to the general meeting of shareholders that the profit to be appropriated in accordance with the proposal in the statu-tory administration report and that the members of the Board of Direc-tors and the Managing Director be discharged from liability for the financial year.
Basis for OpinionsWe conducted the audit in accordance with generally accepted audit-ing standards in Sweden. Our responsibilities under those standards are further described in the Auditor’s Responsibilities section. We are independent of the parent company and the group in accordance with professional ethics for accountants in Sweden and have otherwise ful-filled our ethical responsibilities in accordance with these require-ments. We believe that the audit evidence we have obtained is suffi-cient and appropriate to provide a basis for our opinions.
Responsibilities of the Board of Directors and the Managing DirectorThe Board of Directors is responsible for the proposal for appro-priations of the company’s profit or loss. At the proposal of a dividend, this includes an assessment of whether the dividend is justifiable considering the requirements which the company’s and the group’s type of operations, size and risks place on the size of the parent com-
pany’s and the group’s equity, consolidation requirements, liquidity and position in general.
The Board of Directors is responsible for the company’s organiza-tion and the administration of the company’s affairs. This includes among other things continuous assessment of the company’s and the group’s financial situation and ensuring that the company’s organiza-tion is designed so that the accounting, management of assets and the company’s financial affairs otherwise are controlled in a reassuring manner. The Managing Director shall manage the ongoing administra-tion according to the Board of Directors’ guidelines and instructions and among other matters take measures that are necessary to fulfill the company’s accounting in accordance with law and handle the man-agement of assets in a reassuring manner.
Auditor’s responsibilityOur objective concerning the audit of the administration, and thereby our opinion about discharge from liability, is to obtain audit evidence to assess with a reasonable degree of assurance whether any member of the Board of Directors or the Managing Director in any material respect:• has undertaken any action or been guilty of any omission which can
give rise to liability to the company, or• in any other way has acted in contravention of the Companies Act,
the Annual Accounts Act or the Articles of Association.
Our objective concerning the audit of the proposed appropriations of the company’s profit or loss, and thereby our opinion about this, is to assess with reasonable degree of assurance whether the proposal is in accordance with the Companies Act.
Reasonable assurance is a high level of assurance, but is not a guarantee that an audit conducted in accordance with generally accepted auditing standards in Sweden will always detect actions or omissions that can give rise to liability to the company, or that the proposed appropriations of the company’s profit or loss are not in accordance with the Companies Act.
As part of an audit in accordance with generally accepted auditing standards in Sweden, we exercise professional judgment and maintain professional scepticism throughout the audit. The examination of the administration and the proposed appropriations of the company’s profit or loss is based primarily on the audit of the accounts. Additional audit procedures performed are based on our professional judgment with starting point in risk and materiality. This means that we focus the examination on such actions, areas and relationships that are material for the operations and where deviations and violations would have par-ticular importance for the company’s situation. We examine and test decisions undertaken, support for decisions, actions taken and other circumstances that are relevant to our opinion concerning discharge from liability. As a basis for our opinion on the Board of Directors’ proposed appropriations of the company’s profit or loss we examined whether the proposal is in accordance with the Companies Act.
Gothenburg 16th of March Deloitte AB
Jan NilssonAuthorized public accountant
VOLVO CAR GROUP | ANNUAL REPORT 2016 131ANNUAL REPORT 2016 | VOLVO CAR GROUP
AUDITOR’S REPORT
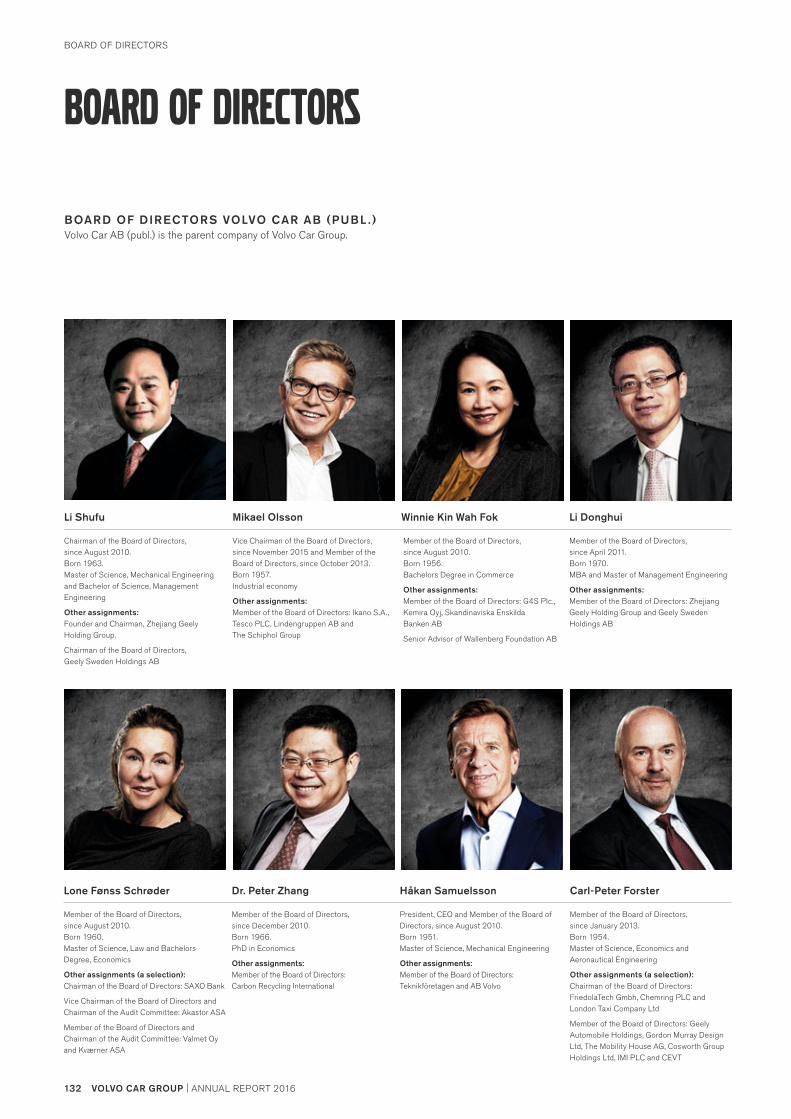
board of directors
Chairman of the Board of Directors, since August 2010. Born 1963. Master of Science, Mechanical Engineering and Bachelor of Science, Manage ment Engineering
Other assignments: Founder and Chairman, Zhejiang Geely Holding Group.
Chairman of the Board of Directors, Geely Sweden Holdings AB
Li Shufu
Vice Chairman of the Board of Directors, since November 2015 and Member of the Board of Directors, since October 2013. Born 1957. Industrial economy
Other assignments: Member of the Board of Directors: Ikano S.A., Tesco PLC, Lindengruppen AB and The Schiphol Group
Member of the Board of Directors, since December 2010. Born 1966. PhD in Economics
Other assignments: Member of the Board of Directors: Carbon Recycling International
Mikael Olsson
Dr. Peter Zhang
President, CEO and Member of the Board of Directors, since August 2010. Born 1951. Master of Science, Mechanical Engineering
Other assignments: Member of the Board of Directors: Teknikföretagen and AB Volvo
Håkan Samuelsson
Member of the Board of Directors, since April 2011. Born 1970. MBA and Master of Management Engineering
Other assignments: Member of the Board of Directors: Zhejiang Geely Holding Group and Geely Sweden Holdings AB
Li Donghui
Member of the Board of Directors, since August 2010. Born 1956. Bachelors Degree in Commerce
Other assignments: Member of the Board of Directors: G4S Plc., Kemira Oyj, Skandinaviska Enskilda Banken AB
Senior Advisor of Wallenberg Foundation AB
Winnie Kin Wah Fok
Member of the Board of Directors, since August 2010. Born 1960. Master of Science, Law and Bachelors Degree, Economics
Other assignments (a selection): Chairman of the Board of Directors: SAXO Bank
Vice Chairman of the Board of Directors and Chairman of the Audit Committee: Akastor ASA
Member of the Board of Directors and Chair man of the Audit Committee: Valmet Oy and Kværner ASA
Lone Fønss Schrøder
BOARD OF DIRECTORS VOLVO CAR AB (PUBL . )Volvo Car AB (publ.) is the parent company of Volvo Car Group.
Member of the Board of Directors, since January 2013. Born 1954. Master of Science, Economics and Aeronautical Engineering
Other assignments (a selection): Chairman of the Board of Directors: FriedolaTech Gmbh, Chemring PLC and London Taxi Company Ltd
Member of the Board of Directors: Geely Automobile Holdings, Gordon Murray Design Ltd, The Mobility House AG, Cosworth Group Holdings Ltd, IMI PLC and CEVT
Carl-Peter Forster
BOARD OF DIRECTORS
132 VOLVO CAR GROUP | ANNUAL REPORT 2016

Member of the Board of Directors, since January 2015. Born 1955. Master of Arts
Other assignments: Chairman of the Board of Directors: Husqvarna AB, Combient AB, The British Swedish Chamber of Commerce and The English School Gothenburg
Member of the Board: Investor AB, Wärtsilä Corporation and Frölunda Hockey Club
Thomas Johnstone CBE
BOARD OF DIRECTORS IN VOLVO CAR AB (PUBL . ) CONT.
UNION REPRESENTAT IVES
Union Representative in The Board of Directors appointed by IF Metall, since 2009.
Employed by Volvo Cars: 1974Born 1955
Union Representative in The Board of Directors, appointed by IF Metall, since 2006.
Employed by Volvo Cars: 1984Born 1965
Union Representative in The Board of Directors, appointed by Unionen, since 2016.
Employed by Volvo Cars: 1988Born 1968
Deputy Union Representative, appointed by IF Metall, since 2009.
Employed by Volvo Cars: 1981Born 1963
Deputy Union Representative, appointed by Akademikerna Volvo Cars, since 2016.
Employed by Volvo Cars: 1994Born 1969
Glenn Bergström Marko Peltonen Jörgen Olsson Björn Ohlsson Anna Margitin
Member of the Board of Directors, since January 2016. Born 1953. Bachelors Degree, Liberal Arts
Other assignments: Member of the Board of Directors: Home Depot Supply, Schneider Electric and SL Green
Chairman of Advisory Board: SAP AG
CEO: Baja Corp
Betsy Atkins
BOARD OF DIRECTORS
VOLVO CAR GROUP | ANNUAL REPORT 2016 133ANNUAL REPORT 2016 | VOLVO CAR GROUP

executive management TEAM
E XECUTIVE MANAGEMENT TE AM IN VOLVO CAR CORPOR ATIONVolvo Car Corporation is a subsidiary of Volvo Car AB (publ.). Volvo Car Corporation is managed by the Executive Management Team, (EMT) with 13 members, led by the CEO and overseen by the Board of Directors of Volvo Car AB. Besides from manag-ing Volvo Car Corporation the Executive Management Team also set out the directions for the operations in the rest of the businesses in Volvo Cars.
President & CEO, since October, 2012.Born 1951. Master of Science in Mechanical Engineering
Previous positions: Chairman & CEO, MAN AG
Chairman & CEO, MAN Nutzfahrzeuge AG
Executive Board Member, Scania Group
Senior Vice President & Chief Financial Officer, since August 2013. Born 1965. Master Degree in Finance
Previous positions: Deputy CFO and Group Controller, Volvo Cars
Vice President and Controller, Marketing, Sales & Services, Volvo Cars
Håkan Samuelsson
Senior Vice President, Design, since July, 2012. Born 1964. Master of Arts
Previous positions:
Director of Design, Volkswagen Group
Head of Design, Skoda Design Studio
Head of Exterior Design, Volkswagen
Thomas Ingenlath
Hans Oscarsson
Senior Vice President, Asia Pacific Region, since March 2017 (appointed 2016 succeeding Lars Danielsson). Born 1969. Master’s Degree
Previous positions: Deputy Senior Vice President and President of Asia Pacific Region, Volvo Cars
Secretary of the Board of Directors, Volvo Cars
Head of Chairman’s Office, Volvo Cars
Xiaolin Yuan
Senior Vice President, Corporate Communications, since November, 2014. Born 1964. Degree in Combined Honours in French, English Literature and International Politics, Diploma in Business Administration
Previous positions: Executive Vice President Communications at PSA Peugeot Citroën
Director of Worldwide Press Relations, PSA Peugeot Citroën
Jonathan Goodman
Senior Vice President, Americas Region, since March 2015. Born 1960. Degree in Automotive Business Management
Previous Positions: Senior Vice President, Product Strategy & Vehicle Line Management, Volvo Cars
President, Volvo Car Overseas Corporation
Senior Vice President, Brand, Business & Product Strategy
Lex Kerssemakers
General Counsel & Senior Vice President, Group Legal and Corporate Governance, since March 2012. Born 1964. Master of Law
Previous positions: Legal Counsel, AB SKF
Lawyer and Senior Associate, Mannheimer Swartling
Legal Counsel, SCA Hygine Products AB
Maria Hemberg
Senior Vice President, Research & Development, December 2016. Born 1973. MSc in Computer Engineering
Previous positions: Vice President Product Strategy & Vehicle Line Management, Volvo Car Group
Vice President Product Strategy & Vehicle Line Management Volvo Car China, Volvo Car Group
Vice President Vehicle Line Management Volvo Cars 40-series, Volvo Car Group
Henrik Green
EXECUTIVE MANAGEMENT TEAM
134 VOLVO CAR GROUP | ANNUAL REPORT 2016
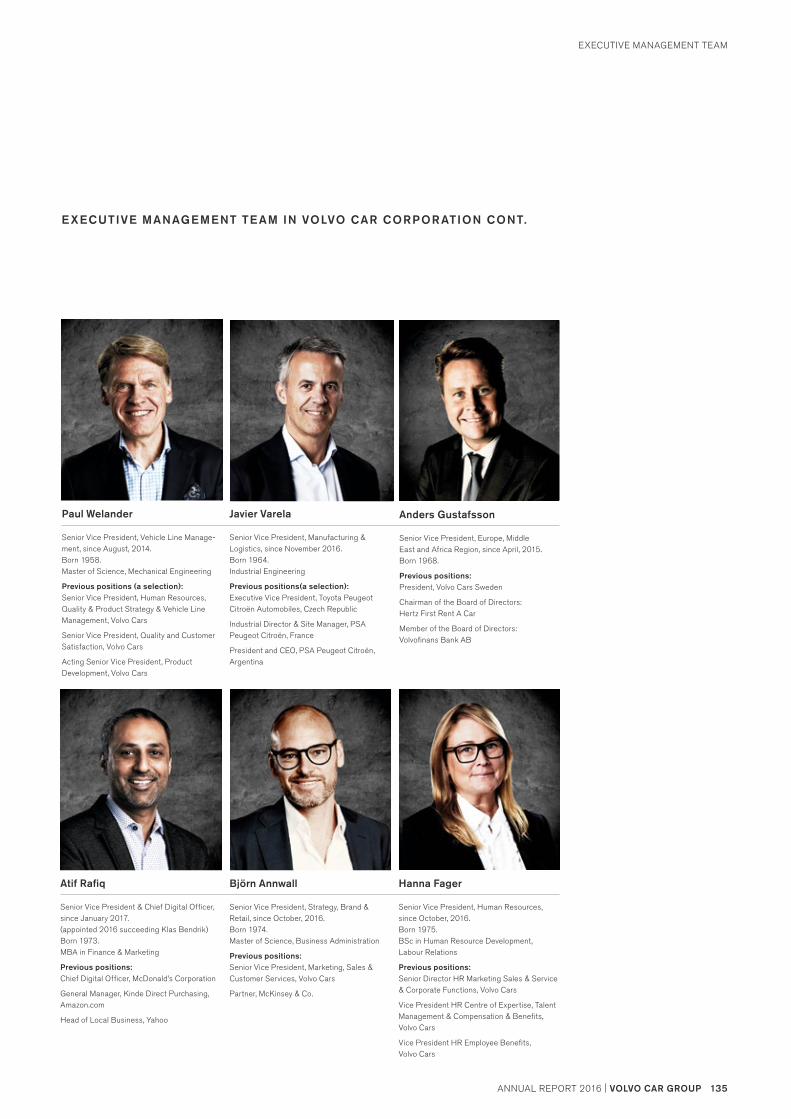
E XECUTIVE MANAGEMENT TE AM IN VOLVO CAR CORPOR ATION CONT.
Senior Vice President, Manufacturing & Logistics, since November 2016. Born 1964. Industrial Engineering
Previous positions(a selection): Executive Vice President, Toyota Peugeot Citroën Automobiles, Czech Republic
Industrial Director & Site Manager, PSA Peugeot Citroën, France
President and CEO, PSA Peugeot Citroën, Argentina
Javier Varela
Senior Vice President, Strategy, Brand & Retail, since October, 2016. Born 1974. Master of Science, Business Administration
Previous positions: Senior Vice President, Marketing, Sales & Customer Services, Volvo Cars
Partner, McKinsey & Co.
Senior Vice President, Human Resources, since October, 2016. Born 1975. BSc in Human Resource Development, Labour Relations
Previous positions: Senior Director HR Marketing Sales & Service & Corporate Functions, Volvo Cars
Vice President HR Centre of Expertise, Talent Management & Compensation & Benefits, Volvo Cars
Vice President HR Employee Benefits, Volvo Cars
Björn Annwall Hanna Fager
Senior Vice President, Vehicle Line Manage-ment, since August, 2014. Born 1958. Master of Science, Mechanical Engineering
Previous positions (a selection): Senior Vice President, Human Resources, Quality & Product Strategy & Vehicle Line Management, Volvo Cars
Senior Vice President, Quality and Customer Satisfaction, Volvo Cars
Acting Senior Vice President, Product Development, Volvo Cars
Paul Welander
Senior Vice President & Chief Digital Officer, since January 2017. (appointed 2016 succeeding Klas Bendrik)Born 1973.MBA in Finance & Marketing
Previous positions: Chief Digital Officer, McDonald’s Corporation
General Manager, Kinde Direct Purchasing, Amazon.com
Head of Local Business, Yahoo
Atif Rafiq
Senior Vice President, Europe, Middle East and Africa Region, since April, 2015. Born 1968.
Previous positions: President, Volvo Cars Sweden
Chairman of the Board of Directors: Hertz First Rent A Car
Member of the Board of Directors: Volvofinans Bank AB
Anders Gustafsson
EXECUTIVE MANAGEMENT TEAM
VOLVO CAR GROUP | ANNUAL REPORT 2016 135ANNUAL REPORT 2016 | VOLVO CAR GROUP
Sustainability management and governance
Our approach to sustainability managementVolvo Cars is committed to protecting and improving the environment and wider society, as well as the lives of our own customers and employees. Our sustainability programme (Omtanke) and commit-ments guide our strategic and operational decisions.
We have a clear governance structure to ensure that we are deliver-ing on these commitments, and take actions in order to improve our performance. We are always looking to identify new ways to measure our sustainability performance and seek out strong external partner-ships that will improve our performance. We realise that our existing customers, and potential customers, expect us to deliver on our com-mitments. We are determined to not let them down. Finally, we recog-nise that a sustainable approach not only brings environmental and social benefits, but can also increase profitability and competiveness.
International commitmentsVolvo Cars is proud of the fact that we were a founding member of the UN Global Compact in 2000. Since then, we have endeavoured to observe the Ten Principles of the Global Compact. This includes Principle 7, the adoption of a precautionary approach to environmental challenges. Furthermore, we are committed to supporting the Sustain-able Development Goals (SDGs), which guide our sustainability approach.
In addition to the UN Global Compact, our own Code of Conduct reflects the following international conventions and guidelines:
• The eight core conventions of the UN agency, ILO (the International Labour Organization): – Child Labour (138 and 182), – Forced Labour and Compulsory Labour (29 and 105), – Equal Remuneration and Discrimination (100 and 111), – Freedom of Association and Collective Bargaining (87 and 98)
• The 10 principles of the Global Compact• The Universal Declaration of Human Rights• UN Convention on the Rights of the Child• OECD Guidelines for Multinational Companies• UN Guiding Principles on Business & Human Rights
Sustainability governanceVolvo Cars has a clear governance structure to monitor both our progress against our sustainability commitments, and develop our existing programme. This includes the designation of an Executive Management Team (EMT) member responsible for the delivery of each of our Omtanke commitments.
The Sustainability BoardSustainability at Volvo Cars is governed by the Sustainability Board, which is a decision making body responsible for directing and monitor-ing the delivery and communication of our sustainability programme. The Board members also ensure that our sustainability programme is aligned with the corporate strategy and the Volvo Cars business plan, and that the company operates in accordance with Volvo Cars’ values and Code of Conduct. The Board consists of the President and CEO as well as a number of EMT members. The Board is chaired by the Senior Vice President and General Counsel, Group Legal and Corpo-rate Governance.
The Sustainability Working GroupThe Sustainability Working Group consists of the operational leads responsible for the delivery of our Sustainability Programme, Omtanke. It meets fortnightly to discuss emerging opportunities and challenges, and share best practice and ongoing initiatives. The Working Group is chaired by the Director, Sustainability and reports to the Sustainability Board.
The Global Compliance CommitteeThe Global Complience Committee consists of members of the EMT and oversees the effectiveness and continuous improvement of Volvo Car Group’s Compliance Programme. It also reviews policies, direc-tives and other procedures related to compliance and ethics. The Committee supervises the Corporate Compliance & Ethics Office.
Sustainability reportingVolvo Cars has been reporting on environmental, health and safety aspects of its products and production since it signed the UN Global Compact in 2000. In 2003, the company produced its first Sustaina-bility Report in line with the international reporting guidelines from the Global Reporting Initiative (GRI). By applying and living up to the GRI’s international guidelines for sustainability reporting, Volvo Cars aims to ensure transparent reporting based on content which is relevant to its stakeholders.
The 2016 report is prepared in accordance with GRI Standards accordance level Core. Volvo Cars reports on an annual basis, and this report covers the period January 1 to December 31 2016. The 2015 report was issued in May 2016 and is available at Volvo Cars’ website: www.volvocars.com.
Definitions regarding boundaries as well as measuring techniques and calculations for each performance indicator are given in respect to the indicator concerned. No significant changes occurred during the reporting period or from previous reporting periods.
The Volvo Cars’ Sustainability Report 2016 has not been verified by a third party. However, Volvo Cars may consider this in the future. As a signatory to the UN Global Compact, the Sustainability Report is also our Communication on Progress.
SUSTAINABILITY MANAGEMENT AND GOVERNANCE
136 VOLVO CAR GROUP | ANNUAL REPORT 2016

VOLVO CAR AB BOARD OF DIRECTORS
REGULATIONS OF THE WORK OF THE
BOARD OF DIRECTORSAUDIT COMMITTEE
CEO AND EXECUTIVE MANAGEMENT TEAM (EMT)
OPERATIONS
CORPORATE STRATEGY
BUSINESS FUNCTIONS
CORPORATE POLICIES AND CODE OF CONDUCT
FUNCTIONAL POLICIES AND PROCEDURES
GOVERNANCE PRODUCTS AND SERVICES
MARKET AND PRODUCTION PEOPLE
Sustainability Board
Corporate Development Board
Product BoardMarketing and Retail Board People and Organization Board
Global Compliance Committee
Quality BoardVolume Decision Board
Strategic Product BoardSales and Revenue Forecast Meeting
Global Audit Office (GAO)
Design Board
IT Board
CORPOR ATE GOVERNANCE STRUCTURE
Compliance and Ethics Office
PRODUCT STRATEGY & INVESTMENT COMMITTEE
PEOPLE AND COMPENSATION COMMITTEE
VOLVO CAR GROUP | ANNUAL REPORT 2016 137ANNUAL REPORT 2016 | VOLVO CAR GROUP
SUSTAINABILITY MANAGEMENT AND GOVERNANCE

Stakeholder Engagement & Materiality Analysis Our stakeholder involvement provides guidance on how we should develop and communicate our sustainability work. One indicatior of our success, is whether our stakeholders chose to buy our products and/or do business with us.
We have an open dialogue with our major stakeholders not only through networks, conferences, our website or at [email protected], but also through deeper interviews, surveys and analysis.
Since 2012, we have undergone an extensive process to update and adjust our sustainability strategy. The aim of this process has been to gather sufficient analysis and input to allow us to establish a company wide sustainability framework, with clear priorities and commitments. Stakeholder consulta-tion has been in the form of individual interviews with a wide range of stakeholders across Europe and China, as well as an online survey in 2015. In the survey external and internal stakeholders were asked to indicate which sustainability areas they considered to be of greatest relevance to Volvo Cars. This resulted in a list of 13 aspects that were voted by at least 40 per cent of the respondents as important:
VOLVO CARS
GOVERNMENT, PUBLIC
AUTHORITIES, POLITICIANS SUPPLIERSMEDIA
INVESTORS, BANKS,
INSURANCE COMPAINES
INDUSTRY AND CONSUMERASSOCIATIONS
LOCALCOMMUNITIESINDUSTRY
NETWORK
ACADEMIA,UNIVERSITIES,
SCHOOLS
EMPLOYEESPRIVATE OPINIONLEADERS
CUSTOMERS
DEALERS
NGOs,ENVIRONMENTALASSOCIATIONS,HUMAN RIGHTS
ORGANISATIONS
Prioritised topics Proportion of respondents that rated the topic as important
Fuel economy and car emissions 77%
Car and traffic safety (product responsibility) 71%
Social and environmental requirements on suppliers/dealers 65%
Energy efficiency and emissions (production) 61%
Future mobility 61%
Code of conduct and integrity 58%
Occupational health and safety 47%
Research and development 47%
Assessing, evaluating and auditing suppliers 43%
Technology and knowledge sharing 43%
Materials, recycling and waste 42%
Satisfaction of customers and business partners 42%
Environmental management 40%
Our Sustainability Board aligned the list of topics with our various internal strategies to define what we consider to be our most relevant material aspects. We then developed the structure and focus areas of our Sustainability Programme – Omtanke (see page 21).
MATERIALITY ANALYSIS
138 VOLVO CAR GROUP | ANNUAL REPORT 2016

In 2016, we focused on rolling out our Sustainability Programme to our stakeholders through press releases, updated websites, presentations at conferences and in individual meetings. We will
continue promoting Omtanke in 2017, as well as re-launch the survey to receive feedback on our programme and current direction.
ENERGYAspect boundary: energy consumption within
operations, excluding logistics.
CUSTOMER HEALTH AND SAFETYAspect boundary: customers and other
passengers and road uses.
ANTI-CORRUPTIONAspect boundary:
own operations and partners
SUPPLIER HUMAN RIGHTS ASSESSMENTAspect boundary: own operations
(purchasing) and supply chain
EMISSIONSAspect boundary: emissions from own operations,
excluding logistics. Emissions from cars are covered under material aspect Products and Services.
Aspect boundary: Volvo Cars products (the environmental performance of our cars).
RESOURCE EFFICIENT BUSINESSClimate neutral operations by 2025
LIFE CYCLE PERFORMANCE1 million electrified vehicles
sold by 2025
PARTNER IN SUSTAINABLE DEVELOPMENT
Engage in corporate partnerships
REAL-LIFE SAFETYOur vision is that by 2020, no one should be killed
or seriously injured in a new Volvo car
SAFER BY SHARINGKnowledge sharing to improve traffic safety
CUSTOMER EXPERIENCECleanZone leadership
EMBODYING ETHICS & HUMAN RIGHTSEthical leadership for responsible business
PARTNER IN SUSTAINABLE DEVELOPMENTEngage in corporate partnerships
OCCUPATIONAL HEALTH AND SAFETYAspect boundary: own operations
(i. e. Volvo Cars employees).
DIVERSITY AND EQUAL OPPORTUNITIESAspect boundary: own operations
(i. e. Volvo Cars employees).
SUSTAINABLE WORK LIFENo fatalities or serious injuries
at Volvo Cars
DIVERSE & INCLUSIVE CULTURE35% internationally diverse leaders &
35% female leaders by 2020
VOLVO CARS MATE RIAL ASPECTS
VOLVO CARS SUSTAINABIL IT Y PROGR AMME – OMTANKE
MATERIALITY ANALYSIS
VOLVO CAR GROUP | ANNUAL REPORT 2016 139ANNUAL REPORT 2016 | VOLVO CAR GROUP

2016 2015 20142) 20131) 20121)
Retail sales (units) 534,332 503,127 465,866 427,840 421,951
Net revenue (MSEK) 180,672 164,043 137,590 122,245 124,547
1) Not restated after the acquisitions of the Chinese industrial entities in 2015.2) The comparative figures for 2014 are restated to include the new Volvo Car Group structure including the acquired Chinese industrial entities.
For further descriptions refer to the Volvo Car Group’s annual report 2015.
ECONOMIC DIMENSION
ENVIRONMENTAL DIMENSION
Energy use, Operations Europe (MWh)1) 2016 2015 2014 2013 2012
Total direct energy use2) 227,000 254,000 249,000 297,000 304,000
Total indirect energy use3) 539,000 499,000 497,000 493,000 495,000
Total energy use (direct + indirect) 766,000 753,000 746,000 790,000 799,000
Energy use per manufactured vehicle (MWh/vehicle)4) 1.2 1.2 1.2 1.3 1.3
1) The Volvo Cars facilities included in the 2016 data are Volvo Cars Torslanda Plant (Gothenburg, Sweden), Volvo Cars Ghent Plant (Ghent, Belgium), Volvo Cars Skövde – Engines (Skövde, Sweden), and Volvo Cars Olofström – Body Components (Olofström, Sweden). Data for Volvo Cars Malaysia – CKD (Kuala Lumpur, Malaysia) is included in data to 2014 (since 2015, included in Asia figures). Data for Volvo Cars Floby (Floby, Sweden) is included up to 2015.
2) Energy produced for own consumption 3) Purchased electricity and heating 4) Energy use in Volvo Cars Torslanda Plant (Gothenburg, Sweden) and Volvo Cars Ghent Plant (Ghent, Belgium). Data for Malaysia is included up to 2014.
Direct energy use by source Europe (MWh)1) 2016 2015 2014 2013 2012
Natural gas/LPG 213,000 234,000 230,000 278,000 286,000
Oil/diesel/ petrol — 3,800 3,900 4,200 4,100
Renewables (non-biomass, wind) 12,900 14,500 13,500 13,900 13,700
Renewables (biomass) — — — — —
Coal — — — — —
Other/Unspecified, water 1,100 1,100 1,000 1,000 970
1) The Volvo Cars facilities included in the 2016 data are Volvo Cars Torslanda Plant (Gothenburg, Sweden), Volvo Cars Ghent Plant (Ghent, Belgium), Volvo Cars Skövde – Engines (Skövde, Sweden), and Volvo Cars Olofström – Body Components (Olofström, Sweden). Data for Volvo Cars Malaysia – CKD (Kuala Lumpur, Malaysia) is included in data to 2014 (since 2015, included in Asia figures). Data for Volvo Cars Floby (Floby, Sweden) is included up to 2015.
Energy use, Operations Asia (MWh)1) 2016 2015 2014 2013 2012
Total direct energy use2) 201,000 177,000 — — —
Total indirect energy use3) 116,000 102,000 — — —
Total energy use (direct and indirect) 317,000 279,000 — — —
Energy use per manufactured vehicle Asia (MWh/vehicle), MWh4) 3.8 4.2 — — —
1) The Volvo Cars facilities included in the 2016 data are Volvo Cars Malaysia – CKD (Kuala Lumpur, Malaysia), Volvo Cars Chengdu Plant (Chengdu, China), Volvo Cars Daqing Plant (Daqing, China) and Volvo Cars Zhangjiakou – Engines (Zhangjiakou, China). 2015 was the first year when Volvo Cars started reporting figures for China.
2) Produced energy used for own consumption 3) Purchased electricity and district heating used for own consumption 4) Figures include Volvo Cars Malaysia – CKD (Kuala Lumpur, Malaysia), Volvo Cars Chengdu Plant (Chengdu, China) and Volvo Cars Daqing Plant
(Daqing, China).
Sustainability scorecard
SUSTAINABILITY SCORECARD
140 VOLVO CAR GROUP | ANNUAL REPORT 2016

Direct energy use by source Asia (MWh)1) 2016 2015 2014 2013 2012
Natural gas/LPG 201,000 176,000 — — —
Oil/diesel/ petrol — 800 — — —
Renewables (non-biomass) — — — — —
Renewables (biomass) — — — — —
Coal — — — — —
Other/Unspecified — — — — —
1) The Volvo Cars facilities included in the 2016 data are Volvo Cars Malaysia – CKD (Kuala Lumpur, Malaysia), Volvo Cars Chengdu Plant (Chengdu, China), Volvo Cars Daqing Plant (Daqing, China) and Volvo Cars Zhangjiakou – Engines (Zhangjiakou, China). 2015 was the first year when Volvo Cars started reporting fig-ures for China.
Emissions, Operations Europe (tonnes)1) 2016 2015 2014 2013 2012
CO2 emissions per manufactured vehicle (tonnes/vehicle)2) 0.08 0.10 0.09 0.11 0.12
Direct emissions of CO2 from natural gas and renewables 41,600 46,900 44,000 51,000 55,000
Indirect emissions of CO2 from electricity3) — — 4,500 4,200 4,200
Indirect emissions of CO2 from district heating 1,300 800 1,200 4,200 2,900
Total emissions of CO2 42,800 47,700 49,900 59,700 61,700
Emissions of SOx4) <1 <1 <1 <1 <1
Emissions of NOx5) 79 80 77 76 73
Emissions of VOC6) 630 580 675 725 790
1) The Volvo Cars facilities included in the 2016 data are Volvo Cars Torslanda Plant (Gothenburg, Sweden), Volvo Cars Ghent Plant (Ghent, Belgium), Volvo Cars Skövde – Engines (Skövde, Sweden), and Volvo Cars Olofström – Body Components (Olofström, Sweden). Data for Volvo Cars Malaysia – CKD (Kuala Lumpur, Malaysia) is included in data to 2014 (since 2015, included in Asia figures). Data for Volvo Cars Floby (Floby, Sweden) is included up to 2015.
2) The Volvo Cars facilities included are Volvo Cars Torslanda Plant (Gothenburg, Sweden) and Volvo Cars Ghent Plant (Ghent, Belgium).3) Indirect emissions are estimated based on our assumptions for the primary energy sources for the countries in which we operate. The primary energy source
for electricity in Europe is hydropower, which is climate-neutral, while the primary energy source in Malaysia is coal.4) SOx emissions are calculated on the basis of the sulphur content in the fuel. 5) The NOx emissions are calculated based on the quantity of fuel. Spot tests are also performed. 6) Calculations of VOC emissions are based mainly on the amount of solvents in materials used and on measurements of the degree of purification of the
equipment.
Emissions, Operations Asia (tonnes)1) 2016 2015 2014 2013 2012
CO2 emissions per manufactured vehicle (tonnes/vehicle) 1.18 1.10 — — —
Direct emissions of CO2 from natural gas and renewables2) 40,600 36,000 — — —
Indirect emissions of CO2 from electricity2) 64,000 42,000 — — —
Indirect emissions of CO2 from district heating3) 3,000 2,600 — — —
Total emissions of CO2 107,700 80,000 — — —
1) The Volvo Cars facilities included in the 2016 data are Volvo Cars Malaysia – CKD (Kuala Lumpur, Malaysia), Volvo Cars Chengdu Plant (Chengdu, China), Volvo Cars Daqing Plant (Daqing, China) and Volvo Cars Zhangjiakou – Engines (Zhangjiakou, China). 2015 was the first year when Volvo Cars started reporting fig-ures for China. Figures are not directly comparable as different emission factors were used in 2015.
2) Indirect emissions from electricity are estimated based on our assumptions for the primary energy sources for the countries in which we operate. The primary energy source in Malaysia is coal: emission factor 0.720 tonnes CO2/MWh. In Chengdu: emission factor 0.2475 tonnes CO2/MWh (Sichuan Province 2012 from NDRC). In Daqing: emission factor 1.1291 tonnes CO2/MWh (North East China grid index 2014). In Zhangjiakou: emission factor 1.0416 tonnes CO2/MWh (North China grid index 2014).
3) Assumption for district heating in Volvo Cars Zhangjiakou – Engines (Zhangjiakou, China) is 350 kg CO2/MWh (coal).
Emissions, Other 2016 2015 2014 2013 2012
CO2 emissions of products – EU fleet average ( CO2 g/km) 121 123 126 132 144
Electrified vehicles sold – accumulated figures 43,520 23,520 13,320 7,620 220
Global transports total CO2 emissions (tonnes)1) 496,567 447,267 333,971 — —
CO2 emissions per manufactured vehicle (kg/vehicle) from logistics1) 929 882 826 — —
1) Includes CO2 emissions from inbound and outbound transports managed and paid for by Volvo Cars. Figures for 2014 and 2015 updated to be comparable based on method and available figures. Figures for 2016 are based on actuals and prognosis (11+1). Figures before 2014 not available due to third party involvement in transports.
SUSTAINABILITY SCORECARD
VOLVO CAR GROUP | ANNUAL REPORT 2016 141ANNUAL REPORT 2016 | VOLVO CAR GROUP
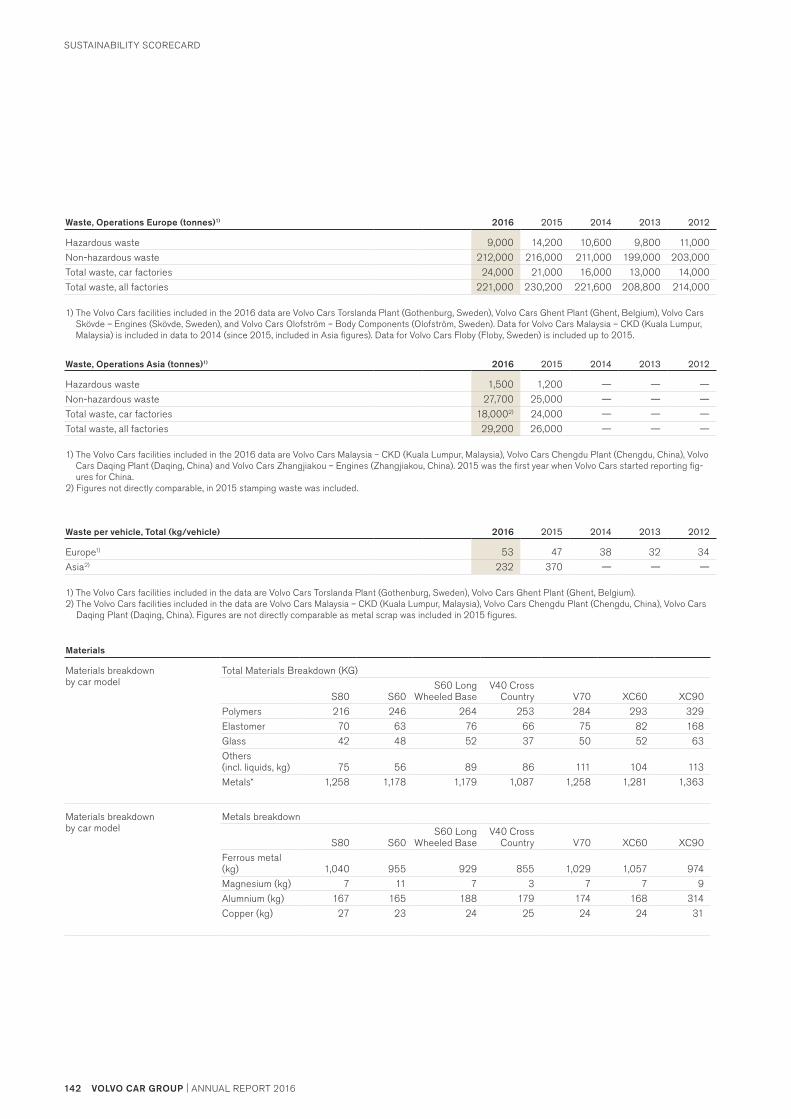
Waste, Operations Europe (tonnes)1) 2016 2015 2014 2013 2012
Hazardous waste 9,000 14,200 10,600 9,800 11,000
Non-hazardous waste 212,000 216,000 211,000 199,000 203,000
Total waste, car factories 24,000 21,000 16,000 13,000 14,000
Total waste, all factories 221,000 230,200 221,600 208,800 214,000
1) The Volvo Cars facilities included in the 2016 data are Volvo Cars Torslanda Plant (Gothenburg, Sweden), Volvo Cars Ghent Plant (Ghent, Belgium), Volvo Cars Skövde – Engines (Skövde, Sweden), and Volvo Cars Olofström – Body Components (Olofström, Sweden). Data for Volvo Cars Malaysia – CKD (Kuala Lumpur, Malaysia) is included in data to 2014 (since 2015, included in Asia figures). Data for Volvo Cars Floby (Floby, Sweden) is included up to 2015.
Waste, Operations Asia (tonnes)1) 2016 2015 2014 2013 2012
Hazardous waste 1,500 1,200 — — —
Non-hazardous waste 27,700 25,000 — — —
Total waste, car factories 18,0002) 24,000 — — —
Total waste, all factories 29,200 26,000 — — —
1) The Volvo Cars facilities included in the 2016 data are Volvo Cars Malaysia – CKD (Kuala Lumpur, Malaysia), Volvo Cars Chengdu Plant (Chengdu, China), Volvo Cars Daqing Plant (Daqing, China) and Volvo Cars Zhangjiakou – Engines (Zhangjiakou, China). 2015 was the first year when Volvo Cars started reporting fig-ures for China.
2) Figures not directly comparable, in 2015 stamping waste was included.
Waste per vehicle, Total (kg/vehicle) 2016 2015 2014 2013 2012
Europe1) 53 47 38 32 34
Asia2) 232 370 — — —
1) The Volvo Cars facilities included in the data are Volvo Cars Torslanda Plant (Gothenburg, Sweden), Volvo Cars Ghent Plant (Ghent, Belgium).2) The Volvo Cars facilities included in the data are Volvo Cars Malaysia – CKD (Kuala Lumpur, Malaysia), Volvo Cars Chengdu Plant (Chengdu, China), Volvo Cars
Daqing Plant (Daqing, China). Figures are not directly comparable as metal scrap was included in 2015 figures.
Materials
Materials breakdown by car model
Total Materials Breakdown (KG)
S80 S60S60 Long
Wheeled BaseV40 Cross
Country V70 XC60 XC90
Polymers 216 246 264 253 284 293 329
Elastomer 70 63 76 66 75 82 168
Glass 42 48 52 37 50 52 63
Others (incl. liquids, kg) 75 56 89 86 111 104 113
Metals* 1,258 1,178 1,179 1,087 1,258 1,281 1,363
Materials breakdown by car model
Metals breakdown
S80 S60S60 Long
Wheeled BaseV40 Cross
Country V70 XC60 XC90
Ferrous metal (kg) 1,040 955 929 855 1,029 1,057 974
Magnesium (kg) 7 11 7 3 7 7 9
Alumnium (kg) 167 165 188 179 174 168 314
Copper (kg) 27 23 24 25 24 24 31
SUSTAINABILITY SCORECARD
142 VOLVO CAR GROUP | ANNUAL REPORT 2016

Re-manufacturing 2016 2015 2014 2013 2012
Aluminium saved due to remanufacturing (accumulated kg) 292,569 296,730 296,868 327,003 355,126
Remanufactured parts sold 90,828 105,236 110,937 118,511 118,181
Water use, Operations Europe (m3)1) 2016 2015 2014 2013 2012
Total water use, all plants2) 748,000 715,000 761,000 767,000 765,000
Total water use, car plants3) 634,000 580,000 617,000 626,000 631,000
Water use per vehicle (m3/vehicle)4) 1.4 1.3 1.5 1.5 1.5 1) Main source is municipal water supplies2) The Volvo Cars facilities included in the 2016 data are Volvo Cars Torslanda Plant (Gothenburg, Sweden), Volvo Cars Ghent Plant (Ghent, Belgium), Volvo Cars
Skövde – Engines (Skövde, Sweden), and Volvo Cars Olofström – Body Components (Olofström, Sweden). Data for Volvo Cars Malaysia – CKD (Kuala Lumpur, Malaysia) is included in data to 2014 (since 2015, included in Asia figures). Data for Volvo Cars Floby (Floby, Sweden) is included up to 2015.
3) The Volvo Cars facilities included are Volvo Cars Torslanda Plant (Gothenburg, Sweden) and Volvo Cars Ghent Plant (Ghent, Belgium). As of 2015, Volvo Cars Malaysia is included in data for Asia.
4) Water use/vehicle is based on the number of produced cars in car manufacturing plants: Volvo Cars Torslanda Plant (Gothenburg, Sweden) and Volvo Cars Ghent Plant (Ghent, Belgium).
Water use, Operations Asia (m3)1) 2016 2015 2014 2013 2012
Total water use, all plants2) 789,000 696,000 — — —
Total water use, car plants3) 760,000 665,000 — — —
Water use per vehicle (m3/vehicle)4) 9.8 10.2 — — —
1) Main source is municipal water supplies. 2015 was the first year when Volvo Cars started reporting figures for Asia.2) The Volvo Cars facilities included in the 2016 data are Volvo Cars Malaysia – CKD (Kuala Lumpur, Malaysia), Volvo Cars Chengdu Plant (Chengdu, China), Volvo
Cars Daqing Plant (Daqing, China) and Volvo Cars Zhangjiakou – Engines (Zhangjiakou, China). These figures exclude water used for cooling.3) Manufacturing car plants are Volvo Cars Malaysia – CKD (Kuala Lumpur, Malaysia), Volvo Cars Chengdu Plant (Chengdu, China) and Volvo Cars Daqing Plant
(Daqing, China).4) Water use/vehicle is based on the number of produced cars in car manufacturing plants.
PEOPLE DIMENSION
Employees
Breakdown of employees, excluding EMT and Board, according to gender and age group as per December 31 2016
Women Men
<30 30–50 >50 <30 30–50 >50
Sweden 9% 12% 5% 18% 35% 21%
Belgium 5% 8% 2% 19% 43% 23%
China 9% 9% 1% 50% 30% 1%
Total 8% 11% 4% 23% 36% 18%
Indicator 2016 2015 2014 2013 2012
Women in leading positions 26.2% 25.6% 24.5% 22.9% 21.3%
Internationally diverse leaders 27.0% 25.0% — — —
Accidents and sick leave1) 2016 2015 2014 2013 2012
Injuries2) (LTCR) 0.22 0.34 0.34 0.62 0.55
Serious injuries3) 9 16 14 6 9
Sick leave, employees 4.8% 4.7% 4.5% 4.5% 4.4%
1) Data includes Europe and China. 2) LTCR is defined as the number of work/occupational accidents and illness, reported and at least one day sick leave, divided by 200 000 hours worked (equiv-
alent to 100 man years).3) Defined as total number of injuries leading to fractures and unconsciousness.
SUSTAINABILITY SCORECARD
VOLVO CAR GROUP | ANNUAL REPORT 2016 143ANNUAL REPORT 2016 | VOLVO CAR GROUP

Total number of employees by employment contract and gender as per December 31 20161)
Women Men Total
Permanent contract 22% 78% 100%
Temporary contract 27% 73% 100%
1) The main employment form within Volvo Cars is permanent employments, but depending on the need and duration of assignment temporary solutions will be used such as consultants, agency and temporary employment contracts. Key positions should always be employed on a permanent basis. Depending on national labour regulations and market situation the approach may vary in Volvo Cars’ different locations.
Total number of permanent employees by employment type and gender as per December 31 20161)
Women Men Total
Total 26% 74% 100%Full-time 26% 74% 100%
Part-time 25% 75% 100%
1) For Volvo Cars in Sweden full-time employments are the main rule, but there is no generic principle on this for Volvo Car Group in total.
Total workforce by employees and supervised workers by gender as per December 31 2016
EmployeesSupervised workers
(consultants) Total
Total FTE Total FTE Total FTE
Male: Female:
Male: Female:
Male: Female:
Global Total 31,416 4,145 35,561
Contractors1) 2) 2016 2015 2014 2013 2012
Injuries 7 5 3 9 21
Fatalities — — — 1 —
1) Independent contractors are defined as contractors involved in the construction/re-construction of Volvo Cars’ factories. Injuries and fatalities among contrac-tors are only reported for projects in which Volvo Cars is the developer.
2) Lost time case (LTC) figures only, worked hours for contractors is not measured, therefore no figures for LTCR for contractors.
Board and Executive Management Team
Board members per gender and age group as per December 31 2016 Women Men
<30 30–50 >50 <30 30–50 >50
— — 3 — 3 7
Executive Management Team per gender and age group as per December 31 2016
Women Men
30< 30–50 >50 30< 30–50 >50
— 1 1 — 4 9
SUSTAINABILITY SCORECARD
144 VOLVO CAR GROUP | ANNUAL REPORT 2016

Employer of choice – Employer Attractiveness Rankings 2016 2015 2014 2013 2012
Students, MSc Engineering, Worldwide 47 46 40 50 43
Students, MSc Engineering, Sweden 2 6 7 13 26
Students, Business, Sweden 21 30 37 44 41
Young Professionals, Engineering, Sweden 7 7 8 12 12
Young Professionals, Business, Sweden 6 10 43 41 34
SOCIETAL DIMENSION
2016 2015 2014 2013 2012
Percentage of product categories for which health and safety impacts are assessed for improvement1) 100% 100% 100% 100% 100%
1) Safety is the number one priority for Volvo Cars. This means that health and safety concerns are integral in every phase in the development of all cars that is being developed and manufactured by Volvo Cars. For more information about Volvo Cars's work on safety, please see page 32.
2016 2015 2014 2013 2012
Share of independent tests where Volvo Cars received the highest rank. 96% 96% 95% 95% 95%
SUSTAINABILITY SCORECARD
VOLVO CAR GROUP | ANNUAL REPORT 2016 145ANNUAL REPORT 2016 | VOLVO CAR GROUP

GRI Index
Number of Disclosure Disclosure Comment
Page number(s) and/or URL(s)
Organizational Profile102-1 Name of the Organisation Front page, 1, 73
102-2 Activities, brands, products and services 1, 8–9, 30–31
102-3 Location of headquarters 1, 8–9, 73
102-4 Location of operations 8–9
102-5 Ownership and legal form 1, 73
102-6 Markets served 8–9
102-7 Scale of the organization 2–3, 73
102-8 Information on employees and other workers 60–68, 143–144
102-9 Supply chain 42
102-10 Significant changes to the organisation and its supply chain 136
102-11 Precautionary Principle or approach 136
102-12 External initiatives 70–71
102-13 Membership of associations 70–71
Strategy102-14 Statement from senior decision-maker 4–5
Ethics and Integrity102-16 Values, principles, standards and norms
of behaviour14–15, 18–21, 61–66, 136
Governance
102-18 Governance structure 136–137
Stakeholder engagement102-40 List of stakeholder groups 138
102-41 Collective bargaining agreements 65
102-42 Identifying and selecting stakeholders 138–139
102-43 Approach to stakeholder engagement 138–139
102-44 Key topics and concerns raised 138–139
Reporting practice102-45 Entities included in the consolidated
financial statements73
102-46 Defining report content and topic Boundaries
136
102-47 List of material topics 139
102-48 Restatements of information No restatements of information are made in this report
102-49 Changes in reporting 136
102-50 Reporting period 136
102-51 Date of most recent report 136
102-52 Reporting cycle 136
102-53 Contact point for questions regarding the report
136, 148
102-54 Claims of reporting in accordance with the GRI Standards
136
102-56 External assurance 136
GRI 101: Foundation 2016 (does not include disclosures)GRI 102: General Disclosures 2016 (core)
GRI-INDEX
146 VOLVO CAR GROUP | ANNUAL REPORT 2016

MATERIAL TOPICS
Number of Disclosure Disclosure Comment
Page number(s) and/or URL(s) Omission Reason for omission
ECONOMIC STANDARDS
Anti corruption103-1 – 103-3
Explanation of the material topic and its Boundary
65–66, 139
205-3 Confirmed incidents of corruption and actions taken
65
ENVIRONMENTAL STANDARDS
Energy103-1 – 103-3
Explanation of the material topic and its Boundary
21, 44, 139
302-1 Energy consumption within the organisation
44, 140–141 Volvo Cars does not sell any electricity, heating, cooling or steam. Hence only energy consumption is reported with the exception of cooling consumption.
Not applicable
Emissions103-1 – 103-3
Explanation of the material topic and its Boundary
21, 30–31, 34, 38, 44–45, 139
305-1 Direct (Scope 1) GHG emissions 44,140–141
305-2 Energy indirect (Scope 2) GHG emissions
140–141
305-3 Other indirect (Scope 3) GHG emissions
Volvo Cars defines scope 3 emissions as 1) the measurement of the
average CO2 emissions from the Volvo Cars car fleet, and
2) emissions from transports
35, 45, 141
305-7 Nitrogen oxides (NOx), sulfur oxides (SOx), and other significant air emissions
141 POP, HAP and PM are not reported
Not applicable
SOCIAL STANDARDS
Occupational Health and Safety103-1 – 103-3
Explanation of the material topic and its Boundary
62–65, 139
403-2
Type of injury and rates of injury, occupational diseases, lost days and absenteeism and total number of work-related fatalities
64, 143–144 1) data per gender2) data per region3) sick leave, absenteeism,
LTCR for contractors
1) Not applicable – Volvo Cars does not differentiate health and safety issues on the basis of gender
2) Not applicable – figures are presented on an aggregated level
3) Information unavailable
Diversity and Equal Opportunity103-1 – 103-3
Explanation of the material topic and its Boundary
62–65, 139
405-1 Diversity of governance bodies and employees
Governance bodies are defined as the Volvo Cars Board and Executive Management Team
132–135, 144
Supplier Social Assessment103-1 – 103-3
Explanation of the material topic and its Boundary
42, 139
414-1 New suppliers that were screened using social criteria
Social criteria are communi-cated to all suppliers as part of Terms and Conditions. Volvo Cars also has several tools for assessing and supporting the improvement of suppliers’ social sustainability performance.
42
Customer Health and Safety103-1 – 103-3
Explanation of the material topic and its Boundary
30–35, 71, 139
416-1 Assessment of the health and safety impacts of product and service categories
145
GRI-INDEX
VOLVO CAR GROUP | ANNUAL REPORT 2016 147ANNUAL REPORT 2016 | VOLVO CAR GROUP
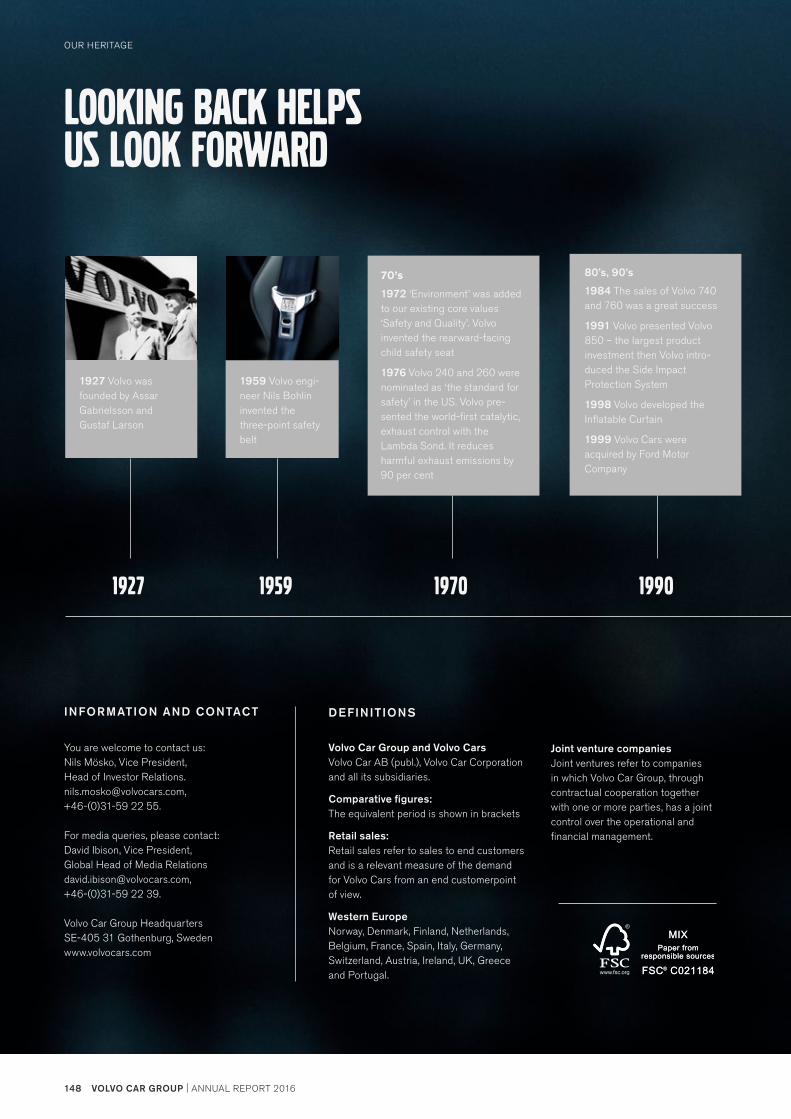
INFORMATION AND CONTACT DEFINIT IONS
You are welcome to contact us:Nils Mösko, Vice President, Head of Investor Relations. [email protected], +46-(0)31-59 22 55.
For media queries, please contact: David Ibison, Vice President, Global Head of Media [email protected], +46-(0)31-59 22 39.
Volvo Car Group HeadquartersSE-405 31 Gothenburg, Swedenwww.volvocars.com
Volvo Car Group and Volvo CarsVolvo Car AB (publ.), Volvo Car Corporation and all its subsidiaries.
Comparative figures:The equivalent period is shown in brackets
Retail sales:Retail sales refer to sales to end customers and is a relevant measure of the demand for Volvo Cars from an end customerpoint of view.
Western EuropeNorway, Denmark, Finland, Netherlands, Belgium, France, Spain, Italy, Germany, Switzerland, Austria, Ireland, UK, Greece and Portugal.
LOOKING BACK HELPS US LOOK FORWARD
70’s
1972 ‘Environment’ was added to our existing core values ‘Safety and Quality’. Volvo invented the rearward-facing child safety seat
1976 Volvo 240 and 260 were nominated as ‘the standard for safety’ in the US. Volvo pre-sented the world-first catalytic, exhaust control with the Lambda Sond. It reduces harmful exhaust emissions by 90 per cent
1927 1959 1970
1927 Volvo was founded by Assar Gabrielsson and Gustaf Larson
1959 Volvo engi-neer Nils Bohlin invented the three-point safety belt
80’s, 90’s
1984 The sales of Volvo 740 and 760 was a great success
1991 Volvo presented Volvo 850 – the largest product investment then Volvo intro-duced the Side Impact Protection System
1998 Volvo developed the Inflatable Curtain
1999 Volvo Cars were acquired by Ford Motor Company
1990
Joint venture companiesJoint ventures refer to companies in which Volvo Car Group, through contractual cooperation together with one or more parties, has a joint control over the operational and financial management.
148 VOLVO CAR GROUP | ANNUAL REPORT 2016
OUR HERITAGE

2010 Volvo Cars were acquired by Zhejiang Geely Holding Group
2013 Industrial entities in China were established
2008 Volvo Cars presented the collision avoidance system that could auto brake – City Safety
2014 Volvo Cars unveiled the first product developed on the SPA platform – the all-new XC90
2015 Volvo Cars started the construction of a plant in the US
2008
2010 2014
2013
2016
2015
2016 Volvo Cars accessed the capital market
VOLVO CAR GROUP | ANNUAL REPORT 2016 149ANNUAL REPORT 2016 | VOLVO CAR GROUP
OUR HERITAGE

721 MUSSEL BLUELAUNCH COLOUR FOR S90 2016