volvo car group annual report 2014/media/files/v/volvo...volvo car group annual report 2014 geely...
TRANSCRIPT

volvocar group
annualreport
2014
GEELY SWEDEN AB | ANNUAL REPORT 2014

2014 in brief
CEO comment
Challenges and opportunities
Strategy section
Strategic change themes
Brand
Design
Products
Research and development
Purchasing and manufacturing
Marketing and sales
People
Board of Directors’ report
Consolidated financial statements
Notes to the consolidated
financial statements
Parent company financial statements
Notes to the parent company
financial statements
Auditor’s report
Board of Directors
Executive management
Definitions
TABLE OF CONTENTS
3
4
6
8
10
12
14
16
18
20
24
28
35
43
47
76
79
83
84
86
88
this is volvo car groupOur history dates back to 1927 when the Swedish company Volvo Car Corporation was founded and the first Volvo car was launched. Volvo Cars is headquartered in Gothenburg in Sweden. Volvo cars are produced in factories in Torslanda in Swe-den, Ghent in Belgium, Chengdu, Daqing and Chongqing in China and Kuala Lum-pur in Malaysia. Since 2010, Volvo Cars is owned by Shanghai Geely Zhaoyuan International Investment Co., Ltd. which is ultimately owned by Zhejiang Geely Holding Group Ltd. (Geely). In 2014 around 2,300 Volvo dealers sold 465,866 cars in 100 countries around the world. As of December 2014, Volvo Car Group employed about 24,000 people.
We started making cars in 1927 because we believed nobody else was making them strong or safe enough for Swedish roads. Along the way we have come up with many innovations, some of which have changed the world. This commitment drives us forward to the next great Volvo Cars idea.
ZHEJIANG GEELYHOLDING GROUP CO., LTD.
SHANGHAI GEELY ZHAOYUAN INTERNATIONAL INVESTMENT CO., LTD.
GEELY SWEDEN HOLDINGS AB
GEELY SWEDEN AUTOMOTIVE AB
VOLVO CAR CORPORATION
ALL SALES COMPANIES, OTHER SUBSIDIARIES, JOINT VENTURES
AND ASSOCIATED COMPANIES
Related companies
GEELY SWEDEN AB VOLVO CAR GROUP(Consolidation level of all financial communication)
Volvo CarsThe Operations
CORPOR ATE STRUCTURE
READ MORE ON PAGE 35 .

1ANNUAL REPORT 2014 | GEELY SWEDEN AB
LORUM IPSUM
”Looking back at 2014’s performance gives me confidence in our future performance. Volvo Cars is performing well. Sales are grow-ing, a range of all new products are on the way, we are leading the field in new technologies and Volvo Cars is well placed to benefit from important new markets.”
HÅKAN SAMUELSSON, PRESIDENT & CEO, CEO COMMENT PAGE 4.

2 GEELY SWEDEN AB | ANNUAL REPORT 2014
LORUM IPSUM

GEELY SWEDEN AB | ANNUAL REPORT 2014 3ANNUAL REPORT 2014 | GEELY SWEDEN AB
LORUM IPSUM
2014 in brief
• Volvo Cars retail sales up by 8.9 per cent to 465,866 (427,840) units
• Volvo Car Group net revenue increased by 6.3 per cent to MSEK 129,959 (122,245)
• Operating income (EBIT) at MSEK 2,252 (1,919)
• Net income at MSEK 834 (960)
• Cash flow from operating and investing activities adjusted for investments in marketable securities of MSEK -4,131 (109)
Q1Q2
Q3Q4
Volvo Concept XC Coupé: "Best Concept Car" award at 2014 Detroit Motor Show and Volvo Concept Estate: multiple ‘Car of the show’ awards in Geneva.
In August, Volvo Cars pre-launched the all new XC90 in Stockholm. It will be one of the safest cars on the market and was very well received.
The Torslanda plant celebrated its 50 years anniversary and a new body shop was inaugurated to prepare for the new XC90 launch.
Volvo Cars earned top result in 2015 IIHS Top Safety Pick+ and the V60 Cross Country was launched at the Los Angeles motor show in October.
KEY RATIOS
MSEK 2014 2013
Net revenue 129,959 122,245
Operating income, EBIT 2,252 1,919
Net Income 834 960
EBITDA 9,183 9,057
Operating & investing cash flow –4,131 109
EBIT margin % 1.7 1.6
EBITDA margin, % 7.1 7.4
Equity ratio % 29.9 28.1
Net debt 928 2,607
RETAIL SALES BY REGION 2014
SALES BY CARLINE 2014
Other markets, 18%
Western Europe, 39%
US, 12%
Sweden, 13%
China, 17%
XC, 40%
V, 43%
S, 17%

4 GEELY SWEDEN AB | ANNUAL REPORT 2014
CEO COMMENT
Performing well and leading the field It is Volvo Cars’ long term strategic ambition to further develop its position as a global premium car maker. Driven by the complete renewal of its product range in the next four years, Volvo Cars is aiming to double sales to around 800,000 cars a year until 2020 while improving profitability. During 2014, Volvo Cars took several important steps towards achieving these goals.
With the ownership of Geely, Volvo Cars has the operational, stra-tegic and financial capabilities to develop and build a new genera-tion of cars. The first fruits of a BSEK 75 investment programme were to be seen with the pre-launch of the all new XC90 in August 2014.
Confident with the future of Volvo CarsThe new XC90 says a lot about the future of Volvo Cars.
It is built on an entirely new, in-house developed Scalable Product Architecture (SPA) technology, that improves driveability, provides a wider range of design options and will over time generate significant economies of scale, improvements in productivity and improved profitability. SPA will be used across Volvo Cars' future product range.
The XC90 also features Volvo Cars’ in-house designed new Drive-E powertrain, which provides a world leading combination of power and low carbon emissions. In addition, the XC90 offers world first safety technologies as standard and the most compre-hensive safety package on the market.
While I am extremely confident in the direction we are taking in terms of our products, it is also extremely important that we build our future development on stable finances. We have shown that we can improve our earnings, despite unfavourable currency developments, while developing world beating cars, investing in new car programmes and maintaining a constant vigilance towards costs. These disciplines will remain in place in coming years.
The changes that Volvo Cars is making come at a time of rapid development in the global automotive industry. Volvo Cars wel-comes these changes and is actively positioning the company to benefit from them.
Taking market shares in China One important opportunity is the rise of China as the world’s larg-est car market. Volvo Cars is ideally placed to benefit from this development. In 2014 we expanded our manufacturing footprint in China by announcing that SPA cars would be built at the plant in Daqing and production of the XC60 for the Chinese market has already started in Chengdu.
China became Volvo Cars’ largest market during 2014 and we took market share from our nearest competitors. These and other developments mean that Volvo Cars is well positioned to develop from the rise of China as the world's largest automotive market.
The US revival planTo regain market share and strengthen our presence in the US we have launched a revival plan, focused on strengthening our brand and reinforcing our premium position in the US market. We have a mid-term objective to once again sell 100,000 cars a year in the US. The combination of the new XC90, upcoming cars and our action plan means I am confident and determined that we will succeed.
Strong performance in EuropeVolvo Cars’ sales in Western Europe rose 9.5 per cent in 2014, which is twice as fast as its nearest competitors in the premium segment, according to the European Automobile Manufacturers Association (ACEA).
Leading in Autonomous DrivingAnother global opportunity is the rapid development of autono-mous driving technologies. Once again, Volvo Cars is choosing to address this issue by engaging in it. Reflecting its heritage and corporate values, Volvo Cars has announced a bold vision that by 2020 no-one should be killed or seriously injured in a new Volvo car. Volvo Cars believes autonomous driving is a key factor in reaching this vision.
That is why we have announced the world’s first and largest autonomous drive pilot project which will start in 2017 on selected roads in and around Gothenburg. This will involve our customers driving high level autonomous Volvo cars in everyday driving con-ditions.
This is no technical show case. It seeks to determine how to practically implement autonomous driving and introduce it to the real world. It is Volvo Cars’ strategy to lead the way in new technol-ogies rather than be led.
A growth storyThe benefits of our strategy are already being felt. We have reported record sales for 2014. But there are other important markers that help underpin our confidence in the future.
For example, we made 1,927 limited edition XC90s available for sale online after the pre-launch in August. These cars sold out in just 47 hours. In addition, we received over 15,000 online orders for the XC90 before production even started, underlining the high level of demand for the XC90 when it is released for sale in 2015.

GEELY SWEDEN AB | ANNUAL REPORT 2014 5ANNUAL REPORT 2014 | GEELY SWEDEN AB
LORUM IPSUM
Retail sales of up to 500,000 units
Back to growth in the US
Positive impact of the XC90, first car out in our major product renewal
FOCUS 2015
Retail sales will increase with up to 8% during 2015.8%
”The XC90 paves the way for a portfolio
of exciting new cars to come in the
following years”
We are also expanding our manufacturing capacity from 200,000 cars a year to 300,000 at our plant in Torslanda in Sweden, which celebrated its 50th anniversary in 2014, ahead of the launch of the new XC90. This has created a need to hire 1,300 new employees. These developments make it very clear that Volvo Cars’ story is one of growth.
Looking back at 2014’s performance gives me confidence in our future performance. Volvo Cars is performing well. Sales are grow-ing, we have a strong brand, a range of all new products are on the way and we are leading the field in new technologies so Volvo Cars is well placed to benefit from important new markets.
Lastly, I would like to personally thank our employees, all of whom have contributed to our record sales 2014 and created the founda-tions for our growth in coming years.
Our strategy is working.
Håkan SamuelssonPresident and Chief Executive Officer

6 GEELY SWEDEN AB | ANNUAL REPORT 2014
CHALLENGES AND OPPORTUNITIES
THE FUTURE OF CAR OWNERSHIP
Consumer research shows that young consumers are changing their attitudes toward owning a car. The popularity of ride-hailing and carpooling services is growing rapidly. There are new aspects of the future of car sales and car ownership that the automotive industry needs to consider. For instance, the car industry will pos-sibly sell a larger share of its cars to car-sharing and fleet firms, and the industry might need to offer options for shared car pur-chases by consumers.
At the same time, demographic changes mean that many coun-tries see their population ageing. The ‘silver generation’ of con-sumers has different expectations of their cars and this presents new challenges for car makers: how to adjust their cars to the wishes of older customers, while at the same time remaining attractive to a new, younger generation of car buyers. Manufactur-ers will need to develop cars with simple, accessible technology as well as more sophisticated driver assistance and safety systems.
THE CONNECTED AND SELF-DRIV ING CAR
Connectivity options are becoming more and more important for car buyers as they make their purchase decisions. Car makers therefore need to make sure they are on top of developments within connectivity and technology, a demand that may sometimes be at odds with lead times within the car industry.
On top of customer benefits, connected and in extension self-driving cars offer opportunities in terms of vehicle-to-vehicle and vehicle-to-infrastructure communication. This allows for improvements in safety, fuel economy and congestion to tackle some of the issues caused by global trends such as urbanisation: in general, the world’s population continues to move from the countryside to cities. New technologies in autonomous driving can offer a solution for these problems and can make urban transport networks more sustainable.
At the same time, the automotive industry will need to consider any potential privacy concerns among consumers, for instance about who owns the data generated from connected cars and how it can be used.
the world aroundvolvo carsThe world is constantly changing. Volvo Cars does not only need to adapt to the changes but can also steer them into our desired direction. By defining the challenges and opportunities we under-stand the drivers and have the opportunity to take the lead. These are some of many challenges and opportunities in the world around Volvo Cars that we have defined and are approaching.

GEELY SWEDEN AB | ANNUAL REPORT 2014 7ANNUAL REPORT 2014 | GEELY SWEDEN AB
EMISSION LE VEL S AND FUEL EFFICIENCY
Ever stricter emission regulations in all major automotive markets mean that manufacturers have to constantly improve the fuel efficiency and emission levels of their cars. Upcoming regulations in terms of emissions mean that car makers will have to increase the share of hybrid and fully electric drivetrains in their portfolios. Moreover, the development towards ever more efficient cars and the possibility of linking electric motors with smaller engines also brings into question whether large engines such as V8s and V10s still have a future.
COMPE TIT ION FOR COMPE TENCE
As cars become increasingly connected and packed with technol-ogy, car makers need more digital engineering talent for their future products. This puts the car industry in direct competition with large technology players, who are often located far away from traditional manufacturing bases. As a result, securing the neces-sary talent is more challenging than ever for car makers, while the market for traditional engineering talent also is highly competitive.
EMERGING MARKE TS
In order to grow their business, global carmakers are increasingly shifting their focus to emerging markets as their main source of growth. While China is the single larg-est car market in the world, there are several other markets (such as India, Brazil and Mexico) that offer considerable growth opportunities for the automotive industry. Car mak-ers need to decide on which markets to focus the resources, in which markets to produce and which markets can be cov-ered by imports only.
CHALLENGES AND OPPORTUNITIES

8 GEELY SWEDEN AB | ANNUAL REPORT 2014
STRATEGY SECTION
everything startswith people
COMPANY PURPOSE
Everything we do starts with people. We understand people. We protect what’s important to them and want to make them feel special. We take pride in our role within society and recognise
our commitment towards the environment. We innovate to make people’s lives better and less complicated. Our human- centric focus is what makes us different from all other car companies. And, it is at the heart of everything we create. This is why Volvo cars are designed around you.
THE STR ATEGIC CHANGE THEME S HAVE BE ARING ON E ACH ARE A WITHIN THE COMPANY
THE AREAS ARE DESCRIBED FURTHER ON PAGE 13 to 31
CORPOR ATE OBJECTIVE S
STR ATEGIC CHANGE THEME S
VISION
BRAND PURCHASING &MANUFACTURING
DESIGN MARKETING& SALES
PRODUCT PEOPLERESEARCH & DEVELOPMENT
MISSION
Our vision is to be the world’s most progressive and desired premium car brand.
• Provide cars people want• Be a lean and nimble company• Have a top tier premium auto brand perception• Be the employer of choice
• Emphasise profitability and efficiency• Revitalise the Volvo brand with customer centricity throughout the value chain• Reinforce our product strengths based on focused innovation, smart architecture and win-win collaboration
• Capture global growth and sourcing potential, leveraging the presence in China• Secure profitable growth in core segments in Europe and North America• Build a global organisation with performance and health, able to act in a fast, smart and nimble way
In order to meet the Corporate Objectives there is a need for renewal and a change in the way of doing business. Volvo Cars’ corporate strategy therefore includes six Strategic Change Themes which guide the daily operations and business initiatives and enable Volvo Cars to make that change.
Within each Change Theme there are several ongoing initiatives. On the following spread we describe five of the current initiatives and the related projects.
Which will lead to• Sales of over 800,000 vehicles globally• Top car industry profitability
Our global success will be driven by making life less compli-cated for people, while strengthening our commitment to safety, quality and the environment.

GEELY SWEDEN AB | ANNUAL REPORT 2014 9ANNUAL REPORT 2014 | GEELY SWEDEN AB
LORUM IPSUM
10 GEELY SWEDEN AB | ANNUAL REPORT 2014
STR ATEGIC CHANGE THEME INIT IATIVE PROJECT
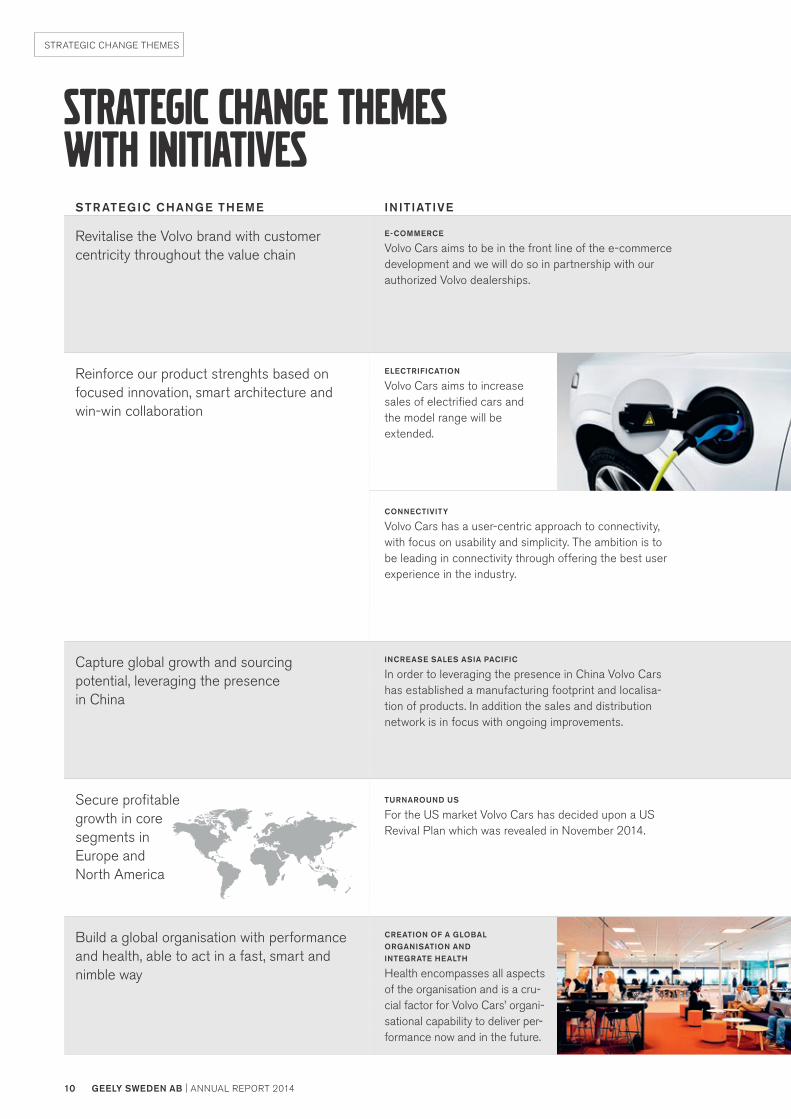
Revitalise the Volvo brand with customer centricity throughout the value chain
E-COMMERCE
Volvo Cars aims to be in the front line of the e-commerce development and we will do so in partnership with our authorized Volvo dealerships.
In conjunction with the pre-launch of the all-new XC90, Volvo sold 1,927 First Edition cars exclusively online in 29 markets. All cars were sold out within 47 hours.
READ MORE ON PAGE 25
Reinforce our product strenghts based on focused innovation, smart architecture and win-win collaboration
ELECTRIFICATION
Volvo Cars aims to increase sales of electrified cars and the model range will be extended.
Based on the success of the V60 Plug-in hybrid and the general strategy to decrease CO2 emissions Volvo Cars is strengthening its competitiveness within electrification. The top-of-the-line ver-sion of the all-new Volvo XC90 is a petrol plug-in hybrid called T8 Twin Engine. The T8 Twin Engine is the world’s most powerful and cleanest SUV with its ultra-low CO2 emissions of 59 g/km.
READ MORE ON PAGE 16 AND ON PAGE 18
CONNECTIVITY Volvo Cars has a user-centric approach to connectivity, with focus on usability and simplicity. The ambition is to be leading in connectivity through offering the best user experience in the industry.
Sensus Connect is Volvo Cars cloud-based infotainment and navigation system which offers customers a fully connected experience.
The all-new XC90 interior is designed around a new user interface with a large, portrait touch-screen in the centre console.
READ MORE ON PAGE 17
Capture global growth and sourcing potential, leveraging the presence in China
INCREASE SALES ASIA PACIFIC
In order to leveraging the presence in China Volvo Cars has established a manufacturing footprint and localisa-tion of products. In addition the sales and distribution network is in focus with ongoing improvements.
New models are launched continuously in China and during 2014 Volvo Cars has revealed investments that will follow in order to fulfil the strategy.
READ MORE ON PAGE 20-23
Secure profitable growth in core segments in Europe and North America
TURNAROUND US For the US market Volvo Cars has decided upon a US Revival Plan which was revealed in November 2014.
The plan includes a complete renewal of the entire product range in the next five years, a renewed focus on its dealer network, world first engine and safety technologies, a new management team and a new market strategy.
READ MORE ON PAGE 26
Build a global organisation with performance and health, able to act in a fast, smart and nimble way
CREATION OF A GLOBAL ORGANISATION AND INTEGRATE HEALTH Health encompasses all aspects of the organisation and is a cru-cial factor for Volvo Cars’ organi-sational capability to deliver per-formance now and in the future.
FOCUS AREAS:
STRATEGIC CHANGE THEMES
Strategic change themeswith initiatives

GEELY SWEDEN AB | ANNUAL REPORT 2014 11ANNUAL REPORT 2014 | GEELY SWEDEN AB
STR ATEGIC CHANGE THEME INIT IATIVE PROJECT
Revitalise the Volvo brand with customer centricity throughout the value chain
E-COMMERCE
Volvo Cars aims to be in the front line of the e-commerce development and we will do so in partnership with our authorized Volvo dealerships.
In conjunction with the pre-launch of the all-new XC90, Volvo sold 1,927 First Edition cars exclusively online in 29 markets. All cars were sold out within 47 hours.
READ MORE ON PAGE 25
Reinforce our product strenghts based on focused innovation, smart architecture and win-win collaboration
ELECTRIFICATION
Volvo Cars aims to increase sales of electrified cars and the model range will be extended.
Based on the success of the V60 Plug-in hybrid and the general strategy to decrease CO2 emissions Volvo Cars is strengthening its competitiveness within electrification. The top-of-the-line ver-sion of the all-new Volvo XC90 is a petrol plug-in hybrid called T8 Twin Engine. The T8 Twin Engine is the world’s most powerful and cleanest SUV with its ultra-low CO2 emissions of 59 g/km.
READ MORE ON PAGE 16 AND ON PAGE 18
CONNECTIVITY Volvo Cars has a user-centric approach to connectivity, with focus on usability and simplicity. The ambition is to be leading in connectivity through offering the best user experience in the industry.
Sensus Connect is Volvo Cars cloud-based infotainment and navigation system which offers customers a fully connected experience.
The all-new XC90 interior is designed around a new user interface with a large, portrait touch-screen in the centre console.
READ MORE ON PAGE 17
Capture global growth and sourcing potential, leveraging the presence in China
INCREASE SALES ASIA PACIFIC
In order to leveraging the presence in China Volvo Cars has established a manufacturing footprint and localisa-tion of products. In addition the sales and distribution network is in focus with ongoing improvements.
New models are launched continuously in China and during 2014 Volvo Cars has revealed investments that will follow in order to fulfil the strategy.
READ MORE ON PAGE 20-23
Secure profitable growth in core segments in Europe and North America
TURNAROUND US For the US market Volvo Cars has decided upon a US Revival Plan which was revealed in November 2014.
The plan includes a complete renewal of the entire product range in the next five years, a renewed focus on its dealer network, world first engine and safety technologies, a new management team and a new market strategy.
READ MORE ON PAGE 26
Build a global organisation with performance and health, able to act in a fast, smart and nimble way
CREATION OF A GLOBAL ORGANISATION AND INTEGRATE HEALTH Health encompasses all aspects of the organisation and is a cru-cial factor for Volvo Cars’ organi-sational capability to deliver per-formance now and in the future.
FOCUS AREAS:
• Improving leadership globally through three major lead-ership programmes within R&D, Purchasing & Manu-facturing and Marketing, Sales & Customer Service
• Improving most elements of health through the contin-ued roll-out of our activity-based work place concept Designed Around You @ Work
STRATEGIC CHANGE THEMES
59 g/km
47 hours
Designed Around You @ Work
Ultra-low CO2 emissions
READ MORE ON PAGE 29

12 GEELY SWEDEN AB | ANNUAL REPORT 2014
LORUM IPSUM
GEELY SWEDEN AB | ANNUAL REPORT 2014 13ANNUAL REPORT 2014 | GEELY SWEDEN AB
BRAND
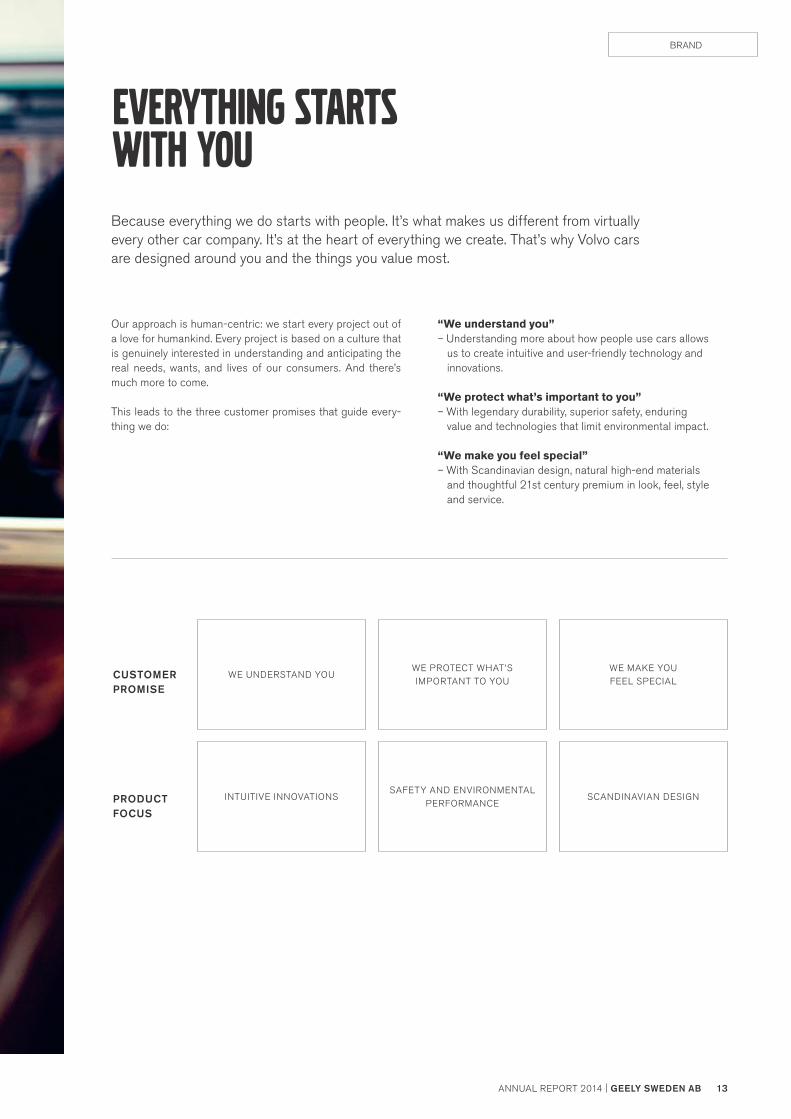
EVERYTHING STARTSWITH YOU
Our approach is human-centric: we start every project out of a love for humankind. Every project is based on a culture that is genuinely interested in understanding and anticipating the real needs, wants, and lives of our consumers. And there’s much more to come.
This leads to the three customer promises that guide every-thing we do:
“We understand you” – Understanding more about how people use cars allows us to create intuitive and user-friendly technology and innovations.
“We protect what’s important to you” – With legendary durability, superior safety, enduring value and technologies that limit environmental impact.
“We make you feel special” – With Scandinavian design, natural high-end materials and thoughtful 21st century premium in look, feel, style and service.
Because everything we do starts with people. It’s what makes us different from virtually every other car company. It’s at the heart of everything we create. That’s why Volvo cars are designed around you and the things you value most.
WE UNDERSTAND YOU
INTUITIVE INNOVATIONS
WE PROTECT WHAT’S IMPORTANT TO YOU
SAFETY AND ENVIRONMENTAL PERFORMANCE
WE MAKE YOU FEEL SPECIAL
SCANDINAVIAN DESIGN
CUSTOMERPROMISE
PRODUCTFOCUS
14 GEELY SWEDEN AB | ANNUAL REPORT 2014
DESIGN
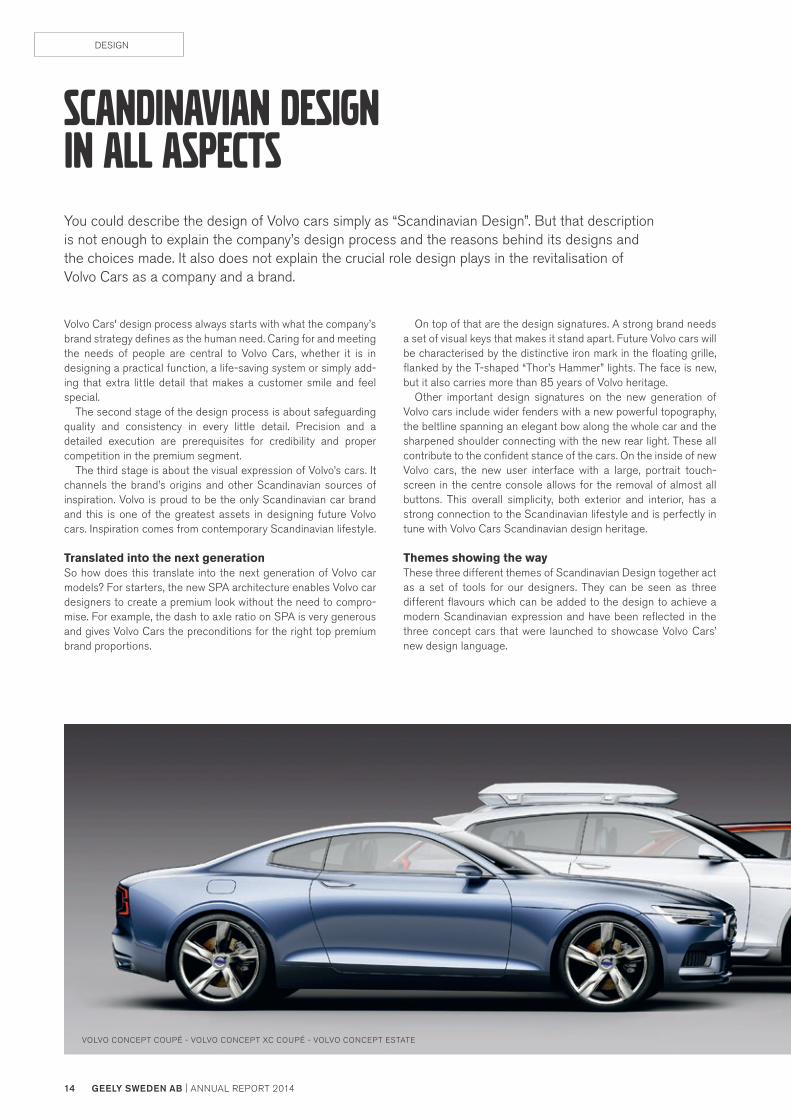
scandinavian designin all aspectsYou could describe the design of Volvo cars simply as “Scandinavian Design”. But that description is not enough to explain the company’s design process and the reasons behind its designs and the choices made. It also does not explain the crucial role design plays in the revitalisation of Volvo Cars as a company and a brand.
Volvo Cars' design process always starts with what the company’s brand strategy defines as the human need. Caring for and meeting the needs of people are central to Volvo Cars, whether it is in designing a practical function, a life-saving system or simply add-ing that extra little detail that makes a customer smile and feel special.
The second stage of the design process is about safeguarding quality and consistency in every little detail. Precision and a detailed execution are prerequisites for credibility and proper competition in the premium segment.
The third stage is about the visual expression of Volvo’s cars. It channels the brand’s origins and other Scandinavian sources of inspiration. Volvo is proud to be the only Scandinavian car brand and this is one of the greatest assets in designing future Volvo cars. Inspiration comes from contemporary Scandinavian lifestyle.
Translated into the next generationSo how does this translate into the next generation of Volvo car models? For starters, the new SPA architecture enables Volvo car designers to create a premium look without the need to compro-mise. For example, the dash to axle ratio on SPA is very generous and gives Volvo Cars the preconditions for the right top premium brand proportions.
On top of that are the design signatures. A strong brand needs a set of visual keys that makes it stand apart. Future Volvo cars will be characterised by the distinctive iron mark in the floating grille, flanked by the T-shaped “Thor’s Hammer” lights. The face is new, but it also carries more than 85 years of Volvo heritage. Other important design signatures on the new generation of Volvo cars include wider fenders with a new powerful topography, the beltline spanning an elegant bow along the whole car and the sharpened shoulder connecting with the new rear light. These all contribute to the confident stance of the cars. On the inside of new Volvo cars, the new user interface with a large, portrait touch-screen in the centre console allows for the removal of almost all buttons. This overall simplicity, both exterior and interior, has a strong connection to the Scandinavian lifestyle and is perfectly in tune with Volvo Cars Scandinavian design heritage.
Themes showing the wayThese three different themes of Scandinavian Design together act as a set of tools for our designers. They can be seen as three different flavours which can be added to the design to achieve a modern Scandinavian expression and have been reflected in the three concept cars that were launched to showcase Volvo Cars’ new design language.
VOLVO CONCEPT COUPÉ - VOLVO CONCEPT XC COUPÉ - VOLVO CONCEPT ESTATE

GEELY SWEDEN AB | ANNUAL REPORT 2014 15ANNUAL REPORT 2014 | GEELY SWEDEN AB
DESIGN
Scandinavian Authority – The Volvo Concept CoupéThe Scandinavian Authority theme puts emphasis on the simplicity, authenticity and elegance in Scandinavian design, while at the same time expressing confidence and strength. All these elements are reflected in the Volvo Concept Coupé, the first of three concept cars showcasing Volvo Cars’ new design direction.
Scandinavian Activity – The Volvo Concept XC CoupéIn Volvo Cars’ part of the world, people spend time outside no matter what the weather is. These adventures in nature require that you bring the right gear and clothes in the right materials. The Volvo Concept XC Coupé highlights this focus on functionalism in a modern and active context. Inspired by the design of modern high-tech sports equipment, it is a sophisticated and capable car for people with an active lifestyle.
Scandinavian Creativity – The Volvo Concept EstateThis theme takes inspiration from the successful creative scenes of Scandinavian fashion, music, arts and advertising. The P1800- inspired Volvo Concept Estate, with its extrovert and colourful inte-rior design featuring exclusive natural materials, recreates the bright and cosy feeling of a Swedish living room.
Thomas Ingenlath, Senior Vice President Design, comments on:
Design of future cars“The new Volvo Concept Coupé reveals how we could shape our cars from now on. Free from the superficial surface excitement of other car brands, we add emo-tional value to the Volvo brand with the calm, confident beauty that is the hallmark of Scandinavian design.”
Human-Centricity“Volvo’s unique human-centric approach and the aim to inject more emotions into the car design are perfect partners. Volvo Cars’ caring, human-centric values are an integrated part of the Scandinavian culture and life-style. The challenge is to express this with a bolder, more distinctive design that is an all-important cus-tomer criterion for premium cars.”

16 GEELY SWEDEN AB | ANNUAL REPORT 2014
PRODUCTS
XC90 revealed with styleeight to followWith nine new cars to be released in the next five years, Volvo Cars stands at the beginning of an unprecedented revitalisation of its product portfolio. The all-new Volvo XC90 is the first in this range of nine new cars: full of new, in-house developed technology and representing the new, independent Volvo Cars.
By the end of that period, the all-new XC90 will be the oldest car on the showroom floor. In that sense, the global reveal and pre-launch of the XC90 in August 2014 was more than simply the launch of a new car for the company: it was the re-launch of the Volvo brand.
New Drive-E powertrain familyVolvo Cars’ brand new, in-house developed, Drive-E powertrain family will power the majority of the vehicles to come. In 2014, the Drive-E engines solidly established their reputation as a hallmark of forward-thinking, Swedish engineering, marking a clear commit-ment from Volvo Cars to its environmental heritage. Volvo Cars is the only premium manufacturer to move away from large engines and fully focus on four-cylinder engines or smaller. The Drive-E
engines are available in all current Volvo car models except the first-generation XC90 and have been a major boost to the compa-ny’s sales success in 2014.
The Drive-E powertrains are a modular family of four-cylinder, two-litre petrol and diesel engines which offer a range of possibili-ties in terms of output. With their uncompromising performance in terms of fuel economy and CO2 emissions they allow Volvo Cars to lead the way in reducing CO2 emissions. Volvo Cars has a specific legal target to reduce its average fleet emissions below 145g CO2/km in EU by 2015, but has succeeded to do so already in 2012.
Prepared for electrificationThe Drive-E engines are also prepared for electrification, which opens up further possibilities to reduce environmental impact via
NEW DRIVE-E VS PREVIOUS ENGINES, CO2/HP FLEET CO2-EMISSIONS
Gram/km
140
160
120
100
80
60
40
20
012 13 1411
CO2 Gram/km
250
275
225
200
175
150
125
100
75150 200 250 300 350
Horsepower (HP)Previous Engines New Drive-E
Volvo Cars is constantly aiming to reduce its fleet CO2-emissions. The new effective Drive-E powertrain are contributing to the development.
In accordance with the strategy the ratio between CO2-emissions and horsepower has been significantly lowered for the Drive-E powertrains.

GEELY SWEDEN AB | ANNUAL REPORT 2014 17ANNUAL REPORT 2014 | GEELY SWEDEN AB
PRODUCTS
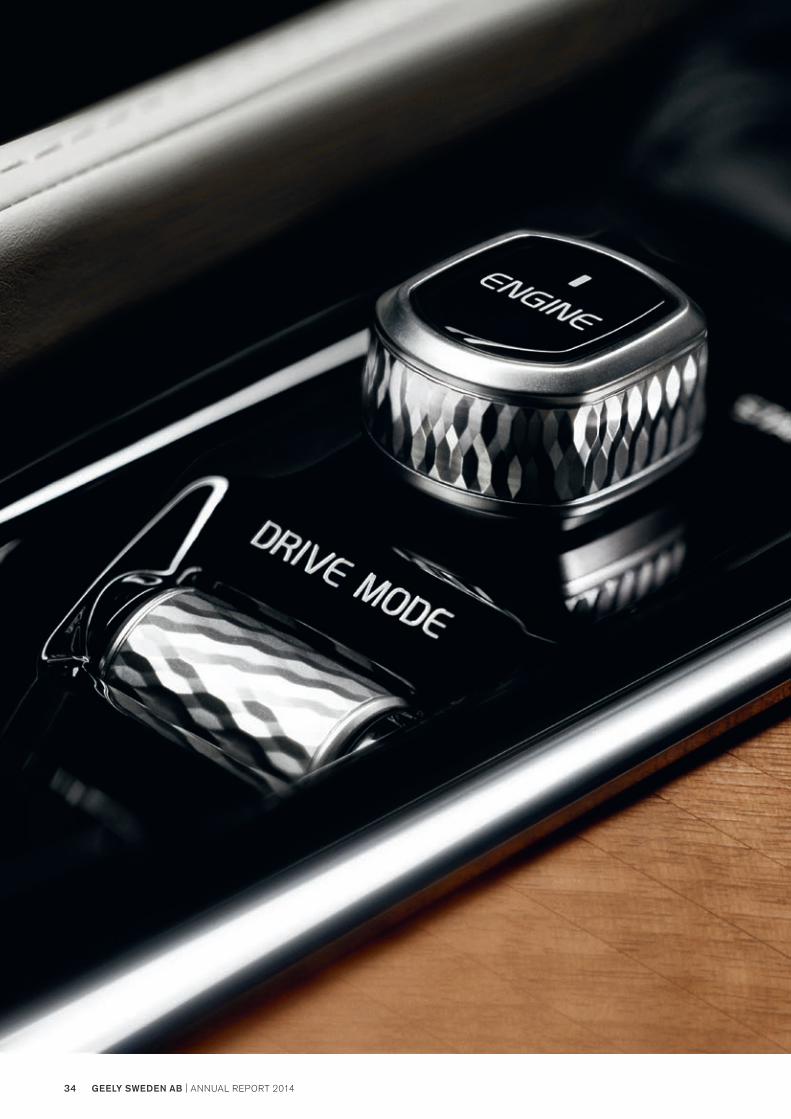
plug-in hybrid drivetrains. The new electrified engines have a three stage power performance: Hybrid, Pure Electric and Power Mode.
The car best reflecting this ‘three-cars-into-one’ philosophy is the all-new Volvo XC90 with T8 Twin Engine powertrain. This top-of-the-line version of the XC90 combines a power output of close to 400 horsepower with CO2 emissions of 59 g/km. Together with the Volvo V60 Plug-in Hybrid and the upcoming S60L Petrol Plug-in Hybrid, the XC90 T8 Twin Engine confirms Volvo Cars’ leading position within smart electrification.
Fully connected experienceAnother area in which Volvo Cars offers a ground-breaking approach is the in-car driving experience and connectivity. Market research shows that connectivity options are weighed ever more heavily by customers as they decide on which car to buy. Custom-ers look for smart, intuitive and flawless technology that allows them to be connected wherever they are, while at the same time this technology should not pose safety issues.
In order to meet these demands, the designers and engineers behind Volvo Cars’ all-new XC90 have completely re-conceived the way drivers operate their cars. The result is the most modern in-car control system on the market.
Volvo Cars’ new in-car control system offers customers a fully connected experience, thanks to the Ericsson-based cloud solution and the navigation system by HERE, which provides the possibility to remotely update content and simplify the entire car experience.
Starting with the all-new XC90, the system also offers Apple CarPlay and Android Auto, which brings selected features and services familiar to smartphone users directly into the car via the large centre console touch screen display. It makes Volvo Cars one of few car makers that offer compatibility for both Apple CarPlay and Android Auto, covering over 95 per cent of the global smart-phone market.
Lex Kerssemakers, Senior Vice President Product Strategy and Vehicle Line Management, comments on
Product strategy“This is an incredibly exciting period to be the head of Volvo Cars’ future product strategy. Never before have we had such a packed portfolio of upcoming cars in such a short timeframe.”
Drive-E and electrifications“If you want 400 horsepower, we can provide that, no problem. But we can offer it without customers having to feel guilty about their impact on the environ-ment. We have simply stopped counting cylinders.”
Connectivity“We have focused on creating a smooth interaction without distraction. Some have wondered whether a touch screen in a car is really safe. Well, if it wasn’t safe, we wouldn’t put it in a Volvo car.”

18 GEELY SWEDEN AB | ANNUAL REPORT 2014
Developing the all-new XC90“With the pre-launch of the all-new XC90, we have basically broken all rules of developing a new car. Everything on this car is new: we have a completely new platform, a brand new engine family, a fully new electrical system as well as a completely new infotainment system, to name a few things.”
Safety“By developing new technologies targeting specific real-life traf-fic situations, we move ever closer to our Safety Vision 2020. When it comes to safety, the conclusion is simple: Volvo Cars leads, the industry follows.”
Autonomous drive“I am convinced that the driver will never completely disappear from the picture. That is why we need to design and develop these technologies around the driver, and Drive Me is a huge step in the right direction.”
Peter Mertens, Senior Vice President Research & Development, comments on:
a new chapterjust startedThree years in the making and part of a BSEK 75 investment programme, the all-new XC90 marks the beginning of a new chapter in Volvo Cars’ history. The car captures Volvo Cars’ future design direction, incorporates its own range of new technologies and utilises its new SPA technology and its highly efficient two-litre, four-cylinder Drive-E powertrain family.
Developing all these new technologies simultaneously has asked a lot of the Volvo Cars R&D department, but the engineers in Gothenburg have delivered: the new XC90 is the best Volvo car the company has ever built.
Following models will benefit as wellThe new technologies were not developed for the new XC90 alone: all following models in the 90 and 60 cluster in the next few years will benefit from these technologies.
At the same time, Volvo Cars is also working closely with Geely on the next-generation C-segment vehicle architecture, called CMA. This modular architecture is developed at the Geely owned Gothenburg-based company China - Euro Vehicle Technology AB (CEVT AB). Being a modular architecture, CMA allows for the development of different vehicles with different performance lev-els, ensuring tailor-made solutions for the Geely and Volvo brands.
World-first safety systems – to start withIn terms of safety features; the all-new XC90 offers the most com-prehensive and technologically sophisticated standard safety package available in the automotive industry. The car also features two new, world-first safety systems: a run-off road protection package and auto brake at intersection capability. These systems are the latest fruits from Volvo Cars’ no-compromises approach to safety technology development and are a sign of things to come in other new Volvo car models in the next few years.
This makes the car an important step towards the company’s Safety Vision 2020: by 2020, no one should be killed or seriously injured in a new Volvo car model. In the longer term, Volvo Cars aims to design and develop cars that simply do not crash.
Safety in every phase of a cars’ life Internationally, Volvo Cars is regarded as the role model for traffic safety, and rightly so. The company incorporates safety in every phase of a Volvo cars’ life cycle. Volvo Cars is unrivalled in its ded-ication to trying to understand why accidents happen and how they can be prevented. The company’s Traffic Accident Research Team, established in 1970, has and continues to collect data from tens of thousands traffic accidents with Volvo cars around Swe-den. These invaluable data are used when designing new cars, while additional data is gathered by performing numerous types of accident reconstructions and crash tests in the company’s state-of-the-art crash laboratory.
Autonomous drive - a key enabler in important issues The Adaptive Cruise Control with Pilot Assist is an example of how Volvo Cars is in the forefront when it comes to the development and practical implementation of autonomous driving technologies. Volvo Cars sees autonomous drive as a key enabler to improve safety, traffic congestion and fuel economy. It is an opportunity to deliver real benefits in real-life traffic situations.
RESEARCH AND DEVELOPMENT

GEELY SWEDEN AB | ANNUAL REPORT 2014 19ANNUAL REPORT 2014 | GEELY SWEDEN AB
SCALABLE PRODUCT ARCHITECTURE (SPA)The all-new XC90 is the first car to be built on Volvo Cars’ in-house developed Scalable Product Architecture (SPA). SPA allows a wide range of cars, powertrains, electrical systems and technologies – all of differing complexity – to be fitted on the same architecture.
Modern-day society faces significant challenges to improve traf-fic safety, to reduce pollution and to make more efficient use of traffic infrastructure. Autonomous drive has the ability to do all three: fuel consumption can be cut by up to 20 per cent and up to 90 per cent of all traffic accidents can be prevented by removing the human error factor. By limiting speed variations, traffic flows can be improved and roads can be used more efficiently.
”Drive Me” in pole positionAfter successfully completing the SARTRE road train project (Safe Road Trains for the Environment) in 2012, Volvo Cars is now working
on what is arguably the most ambitious autonomous drive project in the world: the Drive Me pilot which takes place in Volvo Cars’ Swedish hometown of Gothenburg. The project, with 100 self-driv-ing Volvo cars on public roads by 2017, is moving forward rapidly. The first test cars, chauffeured by Volvo Cars engineers, started driving around Gothenburg in the spring of 2014 and the sophisti-cated Autopilot technology has been performing well.
What makes the Drive Me project so special is that it involves all the key players: legislators, transport authorities, a major city, a vehicle manufacturer and real customers.
Vertical Economics of ScaleSPA will also change the way Volvo cars are built in the future by allowing a wide range of cars, powertrains, electrical systems and technologies – all of differing complexity – to be fitted on the same architecture, generating significant economies of scale.
Volvo Cars has made large investments in research and development from which future Volvo car models will benefit.
RESEARCH AND DEVELOPMENT EXPENSES
MSEK
6,000
7,000
5,000
4,000
3,000
2,000
1,000
012 13 1411
RESEARCH AND DEVELOPMENT
VERTICAL ECONOMICS OF SCALE
M (XC90)
D/E (S90 & V90)
S (XC60)
C/D (V60 & S60)C/D (V60 & S60)
VE
HIC
LE S
IZE

20 GEELY SWEDEN AB | ANNUAL REPORT 2014
higher capacity atall major sites2014 was a year of growth and expansion for Volvo Cars, with large investments at all major manufacturing sites. Volvo Cars invest in order to double the installed manufacturing capacity in the coming years and to support the long-term targets.
In Torslanda, the company prepared for the start of production of the all-new XC90 by opening a brand new, SPA-prepared body shop. This new facility, officially opened in June in con-junction with the celebration of the plant’s 50-year anniver-sary, expands the capacity in Torslanda to 300,000 cars per year. This, in combination with stronger demand for existing Volvo car models, also means that Volvo Cars will re-introduce a third shift in the spring of 2015. The related recruitment of around 1,300 additional employees further underlines the role of Volvo Cars as one of the largest employers in Sweden.
Expanding in Chengdu and DaqingIn China, the Chengdu plant had its first full year of S60L production and started the production of the XC60. The addi-tion of the XC60 to the Chengdu plant also meant an increase of around 500 new employees. Meanwhile, the Daqing plant commenced production of the XC Classic, a China-only ver-sion of the original XC90. The Daqing plant also started pre-paring for manufacturing cars based on the SPA platform. The first SPA model to be built in Daqing is a premium sedan.
In 2015, the Chengdu plant will add an additional variant of the S60L to the production line, in the form of the S60L Pet-rol Plug-in Hybrid. The S60L Petrol Plug-in Hybrid is one of the first premium plug-in vehicles to be manufactured and sold in China. As such, the car represents the future of the car
industry in China – clean, efficient and premium – and high-lights Volvo Cars’ environmental and technological leadership.
A successful year in Ghent Ghent continued to be one of Europe’s most efficient car plants, with the highest capacity utilisation within Volvo Cars’ manufacturing footprint. The full-year production total of 264,200 cars made 2014 the second-most successful year in the history of the plant, which employs around 5,000 people and has been in operation since 1965. In 2014, Ghent passed the milestone of 5.5 million cars built since its foundation.
Focus on quality and environmentAll Volvo Cars’ plants fully adhere to Volvo Cars’ global Volvo Car Manufacturing System (VCMS) pioneered in Torslanda and Ghent, and utilise global technology, global sourcing and provide global quality.
Volvo Cars’ manufacturing plants around the globe also fol-low the Volvo Cars Global Environmental Standard, which ensures that all of Volvo Cars’ manufacturing operations limit their environmental impact as much as possible. In establish-ing new plants, Volvo Cars has chosen not to compromise when it comes in terms of environmental performance and the factories often perform better than what is legally required under local legislation.
President Xi Jinping of the People’s Republic of China and First Lady Mme Peng Liyuan, joined by King Philippe and Queen Mathilde of Belgium, visited the Volvo Cars facilities in Ghent, Belgium in April 2014.
PURCHASING AND MANUFACTURING

GEELY SWEDEN AB | ANNUAL REPORT 2014 21ANNUAL REPORT 2014 | GEELY SWEDEN AB
LORUM IPSUM

22 GEELY SWEDEN AB | ANNUAL REPORT 2014
Water project in ChengduA good example of this approach is the way in which the Chengdu plant deals with waste water. The waste water treatment plant in Chengdu is designed with both chemical and biological treatment steps before the water is released to a municipal waste water treatment facility. While this treatment level is required by Volvo Car Environmental Global Standard, it exceeds local legal require-ments in China. The Ghent plant also further improved its environmental cre-dentials through a co-operation with its neighbour, paper maker Stora Enso. Stora Enso’s facilities in Ghent generate heated water as a by-product which is now used to heat Volvo Cars buildings and paint booths. As a result, Volvo Car Gent substantially reduces its use of fossil fuels for heating purposes and decreases its net annual CO2 emissions by more than 40 per cent.
Suppliers involved in specificationThroughout the process to develop a new Volvo car model the Purchasing and Research & Development departments work closely together. By involving the suppliers in the specification pro-cess Volvo Cars make use of their insights and identify the suppli-ers best positioned to meet its specific requirements. Volvo Cars work closely together in the area of sourcing with for instance CEVT AB in Gothenburg, as part of the ongoing joint development of the C-segment modular vehicle architecture, CMA.
Assessment program for suppliersVolvo Cars’ around 4,000 suppliers have all gone through the company’s supplier assessment program. Partners are naturally evaluated on their technical and development capabilities, as well as on quality standards and daily performance. In line with Volvo Cars’ environmental focus, suppliers also need to meet environ-mental standards and are subject to a sustainability review of their supply chain. The supplier assessment process also includes on-site audits by Volvo Cars representatives.
PURCHASING AND MANUFACTURING

GEELY SWEDEN AB | ANNUAL REPORT 2014 23ANNUAL REPORT 2014 | GEELY SWEDEN AB
Lars Wrebo, Senior Vice President Purchasing and Manufacturing, comments on:
Manufacturing footprint“You could say we are in something of a luxury position when it comes to our manufacturing footprint. While other, larger car manufacturers are dealing with overcapacity, we are faced with the opposite. Rather than reducing capacity, we need to make significant investments in our manufacturing operations in order to expand and be able to meet our long-term growth targets. That is an exciting position to be in.”
Supply chain“Volvo Cars’ relationship with its supplier and partners is based on mu-tual trust. We realise that we don’t need to invent the wheel again, which is why we often make use of the wealth of expertise within our supplier network. But sometimes we do need to ask whether the exis-ting wheel is good enough for our ambition levels.”
PURCHASING AND MANUFACTURING
PRODUCE AND SOURCE WHERE WE SELL A global manufacturing footprint requires a global integrated supply chain based on the overall value chain principle ‘we produce where we sell and we source where we produce’. This strategy allows for just in time delivery, flexibility and gives a responsiveness to meet market and business demands.
USA CAMARILLO
DESIGN CENTRE
MALAYSIAKUALA LUMPUR
ASSEMBLY FACTORY
BELGIUM GENT
V40, V40CC,
S60, XC60
DENMARK COPENHAGEN
RD CENTRE
SWEDEN GOTHENBURG
HEAD OFFICE,
PRODUCT DEVELOPMENT,
DESIGN CENTRE,
MARKETING,
ADMINISTRATION,
S60, S80, V60, V70,
XC70, XC90
SWEDEN SKÖVDE, FLOBY &
OLOFSTRÖM
ENGINE & COMPONENT
MANUFACTORING
CHINA
CHENGDU1)
S60L, XC60
DAQING
XC CLASSIC
ZHANGIJAKOU2)
ENGINE PRODUCTION
CHONQING3)
S80L
1) The manufacturing plant in Chengdu (China) is owned by Chinese subsidiaries of the parent company of the Volvo Car Group, Shanghai Geely Zhaoyuan Investment Co., Ltd. 2) The manufacturing plant in Zhangijakou (China) is a joint venture and a contractual manufacturer.3) The manufacturing plant in Chongqing (China) is owned by Changah Automotive Co Ltd, Ford Motor Company and Mazda Automotive Co., Ltd.

24 GEELY SWEDEN AB | ANNUAL REPORT 2014
Everything works together to create a dynamic and differentiating image of Volvo Cars and ensure that people will get the premium experience they should expect from a brand like Volvo.
Our way of going to market With our new, different way of going to market, Volvo Cars is leav-ing the traditional thinking behind; using small size, nimbleness and ability to think differently to its advantage. The global pre-launch of the all-new XC90 is an inspiring example. In August, the car was first shown to media and other target groups from around the globe at the Scandinavian design venue Artipelag in the Stock-holm archipelago. The one week reveal event generated substan-tial media buzz before the car was shown to the wider Swedish public at urban hot spots in downtown Gothenburg and Stockholm.
For the 2014 Paris Motor show, the Volvo Cars stand focused completely on the all-new XC90. Rain and snow effects as well as a 360 degrees visual spectacle blended together to draw media
and visitors into the Scandinavian heartland of the XC90: the lakes, forests, fields and fresh air of Sweden. In 2014, successful market-ing campaigns with Swedish icons such as football star Zlatan Ibra-himovic and musician Robyn underlined the Swedish heritage and iconoclastic status of Volvo Cars, while at the same time highlighting the strengths and benefits of doing things differently.
Brand building campaigns in ChinaIn China, a campaign from 2013, which highlighted the beneficial effects of Volvo’s industry-leading air filter system, spilled over into 2014 as Volvo cars continued to be positioned as a leading alter-native for buyers who want to counter the negative effects of pol-lution. Volvo Cars continued marketing its cars with brand-building campaigns that focus on the company’s Swedish heritage and themes like safety, environmental impact, personal health and autonomous drive.
Volvo Cars should utilise the unique differentiation of the Volvo brand and do things differently, do it our way. Volvo Cars has therefore defined a new direction when it comes to balancing marketing spend between market communication; sponsorship and events, to digital strategy; offers; showroom experience; service and ownership experience.
DOING Things DIFFERENTLY,DO it our way
MARKETING AND SALES

GEELY SWEDEN AB | ANNUAL REPORT 2014 25ANNUAL REPORT 2014 | GEELY SWEDEN AB
1,927 XC90 sold online in 47 hours Volvo Cars is a firm believer in the opportunities offered by digital commerce and has taken its first steps in developing a digital com-merce operation with the all-new XC90 First Edition. The 1,927 First Edition cars were sold exclusively online. The initiative proved to be a huge success: within 47 hours, all cars were sold out. 600 of these cars were sold in the US which is a much digitalized mar-ket where costumers spend increasingly more time on on-line shopping.
Expanding digital commerceThe XC90 First Edition online success clearly demonstrates the power of digital commerce and how using these channels can revi-talise the Volvo brand. The development of the digital commerce sales channel is an important part of the strategic change themes as defined by Volvo Cars’ executive management team. Going for-ward, Volvo Cars aims to expand its digital commerce activities, in close cooperation and consultation with its dealer network around the globe. Volvo Cars will use the strength of the online channel and tools to enhance the online buying experience as well as the physical network and ownership experience. A new feature
launched as part of the US digital marketing campaign is the Volvo reality app where the costumer can get the all-new XC90 driving experience before the car is available at the retailers.
Best in class ownershipVolvo Cars Customer Service develops and delivers innovative world class Products, Services & Processes for the global Volvo Cars aftermarket business. Together with the Sales Regions, Sales Companies and dealers, the ambition of Customer Service is to make the Volvo car ownership experience best in class – and always with the customer at heart. By having customers build a special relationship with their dealer and Personal Service Techni-cian, Volvo Cars shows customers it is willing to go the extra mile to meet and satisfy the needs of its customers.
Volvo Car Financial Services is managing and developing the global customer finance and insurance offering. In most of the larger markets, Volvo Cars uses a branded financial and insurance offering through Volvo Cars partner banks and insurance compa-nies. An attractive leasing offer is essential for being a competitive player in several markets, for instance the US, where Volvo Cars has improved its offer as a part of the US revival plan (see next page).
MARKETING AND SALES
Alain Visser, Senior Vice President Sales, Marketing and Customer Service, comments on:
A new, different way of going to market“The car industry is one of the most conservative, least evolutionary marketing clusters in global business. For decades, car marketing has been following a certain pattern which is followed by the entire car industry. Now, Volvo Cars chooses to defy that logic and imple-ment a strategy that is geared towards its own needs. We don’t want to throw all existing marketing concepts overboard. Many of them exist for a good reason. But we do have the self-confidence to say that we are different. So our way to market needs to be different as well.”

26 GEELY SWEDEN AB | ANNUAL REPORT 2014
MARKETING AND SALES
Record sales in 20142014 was a record year for Volvo Cars in terms of sales: never before did the company sell as many cars as it did over the past year. The final sales total of 465,866 proves that Volvo Cars is firmly on course to reach its long-term sales target of 800,000 cars a year. In 2014, Volvo Cars broke the 20 year cycle during which it has consistently sold around 400,000 cars a year.
Volvo Cars’ sales success in 2014 was boosted by a number of factors, not in the least by the class-leading Drive-E engine family. The Drive-E engines make Volvo’s car models an attractive offer for many European fleet customers, as well as for frugal-minded customers in China and the United States who refuse to compro-mise on performance.
The XC60, in its sixth full year of sales, was once again the best-selling Volvo car model with sales of 136,993 units and once again set an annual sales record.
Strong performance in ChinaConsumer trends such as rising wealth and an increased use of credit and financing in the Chinese market favor premium car man-ufacturers. The premium segment outgrew the overall market in 2014, while Volvo Cars sales grew faster than the premium seg-ment and most competitors. Throughout the year, Volvo Cars upgraded its dealer network and continued to expand in lower-tier cities, bringing the number of Volvo Cars dealers in China close to 200.
Plan for revival in the United States Volvo Cars has devised a US revival plan in order to restore the brand to its former glory in what is still one of its most important markets. In 2004, Volvo Cars sold close to 140,000 cars in the United States, which demonstrates the potential for the Volvo brand in the market.
The US revival plan, builds on the following initiatives: driving brand awareness via a new marketing strategy; improving its prod-uct offer with cars like the all-new XC90, a further roll-out of the Drive-E engine family and new, attractive specifications; and enhancing its dealer network with attractive leasing offers, a focus on growing showroom traffic and an increased focus on the after-market business.
Swedish football star Zlatan Ibrahimović together with Håkan Samuelsson, President and CEO of Volvo Cars, and the all-new Volvo XC90 at the 2014 Paris Motor Show.
After a slight downturn in sales during 2012 and 2013, due to economic uncertainty in the Eurozone as well as in the US, Volvo Cars managed to break the old sales record of 458,323 cars in 2007.
RETAIL SALES ALL TIME HIGH
Units
400,000
500,000
300,000
200,000
100,000
012 13 1411

GEELY SWEDEN AB | ANNUAL REPORT 2014 27ANNUAL REPORT 2014 | GEELY SWEDEN AB
CHINA SWEDEN US EUROPE OTHER MARKETS
Volvo Cars’ largest market, showed remarkable growth throughout 2014. Volvo Cars managed to take market share from most competitors.
Volvo Cars home market and Volvo Cars is the leading brand with sales of 61,357. This reflects a growth of 17.4 per cent compared to 2013.
Despite a positive car indus-try development in the US Volvo Cars faced a challeng-ing year and sales decreased to 56,371 units.
Volvo Cars was the fastest growing brand among the main premium players in 2014, thereby taking market share from its competitors. Strong growth in key markets such as the UK and Germany further improved Volvo Cars’ position in Europe.
Volvo Cars’ sales performance on other markets was mixed. In Russia, Volvo Cars managed to keep its sales in line with 2013, while economic sanctions and geopolitical tensions caused severe pressure on the domestic car market. Sales in Japan fell considerably, in line with the market, as the Japanese car market suffered from among other things unfavorable tax policies.
SHARE OF VOLVO CARS RETAIL SALES 2014 − CHINA
17%
SHARE OF VOLVO CARS RETAIL SALES 2014 − SWEDEN
13%
SHARE OF VOLVO CARS RETAIL SALES 2014 − US
12%
SHARE OF VOLVO CARS RETAIL SALES 2014 − WESTERN EUROPE
39%
SHARE OF VOLVO CARS RETAIL SALES 2014 − OTHER MARKETS
18%
0,0
0,1
0,2
0,3
0,4
0,5
14131211
%
MARKET SHARE DEVELOPMENT− CHINA
0
5
10
15
20
25
14131211
%
MARKET SHARE DEVELOPMENT− SWEDEN
0,00,10,20,30,40,5
0,6
14131211
%
MARKET SHARE DEVELOPMENT− US
0,0
0,5
1,0
1,5
2,0
14131211
%
MARKET SHARE DEVELOPMENT− WESTERN EUROPE
0,0
0,1
0,2
0,3
0,4
0,5
14131211
%
MARKET SHARE DEVELOPMENT− OTHER MARKETS
0
20
40
60
80
100
14131211
Thousand units
SALES DEVELOPMENT− CHINA
01020304050607080
14131211
Thousand units
SALES DEVELOPMENT− SWEDEN
01020304050607080
14131211
Thousand units
SALES DEVELOPMENT− US
0
50
100
150
200
14131211
Thousand units
SALES DEVELOPMENT− WESTERN EUROPE
0
20
40
60
80
100
14131211
Thousand units
SALES DEVELOPMENT− OTHER MARKETS
BEST-SELLING MODEL(S):
Volvo Cars’ most popular model in China was the XC60, closely followed by the S60L long-wheelbase sedan.
BEST-SELLING MODEL(S):
The 70-series are the best-selling models in Sweden a result of the activity based Swedish lifestyle and the very successful campaign with Zlatan Ibrahimovic.
BEST-SELLING MODEL(S):
The 60-series were the most popular cars in the market.
BEST-SELLING MODEL(S):
The V40/V40 Cross Country was the best-selling model in Europe.
BEST-SELLING MODEL(S):
The XC60 followed by the V40/V40 Cross Country and the S60 were the best-selling mod-els in other markets.
MARKETING AND SALES
VOLVO CARS MARKE TS IN NUMBERS

28 GEELY SWEDEN AB | ANNUAL REPORT 2014
LORUM IPSUM

GEELY SWEDEN AB | ANNUAL REPORT 2014 29ANNUAL REPORT 2014 | GEELY SWEDEN AB
PEOPLE
Volvo Cars build a global organisation based on a balance between performance and health. Health is defined as the ability to align, execute and renew itself faster than its com-petition. The balance between performance and health will improve results, credibility and Volvo Cars’ attractiveness as an employer. The culture is the true enabler to reach these objectives, it is expressed by three cultural values that all employees live by: Passion For Customers & Cars; Move Fast, Aim High and Real Challenge & Respect.
The Volvo Cars CulturePassion For Customers & CarsIn order for the people employed by Volvo Cars to really understand the products, regardless of their position within Volvo Cars, Volvo Cars has established a company car fleet policy which enables all employees to drive a new Volvo car. In addition, there are numerous internal initiatives to increase the product knowledge and common awareness about Volvo Cars activities. For example: Volvo Cars regularly invites employees to presentations and exhibitions held by experts and leaders within each area.
Move Fast – Aim HighBy moving fast and aiming high Volvo Cars wants its employ-ees to see and seize opportunities. Volvo Cars is a relatively small company by automotive industry standards and the
organisation is fairly flat. This means that the organisation can be flexible and adapt quickly to changes in the industry and the economic environment. This is an advantage when setting ambitious new objectives such as the target of selling 800,000 cars annually.
Real Challenge & RespectIn Volvo Cars, we develop leaders for a global market who are courageous, accountable and empowering.
All leaders in Volvo Cars should apply and role-model the six leadership behaviours linked to our Volvo Cars culture:Create Meaning; Customer Focus; Show Courage; Make Things Happen & Innovate; Believe in People and Challenge & Support.
Employer of choiceDuring 2014 Volvo Cars made a good progress towards the goal of becoming the employer of choice. Since 2012 Volvo Cars has been listed on the Universum list of the world’s most attractive employers, in which almost 200,000 students around the globe are asked about their ideal employers. In 2014, Volvo Cars was ranked 40th on the list of most attrac-tive companies among engineering students in the world’s 12 largest economies, up from 49th spot in 2013. Among Chi-nese respondents, Volvo Cars rose significantly from 62nd place in 2013 to 33rd in 2014.
Volvo Cars has a clear vision: to be the world’s most progressive and desired premium car brand. To reach this vision – it needs talented people. That is why Volvo Cars has made it a strategic objective to become the employer of choice that manages to attract the best people available.
ATTRACTING THE BESTTO CREATE PREMIUM
Men, 75,5%
Women, 24,5%
PROPORTION OF WOMENIN LEADING POSITIONS
AVERAGE NUMBER OF EMPLOYEES BY REGION
Other countries, 0.4%
Asia other than China, 2.6%
China, 3.7%
North and South America, 1.7%
Europe other than the Nordic countries and Belgium, 4.4%
Belgium, 19.4%
Nordic countries other than Sweden, 1.4%
Sweden, 66.4%
GENDER DISTRIBUTION ALL EMPLOYEES
Men, 72%
Women, 28%

30 GEELY SWEDEN AB | ANNUAL REPORT 2014
PEOPLE
Diversity Plan showing positive effectsVolvo Cars’ Diversity Plan includes a series of activities to improve diversity and to utilise diversity within the company. The focus areas in the diversity plan include developing the company’s policy on zero tolerance harassment and discrimination as well as a gen-der diversity plan. As part of the gender diversity plan the propor-tion of women in leadership positions (managers with direct reporting responsibilities, programme managers, project leaders and specialists in leading positions) increased from 22.9 per cent in 2013 to 24.5 per cent in 2014.
Healthy and Safe working environment Volvo Cars’ ambition is to create a suitable, structured working environment together with its employees. Employees participate in work environment matters by reporting risks, illness, health-related matters, accidents and potential accidents. This leads to remedial actions and provides feedback on health and safety measures.
Corporate health and safety includes a professional resource within the company to secure requirements for legal compliance and the company ambition of being the employer of choice.
We are people that create cars for people. Our success lies in being truly passionate for our customers and cars, while moving fast and aiming higher than before. We dare to challenge and accept challenges yet never compro-mise the respect we have for one another.
Compliance and Ethics high on the agendaVolvo Cars strives to combine business advantages with social, ethical and environmental responsibility. This commitment to responsible business is described in the Volvo Car Group Code of Conduct. The Code of Conduct rests on international conventions for human rights and labour rights and is aimed at all employees. All suppliers that the company does business with, all dealers that sell the products of Volvo Cars and all other representatives that conduct business on behalf of the company are also expected to adhere to the Code of Conduct. Volvo Cars’ Compliance and Ethics programme include training, education and communication of the Code of Conduct.
PASSION FORCUSTOMERS AND CARS
MOVE FAST,AIM HIGH
REAL CHALLENGEAND RESPECT
VOLVO CARS CULTURE

GEELY SWEDEN AB | ANNUAL REPORT 2014 31ANNUAL REPORT 2014 | GEELY SWEDEN AB
PEOPLE
Three employees and their engagement in Volvo Cars
Designed around you@work Designed around you@work (DAY@work) is a global change pro-gramme, introduced to create an attractive and efficient workplace designed around employees and their activities.
The activity-based workplace of the future is a place that pro-motes cross-functional cooperation and learning from each other, showing Volvo Cars as an attractive employer that supports people to work in a modern and flexible way. It encourages creativity, flex-ibility and accountability for our employees.
What this means in practical terms is that the employees are free to choose where to perform their activities as the workplace is designed to fit all purposes. “Stand up and live longer” Maria Forssell, Programme Manager DAY@work, comments from Rockleigh, US, where the next roll out has just started.
“Research states that you lose 10 years of your life by sitting at your desk all day long. Both our body and mind need variation in order to be healthy and creative. The workplace is a tool for change and development and DAY@work is a visible driver to fulfil the strategy of Volvo Cars to be an employer of choice and an employer that cares about its people and their well-being.”
“A high tech company”In order to maintain the top position within technology and safety Volvo Cars has several collaborations with universities. In Gothen-burg the Senior Technical Leader for Safety and Driver Support Technologies, Erik Coelingh, is also Adjunct Professor at Chalmers University of Technology where he leads a project within autono-mous driving, financed by Volvo Cars and Vinnova. “Volvo Cars is no longer only an industrial company, it is a High Tech company and the competition for competence is stronger. We compete with companies within computer science, IT, telecom and artificial intelligence, but that is also what makes it so inspir-ing” says Erik Coelingh.
Volvo cars culture in everyday actionVolvo Cars has developed a leadership program for leaders within Purchasing and Manufacturing, Aspired Lean Leadership (ALL). In brief, the idea with Aspired Lean Leadership is to transform the values in the Volvo Cars Culture into desired leadership behav-iours. The program involves individual coaching in direct relation to daily operations. The aim is to translate the desired culture into behaviours that people can relate to and to link this to tangible business results.
“Around 600 leaders at all levels within Purchasing and Manu-facturing will follow this program. Ultimately it will lead to the same understanding of leadership from top to bottom and vice versa”, says Derek Jessiman, Lead Coach Lean Leadership.
Maria Forsell Programme Manager
Erik Coelingh Senior Technical Leader
Derek Jessiman Lead Coach Lean Leadership

32 GEELY SWEDEN AB | ANNUAL REPORT 2014

GEELY SWEDEN AB | ANNUAL REPORT 2014 33ANNUAL REPORT 2014 | GEELY SWEDEN AB
FOCUS ON CHINA
“The all-new XC90 offers the most comprehensive and technologically sophisticated standard safety
package available in the automotive industry. It does not only protect the people in the car, but actively
protects and reduces the damage for other vehicles, pedestrians and cyclists.”
34 GEELY SWEDEN AB | ANNUAL REPORT 2014

GEELY SWEDEN AB | ANNUAL REPORT 2014 35ANNUAL REPORT 2014 | GEELY SWEDEN AB
BOARD OF DIRECTORS REPORT
The Volvo Car GroupGeely Sweden AB, with its registered office in Stockholm, is a subsidiary of Geely Sweden Automotive AB, a subsidiary of Geely Sweden Holdings AB, owned by Shanghai Geely Zhaoyuan International Investment Co., Ltd., registered in Shanghai, China, with ultimate majority ownership held by Zhejiang Geely Holding Group Ltd., registered in Hangzhou, China.
Volvo Car Group consists of Geely Sweden AB and Volvo Personvagnar AB, hereinafter referred to as “Volvo Car Corporation”, together with Volvo Car Corporation’s subsidiar-ies, joint ventures and associated companies.
For definitions of subsidiaries, joint ventures, associated companies and related companies, see the Accounting prin-ciples, section Basis of consolidation, page 47.
In its capacity as a holding company, Geely Sweden AB does not conduct any direct business, other than holding shares in its subsidiary, Volvo Car Corporation. Geely Sweden AB indirectly, through Volvo Car Corporation and its subsidi-aries, joint ventures, associated and related companies, here-inafter referred to as ”Volvo Cars”, operate in the automotive industry with business relating to the design, development, manufacturing, marketing and sales of cars. As the opera-tional business is conducted in Volvo Cars, the annual report will refer to Volvo Cars when describing the business opera-tion, and specifically refer to Volvo Car Group where relevant.
Key ratios, MSEKFull year
2014Full year
2013Full year
2012Full year
2011
Net revenue 129,959 122,245 124,547 125,678
Operating income, EBIT 2,252 1,919 66 2,017
Net Income 834 960 –542 1,024
EBITDA 9,183 9,057 8,082 10,130
Operating & investing cash flow –4,131 109 –4,929 2,502
EBIT margin, % 1.7 1.6 0.10 1.6
EBITDA margin, % 7.1 7.4 6.5 8.1
Equity ratio, % 29.9 28.1 28.5 28.1
Net debt 928 2,607 2,240 9,120
Car industry developmentChina During 2014, the Chinese vehicle market grew by 12.7 per cent to 19.3 million units, a decline in growth compared to previous years. The combination of an overall economic slow-down and a difficult property market created a situation where China’s automotive market growth slowed down. There is still a large increase in sales of SUVs while the C sedan segment remains the largest by volume. Despite the slow-down in growth momentum, foreign premium car makers con-tinued to record all-time-high sales figures during 2014.
USDespite a slow start in 2014, light vehicle demand in the United States was up 6.0 per cent to around 16.3 million units and the auto sector remained a positive contributor to the overall US economic recovery. This is the best performance since 2006 and the fifth yearly increase in a row. Loosening credit conditions, low interest rates, improving employment and housing market, along with old vehicles needing to be replaced, all helped support growth throughout the year.
The Annual Report of Geely Sweden AB, corporate identity number 556798-9966, contains the consolidated financial statements for the financial year January 1, to December 31, 2014.
BOARD OF DIRECTORS REPORT
ZHEJIANG GEELYHOLDING GROUP CO., LTD.
SHANGHAI GEELY ZHAOYUAN INTERNATIONAL INVESTMENT CO., LTD.
GEELY SWEDEN HOLDINGS AB
GEELY SWEDEN AUTOMOTIVE AB
VOLVO CAR CORPORATION
ALL SALES COMPANIES, OTHER SUBSIDIARIES, JOINT VENTURES
AND ASSOCIATED COMPANIES
Related companies
GEELY SWEDEN AB
Volvo Car Group(Consolidation level of all financial communication)
Volvo CarsThe Operations
CORPOR ATE STRUCTURE

36 GEELY SWEDEN AB | ANNUAL REPORT 2014
BOARD OF DIRECTORS REPORT
Western EuropeWestern European passenger car registrations increased by 4.5 per cent to around 11.8 million units during 2014. The majority of key regional markets recorded gains during the year, spurred on by improvements in the economic environment. However, demand in some markets remains well behind past figures. Heightened geopolitical tensions weighed down on confidence across the Eurozone, reinforcing still challenging conditions in many coun-tries. For the EU, passenger car demand increased by 5.7 percent in 2014, which was the first positive development in six years. Other marketsThe development on other markets was scattered. Two important markets for Volvo Cars was facing a downturn: The Russian car market was hit in 2014 due to the rouble falling in value against the US dollar, declining oil prices and sanctions from the EU and US. The Japanese car market fell considerably, suffering from unfa-vourable tax policies among other things.
Volvo Cars sales developmentVolvo Cars achieved record sales in 2014. Retail sales increased by 8.9 per cent in 2014 compared to 2013 to 465,866 (427,840) units sold. The new sales record was mainly driven by significant growth in China and growth in the European markets, especially Sweden, the UK and Germany.
The XC60 was the best-selling model with 136,993 (114,010) units sold during 2014, an increase with 20.2 per cent. The biggest market for the Volvo XC60 was China followed by the US and Sweden. The second best-selling car line was the V40/V40 Cross Country models with sales of 110,864 (99,911) units followed by the S60/S60L with 67,623 (61,646) units.
Industry development1), total passenger vehicles registered, ‘000 2014 2013 Change %
China 19,319 17,137 12.7
Sweden 306 270 13.3
US 16,302 15,382 6.0
Western Europe2) 11,756 11,250 4.5
Other Markets 17,631 18,012 –2.1
Retail Sales, number of cars sold FY 2014 FY 2013 Change %
China 81,221 61,146 32.8
Sweden 61,357 52,260 17.4
US 56,371 61,233 –7.9
Western Europe2) 182,157 166,307 9.5
Other Markets 84,760 86,894 –2.5
Market share1), % FY 2014 FY 2013Change,
%–points
China 0.45 0.36 0.09
Sweden 20.2 20.0 0.02
US 0.34 0.40 –0.06
Western Europe2) 1.53 1.49 0.04
Other markets 0.35 0.36 –0.01
1) Source POLK; Preliminary data for most markets2) Excluding Sweden
Retail sales by model 2014 2013
S60 44,255 61,579
S60L 23,368 67
S80 7,668 7,951
S80L 4,821 3,531
V40 84,771 78,307
V40CC 26,093 21,604
V60 61,977 54,666
V70 27,795 26,133
XC60 136,993 114,010
XC70 29,092 24,418
XC90 17,869 23,784
Other models 1,164 11,790
Total 465,866 427,840
Top 10 Retail sales by market 2014 2013
China 81,221 61,146
Sweden 61,357 52,260
US 56,371 61,233
UK 41,022 32,678
Germany 31,575 26,680
Netherlands 21,660 23,006
Belgium 16,846 16,670
Russia 15,421 15,017
Italy 14,524 13,708
Japan 13,264 16,897
ChinaVolvo Cars continued to grow faster than the overall car market in China in 2014. Total retail sales grew by 32.8 per cent in 2014 to 81,221 (61,146) units, exceeding the target of selling at least 80,000 units in the market 2014. The growth established China as the largest market for Volvo Cars worldwide. The establishment of three new manufacturing plants, a growing dealership network and continuous expansion of the product offer are the underlying factors for the continued momentum for Volvo Cars in the Chinese market. The best-selling model was the Volvo XC60 followed by the S60L and the V40.
SwedenVolvo Cars’ sales increased with 17.4 per cent to 61,357 (52,260) units in Sweden. Strong demand for Volvo Cars’ V and XC carlines continued to support a positive sales performance in the Volvo Cars’ home market. The XC carlines increased with 42.1 per cent to 22,879 (16,105) units, supported by the Made by Sweden mar-keting campaign.
USThe US market was Volvo Cars’ third largest market during 2014, with total sales of 56,371 (61,233) units. During 2014, Volvo Cars launched a revival plan for the US market to strengthen its pres-ence and regain market share. A new leadership team was put in place as well as a new marketing strategy which will increase brand awareness and tailor Volvo Cars’ product offer to the individ-ual needs across the country. The Volvo S60 and XC60 models were the best-selling models during the year.

GEELY SWEDEN AB | ANNUAL REPORT 2014 37ANNUAL REPORT 2014 | GEELY SWEDEN AB
BOARD OF DIRECTORS REPORT
Western EuropeVolvo Cars continued its strong performance in Western Europe, where sales increased by 9.5 per cent to 182,157 (166,307) units. Several key markets, including the UK and Germany, showed solid growth. The Volvo V40/V40 Cross Country remained the best- selling model in Europe. Independent figures compiled by the European Automobile Manufacturers Association (ACEA) showed that Volvo Cars was the fastest growing top-5 premium brand in the wider European region (EU28+EFTA) in 2014.
Other marketsSales in other markets decreased by 2.5 per cent to 84,760 (86,894) units largely due to a decrease in sales in Japan. In Russia, Volvo Cars managed to keep its sales in line with 2013.
Significant eventsAcquisitions and divestmentsNew joint venture was established in China In January 2014, the joint venture company Shanghai Volvo Car Research and Development Co., Ltd was established in China. The purpose of the new joint venture is to engage in services support-ing the production and sales of Volvo cars in China.
Acquisition of the assembly business in Johnson ControlsIn July 2014, Volvo Car Group acquired the assembly business for headliner and tunnel consoles from Johnson Controls Inc. The acquisition was performed in order to strengthen the value chain and provide efficiency benefits in the Torslanda and Ghent plants respectively. The paid consideration amounted to MSEK 50 and the acquired net assets amounted to MSEK 27, resulting in a goodwill of MSEK 23.
FlobyDuring 2014, Volvo Cars investigated the interest from external parties to acquire the business performed in the Floby manufac-turing plant. A decision to dispose the business has not been taken.
Investments in manufacturingNew plant opened in Gothenburg, SwedenIn April 2014, Volvo Cars opened a new manufacturing facility in Gothenburg, Sweden. The investment increased the manufacturing capacity from 200,000 cars per year to approximately 300,000 cars a year. The new plant moved Volvo Cars a significant step closer to achieving the long term objective of selling 800,000 cars a year.
CooperationsPartnership with Venko Motors do Brasil establishedIn September 2014, Volvo Car Group established a partnership with Venko Motors do Brasil. The partnership increases the number of potential vehicles sold into the Brazilian market with an additional 4,000 units. Collaboration with Geely regarding common developmentIn December 2014, Volvo Car Group entered into an agreement with Ningbo Geely Automotive Research & Development Co., Ltd regarding certain common development activities, for instance a common C-segment vehicle architecture called CMA.
Other significant events during the year The Chinese president and the King and Queen of Belgium visited the Ghent plantIn April 2014, during the Chinese state visit in Belgium, the Chinese president Xi Jinping and Mme Peng Liyuan together with King Philippe and Queen Mathilde of Belgium visited the Volvo Cars’ production plant in Ghent.
An extension of the credit facility was signedIn June 2014, Volvo Car Corporation signed an agreement with twelve international banks to extend the existing credit facility of MEUR 360 to MEUR 660. The revolving credit facility has a tenor of three years with the option to extend to five years. The purpose of the credit facility is to serve as a back-up and the facility has not yet been utilised.
Production of the first-generation XC90 “Volvo Classic” ended at the Torslanda plant in Gothenburg, SwedenIn July 2014, the production of the first-generation Volvo XC90 ended at the Torslanda plant after more than 636,000 cars of the model were produced over the last twelve years. The XC90 will con-tinue to be produced in China under the name Volvo XC Classic. Production of the all-new Volvo XC90 started at the Torslanda plant in January 2015.
All-new XC90 pre-launchIn August 2014, Volvo Cars pre-launched the all new XC90 in Stockholm. The limited series of 1,927 First Edition XC90’s was sold exclusively online at www.volvocars.com within 47 hours.
Third shift in the Torslanda plant creates 1,300 new jobsIn October 2014, Volvo Cars announced the strategic decision to add a third shift in the Torslanda plant, in order to meet the increas-ing customer demand for the company’s cars. The third shift will lead to up to 1,300 new employments.

38 GEELY SWEDEN AB | ANNUAL REPORT 2014
BOARD OF DIRECTORS REPORT
Significant events after the reporting periodMaastricht operations moved to GhentIn January 2015, the logistic centre in Maastricht, the Netherlands, was moved to the Ghent plant in Belgium following the strategic decision to change the set-up of the Maastricht operations that was taken in July 2014. All employees were offered the opportu-nity to join Volvo Cars’ operations in Ghent. At the same time the customer service operation in Maastricht was outsourced, with all employees offered the option to remain in the company.
Acquisition of assets in DSVIn January 2015, Volvo Car Group acquired assets in DSV in Ghent, to a value of MSEK 38, to further strengthen the value chain and provide efficiency benefits. DSV has been providing logistic services to Volvo Cars in Ghent and the services provided consisted of storing and sequencing 200,000 parts per day and delivering the same amount of parts to the Ghent plant.
Research and developmentVolvo Car Group continues to invest steadily in research and devel-opment in order to strengthen the product portfolio to meet cus-tomer demand and stricter legislation.
The technical centre for research and development is located in Gothenburg, where about 5,000 people work, most of them quali-fied engineers.
Thanks to world-leading R&D capabilities when it comes to safety, a number of new products were launched together with the all new XC90 during 2014. Both run-off road protection and auto brake at intersections are safety technologies that have been developed to prevent or decrease the impact of two very common accident types.
EnvironmentVolvo Cars has a longstanding commitment in being a responsible corporation with a clear focus on sustainable development throug-hout the entire value chain. Volvo Cars publishes annual sustaina-bility reports in line with the international reporting guidelines of the Global Reporting Initiative (GRI). The sustainability reports are available at www.volvocars.com. All businesses have permits covering their operations and the environmental impact of noise, emissions to air and water, waste produced and the consumption of energy and chemicals. Declara-tion is made continuously to both local and national environmental authorities. All manufacturing operations in which Volvo cars are built have to comply with the Volvo Cars Global Environmental Standard (VCGES). The VCGES sets standards in a whole range of areas, varying from waste water treatment over emissions from the paint operations, to energy consumption and energy efficiency. VCGES is very strict and puts high demands on Volvo manufacturing sites. Therefore the plants must perform better than what is legally required.
EmployeesIn 2014, Volvo Car Group employed on average 24,124 (23,242) full time employees. This is an increase of 3.8 per cent compared to last year. The number of agency contracts increased by 16.6 per cent average full time equivalents to 2,363 (2,026), due to higher production volumes and the continuing development of future models.
Enterprise risk management Risks are a natural element in all business activities. In order to achieve Volvo Cars’ short and long term objectives, enterprise risk management is part of the daily activities at Volvo Cars.
ProcessVolvo Cars enterprise risk process is based on the ISO 31000 definition of risk and is used in the enterprise risk management efforts. There is a framework for how to identify risks, and how to describe the risks, and when a function’s identified risk becomes an enterprise risk. There are risk managers appointed within each function of the company, working with their function’s manage-ment team to identify risks. The risk managers report their f unction’s risks to the enterprise risk manager. The enterprise risk report consists of two parts, short term risks and long term risks1), including mitigating actions. The enterprise risk report is reviewed by the executive management team and the current status is reported at each Board of Directors meeting and Audit Committee meeting.
RisksActing in a global business environment, risks are identified in different areas based on Volvo Cars’ strategies, past and existing. Volvo Cars has growth plans for the next coming years, why it is important to secure competence within key areas and financial resources and financial flexibility to address risks implied in the growth plan.
Highlights of the key risks include the future product strategy and product plan. Risks identified are both operational and pro-cess related and will be mitigated through innovation, industry lead with new technologies and process improvements.
The Chinese market is Volvo Cars’ largest market and Volvo Cars’ industrial footprint is expanding. The Chinese market, with the high pace of change and the fact that Volvo Cars volume is growing considerably is considered an opportunity but also a risk.
Information technology is an area that has rapidly become more diverse through the development of connected cars. Risks are identified both with Volvo Cars internal infrastructure and its prod-ucts. Mitigating actions are progressively being executed.
Volvo Cars income, financial position and cash flow is sensitive to the fluctuations in the currency market. This currency risk is being mitigated by an active hedging strategy. The long term expo-sure is depending on Volvo Cars’ global sales, the existing mix of
Short term risk: A risk that may affect the business in the next twelve months. Long term risk: A risk that may affect the business in one to five years.

GEELY SWEDEN AB | ANNUAL REPORT 2014 39ANNUAL REPORT 2014 | GEELY SWEDEN AB
BOARD OF DIRECTORS REPORT
production facilities and supplier structure; this creates an expo-sure in cost base which is different from income currencies, inter-est rates and commodity prices. Financing of Volvo Cars is man-aged in accordance with the Group Treasury Policy. Further information on financial risk management is available in Note 21 – Financial risks and financial instruments.
GovernanceVolvo Cars promotes the value of sound corporate governance, characterised by high standards when it comes to transparency, reliability and ethical values.
Volvo Cars is managed by the Executive Management Team, (EMT) with eleven members, led by the CEO and overseen by the Board of Directors of Volvo Car Corporation.
The Regulations for the work of the Board of Directors of Volvo Car Corporation sets out the principles as regards the size, com-position and independency of the Board of Directors. These principles include that a majority of the board members are inde-pendent from Volvo Cars and that at least two board members shall also be independent from the shareholder. They also stipulate that there is a minimum of three and a maximum of twelve mem-bers of the Board of Directors (excluding the Union members) and that a maximum of two deputy members could be elected and the number of union representatives as the law requires.
In order to ensure that the principles are followed, the share-holder has elected a Nomination Committee which shall nominate any member to the Volvo Cars Board of Directors in accordance with these principles. The Nomination Committee shall ensure that the Board of Directors has a broad competence base matching the scale and complexity of the Volvo Cars business, and follow any other legal requirements. The Nomination Committee evalu-ates the performance of the members of the Board once a year. In addition, the board members will conduct a yearly survey regarding the board work. Based on the result of the survey the Board of Directors will evaluate the performance and identify possible areas of improvements.
In accordance with the Regulations, the board members shall immediately disclose to the chairman and/or vice chairman if they find themselves to have a conflict of interest.
The Board of Directors of Volvo Car Corporation consisted of ten members during 2014 and as from January 1, 2015 of eleven members. In addition to the ten members elected at the share-holders meeting, the employees have appointed three board members and two deputy board members. The Directors of the Board are proposed by the shareholders nomination committee, including a proposed remuneration to the Directors. At the annual shareholders meeting, the Board of Directors and the external auditors, are elected or re-elected on an annual basis. No board member, except for the CEO, is included in the management of Volvo Cars.
The Board of Directors of Volvo Car Corporation has assigned an Audit Committee to oversee the corporate governance, finan-cial reporting, risks and the compliance with external and internal regulations. The Board of Directors has also assigned a Compen-sation Committee to determine the remunerations to the CEO and the EMT members. In 2014, the Board of Directors of Volvo Car Corporation held six ordinary meetings.
Internal control The Volvo Car Corporation Board of Directors has the overall responsibility to ensure that an effective internal control system exists within the Group. Internal control over external financial reporting is a part of the total internal control process within Volvo Cars and provides reasonable assurance for accurate and reliable financial reporting in accordance with International Financial Reporting Standards (IFRS) and applicable laws and regulations.
Volvo Cars builds its internal control on the framework for inter-nal control issued by the Committee of Sponsoring Organisations of the Treadway Commission (COSO) and its five components; Control Environment, Risk Assessment, Control Activities, Infor-mation & Communication and Monitoring activities.
Further, Volvo Cars has an independent Internal Audit depart-ment with the assignment to determine whether Volvo Cars gov-ernance, internal control and risk management processes, as designed, operated and represented by management, are ade-quate and effective. The scope for the internal audit is determined by the risks Volvo Cars is facing and the requirements of the Board. The head of the Internal Audit function reports to the Audit Committee.
Control EnvironmentThe foundation of Volvo Cars control environment is the Code of Conduct which is the guiding principle of Volvo Cars and the Group’s corporate directives and guidelines. It describes what it means to be an employee at Volvo Cars; how to act towards other businesses and other colleagues.
In the area of Financial reporting the Volvo Cars Finance Manual provides accounting principles, terminology and methods to be applied by each reporting entity. The Delegation of Authorities provides the framework for the authority levels for operative business decisions, such as investments and expenses.
Risk AssessmentThe operating functions are responsible for risk management within their areas of responsibility. Enterprise risk management (ERM), which is described at page 39, also includes financial risks. Yearly, the internal control function performs a risk assessment to determine the financial processes materiality - its key controls, which reporting units, applications and infrastructures that should be in scope for the internal control activities the coming year.

40 GEELY SWEDEN AB | ANNUAL REPORT 2014
BOARD OF DIRECTORS REPORT
Control ActivitiesControl activities are actions established through policies and pro-cedures and are performed at all levels of the entity. The control activities are carried out in order to manage risk and to detect and correct errors in the financial processes. All finance employees should adhere to the Volvo Cars Finance Manual. Control activities range from regular analysis of the financial results of each entity as well as the consolidated figures at Group level to financial con-trols in the business processes and its applications.
Information and CommunicationPolicies, procedures, financial information, reporting instructions and the internal control program relating to financial reporting are updated and communicated on a regular basis to affected employ-ees through formal and informal channels.
Financial information is communicated to external parties in the half year Interim Reports and in the Annual Report for the full year. A press conference is held the same day as the financial informa-tion is published through a press release and on the Volvo Cars website, www.volvocars.com.
Monitoring Monitoring includes the follow up of monthly financial reports, results from self-assessments and results from internal and exter-nal audits.
Each entity and function is responsible for continuously follow-ing up the financial information within their area of responsibility. Group functions are monitoring from a group level perspective. The internal control function coordinates evaluation activities in the Internal Control Program through self-assessments. The inter-nal audit works independently and monitors the adherence of financial reporting and internal control. Finally, the external audi-tors perform an examination of the Annual Reports.
Corporate ComplianceVolvo Cars has a Compliance and Ethics Office that supports the business operations in conducting business in a responsible and ethical manner, in line with the Group’s Code of Conduct and Corporate Policies. The Chief Compliance and Ethics Officer reports to the Audit Committee.

GEELY SWEDEN AB | ANNUAL REPORT 2014 41ANNUAL REPORT 2014 | GEELY SWEDEN AB
BOARD OF DIRECTORS REPORT

Consolidated financial statements
Consolidated income statements ...............................................................................43
Consolidated comprehensive income .....................................................................43
Consolidated balance sheets .........................................................................................44
Changes in consolidated equity ...................................................................................45
Consolidated statement of cash flows ...................................................................46
Notes to the consolidated financial statements
Note 1 – Accounting principles ....................................................................................47
Note 2 – Critical accounting estimates and judgements ......................53
Note 3 – Net revenue ............................................................................................................55
Note 4 – Expenses by nature .........................................................................................55
Note 5 – Related parties ....................................................................................................55
Note 6 – Audit fees .................................................................................................................56
Note 7 – Other operating income and expenses ..........................................56
Note 8 – Leasing .......................................................................................................................56
Note 9 – Employees and remuneration .................................................................57
Note 10 – Depreciation and amortisation ...........................................................58
Note 11 – Government grants .......................................................................................58
Note 12 – Financial income .............................................................................................58
Note 13 – Financial expenses .......................................................................................58
Note 14 – Investments in joint ventures and associates ........................58
Note 15 – Taxes .........................................................................................................................61
Note 16 – Intangible assets ............................................................................................62
Note 17 – Tangible assets ................................................................................................63
Note 18 – Other non-current assets .......................................................................63
Note 19 – Inventories ............................................................................................................63
Note 20 – Accounts receivable and other current assets ....................64
Note 21 – Financial risks and financial instruments ..................................64
Note 22 – Marketable securities and cash and cash equivalents ...71
Note 23 – Equity .......................................................................................................................71
Note 24 – Post employment benefits .....................................................................71
Note 25 – Current and other non-current provisions ................................74
Note 26 – Other non-current liabilities ..................................................................75
Note 27 – Other current liabilities ..............................................................................75
Note 28 – Pledged assets ................................................................................................75
Note 29 – Contingent liabilities ...................................................................................75
Note 30 – Cash flow statements ................................................................................75
Parent company financial statements
Income statements and comprehensive income – Parent company .....................................................................................................................76
Balance sheets – Parent company ...........................................................................77
Changes in equity – Parent company .....................................................................78
Statement of cash flows – Parent company ......................................................78
Notes to the parent company financial statements
Note 1 – Accounting principles ....................................................................................79
Note 2 – Related parties ....................................................................................................79
Note 3 – Audit fees .................................................................................................................80
Note 4 – Remuneration to the Board of Directors ......................................80
Note 5 – Financial income and expenses ...........................................................80
Note 6 – Taxes ............................................................................................................................80
Note 7 – Participation in subsidiary .........................................................................80
Note 8 – Pledged assets ...................................................................................................81
Note 9 – Cash flow statement .......................................................................................81
Proposed distribution of net income ....................................................................82
Auditor’s report .............................................................................................................................83
Board of directors ......................................................................................................................84
Executive management team .......................................................................................86
Definitions ..........................................................................................................................................88
Contents Financial Report

MSEK Note 2014 2013
Net revenue 3 129,959 122,245
Cost of sales 4 –107,955 –101,934
Gross income 22,004 20,311
Research and development expenses 4, 16 –6,613 –5,864
Selling expenses 4 –8,073 –7,919
Administrative expenses 4, 6 –5,431 –5,129
Other operating income 7 1,953 1,509
Other operating expenses 7 –1,692 –1,168
Share of income in joint ventures and associates 14 104 179
Operating income 5, 8, 9, 10, 11 2,252 1,919
Financial income 12 325 87
Financial expenses 13 –1,087 –874
Income before tax 1,490 1,132
Income tax 15 –656 –172
Net income 834 960
Net income attributable toOwners of the parent company 834 960
834 960
CONSOLIDATED INCOME STATEMENTS
MSEK Note 2014 2013
Net income for the year 834 960
Other comprehensive income, net of income taxItems that will not be reclassified subsequently to income statement:Remeasurements of provisions for post-employment benefits –1,641 1,735
Items that may be reclassified subsequently to income statement:Translation difference on foreign operations 681 –160
Translation difference of hedge instruments of net investments in foreign operations –192 –100
Change in cash flow hedge 23 –893 9
Other comprehensive income, net of income tax –2,045 1,484Total comprehensive income for the year –1,211 2,444
Total comprehensive income attributable toOwners of the parent company –1,211 2,444
–1,211 2,444
CONSOLIDATED COMPREHENSIVE INCOME
Volvo Car Group generated net revenue of MSEK 129,959 (122,245), an increase of 6.3 per cent compared to 2013. The increase is primarily related to higher sales volumes and positive exchange rate develop-ments on sales. Sales of cars produced by related parties or joint ven-tures in China is not included in Volvo Car Group’s net revenue. The income is reflected in other operating income and share of income in joint ventures and associates. Gross income increased 8.3 per cent to MSEK 22,004 (20,311), a result of positive sales development and mate-rial cost efficiencies, but negatively affected by exchange rate effects on cost of goods sold. Operating income (EBIT) increased to MSEK 2,252 (1,919), resulting in an operating margin of 1.7 (1.6) per cent. The increase is a result of positive gross income, partly offset by slight increase of administrative and selling expenses. Selling expenses have increased due to various marketing efforts in the context of further strengthening the Volvo Cars brand. In relation to net revenue administrative and selling expenses are 4.2 (4.2) per cent and 6.2 (6.5) per cent respectively.
Research and development expenses recognised in the income statement increased by MSEK 749 to MSEK 6,613 (5,864), supporting
the product strategy of Volvo Cars. Capitalised development expenses increased to MSEK 4,748 (4,089), mainly due to continued investments in the SPA platform. Amortisation of capitalised development expenses were MSEK 1,374 (1,165), see table below.
Research and development spending, MSEK 2014 2013
Capitalised development costs 4,748 4,089
Research and development expenses –6,613 –5,864
whereof amortised development costs –1,374 –1,165
Other income and expenses has decreased with net MSEK 80 to MSEK 261 (341). The net change includes a negative exchange rate effect mainly from cash flow hedges, offset by a positive effect from licensor royalties and other income. The effect in other income is partly related to the collaboration with Geely regarding common development. For fur-ther infomation, see Note 5 – Related parties.
EBITDA was MSEK 9,183 (9,057) and the EBITDA margin was 7.1 (7.4) per cent. Net income was MSEK 834 (960).
43ANNUAL REPORT 2014 | GEELY SWEDEN AB
CONSOLIDATED FINANCIAL STATEMENTS

MSEK Note Dec 31, 2014 Dec 31, 2013
ASSETSNon-current assetsIntangible assets 16 20,098 17,271
Property, plant and equipment 8, 17 29,275 25,653
Assets held under operating leases 8, 17 1,942 1,890
Investments in joint ventures and associates 14 1,541 1,159
Other long-term securities holdings 13 10
Deferred tax assets 15 2,535 2,165
Other non-current assets 18 11,647 1,077
Total non-current assets 67,051 49,225
Current assetsInventories 19 14,368 14,416
Accounts receivable 5, 20 8,004 5,618
Current tax assets 355 97
Other current assets 20 4,484 2,781
Marketable securities 22 1,047 88
Cash and cash equivalents 22 14,165 15,372
Total current assets 42,423 38,372TOTAL ASSETS 109,474 87,597
EQUITY & LIABILITIESEquity 23
Equity attributable to owners of the parent company 32,702 24,638
Total equity 32,702 24,638
Non-current liabilitiesProvisions for post-employment benefits 24 6,377 3,641
Deferred tax liabilities 15 3,337 1,759
Other non-current provisions 25 5,592 5,463
Liabilities to credit institutions 26 15,208 12,033
Other non-current liabilities 26 1,600 1,212
Total non-current liabilities 32,114 24,108
Current liabilitiesCurrent provisions 25 9,319 8,169
Liabilities to credit institutions 932 820
Advance payments from customers 299 317
Trade payables 14,434 13,632
Current tax liabilities 598 658
Other current liabilities 27 19,076 15,255
Total current liabilities 44,658 38,851TOTAL EQUITY & LIABILITIES 109,474 87,597
CONSOLIDATED BALANCE SHEETS
The total assets of Volvo Car Group increased 25.0 per cent to MSEK 109,474 (87,597). The increase in total assets is mainly related to other non-current assets, property plant and equipment, intangible assets and accounts receivable.
Other non-current assets increased by MSEK 10,570 to MSEK 11,647 (1,077). The increase is related to group contributions from Geely Sweden Holdings AB to Volvo Car Corporation of MSEK 10,600 (of which MSEK 719 is included in other current assets) and Geely Sweden AB of MSEK 693. The increase is offset by a minor decrease in restricted cash.
Property, plant and equipment has increased by MSEK 3,622 to MSEK 29,275 (25,653) mainly due to special tool investments related to the upcoming launch of the all-new XC90 and the SPA platform. Accounts receivable increased by MSEK 2,386 to MSEK 8,004 (5,618) mainly due to sales growth. Intangible assets have increased by MSEK 2,827 to MSEK 20,098 (17,271) primarily as a result of the continued investments in the SPA platform.
Cash and cash equivalents and marketable securities decreased by MSEK 248 to MSEK 15,212 (15,460).
Assets held under operating leases are in line with previous year. During the year the group has reclassified lease agreements with maturity less than one year, from assets held under operating leases, to inventory. The reclassification has affected assets held under oper-ating leases with MSEK –2,738 (–2,255) and inventories with MSEK 2,738 (2,255).
Equity and liabilities increased mainly due to changes in equity, other current liabilities, non-current liabilities to credit institutions and provisions for post-employment benefits.
Total equity increased by MSEK 8,064 to MSEK 32,702 (24,638) and the equity ratio increased to 29.9 (28.1) per cent, partly due to the net effect of the received group contributions with MSEK 8,808. The increase is offset by negative effects included in other comprehensive income, related to revaluation of provision for post-employment bene-fits of MSEK 1,641 and changes in the cash flow hedge reserve of MSEK 1,085.
44 GEELY SWEDEN AB | ANNUAL REPORT 2014
CONSOLIDATED FINANCIAL STATEMENTS

MSEK Share
capitalShare
premium
Other contributed
capital
Currency translation
reserveOther
reserves1)Retained earnings Total
Balance at January 1, 2013 1,000 5,509 2,906 –578 138 12,926 21,901
Net income for the year — — — — — 960 960
Other comprehensive incomeRemeasurements of provision for post-employment benefits — — — — — 2,190 2,190
Translation difference on foreign operations — — — –160 — — –160
Translation difference of hedge instruments of net investments in foreign operations — — — –128 — — –128
Change in cash flow hedge, recognised in other comprehensive income — — — — 12 — 12
Tax attributable to items recognised in other comprehensive income — — 28 –3 –455 –430
Other comprehensive income — — — –260 9 1,735 1,484Total comprehensive income — — — –260 9 2,695 2,444
Transactions with ownersUnconditional shareholders’ contribution — — 293 — — — 293
Transactions with owners — — 293 — — — 293
Balance at December 31, 2013 1,000 5,509 3,199 –838 147 15,621 24,638
Net income for the year — — — — — 834 834
Other comprehensive incomeRemeasurements of provision for post-employment benefits — — — — — –2,177 –2,177
Translation difference on foreign operations — — — 681 — — 681
Translation difference of hedge instruments of net investments in foreign operations — — — –246 — — –246
Change in cash flow hedge, recognised in other comprehensive income — — — — –1,144 — –1,144
Tax attributable to items recognised in other comprehensive income — — — 54 251 531 836
Other comprehensive income — — — 489 –893 –1,641 –2,045Total comprehensive income — — — 489 –893 –807 –1,211
Transactions with ownersGroup contribution2) — — 8,808 — — — 8,808
Unconditional shareholders’ contribution — — 494 — — — 494
Other changes — — — — — –27 –27
Transactions with owners — — 9,302 — — –27 9,275
Balance at December 31, 2014 1,000 5,509 12,501 –349 –746 14,787 32,702
1) For specification of other reserves, see Note 23 – Equity.2) Group contribution before tax amounted to MSEK 11,293.
CHANGES IN CONSOLIDATED EQUITY
The provision for post-employee benefits has increased mainly due to lower discount rates.
Deferred tax liabilities increased by MSEK 1,578 to MSEK 3,337 (1,759), mainly as a result of the received group contributions.
Other current liabilities increased by MSEK 3,821 to MSEK 19,076 (15,255) due to special tool expenditures related to the upcoming
launch of the all-new XC90 and the SPA platform and due to an increase of sales with lease agreements.
During 2014, Volvo Car Group’s non-current liabilities to credit insti-tutions increased by MSEK 3,175 to MSEK 15,208 (12,033) mainly due to drawdowns on existing loan agreements. In December 2014, MSEK 136 has been amortised of a loan from China Development Bankl (CDB). Net debt has increased to MSEK 928 (–2,607).
45ANNUAL REPORT 2014 | GEELY SWEDEN AB
CONSOLIDATED FINANCIAL STATEMENTS

MSEK Note 2014 2013
OPERATING ACTIVITIESOperating income 2,252 1,919
Depreciation and amortisation of non-current assets 10 6,931 7,138
Interest and similar items received 131 87
Interest and similar items paid –647 –433
Other financial items –39 –80
Income tax paid –1,473 –573
Adjustments for items not affecting cash flow 30 –363 –281
6,792 7,777
Movements in working capitalChange in inventories 531 –349
Change in accounts receivable –2,386 –883
Change in accounts payable 802 1,006
Change in items relating to repurchase commitments –192 –47
Change in provisions 1,374 767
Change in other working capital assets/liabilities –575 590
Cash flow from movements in working capital –446 1,084Cash flow from operating activities 6,346 8,861
INVESTING ACTIVITIESInvestments in joint ventures and associates 14 –537 –520
Investments in intangible assets –4,887 –4,188
Disposal of intangible assets — 500
Investments in property, plant and equipment –5,250 –4,714
Disposal of property, plant and equipment — 66
Investments in marketable securities 22 –978 –88
Other 197 104
Cash flow from investing activities –11,455 –8,840Cash flow from operating and investing activities –5,109 21
FINANCING ACTIVITIESProceeds from credit institutions 26 2,435 5,336
Repayment of liabilities to credit institutions 26 –676 –45
Received shareholders’ contribution 23 494 293
Other 30 894 181
Cash flow from financing activities 3,147 5,765Cash flow for the year –1,962 5,786
Cash and cash equivalents at beginning of year 22 15,372 9,607Exchange difference on cash and cash equivalents 755 –21
Cash and cash equivalents at end of year 14,165 15,372
CONSOLIDATED STATEMENT OF CASH FLOWS
Cash flow from operating activities was positive at MSEK 6,346 (8,861). The decrease mainly relates to negative working capital developments.
Provisions increased by MSEK 1,374 (767) mainly due to increased variable marketing provisions and provisions related to warranty exten-sions. Accounts receivable increased by MSEK 2,386 (883) following higher sales volumes.
Income tax paid has increased by MSEK 900 to MSEK 1,473 (573).A reclassification has been made within cash flow from operating
activities. Lease agreements with maturity less than one year are accounted for as inventory instead of assets held under operating leases. This change has no impact on cash flow from operating activi-ties. The reclassification has affected depreciation and amortisation of non-current assets with MSEK –716 (–769) and change in items relat-ing to repurchase commitments with MSEK 716 (769).
Cash flow from investing activities was MSEK –11,455 (–8,840), a result of increased investments in marketable securities and con-tinuous investments in property, plant and equipment and intangible assets mainly related to the investments in the SPA platform.
In total, cash flow from operating and investing activities amounted to MSEK –5,109 (21). Adjusted for marketable securities the cash flow from operating and investing activities amounted to MSEK –4,131 (109).
Financing activities contributed positively to net cash flow with drawdowns of MSEK 2,435 (5,336) on loans and received shareholder contribution of MSEK 494, resulting in a total cash flow of MSEK –1,962 (5,786).
Cash and cash equivalents together with marketable securities at the end of the year amounted to MSEK 15,212 (15,460).
46 GEELY SWEDEN AB | ANNUAL REPORT 2014
CONSOLIDATED FINANCIAL STATEMENTS

NOTE 1 – ACCOUNTING PRINCIPLES
Basis of preparationThe financial statements of Geely Sweden AB and its subsidiaries (Volvo Car Group) have been prepared in compliance with the Interna-tional Financial Reporting Standards (IFRS) issued by the International Accounting Standards Board (IASB), as adopted by the European Union. This Annual Report is prepared in accordance with IAS 1 Pres-entation of Financial Statements and the Swedish Annual Accounts Act. In addition, RFR 1 Supplementary Rules for Groups has been applied, which is issued by the Swedish Financial Reporting Board. RFR 1 specifies mandatory additions to the IFRS disclosure require-ments in accordance with the Swedish Annual Accounts Act.
The consolidated financial statements have been prepared on the historical cost basis except for certain financial instruments that are carried at fair value, as explained in the accounting policies below. Preparing the financial reports in compliance with IFRS requires that Management makes judgements and estimates as well as assump-tions that affect the application of accounting principles and amounts recognised. The areas involving a higher degree of judgement or com-plexity, or areas where assumptions and estimates have significant impact on the consolidated financial statements are disclosed in Note 2 – Critical accounting estimates and judgements.
The parent company applies the same accounting principles as the consolidated Volvo Car Group, except in the cases specified in the section entitled notes to the parent company’s financial statements. As required by IAS 1, Volvo Car Group companies apply uniform accounting rules, irrespective of national legislation, as defined in the Volvo Car Group Finance Manual, which is in compliance with IFRS. The principles stated below have been applied consistently for all peri-ods, unless otherwise indicated below. For new accounting standards the application follows the rules in each particular standard. For infor-mation on new standards, see the section on new and amended standards adopted by the Volvo Car Group.
Basis of consolidationThe consolidated accounts have been prepared based on the princi-ples set forth in IFRS 10 – Consolidated financial statements. Volvo Car Group includes Geely Sweden AB and its subsidiary Volvo Car Corporation AB. Volvo Car Group also includes all of Volvo Car Corporation AB’s subsidiaries, which means the companies in which Volvo Car Corporation directly or indirectly owns more than 50 per cent of the voting rights of the shares or in any other way holds power to control. Subsidiaries are fully consolidated from the date on which control is transferred to the group. They are deconsolidated from the date that control ceases. IFRS 3 – Business combinations, is applied on acquisitions.
Balances and transactions with Zhejiang Geely Holding Group Co., Ltd and its subsidiaries, companies that are not part of the Volvo Car Group, are classified in the consolidated financial statements as balances and transactions with related companies.
NOTES TO THE CONSOLIDATED FINANCIAL STATEMENTSAll amounts are in MSEK unless otherwise stated. Amounts in brackets refer to the preceding year.
SubsidiariesThe group applies the acquisition method to account for business combinations. The value of the acquired net assets is determined by measuring acquired assets and liabilities and contingent liabilities at fair value on the date of acquisition. In business combinations where the cost of acquisition exceeds the fair value of the acquired identifi-able net assets, the difference is accounted for as goodwill. If the acquisition cost is less than the final fair value of the net assets and the acquisition is determined to be a bargain purchase, the difference is recognised directly as income in the income statement. Acquisition related costs are expensed as incurred. Intercompany transactions, balances and unrealised gains or losses on transactions between group companies are eliminated.
Joint ventures and associated companies Joint ventures refer to companies in which Volvo Car Group, through contractual cooperation together with one or more parties, has a joint control over the operational and financial management. Associated companies are companies in which Volvo Car Group has a significant but not controlling influence, which generally is when Volvo Car Group holds between 20 and 50 per cent of the shares, but it also includes investments with less participation if significant influence is proven. Investments in joint ventures and associated companies are reported in accordance with the equity method and are initially recognised at acquisition cost. The group’s share of post acquisition profit or loss is recognised in the income statement, and its share of post-acquisition movements in other comprehensive income is recognised in other comprehensive income with a corresponding adjustment to the carry-ing amount of the investment. When the group’s share of losses in an associate equals or exceeds its interest in the associate, the group does not recognise further losses unless it has incurred legal or con-structive obligations or made payments on behalf of the associate or joint venture.
Foreign currencyTranslation of foreign group entitiesVolvo Car Group’s functional currency is the Swedish krona (SEK). The functional currency of each Volvo Car Group company is determined based on the primary economic environment in which it operates. Volvo Car Group’s and Geely Sweden AB’s presentation currency is SEK. When preparing the consolidated financial statements, balance sheet and income statements for all group entities whose functional currency is not SEK, the currencies are translated into Volvo Car Group’s presen-tation currency using the procedures below, except for subsidiaries in hyperinflationary economies. Currently none of the entities within Volvo Car Group operates in a hyperinflationary economy. – Assets and liabilities are translated at the exchange rates at the
respective year end closing rate. – Income and expenses are translated at the monthly exchange rates
reported in the income statement and statement of other compre-hensive income.
– All translation differences that arise when translating the financial statements of subsidiaries outside Sweden are recognised as a separate item under other comprehensive income in the statement of other comprehensive income, without affecting income, until the disposal of the subsidiary.
GEELY SWEDEN AB | ANNUAL REPORT 2014 47ANNUAL REPORT 2014 | GEELY SWEDEN AB
NOTES TO THE CONSOLIDATED FINANCIAL STATEMENTS
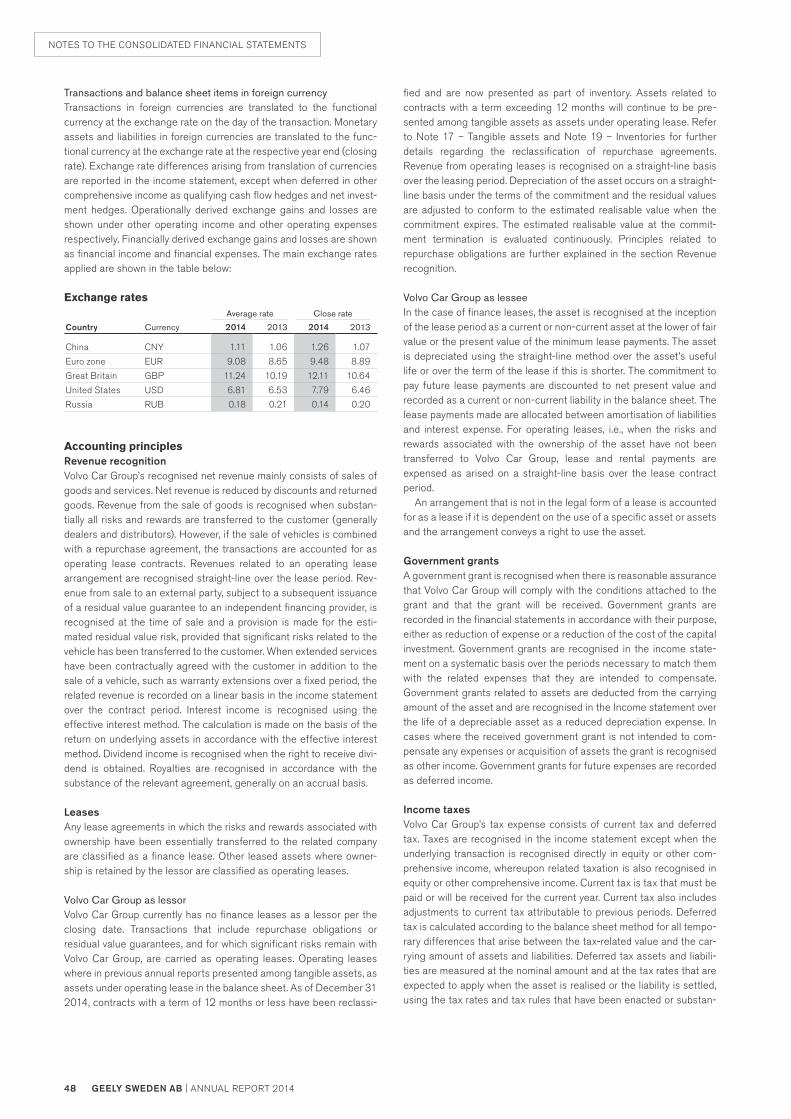
Transactions and balance sheet items in foreign currencyTransactions in foreign currencies are translated to the functional currency at the exchange rate on the day of the transaction. Monetary assets and liabilities in foreign currencies are translated to the func-tional currency at the exchange rate at the respective year end (closing rate). Exchange rate differences arising from translation of currencies are reported in the income statement, except when deferred in other comprehensive income as qualifying cash flow hedges and net invest-ment hedges. Operationally derived exchange gains and losses are shown under other operating income and other operating expenses respectively. Financially derived exchange gains and losses are shown as financial income and financial expenses. The main exchange rates applied are shown in the table below:
Exchange ratesAverage rate Close rate
Country Currency 2014 2013 2014 2013
China CNY 1.11 1.06 1.26 1.07
Euro zone EUR 9.08 8.65 9.48 8.89
Great Britain GBP 11.24 10.19 12.11 10.64
United States USD 6.81 6.53 7.79 6.46
Russia RUB 0.18 0.21 0.14 0.20
Accounting principlesRevenue recognitionVolvo Car Group’s recognised net revenue mainly consists of sales of goods and services. Net revenue is reduced by discounts and returned goods. Revenue from the sale of goods is recognised when substan-tially all risks and rewards are transferred to the customer (generally dealers and distributors). However, if the sale of vehicles is combined with a repurchase agreement, the transactions are accounted for as operating lease contracts. Revenues related to an operating lease arrangement are recognised straight-line over the lease period. Rev-enue from sale to an external party, subject to a subsequent issuance of a residual value guarantee to an independent financing provider, is recognised at the time of sale and a provision is made for the esti-mated residual value risk, provided that significant risks related to the vehicle has been transferred to the customer. When extended services have been contractually agreed with the customer in addition to the sale of a vehicle, such as warranty extensions over a fixed period, the related revenue is recorded on a linear basis in the income statement over the contract period. Interest income is recognised using the effective interest method. The calculation is made on the basis of the return on underlying assets in accordance with the effective interest method. Dividend income is recognised when the right to receive divi-dend is obtained. Royalties are recognised in accordance with the substance of the relevant agreement, generally on an accrual basis.
LeasesAny lease agreements in which the risks and rewards associated with ownership have been essentially transferred to the related company are classified as a finance lease. Other leased assets where owner-ship is retained by the lessor are classified as operating leases.
Volvo Car Group as lessorVolvo Car Group currently has no finance leases as a lessor per the closing date. Transactions that include repurchase obligations or residual value guarantees, and for which significant risks remain with Volvo Car Group, are carried as operating leases. Operating leases where in previous annual reports presented among tangible assets, as assets under operating lease in the balance sheet. As of December 31 2014, contracts with a term of 12 months or less have been reclassi-
fied and are now presented as part of inventory. Assets related to contracts with a term exceeding 12 months will continue to be pre-sented among tangible assets as assets under operating lease. Refer to Note 17 – Tangible assets and Note 19 – Inventories for further details regarding the reclassification of repurchase agreements. Revenue from operating leases is recognised on a straight-line basis over the leasing period. Depreciation of the asset occurs on a straight-line basis under the terms of the commitment and the residual values are adjusted to conform to the estimated realisable value when the commitment expires. The estimated realisable value at the commit-ment termination is evaluated continuously. Principles related to repurchase obligations are further explained in the section Revenue recognition.
Volvo Car Group as lesseeIn the case of finance leases, the asset is recognised at the inception of the lease period as a current or non-current asset at the lower of fair value or the present value of the minimum lease payments. The asset is depreciated using the straight-line method over the asset’s useful life or over the term of the lease if this is shorter. The commitment to pay future lease payments are discounted to net present value and recorded as a current or non-current liability in the balance sheet. The lease payments made are allocated between amortisation of liabilities and interest expense. For operating leases, i.e., when the risks and rewards associated with the ownership of the asset have not been transferred to Volvo Car Group, lease and rental payments are expensed as arised on a straight-line basis over the lease contract period.
An arrangement that is not in the legal form of a lease is accounted for as a lease if it is dependent on the use of a specific asset or assets and the arrangement conveys a right to use the asset.
Government grantsA government grant is recognised when there is reasonable assurance that Volvo Car Group will comply with the conditions attached to the grant and that the grant will be received. Government grants are recorded in the financial statements in accordance with their purpose, either as reduction of expense or a reduction of the cost of the capital investment. Government grants are recognised in the income state-ment on a systematic basis over the periods necessary to match them with the related expenses that they are intended to compensate. Government grants related to assets are deducted from the carrying amount of the asset and are recognised in the Income statement over the life of a depreciable asset as a reduced depreciation expense. In cases where the received government grant is not intended to com-pensate any expenses or acquisition of assets the grant is recognised as other income. Government grants for future expenses are recorded as deferred income.
Income taxesVolvo Car Group’s tax expense consists of current tax and deferred tax. Taxes are recognised in the income statement except when the underlying transaction is recognised directly in equity or other com-prehensive income, whereupon related taxation is also recognised in equity or other comprehensive income. Current tax is tax that must be paid or will be received for the current year. Current tax also includes adjustments to current tax attributable to previous periods. Deferred tax is calculated according to the balance sheet method for all tempo-rary differences that arise between the tax-related value and the car-rying amount of assets and liabilities. Deferred tax assets and liabili-ties are measured at the nominal amount and at the tax rates that are expected to apply when the asset is realised or the liability is settled, using the tax rates and tax rules that have been enacted or substan-
48 GEELY SWEDEN AB | ANNUAL REPORT 2014
NOTES TO THE CONSOLIDATED FINANCIAL STATEMENTS

tively enacted at the balance sheet date. Deferred tax assets relating to deductible temporary differences and loss carry forwards are rec-ognised to the extent it is probable that they will be utilised in the future. Deferred tax assets and deferred tax liabilities are offset when they are attributable to the same taxation authority on either the same taxable entity or different taxable entities where there is an intention to settle the balances on a net basis and the affected company has a legally enforceable right to offset tax asset against tax liabilities. Tax laws in Sweden and in certain other countries allow companies to defer tax payments through allocation to untaxed reserves. These items are treated as temporary differences in the consolidated balance sheet where the untaxed reserves are divided between deferred tax liability and equity. In the consolidated income statement an allocation to or withdrawal from, untaxed reserves is divided between deferred taxes and net income for the year.
Group contributionsGroup contributions received from the parent company and the tax effect on these contributions are recognised in equity in accordance with the principles for shareholders’ contributions.
Classification of current and non-current assets and liabilitiesAn asset is classified as a current asset when it is held primarily for the purpose of trading, is expected to be realised within twelve months after the balance sheet date or consists of cash or cash equivalents, provided it is not subject to any restrictions. All other assets are clas-sified as non-current assets. A liability is classified as a current liability when it is held primarily for the purpose of trading or is expected to be settled within twelve months after the balance sheet date. All other liabilities are classified as non-current liabilities.
Intangible assetsAn intangible asset is recognised when the asset is identifiable, the Volvo Car Group controls the asset and it is expected to yield future economic benefits. Intangible assets comprise product development, licenses and patents, trademarks, dealer network and investments in IT systems and software. Intangible assets such as trademarks and dealer networks are normally identified and measured at fair value in connection with business combinations. Both acquired and internally generated intangible assets, other than research and development expenses, are recognised at acquisition cost, less accumulated amor-tisation and any impairment loss. When applicable, internal costs directly related to the development of intangible assets are included in the value of the intangible asset. Borrowing costs are included in the cost of assets that take substantial period of time to get ready for its intended use. Subsequent expenditure on intangible assets increases the cost only if it is likely that the Volvo Car Group will have future economic benefit from the subsequent expenditure. All other subse-quent expenditure is recognised as an expense in the period in which it is incurred.
Capitalised product development costsVolvo Car Group’s research and development activities are divided into a concept phase and a product development phase. Research costs during the concept phase are charged to the income statement as they arise. Development costs for new products, production systems and software are capitalised at manufacturing cost beginning on the date when it is probable that the development expenditure will gener-ate future economic benefits. Development costs are capitalised to the extent that attributable costs can be measured reliably and both technical feasibility and successful marketing are assured. If the con-ditions for capitalisation are not met, the costs are recognised in the Income statement as expenses in the period they occur. Capitalised
development costs comprise all expenditures that can be directly attributed to the development phase and that serves to prepare the asset for use, including development related overhead and borrowing cost.
Development costs previously recognised as an expense are not recognised as an asset in a subsequent period.
Amortisation methods for intangible assetsIntangible assets with definite useful life are amortised on a straight-line basis in the income statement over their respective expected economic life and are tested for impairment whenever there is an indi-cation that the intangible asset may be impaired. The amortisation period for contractual rights such as licenses does not exceed the contract period. Trademarks are assumed to have indefinite useful lives since the Volvo Car Group has the right and the intention to con-tinue to use the trademarks for the foreseeable future and the useful life cannot be assessed why no amortisation is made. Dealer network is estimated to have a useful life based on the fact that it has been proven historically to have had a stable basis of dealers.
The useful lives are to a large extent based on historical experience, expected application as well as other individual characteristics of the asset. The following useful lives are applied:
Dealer network 30 years
Software, mainframe 8 years
Product development costs 3–10 years
Patents, licences and similar rights 3–10 years
Software, PC 3 years
Amortisation is included in cost of sales, selling or administrative expenses depending on where the assets have been used.
Property, plant and equipmentThe Volvo Car Group applies the cost method for measurement of tangible assets. Cost includes expenditure that can be directly attrib-uted to the acquisition. Borrowing costs are included in the acquisition value of an asset that takes substantial period of time to get ready for its intended use or sale, a so called qualifying asset. Tangible assets are recognised at acquisition cost, less accumulated depreciation and potential impairment loss. Subsequent expenditure on property, plant and equipment increases the acquisition value only if it is probable that the Volvo Car Group will have future economic benefit from the subse-quent expenditure. The carrying amount of the replaced part is derecognised. All other repairs and maintenance are charged to the income statement during the financial period in which they are incurred.
Depreciation methods for tangible assetsDepreciation according to plan is based on the acquisition value. Tangible assets are systematically depreciated over the expected eco-nomic life of the asset.
Each part of an item of property, plant and equipment, with a cost that is significant in relation to the total cost of the item, is depreciated separately when the useful life for the part differs from the useful life of the other parts of the item. Land is assumed to have an indefinite useful life and is not depreciated. The following useful lives are applied:
Buildings (whereof frames 50 years) 14.5–50 years
Land improvements 30 years
Machinery 8–30 years
Equipment 3–20 years
GEELY SWEDEN AB | ANNUAL REPORT 2014 49ANNUAL REPORT 2014 | GEELY SWEDEN AB
NOTES TO THE CONSOLIDATED FINANCIAL STATEMENTS

Impairment of assetsThe carrying amounts of intangible and tangible assets as well as all shareholding investments are tested regularly to assess whether there is an indication of impairment. Intangible assets that have an indefinite useful life or not yet available for use are not subject for amortisation and are tested for impairment annually or whenever there is an indica-tion of decline in value. The carrying amount of tangible assets with definite useful lives is tested whenever events or changes in circum-stances indicate that the value of the asset is reduced and there might be an impairment loss. For these assets as well as assets with an indefinite useful life, the asset’s recoverable amounts are calculated. The recoverable amount is the higher of an asset’s fair value less costs to sell or value in use. Value in use is defined as the present value of the future cash flows expected to be derived from an asset. For the purpose of assessing impairment, assets are grouped in one cash-generating unit (CGU). When an indication is confirmed, an impair-ment loss is recognised to the extent that the carrying amount exceeds its recoverable amount. Previously recognised impairment loss is reversed if reasons for the earlier impairment no longer exist. An impairment loss is reversed only to the extent that the asset’s carrying amount after reversal does not exceed the carrying amount, net of amortisation, which would have been reported if no impairment loss had been recognised in prior years.
Financial assets and liabilitiesFinancial instruments are any form of contract that gives rise to a financial asset in one company and a financial liability or equity instru-ment in another company.
Classification of financial assets and liabilitiesThe Group classifies its financial assets in the following categories; financial assets at fair value through profit and loss, loans and receiva-bles, financial liabilities at fair values through profit and loss and other financial liabilities. Classification takes place at initial recognition. Exceptions from these principles apply to financial instruments included in hedge accounting, which are described further in the section Hedge accounting.
Financial assets in the consolidated balance sheet encompass interest-bearing receivables, trade receivables, other financial assets, derivative assets and cash and cash equivalents. Derivative instru-ments include forwards, options and swaps used primarily to cover risks relating to exchange rate, exposure to interest rate risks and price fluctuations on electricity. Financial liabilities in the consolidated balance sheet mostly consist of trade payables, loans and derivative liabilities.
Recognition and measurement of financial assets and liabilitiesFinancial assets and liabilities are recognised in the balance sheet when the Volvo Car Group becomes a party to the contractual terms and conditions. Receivables are recognised in the balance sheet when Volvo Car Group has a contractual right to receive payment and liabili-ties are recognised when the counterparty has performed and there is a contractual obligation to pay. Financial assets and liabilities are reported on settlement date, with the exception of derivative instru-ments, which are reported on the trade date.
Financial assets are initially recognised at fair value plus transaction costs except for those financial assets carried at fair value through the income statement. Financial assets carried at fair value through the income statement are initially recognised at fair value, and transaction costs are expensed in the income statement. Fair value is generally determined by reference to official market quotes. When market quotes are not available the fair value is determined using generally accepted valuation methods such as discounted future cash flows.
Loans and receivables are subsequently measured at amortised cost. Accounts receivable are recognised at the amount expected to
be received, i.e. after deduction of bad debts allowance. A bad debt allowance has incurred when there has been a triggering event for the customer’s inability to pay. The bad debts on accounts receivable are recognised as operating expenses. Amortised cost is calculated using the effective interest method, where any premiums or discounts and directly attributable costs and revenue are capitalised over the con-tract period using the effective interest rate.
Borrowings are initially recognised at fair value net of transaction-costs incurred. After initial recognition, borrowings are valued at amortised cost using the effective interest method.
Financial assets carried at fair value through the income statementA financial asset is assigned to this category if it is held for trading.Derivative instruments with a positive market value are assigned to this category, unless they are included in hedge accounting. Changes in fair value of these instruments are recognised in the income state-ment. Based on the purpose of the contract, changes in fair value are reported either under operating income or as financial income/ expense. Derivatives with positive fair values (unrealised gains) are recognised as other current assets.
Loans and receivablesNon-derivative financial assets with fixed or determinable payments that are not quoted in an active market, for example accounts receiv-able and loan receivables, are assigned to this category. Cash and cash equivalents are also assigned to this category. Loans and receiv-ables are carried at amortised cost except for accounts receivable that have a short duration and are therefore valued at nominal value with-out discounting to net present value. The nominal value for these short term items will reflect the fair value.
Financial liabilities at fair value through the income statementDerivative instruments with a negative fair value are assigned to this category, unless they are included in hedge accounting. Changes in the fair values of these instruments are recognised in the income statement. Based on the purpose of the contract, changes in fair value are reported either under operating income or as financial income/expense. Derivatives with negative fair values (unrealised losses) are recognised as other current liabilities.
Other financial liabilitiesThis category includes financial liabilities such as trade payables as well as borrowings and repurchase commitments.
Hedge accountingHedge accounting is adopted for derivative instruments that are included in a documented hedge relationship. For hedge accounting to be applied, a direct connection between the hedge and the hedged item is required. Further, it is necessary for the hedge to protect the risk as effectively as intended, that the effectiveness of the measure can be demonstrated at all times to be sufficiently high through effec-tiveness testing, and that hedging documentation has been prepared. Volvo Car Group apply hedge accounting for derivate instruments related to hedging of currency risk in future commercial cash flows. Volvo Car Group also applies hedge accounting of net investments in foreign operations. Hedge accounting is applied for derivative instru-ments that were acquired for the purpose of hedging expected future commercial cash flows in foreign currencies against currency rate risks. A cash flow hedge is a hedge held to reduce the risk of an impact on the income statement from foreign exchange changes in cash flow relating to a future transaction. In cash flow hedge accounting, the derivative is recognised in the balance sheet at fair value, and changes in the fair value is recognised under other comprehensive income and accumulated in the hedge reserve in equity. Amounts that have been recognised in the hedge reserve in equity are recognised in the
50 GEELY SWEDEN AB | ANNUAL REPORT 2014
NOTES TO THE CONSOLIDATED FINANCIAL STATEMENTS

income statement in the same period as the payment flows reach the income statement. The hedging relationship is regularly tested up until its maturity date. If the identified relationships are no longer deemed effective, the fluctuation in fair value on the hedging instrument from the last period the instrument was considered effective is recognised in the income statement. If the hedged transaction is no longer expected to occur, the hedge’s accumulated changes in value are immediately transferred from other comprehensive income to the income statement and are included in operating income. Hedging of net investments in foreign operations refers to hedges held to reduce the effect of changes in the value of a net investment in a foreign operation due to changes in foreign exchange rates. The foreign currency gains and losses on hedging instruments are recognised under other comprehensive income. In the event of a divestment, the accumulated result from the hedge is immediately transferred from the hedge reserve in equity to the income statement. For further informa-tion regarding accounting treatment related to foreign currency, see section Foreign currency on page 47. See also Note 21– Financial risks and financial instruments for more information regarding finan-cial instruments.
Derecognition of financial assets and liabilitiesA financial asset or a portion of a financial asset is derecognised in the balance sheet when all significant risks and benefits linked to the asset have been transferred to a third party. Where Volvo Car Group concludes that all significant risks and benefits have not been trans-ferred, the portion of the financial assets corresponding to Volvo Car Group’s continuous involvement is recognised. Invoiced sales are sometimes subject to contracts for factoring with a third party (bank or financial institution). This enables Volvo Car Group to receive payment for its accounts receivable within a few days after billing and thus free liquidity at an earlier stage. If the criteria for derecognition of accounts receivable are not fulfilled, the receivable remains on the balance sheet. A financial liability or a portion of a financial liability is derecog-nised from the balance sheet when the obligation in the contract has been fulfilled or cancelled or has expired. For further information regarding financial instruments refer to Note 21 – Financial risks and financial instruments.
InventoryInventories of raw material, consumables and supplies, semi-manufac-tured goods, work in progress, finished goods and goods for resale are reported in inventories and carried at the lower of cost and net realis-able value at the reporting date. Furtermore, assets held under operat-ing lease, with a maturity less or equal to twelve months, are also reported as inventory. Costs of inventories comprise costs of purchase, production charges and other expenditures incurred in bringing the inventories to their present location and condition. The cost of inven-tories of similar assets is established using the first-in, first-out method (FIFO) and is based on the standard cost method. The standard costs are updated annually and adjustments are made at the turn of the model year. Net realisable value is calculated as the selling price in the ordinary course of business less estimated costs of completion and selling costs. For groups of similar products a group valuation method is applied. Physical stock counts are carried out annually or more often where appropriate in order to verify the records.
Cash and cash equivalentsCash and cash equivalents consist of cash and bank balances as well as short-term liquid investments with a maturity of maximum 90 days, which are subject to an insignificant risk of fluctuations in value. Cash and cash equivalents are stated at nominal value.
Post-employment benefitsVolvo Car Group has both defined contribution plans and defined ben-efit plans. Under a defined contribution plan, Volvo Car Group pays fixed contributions into a separate legal entity and will have no legal obligation to pay further contributions if the fund does not hold suffi-cient assets to pay all employee benefits. The contributions are recog-nised as employee benefit expenses in the income statement when earned by the employee.
A defined benefit plan is a pension plan that defines the amount of post-employee benefit an employee will receive upon retirement, usu-ally dependent on one or more factors such as age, years of service and compensation. Volvo Car Group has the obligation for the future benefits. For the funded defined benefits plans, the assets have been separated, with the majority invested in pension foundations. The pen-sion provision or asset recognised in the balance sheet in respect of defined benefit pension plans is the present value of the defined ben-efit obligation at the balance sheet date less the fair value of plan assets.
The calculation of the present value of defined benefit pension undertakings is performed according to the Projected Unit Credit method, which also considers future earnings. The calculation is per-formed annually by independent actuaries. The present value of the defined benefit obligation is determined by discounting the estimated future cash outflows using interest rates of high-quality corporate and government bonds that are denominated in the currency in which the benefits will be paid, and that have terms to maturity approximating to the terms of the related pension liability. The discount rate for the Swedish pension obligation is determined by reference to mortgage bonds. The most important actuarial assumptions are stated in Note 24 – Post employment benefits.
Actuarial gains and losses arising from experience adjustments and changes in actuarial assumptions are charged or credited to other comprehensive income in the period in which they arise. Past service costs are recognised immediately in the income statement when the settlement occurs.
The net interest cost is calculated by applying the discount rate to the net balance of the defined benefit obligation and the fair value of plan assets. Termination benefits are payable when employment is ter-minated by the group before the normal retirement date, or whenever an employee accepts voluntary redundancy in exchange for these benefits. The group recognises termination benefits at the earlier of the following dates: (a) when the group can no longer withdraw the offer of those benefits and (b) when the entity recognises costs for a restructuring that is within the scope of IAS 37 and involves payment of termination benefits.
ProvisionsProvisions are recognised in the balance sheet when a legal or con-structive obligation exist as a result of a past event and it is deemed more likely than not that an outflow of resources will be required to settle the obligation and the amount can be reliably estimated. The amount recognised as provision is the best estimate of the expendi-ture required to settle the present obligation at the balance sheet date. Provisions are regularly reviewed and adjusted as further information becomes available or circumstances change.
GEELY SWEDEN AB | ANNUAL REPORT 2014 51ANNUAL REPORT 2014 | GEELY SWEDEN AB
NOTES TO THE CONSOLIDATED FINANCIAL STATEMENTS

If the effect is material, non-current provisions are recognised at present value by discounting the expected future cash flows at a pre-tax rate reflecting current market assessments of the time value of money. The discount rate does not reflect such risks that are taken into consideration in the estimated future cash flow.
Revisions to estimated cash flows (both amount and likelihood) are allocated as operating cost. Changes to present value due to the passage of time and revisions of discount rates to reflect prevailing current market conditions are recognised as a financial cost. Warranty provisions include the Group’s cost of satisfying the customers with specific contractual warranty obligations, as well as other costs not covered by contractual commitments. All warranty provisions are recognised at the sale of the vehicles or spare parts. The initial calcu-lations of the reserves are based on historical warranty statistics con-sidering known quality improvements, costs for remedy of defaults etc. The provisions for campaigns booked at point of sale are adjusted as campaign decisions for specific quality problems are made. On a quar-terly basis the provisions are adjusted to reflect latest available data such as actual spend, exchange rates, discounting rates etc. The pro-visions are reduced by virtually certain warranty reimbursements from suppliers.
Contingent liabilitiesWhen a commitment does not meet the criteria for recognition of a liability or provision in the balance sheet it may be disclosed as a con-tingent liability. These possible obligations derive from past events and their existence will be confirmed only when one or several uncertain future events, which are not entirely within the Volvo Car Group’s con-trol, take place or fail to take place. A contingent liability could also exist for a present obligation where an outflow of resources is not likely or when the amount of the obligation cannot be measured with sufficient reliability.
Changes in accounting policy and disclosuresNew and amended standards adopted by the GroupThe following standards have been adopted by the Group forthe first time for the financial year beginning on January 1, 2014but have had no material impact on the group:
IFRS 10 – Consolidated financial statementsIFRS 10 is based on existing principles by identifying the concept of control as the determining factor for assessment of whether a com-pany should be included in the consolidated financial statements. The standard provides additional guidance to assist in the determination of control where this is difficult to assess.
IFRS 11 – Joint arrangementsIFRS 11 provides guidance for the accounting of joint arrangements by focusing on the rights and obligations of the arrangement, rather than its legal form. Joint arrangements are divided into two categories – joint operations and joint ventures. In joint operations each joint ven-ture accounts for the assets, liabilities, revenues and expenses relat-ing to its interest in the joint arrangement. In joint ventures, each joint venture shall account for its interest using the equity method.
IFRS 12 – Disclosure of interests in other entitiesIFRS 12 is a new and comprehensive standard on disclosure require-ments for all forms of interests in other entities, including joint arrange-ments, associates and structured entities. The new standard has resulted in extended disclosures for the Volvo Car Group.
New standards and interpretations not yet adopted by the GroupWhen preparing the consolidated financial statements as of Decem-ber 31, 2014, a number of standards, interpretations and amendments have been published, but have not yet become effective. None of these are expected to have a significant effect on the consolidated financial statements of the Group except those stated below. The following is a preliminary assessment of the effect that the implemen-tation of these standards and interpretations could have on Volvo Car Group’s financial statements.
IFRS 9 – Financial instrumentsIFRS 9 addresses the classification, measurement and recognition of financial assets and financial liabilities and replaces the guidance in IAS 39. IFRS 9 establishes three primary measurement categories for financial assets: amortised cost, fair value through Other comprehen-sive income and fair value through the income statement. The basis of classification depends on the entity’s business model and the contrac-tual cash flow characteristics of the financial asset. For financial liabil-ities the only change relates to recognition of changes in own credit risk in other comprehensive income, for liabilities designated at fair value through the income statement. IFRS 9 relaxes the requirements for hedge effectiveness by replacing the bright line hedge effective-ness tests. Instead It requires an economic relationship between the hedged item and hedging instrument and for the ‘hedged ratio’ to be the same as the one management actually use for risk management purposes. The standard is effective for accounting periods beginning on or after January 1, 2018. Early adoption is permitted. The group is yet to assess IFRS 9’s full impact.
IFRS 15 – Revenue from contracts with customersIFRS 15 deals with revenue recognition and establishes principles for reporting useful information to users of financial statements about the nature, amount, timing and uncertainty of revenue and cash flows aris-ing from an entity’s contracts with customers. Revenue is recognised when a customer obtains control of a good or service and thus has the ability to direct the use and obtain the benefits from the good or ser-vice. The standard replaces IAS 18 – Revenue and IAS 11 – Construc-tion contracts and related interpretations. The standard is effective for annual periods beginning on or after January 1, 2017 and earlier appli-cation is permitted. The group is assessing the impact of IFRS 15.
There are no other IFRSs or IFRIC interpretations that are not yet effective that would be expected to have a material impact on the Group.
Other changes in standards and interpretations that enter into force on January 1, 2015 or subsequently are not expected to have any material impact on the Group.
52 GEELY SWEDEN AB | ANNUAL REPORT 2014
NOTES TO THE CONSOLIDATED FINANCIAL STATEMENTS

NOTE 2 – CRITICAL ACCOUNTING ESTIMATES AND JUDGEMENTS
Preparation of the financial statements in accordance with IFRS requires the company’s executive management and Board of Directors to make estimations and assessments as well as to make assumptions that affect application of the accounting policies and the reported assets, liabilities, income and expenses. The estimates are based on historical experience and assumptions that are deemed reasonable and realistic in the circumstances. The results of these estimations and assessments are then used to establish the reported values of assets and liabilities that are not otherwise clearly documented from other sources. The actual outcome may differ from these estimates and assessments. The estimates and underlying assumptions are reviewed on a regular basis. Changes are recognised in the period of the change and future periods if the change affects both. The estima-tions and assessments described below are those that are deemed to be the most important for an understanding of Volvo Car Group’s financial reports, taking into account the degree of materiality and uncertainty. Changes in estimates used in these and other items could have a material impact on Volvo Car Group’s financial statements.
Residual value risks In the course of its operations, Volvo Car Group is exposed to residual value risks through sales combined with repurchase agreements and sales to external rental company subject to residual value guarantees. Residual value risks are reflected in different ways in the consolidated financial statements depending on the extent to which the risk remains with the Group. In cases where significant risks pertaining to vehicles remain with Volvo Car Group, the vehicles are generally recognised in the balance sheet as assets under operating leases or inventory, depending on the maturity of the lease contract. Accumulated depre-ciation on these vehicles reduces the value of the vehicles from their original acquisition value to their expected residual value, being the estimated net realisable value, at the end of the lease term. Vehicles sold to an external party, subject to a subsequent issuance of a resid-ual value guarantee to an independent financing provider, are derecog-nised from the balance sheet in cases where no significant risks remain with the Group. A provision is made for the residual value risk related to the guarantee based upon estimations of the used products’ future net realisable values. The estimated net realisable value of the products at the end of the commitment is monitored individually on a continuing basis and is estimated by evaluating recent auction values, future price deterioration due to expected change of market condi-tions, marketing incentive plans, vehicle quality data and repair and reconditioning costs etc. High inventories in the vehicle industry and low demand may have a negative impact on the prices of new and used vehicles. A decline in prices of the vehicles may negatively affect the consolidated income. When the Group has entered into a residual value guarantee in relation to a vehicle sale, there may be a question of judgement regarding whether or not significant risks and rewards of ownership have been transferred to the customer. If the previous assessment of retained risk by Volvo Car Group is proven to be incor-rect and it is instead determined that significant risks are retained by the Group, revenue in the coming period will decline and instead be distributed over several reporting periods. Refer to Note 1 – Account-ing principles for a description of Volvo Car Group’s revenue recogni-tion policy relating to operating lease contracts.
Deferred tax assets The calculation of deferred tax assets requires assumptions to be made with regard to the level of future taxable income and the timing of recovery of deferred tax assets. These assumptions take account of forecast operating results and the impact on earnings of the reversal of taxable temporary differences. The measurement of deferred tax assets is subject to uncertainty and the actual result may diverge from these judgements due for example to future changes in business
climate and altered tax laws. An assessment is made at each closing date of the likelihood that the deferred tax asset will be utilised. If needed the carrying amount of the deferred tax asset will be altered. The judgements that have been made may affect net income both positively and negatively. Refer to Note 15 – Taxes for the presentation of carrying values and further information on deferred tax assets.
Impairment, amortisation and depreciation of non-current assets The Volvo Car Group has substantial values reported in the balance sheet regarding non-current assets. Property, plant and equipment and intangible assets are depreciated on a straight-line basis over their estimated useful lives; refer to Note 1 – Accounting principles. Management regularly reassesses the useful life of all significant assets. If the estimated useful life is incorrect, or circumstances change such that the estimated economic useful life has to be revised, an impairment loss or additional depreciation expense could result in future periods.
The carrying amounts of non-current assets are tested for impair-ment in accordance with the accounting policies described in Note 1 – Accounting principles. An impairment is recognised if the carrying value of the asset exceeds the recoverable amount. The recoverable amount is the higher of the asset’s net selling price and its value in use. For these calculations, certain estimations must be made regard-ing future cash flows, required return on investments and other ade-quate assumptions. The estimated future cash flows are based on assumptions that represent management’s best estimate of the eco-nomic conditions that will exist during the asset’s remaining lifetime, and are based on internal business plans or forecasts. Future cash flows are determined on the basis of the long-term planning, which is approved by Management and which is valid at the date of conduction of the impairment test. This planning is based on expectations regard-ing future market share, the market growth as well as the products’ profitability. Refer to Note 16 – Intangible assets and Note 17 – Tangi-ble assets for the presentation of carrying values and further informa-tion of impairment of non-current assets.
InventoriesInventories are measured at the lower of cost and their net realisable value. Net realisable value is based on the most reliable evidence of the amount the Volvo Car Group expects to realise from vehicles and components, on future sales trends or needs (for components) and also takes into account items that are wholly or partially obsolete. A future unexpected worsening in market conditions could result in an adjustment in future expected sales, requirements and in estimated selling prices assumptions which may require an adjustment to the carrying amount of inventories. Refer to Note 19 – Inventories for the presentation of carrying values and further information of inventories.
Post-employment benefitsThe value of pension obligations for defined benefit obligations is determined through actuarial calculations based on assumptions about the discount rate, future salary increases, inflation, mortality rates and demographic conditions. Every change in these assump-tions affects the calculated value of the post-employee benefits obligations. The discount rate, which is the most critical assumption, is based on market return on high-quality corporate and government bonds that are denominated in which the benefits will be paid and with maturities corresponding to the related pension liability. A lower discount rate increases the present value of post-employee benefits obligations and their cost while a higher discount rate has the reverse effect. Due to changing market and economic conditions, the underly-ing key assumptions may differ from actual developments and may lead to significant changes in pension and other post-employment benefit obligations. Refer to Note 24 – Post employment benefits for the presentation of carrying values and further information on pension provisions.
GEELY SWEDEN AB | ANNUAL REPORT 2014 53ANNUAL REPORT 2014 | GEELY SWEDEN AB
NOTES TO THE CONSOLIDATED FINANCIAL STATEMENTS

Warranty The recognition and measurement of provisions for product warranties is generally connected with estimates. Estimated costs for product warranties are charged to cost of sales when the products are sold. Estimated warranty costs include contractual warranty, warranty cam-paigns (recalls and buy-backs) and warranty cover in excess of con-tractual warranty or campaigns, which is accepted as a matter of policy or normal practice in order to maintain a good business relation with the customer. Warranty provisions are estimated based on historical claims statistics and the warranty period. Quality index improvements based on historical patterns have been reflected in all categories of warranty. Refunds from suppliers that decrease Volvo Car Group’s warranty costs are recognised to the extent these are considered to be virtually certain. Refer to Note 25 – Current and other non-current provisions for presentation of carrying values and further information of warranty provisions.
Legal proceedings Companies within Volvo Car Group are involved in legal proceedings covering a range of different matters, which are pending in various jurisdictions. These include, but are not limited to, commercial disputes
such as alleged breach of contract, insufficient supplies of goods or services, product liability, patent infringement or infringement of other intangible rights. The various matters raised are often of a difficult and complex nature and often legally complicated. It is therefore difficult to predict the final outcome of such matters. The companies within Volvo Car Group work closely with legal advisors and other experts in the various matters in each jurisdiction. A provision is made when it is determined that an adverse outcome is more likely than not and the amount of the loss can be reasonably estimated. In instances where these criteria are not met, a contingent liability has been disclosed provided the risk qualifies as such liability. Refer to Note 29 – Contingent liabilities for disclosure of values related to legal claims.
Tax processes Volvo Car Group is also, like other global companies, at times involved in tax processes of varying scope and in various stages. These tax processes are evaluated regularly and provisions are made according to the accounting principles, i.e., when it is more likely than not that additional tax must be paid and the outcome can be reliably estimated. If it is not probable that the additional tax will be paid but the risk is more than remote, such amounts are shown as contingent liabilities.
54 GEELY SWEDEN AB | ANNUAL REPORT 2014
NOTES TO THE CONSOLIDATED FINANCIAL STATEMENTS

NOTE 3 – net revenue
The Net revenue allocated to geographical regions: 2014 2013
China 18,884 18,793
US 14,205 14,132
Sweden 19,746 17,866
Western Europe1) 53,761 47,192
of which Germany 9,141 7,470
of which United Kingdom 9,736 6,931
Other markets 23,363 24,262
of which Russia 4,398 4,526
of which Japan 3,312 4,595
Total 129,959 122,245
1) Norway, Denmark, Finland, Netherlands, Belgium, France, Spain, Italy, Germany, Switzerland, Austria, Ireland, UK, Greece and Portugal.
For each significant category of revenue, see additional information in the Board of Directors report.
NOTE 4 – EXPENSES BY NATURE2014 2013
Material cost incl. freight and distribution –89,546 –85,013
Warranty expenditure –2,032 –1,808
Personnel –18,622 –18,557
Amortisation/depreciation –6,906 –6,947
Other –10,966 –8,521
Total –128,072 –120,846
Capitalised product development costs has reduced the amounts presented as personnel and other. During the year the group has reclassified lease agreements with maturity less than one year from assets held under operating leases to inventory. As a result, MSEK 716 (769) has been reclassified from depreciation to material cost incl. freight and distribution.
NOTE 5 – RELATED PARTies
During the year, Group companies entered into the following trading transactions with related parties that are not consolidated in the Volvo Car Group:
Sales of goods, services and other
Purchases of goods, services
and other
2014 2013 2014 2 013
Related companies1) 3,872 945 –670 –350
Associated companies and Swedish joint ventures 1,699 2,641 –1,252 –1,533
Receivables from Payables to
2014 2013 2014 2013
Related companies1) 3,263 1,098 755 562
Associated companies and Swedish joint ventures 30 65 71 72
1) Balances and transactions with Zhejiang Geely Holding Group., Ltd and its subsidiaries, companies that are not part of the Volvo Car Group, are classi-fied as balances and transactions with related companies. For joint ventures and associated companies see Note 14 – Investments in joint ventures and associates.
Significant related party transactions Since 2012, Volvo Car Group has an agreement with a subsidiary of Shanghai Geely Zhaoyuan International Investment Co., Ltd for licens-ing of certain intellectual property rights from Volvo Car Group, to enable production of Volvo cars in the Chengdu and Daqing plants. During 2014, Volvo Car Group has entered into an agreement with Zhongjia Automobile Manufacturing (Chengdu) Co., Ltd related to its usage of certain Volvo Car Group owned vendor tools, which has resulted in an income of MSEK 13. In January 2014, the joint venture company Shanghai Volvo Car Research and Development Co., Ltd was established in China. The purpose of the new joint venture is to engage in services supporting the development, production and sales of Volvo cars in China. In April 2014, the joint venture company Daqing Volvo Car Manufac-turing Co., Ltd bought the shares in Kaixuan Automobile Parts Manu-facturing (Daqing) Co., Ltd, which owns production facilities in Daqing, from Zhejiang Geely Holding Group Co., Ltd and Shanghai Geely Zhaoyuan International Investment Co., Ltd. Furthermore, Daqing Volvo Car Manufacturing Co., Ltd has incorporated the company
Daqing Fengwo Car Distribution Co., Ltd as a wholly owned subsidiary. For further information see Note 14 – Investments in joint ventures and associates. In May 2014, Volvo Car Group signed an agreement with London Taxi Co., Ltd, a wholly owned subsidiary to Zhejiang Geely Holding Group Co,. Ltd, regarding development, technical support and component sales, which has resulted in an income of MSEK 36. In June 2014, Volvo Car Group received an entry fee from Zhongjia Automobile Manufacturing (Shanghai) Co., Ltd of MSEK 106, relating to an extension of the technology license for production of Volvo cars in the Chengdu plant. Furthermore, in December, 2014 Volvo Car Group received an another entry fee of MSEK 157 and a royalty of MSEK 36 from Daqing Volvo Car Manufacturing Co., Ltd, relating to the technology licenses to produce Volvo cars in the Daqing plant. In December 2014, Volvo Car Group entered into an agreement with Ningbo Geely Automotive Research & Development Co., Ltd, a wholly owned subsidiary to Zhejiang Geely Automobile Co,. Ltd, regarding certain common development activities. The agreement has resulted in an income related to sale of licenses of MSEK 407, other income of MSEK 170 and capitalised intangible assets of MSEK 435. During 2014, Volvo Car Group has also received technology fees and trademark licences fees of MSEK 450 whereof MSEK 433 from Zhongjia Automobile Manufacturing (Shanghai) Co., Ltd and MSEK 17 from Daqing Volvo Car Manufacturing Co., Ltd. Licenses and royalties are classified as other operating income in the income statement. During 2014, Volvo Car Group has sold tools and components to Daqing Volvo Car Manufacturing Co., Ltd for the production of the XC90 Classic of MSEK 513, whereof MSEK 506 is reflected in net revenue and MSEK 7 is reflected in other operating income. Furthermore during 2014, Geely Sweden AB has received an uncon-ditional shareholders’ contribution from Shanghai Geely Zhaoyuan International Investment Co., Ltd. The shareholders’ contribution was initially received by Geely Sweden Holdings AB from Shanghai Geely Zhaoyuan International Investment Co., Ltd and was then given to Geely Sweden Automotive AB and thereafter to Geely Sweden AB. Volvo Car Group does not engage in any transactions with Board members or senior executives except remuneration for services. For fur-ther information about remunerations, see Note 9 – Employees and remuneration.
GEELY SWEDEN AB | ANNUAL REPORT 2014 55ANNUAL REPORT 2014 | GEELY SWEDEN AB
NOTES TO THE CONSOLIDATED FINANCIAL STATEMENTS

NOTE 6 – AUDIT FEES2014 2013
Deloitte
Audit fees –24 –22
Audit-related fees –4 –3
Tax services –1 –1
Other services –8 –9
Total –37 –35
Audit fees involve audit of the Annual Report, financial accounts and the administration by the Board of Directors and the Managing Director. The audit also includes advice and assistance as a result of the obser-vations made in connection with the audit.
Audit-related fees refer to other assignments to ensure quality in the financial statements including consultations on reporting require-ments and internal control.
Tax services include tax-related consultancy.
All other work performed by the auditor is defined as other services.
NOTE 7 – OTHER OPERATING INCOME AND EXPENSES2014 2013
Other operating income
Licences 896 323
Royalty 530 —
Foreign exchange gain — 775
Other 527 411
Total 1,953 1,509
2014 2013
Other operating expenses
Foreign exchange loss –639 —
Royalty –264 –351
Restructuring costs –111 –60
Property tax –73 –65
Other –605 –692
Total –1,692 –1,168
For furter information, see note 5 – Related parties. For information regarding the treatment of ineffective hedge contracts, see note 21 – Financial risks and financial instruments.
NOTE 8 – LEASING
Volvo Car Group as lessorOperational lease contracts are recognised as non-current assets in assets held under operating leases in the balance sheet and mainly relate to vehicles sold with repurchase agreements. The difference between the original sales price and the repurchase price is recog-nised in the income statement as revenue on a straight-line basis over the lease term. The remaining lease revenue yet to be recognised in income is presented as part of current and non-current liabilities in the balance sheet, see Note 26 – Other non-current liabilities and Note 27 – Other current liabilities. The repurchase obligation is considered to be a financial liability and is presented as part of current and non-current liabilities. Volvo Car Group does currently not have any finance lease engagements as a lessor.
Future lease revenue of operating lease contracts Rental income 2014 2013
No later than 1 year 473 549
Later than 1 year and no later than 5 years 357 420
Later than 5 years — —
Total 830 969
Volvo Car Group as lesseeOperating lease contractsThe operating lease contracts Volvo Car Group holds are mainly contracts for premises and office equipment around the world. Also some production equipment such as forklifts for the factories are under operating lease contracts.
Operating lease expenses 2014 2013
Minimum lease payments –1,020 –934
Contingent rents –62 –47
Less subleases 71 15
Total –1,011 –966
Operating lease commitments per Dec 31, 2014
Minimum lease
paymentsLess
subleases Total
Present value of operating
lease commitments less subleases
No later than 1 year 914 32 882 863
Later than 1 year and no later than 5 years 1,915 122 1,793 1,586
Later than 5 years 2,710 295 2,415 1,667
Total 5,539 449 5,090 4,116
Finance lease contractsVolvo Car Group holds finance lease contracts for production equip-ment and some buildings used in production. The assets will be owned by Volvo Car Group at the end of the lease contracts at no additional cost. All leases are fixed terms with fixed payments.
Finance lease assetsBuildings and land
Machinery and
equipment
Acquisition cost
Balance at January 1, 2013 1) 92 2
Divestments and disposals –2 —
Effect of foreign currency exchange differences –3 —
Balance at December 31, 2013 87 2
Additions — 7
Effect of foreign currency exchange differences 7 —
Balance at December 31, 2014 94 9
Accumulated depreciation
Balance at January 1, 2013 1) –41 –2
Divestments and disposals 1) –7 —
Balance at December 31, 2013 –48 –2
Depreciation expense –9 —
Effect of foreign currency exchange differences –3 —
Balance at December 31, 2014 –60 –2
Net balance at December 31, 2013 1) 39 —
Net balance at December 31, 2014 34 7
56 GEELY SWEDEN AB | ANNUAL REPORT 2014
NOTES TO THE CONSOLIDATED FINANCIAL STATEMENTS

Gross finance lease liabilities – minimum lease payments
Dec 31, 2014
Dec 31, 2013
No later than 1 year 10 33
Later than 1 year and no later than 5 years 95 122
Later than 5 years 4 6
Total 109 161
Future finance charges on finance leases –3 –22
Present value of finance lease liabilities 106 139
The present value of finance lease liabilities is as follows:
Gross finance lease liabilities – minimum lease payments
Dec 31, 2014
Dec 31, 2013
No later than 1 year 9 25
Later than 1 year and no later than 5 years 93 109
Later than 5 years 4 5
Total 106 139
The finance lease liabilities are included in the financial statement as:
Dec 31, 2014
Dec 31, 2013
Other non-current liabilities (Note 26) 98 114
Other current liabilities (Note 27) 8 25
Total 106 1391) The net book value for 2013 has been adjusted by MSEK –130 since an purchase on instalment previously was classified as a finance lease.
NOTE 9 – EMPLOYEES AND REMUNERATION
Average number of employees by region: 2014
Of whom women 2013
Of whom women
Sweden 16,022 22% 15,786 23%
Nordic countries other than Sweden 333 29% 342 29%
Belgium 4,685 14% 4,171 12%
Europe other than the Nordic countries and Belgium 1,056 39% 991 39%
North and South America 414 23% 421 23%
China 905 33% 753 33%
Asia other than China 627 35% 679 35%
Other countries 97 35% 99 35%
Total 24,139 24% 23,242 22%
Dec 31, 2014
Of whom women
Dec 31, 2013
Of whom women
Number of Board members and senior executives1)
Board members (Chief Executive
Officers and senior executives)
Board members (Chief Executive
Officers and senior executives)
Parent company 4 0% 4 0%
Subsidiaries82
(210)18%
(20%)98
(218)18%
(20%)
Total86
(210)17%
(20%)102
(218)17%
(20%)
2014 2013
Salaries and other remunerations, total
Wages and salaries,
other remune
rations
Social security
expenses (of which pension
expenses)
Wages and salaries,
other remune
rations
Social security
expenses (of which pension
expenses)
Parent company 3 1 (—) 6 2 (—)
Subsidiaries 11,750 5,193 (2,092)
11,087 4,808 (2,194)
Total 11,7535,194
(2,092) 11,0934,810
(2,194)
2014 2013
Salaries and other remuneration to the Board2), CEO, Executive managem ent team (EMT)3) and other employees
Wages and salaries,
other remunera
tions (of which
variable salaries)
Social security
expenses (of which pension
expenses)
Wages and salaries,
other remunera
tions (of which
variable salaries)
Social security
expenses (of which pension
expenses)
Board, Chief Executive Officers and EMT
211 (54)
96(29)
194 (34)
108 (33)
Other employees
11,542 5,098 (2,063)
10,899 4,702 (2,161)
Total11,753
(54)5,194
(2,092)11,093
(34)4,810
(2,194)
1) Senior executives are defined as key personnel within the subsidiaries. 2) The Board includes all board members in the subsidiaries within Volvo Car
Group.3) The executive management team (EMT) consists of the CFO in Volvo Car
Corporation and key management personnel other than board members. For further information regarding EMT, see Board of Directors’ report.
Volvo Car Group’s outstanding post-employment benefits obligations to the Board members, Chief Executive Officers and EMT amount to MSEK 74 (113).
The notice period for a member of EMT is maximum twelve months in case of termination by Volvo Car Corporation and twelve months in case of termination by the member of EMT. Furthermore the employee is, in case of termination by Volvo Car Corporation, entitled to sever-ance pay calculated based on the fixed salary, during a period of max-imum twelve months.
During 2014, no members of EMT, left the Volvo Car Group com-pared with 2013, when 3 members left. Remunerations during the notice period and severance pay amounted to MSEK 0 (21), excluding social expenses.
Incentive programmesVolvo Car Group has two global incentive programmes; a short term incentive programme (STI) including all employees and a long term incentive programme for EMT and senior executives (LTI). The design and payout of the programmes are subject to the Board of Directors’ annual approval.
Short term incentive programThe purpose of the STI-programme is to strengthen global alignment among employees around Volvo Car Group’s vision, objectives and strategies and to encourage all employees to achieve and exceed the business plan targets in order to reach the long term targets. The qualifier for all STI plans is that the profit target (EBIT) is reached. The short term incentive has a defined ceiling in relation to base salary and earned remuneration is paid in cash. The cost for the STI-programme amounted to MSEK 618 (678) including social security cost, of which MSEK 28 (27) relates to the Executive management team.
GEELY SWEDEN AB | ANNUAL REPORT 2014 57ANNUAL REPORT 2014 | GEELY SWEDEN AB
NOTES TO THE CONSOLIDATED FINANCIAL STATEMENTS

Long term incentive programThe purpose of the LTI-programme is to attract, motivate and retain key competence within Volvo Car Group. The LTI-programme is based on calculated market value of Volvo Car Group during three years. As Volvo Car Group is not listed, no official market value is available. Hence, the LTI program is based on a synthetic share price derived from variables known to determine the value of an automotive OEM. The calculated market value is based on the ROIC and volume growth in the Business plan five years ahead. The Business plan is adopted annually by the board. The variable compensation is cash based and set to 30 % of the annual base salary. The cost for the LTI-programme amounted to MSEK 152 (113) including social security cost, of which MSEK 27 (19) relates to the Executive management team. The total liability amounted to MSEK 255 (197) as of December 31, 2014.
Other long-term benefitsApart from the compensation accounted for under Incentive pro-grammes, the Executive management team do not have any other long-term benefits.
NOTE 10 – DEPRECIATION AND AMORTISATION
Operating income includes depreciation and amortisation as specified below: 2014 2013
Software –261 –265
Capitalised product development cost –1,374 –1,165
Other intangible assets –1,084 –1,263
Buildings and land improvements –457 –471
Machinery & equipment –3,494 –3,772
Assets under operating leases –261 –202
Total –6,931 –7,138
Depreciation and amortisation according to plan by function: 2014 2013
Cost of sales1) –3,716 –3,938
Research and development expenses –2,747 –2,570
Selling expenses –80 –96
Administrative expenses –363 –343
Other income and expense –25 –191
Total –6,931 –7,138
1) Of which impairment loss MSEK 2 (7).
During the year the group has reclassified lease agreements with maturity less than one year from assets held under operating leases to inventory. Depreciation has as a result of the reclassification decreased by MSEK 716 (769).
NOTE 11 – GOVERNMENT GRANTS
Volvo Car Group receives grants mainly from the Swedish Govern-ment. Grants are also received in Belgium and from the EU. In 2014, the government grants received amounted to MSEK 87 (81) and the government grants realised in the income statement amounted to MSEK 105 (76).
NOTE 12 – FINANCIAL INCOME2014 2013
Net foreign exchange gain on financing activities 194 —
Interest income on bank deposits 131 87
Total 325 87
NOTE 13 – FINANCIAL EXPENSES2014 2013
Interest effect from the measurement of repurchase obligations –186 –197
Interest expenses related to provision for post-employment benefits –126 –189
Expenses for credit facilities –107 –46
Net foreign exchange loss on financing activities — –82
Other interest expenses –485 –333
Other financial expenses –183 –27
Total –1,087 –874
NOTE 14 – INVESTMENTS IN joint ventures and ASSOCIATES
2014 2013
Share of income in joint ventures 58 109
Share of income in associates 46 70
Total 104 179
Share of income in joint ventures and associates is specified below: 2014 2013
V2 Plug-In Hybrid Vehicle Partnership HB1) 144 114
Daqing Volvo Car Manufacturing Co., Ltd2) –104 —
Zhangjiakou Volvo Car Engine Manufacturing Co., Ltd3) 18 –5
Volvofinans Bank AB5) 27 39
Other companies 19 31
Total 104 179
Dec 31, 2014
Dec 31, 2013
At beginning of the year/acquired acquisition value 1,159 550
Share of net income 104 179
Investment in Daqing Volvo Car Manufacturing Co., Ltd2) 452 133
Investment in Zhangjiakou Volvo Car Engine Manufacturing Co., Ltd3) — 387
Investment in Shanghai Volvo Car Research and Development Co., Ltd4) 49 —
Investment in VH Systems AB6) 18 —
Capital contribution VH Systems AB 18 —
Capital repayment V2 Plug-In Hybrid Vehicle Partnership HB1) –176 –85
Dividends –22 –5
Reclassification from previous year1) –61 —
Total 1,541 1,159
58 GEELY SWEDEN AB | ANNUAL REPORT 2014
NOTES TO THE CONSOLIDATED FINANCIAL STATEMENTS

Volvo Car Group’s carrying amount on investments in joint ventures and associates: Corp. ID no.
Country of incorporation % interest held Dec 31, 2014 Dec 31, 2013
Joint ventures
Volvo Trademark Holding AB 556567-0428 Sweden 50 5 5
V2 Plug-In Hybrid Vehicle Partnership HB1) 969741-9175 Sweden 50 133 226
VH Systems AB6) 556820-9455 Sweden 50 36 —
Daqing Volvo Car Manufacturing Co., Ltd2) 100000400012348 China 30 481 133
Zhangjiakou Volvo Car Engine Manufacturing Co., Ltd3) 100000400012356 China 30 400 381
Shanghai Volvo Car Research and Development Co., Ltd4) 310000400729199 China 30 49 —
Associated companies
First Rent a Car AB 556434-7820 Sweden 45 66 52
VCC Tjänstebilar KB 969673-1950 Sweden 37 2 2
VCC Försäljnings KB 969712-0153 Sweden 37 1 1
Volvohandelns PV-Försäljnings KB 916839-7009 Sweden 37 11 10
Volvohandelns PV-Försäljnings AB 556430-4748 Sweden 36 10 9
Volvo Event Management Corporation 444517742 Belgium 33 1 1
Göteborgs Tekniska College AB 556570-6768 Sweden 26 4 2
Volvofinans Bank AB5) 556069-0967 Sweden 10 342 337
Carrying amount, participation in joint ventures and associates 1,541 1,159
1) V2 Plug-In Hybrid Vehicle Partnership HB is a joint venture and reported in accordance with the equity method since none of the holding compa-nies, Volvo Cars PHEV Holding AB and Vattenfall PHEV Holding AB, has the decision-making power over the operation. Volvo Car Group and Vat-tenfall have together developed the world’s first diesel-powered hybrid car, which can be driven as an ordinary diesel car, as a hybrid, or as a fully electric car. The car is available on the market since the first quarter of 2013. During 2014, V2 Plug-In Hybrid Vehicle Partnership HB provided a repayment of MSEK 176 (99) to Volvo Cars PHEV Holding AB. Prior year, V2 Plug-In Hybrid Vehicle Partnership HB received a shareholders’ contribution of MSEK 14 from Volvo Cars PHEV Holding AB.
2,3,4) Daqing Volvo Car Manufacturing Co., Ltd, Zhangjiakou Volvo Car Engine Manufacturing Co., Ltd and Shanghai Volvo Car Research and Development Co., Ltd are classified as joint ventures and reported in accordance with the equity method since the shareholders, Volvo Cars (China) Investment Co., Ltd, Shanghai Geely Zhaoyuan International Investment Co., Ltd and Zhejiang Geely Holding Group Co., Ltd have joint control over these China operation companies according to IFRS 11 – Joint arrangements.
2) The principal activity of the Daqing Volvo Car Manufacturing Co., Ltd is car manufacturing for the Chinese market. During 2014 Daqing Volvo Car Manufacturing Co., Ltd acquired Kaixuan Automobile Parts Manufacturing (Daqing) Co., Ltd from Zhejiang Geely Holding Group Co., Ltd and Shanghai Geely Zhaoyuan International Investment Co., Ltd and incorpo-rated the newly established Daqing Fengwo Car Distribution Co., Ltd as wholly owned subsidiaries. In 2014, the Daqing Volvo Car Manufacturing Co., Ltd received a shareholder contribution of MSEK 452 (133).
3) The principal activity of the Zhangjiakou Volvo Car Engine Manufacturing Co., Ltd is to produce engines for Volvo’s Chinese produced cars. Prior year, the Zhangjiakou Volvo Car Engine Manufacturing Co., Ltd received a shareholder contribution of MSEK 387.
4) In January 2014, Shanghai Volvo Car Research and Development Co., Ltd was established and thereby became the third joint venture company with the same set-up as Daqing Volvo Car Manufacturing Co., Ltd and Zhangjiakou Volvo Car Engine Manufacturing Co., Ltd. The purpose of the new joint venture is to engage in services supporting the production and sales of Volvo cars in China. In 2014, Shanghai Volvo Car Research and Development Co., Ltd received a shareholder contribution of MSEK 49.
5) Volvo Car Group holds 10 per cent of the equity shares of Volvofinans Bank AB and due to significant volume transactions and board represen-tation, Volvo Car Group exercises significant influence on the operations which qualifies for the use of the equity method.
6) In July 2014, the joint venture company VH System AB was established between Volvo Cars subsidiary Volvo Car Sverige AB and Volvohandlar-föreningen Ekonomiska förening. The purpose is to formalise a future strategy for the commonly owned Dealer Management Systems devel-oped and maintained by the Volvo Car Sverige AB’s subsidiary Volvo Car Retail Solutions AB. VH System AB is reported in accordance with the equity method since none of the holding companies has the decision-making power over the operation. In September 2014, VH System AB received an unconditional shareholder’s contribution of MSEK 18 from Volvo Car Sverige AB.
The share of voting power corresponds to holdings in per cent as per above. All of the above joint ventures and associates are accounted for using the equity method in these consolidated financial statements. For practical reasons, some of the joint ventures and associates are included in the consolidated financial statements with a certain time lag, normally one month.
GEELY SWEDEN AB | ANNUAL REPORT 2014 59ANNUAL REPORT 2014 | GEELY SWEDEN AB
NOTES TO THE CONSOLIDATED FINANCIAL STATEMENTS

The following tables present summarised financial information for the Volvo Car Group’s material joint ventures and associates
V2 PlugIn Hybrid Vehicle Partnership HB1)
Daqing Volvo Car Manufacturing Co., Ltd2) 9)
Zhangjiakou Volvo Car Engine Manufacturing Co., Ltd3) Volvofinans Bank AB5)10)
Summarised balance sheets 2014 2013 2014 2013 2014 2013 2014 2013
Percentage voting/ownership 50 50 30 30 30 30 10 10
Non-current assets 423 495 2,473 — 719 6 24,873 23,994
Cash and cash equivalents 44 71 1,367 337 669 1,289 1,785 2,586
Other current assets 43 124 893 107 908 180 2,641 3,283
Total assets 510 690 4,733 444 2,296 1,475 29,299 29,863
Equity7) 454 628 1,723 444 1,565 1,274 3,427 3,385
Non-current liabilities7) 8) 49 46 610 — 5 — 24,148 24,887
Current liabilities8) 7 16 2,400 — 726 201 1,724 1,591
Total equity and liabilities 510 690 4,733 444 2,296 1,475 29,299 29,863
7) Equity and Non-current liabilities are adjusted with the portion of untaxed reserves where appropriate.8) In Daqing Volvo Car Manufacturing Co., Ltd the non-current liability is a financial liability and the current liabilities
includes a financial liability of MSEK 1,071 (0).9) Year 2014 includes the consolidated figures from Daqing Volvo Car Manufacturing Co., Ltd and it’s subsidiary
Kaixuan Automobile Parts Manufacturing (Daqing) Co., Ltd. 10) Volvofinans Bank AB’s equity share in the Volvo Car Group is included with a time lag of one month.
V2 PlugIn Hybrid Vehicle Partnership HB1)
Daqing Volvo Car Manufacturing Co., Ltd2) 9)
Zhangjiakou Volvo Car Engine Manufacturing Co., Ltd 3) Volvofinans Bank AB5)
Summarised income statements 2014 2013 2014 2013 2014 2013 2014 2013
Net sales 256 372 762 — 1,066 53 3,887 3,724
Profit/loss from continuing operations11) 170 230 –215 –1 56 –15 1,007 215
Profit (loss) for the year 170 230 –215 –1 56 –15 1,007 215
Other comprehensive income for the year — — — — — — — —
Total comprehensive income for the year 170 230 –215 –1 56 –15 1,007 215
Dividends received from the associates during the year — — — — — — 22 5
11) In V2 Plug-In Hybrid Vehicle Partnership HB the profit for the year includes depreciation of MSEK 73 (73).11) In Daqing Volvo Car Manufacturing Co., Ltd the loss for the year includes depreciation of MSEK 67 (0),
interest income of MSEK 6 (1), interest expense of MSEK 57 (0) and tax income of MSEK 78 (0).11) In Zhangjiakou Volvo Car Engine Manufacturing Co., Ltd the profit for the year includes depreciation of MSEK 24 (0),
interest income of MSEK 6 (0) and tax expense of MSEK 19 (prior year; tax income of MSEK 5)
Reconciliation of the summarised financial information presented to the carrying amount of its interest in joint ventures.
V2 PlugIn Hybrid Vehicle Partnership HB1)
Daqing Volvo Car Manufacturing Co., Ltd2) 9)
Zhangjiakou Volvo Car Engine Manufacturing Co., Ltd 3)
Reconciliation of summarised financial information 2014 2013 2014 2013 2014 2013
Net asset of the joint venture 454 628 1,723 444 1,565 1,274
Proportion of the Group's ownership in the joint venture 50 % 50 % 30 % 30 % 30 % 30 %
Adjustments for differences in accounting principles –94 –88 — — — —
Other adjustments — — –36 — –70 —
Carrying amount of the Group´s interest in the joint venture 133 226 481 133 400 381
Significant restrictionsFor the Chinese joint ventures there are restrictions on the Volvo Car Group’s ability to access or use cash from these joint ventures, for more information on cash that is not available or with other limitations, see Note 22 – Marketable securities and cash and cash equivalents in the con-solidated financial statements.
60 GEELY SWEDEN AB | ANNUAL REPORT 2014
NOTES TO THE CONSOLIDATED FINANCIAL STATEMENTS

NOTE 15 – TAXES
Income tax recognised in income statement 2014 2013
Current income tax for the year –764 –833
Current income tax for previous years –31 15
Deferred taxes 255 680
Other taxes –116 –34
Total –656 –172
Information regarding current year tax expense compared to tax expense based on the applicable Swedish tax rate 2014 2013
Income before tax for the year 1,490 1,132
Tax according to applicable Swedish tax rate, 22 % –328 –249
Operating income/costs, non-taxable –36 –22
Other taxes, non-taxable –116 –34
Capital gains or losses, non-taxable — —
Effect of different tax rates –93 –90
Tax effect on deferred tax due to change of tax rate –3 –10
Revaluation of previously non-valued losses and other temporary differences –64 161
Other –16 72
Total –656 –172
Income tax recognised directly in equity 2014 2013
Deferred tax
Tax effects on group contributions 2,485 —
Tax effects on cash flow hedge reserve –251 3
Tax effect of remeasurement of provisions for post employment benefits –531 455
Tax effects on translation difference, hedge instruments of net investments in foreign operations –54 –28
Total 1,649 430
Specification of deferred tax assetsDec 31,
2014Dec 31,
2013
Goodwill arising from the purchase of the net assets of a business 102 333
Provision for employee benefits 1,340 769
Unutilised tax loss carry-forwards 3,008 4,067
Reserve for unrealised income in inventory 106 364
Provision for warranty 301 271
Other temporary differences –96 542
Total deferred tax assets 4,761 6,346
Netting of assets/liabilities –2,226 –4,181
Total deferred tax assets, net 2,535 2,165
Specification of deferred tax liabilitiesDec 31,
2014Dec 31,
2013
Fixed assets 5,740 5,873
Other temporary differences –177 67
Total deferred tax liabilities 5,563 5,940
Netting of assets/liabilities –2,226 –4,181
Total deferred tax liabillities, net 3,337 1,759
Deferred tax assets and deferred tax liabilities are offset when the item relates to income taxes levied by the same taxation authority on either the same taxable entity or different taxable entities which intend either to settle current tax liabilities and assets on a net basis, or to realise the assets and settle the liabilities simultaneously.
Deferred tax assets are only recognised in countries where Volvo Car Group expects to be able to generate corresponding taxable income in the future to benefit from tax reductions. Significant tax loss carry-forwards are related to countries with long or indefinite periods of utilisation, mainly Sweden and USA. Of the total MSEK 3,008 (4,067) recognised deferred tax assets related to tax loss carry-forwards, MSEK 2,228 (3,736) relates to Sweden with indefinite periods of utili-sation. MSEK 697 (288) relates to USA where tax loss carry-forwards are expected to be utilised before expiration date. The assessement is that Volvo Car Group will be able to generate sufficient income in the coming years to also utilise the remaining part of the recognised amounts.
Deferred tax assets are only accounted for to the extent there are taxable temporary differences or other factors that convincingly indicate there will be sufficient future taxable profit. The main part of losses carried forward is related to jurisdictions where temporary differences exceed losses carried forward and where periods of utili-sation are in definite.
Deferred tax that may arise on distribution of remaining unrestricted earnings of foreign subsidiaries has not been booked, hence they can be distributed free of tax or Volvo Car Group may consider them permanently reinvested in the subsidiaries.
Changes in deferred tax assets and liabilities during the reporting period
Dec 31, 2014
Dec 31, 2013
Net book value of deferred taxes at January 1 406 264
Deferred tax income/expense recognised through income statement 255 681
Change in deferred taxes recognised directly in equity –1,649 –430
Exchange rate impact 186 –109
Net book value of deferred taxes at December 31 –802 406
Deferred tax assets regarding tax loss carry-forwards are reported to the extent that realisation of the related tax benefit through future tax-able profits is probable also when considering the period during which these can be utilised, as described below. As of December 31, 2014, the recognised tax loss carry-forwards amounted to MSEK 12,216 (18,048). The tax value of these tax loss carry-forwards is reported as an asset. The final years in which the recognised loss carry-forwards can be utilised are shown in the following table.
Tax-loss carry-forwards; year of expirationDec 31,
2014Dec 31,
2013
Due date
2015 — —
2016 — —
2017 — —
2018 17 25
2019 — 18,023
2020– 12,199 —
Total 12,216 18,048
Significant tax loss carry forwards are related to countries with long or indefinite periods of utilisation. Of the total unused tax loss carry forwards, MSEK 0 (MSEK 0), relates to unused tax losses for which no deferred tax asset is recognised in the statement of financial position and it expires 2020.
GEELY SWEDEN AB | ANNUAL REPORT 2014 61ANNUAL REPORT 2014 | GEELY SWEDEN AB
NOTES TO THE CONSOLIDATED FINANCIAL STATEMENTS

NOTE 16 – INTANGIBLE ASSETS
Capitalised product development cost1) Software
Trademark and
goodwill2)Other intangible
assets3) Total
Acquisition cost
Balance at January 1, 2013 5,878 3,670 3,598 9,042 22,188
Additions 4,089 208 — — 4,297
Divestments and disposals –1 –41 — –184 –226
Effect of foreign currency exchange differences — 8 — –4 4
Balance at December 31, 2013 9,966 3,845 3,598 8,854 26,263
Additions 4,748 312 26 443 5,529
Divestments and disposals — –302 — 6 –296
Effect of foreign currency exchange differences — 13 — 23 36
Balance at December 31, 2014 14,714 3,868 3,624 9,326 31,532
Accumulated amortisation and impairment
Balance at January 1, 2013 –990 –2,232 — –3,300 –6,522
Amortisation expense –1,165 –265 — –1,263 –2,693
Divestments and disposals 1 45 — 184 230
Effect of foreign currency exchange differences — –9 — 2 –7
Balance at December 31, 2013 –2,154 –2,461 — –4,377 –8,992
Amortisation expense –1,374 –261 — –1,084 –2,719
Divestments and disposals — 301 — –6 295
Effect of foreign currency exchange differences — –15 — –3 –18
Balance at December 31, 2014 –3,528 –2,436 — –5,470 11,434
Net balance at December 31, 2013 7,812 1,384 3,598 4,477 17,271
Net balance at December 31, 2014 11,186 1,432 3,624 3,856 20,098
1) Volvo Car Group has capitalised borrowing costs related to product development of MSEK 192 (108). A capitalisation rate of 4,6 % (4,8 %) was used to determine the amount of borrowing costs eligible for capitalisation.
2) Of the total Net balance at December 31 2014, Goodwill amounts to MSEK 26 (0).3) Other intangible assets refers to licences, dealer network, patents and similar rights.
Intangible assets with indefinite useful lives, i.e. trademark, goodwill, and other intangible assets not yet ready for use, are tested for impair-ment annually as well as if there are any indications of need for impair-ment. Assets with definite useful lives are tested if there are any indications of need for impairment. An impairment test is made by calculating the recoverable value. If the recoverable value is less than the carrying value, the asset is writ-ten down to its recoverable value. The recoverable amounts are based on a discounted cash flow model, with Volvo Car Group as one single Cash Generating Unit. Assumption of future market share, market growth and Volvo Car Group’s expected performance in this environment is a basis for the valuation. Management’s business plan for 2015–2019 and volume programs for 2020–2023 are used as a basis for the calculation. The available future volume programs are considered in the calculation for increased precision. In the model, Volvo Car Group is expected to maintain stable efficiency over time and the estimates for the cash flows following the end of the planning period are based on the same growth rate and
cash flow as for the last year in the calculation onwards in perpetuity. The business plan and volume programs are an integral part of Volvo Car Group’s financial planning process and represents management’s best estimate of the economic conditions that will exist during the asset’s remaining lifetime. The business plan process builds on the historic and current financial performance and financial position of the company, i.e. assumptions for margin development, fixed cost and new investments are based on current year financials and balanced towards what is containable given the projection of exogenous factors. Exogenous factors as industry and segment volumes, exchange rates, raw material etc are based on external assessments from analyst com-panies and banks. A discount rate of 10.8 (11.1) per cent has been used. In 2014, the discounted cash flow exceeded the carrying amount and no impair-ment loss was recognised. A sensitivity test has been performed whether a negative adjustment of one percentage point to the margin development or in the discount rate would result in impairment. No impairment loss was recognised as a result of this test.
62 GEELY SWEDEN AB | ANNUAL REPORT 2014
NOTES TO THE CONSOLIDATED FINANCIAL STATEMENTS

NOTE 17 – TANGIBLE ASSETS
Buildings and land1), 2), 3)
Machinery and equipment1), 2) 3), 4)
Construction in progress
Assets under operating
leases5) Total
Aquisition cost
Balance at January 1, 2013 13,072 62,847 1,728 1,706 79,353
Additions 331 2,098 1,897 1,202 5,528
Divestments and disposals –696 –3,712 — –743 –5,151
Reclassifications 64 1,341 –1,405 — —
Effect of foreign currency exchange differences 45 293 — –3 335
Balance at December 31, 2013 12,816 62,867 2,220 2,162 80,065
Additions 75 4,244 3,186 1,106 8,611
Divestments and disposals –115 –2,275 — –970 –3,360
Reclassifications 70 702 –772 — —
Effect of foreign currency exchange differences 311 880 3 –4 1,190
Balance at December 31, 2014 13,157 66,418 4,637 2,294 86,506
Accumulated depreciation and impairment
Balance at January 1, 2013 –6,715 –45,278 — –216 –52,209
Depreciation expense –471 –3,772 — –202 –4,445
Divestments and disposals 620 3,597 — 148 4,365
Effect of foreign currency exchange differences –40 –191 — –2 –233
Balance at December 31, 2013 –6,606 –45,644 — –272 –52,522
Depreciation expense –457 –3,494 — –261 –4,212
Divestments and disposals 102 2,001 — 188 2,291
Effect of foreign currency exchange differences –174 –665 — –7 –846
Balance at December 31, 2014 7,135 –47,802 –352 –55,289
Net balance at December 31, 2013 6,210 17,223 2,220 1,890 27,543
Net balance at December 31, 2014 6,022 18,616 4,637 1,942 31,217
1) Buildings and land include finance leases of MSEK 34 (39) and Machinery and equipment includes finance leases of MSEK 7 (130). For further information regarding finance leases, see Note 8 – Leasing.
2) Depreciation expense include impairment loss of MSEK 2 (7). For further information regarding depreciations, see Note 10 – Depreciation and amortisation.3) Volvo Car Group has no mortgages in property, plant and equipment. For further information regarding pledged assets, see Note 28 – Pledged assets.4) Machinery and equipment includes capitalised borrowing costs of MSEK 94 (123). 5) Volvo Car Group has reclassified lease agreements with maturity less than one year from assets held under operating leases to inventory. The reclassification
has affected the Net balance as at December 31, 2014 by MSEK 2,738 (2,255).
NOTE 18 – OTHER NON-CURRENT ASSETSDec 31,
2014Dec 31,
2013
Receivables from related companies and group companies 10,799 —
Restricted cash 424 930
Endowment insurance for pensions 191 —
Rental deposition 32 27
Other non-current assets 201 120
Total 11,647 1,077
Change in other non-current assets during the year 2014 2013
Balance at January 1 1,077 734
Received group contribution 10,574 —
Change in restricted cash –506 424
Change in endowment insurance for pensions 191 —
Other changes 311 –81
Balance at December 31 11,647 1,077
For further information see Note 21 – Financial risks and financial instruments.
NOTE 19 – INVENTORIESDec 31,
2014Dec 31,
2013
Raw materials and consumables 142 130
Products in progress 2,181 2,118
Finished goods and goods in resale 12,045 12,168
Total 14,368 14,416
Of which value adjustment reserve: –221 –191
The cost of inventories recognised as an expense and included in cost of sales amounted to MSEK 105,316 (99,549).
The cost of inventories recognised as an expense includes MSEK 1 (50) in respect of write-downs of inventory to net realisable value.
During 2014, Volvo Car Group has reclassified lease agreements with maturity less than one year from assets held under operating leases to inventory. The reclassification has increased the inventory value by MSEK 2,738 (2,255).
GEELY SWEDEN AB | ANNUAL REPORT 2014 63ANNUAL REPORT 2014 | GEELY SWEDEN AB
NOTES TO THE CONSOLIDATED FINANCIAL STATEMENTS

Aging analysis of accounts receivable and receivables from related companies Not due
1–30 days
overdue
30–90 days
overdue>90 days
overdue Total
2014
Accounts receivable gross 6,636 486 143 799 8,064
Provision doubtful accounts receivable –2 –7 –18 –33 –60
Accounts receivable net 6,634 479 125 766 8,004
2013
Accounts receivable gross 4,782 242 15 651 5,690
Provision doubtful accounts receivable –8 — –29 –35 –72
Accounts receivable net 4,774 242 –14 616 5,618
Accounts receivable amounting to MSEK 8,004 (5,618) includes pro-vision for doubtful accounts receivable of MSEK 60 (72). The estab-lishment of credit loss provisions for accounts receivable is recognised as soon as it is probable that a credit loss has incurred. A credit loss has incurred when there has been an event that has triggered the customer’s inability to pay. As of December 31, 2014, the total credit loss reserves for account receivables amounted to 0.75 (1.28) per cent of total accounts receivable. The accounts receivable that are not yet due or subject to impairment are estimated to have high credit quality.
NOTE 21 – FINANCIAL RISKS AND FINANCIAL INSTRUMENTS
In its operations, Volvo Car Group is exposed to various types of finan-cial risks such as currency risk, interest rate risk, credit risk, commodity price risk, refinancing risk and liquidity risk.
Volvo Car Group treasury function is responsible for management and control of the financial risks, ensures that appropriate financing is in place through loans and committed credit facilities and manages the Group’s liquidity. The management of financial risks is governed by Volvo Car Group treasury policy which is approved by the Board of Directors and is subject to annual review. The policy is focused on minimising the negative effects from fluctuating financial markets on Volvo Car Group’s financial earnings. A monthly follow up of the treas-ury policy in form of a Group treasury monthly report is presented to the Audit Committee and distributed to the Board of Directors.
During the year, the Group treasury policy has been reviewed and amended. A more detailed policy on commercial credit risk has been decided and the requirement on short term liquidity has been increased. Volvo Cars shall always have committed back-up facilities or cash and marketable securities available corresponding to 10 (5) per cent of the net revenue. Furthermore, the time horizon for FX hedge activities has increased from fifteen months to twentyfour months starting January 1, 2015 and has not affected the hedges decribed below.
Currency riskThe currency exposure arises from the production in various countries, procurement and the mix of sales currencies and has a direct impact on the Volvo Car Group’s operating income, balance sheet and cash flow as well as the long-term competitiveness.
The currency risk is related to:• expected future cash flows from sales and purchase in foreign
currencies (transaction risk)• changes in value of loans and investments (translation risk)• net assets and liabilities of foreign subsidiaries (translation risk)
Transaction exposure riskThe currency transaction exposure risk is the risk that profitability is
negatively affected by changes in exchange rates. The sales to differ-ent markets in combination with purchases in different currencies determine the transaction exposure.
Sales to markets other than Sweden generate transaction expo-sure. For the majority of the sales the parent company’s invoices to national sales companies are in local currencies. The total currency inflow was distributed between EUR 21 (25) per cent, SEK 20 (19) per cent, CNY 21 (15) per cent, USD 12 (13) per cent, GBP 7 (6) per cent, RUB 3 (4) per cent and other currencies 16 (18) per cent. The major part of the production is in the plants in Sweden and Belgium at cost mainly in EUR and SEK. The total currency outflow was split into EUR 51 (47) per cent, SEK 30 (30) per cent, CNY 4 (5) per cent, JPY 4 (5) per cent and other currencies 11 (13) per cent.
Transaction exposure risk managementThe policy for transaction risk management states that up to 80 per cent of the future expected cash flows in the coming fifteen months can be hedged with adequate financial instruments: options, forwards or combined instruments with maturities matching expected timing of cash flows. Hedging of cash flows with maturity more than fifteen months requires a Board of Directors’ decision.
Change in provision for doubtful accounts receivable is as follows: 2014 2013
Balance at January 1 72 141
Additions 29 24
Reversals –29 –83
Write-offs –11 –10
Translation difference –1 —
Balance at December 31 60 72
NOTE 20 – ACCOUNTS RECEIVABLE AND OTHER CURRENT ASSETSDec 31,
2014Dec 31,
2013
Accounts receivable from non-group companies 5,777 5,062
Accounts receivable from related companies and group companies 2,227 556
VAT receivables 738 896
Prepaid expenses and accrued income 1,752 1,078
Other financial receivables 694 434
Other receivables1) 1,300 373
Total 12,488 8,399
1) Whereof receivables from group companies MSEK 719 (0).
64 GEELY SWEDEN AB | ANNUAL REPORT 2014
NOTES TO THE CONSOLIDATED FINANCIAL STATEMENTS

The currency exposure is expressed in terms of Cash Flow at Risk (CFaR), which is the maximum loss at a 95 per cent confidence level in one year. The CFaR is dependent on the cash flow forecast for the coming fifteen months, market volatility and correlations. The CFaR at year end for the cash flows in one year, excluding hedges, was approx-imately SEK 4 billion. Another way of expressing the currency sensitiv-ity in income and expenses in foreign currencies is to say that during 2014, a one per cent change in SEK against major currencies, exclud-ing currency hedges, has a net impact on operating income of approx-imately MSEK 190. A steering model with a benchmark level of CFaR is decided and a stipulated mandate to deviate from that benchmark is given to Group Treasury. The hedging strategy for the forecasted cash flows up to fifteen months is proposed by Group Treasury and approved by the CEO/CFO. The hedging strategy is expressed as a strategic hedge level in terms of currency exposure expressed as CFaR. Group Treas-ury is given a tactical mandate to deviate from the strategic hedge level. The hedging strategy shall be revised at least quarterly. Forward contracts and options are used to reduce the currency risk in expected future cash flows from sales and purchase in foreign currencies. At year end 21 (39) per cent of the forecasted cash flows in foreign currencies the coming fifteen months was hedged and during 2014 the average hedge level has been 29 (35) per cent. The transaction exposure in the Group, measured as Cash Flow at Risk (CFaR) based on fifteen months net cash flows, is reduced by 34 per cent as of end December 2014.
Hedge accountingHedge accounting is applied for cash flow hedging of currency risk and for net investment in foreign operations. Gains and losses on the effective portions of derivatives designated under cash flow hedge accounting and net investment in foreign operations are recognised in other comprehensive income.
The highly probable forecast transactions in foreign currencies that are hedged are expected to occur at various dates during the next fifteen months. Gains and losses recognised in the hedge reserve in equity on forward foreign exchange contracts as at December 31, 2014 are recognised in the income statement in the periods when the hedged forecast transaction affects the income statement.
Based on cash flow hedging portfolio, a one per cent change in the Swedish krona (SEK) against major currencies has a net impact of MSEK 170 on other comprehensive income.
The cash flow hedge reserve in shareholders’ equity as at Decem-ber 31, 2014 amounts to MSEK –955 (189) before tax. Due to the uncertainty in the political and economic situation in Russia, which had an impact on market conditions for the Volvo Car Group, has the short term forecasted sales in Russia been reduced. The consequence of this is that a significant part of the cash flows are no longer expected to occur and Volvo Car Group is thus over-hedged in ruble. This over-hedge is recognised in the income statement as inefficiency in cash flow hedges. The ineffectiveness in the cash flow hedges that has affected net income amounts to MSEK 181 (4). The hedge reserve for net investment in foreign operations as at December 31, 2014 amounts to MSEK –314 (–68) before tax. No ineffectiveness has affected net income for 2014 and 2013.
Maturities of cash flow hedges (forwards and call options), nominal amounts in millions, local currency
Maturity EUR USD GBP CNY RUB NOK AUD CHF CAD PLN TRY
0–6 months 204 –678 –194 –2,729 –3,978 –660 –36 –47 –36 –113 –25
7–12 months 45 –273 –69 –1,873 –500 –170 –5 –23 –11 –11 —
>12 months — — — — — — — — — — —
Total 249 –951 –263 –4,602 –4,478 –830 –41 –70 –47 –124 –25
The average duration of the portfolio was 4 (3) months. The fair value of the outstanding derivatives as at December 31, 2014 amounted to MSEK –802 (226).
Fair value of derivatives for cash flow hedging 2014 2013
Hedge reserve –955 189
Recognised in other comprehensive income –955 189
Time value in options –28 37
Ineffective contracts 181 —
Recognised in other operating income and expenses 153 37
Fair value of financial instruments for hedging of net investments of foreign operations
Hedge reserve –314 –68
Recognised in other comprehensive income –314 –68
Total fair value –1,116 158
Translation exposure riskTranslation risk in Volvo Car Group relates to the translation of net assets in foreign subsidiaries. This exposure can generate a positive or negative impact on Group earnings or change the value of equity.
EUR CNY GBP AUD USD Other Total
Investments in foreign operations (MSEK) 5,005 3,866 562 427 –97 1,374 11,137
Translation exposure 5,005 3,866 562 427 –97 1,374 11,137
A one per cent change in the Swedish krona against major currencies has a net impact of approximately MSEK 111.
Translation risk of assets and liabilities in foreign currencies related to the operations, as accounts receivable, trade payables and guaran-tee provisions, will generate an impact on the income statement in other operating income. All translation of assets and liabilities to credit institutions and intercompany loans and deposits are reflected in the financial income and expenses.
Translation exposure risk managementThe translation risk is primarily covered by matching the currency com-position of debt with the composition of assets. The translation risk management is managed on the following levels:• Exposure related to the translation effects on financial asset and
liabilities is managed via natural hedging or via financial derivatives.• Exposure related to translation effects on operational items in the
balance sheets is managed via financial derivatives and liquidity management.
Part of the investments in operations in the Euro zone is used for hedge accounting. The residual translation risk is part of the strategic risk management and is not hedged with financial instruments, the translation effect is recognised in other comprehensive income.
GEELY SWEDEN AB | ANNUAL REPORT 2014 65ANNUAL REPORT 2014 | GEELY SWEDEN AB
NOTES TO THE CONSOLIDATED FINANCIAL STATEMENTS

Total translation effect of net investments in foreign operations was MSEK 681 (–160). This effect does not impact the income statement but is recognised in other comprehensive income.
Volvo Car Group uses MEUR 420 of the MEUR 907 debt to reduce the translation exposure on net investments in EUR. The currency gains or losses from the translation of the net investments in opera-tions in EUR used for hedge accounting are recognised in other com-prehensive income.
The currency risk arising from the part of the external debt of MEUR 907 not used to hedge the net investments in EUR is managed by currency swaps. Currency gains or losses from the currency swaps are recognised in the income statement and offset the currency gains or losses from the residual part of the loan.
The translation effect arising from the external debt of MUSD 800 is naturally hedged by the translation effect on internal receivables in USD, the residual part of the loan is hedged by currency swaps, effects are recognised in the income statement.
Capital StructureVolvo Car Group treasury policy stipulates that the medium term objective is to have a capital structure that enables the company to deliver according to the requirements in the business plan. The longer term objective is to have a capital structure that enables investment grade rating; currently Volvo Car Group has no external rating. The equity ratio as per December 31, 2014 is 29.9 (28.1) per cent. Volvo Car Group defines capital as shareholders’ equity as at the balance sheet date amounted to MSEK 32,702 (24,638).
Funding and liquidity risk managementLong term fundingAll draw down on new loans is evaluated against future liquidity needs and investment plans. Volvo Car Group should for the coming twelve months at any given time have available committed financing for investments and maturing loans. To limit the risk of refinancing, debt maturing over the next twelve months should not exceed 25 per cent of total debt. Less than 50 per cent of the long term debt should be re-financeable within three years.
During the year, the second and third tranche of the USD funding were drawn which means that all long term funding facilities are now fully drawn, which is according to plan.
The outstanding amount of long term funding in Volvo Car Group as per year end 2014 was MSEK 15,110 (11,919). Remaining credit dura-tion of the outstanding facilities was 4.0 (4.8) years.
Outstanding loans are shown below.
Funding CurrencyNominal amount
(million) Maturity
Bank loan SEK 1,000 2016
Bank loan EUR 907 2020
Bank loan USD 800 2021
Loan Repayment Structure 2014 2015 2016 2017 2018 2019 2020 2021
2013 137 389 2,002 1,668 2,335 2,531 2,182 813
2014 146 425 2,158 2,080 3,003 3,333 2,991 1,683
In relation to all external loans there are information undertakings and covenants according to Loan Market Association (LMA) standards. These are monitored and calculated quarterly to fulfil the terms and conditions stated in the financial agreements. Covenants are based on standard ratios such as EBITDA and Net debt.
Liquidity risk managementLiquidity risk is the risk that Volvo Car Group is unable to meet ongoing financial obligations on time. In order to meet seasonal volatility in cash requirements, Volvo Car Group shall always have committed back up facilities or free cash available corresponding to 10 per cent or more of net revenue. The rolling twelve months cash flow forecasts are the basis for the risk assessment of the liquidity risk management.
In June 2014, Volvo Car Group signed a MEUR 660 revolving credit facility with a group of twelve leading global and regional banks. The MEUR 660 revolving credit facility replaces an existing MEUR 360 revolving credit facility signed early in 2013. It will serve as a back-up facility for general corporate purposes and has a tenor of three years with two extension options of one year each. The banks are well diver-sified and will form the core relationship bank group for Volvo Cars globally. During 2014, the facility has remained undrawn.
As at December 31, 2014, Volvo Car Group had committed back-up facilities and cash and marketable securities available of MSEK 21,469 (18,662), approximately 17 (15) per cent of net revenue. The liquidity of the Group is strong considering the maturity profile of the external borrowings, the balance of cash and cash equivalents and marketable securities at year end, and available back-up credit facili-ties from banks.
The following table presents the maturity structure of the Group’s financial assets and liabilities. The figures shown are contractual undiscounted cash flows based on contracted date, when the Group is liable to pay or eligible to receive, and includes both interest and nominal amounts.
Outstanding loans 2014Outstanding loans 2013
Million SEK equivalent
0
3,000
6,000
9,000
12,000
15,000
18,000
202120202019201820172016201520142013
Maturity profile of external loans
66 GEELY SWEDEN AB | ANNUAL REPORT 2014
NOTES TO THE CONSOLIDATED FINANCIAL STATEMENTS

Dec 31, 2014 Up to 1 year 1–5 years Over 5 years
Assets
Other non-current assets — 11,457 190
Total non-current financial assets — 11,457 190
Accounts receivable 8,004 — —
Derivative assets 665 — —
Other current assets1) 1,211 — —
Marketable securities 1,047 — —
Cash and cash equivalents 14,165 — —
Total current financial assets 25,092 — —
Total financial assets 25,092 11,457 190
Liabilities
Liabilities to credit institutions — 10,530 4,678
Other non-current liabilities1) — 1,236 8
Total non-current financial liabilities — 11,766 4,686
Liabilities to credit institutions 932 — —
Trade payables 14,434 — —
Derivative liabilities 1,171 5 —
Other current liabilities1) 5,604 — —
Total current financial liabilities 22,141 5 —
Total financial liabilities 22,141 11,771 4,686
1) Pre-payments, accruals, statutory recievables and liabilities are excluded as this table only includes financial assets and liabilities.
Interest rate risk managementChanges in the interest rate levels will impact Volvo Car Group’s net financial income/expense or the value of financial assets and liabili-ties. The return on cash and cash equivalents, short term investments and credit facilities are impacted by changes in the interest rates. The exposure can be either direct from interest rate bearing debt or indirect through leasing or other financing arrangements.
As at December 31, 2014, Volvo Car Group’s interest-bearing assets consisted of cash in the form of cash at bank, short term deposits and marketable securities. The average interest fixing term on these assets was less than one month. The average interest fixing term on outstanding loans was less than six months. The average cost of borrowing was 4.9 (4.8) per cent. A 100 basis points change in market interests would have an impact of MSEK 149 (93) on interest expenses.
According to the policy, the interest rate risk in Volvo Car Group’s net cash position has a benchmark duration of six months. The policy allows a deviation of –6/+3 months from the benchmark. At year end the duration was 5 (5) months.
Commodity price risk managementCommodity Price Risk is the risk that the cost of materials could increase as commodity prices rise in global markets. Changes in com-modity prices impact Volvo Car Group’s cash flow and earnings. In 2014, Volvo Car Group had cost for raw materials of approximately SEK 8 billion. Purchases of steel and resin accounted for the largest cost.
Commodity price risk is primarily managed through contracts with the suppliers using clauses or similar constructions and fixed prices with suppliers. A one per cent change in the prices of commodities has an impact on operating income of approximately MSEK 80.
Volvo Car Group manages the changes in prices for electricity by using forward contracts. The hedging is managed by Vattenfall Power Management AB on discretionary account with certain risk limits decided by Volvo Car Group.
Credit risk managementVolvo Car Group’s credit risk focuses mainly on counterparty risk in financial market transactions, investments of cash surplus and coun-terparty risk in connection with customer and dealer financing.
Financial counterpartiesThe maximum amount exposed to financial credit risk is the total of cash and cash equivalents MSEK 14,165 (15,372), investments in marketable securities MSEK 1,047 (88) and positive market value of outstanding derivative assets MSEK 665 (411). The maximum amount exposed to credit risk for financial instruments is best represented by their fair values, see table ‘Financial assets and liabilities by category’ in this note. Investments of cash surplus are made in the money and capital markets. All investments must meet the requirements of low credit risk and high liquidity. All counterparties used for investments and derivative transactions have credit rating A or better from one of the well-established credit rating institutions and ISDA agreements are in place with all counterparties used for derivative transactions which is required according to Volvo Car Group treasury policy. Limits are set and limit usage is followed up for the Volvo Car Group treasury counterparties and deposits are diversified between relationship banks. Subsidiaries’ bank balances are diversified in order to limit credit risk.
GEELY SWEDEN AB | ANNUAL REPORT 2014 67ANNUAL REPORT 2014 | GEELY SWEDEN AB
NOTES TO THE CONSOLIDATED FINANCIAL STATEMENTS

No financial assets and liabilities are offset in the balance sheet. Derivative contracts are subject to master netting agreements (ISDA) and the carrying amount of derivative assets that are not offset in the balance amount to MSEK 665 (411) and the carrying amount of the related derivative liabilities amount to MSEK –1,176 (–307). No collat-eral has been received or posted.
Dealers, importers and other counterpartiesFor the credit risk in customer and dealer financing, the objective is to have a sound and balanced credit portfolio and to engage in credit monitoring by means of detailed procedures which include follow-up and repossession. In cases where the credit risk is considered unsat-isfactory a letter of credit or other instruments are used. The maximum amount exposed to credit risk is the carrying amount of accounts receivable, see table ‘Financial assets and liabilities by category’ in this note. For quantification of credit risk in accounts receivable refer to Note 20 – Accounts receivable and other current assets.
Financial Instruments – ClassificationFinancial instruments are divided into three levels depending on the market information available.• Level 1: Level 1 inputs are quoted prices (unadjusted) in active mar-
kets for identical assets or liabilities that the entity can access at the measurement date.
• Level 2: Level 2 inputs are inputs other than quoted prices included within level 1 that are observable for the assets or liabilities, either directly or indirectly.
• Level 3: Level 3 inputs are unobservable inputs for the assets or liabilities.
All derivative financial instruments and marketable securities that Volvo Car Group holds as of December 31, 2014 belong to level 2. No transfers between the levels of the fair value hierarchy have occurred.
Fair value estimationFinancial assets and liabilities are measured at amortised cost or fair value depending on their initial classification. Fair value is defined as the price that would be received to sell an asset or paid to transfer a liability in an orderly transaction between market participants at the measurement date. Amortised cost is calculated using the effective interest method, where any premiums or discounts and directly attrib-utable costs and revenue are capitalised over the contract period using the effective interest rate. Valuation of financial instruments at fair value is done at quoted market prices. For instruments where no reliable price is available on the market, cash flows are discounted using the deposit/swap curve of the cash flow currency. For option instruments, the valuation is based on Black & Scholes formula.
The fair value of a financial asset or liability reflects non- performance risk including the counterparty’s credit risk for an asset and an entity’s own credit risk for a liability. For Volvo Car Group this only applies to derivatives and marketable securities since no other classes of assets and liabilities are recorded at fair value. Volvo Car Group has chosen to use Default Probability of the counterparty to adjust the positive mar-ket value on derivatives and marketable securities. Own credit risk is adjusted for by taking an average of the default probability of a peer group of car manufacturers.
The table below presents Volvo Car Group’s financial assets and liabilities that are measured at fair value.
December 31, 2014 Level 1 Level 2 Level 3 Total
Derivative instruments for hedging of currency risk in future commercial cash flows — 320 — 320
Derivative instruments for hedging of currency risk related to financial assets and liabilities — 339 — 339
Electricity derivatives — 6 — 6
Marketable securities — 1,047 — 1,047
Total assets — 1,712 — 1,712
Derivative instruments for hedging of currency risk in future commercial cash flows — 1,122 — 1,122
Derivative instruments for hedging of currency risk related to financial assets and liabilities — 24 — 24
Electricity derivatives — 30 — 30
Total liabilities — 1,176 — 1,176
December 31, 2013 Level 1 Level 2 Level 3 Total
Derivative instruments for hedging of currency risk in future commercial cash flows — 393 — 393
Electricity derivatives — 18 — 18
Marketable securities — 88 — 88
Total assets — 499 — 499
Derivative instruments for hedging of currency risk in future commercial cash flows — 167 — 167
Derivative instruments for hedging of currency risk related to financial assets and liabilities — 70 — 70
Electricity derivatives — 70 — 70
Total liabilities — 307 — 307
68 GEELY SWEDEN AB | ANNUAL REPORT 2014
NOTES TO THE CONSOLIDATED FINANCIAL STATEMENTS

Financial instruments at fair value through the income
statement
Financial assets and liabilities by category
Instruments held for trading
Derivatives used in hedge
accountingLoans and
receivables
Financial liabilities at amortised
cost Total Fair value
December 31, 2014
Other non-current assets — — 11,647 — 11,647 11,647
Accounts receivable — — 8,004 — 8,004 8,004
Derivative assets 583 82 — — 665 665
Other current assets1) — — 1,211 — 1,211 1,211
Marketable securities 1,047 — — — 1,047 1,047
Cash and cash equivalents — — 14,165 — 14,165 14,165
Total financial assets 1,630 82 35,027 — 36,739 36,739
Liabilities to credit institutions — — — 16,140 16,140 16,140
Other non-current liabilities1) — — — 1,244 1,244 1,244
Trade payables — — — 14,434 14,434 14,434
Derivative liabilities 138 1,038 — — 1,176 1,176
Other current liabilities1) — — — 5,604 5,604 5,604
Total financial liabilities 138 1,038 — 37,422 38,598 38,598
December 31, 2013
Other non-current assets1) — — 1,054 — 1,054 1,054
Accounts receivable — — 5,618 — 5,618 5,618
Derivative assets 58 353 — — 411 411
Other current assets1) — — 260 — 260 260
Marketable securities 88 — — — 88 88
Cash and cash equivalents — — 15,372 — 15,372 15,372
Total financial assets 146 353 22,304 — 22,803 22,803
Liabilities to credit institutions — — — 12,853 12,853 12,853
Other non-current liabilities1) — — — 792 792 792
Trade payables — — — 13,632 13,632 13,632
Derivative liabilities 143 164 — — 307 307
Other current liabilities1) — — — 3,460 3,460 3,460
Total financial liabilities 143 164 — 30,737 31,044 31,044
1) Pre-payments, accruals, statutory recievables and liabilities are excluded as this table only includes financial assets and liabilities.
The carrying amount essentially equals the fair value for all current items. For liabilities to credit institutions, the carrying amount is a good estimate of the fair value. The interest rates in existing loan agree-ments were on December 31, 2014 estimated to be in par with credit market interest rates, and the fair value therefore corresponds, in every significant respect, with the carrying amount.
For aging analysis regarding accounts receivable refer to Note 20 – Accounts receivable and other current assets. For aging analysis regarding liabilities to credit institutions refer to Note 26 – Other non-current liabilities. Trade payables are for the most part due within 60 days.
GEELY SWEDEN AB | ANNUAL REPORT 2014 69ANNUAL REPORT 2014 | GEELY SWEDEN AB
NOTES TO THE CONSOLIDATED FINANCIAL STATEMENTS

Dec 31, 2014 Dec 31, 2013
Nominal amounts and fair values of derivative instrumentsNominal amount Fair value
Nominal amount Fair value
Derivative instruments for hedging of currency risk related to financial assets and liabilities
Foreign exchange swaps
–receivable position1) 13,087 340 39 —
–payable position2) 2,251 –25 8,552 –70
Forward contracts
–receivable position1) 115 — — —
–payable position2) — — — —
Subtotal 15,453 315 8,591 –70
Derivative instruments for hedging of currency risk in future commercial cash flows
Foreign exchange swaps
–receivable position1) 1,154 131 6,643 111
–payable position2) 5,111 –385 5,968 –117
Forward contracts
–receivable position1) 1,681 187 13,203 215
–payable position2) 7,472 –456 3,904 –39
Currency options
–receivable position1) 67 1 8,915 67
–payable position2) 7,949 –280 853 –11
Subtotal 23,434 –802 39,486 226
Electricity derivatives
– receivable position1) –46 6 –104 18
– payable position2) 326 –30 422 –70
Subtotal 280 –24 318 –52
Total 39,167 –511 48,395 104
1) Financial instruments included in the balance sheet under other current assets.2) Financial instruments included in the balance sheet under other current liabilities
The table below shows how gains and losses as well as interest income and expenses have affected the income statement divided on the different categories of financial instruments.
Net gains/losses, interest income and expenses related to financial instruments 2014 2013
Recognised in operating income Gains/ losses
Interest income
Interest expenses
Gains/ losses
Interest income
Interest expenses
Financial assets and liabilities at fair value through the income statement
Derivative instruments for hedging of currency risk in future commercial cash-flows rerouted from the hedge reserve –676 — — 836 — —
Electricity derivatives 28 — — 22 — —
Loans and receivables
Accounts receivable/trade payables1) –173 — — –43 — —
Effect on operating income –821 — — 815 — —
Recognised in financial items
Financial assets and liabilities at fair value through the income statement
Derivative instruments for hedging of currency risk related to financial assets and liabilities 1,289 — — 195 — —
Marketable securities –11 6 — — — —
Loans and receivables
Cash and cash equivalents1) — 125 — — 83 —
Financial liabilities at amortised cost including currency effects1) –1,253 — –662 –106 — –438
Effect on financial items 25 131 –662 89 83 –438
1) The total income and expenses from items that are not measured at fair value through the income statement amounts to MSEK 125 (83) and MSEK –2,088
(–587) respectively.
70 GEELY SWEDEN AB | ANNUAL REPORT 2014
NOTES TO THE CONSOLIDATED FINANCIAL STATEMENTS

NOTE 22 – MARKETABLE SECURITIES AND CASH AND CASH EQUIVALENTS
Marketable securitiesDec 31,
2014Dec 31,
2013
Commercial papers 597 88
Time deposits in banks 450 —
Total 1,047 88
Marketable securities comprise of interest-bearing investments with a term of more than three months from acquisition date.
Cash and cash equivalentsDec 31,
2014Dec 31,
2013
Cash in banks 11,285 11,223
Time deposits in banks 2,405 4,149
Commercial papers1) 475 —
Total 14,165 15,372
1) Commercial papers which matures within three months of the date of
acquisition
Cash and Cash equivalents includes MSEK 863 (1,047) where limita-tions exist, mainly liquid funds where exchange controls or other legal restrictions apply. It is not possible to immediately use the liquid funds in other parts of Volvo Car Group, however there is normally no limita-tion for use in the Group’s operation in the respective country.
NOTE 23 – EQUITY
The share capital of Geely Sweden AB consists of 1,000,000,000 shares fully paid with a par value of 1 SEK and with voting rights of one vote per share.
The share premium relates to the business combination, through contribution in kind.
Other contributed capital consists of Group contribution from Geely Sweden Holdings AB and unconditional shareholders’ contribution from Shanghai Geely Zhaoyuan International Investment Co., Ltd. An unconditional shareholders’ contribution was initially received by Geely Sweden Holdings AB from Shanghai Geely Zhaoyuan International Investment Co., Ltd and was then given to Geely Sweden Automotive AB and thereafter to Geely Sweden AB.
The currency translation reserve comprises exchange rate differ-ences of hedge instruments of net investments in foreign operations and all exchange rate differences resulting from the translation of financial reports of foreign operations that have prepared their finan-cial reports in a currency other than Volvo Car Group’s reporting cur-rency. The parent company and Volvo Car Group present their financial reports in Swedish kronor (SEK).
The other reserve consist of the change in fair value of commercial cash flow hedging instruments in cases where hedge accounting is applied according to IAS 39, Financial Instruments: Recognition and Measurement.
Retained earnings comprises net income for the year and preceding years.
Total equity consists of the equity attributable to the owners of the parent company. At year end 2014, the Volvo Car Group’s total equity amounted to MSEK 32,702 (24,638).
Change in other reserves 2014 2013
Balance at January 1 147 138
Change in fair value of currency risk derivatives during the year –955 189
Currency risk contracts recognised in the income statement1) –189 –177
Tax attributable to items recognised in other comprehensive income 251 –3
Balance at December 31 –746 147
1) Included in the income statement under other operating income/expenses.
NOTE 24 – POST EMPLOYMENT BENEFITS
Volvo Car Group has various schemes for post-employment benefits, mainly relating to pension plans. Other benefits can in some locations include disability, life insurance and health benefits. Pension plans are classified either as defined contribution or defined benefit plans. Volvo Car Group has both defined contribution and defined benefit plans.
Defined contribution plansUnder a defined contribution plan, Volvo Car Group pays fixed contri-butions into a separate entity outside Volvo Car Group and will have no future financial obligations. The contributions are recognised as employee benefit expense in the income statement.
Defined benefit plansDefined benefit plans are all plans that are not classified as defined contribution plans. A defined benefit plan is a pension plan where the employee will receive a defined pension benefit upon retirement, usually dependent on factors such as age, years of service and com-pensation. Volvo Car Group has defined benefit plans for qualifying employees in some subsidiaries and the largest plans are in Sweden and Belgium.
SwedenIn Sweden, Volvo Car Group has five retirement plans of which three are funded. The largest plan overall is the Swedish ITP 2 plan which is a collectively agreed pension plan for white collar employees. ITP 2 is a final salary-based plan. For the defined benefit plans operated, Volvo Car Group has the obligation for the future benefits. Volvo Car Group’s defined benefit plans are secured in three ways: as a liability in the balance sheet, assets held in separate pension funds or funded through insurance payments. The “funded through insurance pay-ments” plans are defined benefit plans accounted for as defined con-tribution plans. These plans in Sweden are secured with the mutual insurance company Alecta.
The portion secured through insurance with Alecta refers to a defined benefit plan that comprises several employers and is reported according to a pronouncement by the Swedish Financial Reporting Board, UFR 10. For 2014, Volvo Car Group did not have access to the information to report it’s proportionate share of the plan’s obligations, assets under management and cost, that would make it possible to report this plan as a defined benefit plan. The ITP 2 pension plan, which is secured through insurance with Alecta, is therefore reported as a defined contribution plan. The Group estimates it will pay premiums of about MSEK 113 to Alecta in 2015. The Group’s share of the total saving premiums for ITP2 in Alecta as at December 31, 2014 amounted to 0,23% and the Group’s share of the total number of active policy holders amounted to 1,22 %.
GEELY SWEDEN AB | ANNUAL REPORT 2014 71ANNUAL REPORT 2014 | GEELY SWEDEN AB
NOTES TO THE CONSOLIDATED FINANCIAL STATEMENTS
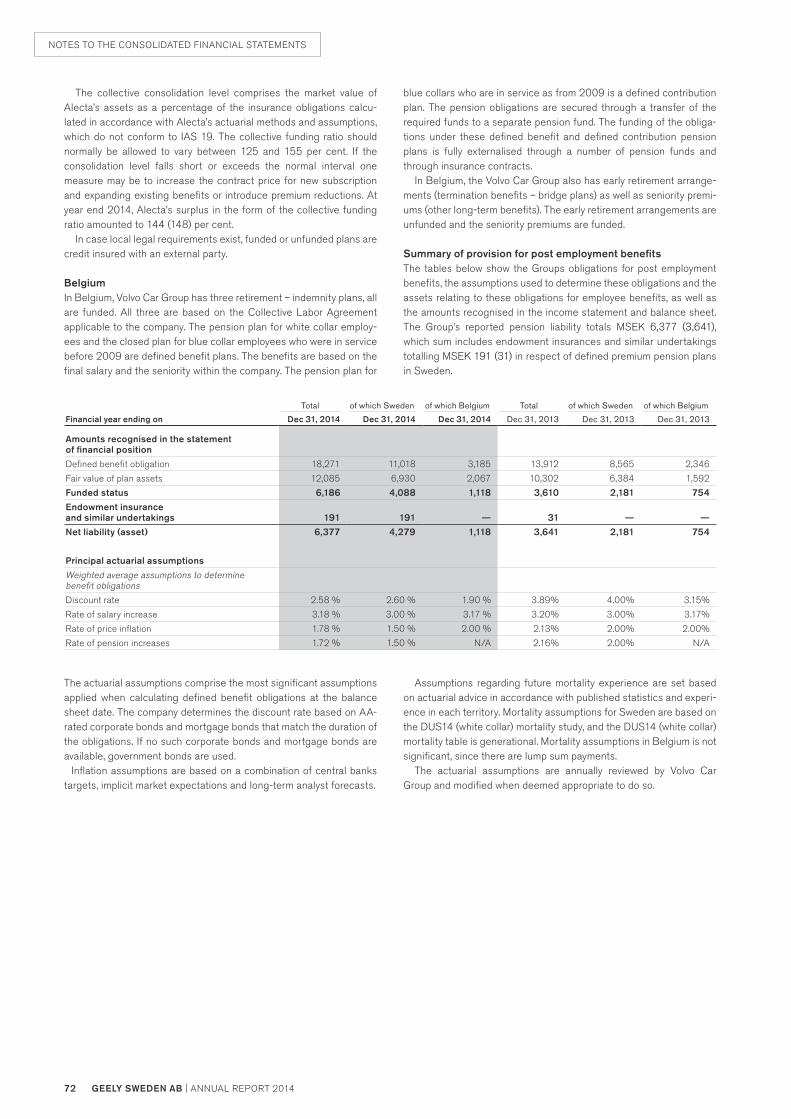
Total of which Sweden of which Belgium Total of which Sweden of which Belgium
Financial year ending on Dec 31, 2014 Dec 31, 2014 Dec 31, 2014 Dec 31, 2013 Dec 31, 2013 Dec 31, 2013
Amounts recognised in the statement of financial position
Defined benefit obligation 18,271 11,018 3,185 13,912 8,565 2,346
Fair value of plan assets 12,085 6,930 2,067 10,302 6,384 1,592
Funded status 6,186 4,088 1,118 3,610 2,181 754
Endowment insurance and similar undertakings 191 191 — 31 — —
Net liability (asset) 6,377 4,279 1,118 3,641 2,181 754
Principal actuarial assumptions
Weighted average assumptions to determine benefit obligations
Discount rate 2.58 % 2.60 % 1.90 % 3.89% 4.00% 3.15%
Rate of salary increase 3.18 % 3.00 % 3.17 % 3.20% 3.00% 3.17%
Rate of price inflation 1.78 % 1.50 % 2.00 % 2.13% 2.00% 2.00%
Rate of pension increases 1.72 % 1.50 % N/A 2.16% 2.00% N/A
blue collars who are in service as from 2009 is a defined contribution plan. The pension obligations are secured through a transfer of the required funds to a separate pension fund. The funding of the obliga-tions under these defined benefit and defined contribution pension plans is fully externalised through a number of pension funds and through insurance contracts.
In Belgium, the Volvo Car Group also has early retirement arrange-ments (termination benefits – bridge plans) as well as seniority premi-ums (other long-term benefits). The early retirement arrangements are unfunded and the seniority premiums are funded.
Summary of provision for post employment benefitsThe tables below show the Groups obligations for post employment benefits, the assumptions used to determine these obligations and the assets relating to these obligations for employee benefits, as well as the amounts recognised in the income statement and balance sheet. The Group’s reported pension liability totals MSEK 6,377 (3,641), which sum includes endowment insurances and similar undertakings totalling MSEK 191 (31) in respect of defined premium pension plans in Sweden.
The collective consolidation level comprises the market value of Alecta’s assets as a percentage of the insurance obligations calcu-lated in accordance with Alecta’s actuarial methods and assumptions, which do not conform to IAS 19. The collective funding ratio should normally be allowed to vary between 125 and 155 per cent. If the consolidation level falls short or exceeds the normal interval one measure may be to increase the contract price for new subscription and expanding existing benefits or introduce premium reductions. At year end 2014, Alecta’s surplus in the form of the collective funding ratio amounted to 144 (148) per cent.
In case local legal requirements exist, funded or unfunded plans are credit insured with an external party.
BelgiumIn Belgium, Volvo Car Group has three retirement – indemnity plans, all are funded. All three are based on the Collective Labor Agreement applicable to the company. The pension plan for white collar employ-ees and the closed plan for blue collar employees who were in service before 2009 are defined benefit plans. The benefits are based on the final salary and the seniority within the company. The pension plan for
The actuarial assumptions comprise the most significant assumptions applied when calculating defined benefit obligations at the balance sheet date. The company determines the discount rate based on AA-rated corporate bonds and mortgage bonds that match the duration of the obligations. If no such corporate bonds and mortgage bonds are available, government bonds are used. Inflation assumptions are based on a combination of central banks targets, implicit market expectations and long-term analyst forecasts.
Assumptions regarding future mortality experience are set based on actuarial advice in accordance with published statistics and experi-ence in each territory. Mortality assumptions for Sweden are based on the DUS14 (white collar) mortality study, and the DUS14 (white collar) mortality table is generational. Mortality assumptions in Belgium is not significant, since there are lump sum payments.
The actuarial assumptions are annually reviewed by Volvo Car Group and modified when deemed appropriate to do so.
72 GEELY SWEDEN AB | ANNUAL REPORT 2014
NOTES TO THE CONSOLIDATED FINANCIAL STATEMENTS
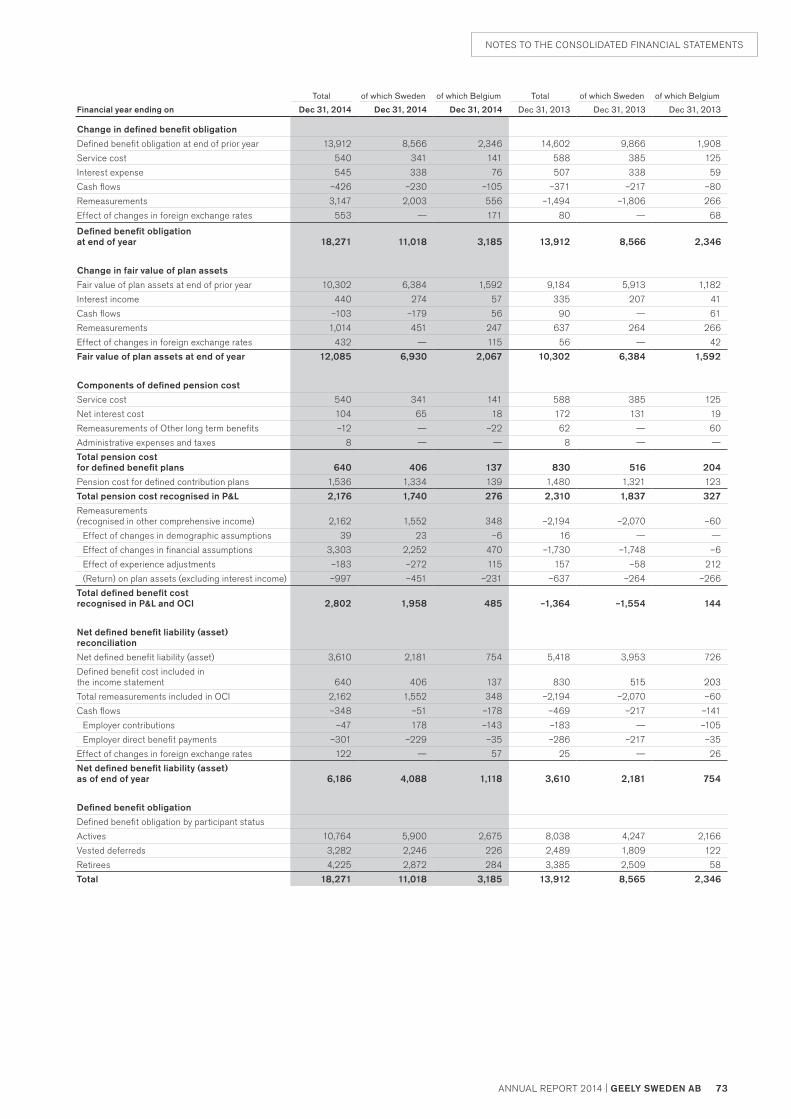
Total of which Sweden of which Belgium Total of which Sweden of which Belgium
Financial year ending on Dec 31, 2014 Dec 31, 2014 Dec 31, 2014 Dec 31, 2013 Dec 31, 2013 Dec 31, 2013
Change in defined benefit obligation
Defined benefit obligation at end of prior year 13,912 8,566 2,346 14,602 9,866 1,908
Service cost 540 341 141 588 385 125
Interest expense 545 338 76 507 338 59
Cash flows –426 –230 –105 –371 –217 –80
Remeasurements 3,147 2,003 556 –1,494 –1,806 266
Effect of changes in foreign exchange rates 553 — 171 80 — 68
Defined benefit obligation at end of year 18,271 11,018 3,185 13,912 8,566 2,346
Change in fair value of plan assets
Fair value of plan assets at end of prior year 10,302 6,384 1,592 9,184 5,913 1,182
Interest income 440 274 57 335 207 41
Cash flows –103 –179 56 90 — 61
Remeasurements 1,014 451 247 637 264 266
Effect of changes in foreign exchange rates 432 — 115 56 — 42
Fair value of plan assets at end of year 12,085 6,930 2,067 10,302 6,384 1,592
Components of defined pension cost
Service cost 540 341 141 588 385 125
Net interest cost 104 65 18 172 131 19
Remeasurements of Other long term benefits –12 — –22 62 — 60
Administrative expenses and taxes 8 — — 8 — —
Total pension cost for defined benefit plans 640 406 137 830 516 204
Pension cost for defined contribution plans 1,536 1,334 139 1,480 1,321 123
Total pension cost recognised in P&L 2,176 1,740 276 2,310 1,837 327
Remeasurements (recognised in other comprehensive income) 2,162 1,552 348 –2,194 –2,070 –60
Effect of changes in demographic assumptions 39 23 –6 16 — —
Effect of changes in financial assumptions 3,303 2,252 470 –1,730 –1,748 –6
Effect of experience adjustments –183 –272 115 157 –58 212
(Return) on plan assets (excluding interest income) –997 –451 –231 –637 –264 –266
Total defined benefit cost recognised in P&L and OCI 2,802 1,958 485 –1,364 –1,554 144
Net defined benefit liability (asset) reconciliation
Net defined benefit liability (asset) 3,610 2,181 754 5,418 3,953 726
Defined benefit cost included in the income statement 640 406 137 830 515 203
Total remeasurements included in OCI 2,162 1,552 348 –2,194 –2,070 –60
Cash flows –348 –51 –178 –469 –217 –141
Employer contributions –47 178 –143 –183 — –105
Employer direct benefit payments –301 –229 –35 –286 –217 –35
Effect of changes in foreign exchange rates 122 — 57 25 — 26
Net defined benefit liability (asset) as of end of year 6,186 4,088 1,118 3,610 2,181 754
Defined benefit obligation
Defined benefit obligation by participant status
Actives 10,764 5,900 2,675 8,038 4,247 2,166
Vested deferreds 3,282 2,246 226 2,489 1,809 122
Retirees 4,225 2,872 284 3,385 2,509 58
Total 18,271 11,018 3,185 13,912 8,565 2,346
GEELY SWEDEN AB | ANNUAL REPORT 2014 73ANNUAL REPORT 2014 | GEELY SWEDEN AB
NOTES TO THE CONSOLIDATED FINANCIAL STATEMENTS

Plan assetsOf which with a quoted
market price
Fair value of plan assets 2014 2013 2014 2013
Cash and cash equivalents 334 333 43 5
Equity instruments 2,054 2,262 1,365 931
Debt instruments 3,510 2,791 1,404 609
Real estate 64 9 — —
Investment funds 4,690 3,243 213 178
Other 1,433 1,664 489 308
Total 12,085 10,302 3,514 2,031
Responsibility for the management of the pension plans and retire-ment assets is the resonsibility of the Company and Volvo Personvag-nar’s pension fund. The pension fund is managed by a capital preser-vation strategy and the risk exposure is adjusted accordingly. The investments are long term and the distribution of assets ensures that investment portfolios are well diversified and corresponds to the vola-tility target determined by the trustees. Capital is managed in accord-ance with the guidelines approved by the investment policy of the pen-sion fund, said policy is reviewed and updated on a yearly basis. Continuous monitoring is done by the trustees on a monthly basis to ensure that capital is allocated and managed according to the guide-lines set forth. In Sweden, the minimum funding target is decided by PRI Pensionsgaranti, this is mandatory in order to stay in the system and receive insurance for the pension liability. The actual return on plan assets amounts to MSEK 1,454 (972).
RisksThere are mainly three categories of risks related to defined benefit obligations and pension plans. The first category relates to risks affecting the actual pension payments. Increased longevity and inflation of salary and pensions are the principle risks that may increase the future pension payments and hence, increase the pension obliga-tion. The second category relates to investment return. Pension plan assets are invested in a variety of financial instruments and are exposed to market fluctuations. Poor investment return may reduce the value of investments and render them insufficient to cover future pension payments. The final category relates to measurement and affects the accounting for pensions. The discount rate used for measuring the present value of the obligation may fluctuate which impacts the valuation of the defined benefit obligation. The discount rate also impacts the size of the interest income and expense that is reported in the financial items and the service cost. The risk related to pension obligations, i.e. mortality exposure, discount rate and inflation, are monitored on an ongoing basis.
Below is the sensitivity analysis for the main financial assumption and the potential impact on the present value of the defined benefit obliga-tion on the major plans.
Sensitivity analysis on defined benefit obligation Sweden Belgium
Discount rate +0,5% –1,166 –193
Discount rate –0,5% 1,265 205
The weighted average duration of the obligation is 22.9 years for Sweden and 12.5 years for Belgium.
NOTE 25 – CURRENT AND OTHER NON–CURRENT PROVISIONS
Warranties Service contractsOther sales generated
obligations Other provisions Total
Balance at January 1, 2014 4,694 3,082 3,774 2,081 13,631
Provided for during year 3,329 4,204 9,345 8,518 25,396
Utilised during year –3,162 –4,232 –9,062 –8,616 –25,072
Reversal of unutilised amounts –115 3 –54 –199 –365
Translational differences and other 129 227 439 526 1,321
Balance at December 31, 2014 4,875 3,284 4,442 2,310 14,911
Of which current 2,045 1,039 4,442 1,793 9,319
Of which non–current 2,830 2,245 — 517 5,592
WarrantiesWarranty provisions include the cost for the company of satisfying the customers with specific contractual warranty obligations, as well as other costs not covered by contractual commitments. The provision comprise of confirmed claims and estimated future obligations.
Service contractsVolvo Car Group is on some markets offering service contracts for customers, this is normally referred to as Extended Service Business. The customer sign up for regular services, paid for upfront or by monthly payments. The contracts can also be a marketing promotion.
Other sales generated obligationsProvisions for sales revenue generated obligations not effectuated at the closing date, all variable marketing programs.
Other provisionsOther provisions cover a wide range of identified risks and uncertain obligations such as incentive programmes.
For additional information regarding accounting principles for provi-sions, see Note 1 – Accounting principles and Note 2 – Critical accounting estimates and judgements.
74 GEELY SWEDEN AB | ANNUAL REPORT 2014
NOTES TO THE CONSOLIDATED FINANCIAL STATEMENTS

NOTE 26 – OTHER NON–CURRENT LIABILITIESDec 31,
2014Dec 31,
2013
Liabilities to credit institutions and finance lease contracts
Liabilities to credit institutions 15,110 11,919
Liabilities related to finance lease contracts 98 114
Total 15,208 12,033
Liabilities to credit institutionsLiabilities to credit institutions mature until 2021 (2021). The average cost of borrowing paid 2014 amounted to 4.9 (4.8) per cent. In 2014 the shares of Volvo Car Corporation were pledged for the liabilities to credit institutions of MSEK 14,110 (10,919).
Dec 31, 2014
Dec 31, 2013
Other non-current liabilities
Liabilities related to repurchase agreements 733 745
Deferred leasing revenue 357 420
Other liabilities 510 47
Total 1,600 1,212
Dec 31, 2014
Dec 31, 2013
Repayment structure of liabilities to credit institutions
1–5 years 10,432 8,924
Over 5 years 4,678 2,995
Total 15,110 11,919
Exposure of interest rate changes related to liabilities to credit institutions
6 months or less 15,110 11,919
Total 15,110 11,919
Dec 31, 2014
Dec 31, 2013
The carrying amounts, in MSEK, of Volvo Car Group’s liabilities to credit institutions are denominated in the following currencies:
EUR 7,943 7,973
USD 6,168 2,948
SEK 999 998
Total 15,110 11,919
Volvo Car Group has the following undrawn borrowing facilities:
Floating rate
Expiring within one year — 2,159
Expiring after one year but within five years 6,257 3,202
Total 6,257 5,361
NOTE 27 – OTHER CURRENT LIABILITIESDec 31,
2014Dec 31,
2013
Accrued expenses and prepaid income 7,425 5,624
Liabilities related to repurchase agreements 4,235 3,460
Personnel related liabilities 3,069 2,906
VAT liabilities 1,543 1,475
Hedging instruments 1,176 308
Deferred leasing revenue 473 549
Other liabilities 1,155 933
Total 19,076 15,255
NOTE 28 – PLEDGED ASSETSDec 31,
2014Dec 31,
2013
Shares in subsidiaries 19,488 14,844
Restricted cash 424 930
Inventory 277 486
Other pledged assets — 1
Total 20,189 16,261
NOTE 29 – CONTINGENT LIABILITIESDec 31,
2014Dec 31,
2013
Investment commitments in contractual manufacturer 182 266
Guarantees to insurance company FPG 123 116
Legal claims2) 166 113
Tax claims2) 252 —
Other contingent liabilities1) 53 70
Total 776 565
1) Apart from the above contingent liabilities, there are other commitments and guarantees that are not recognised since the likelihood of an outflow of resources is very low.
2) Legal proceedings and tax processes are further explained in Note 2 – Critical accounting estimates and judgements.
NOTE 30 – CASH FLOW STATEMENTS2014 2013
Adjustments for items not affecting cash flow consist of:
Capital gains/losses on sale of tangible and intangible assets 197 33
Share of income in joint ventures and associates –104 –179
Interest effect from the measurement of repurchase obligations –186 –197
Shareholders’ contribution to associates offset against invoiced services — –14
Other non-cash items –270 76
Total –363 –281
“Other” under cash flow from financing activitites is attributable to realised result from financial instruments.
GEELY SWEDEN AB | ANNUAL REPORT 2014 75ANNUAL REPORT 2014 | GEELY SWEDEN AB
NOTES TO THE CONSOLIDATED FINANCIAL STATEMENTS

MSEK Note 2014 2013
Other income 16 15
Gross income 16 15
Administrative expenses 3 –9 –13
Other operating income — 1
Other operating expenses –4 –2
Operating income 2,4 3 1
Financial income 5 190 30
Financial expenses 5 –83 –103
Income before tax 110 –72
Income tax 6 –23 14
Net income 87 –58
Other comprehensive income and net income are consistent since there are no items in other comprehensive income.
INCOME STATEMENTS AND COMPREHENSIVE INCOME – PARENT COMPANY
76 GEELY SWEDEN AB | ANNUAL REPORT 2014
PARENT COMPANY FINANCIAL STATEMENTS

MSEK Note Dec 31, 2014 Dec 31, 2013
ASSETSNon-current assetsParticipation in subsidiary 7 11,774 11,280
Deferred tax assets 6 — 175
Receivables from group companies 2 1,414 567
Other non-current assets — 2
Total non-current assets 13,188 12,024
Current assetsReceivables from group companies 2 18 26
Other current assets 11 11
Cash and cash equivalents 181 136
Total current assets 210 173
TOTAL ASSETS 13,398 12,197
EQUITY AND LIABILITIESEquity 7
Restricted equityShare capital (1,000,000,000 shares with par value of 1 SEK) 1,000 1,000
1,000 1,000Non-restricted equityShare premium reserve 5,509 5,509
Retained earnings 3,362 2,385
Net income 87 –58
8,958 7,836Total equity 9,958 8,836
Non-current liabilitiesOther non-current liabilities 1 1
Liabilities to group companies 2 3,425 3,342
Total non-current liabilities 3,426 3,343
Current liabilitiesCurrent provisions 2 3
Liabilities to group companies 2 4 —
Other current liabilities 8 15
Total current liabilities 14 18TOTAL EQUITY AND LIABILITIES 13,398 12,197
BALANCE SHEETS – PARENT COMPANY
GEELY SWEDEN AB | ANNUAL REPORT 2014 77ANNUAL REPORT 2014 | GEELY SWEDEN AB
PARENT COMPANY FINANCIAL STATEMENTS

Restricted equity Non-restricted equity
MSEK Share capital
Share premium
reserve
Other contributed
capitalRetained earnings Total
Total equity
Balance at January 1, 2013 1,000 5,509 2,906 –814 7,601 8,601
Net income — — — –58 –58 –58
Transactions with ownersUnconditional shareholders’ contribution — — 293 — 293 293
Transactions with owners 293 293
Balance at December 31, 2013 1,000 5,509 3,199 –872 7,836 8,836
Net income — — — 87 87 87
Transactions with ownersGroup contribution1) — — — 541 541 541
Unconditional shareholders’ contribution — — 494 — 494 494
Transactions with owners — — 494 541 1,035 1,035
Balance at December 31, 2014 1,000 5,509 3,693 –244 8,958 9,958
1) Group contribution before tax amounted to MSEK 693.
CHANGES IN EQUITY – PARENT COMPANY
STATEMENT OF CASH FLOWS – PARENT COMPANYMSEK Note 2014 2013
OPERATING ACTIVITIESOperating income 3 1
Adjustments for items not affecting cash flow 9 2 5
5 6
Movements in working capitalChange in current assets 15 28
Change in accounts payable — –1
Change in provisions 2 4
Change in other working capital liabilities –9 –9
Cash flow from movements in working capital 8 22Cash flow from operating activities 13 28
MSEK Note 2014 2013
INVESTING ACTIVITIESGiven shareholders’ contribution 2 –494 –293
Cash flow from investing activities –494 –293Cash flow from operating and investing activities –481 –265
FINANCING ACTIVITIESReceived shareholders’ contribution 2 494 293
Cash flow from financing activities 494 293Cash flow for the year 13 28
Cash and cash equivalents at beginning of year 136 110Exchange difference on cash and cash equivalents 32 –2
Cash and cash equivalents at end of year 181 136
78 GEELY SWEDEN AB | ANNUAL REPORT 2014
PARENT COMPANY FINANCIAL STATEMENTS

NOTE 1 – ACCOUNTING PRINCIPLES
The parent company has been prepared in compliance with Swedish Annual Accounts Act and Recommendation RFR 2, Accounting for legal entities of the Swedish Financial Reporting Board. RFR 2 implies that the parent company in the Annual Report of a legal entity shall apply all International Financial Reporting Standards and interpreta-tions approved by the EU as far as this is possible within the framework of the Annual Accounts Act and taking into account the connection between reporting and taxation. The operation of the parent company consist for the most part of share ownership in Group companies and financing. Volvo Car Group’s accounting principles apply except for the following areas:
Income taxesDue to the relationship between accounting and taxation, the deferred tax liability on untaxed reserves are included in the untaxed reserves.
Shares in subsidiariesThe shares in subsidiaries are accounted for according to the acquisition cost method. Acquisition related costs directly attributable to the acquisition are capitalised as part of the participation in Geely Sweden AB. Investments are carried at cost and dividends are accounted for in the income statement. An impairment test is per-formed annually and write-downs are made when permanent decline in value is established.
NOTE 2 – related parties
During the year, the parent company entered into the following transactions with related parties:
Part of sales to related parties Part of purchases from related parties
2014 2013 2014 2013
Companies within the Volvo Car Group 100 % 100 % 24 % 71 %
Receivables from Liabilities to
2014 2013 2014 2013
Companies within the Volvo Car Group 738 592 3,429 3,342
Geely Sweden Holdings AB 694 1 — —
whereof short-term 17 26 4 —
1,432 593 3,429 3,342
NOTES TO THE parent company FINANCIAL STATEMENTSAll amounts are in MSEK unless otherwise stated. Amounts in brackets refer to the preceding year.
Financial assetsFinancial assets are carried at cost. Impairment tests are conducted annually and impairment losses are recognised if it is likely that a decline in value is permanent.
Transaction costs directly attributable to the acquisition of Volvo Car Corporation in 2010 have been accounted for as an increase in the carrying amount of the shares.
EquityIn accordance with the Swedish Annual Accounts Act, the equity is split between restricted and non-restricted equity.
Shareholders’ contributionShareholders’ contributions are recognised in shares in subsidiaries and as such they are subject to impairment testing.
Of the total receivables from related parties, MSEK 1,432 (593) is due within five years. Of the total liabilities to related parties MSEK 3,425 (3,342) is due within five years.
Business transactions between the parent company and related parties all arise in the normal course of business and are conducted on the basis of arm’s length principles.
During 2014, the company has received an unconditional share-holders’ contribution from Geely Sweden Automotive AB amounting to MSEK 494 (293). The contribution was initially received by Geely
Sweden Holdings AB from Shanghai Geely Zhaoyuan International Investment Co., Ltd and was then given to Geely Sweden Automotive AB, thereafter to Geely Sweden AB and then finally to Volvo Car Cor-poration, as an unconditional shareholders’ contribution.
Volvo Car Group does not engage in any transactions with Board members or senior executives except remunerations for services. For further information regarding remunerations, see Note 9 – Employees and remuneration in the consolidated statements.
GEELY SWEDEN AB | ANNUAL REPORT 2014 79ANNUAL REPORT 2014 | GEELY SWEDEN AB
NOTES TO THE PARENT COMPANY FINANCIAL STATEMENTS

NOTE 3 – AUDIT FEES
SEK thousand 2014 2013
Deloitte
Audit fees –63 –84
Audit-related fees — –3
Other services –80 –327
Total –143 –414
Audit fees involve audit of the Annual report, financial accounts and the administration by the Board of Directors and the Managing Direc-tor. The audit also includes advice and assistance as a result of the observations made in connection with the audit.
Audit-related fees refer to other assignments to ensure quality in the financial statements including consultations on reporting require-ments and internal control.
All other work performed by the auditor is defined as other services.
NOTE 4 – REMUNERATION TO THE BOARD OF DIRECTORS
Information on remuneration to Board members by gender is shown in Note 9 – Employees and remuneration, in the consolidated statements.
NOTE 5 – FINANCIAL INCOME AND EXPENSES
2014 2013
Financial income
Interest income from subsidiaries 33 30
Net foreign exchange gain on financing activities 157 —
Total 190 30
Financial expenses
Interest expenses to subsidiaries –83 –96
Net foreign exchange loss on financing activities — –7
Total –83 –103
NOTE 6 – TAXES
Income tax recognised in income statement 2014 2013
Deferred taxes –23 14
Total –23 14
Information regarding current year tax expense compared to tax expense based on the applicable Swedish tax rate
Income before tax for the year 110 –72
Tax according to applicable Swedish tax rate, 22% –24 16
Additional deferred tax relating to previous years — –3
Other 1 1
Total –23 14
Total deferred tax asset MSEK 0 (175) relates to loss-carry forward. Deferred tax assets are only accounted for to the extent there are tax-able temporary differences or other factors that convincingly indicate there will be sufficient future taxable profit. The tax loss carry-forward has an indefinite period of utilisation.
NOTE 7 – PARTICIPATION IN SUBSIDIARYDec 31, 2014 Dec 31, 2013
At beginning of the year/acquired acquisition value 11,280 10,987
Shareholders’ contribution 494 293
Total 11,774 11,280
Geely Sweden AB’s investments in subsidiaries: Corp. ID no. Registered office No. of shares
% interest held
Book value Dec 31, 2014
Book value Dec 31, 2013
Volvo Personvagnar AB1) 556074-3089 Göteborg 1,000,000,000 100 11,774 11,280
Details of Volvo Car Corporation’s direct wholly owned subsidiares at the end of the reporting period are presented in below table.
Legal entity: Corp. ID no. Registered office% interest
held
Sweden
Volvo Bil i Göteborg AB 556056-6266 Gothenburg / Sweden 100
Volvo Car Australia Holding AB 556152-2680 Gothenburg / Sweden 100
Volvo Car Investment and Borrowing AB 556130-4246 Gothenburg / Sweden 100
Volvo Car NSC Holding AB 556754-8283 Gothenburg / Sweden 100
Volvo Car Overseas Corp AB 556223-0440 Gothenburg / Sweden 100
Volvo Car PHEV Holding AB 556785-9375 Gothenburg / Sweden 100
Volvo Car Real Estate and Assets 1 AB 556205-7298 Gothenburg / Sweden 100
Volvo Car Services 1 AB 556877-5778 Gothenburg / Sweden 100
Volvo Car Services 2 AB 556877-5760 Gothenburg / Sweden 100
Volvo Car Services 3 AB2) 556955-6441 Gothenburg / Sweden 100
Volvo Car Sverige AB3) 556034-3484 Gothenburg / Sweden 100
Volvo Personvagnar Norden AB 556413-4848 Gothenburg / Sweden 100
Volvo Car Center Uddevalla AB 556651-0193 Uddevalla / Sweden 100
Volvo Car Uddevalla AB 556232-0142 Uddevalla / Sweden 100
80 GEELY SWEDEN AB | ANNUAL REPORT 2014
NOTES TO THE PARENT COMPANY FINANCIAL STATEMENTS

1) Refered to as Volvo Car Corporation
The Executive Management has made the decision to create a coherent name structure globally in order to build the brand and corporate identity around Volvo Car. As a consequence some subsidiaries has changed name during the year. Below is the prior name stated.
2) Prior name: Goldcup 9397 AB3) Prior name: Volvo Personbilar Sverige AB4) Prior name: Volvo Auto Czech s.r.o.5) Prior name: Volvo Car Finland Auto Oy6) Prior name: Volvo Automobiles France SAS7) Prior name: Volvo Auto Polska Sp Z.o.o8) Prior name: Volvo Otomobil Ticaret Ltd
The share of voting power corresponds to holdings in per cent as per above. The countries where the subsidiaries are registered are also where their main operation is carried out.
Significant restrictionsFor some subsidiaries there are restrictions on the Volvo Car Group’s ability to access or use cash from these subsidiaries, for more informa-tion on cash that is not available or with other limitations, see Note 22 – Marketable securities and cash and cash equivalents in the consolidated financial statements.
NOTE 8 – PLEDGED ASSETSDec 31,
2014Dec 31,
2013
Shares in Volvo Car Corporation 11,774 11,280
Total 11,774 11,280
Pledged shares in subsidiaries per December 31, 2014 refer to a loan in Volvo Car Corporation.
NOTE 9 – CASH FLOW STATEMent
Adjustments for items not affecting cash flow consist of:
2014 2013
Non-cash items 2 5
2 5
Europe Registered office% interest
held
Volvo Car Austria GmbH Austria 100
Volvo Car Czech Republic s.r.o.4) Czech Republic 100
Volvo Car Denmark AS Denmark 100
Volvo Car Finland Oy Ab5) Finland 100
Volvo Car France SAS6) France 100
Volvo Car Germany GmbH Germany 100
Volvo Car Hellas Greece 100
Volvo Car Hungary Trading and Service Ltd Hungary 100
Volvo Car Ireland Ltd Ireland 100
Volvo Car Italia S.p.A Italy 100
Volvo Car Nederland B.V. The Netherlands 100
SNEBE Holding B.V. The Netherlands 100
SNITA Holding B.V. The Netherlands 100
SWENE Holding B.V. The Netherlands 100
Volvo Car Norway AS Norway 100
Volvo Car Poland Sp Z.o.o7) Poland 100
Volvo Car Portugal SA Portugal 100
Volvo Car Espana S.L Spain 100
Volvo Car Switzerland AG Switzerland 100
Volvo Car UK Ltd United Kingdom 100
North and South America
Volvo Car Brasil Importacao e Comercia de Veiculos Ltda Brazil 100
Volvo Car do Brasil Automoveis Ltda Brazil 100
Volvo Cars of Canada Corp. Canada 100
Volvo Auto de Mexico S.A de C.V Mexico 100
Volvo Car Financial Services US LLC USA 100
Volvo Cars of North America LLC USA 100
Africa and Asia
Volvo Cars (China) Investment Co., Ltd China 100
Volvo Cars Technology (Shanghai) Co., Ltd China 100
Volvo Auto India Pvt. Ltd India 100
Volvo Car Japan Ltd Japan 100
Volvo Car Korea Co., Ltd Korea 100
Volvo Car Manufacturing Malaysia Sdn Bhd Malaysia 100
Volvo Car Taiwan Ltd Taiwan 100
Volvo Car Turkey Otomobil Ltd Sirketi8) Turkey 100
Volvo Car Asia Pacific Ltd Singapore 100
Volvo Car South Africa Pty Ltd South Africa 100
GEELY SWEDEN AB | ANNUAL REPORT 2014 81ANNUAL REPORT 2014 | GEELY SWEDEN AB
NOTES TO THE PARENT COMPANY FINANCIAL STATEMENTS

PROPOSED DISTRIBUTION OF NET INCOME
Stockholm, March 19, 2015
Li Shufu Hans-Olov OlssonChairman of the board Board member
Carl-Peter Forster Li Donghui Board member Board member
Our audit report was submitted at March 19, 2015
Deloitte AB
Jan NilssonAuthorized Public Accountant
The parent companyThe following funds are at the disposal of Annual General Meeting (AGM):
Share premium reserve SEK 5,509,350,000
Shareholders’ contribution SEK 493,974,611
Net income brought forward SEK 2,867,854,998
Net income for the year SEK 87,358,745
At the disposal of the AGM SEK 8,958,538,354
The Board proposes the following allocations of funds:
Carried forward SEK 8,958,538,354
82 GEELY SWEDEN AB | ANNUAL REPORT 2014
PROPOSED DISTRIBUTION OF NET INCOME
AUDITOR’S REPORTTo the annual meeting of the shareholders of Geely Sweden AB Corporate identity number 556798-9966This is a direct translation of the Swedish Audit Report.
Report on the annual accounts and consolidated accounts We have audited the annual accounts and consolidated accounts of Geely Sweden AB for the financial year 2014-01-01 – 2014-12-31. The annual accounts and consolidated accounts of the company are included in the printed version of this document on pages 35–82.
Responsibilities of the Board of Directors for the annual accounts and consolidated accountsThe Board of Directors is responsible for the preparation and fair pres-entation of these annual accounts in accordance with the Annual Accounts Act and of the consolidated accounts in accordance with International Financial Reporting Standards, as adopted by the EU, and the Annual Accounts Act, and for such internal control as the Board of Directors determines is necessary to enable the preparation of annual accounts and consolidated accounts that are free from material misstatement, whether due to fraud or error.
Auditor’s responsibilityOur responsibility is to express an opinion on these annual accounts and consolidated accounts based on our audit. We conducted our audit in accordance with International Standards on Auditing and gen-erally accepted auditing standards in Sweden. Those standards require that we comply with ethical requirements and plan and perform the audit to obtain reasonable assurance about whether the annual accounts and consolidated accounts are free from material misstate-ment.
An audit involves performing procedures to obtain audit evidence about the amounts and disclosures in the annual accounts and con-solidated accounts. The procedures selected depend on the auditor’s judgement, including the assessment of the risks of material misstate-ment of the annual accounts and consolidated accounts, whether due to fraud or error. In making those risk assessments, the auditor consid-ers internal control relevant to the company’s preparation and fair presentation of the annual accounts and consolidated accounts in order to design audit procedures that are appropriate in the circum-stances, but not for the purpose of expressing an opinion on the effec-tiveness of the company’s internal control. An audit also includes evaluating the appropriateness of accounting policies used and the reasonableness of accounting estimates made by the Board of Direc-tors, as well as evaluating the overall presentation of the annual accounts and consolidated accounts.
We believe that the audit evidence we have obtained is sufficient and appropriate to provide a basis for our audit opinions.
OpinionsIn our opinion, the annual accounts have been prepared in accordance with the Annual Accounts Act and present fairly, in all material respects, the financial position of the parent company as of 31 Decem-ber 2014 and of its financial performance and its cash flows for the year then ended in accordance with the Annual Accounts Act. The consolidated accounts have been prepared in accordance with the Annual Accounts Act and present fairly, in all material respects, the
financial position of the group as of 31 December 2014 and of their financial performance and cash flows for the year then ended in accordance with International Financial Reporting Standards, as adopted by the EU, and the Annual Accounts Act. The statutory admin-istration report is consistent with the other parts of the annual accounts and consolidated accounts.
We therefore recommend that the annual meeting of shareholders adopt the income statement and balance sheet for the parent com-pany and the group.
Report on other legal and regulatory requirements In addition to our audit of the annual accounts and consolidated accounts, we have also audited the proposed appropriations of the company’s profit or loss and the administration of the Board of Directors of Geely Sweden AB for the financial year 2014-01-01 – 2014-12-31.
Responsibilities of the Board of DirectorsThe Board of Directors is responsible for the proposal for appropria-tions of the company’s profit or loss, and the Board of Directors is responsible for administration under the Companies Act.
Auditor’s responsibilityOur responsibility is to express an opinion with reasonable assurance on the proposed appropriations of the company’s profit or loss and on the administration based on our audit. We conducted the audit in accordance with generally accepted auditing standards in Sweden.
As a basis for our opinion on the Board of Directors’ proposed appropriations of the company’s profit or loss, we examined whether the proposal is in accordance with the Companies Act.
As a basis for our opinion concerning discharge from liability, in addition to our audit of the annual accounts and consolidated accounts, we examined significant decisions, actions taken and circumstances of the company in order to determine whether any member of the Board of Directors is liable to the company. We also examined whether any member of the Board of Directors has, in any other way, acted in contravention of the Companies Act, the Annual Accounts Act or the Articles of Association.
We believe that the audit evidence we have obtained is sufficient and appropriate to provide a basis for our opinions.
OpinionsWe recommend to the annual meeting of shareholders that the profit be appropriated in accordance with the proposal in the statutory administration report and that the members of the Board of Directors be discharged from liability for the financial year.
Gothenburg, March 19, 2015Deloitte AB
Signature on the Swedish original
Jan NilssonAuthorized Public Accountant
GEELY SWEDEN AB | ANNUAL REPORT 2014 83ANNUAL REPORT 2014 | GEELY SWEDEN AB
AUDITOR’S REPORT

board of directors
Chairman of the Board of Directors, Since August, 2010. Born 1963. MSc in mechanical engineering and BSc in Manage ment Engineering.
Other assignments: Founderand Chairman, Zhejiang GeelyHolding Group.
Chairman of the Board of Directors, Since August, 2010. Born 1963. MSc in mechanical engineering and BSc in Manage ment Engineering.
Other assignments: Founderand Chairman, Zhejiang GeelyHolding Group.
Member of the Board of Directors, since October 2013. Born 1957. Industrial economy.
Other assignments: Member of the Board in Ikano S.A., Tesco Plc and Lindengruppen AB.
Li Shufu
Li Shufu Mikael Ohlsson
Vice-Chairman of the Board of Directors, since August 2010. Born 1941. Master of Political Sciences, Honorary Doctorate in Economics.
Other assignments: Member of The Royal Swedish Academy of Engineering Sciences (IVA), Member of the Board, H.M. King Carl XVI Gustaf’s Foundation for Young Leadership.
Hans-Olov Olsson
Hans-Olov Olsson
Member of the Board of Directors, since April, 2011. Born 1970. MBA and Master of Management Engineering.
Other assignments: Board mem-ber of Zhejiang Geely Holding Group.
Li Donghui
Member of the Board of Directors, since January 2013. Born 1954. Economics, Aeronautical Engineering.
Other assignments: Chairman of the Board, ZMDi AG and Friedola Tech GmbH. Member of the Board, Geely Automobile Holdings, Gordon Murray Design Ltd., The Mobility House AG, Cosworth Group Holdings Ltd, IMI Plc and Rexam Plc.
Carl-Peter Forster
Member of the Board of Directors, since April, 2011. Born 1970. MBA and Master of Management Engineering.
Other assignments: CFO & Vice President, Zhejiang Geely Holding Group, Executive Director, Geely Automobile Holdings, Chairman of London Taxi Corporation.
Li Donghui
Member of the Board of Directors, since August 2010. Born 1956. Bachelor Degree in Commerce.
Other assignments: Senior Advisor of FA M, Member of the Board of Directors: G4S Plc., Kemira Oyj, Skandinaviska Enskilda Banken AB, HOPU Investments Co. Ltd.
Winnie Kin Wah Fok
BOARD OF DIRECTORS IN GEELY SWEDEN ABThe Board of Directors in Geely Sweden AB consists of four members.
BOARD OF DIRECTORS IN VOLVO CAR CORPOR ATIONVolvo Car Corporation is a subsidiary of Geely Sweden AB. The operational business is conducted in Volvo Car Corporation and its subsidiaries. During 2014, The Board of Directors of Volvo Car Corporation consisted of ten members.
84 GEELY SWEDEN AB | ANNUAL REPORT 2014
BOARD OF DIRECTORS

Member of the Board of Directors, since December 2010. Born 1966. PhD in Economics.
Other assignments: Regional Managing Director, North Asia, G4S Plc.
Dr. Peter Zhang
CEO and Member of the Board of Directors, since August 2010. Born 1951. MSc in Mechanical Engineering.
Håkan Samuelsson
Member of the Board of Directors, since January 2013. Born 1954. Economics, Aeronautical Engineering.
Other assignments: Chairman of the Board, ZMDi AG and Friedola Tech GmbH. Member of the Board, Geely Automobile Holdings, Gordon Murray Design Ltd., The Mobility House AG, Cosworth Group Holdings Ltd, IMI Plc and Rexam Plc.
Carl-Peter Forster
UNION REPRESENTAT IVES
Union representative in The Board of Directors appointed by IF Metall, since 2009.
Employed by Volvo Cars: 1974Born 1955
Union representative in The Board of Directors, appointed by IF Metall, Since 2006.
Employed by Volvo Cars: 1989Born 1965
Union representative in The Board of Directors, appointed by Unionen, Since 2010.
Employed by Volvo Cars: 1985Born 1964
Deputy union representative, appointed by IF Metall, since 2009.
Employed by Volvo Cars: 1981Born 1963
Deputy union representative, appointed by Akademikerna Volvo Cars, since 2008.
Employed by Volvo Cars: 1979Born 1954
Glenn Bergström Marko Peltonen Sören Carlsson Björn Ohlsson Magnus Sundemo
Member of the Board of Directors, since August 2010. Born 1953. PhD in technical sciences.
Other assignments: Chief Execu-tive Officer, M+W Group GmbH.
Dr. Herbert H. Demel
Member of the Board of Directors, since August 2010. Born 1960. MSc in Law and an MSc in Economics.
Other assignments: Vice Chairman and Audit Committee, SAXO Bank. Member of the Board and Audit Committee, Aker Solution ASA, Member of the Board and Chairman of the Audit Committee NKT A/S and Valmet Oy amo.
Lone Fønss Schrøder
BOARD OF DIRECTORS IN VOLVO CAR CORPOR ATION CONT.
GEELY SWEDEN AB | ANNUAL REPORT 2014 85ANNUAL REPORT 2014 | GEELY SWEDEN AB
BOARD OF DIRECTORS

executive management TEAM
E XECUTIVE MANAGEMENT TE AM IN VOLVO CAR CORPOR ATIONVolvo Car Corporation is managed by the Executive Management Team, (EMT) with eleven members, led by the CEO and overseen by the Board of Directors of Volvo Car Corporation. Besides from managing Volvo Car Corporation the Executive Management Team also set out the directions for the operations in the rest of the businesses in Volvo Cars.
President & CEO, since October, 2012.Born 1951. MSc in Mechanical Engineering.
Previous positions: Chairman & CEO, MAN AG. Executive Board Member Development/Production, Scania Group.
Chief Financial Officer, since August 2013.Born 1965. Master Degree of Finance.
Previous positions: Various positions within Finance, Volvo Cars.
Håkan Samuelsson
Senior Vice President Design, since July, 2012.Born 1964. Master of Arts.
Previous positions: Design Director of the Volkswagen Group Design Studio Potsdam. Design Director of Skoda Design.
Thomas Ingenlath
Hans Oscarsson
Senior Vice President, Volvo Cars China Operations, since March, 2013. Born 1949. B.A. in Mathematics and Computer Science.
Previous positions: Vice president, Volvo Cars Manufacturing Asia, Shanghai. General Manager, Volvo Cars Torslanda (VCT), Gothenburg. Vice President Manufacturing, Saab Automobile, Trollhättan.
Lars Danielson
Senior Vice President, Corporate Communications, since November, 2014. Born 1964. Degree in Combined Honours in French, English Literature and International Politics. Diploma in Business Administration.
Previous positions: Executive Vice President Communications at PSA Peugeot Citroën, several leading positions within the PSA Group, based in the UK, France, Belgium and Luxembourg.
Jonathan Goodman
Senior Vice President Group Legal and General Counsel, Since March 2012. Born 1964. Master of Law.
Previous positions: Legal Counsel, AB SKF. Lawyer, Senior Associate Mannheimer Swartling. Legal Counsel, SCA Hygine Products AB.
Maria Hemberg
86 GEELY SWEDEN AB | ANNUAL REPORT 2014
EXECUTIVE MANAGEMENT TEAM

E XECUTIVE MANAGEMENT TE AM IN VOLVO CAR CORPOR ATION CONT.
Senior Vice President, Purchasing & Manufacturing, since April, 2012. Born 1961. Master of Science.
Previous positions: Executive Vice President, Production & Logistics. Member of the Executive Board MAN Trucks & Bus, Munich, Germany. Senior Vice President, Chassis and Cab Production, Scania, Södertälje, Sweden. Managing Director, Scania Production Angers S.A.S., Angers, France.
Lars Wrebo
Senior Vice President Marketing, Sales and Customer Service, since July, 2013. Born 1963. Master of Business Administration.
Previous positions: Board member at Opel/Vauxhall. Chief Marketing Officer at GM Europe.
Alain Visser
Senior Vice President, Product Strategy & Vehicle Line Management, since January, 2011. Senior Vice President, Amaricas and President & CEO of VCNA, since January 2015. Born 1960. Automotive Business Management.
Previous Positions: President, Volvo Car Overseas Corp. Senior Vice President, Brand, Business & Product Strategy. Vice President Global Marketing, Volvo Cars, Gothenburg.
Lex Kerssemakers
Senior Vice President, Research & Development, since April, 2011. Born 1961. PhD in Production and Industrial Engineering.
Previous positions: Jaguar Cars Plc/Tata Motors India, Head of Corporate Quality. Member of the management board of Tata Automotive and Jaguar/Landrover Cars. Global Vehicle Line Executive, Compact Cars, General Motors.
Peter Mertens
Senior Vice President, Quality and Customer Satisfaction, since April 1, 2011. Born 1958. Master of Science in Mechanical Engineering.
Previous positions: Acting as Senior Vice President, Product Development, Senior Vice President, Quality and Customer Satisfaction, Volvo Cars. Executive Vice President, Aftersales Business Unit, Volvo Cars of North America.
Paul Welander
GEELY SWEDEN AB | ANNUAL REPORT 2014 87ANNUAL REPORT 2014 | GEELY SWEDEN AB
EXECUTIVE MANAGEMENT TEAM

INFORMATION AND CONTACT DEFINIT IONS
You are welcome to contact us:Nils Mösko, Vice President, Head of Investor Relations. [email protected], +46-(0)31-59 22 55.
For media queries, please contact: David Ibison, Global Head of Media Relations and Corporate [email protected], +46-(0)31-59 22 39.
Volvo Car Group Headquarters50400 – HA2SSE-405 31 Gothenburg, Swedenwww.volvocars.com
Comparative figures:The equivalent period is shown in brackets
Retail Sales:Sales to end customers
Equity ratio: Total equity divided by total assets
Net debt:Liabilities to credit institu-tions minus cash and cash equivalents and marketable securities
88 GEELY SWEDEN AB | ANNUAL REPORT 2014
DEFINITIONS

GEELY SWEDEN AB | ANNUAL REPORT 2014

IV
To be the world’s most progressive and desired premium car brand