volusia county, florida data report, february 2015 · deltona-daytona beach-ormond beach msa and...
TRANSCRIPT
Volusia County, FloridaDATA Report, February 2015

Table of contents
Section 1, Volusia County data • Volusia map and population projections section 1 - 1• demographic and income data section 1 - 2• population by age, 2014-2019 section 1 - 3• banks in Volusia County, September 5, 2014 section 1 - 4• top Volusia employers, November 2014 section 1 - 5• labor force: 2014 vs 2013 4th quarter comparison section 1 - 6• single family home sale prices - April-June 2014 section 1 - 7
Section 2, individual Volusia County city data • Daytona Beach/Daytona Beach Shores section 2 - 1• DeBary/DeLand section 2 - 2• Deltona/Edgewater section 2 - 3• Holly Hill/Lake Helen section 2 - 4• New Smyrna Beach/Oak Hill section 2 - 5• Orange City/Ormond Beach section 2 - 6• Pierson/Ponce Inlet section 2 - 7• Port Orange/South Daytona section 2 - 8• Volusia County versus all of Florida section 2 - 9• The United States section 2-10
Section 3, Volusia County workforce • Average wage by occupation, July 2014 section 3 - 1• 2014 average private sector wage by industry section 3 - 2• 2014 average private sector employment by industry section 3 - 3• private sector businesses by industry section 3 - 4 • labor force statistics, 4th quarter 2014 section 3 - 5• non-agricultural employment section 3 - 6• workers by reason of unemployment, all U.S., Aug. 2014 section 3- 7• 12 month median earnings, population 25 years + section 3- 8 • educational attainment, population 25 years and older section 3- 9• unemployment by education, all U.S., March 2014 section 3-10• hospitals in Volusia County section 3-11
UPDATED: These pages were updated in January 2015 to include available October, November and December 2014 information. Every effort is made to include the latest, most reliable statistics available. In some cases, the best data is released more than a year after the fact by our sources. Expected publication schedules are noted on the bot-tom of each data page.
This data has been compiled by Volusia County Economic Development for the use of anyone who might need research or planning data pertaining to the County of Volusia, Florida. The County assumes no liability for the correctness of the data shown or errors that may have occurred. Please advise us of any errors or incorrect data.
Published and updated by Volusia County Division of Economic DevelopmentDaytona Beach International Airport, 700 Catalina Drive, Suite 200, Daytona Beach, Florida 32114
Telephone: 386.248.8048 or 800.554.3801 Web: www.floridabusiness.org

Section 1: Volusia County dataVolusia map and population projections
Population and projected population growth, 2015 through 2040 2015 2020 2025 2030 2035 2040 Volusia County 507,700 530,500 550,500 567,200 580,900 592,700 Florida 19,750,600 21,141,300 22,434,000 23,601,100 24,639,500 25,583,200
Volusia County demographicsVolusia County, Florida, is bordered on the west by the historic St. Johns River, and by the Atlantic Ocean to the east. Roughly the size of Rhode Is-land, Volusia County is about 50 miles northeast of Orlando, 60 miles north of the Kennedy Space Center, and 90 miles south of Jacksonville. DeLand is the picturesque county seat of Volusia, and Daytona Beach is one of its best known cities.
Volusia has 16 cities: Daytona Beach, Daytona Beach Shores, DeBary, DeLand, Deltona, Edgewater, Holly Hill, Lake Helen, New Smyrna Beach, Oak Hill, Orange City, Ormond Beach, Pierson, Ponce Inlet, Port Orange and South Daytona.
For comprehensive information about Volusia County, visit volusia.org. For specific information and data about economic development, visit floridabusiness.org.
Volusia County population
497,145
State of Florida population
19,074,434
Source: University of Florida, Bureau of Economic and Business Research (BEBR), “Florida Population Studies “, Bulletin 165, March 2013”
Published and updated by Volusia County Division of Economic Development, www.floridabusiness.org
- Volusia County data: section 1-1 page updated February 2014 (new data anticipated on an annual basis)

Summary 2010 2014 2019population 494,593 502,340 515,219households 208,236 211,712 217,377families 130,386 131,435 134,060average household size 2.31 2.31 2.31owner-occupied housing units 150,443 145,120 148,049renter-occupied housing units 57,793 66,592 69,328median age 45.3 46.3 47.5
Trends by percent: 2014-2019 annual rate Volusia Florida U.S.population 0.51 % 1.06 % 0.73 %households 0.53 % 1.06 % 0.75 %families 0.40 % 0.95 % 0.66 %owner-occupied housing units 0.40 % 0.93 % 0.69 %median household income 3.74 % 3.16 % 2.74 %
Income 2014 2019median household income $41,769 $50,184average household income $56,792 $64,433per capita income $24,232 $27,458
Source: U.S. Census Bureau, Census 2010 Summary File 1. Esri forecasts for 2014 and 2019.
Demographic and income data: Volusia County
Published and updated by Volusia County Division of Economic Development, www.floridabusiness.org
- Volusia County data: section 1-2 page updated August 2014 (new data anticipated on an annual basis)

Population by age, Volusia County 2014-2019
by age: 0-4 5-9 10-14 15-19 20-24 25-34 35-44 45-54 55-64 65-74 75-85 85+ Source: U.S. Census Bureau, Census 2010 Summary File 1. Esri forecasts for 2014 and 2019.
80,000
70,000
60,000
50,000
40,000
30,000
20,000
10,000
Published and updated by Volusia County Division of Economic Development, www.floridabusiness.org
- Volusia County data: section 1-3page updated August 2014 (new data anticipated on an annual basis)
0
20000
40000
60000
80000
100000
■ 2014■ 2019

Banks in Volusia County, September 5, 2014
State/Federal offices depositsx$000 charter (Volusia) (Volusia)
SunTrust Bank State 28 $2,140,794Wells Fargo Bank, NA Federal 27 1,936,512Bank of America, NA Federal 22 1,669,145PNC Bank, NA Federal 15 450,935TD Bank, NA Federal 13 450,220Branch Banking and Trust Company State 10 350,464Regions Bank State 9 320,726Gateway Bank of Florida State 3 226,474Mainstreet Community Bank of Florida State 4 207,096Fifth Third Bank State 8 178,420Intracoastal Bank State 1 177,123Florida Community Bank, NA Federal 4 139,369Reunion Bank of Florida State 2 120,569JPMorgan Chase Bank, NA Federal 5 120,408Floridian Bank State 4 114,867Pinnacle Bank State 1 104,328Friends Bank State 3 102,222Prosperity Bank State 2 98,793Hancock Bank State 2 94,263Surety Bank State 2 93,963Florida Capital Bank, NA Federal 1 79,172Urban Trust Bank Federal 1 71,096CenterState Bank of Florida, NA Federal 3 64,418BankFIRST State 2 55,417TrustCo Bank Federal 2 49,038First Southern Bank State 1 39,048First Green Bank State 1 17,031Southern Commerce bank, NA Federal 1 4,435
28 total institutions in market 177 $9,476,346
Source: Federal Deposit Insurance Corporation (FDIC), Deposit Market Share Report by MSA. * Report updated as new data is available. Info above current as of September 5, 2014.
Published and updated by Volusia County Division of Economic Development, www.floridabusiness.org
- Volusia County data: section 1-4page updated September 2014 (new data anticipated on quarterly basis)

Top Volusia employers, November 2014
Business/organization Number of employees Type of businessVolusia County Schools 7,340 education
Halifax Health 4,090 healthcare
Volusia County Government 3,285 government
Florida Hospital – all divisions 3,834 healthcare
Publix Supermarkets, Inc. 3,046 grocery
State of Florida 2,661 grocery/retail
Wal-Mart Stores, Inc. 1,873 government
Daytona State College 1,558 education
Embry-Riddle Aeronautical University 1,465 education
U.S. Government 1,450 government
total employees 30,602
Source: Total labor force in Volusia County: 258,685 per Department of Economic Opportunity Local Area Unemployment Statistics. Note: The above list ranks the largest employers in the county by the number of workers employed. It is based on a telephone survey by Volusia County Economic Development to area businesses and organizations. Only companies responding to this survey are included on this listing.
Published and updated by Volusia County Division of Economic Development, www.floridabusiness.org
- Volusia County data: section 1-5page updated November 2014 (new data anticipated on an annual basis)
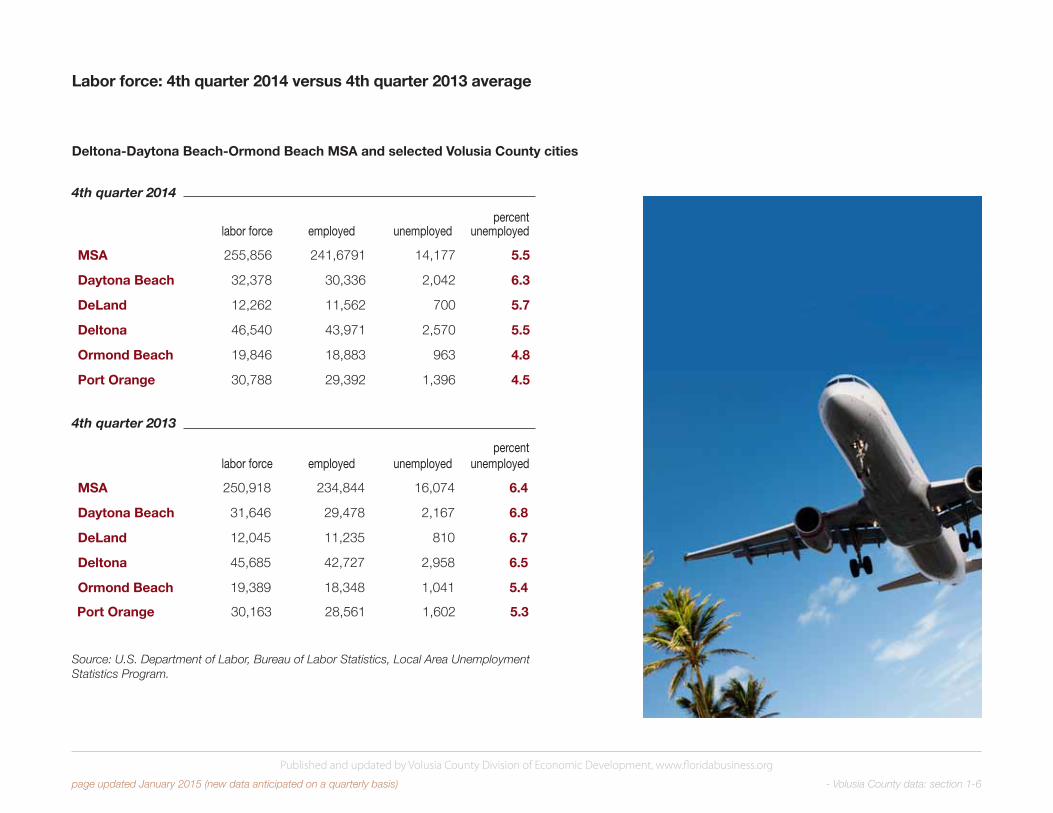
Labor force: 4th quarter 2014 versus 4th quarter 2013 average
Deltona-Daytona Beach-Ormond Beach MSA and selected Volusia County cities
4th quarter 2014 percent labor force employed unemployed unemployed
MSA 255,856 241,6791 14,177 5.5
Daytona Beach 32,378 30,336 2,042 6.3
DeLand 12,262 11,562 700 5.7
Deltona 46,540 43,971 2,570 5.5
Ormond Beach 19,846 18,883 963 4.8
Port Orange 30,788 29,392 1,396 4.5
4th quarter 2013 percent labor force employed unemployed unemployed
MSA 250,918 234,844 16,074 6.4
Daytona Beach 31,646 29,478 2,167 6.8
DeLand 12,045 11,235 810 6.7
Deltona 45,685 42,727 2,958 6.5
Ormond Beach 19,389 18,348 1,041 5.4
Port Orange 30,163 28,561 1,602 5.3
Source: U.S. Department of Labor, Bureau of Labor Statistics, Local Area Unemployment Statistics Program.
Published and updated by Volusia County Division of Economic Development, www.floridabusiness.org
- Volusia County data: section 1-6page updated January 2015 (new data anticipated on a quarterly basis)

Median single-family home sale prices, April through June, 2014
Source: National Association of Realtors
Deltona - Daytona Beach - Ormond Beach FL MSA
Philadelphia - Camden - Wilmington PA - NJ - DE - MD
Denver - Aurora CO
Los Angeles - Long Beach - Santa Ana CA
Boston - Cambridge - Quincy MA - NH
San Diego - Carlsbad - San Marcos CA
New York - Northern New Jersey - Long Island NY - NJ - PA
San Francisco - Oakland - Fremont CA
Honolulu HI
0 100000200000300000400000500000600000700000800000
$131,200
$227,200
$316,300
$420,300
$398,100
$504,200
$396,700
$769,600
$678,500
$0 $100,000 $200,000 $300,000 $400,000 $500,000 $600,000 $700,000
Published and updated by Volusia County Division of Economic Development, www.floridabusiness.org
- Volusia County data: section 1-7page updated October 2014 (new data anticipated on a quarterly basis)

The City of Daytona Beach 68.1 square miles 2010 census 2014 2019population 61,005 62,784 64,746households 27,314 28,119 29,042families 12,688 12,975 13,303average household size 2.05 2.05 2.05 owner-occupied housing units 12,583 11,820 12,122 renter-occupied housing units 14,731 16,298 16,920 median age 39.8 40.5 41.2 Trends: 2014 - 2019 annual rate area state nationalpopulation 0.62% 1.06% 0.73% households 0.65% 1.06% 0.75% families 0.50% 0.95% 0.66% owner-occupied households 0.51% 0.93% 0.69% median household income 3.36% 3.16% 2.74% median household income: 2014: $ 28,407 2019: $ 33,504 average household income: 2014: $ 40,929 2019: $ 47,135 Contact: City of Daytona Beach PlanningCity Hall, Room 240, 301 South Ridgewood Avenue, Daytona Beach, Florida 32114Telephone: 386.671.8120, web: codb.us
Source - U.S. Census Bureau, census 2010 Summary File 1. Esri forecasts for 2014 and 2019and Volusia County GIS
Section 2: Volusia County cities, Florida and U.S.– comparable dataVolusia County cities: Daytona Beach and Daytona Beach Shores
The City of Daytona Beach Shores 0.9 square miles 2010 census 2014 2019population 4,247 4,293 4,384households 2,428 2,456 2,506families 1,277 1,299 1,313 average household size 1.73 1.73 1.74 owner-occupied housing units 1,758 1,747 1,773renter-occupied housing units 670 709 733 median age 64.8 63.0 63.7 Trends: 2014 - 2019 annual rate area state nationalpopulation 0.42% 1.06% 0.73% households 0.40% 1.06% 0.75% families 0.21% 0.95% 0.66%owner-occupied households 0.30% 0.93% 0.69%median household income 3.46% 3.16% 2.74% median household income: 2014: $ 48,053 2019: $ 56,950 average household income: 2014: $ 67,688 2019: $ 77,215 Contact: City of Daytona Beach Shores, City Manager2990 South Atlantic Avenue, Daytona Beach Shores, Florida 32118Telephone: 386.763.5373, web: dbshores.org
Source - U.S. Census Bureau, census 2010 Summary File 1. Esri forecasts for 2014 and 2019 and Volusia County GIS
Published and updated by Volusia County Division of Economic Development, www.floridabusiness.org
- Volusia County data: section 2-1 page updated August 2014 (new data anticipated on an annual basis)

Volusia County cities: DeBary and DeLand
The City of DeLand 18.7 square miles
2010 census 2014 2019population 27,031 28,588 29,781households 10,746 11,368 11,855families 6,159 6,704 6,963average household size 2.29 2.32 2.32 owner-occupied housing units 6,033 6,301 6,524renter-occupied housing units 4,713 5,067 5,331 median age 39.1 40.6 41.4 Trends: 2014 - 2019 annual rate area state nationalpopulation 0.82% 1.06% 0.73% households 0.84% 1.06% 0.75% families 0.76% 0.95% 0.66% owner-occupied households 0.70% 0.93% 0.69%median household income 4.03% 3.16% 2.74% median household income: 2014: $36,442 2019: $44,393 average household income: 2014: $51,210 2019: $59,252 Contact: City of DeLand, Community Development Director120 South Florida Avenue, DeLand, Florida 32720Telephone: 386.626.7023, web: deland.org
Source - U.S. Census Bureau, census 2010 Summary File 1. Esri forecasts for 2014 and 2019 and Volusia County GIS
The City of DeBary 21.6 square miles 2010 census 2014 2019population 19,320 19,361 19,833households 8,065 8,085 8,273families 5,656 5,651 5,750average household size 2.38 2.37 2.37 owner-occupied housing units 6,901 6,600 6,736 renter-occupied housing units 1,164 1,484 1,537median age 47.8 48.4 49.8 Trends: 2014 - 2019 annual rate area state nationalpopulation 0.48% 1.06% 0.73% households 0.46% 1.06% 0.75% families 0.35% 0.95% 0.66% owner-occupied households 0.41% 0.93% 0.69%median household income 2.28% 3.16% 2.74% median household income: 2014: $54,621 2019: $61,126 average household income: 2014: $67,487 2019: $74,489 Contact: City of DeBary, City Manager,16 Colomba Road, DeBary, Florida 32713Telephone: 386.668.2040, web: debary.org
Source - U.S. Census Bureau, census 2010 Summary File 1. Esri forecasts for 2014 and 2019 and Volusia County GIS
Published and updated by Volusia County Division of Economic Development, www.floridabusiness.org
- Volusia County data: section 2-2 page updated August 2014 (new data anticipated on an annual basis)

Volusia County cities: Deltona and Edgewater
The City of Deltona 40.9 square miles 2010 census 2014 2019 population 85,182 85,842 87,393households 30,223 30,448 30,992families 23,046 23,070 23,370 average household size 2.81 2.81 2.81 owner-occupied housing units 24,623 23,936 24,185renter-occupied housing units 5,600 6,512 6,807 median age 37.8 38.8 39.2 Trends: 2014 - 2019 annual rate area state nationalpopulation 0.36% 1.06% 0.73% households 0.35% 1.06% 0.75%families 0.26% 0.95% 0.66% owner-occupied households 0.21% 0.93% 0.69%median household income 1.94% 3.16% 2.74% median household income: 2014: $48,418 2018: $53,311 average household income: 2014: $57,057 2018: $63,206
Contact: City of Deltona, City Manager2345 Providence Boulevard, Deltona, Florida 32725Telephone: 386.878.8850, web: ci.deltona.fl.us
Source - U.S. Census Bureau, census 2010 Summary File 1. Esri forecasts for 2014 and 2019and Volusia County GIS
The City of Edgewater 22.2 square miles
2010 census 2014 2019population 20,750 20,653 20,817 households 8,786 8,749 8,815 families 5,849 5,791 5,803 average household size 2.36 2.36 2.36 owner-occupied housing units 7,003 6,683 6,690 renter-occupied housing units 1,783 2,066 2,125 median age 46.4 47.9 48.9 Trends: 2014 - 2019 annual rate area state nationalpopulation 0.16% 1.06% 0.73% households 0.15% 1.06% 0.75%families 0.04% 0.95% 0.66% owner-occupied households 0.02% 0.93% 0.69%median household income 3.37% 3.16% 2.74% median household income: 2014: $42,428 2019: $50,070 average household income: 2014: $52,344 2019: $58,708 Contact: City of Edgewater, City Manager104 North Riverside Drive, Edgewater, Florida 32132Telephone: 386.424.2400, web: cityofedgewater.org
Source - U.S. Census Bureau, census 2010 Summary File 1. Esri forecasts for 2014 and 2019and Volusia County GIS
Published and updated by Volusia County Division of Economic Development, www.floridabusiness.org
- Volusia County data: section 2-3 page updated August 2014 (new data anticipated on an annual basis)

Volusia County cities: Holly Hill and Lake Helen
The City of Holly HIll 4.5 square miles 2010 census 2014 2019population 11,659 11,937 12,333 households 5,435 5,547 5,715 families 2,775 2,810 2,870 average household size 2.12 2.12 2.13 owner-occupied housing units 2,952 2,718 2,749 renter-occupied housing units 2,483 2,828 2,966 median age 44.3 44.2 43.8 Trends: 2014 - 2019 annual rate area state nationalpopulation 0.65% 1.06% 0.73% households 0.60% 1.06% 0.75%families 0.42% 0.95% 0.66% owner-occupied households 0.23% 0.93% 0.69%median household income 3.79% 3.16% 2.74% median household income: 2014: $29,416 2019: $35,422 average household income: 2014: $38,928 2019: $44,907 Contact: City of Holly Hill, Economic Development Director1065 Ridgewood Avenue, Holly Hill, Florida 32117Telephone: 386.248.9444, web: hollyhillfl.org
Source - U.S. Census Bureau, census 2010 Summary File 1. Esri forecasts for 2014 and 2019 and Volusia County GIS
The City of Lake Helen 4.6 square miles 2010 census 2014 2019population 2,624 2,626 2,655 households 1,128 1,132 1,144 families 724 736 736 average household size 2.33 2.32 2.32 owner-occupied housing units 903 874 880 renter-occupied housing units 225 258 264 median age 47.5 48.5 49.5 Trends: 2014 - 2019 annual rate area state nationalpopulation 0.22% 1.06% 0.73% households 0.21% 1.06% 0.75%families 0.00% 0.95% 0.66% owner-occupied households 0.14% 0.93% 0.69%median household income 2.31% 3.16% 2.74% median household income: 2014: $46,564 2019: $52,187 average household income: 2014: $54,007 2019: $58,995 Contact: City of Lake Helen, City Administrator327 South Lakeview Drive, Lake Helen, FL 32744Telephone: 386.228.2121, web: lakehelen.com
Source - U.S. Census Bureau, census 2010 Summary File 1. Esri forecasts for 2014 and 2019 and Volusia County GIS
Published and updated by Volusia County Division of Economic Development, www.floridabusiness.org
- Volusia County data: section 2-4page updated August 2014 (new data anticipated on an annual basis)

Volusia County cities: New Smyrna Beach and Oak Hill
The City of New Smyrna Beach 39.0 square miles 2010 census 2014 2019population 22,464 23,272 23,974households 11,074 11,440 11,787families 6,322 6,554 6,707 average household size 2.01 2.01 2.01 owner-occupied housing units 7,887 7,992 8,217renter-occupied housing units 3,187 3,448 3,570 median age 54.4 55.7 57.4 Trends: 2014 - 2019 annual rate area state nationalpopulation 0.60% 1.06% 0.73% households 0.60% 1.06% 0.75%families 0.46% 0.95% 0.66% owner-occupied households 0.56% 0.93% 0.69%median household income 3.73% 3.16% 2.74% median household income: 2014: $45,054 2019: $54,099 average household income: 2014: $62,641 2019: $72,135
Contact: City of New Smyrna Beach, City Manager210 Sams Avenue, New Smyrna Beach, Florida 32168Telephone: 386.424.2108, web: cityofnsb.com
Source - U.S. Census Bureau, census 2010 Summary File 1. Esri forecasts for 2014 and 2019 and Volusia County GIS
The City of Oak Hill 11.1 square miles 2010 census 2014 2019population 1,792 1,830 1,952households 797 816 873 families 497 499 529 average household size 2.25 2.24 2.24 owner-occupied housing units 638 635 677renter-occupied housing units 159 181 196median age 51.2 53.4 55.4 Trends: 2014 - 2019 annual rate area state nationalpopulation 1.30% 1.06% 0.73% households 1.36% 1.06% 0.75%families 1.17% 0.95% 0.66% owner-occupied households 1.29% 0.93% 0.69%median household income 2.89% 3.16% 2.74% median household income: 2014: $40,076 2019: $46,221average household income: 2014: $51,026 2019: $57,321 Contact: City of Oak Hill234 U.S. Highway 1, Oak Hill, FL 32759Telephone: 386.345.3522, web: oakhillfl.com
Source - U.S. Census Bureau, census 2010 Summary File 1. Esri forecasts for 2014 and 2019 and Volusia County GIS
Published and updated by Volusia County Division of Economic Development, www.floridabusiness.org
- Volusia County data: section 2-5page updated August 2014 (new data anticipated on an annual basis)

Volusia County cities: Orange City and Ormond Beach
The City of Orange City 7.3 square miles 2010 census 2014 2019population 10,599 10,846 11,137households 4,909 5,009 5,149 families 2,754 2,853 2,906 average household size 2.11 2.14 2.14owner-occupied housing units 2,740 2,993 3,044renter-occupied housing units 2,169 2,016 2,105 median age 47.5 50.7 52.4 Trends: 2014 - 2019 annual rate area state nationalpopulation 0.53% 1.06% 0.73% households 0.55% 1.06% 0.75%families 0.37% 0.95% 0.66% owner-occupied households 0.34% 0.93% 0.69%median household income 3.69% 3.16% 2.74 % median household income: 2014: $32,091 2019: $38,458 average household income: 2014: $43,956 2019: $50,368 Contact: Orange City, Development Services Director205 East Graves Avenue, Orange City, Florida 32763Telephone: 386.775.5415, web: ci.orange-city.fl.us
Source - U.S. Census Bureau, census 2010 Summary File 1. Esri forecasts for 2014 and 2019 and Volusia County GIS
The City of Ormond Beach 36.5 square miles 2010 census 2014 2019population 38,137 38,366 39,257households 17,062 17,247 17,710 families 10,781 10,735 10,956 average household size 2.21 2.20 2.20 owner-occupied housing units 13,496 12,723 12,915renter-occupied housing units 3,566 4,524 4,795median age 50.7 51.5 53.1 Trends: 2014 - 2019 annual rate area state nationalpopulation 0.46% 1.06% 0.73% households 0.53% 1.06% 0.75%families 0.41% 0.95% 0.66% owner-occupied households 0.30% 0.93% 0.69%median household income 3.23% 3.16% 2.74% median household income: 2014: $46,941 2019: $55,037 average household income: 2014: $69,158 2019: $78,863 Contact: City of Ormond Beach, Economic Development Director22 South Beach Street, Ormond Beach, Florida 32174Telephone: 386.676.3266, web: ormondbeach.org
Source - U.S. Census Bureau, census 2010 Summary File 1. Esri forecasts for 2014 and 2019 and Volusia County GIS
Published and updated by Volusia County Division of Economic Development, www.floridabusiness.org
- Volusia County data: section 2-6 page updated August 2014 (new data anticipated on an annual basis)

Volusia County cities: Pierson and Ponce Inlet
The Town of Pierson 10.9 square miles 2010 census 2014 2019population 1,736 1,766 1,809 households 486 495 509 families 381 359 367average household size 3.44 3.52 3.50 owner-occupied households 336 354 374 renter-occupied households 150 141 135 median age 30.8 37.7 38.1 Trends: 2014 - 2019 annual rate area state nationalpopulation 0.48% 1.06% 0.73% households 0.56% 1.06% 0.75%families 0.44% 0.95% 0.66% owner-occupied households 1.11% 0.93% 0.69%median household income 2.98% 3.16% 2.74% median household income: 2014: $40,626 2019: $47,061 average household income: 2014: $54,129 2019: $61,106 Contact: Town of Pierson, Pierson Town Clerk106 North Center Street, Pierson, FL 32180Telephone: 386.749.2661, web: townofpierson.org
Source - U.S. Census Bureau, census 2010 Summary File 1. Esri forecasts for 2014 and 2019 and Volusia County GIS
The City of Ponce Inlet 6.6 square miles 2010 census 2014 2019population 3,032 3,037 3,070households 1,535 1,541 1,560 families 1,022 1,017 1,023 average household size 1.98 1.97 1.97 owner-occupied households 1,323 1,286 1,298renter-occupied households 212 255 262 median age 60.8 62.1 63.3 Trends: 2014 - 2019 annual rate area state nationalpopulation 0.22% 1.06% 0.73% households 0.25% 1.06% 0.75%families 0.12% 0.95% 0.66% owner-occupied households 0.19% 0.93% 0.69%median household income 3.72% 3.16% 2.74% median household income: 2014: $65,743 2019: $78,907 average household income: 2014: $99,913 2019: $119,037 Contact: Town of Ponce Inlet, Town Manager4300 South Atlantic Avenue, Ponce Inlet, FL 32127Telephone: 386.236.2150, web: ponce-inlet.org
Source - U.S. Census Bureau, census 2010 Summary File 1. Esri forecasts for 2014 and 2019 and Volusia County GIS
Published and updated by Volusia County Division of Economic Development, www.floridabusiness.org
- Volusia County data: section 2-7page updated August 2014 (new data anticipated on an annual basis)

Volusia County cities: Port Orange and South Daytona
The City of Port Orange 26.7 square miles 2010 census 2014 2019population 56,048 56,765 57,965 households 24,841 25,158 25,704 families 15,444 15,597 15,852average household size 2.25 2.25 2.25owner-occupied households 18,641 18,107 18,449 renter-occupied households 6,200 7,052 7,255 median age 46.8 48.5 50.0 Trends: 2014 - 2019 annual rate area state nationalpopulation 0.42% 1.06% 0.73% households 0.43% 1.06% 0.75%families 0.32% 0.95% 0.66% owner-occupied households 0.37% 0.93% 0.69%median household income 3.22% 3.16% 2.74% median household income: 2014: $44,220 2019: $51,811 average household income: 2014: $59,347 2019: $67,180 Contact: City of Port Orange, Director of Community Development1000 City Center Circle, Port Orange, Florida 32129Telephone: 386.506.5600, web: port-orange.org
Source - U.S. Census Bureau, census 2010 Summary File 1. Esri forecasts for 2014 and 2019 and Volusia County GIS
The City of South Daytona 3.7 square miles 2010 2014 2019population 12,252 12,511 12,896 households 5,532 5,666 5,844 families 3,189 3,184 3,252 average household size 2.20 2.20 2.20 owner-occupied households 3,515 3,332 3,386renter-occupied households 2,017 2,334 2,458 median age 43.6 44.9 45.6 Trends: 2014 - 2019 annual rate area state nationalpopulation 0.61% 1.06% 0.73% households 0.62% 1.06% 0.75%families 0.42% 0.95% 0.66% owner-occupied households 0.32% 0.93% 0.69%median household income 2.80% 3.16% 2.74% median household income: 2014: $35,100 2019: $40,298 average household income: 2014: $44,585 2019: $50,403 Contact:CityofSouthDaytona,OfficeoftheCityManager1672 South Ridgewood Avenue, South Daytona, Florida 32119Telephone: 386.322.3010, web: southdaytona.org
Source - U.S. Census Bureau, census 2010 Summary File 1. Esri forecasts for 2014 and 2019 and Volusia County GIS
Published and updated by Volusia County Division of Economic Development, www.floridabusiness.org
- Volusia County data: section 2-8 page updated August 2014 (new data anticipated on an annual basis)

Volusia County versus all of Florida
The State of Florida
2010 census 2014 2019population 18,801,310 19,383,475 20,434,286households 7,420,802 7,636,053 8,048,373 families 4,835,475 4,939,383 5,177,974 average household size 2.48 2.48 2.49 owner-occupied households 4,998,979 4,857,688 5,086,903renter-occupied households 2,421,823 2,778,365 2,961,470 median age 40.8 41.7 42.2
Trends: 2014 - 2019 annual ratestate national
population 1.06% 0.73%households 1.06% 0.75%families 0.95% 0.66%owner-occupied households 0.93% 0.69%median household income 3.16% 2.74%
median household income: 2014: $45,645 2019: $53,323average household income: 2014: $65,254 2019: $74,287
Contact: MyFlorida.com, theofficialportaloftheStateofFlorida
Source - U.S. Census Bureau, census 2010 Summary File 1. Esri forecasts for 2014 and 2019.
Volusia County
2010 census 2014 2019population 494,593 502,340 515,219households 208,236 211,712 217,377families 130,386 131,435 134,060average household size 2.31 2.31 2.31owner-occupied households 150,443 145,120 148,049renter-occupied households 57,793 66,592 69,328median age 45.3 46.3 47.5
Trends: 2014 - 2019 annual ratearea state national
population 0.51% 1.06% 0.73%households 0.53% 1.06% 0.75%families 0.40% 0.95% 0.66%owner-occupied households 0.40% 0.93% 0.69%median household income 3.74% 3.16% 2.74%
median household income: 2014: $41,769 2019: $50,184average household income: 2014: $56,792 2019: $64,433
Contact: Volusia County, Thomas C. Kelly Administration Center123 W. Indiana Avenue, DeLand, FL 32720Telephone: 386.736.2700, web: volusia.org
Source - U.S. Census Bureau, census 2010 Summary File 1. Esri forecasts for 2014 and 2019.
Published and updated by Volusia County Division of Economic Development, www.floridabusiness.org
- Volusia County data: section 2-9page updated August 2014 (new data anticipated on an annual basis)

The United States of America
United States
2010 census 2014 2019population 308,745,538 316,296,988 327,981,317households 116,716,292 119,862,927 124,446,535families 77,538,296 79,114,777 81,763,262average household size 2.58 2.57 2.57 owner-occupied households 75,986,074 75,871,312 78,522,941renter-occupied households 40,730,218 43,991,615 45,923,594median age 37.1 37.7 38.2
Trends: 2014 - 2019 annual ratenational
population 0.73% households 0.75%families 0.66% owner-occupied households 0.69%median household income 2.74%
median household income: 2014: $52,076 2019: $59,599average household income: 2014: $72,809 2019: $83,937
Source - U.S. Census Bureau, census 2010 Summary File 1. Esri forecasts for 2014 and 2019.
Published and updated by Volusia County Division of Economic Development, www.floridabusiness.org
- Volusia County data: section 2-10 page updated August 2014 (new data anticipated on an annual basis)

Average wage by occupation - Deltona, Daytona Beach, Ormond Beach MSA
occupation average annual wagetotal all occupations $ 36,317assemblers and fabricators, all other $ 23,026computer and information systems managers $ 110,282electrical and electronic equipment assemblers $ 28,829electrical engineers $ 77,355general and operations managers $ 104,582grinding,lapping,polishingandbuffingmachinetool setters, operators and tenders, metal and plastic $ 37,419industrial engineers $ 67,995industrial machinery mechanics $ 44,138industrial production managers $ 103,958machinists $ 34,986mechanical engineers $ 72,030molding, coremaking and casting machine setters, operators and tenders, metal and plastic $ 34,757packers and packagers, hand $ 17,992procurement clerks $ 38,230production workers, all other $ 24,419purchasing managers $ 101,525sales managers $ 112,112secretariesandadministrativeassistants,exceptlegal,medicalandexecutive $ 29,162shipping,receivingandtrafficclerks $ 28,038team assemblers $ 26,915tool and die makers $ 47,050welders, cutters, solderers and brazers $ 31,054 Source: Department of Economic Opportunity, Bureau of Labor Market Statistics Occupational Employment Statistics and Wages, data updated July 2014
Published and updated by Volusia County Division of Economic Development, www.floridabusiness.org
- Volusia County data: section 3-1 page updated August 2014 (new data anticipated on an annual basis)
Section 3: Volusia County workforceVolusia County cities: Daytona Beach and Daytona Beach Shores

2014 average private sector wage by industry
industry average annual wage (quarterly x 4)
1. utilities $93,7802. management of companies and enterprises $172,7923. financeandinsurance $52,5684. wholesale trade $46,9165. manufacturing $52,8606. information $44,0367. professional,scientificandtechnicalservices $41,5408. health care and social assistance $40,9329. educational services $37,716
10. construction $35,62011. transportation and warehousing $35,25212. otherservices(exceptpublicadministration) $30,41613. real estate, rental and leasing $32,24414. admin. support, waste mgt., remediation services $26,36815. arts, entertainment and recreation $25,40416. retail trade $25,47217. agriculture,forestry,fishingandhunting $18,57218. accommodation and food services $17,088
average of all private sector wages, all industries $34,372
Source: Florida Department of Economic Opportunity, Labor Market Statistics Center, Quarterly Census of Employment and Wages for 1st quarter 2014
Published and updated by Volusia County Division of Economic Development, www.floridabusiness.org
- Volusia County data: section 3-2 page updated September 2014 (new data anticipated on an annual basis)

2014 Volusia County average private sector employment by industry
Published and updated by Volusia County Division of Economic Development, www.floridabusiness.org
- Volusia County data: section 3-3 page updated January 2015 (new data anticipated on a quarterly basis)
avg employment industry by month
1. health care and social assistance 27,287
2. retail trade 23,911
3. accommodation and food services 20,745
4. Administrative and waste services 8,914
5. construction 8,496
6. manufacturing 9,453
7. professional, scientific and technical services 6,432
8. other services (except public administration) 5,312
9. educational services 5,021
10. wholesale trade 3,863
11. finance and insurance 3,930
12. arts, entertainment and recreation 3,844
13. real estate, rental and leasing 3,460
14. information 1,692
15. agriculture, forestry, fishing and hunting 1,385
16. transportation and warehousing 1,543
17. management of companies and enterprises 1,008
18. utilities 258
total private sector employment 136,554
Source: Florida Department of Economic Opportunity, Bureau of Labor Statistics Quarterly Census of Employment and Wages in cooperation with the U.S. Depart-ment of Labor, Bureau of Labor Statistics (for second quarter , 2014).

industry number of businesses
1. retail trade 2,0312. construction 1,7283. professional,scientificandtechnicalservices 1,4754. health care and social assistance 1,3975. otherservices(exceptpublicadministration) 1,2206. accommodation and food services 1,1937. administrative and waste services 9788. real estate, rental and leasing 7129. financeandinsurance 645
10. wholesale trade 55811. manufacturing 45812. transportation and warehousing 24413. arts, entertainment and recreation 22814. information 16715. educational services 14016. agriculture,forestry,fishingandhunting 13017. management of companies and enterprises 6318. unclassified 5019. utilities 21
total 13,438
Volusia County private sector businesses by industry
Source: Florida Department of Economic Opportunity, Bureau of Labor Market Statistics, Quarterly Census of Employment and Wages (for 2nd quarter 2014)
Published and updated by Volusia County Division of Economic Development, www.floridabusiness.org
- Volusia County data: section 3-4 page updated January 2015 (new data anticipated on a quarterly basis)
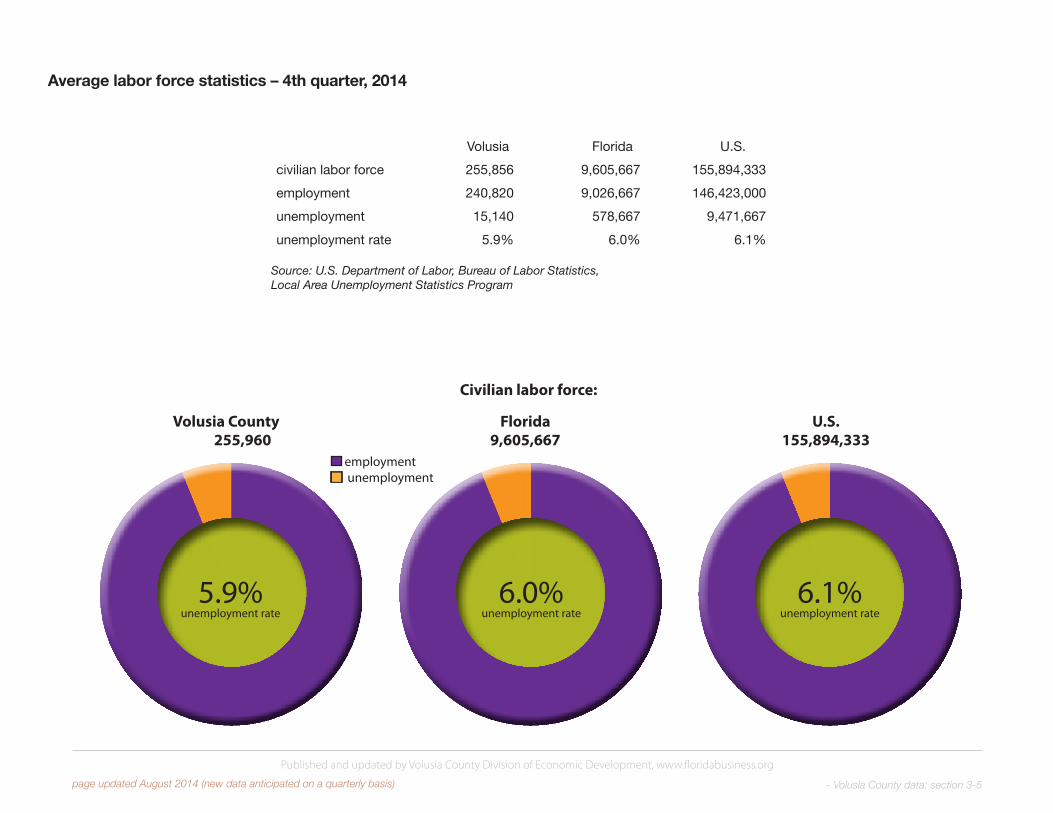
Average labor force statistics – 4th quarter, 2014
Volusia Florida U.S.civilian labor force 255,856 9,605,667 155,894,333employment 240,820 9,026,667 146,423,000unemployment 15,140 578,667 9,471,667unemployment rate 5.9% 6.0% 6.1%
Source: U.S. Department of Labor, Bureau of Labor Statistics, Local Area Unemployment Statistics Program
Volusia County Florida U.S. 255,960 9,605,667 155,894,333
■ employment■ unemployment
5.9% unemployment rate
6.0% unemployment rate
6.1% unemployment rate
Published and updated by Volusia County Division of Economic Development, www.floridabusiness.org
- Volusia County data: section 3-5 page updated August 2014 (new data anticipated on a quarterly basis)
Civilian labor force:

Non-agricultural employment
Deltona-Daytona Beach-Ormond Beach MSAJanuary – November 2014, total employment 160,000
14.8% leisure and hospitality
4.8% other
20.4% education and health services
12.5% government
(federal, state and local)5.3%
mining, logging and construction
5.9% manufacturing
18.8% trade, transportation
and utilities
1.1% information
4.8% financial activities
11.6% professional and business
services
Note: Not seasonally adjusted. Percents may not add up to 100.0 due to rounding.Source: Florida Department of Economic Opportunity, Bureau of Labor Market Sta-tistics, Quarterly Census of Employment and Wages Program in cooperation with the U.S. Department of Labor, Bureau of Labor Statistics
Published and updated by Volusia County Division of Economic Development, www.floridabusiness.org
- Volusia County data: section 3-6 page updated January 2015 (new data anticipated on a quarterly basis)

Workers by reason of unemployment, all U.S., August 2014
Source: U. S. Department of Commerce, Bureau of Labor Statistics, Table A-11 Unemployed Persons by Reason of Unemployment
48.5% were laid off or completed temporary jobs
30.1% hope to re-enter
the work force
9.4% voluntarily left the workforce
12.0% are new workers
Published and updated by Volusia County Division of Economic Development, www.floridabusiness.org
- Volusia County data: section 3-7 page updated January 2015 (new data anticipated on a quarterlyl basis)

12 month median earnings, population 25 years and older
Source: U. S. Department of Commerce, Bureau of the Census, 2013 American Community Survey, 1 year estimates
less than high school graduate
high school graduate (including equivalency)
some college or associate’s degree
bachelor’s degree
graduate or professional degree
0 $10,000 $20,000 $30,000 $40,000 $50,000 $60,000 $70,000
0
10000
20000
30000
40000
50000
60000
70000
80000
■ Volusia County■ all Florida■ U.S.
Published and updated by Volusia County Division of Economic Development, www.floridabusiness.org
- Volusia County data: section 3-8page updated January 2015 (new data anticipated on an annual basis)

Educational attainment, population 25 years and older
Source: U. S. Department of Commerce, Bureau of the Census, 2013 American Community Survey, 1year estimates
less than 9th grade
grades 9-12, no diploma
high school graduate (including equivalency)
some college, no degree
associate’s degree
bachelor’s degree
graduate or professional degree
0 5% 10% 15% 20% 25% 30% 35%
0 5 10 15 20 25 30 35
■ Volusia County■ all Florida■ U.S.
Published and updated by Volusia County Division of Economic Development, www.floridabusiness.org
- Volusia County data: section 3-9 page updated August 2014 (new data anticipated on a quarterlyl basis)
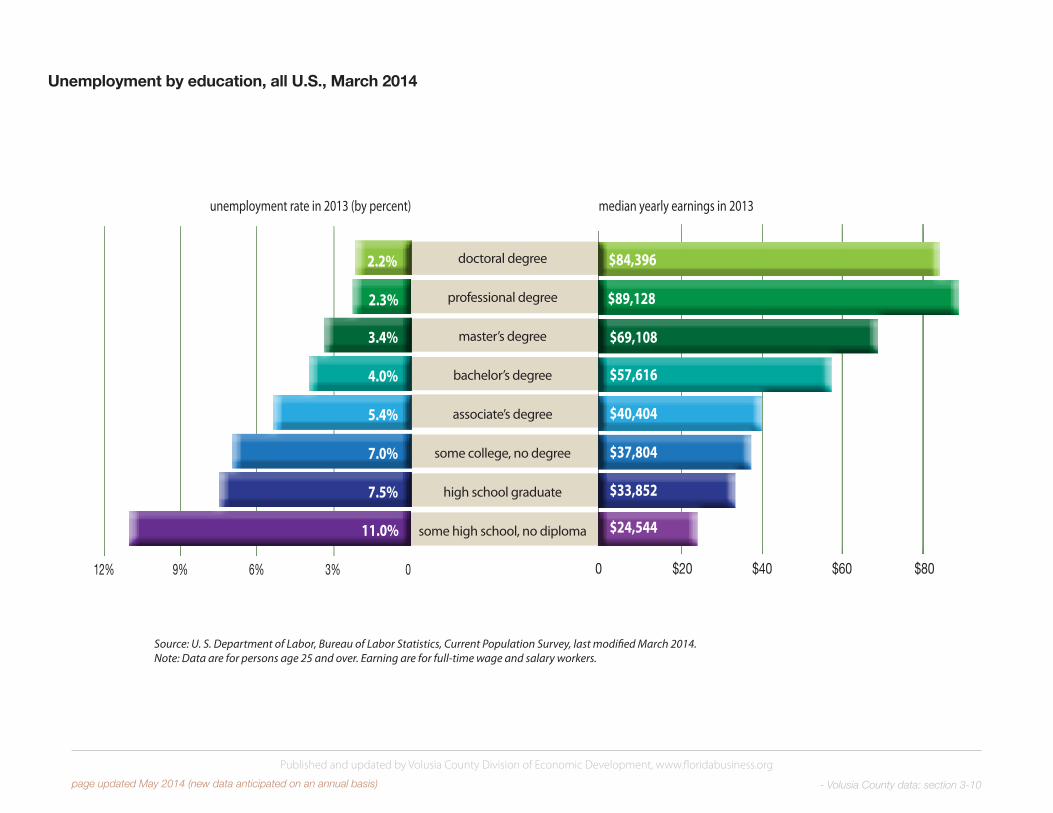
Unemployment by education, all U.S., March 2014
Source: U. S. Department of Labor, Bureau of Labor Statistics, Current Population Survey, last modified March 2014.Note: Data are for persons age 25 and over. Earning are for full-time wage and salary workers.
doctoral degree
professional degree
master’s degree
bachelor’s degree
associate’s degree
some college, no degree
high school graduate
some high school, no diploma
unemployment rate in 2013 (by percent)
12% 9% 6% 3% 0
0246810
12
2.2%
2.3%
3.4%
4.0%
5.4%
7.0%
7.5%
11.0%
median yearly earnings in 2013
0 $20 $40 $60 $80
0
20000
40000
60000
80000
100000
$84,396
$89,128
$69,108
$57,616
$40,404
$37,804
$33,852
$24,544
Published and updated by Volusia County Division of Economic Development, www.floridabusiness.org
- Volusia County data: section 3-10 page updated May 2014 (new data anticipated on an annual basis)

Published and updated by Volusia County Division of Economic Development, Daytona Beach International Airport, 700 Catalina Drive, Suite 200, Daytona Beach, Florida 32114Telephone: 386.248.8048 or 800.554.3801 Web: floridabusiness.org
Hospitals in Volusia County
- Volusia County workforce: section 3, page 11 -
Source: compiled by Volusia County’s Division of Economic Development
original publication date: March, 2012 (new data on as needed basis)
1. Florida Hospital, DeLand (156 licensed beds) 701 Plymouth Avenue, DeLand, FL 32720 Telephone (386) 943.4522
2. Florida Hospital Fish Memorial (139 licensed beds) 1055 Saxon Boulevard, Orange City, Florida 32763 Telephone: (386) 851.5000
3. Halifax Health Medical Center (80 licensed beds) 1041 Dunlawton Avenue, Port Orange, Florida 32127 Telephone: (386) 254.4000
4. Florida Hospital Oceanside (119 licensed beds) 264 South Atlantic Avenue, Ormond Beach, Florida 32176 Telephone: (386) 231.3909
5. Halifax Health Medical Center (654 licensed beds) 303 North Clyde Morris Boulevard, Daytona Beach, Florida 32114 Telephone: (386) 254.4000
6. Bert Fish Medical Center (112 licensed beds) 401 Palmetto Street, New Smyrna Beach, Florida 32168 Telephone: (386) 424.5000
7. Florida Hospital Memorial Medical Center (277 licensed beds) 301 Memorial Medical Parkway, Daytona Beach, Florida 32117 Telephone: (386) 231.6000