voluntary adverse event reporting in rural hospitals adverse event reporting in rural hospitals...
TRANSCRIPT

Voluntary Adverse Event Reporting in Rural Hospitals Charles P. Schade, MD, MPH; Patricia Ruddick, MSN, APRN-BC; David R. Lomely, BS; Gail Bellamy, PhD
Abstract Since 2004, we have managed a voluntary Web-based medical adverse event (AE) reporting system with a special focus on small rural and critical access hospitals (CAHs). We monitor safety event reporting and provide concise, action-oriented feedback through quarterly composite reports, including peer group benchmarking. Hospital participation increased from 11 (5 CAH; 6 non-CAH) at the start of the project and peaked at 26 (15 CAH; 11 non-CAH). Reporting rates remained nearly constant over the nine quarters (52 ± 4 events/1,000 patient-days). Most AE categories were reported more frequently in CAHs and tended to increase over time. For example, the rate of reported wrong drug administration increased significantly among CAHs and declined 50 percent in others. Event rates in this passive surveillance system were substantially lower than have been reported in research settings. Despite this evidence of underreporting, participating hospitals have used the system as intended, discovering and remedying problems suggested by trends in the data.
Introduction Public and professional concern over patient safety, adverse health care events, and medical error have been increasing since before the beginning of the new millennium. Lucian Leape, Don Berwick, and others pioneered research on these topics in the 1990s.1, 2, 3, 4 The landmark 1999Institute of Medicine report, To Err is Human, advocated voluntary reporting systems for patient safety events to facilitate improvement through reporting of “near miss” events and those that result in no or minimal harm.
5
Under a Transforming Healthcare Quality through Information Technology (THQIT) cooperative agreement with the Agency for Healthcare Research and Quality (AHRQ), the West Virginia Medical Institute (WVMI), in partnership with the State’s hospital association and office of rural health, Quantros, Inc., and Verizon, has been working to improve rural hospital patient safety in West Virginia. The overall goal of the cooperative agreement was the improvement of patient safety by implementation and use of a statewide voluntary patient safety reporting system.
One of the intended uses of the project’s data was to inform collaborating hospitals of opportunities for improvement, where performance in individual facilities or the collaborating hospitals collectively differed from that observed elsewhere in similar hospital settings. We approached this problem using the model of public health surveillance systems. According to the Centers for Disease Control and Prevention, public health surveillance is “…the ongoing,
1
systematic collection, analysis, interpretation, and dissemination of data regarding a health-related event for use in public health action to reduce morbidity and mortality and to improve health.”6
Ours is a passive surveillance system. The major limitation of such systems is underreporting, which can be substantial.7, 8, 9 One intervention early in this project showed that in one participating hospital, only about 4 percent of adverse drug events requiring rescue drugs had been reported to the voluntary system.10 We believed that systematic feedback would improve reporting rates if hospital staff and management found the information useful and relevant. We developed denominators and benchmarks appropriate to the different categories of events reported to allow comparison across hospitals (including rural critical access hospitals) and geographic boundaries.
We present the results of analysis of reported hospital safety events over the first nine quarters of reporting system operation. The goals of this project were to: (1) develop a consistent set of measures for comparing hospital adverse event (AE) reports, including denominators suitable for calculating event rates; (2) report these rates periodically to participating hospitals in an actionable format; and (3) evaluate patterns and trends in reported rates among hospitals and within groups of similar hospitals.
Methods As a part of this project, we licensed a Web-based medical error reporting system (the Occurrence Report Management [ORM] system by Quantros, Inc., a reporting software vendor) and provided it free of cost to participating hospitals. We invited all of the State’s acute care hospitals in rural areas and critical access hospitals (CAHs) to participate in the voluntary patient safety event reporting system component of the project. Long-term care facilities associated with hospitals were also invited to participate.
Twenty-eight (16/18 CAHs and 12/32 other rural hospitals) hospitals accepted the invitation during the course of the project. CAHs are limited to 25 beds; the median bed size of the other rural hospitals was 71.5 (range 39-240). Seven CAHs and three other rural hospitals had associated long-term care facilities. In this report, we limited data to those reported from the acute care and CAHs because patient characteristics, risk exposure, and length of stay were substantially different in long-term care facilities. Statewide hospital counts are as of July 1, 2005, as determined from dates of Medicare acceptance and closing reported by the Centers for Medicare & Medicaid Services and do not include Veterans Affairs facilities. Numbers of participants varied over the course of the project due to sign-up dates, hospital closures, and conversion of hospitals from acute care hospitals to CAHs.
Reports concerning medical errors were available in real time to designated hospital administrators and to WVMI. Hospital staff could view and respond to details in individual reports and generate facility-level aggregate reports. WVMI produced statewide aggregated reports of numerator data (e.g., How many medication errors were reported?) and relative frequencies of events (e.g., What proportion of all reported errors were unobserved falls?).
2

We conducted a structured literature review using PubMed to identify appropriate denominators for comparing the numerator data across facilities and through time. By “denominators,” we mean measures of exposure to the risk of an AE. For example, if an AE is misidentification of a laboratory specimen, an appropriate measure of risk of exposure might be the number of laboratory specimens obtained within a specified time interval. We were interested in the denominators other investigators had chosen, in addition to their rationales. We expected to see different denominators in use for different kinds of AEs.
The literature review covered English language articles published between 1995 and 2004 that addressed medical errors in hospitals and provided statistics or numerical data. We looked within these articles for reports of rates, comparisons, or denominators. We refined search criteria as we identified potentially relevant articles by adding free text search terms that appeared in relevant articles and repeatedly searched until we stopped retrieving new articles. We used the following search terms: adverse events; calculat*; claims-based; compar*; denominator; falls; hospitals; hospitals/standards; measur*; medical errors; rate; report; safety; statistics and numerical data. In the list of terms, “*” was a “wildcard” denoting a word beginning with the characters listed.
A reference librarian scanned the abstracts of articles retrieved and identified those reporting counts or rates of medical error events in hospitals. Other articles were discarded. One author reviewed the abstracts and confirmed those that appeared to have specific information from which comparable event rates could be determined and calculated for different types of AEs in hospitals.
We examined the frequencies of AEs reported during the pilot phase of operation of the voluntary reporting system (June 30, 2002 to December 31, 2004). Using the Quantros system taxonomy, we grouped events into broader categories that represented appreciable proportions of the total. In that scheme, events were classified by affected party, occurrence type, and outcome. We created groups of similar events by occurrence type, such that each group would be expected to include 2 percent or more of reported events. Using the results of the systematic literature search, we chose appropriate denominators for comparing rates across hospitals and over time.
This process resulted in a set of indicators that we reported to participating hospitals quarterly, beginning in late 2005. We calculated percentile distributions of the indicators every quarter and examined indicator rates in individual hospitals, groups of similar hospitals, and statewide to assess trends. Where published data were available, we compared our results with these.
Results
Literature Review Broad search terms such as “Benchmarking[MESH] AND Hospitals/standards[MESH] yielded large numbers of articles with little relevance to medical error rate calculation. Adding “Medical Error[MESH]” or the generic term “Error” to searches narrowed them considerably, but most articles reported numbers of errors, when they reported statistical information at all. When abstracts revealed studies calculating rates of error or AEs or presenting denominators, we selected terms that would have retrieved them. Using these more specific qualifiers, we screened
3

456 articles, identifying 60 as potentially relevant. Of these, 13 were found to be news items, numerator-only analyses, general reviews, or otherwise missing relevant information. The other 47 were included in the evidence table (available from the authors) summarized below.
A plurality (19/47) of the articles dealt with adverse drug events. The second largest group (16/47) presented results of studies on all AEs. Smaller numbers focused on infections, devices, laboratory errors, surgical errors, and falls. All but three articles provided results as rates. We examined each article to determine the denominator(s) used for comparing frequencies of events. Results are presented in Table 1, which shows denominators associated with particular kinds of AEs in at least one published study.
Table 1. Denominator measures used in 47 studies of various patient safety events
Denominator measures used
Type of adverse event (AE) Discharge Patient-day Dose Order Procedure
General AE Xa X
Medication error X X X
Laboratory-related X
Fall X
Surgical infection X
a An “X” denotes one or more studies published between 1995 and 2004, using the stated measure as a denominator for computing rates of patient safety events in hospitals; e.g., AEs per 1,000 patient-days.
AE Frequencies Analysis of AEs during the pilot and early operational phases of this project in 2002 to 2004, when eight hospitals had reported almost 9,000 events, showed the relative frequencies of events documented in Table 2. We limited consideration of categories for inclusion to those expected to account for at least 2 percent of reported events, based on observations early in implementation. In 2005, 13/19 reporting hospitals averaged fewer than 100 reported events per quarter. With such reporting rates, hospitals would be unlikely to observe events with expected frequency < 2 percent. The final list of event categories with definitions resulted from combination of similar event types in the reporting system and is presented in Table 3. Several of the final categories have relative frequencies less than 2 percent in the statewide system, but they were considered important enough to attempt to collect them anyway.
4

Table 2. Relative frequencies of AEs reported during pilot phase, West Virginia Patient Safety Project: June 30, 2002 to December 31, 2004
Event category/subcategory Relative frequencya (%)
Other 10.0
Falls found on floor 7.1
Administrative discharge, left against medical advice 6.3
Administrative discharge, left without being seen 5.6
Medication/infusion omitted 5.2
Adverse clinical other/miscellaneous 5.1
Administrative patient/family dissatisfaction 4.9
Administrative other/miscellaneous 4.9
Adverse clinical work-related injury 3.2
Adverse clinical skin integrity 3.0
Medication/infusion other 2.7
Medication/infusion wrong dose 2.5
Administrative documentation/records 2.1
Administrative financial 2.1
Administrative HIPAA 2.1
Adverse clinical treatment/test issues (non-operative) 2.1
a Relative frequency = percent of all reported events during the pilot phase. Data from five hospitals reporting during all or part of the time interval. Event categories with <2 percent frequency are not shown.
Final Denominator Determination None of the candidate denominator measures in Table 1, except number of discharges, are routinely available from administrative statistics. We surveyed participants to ascertain ability to supply counts of laboratory tests, employee work days, and drug doses ordered. For two quarters, we asked the hospitals to submit these counts. We computed ratios between these candidate event-specific denominator measures and the number of discharges within each hospital and observed very large quarter-to-quarter variation. On careful inquiry, we learned that these counts were not readily available within participating hospitals and ascertained that there had been significant misunderstanding of the definition of the denominators. We abandoned the attempt to use measure-specific denominators and settled on patient-days as a compromise denominator for all indicators.
5
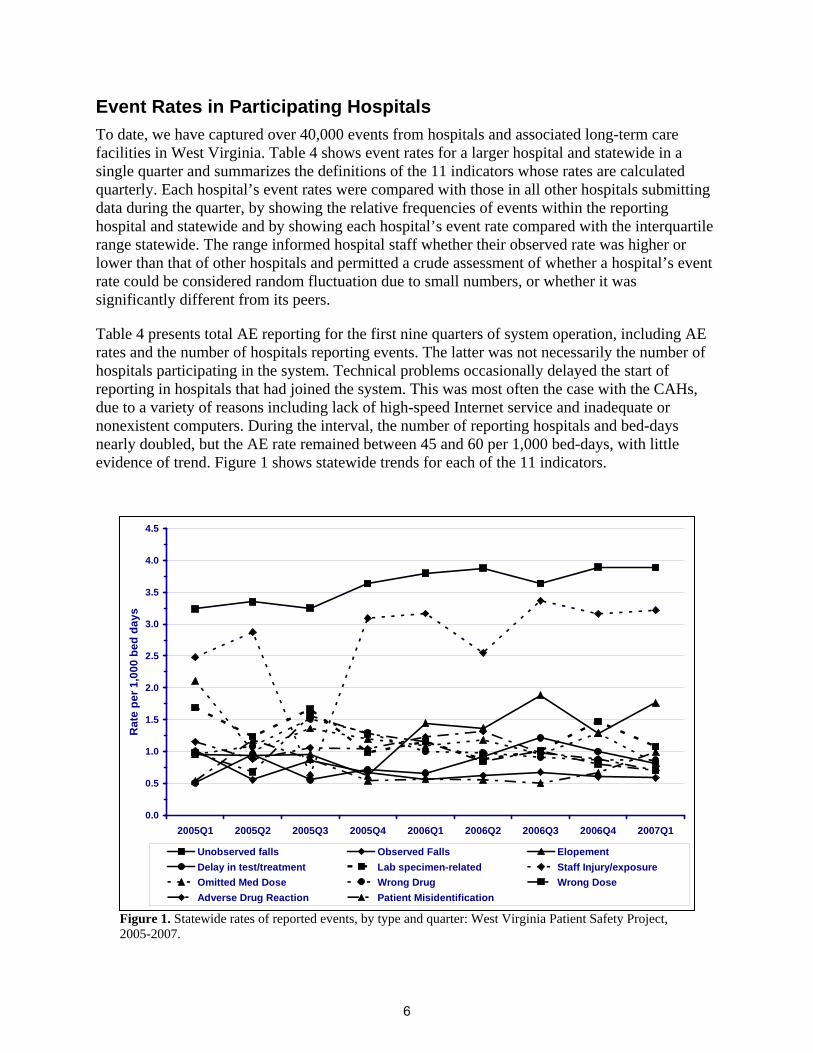
Table 4 presents total AE reporting for the first nine quarters of system operation, including AE rates and the number of hospitals reporting events. The latter was not necessarily the number of hospitals participating in the system. Technical problems occasionally delayed the start of reporting in hospitals that had joined the system. This was most often the case with the CAHs, due to a variety of reasons including lack of high-speed Internet service and inadequate or nonexistent computers. During the interval, the number of reporting hospitals and bed-days nearly doubled, but the AE rate remained between 45 and 60 per 1,000 bed-days, with little evidence of trend. Figure 1 shows statewide trends for each of the 11 indicators.
To date, we have captured over 40,000 events from hospitals and associated long-term care facilities in West Virginia. Table 4 shows event rates for a larger hospital and statewide in a single quarter and summarizes the definitions of the 11 indicators whose rates are calculated quarterly. Each hospital’s event rates were compared with those in all other hospitals submitting data during the quarter, by showing the relative frequencies of events within the reporting hospital and statewide and by showing each hospital’s event rate compared with the interquartile range statewide. The range informed hospital staff whether their observed rate was higher or lower than that of other hospitals and permitted a crude assessment of whether a hospital’s event rate could be considered random fluctuation due to small numbers, or whether it was significantly different from its peers.
Event Rates in Participating Hospitals
Figure 1. Statewide rates of reported events, by type and quarter: West Virginia Patient Safety Project, 2005-2007.
0.0
0.5
1.0
1.5
2.0
2.5
3.0
3.5
4.0
4.5
2005Q1 2005Q2 2005Q3 2005Q4 2006Q1 2006Q2 2006Q3 2006Q4 2007Q1
Rat
e pe
r 1,0
00 b
ed d
ays
Adverse Drug ReactionOmitted Med DoseDelay in test/treatmentUnobserved falls
Patient MisidentificationWrong DrugLab specimen-relatedObserved Falls
Wrong DoseStaff Injury/exposureElopement
6
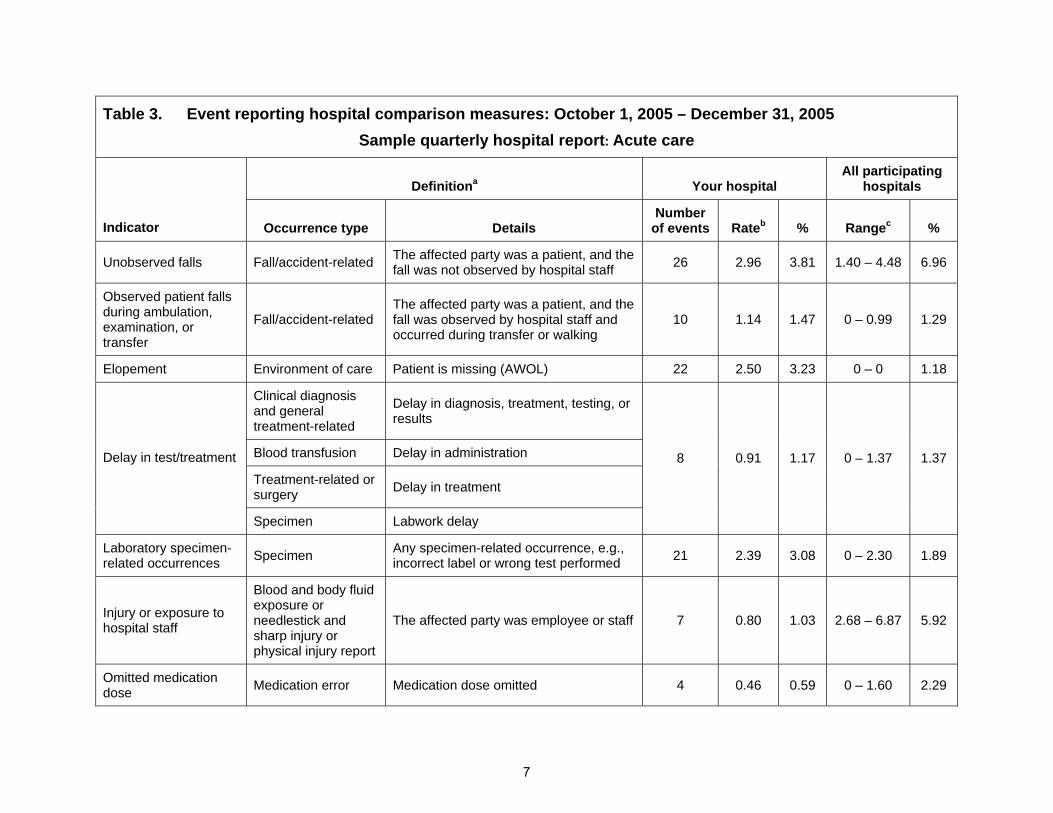
Table 3. Event reporting hospital comparison measures: October 1, 2005 – December 31, 2005 Sample quarterly hospital report: Acute care
Definitiona Your hospital All participating
hospitals
Indicator Occurrence type Details Number
of events Rateb % Rangec %
Unobserved falls Fall/accident-related The affected party was a patient, and the fall was not observed by hospital staff 26 2.96 3.81 1.40 – 4.48 6.96
Observed patient falls during ambulation, examination, or transfer
Fall/accident-related The affected party was a patient, and the fall was observed by hospital staff and occurred during transfer or walking
10 1.14 1.47 0 – 0.99 1.29
Elopement Environment of care Patient is missing (AWOL) 22 2.50 3.23 0 – 0 1.18
Clinical diagnosis and general treatment-related
Delay in diagnosis, treatment, testing, or results
Blood transfusion Delay in administration
Treatment-related or surgery Delay in treatment
Delay in test/treatment
Specimen Labwork delay
8 0.91 1.17 0 – 1.37 1.37
Laboratory specimen-related occurrences Specimen Any specimen-related occurrence, e.g.,
incorrect label or wrong test performed 21 2.39 3.08 0 – 2.30 1.89
Injury or exposure to hospital staff
Blood and body fluid exposure or needlestick and sharp injury or physical injury report
The affected party was employee or staff 7 0.80 1.03 2.68 – 6.87 5.92
Omitted medication dose Medication error Medication dose omitted 4 0.46 0.59 0 – 1.60 2.29
7
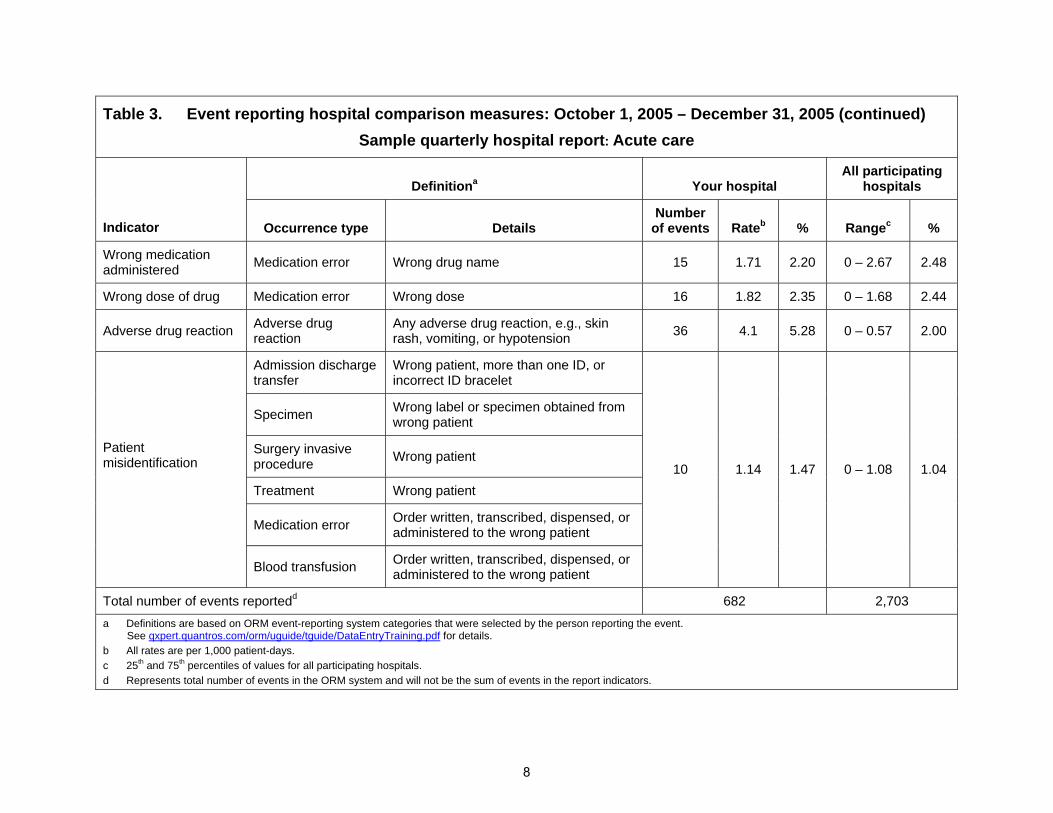
Table 3. Event reporting hospital comparison measures: October 1, 2005 – December 31, 2005 (continued) Sample quarterly hospital report: Acute care
Definitiona Your hospital All participating
hospitals
Indicator Occurrence type Details Number
of events Rateb % Rangec %
Wrong medication administered Medication error Wrong drug name 15 1.71 2.20 0 – 2.67 2.48
Wrong dose of drug Medication error Wrong dose 16 1.82 2.35 0 – 1.68 2.44
Adverse drug reaction Adverse drug reaction
Any adverse drug reaction, e.g., skin rash, vomiting, or hypotension 36 4.1 5.28 0 – 0.57 2.00
Admission discharge transfer
Wrong patient, more than one ID, or incorrect ID bracelet
Specimen Wrong label or specimen obtained from wrong patient
Surgery invasive procedure Wrong patient
Treatment Wrong patient
Medication error Order written, transcribed, dispensed, or administered to the wrong patient
Patient misidentification
Blood transfusion Order written, transcribed, dispensed, or administered to the wrong patient
10 1.14 1.47 0 – 1.08 1.04
Total number of events reportedd 682 2,703 a Definitions are based on ORM event-reporting system categories that were selected by the person reporting the event.
See qxpert.quantros.com/orm/uguide/tguide/DataEntryTraining.pdf for details. b All rates are per 1,000 patient-days. c 25th and 75th percentiles of values for all participating hospitals. d Represents total number of events in the ORM system and will not be the sum of events in the report indicators.
8
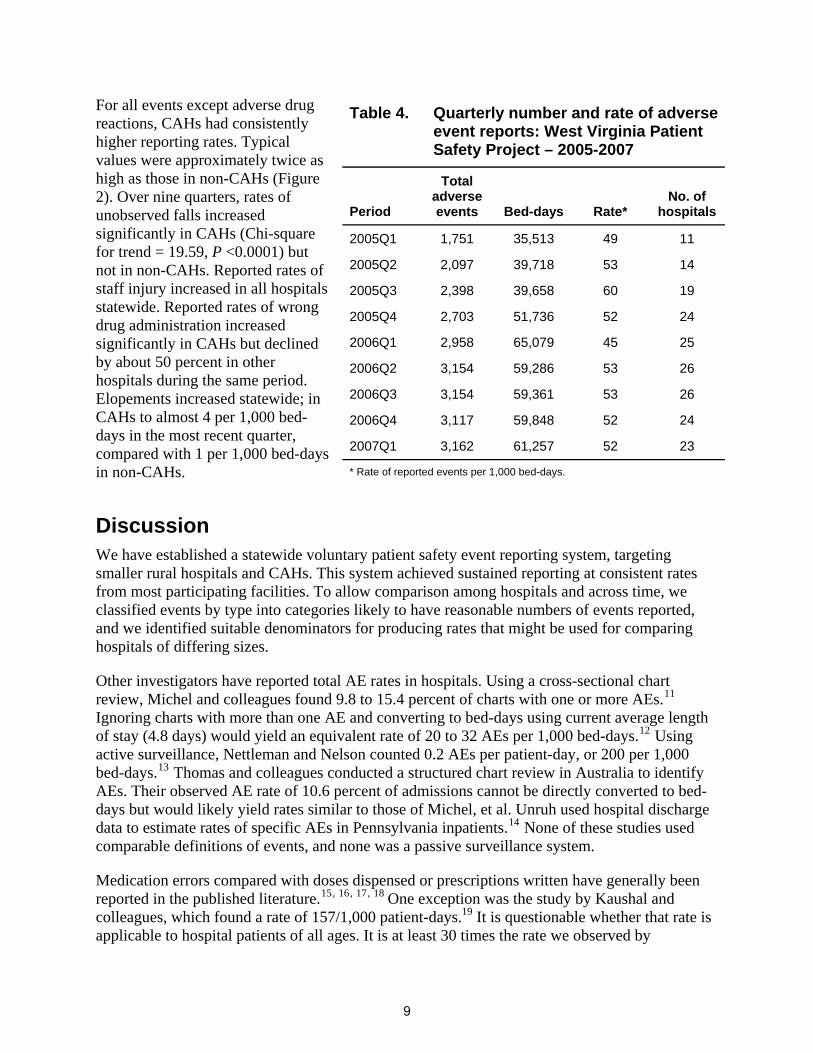
For all events except adverse drug reactions, CAHs had consistently higher reporting rates. Typical values were approximately twice as high as those in non-CAHs (Figure 2). Over nine quarters, rates of unobserved falls increased significantly in CAHs (Chi-square for trend = 19.59, P <0.0001) but not in non-CAHs. Reported rates of staff injury increased in all hospitals statewide. Reported rates of wrong drug administration increased significantly in CAHs but declined by about 50 percent in other hospitals during the same period. Elopements increased statewide; in CAHs to almost 4 per 1,000 bed-days in the most recent quarter, compared with 1 per 1,000 bed-days in non-CAHs.
Table 4. Quarterly number and rate of adverse event reports: West Virginia Patient Safety Project – 2005-2007
Period
Total adverse events Bed-days Rate*
No. of hospitals
2005Q1 1,751 35,513 49 11
2005Q2 2,097 39,718 53 14
2005Q3 2,398 39,658 60 19
2005Q4 2,703 51,736 52 24
2006Q1 2,958 65,079 45 25
2006Q2 3,154 59,286 53 26
2006Q3 3,154 59,361 53 26
2006Q4 3,117 59,848 52 24
2007Q1 3,162 61,257 52 23
* Rate of reported events per 1,000 bed-days.
Discussion We have established a statewide voluntary patient safety event reporting system, targeting smaller rural hospitals and CAHs. This system achieved sustained reporting at consistent rates from most participating facilities. To allow comparison among hospitals and across time, we classified events by type into categories likely to have reasonable numbers of events reported, and we identified suitable denominators for producing rates that might be used for comparing hospitals of differing sizes.
Other investigators have reported total AE rates in hospitals. Using a cross-sectional chart review, Michel and colleagues found 9.8 to 15.4 percent of charts with one or more AEs.11 Ignoring charts with more than one AE and converting to bed-days using current average length of stay (4.8 days) would yield an equivalent rate of 20 to 32 AEs per 1,000 bed-days.12 Using active surveillance, Nettleman and Nelson counted 0.2 AEs per patient-day, or 200 per 1,000 bed-days.13 Thomas and colleagues conducted a structured chart review in Australia to identify AEs. Their observed AE rate of 10.6 percent of admissions cannot be directly converted to bed-days but would likely yield rates similar to those of Michel, et al. Unruh used hospital discharge data to estimate rates of specific AEs in Pennsylvania inpatients.14 None of these studies used comparable definitions of events, and none was a passive surveillance system.
Medication errors compared with doses dispensed or prescriptions written have generally been reported in the published literature.15, 16, 17, 18 One exception was the study by Kaushal andcolleagues, which found a rate of 157/1,000 patient-days.19 It is questionable whether that rate is applicable to hospital patients of all ages. It is at least 30 times the rate we observed by
9

0
1
2
3
4
5
6
Unobserve
d falls
Observe
d Falls
Elopemen
t
Delay i
n test/
treatm
ent
Lab sp
ecim
en-re
lated
Staff In
jury/ex
posure
Omitted M
ed D
ose
Wrong D
rug
Wrong D
ose
Adverse
Dru
g Rea
ction
Patien
t Misi
dentifi
catio
n
CAH
Non CAH
Med
ian
rate
/1,0
00 b
ed-d
ays
combining the four categories of medication AEs in our study (3.1 to 5.5); the large difference in rates is not surprising because Kaushal’s team conducted active surveillance.19
The medical literature contains numerous studies of fall causation and prevention; however, relatively few reports focus on fall rates in institutions, and none are specific to small rural hospitals, including but not limited to CAHs. Morse observed a rate of 2.9/1,000 patient-days in acute care hospitals.20 Hitcho and coworkers reported a rate of 6.1/1,000 patient-days in medicine and neurology wards.21
We speculate that our reported fall rates are consistent with published values because falls are very likely to generate reports in a hospital setting. A typical scenario involves a patient found on the floor by staff. Because this situation raises liability, treatment, and risk-mitigation questions, multiple channels exist for report generation. On the other hand, medication errors are grossly underreported in our surveillance system for two principal reasons: first, many are not recognized when they occur; and second, they are quite common and often have no detected harmful consequences. The large variation in rates of total AEs and the lack of a standardized definition makes comparison with our passive surveillance-based rates difficult. Of more interest is the wide variation in reported events among participating hospitals.
In general, CAHs have been reporting more events on a per-bed-day basis. Rates are typically twice as great in CAHs as they are in other hospitals. We doubt that CAHs are intrinsically less
Figure 2. Median event rates over nine quarters, critical access and noncritical access hospitals: West Virginia Patient Safety Project 2005-2007
10
safe than larger facilities. In some instances, the event rate difference is probably smaller than it should be because the denominator was not proportional to the risk of an event. For example, larger hospitals might well dispense more drugs and do more lab tests than smaller and critical access sites per bed day. The most likely explanation for differences is systematic reporting biases, with CAH staff generally more likely to report. The explanation for these differences must await further research into the risk of AEs and the likelihood of detecting and reporting them in different hospital settings.
Despite these problems related to accuracy, the reporting system has been useful to the hospitals involved. It has helped them recognize that falls are an increasing issue, as evidenced by their participation in a statewide falls-prevention collaborative. In addition, the utility of the reporting system to participating hospitals was specifically examined through a series of key informant interviews with CEOs, risk managers, and floor nurses, which will be the subject of a separate article under development.
A majority of risk managers interviewed reported undertaking a quality improvement (QI) project based on information from ORM. QI efforts focused on falls, patient flow through the emergency room, and medication errors. Floor nurses who were interviewed reported using the data to look at the environment surrounding an event (e.g., falls; and again, pre- and post- the QI intervention to monitor change). Floor nurses were almost unanimous in their positive assessment of ORM related to analysis and use of medication errors to implement change in their medication use process. Nurses said they were able to track particular weaknesses and focus on where the errors were occurring. By researching events, they report becoming more aware of the kinds of errors they were making. Unusual shifts in reporting rates have led to hospital-specific interventions, “…we noticed an increase in falls, and after trending it, we implemented a hospitalwide falls program, plus education with staff – physical therapy, occupational therapy, and a few other people – and had everyone trained in transferring patients, lifting patients, walking patients. Right after that, we saw a decrease in falls.”[Risk Manager]
Conclusion A multihospital, voluntary, AE reporting system involving rural and CAHs generated event reports that were consistent with those appearing in the medical literature. The use of patient-days proved to be both a reasonable and feasible source of denominator data from small facilities with limited human resources; standardization of taxonomy and of denominator populations would increase comparability of reports. Aggregate event rate data have been useful to small hospitals in focusing their efforts to prevent and mitigate AEs.
Acknowledgments This project was supported by grant number 5 UC1 HS014920-02 from the AHRQ, Dr. Gail R. Bellamy, principal investigator. We acknowledge the assistance of Carolyn D. Schade, MLS, who performed the literature searches for the systematic review.
11

Supplementary Data The full list of search criteria for the systematic review and detailed evidence table summarized in this report are available from the authors.
Author Affiliations West Virginia Medical Institute, Inc., Charleston, WV (Dr. Schade, Ms. Ruddick, Mr. Lomely); Florida State University, College of Medicine, Division of Health Affairs, Tallahassee, FL (Dr. Bellamy)
Address correspondence to: Charles P. Schade, MD, MPH, Director of Scientific Support, West Virginia Medical Institute, Inc., 3001 Chesterfield Place, Charleston, WV 25305; e-mail: [email protected].
References
8. Rosenman KD, Kalush A, Reilly MJ, et al. How much work-related injury and illness is missed by the current national surveillance system? J Occup Environ Med 2006; 48: 357-365.
1. Berwick DM, Leape LL. Reducing errors in medicine. Br Med J 1999; 319: 136-137.
9. Stone PW, Horan TC, Shih HC, et al. Comparisons of health care-associated infections identification using two mechanisms for public reporting. Am J Infect Control 2007; 35: 145-149.
2. Leape LL. Error in medicine. JAMA 1994; 272: 1851-1857.
3. Leape LL, Brennan TA, Laird N, et al. The nature of adverse events in hospitalized patients. Results of the Harvard Medical Practice Study II. N Engl J Med 1991; 324: 377-384.
10. Schade CP, Hannah K, Ruddick P, et al. Improving self-reporting of adverse drug events in a West Virginia hospital. Am J Med Qual 2006; 21: 335-341.
4. Leape LL, Woods DD, Hatlie MJ, et al. Promoting patient safety by preventing medical error. JAMA 1998; 280:1444-1447.
11. Michel P, Quenon JL, de Sarasqueta AM, et al. Comparison of three methods for estimating rates of adverse events and rates of preventable adverse events in acute care hospitals. Br Med J 2004; 328: 199. 5. Institute of Medicine, Committee on Health Care
Quality in America. To err is human: Building a safer health system. Washington DC: National Academies Press; 2000.
12. Health, United States 2006 with chartbook on trends in the health of Americans. Hyattsville, MD: National Center for Health Statistics; 2006.
6. Centers for Disease Control and Prevention. Updated guidelines for evaluating public health surveillance systems: Recommendations from the guidelines working group. MMWR 2001; 50(RR-13): 1-35.
13. Nettleman MD, Nelson AP. Adverse occurrences during hospitalization on a general medicine service. Clin Perform Qual Health Care 1994; 2: 67-72.
14. Unruh L. Trends in adverse events in hospitalized patients. J Healthc Qual 2002; 24: 4-10; quiz 10, 18.
7. Emori TG, Edwards JR, Culver DH, et al. Accuracy of reporting nosocomial infections in intensive care unit patients to the National Nosocomial Infections Surveillance System: A pilot study. Infect Control Hosp Epidemiol 1998; 19:308-316.
15. Dean B, Schachter M, Vincent C, et al. Prescribing errors in hospital inpatients: Their incidence and clinical significance. Qual Saf Health Care 2002; 11: 340-344.
12
16. Fortescue EB, Kaushal R, Landrigan CP, et al. Prioritizing strategies for preventing medication errors and adverse drug events in pediatric inpatients. Pediatrics 2003; 111(4 Pt 1): 722-729.
19. Kaushal R, Bates DW, Landrigan C, et al. Medication errors and adverse drug events in pediatric inpatients. JAMA 2001; 285(16): 2114-2120.
20. Morse JM, Morse RM. Calculating fall rates: Methodological concerns. QRB Qual Rev Bull 1988; 14: 369-371.
17. Lesar TS, Briceland L, Stein DS. Factors related to errors in medication prescribing. JAMA 1997; 277: 312-317.
21. Hitcho EB, Krauss MJ, Birge S, et al. Characteristics and circumstances of falls in a hospital setting: A prospective analysis. J Gen Intern Med 2004; 19: 732-739.
18. West DW, Levine S, Magram G, et al. Pediatric medication order error rates related to the mode of order transmission. Arch Pediatr Adolesc Med 1994; 148: 1322-1326.
13