volumetric survey of medina lake and ... survey of medina lake and diversion lake prepared for:...
TRANSCRIPT
VOLUMETRIC SURVEYOF
MEDINA LAKE ANDDIVERSION LAKE
Prepared for:
BEXAR-MEDINA-ATASCOSA COUNTIES WATER CONTROL ANDIMPROVEMENT DISTRICT NUMBER ONE
Prepared by:
The Texas Water Development Board
March 10, 2003

Texas Water Development Board
Craig D. Pedersen, Executive Administrator
Texas Water Development Board
William B. Madden, Chairman Noe Fernandez, Vice-ChairmanCharles W. Jenness Charles L. GerenLynwood Sanders Elaine M. Barrón, M.D.
Authorization for use or reproduction of any original material contained in this publication, i.e. notobtained from other sources, is freely granted. The Board would appreciate acknowledgment.
This report was prepared by the Hydrographic Survey group:
Scot Sullivan, P.E.Duane ThomasSteve Segura
Marc RobichaudWayne Elliott
For more information, please call (512) 936-0848
Published and Distributedby the
Texas Water Development BoardP.O. Box 13231
Austin, Texas 78711-3231

TABLE OF CONTENTS
INTRODUCTION ............................................................................................................................1
HISTORY AND GENERAL INFORMATION OF THE RESERVOIR ...........................................1
HYDROGRAPHIC SURVEYING TECHNOLOGY ........................................................................3GPS Information...................................................................................................................3Equipment and Methodology ................................................................................................4Previous Survey Procedures.................................................................................................5
PRE-SURVEY PROCEDURES .......................................................................................................6
SURVEY CONTROL SETUP ..........................................................................................................7
SURVEY PROCEDURES................................................................................................................8Equipment Calibration and Operation..................................................................................8Field Survey.........................................................................................................................9Data Processing..................................................................................................................10
MEDINA LAKE SURVEY RESULTS...........................................................................................12
DIVERSION LAKE SURVEY RESULTS......................................................................................13
SUMMARY....................................................................................................................................14
APPENDICES
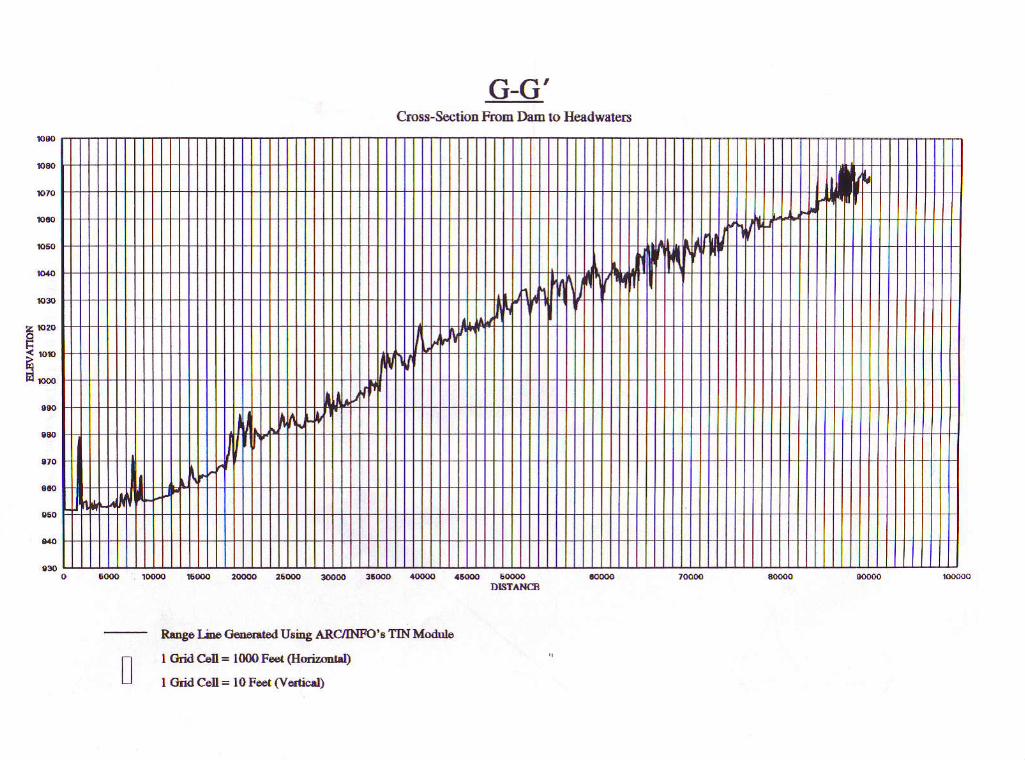
APPENDIX A - DEPTH SOUNDER ACCURACYAPPENDIX B - MEDINA LAKE VOLUME TABLEAPPENDIX C - MEDINA LAKE AREA TABLEAPPENDIX D -AREA-ELEVATION-CAPACITY GRAPH - MEDINA LAKEAPPENDIX E - DIVERSION LAKE VOLUME TABLEAPPENDIX F - DIVERSION LAKE AREA TABLEAPPENDIX G - AREA-ELEVATION-CAPACITY GRAPH - DIVERSION LAKEAPPENDIX H - MEDINA CROSS-SECTION PLOTS
LIST OF FIGURES
FIGURE 1 - LOCATION MAPFIGURE 2 - LOCATION OF SURVEY DATAFIGURE 3 - LOCATION OF SURVEY CONTROL POINTFIGURE 4 - SHADED RELIEFFIGURE 5 - DEPTH CONTOURSFIGURE 6 - MEDINA LAKE 2-D CONTOUR MAPFIGURE 7 - DIVERSION LAKE 2-D CONTOUR MAP
MEDINA LAKE AND DIVERSION LAKE

HYDROGRAPHIC SURVEY REPORT
INTRODUCTION
Staff of the Hydrographic Survey Unit of the Texas Water Development Board (TWDB)
conducted hydrographic surveys on Medina Lake and Diversion Lake in July, 1995. The purpose of
the surveys was to determine the capacity of the lakes at the conservation pool elevation and to
establish baseline information for future surveys. From this information, future surveys will be able
to determine sediment deposition locations and rates over time. Survey results are presented in the
following pages in both graphical and tabular form. All elevations presented in this report will be
reported according to the Medina datum. The Medina datum is approximately 7.8 feet below mean
sea level based on the National Geodetic Vertical Datum of 1929 (NGVD '29). Based on a survey
made prior to 1912, the surface area of Medina Lake at the conservation pool elevation of 1,072.0 feet
was calculated to be 5,575 acres with a corresponding capacity of 254,000 acre-feet. There was no
previous information for Diversion Lake. Information presented in the following report will deal
mainly with the Medina Lake survey. Information regarding the procedures and processing of data for
the Diversion Lake survey will be presented in the section, "Diversion Lake Survey."
HISTORY AND GENERAL INFORMATION OF THE RESERVOIR
Medina Lake is located on the Medina River approximately 16 miles southeast of Bandera,
Tx. The lake and dam facility are owned by the Bexar-Medina-Atascosa Counties Water Control and
Improvement District Number One. Inflows to the lake originate over a 634 square mile drainage
area. At the conservation capacity pool elevation of 1072.0 feet, the lake is approximately 18 miles
long and about 3 miles wide at it's widest point.
Originally the project was built by the Medina Valley Irrigation Company. The water rights
were conveyed by the State Board of Water Engineers under Certificate of Filing # 18 on February
14, 1914. The Medina Valley Irrigation Company went into receivership in 1917 and several years
later became Bexar-Medina-Atascosa Counties Water Improvement District Number One. On
November 1, 1979, a resolution was passed, broadening its powers as a water district and changing
3
its name to the presently known Bexar-Medina-Atascosa Counties Water Control and Improvement
District Number One (BMA). On August 1, 1981, a Certificate of Adjudication # 2130 was issued
by the Texas Water Commission to BMA authorizing the owner to maintain an existing dam and
reservoir known as Medina Lake and to impound not to exceed 237,874 acre-feet of water. BMA was
also authorized to maintain an existing dam and reservoir, known as Diversion Lake and impound
therein not to exceed 4,500 acre-feet of water. Authorization was granted to BMA to use, not to
exceed, 66,000 acre-feet of water per annum from both Medina and Diversion Lake for irrigation of
a maximum 33,000 acres of land within the boundaries of the Bexar-Medina-Atascosa Counties Water
Control and Improvement District Number One. It also authorized the BMA to use , not to exceed 750
acre-feet of water per annum by the residents of the district for domestic and livestock purposes.
Certificate of Adjudication # 2130 was amended several times. The latest amendment, # 2130C, was
filed September 3, 1993 for the purpose to clarify all use authorizations. The total amount of water
for usage did not change but the purpose was changed to include irrigation, municipal and industrial
purposes.
Medina Dam construction commenced in 1912 and was completed in 1913. Deliberate
impoundment of water began on May 7, 1913. The project was designed by Bartlett and Ranney of
San Antonio, and the total cost of Medina and Diversion Dams was $2,739,300.
Medina Dam is a gravity-type concrete dam with a length of 1,580 feet, rising 164 feet above
the natural stream bed to an elevation of 1084.0 feet. The uncontrolled spillway is a cut through
natural rock and is 880 feet long with a 3 foot wide cutoff wall located near the right end of the dam.
The water supply outlets consist of 3 steel pipes, 5 feet in diameter, with lift type gates. The invert
elevation of these outlets is elevation 966.5. The low flow outlets consist of 2 steel pipes, 2.5 feet
in diameter, with lift type gates. The invert elevation of these pipes is 920.0
HYDROGRAPHIC SURVEYING TECHNOLOGY
The following sections will describe the equipment and methodology used to conduct this
hydrographic survey. Some of the theory behind Global Positioning System (GPS) technology and it’s
4
accuracy are also addressed.
GPS Information
The following is a brief and simple description of Global Positioning System (GPS)
technology. GPS is a new technology that uses a network of satellites, maintained in precise orbits
around the earth, to determine locations on the surface of the earth. GPS receivers continuously
monitor the broadcasts from the satellites to determine the position of the receiver. With only one
satellite being monitored, the point in question could be located anywhere on a sphere surrounding the
satellite with a radius of the distance measured. The observation of two satellites decreases the
possible location to a finite number of points on a circle where the two spheres intersect. With a third
satellite observation, the unknown location is reduced to two points where all three spheres intersect.
One of these points is obviously in error because its location is in space, and it is ignored. Although
three satellite measurements can fairly accurately locate a point on the earth, the minimum number of
satellites required to determine a three dimensional position within the required accuracy is four. The
fourth measurement compensates for any time discrepancies between the clock on board the satellites
and the clock within the GPS receiver.
GPS technology was developed in the 1960s by the United States Air Force and the defense
establishment. After program funding in the early 1970s, the initial satellite was launched on
February 22, 1978. A four year delay in the launching program occurred after the Challenger space
shuttle disaster. In 1989, the launch schedule was resumed. Full operational capability will be
reached when the NAVSTAR (NAVigation System with Time And Ranging) satellite constellation is
composed of 24 Block II satellites. At the time of the survey, the system had achieved initial
operational capability. A full constellation of 24 satellites, in a combination of Block I (prototype)
and Block II satellites, was fully functional. The NAVSTAR satellites provide data based on the
World Geodetic System (WGS '84) spherical datum. WGS '84 is essentially identical to NAD '83.
The United States Department of Defense (DOD) is currently responsible for implementing
and maintaining the satellite constellation. In an attempt to discourage the use of these survey units
as a guidance tool by hostile forces, the DOD has implemented means of false signal projection called
Selective Availability (S/A). Positions determined by a single receiver when S/A is active result in
5
errors to the actual position of up to 100 meters. These errors can be reduced to centimeters by
performing a static survey with two GPS receivers, one of which is set over a point with known
coordinates. The errors induced by S/A are time-constant. By monitoring the movements of the
satellites over time (one to three hours), the errors can be minimized during post processing of the
collected data and the unknown position computed accurately.
Differential GPS (DGPS) can determine positions of moving objects in real-time or "on-the-
fly." One GPS receiver was set up over a benchmark with known coordinates established by the
hydrographic survey crew. This receiver remained stationary during the survey and monitored the
movements of the satellites overhead. Position corrections were determined and transmitted via a
radio link once per second to a second GPS receiver located on the moving boat. The boat receiver
used these corrections, or differences, in combination with the satellite information it received to
determine its differential location. The large positional errors experienced by a single receiver when
S/A is active are greatly reduced by utilizing DGPS. The reference receiver calculates satellite
corrections based on its known fixed position, which results in positional accuracies within three
meters for the moving receiver. DGPS was used to determine horizontal position only. Vertical
information was supplied by the depth sounder.
Equipment and Methodology
The equipment used in the performance of the hydrographic survey consisted of a 23-foot
aluminum tri-hull SeaArk craft with cabin, equipped with twin 90-Horsepower Johnson outboard
motors. Installed within the enclosed cabin are an Innerspace Helmsman Display (for navigation), an
Innerspace Technology Model 449 Depth Sounder and Model 443 Velocity Profiler, a Trimble
Navigation, Inc. 4000SE GPS receiver, a Motorola Radius radio with an Advanced Electronic
Applications, Inc. packet modem, and an on-board computer. The computer was supported by a dot
matrix printer and a B-size plotter. Power was provided by a water-cooled generator through an in-
line uninterruptible power supply. Reference to brand names does not imply endorsement by the
TWDB.
The shore station included a second Trimble 4000SE GPS receiver, Motorola Radius radio

6
and Advanced Electronic Applications, Inc. packet modem, and an omni-directional antenna mounted
on a modular aluminum tower to a total height of 40 feet. The combination of this equipment provided
a data link with a reported range of 25 miles over level to rolling terrain that does not require that
line-of-sight be maintained with the survey vessel in most conditions, thereby reducing the time
required to conduct the survey.
The GPS equipment, survey vessel, and depth sounder combine together to provide an efficient
hydrographic survey system. As the boat travels across the lake surface, the depth sounder gathers
approximately ten readings of the lake bottom each second. The depth readings are stored on the
survey vessel's on-board computer along with the corrected positional data generated by the boat's
GPS receiver. The daily data files collected are downloaded from the computer and brought to the
office for editing after the survey is completed. During editing, bad data is removed or corrected,
multiple data points are averaged together to get one data point per second, and average depths are
converted to elevation readings based on the daily recorded lake elevation on the day the survey was
performed. Accurate estimates of the lake volume can be quickly determined by building a 3-D model
of the reservoir from the collected data. The level of accuracy is equivalent to or better than previous
methods used to determine lake volumes, some of which are discussed below.
Previous Survey Procedures
Originally, reservoir surveys were conducted with a rope stretched across the reservoir along
pre-determined range lines. A small boat would manually pole the depth at selected intervals along
the rope. Over time, aircraft cable replaced the rope and electronic depth sounders replaced the pole.
The boat was hooked to the cable, and depths were again recorded at selected intervals. This
method, used mainly by the Soil Conservation Service, worked well for small reservoirs.
Larger bodies of water required more involved means to accomplish the survey, mainly due
to increased size. Cables could not be stretched across the body of water, so surveying instruments
were utilized to determine the path of the boat. Monumentation was set for the end points of each line
so the same lines could be used on subsequent surveys. Prior to a survey, each end point had to be
located (and sometimes reestablished) in the field and vegetation cleared so that line of sight could

7
be maintained. One surveyor monitored the path of the boat and issued commands via radio to insure
that it remained on line while a second surveyor determined depth measurement locations by turning
angles. Since it took a major effort to determine each of the points along the line, the depth readings
were spaced quite a distance apart. Another major cost was the land surveying required prior to the
reservoir survey to locate the range line monuments and clear vegetation.
Electronic positioning systems were the next improvement. If triangulation could determine
the boat location by electronic means, then the boat could take continuous depth soundings. A set of
microwave transmitters positioned around the lake at known coordinates would allow the boat to
receive data and calculate its position. Line of site was required, and the configuration of the
transmitters had to be such that the boat remained within the angles of 30 and 150 degrees in respect
to the shore stations. The maximum range of most of these systems was about 20 miles. Each shore
station had to be accurately located by survey, and the location monumented for future use. Any errors
in the land surveying resulted in significant errors that were difficult to detect. Large reservoirs
required multiple shore stations and a crew to move the shore stations to the next location as the
survey progressed. Land surveying was still a major cost.
Another method used mainly prior to construction utilized aerial photography to generate
elevation contours which could then be used to calculate the volume of the reservoir. Fairly accurate
results could be obtained, although the vertical accuracy of the aerial topography was generally one-
half of the contour interval or + five feet for a ten-foot contour interval. This method could be quite
costly and was only applicable in areas that were not inundated.
PRE-SURVEY PROCEDURES
The reservoir's surface area was determined prior to the survey by digitizing with AutoCad
software contour 1064.0 (the equivalent conservation pool capacity elevation in NGVD datum used
by the USGS) upstream from the dam on two USGS quad sheets. The names of the quad sheets are as
follows: MEDINA LAKE, TX 1964 (Photorevised 1982) and PIPE CREEK, TX 1970 (Photorevised
1982). The graphic boundary file created was then transformed into the proper datum, from NAD '27

8
datum to NAD '83, using Environmental Systems Research Institutes's (ESRI) Arc/Info project
command with the NADCOM parameters. The area of the lake boundary was checked to verify that
the area was the same in both datums.
The survey layout was designed by placing survey track lines at 500 foot intervals across the
lake. The survey design for this lake required approximately 258 survey lines to be placed along the
length of the lake. Survey setup files were created using Coastal Oceangraphics, Inc. Hypack software
for each group of track lines that represented a specific section of the lake. The setup files were
copied onto diskettes for use during the field survey.
SURVEY CONTROL SETUP
The first task of the Hydrographic Survey field staff after arriving at Medina Lake was to
establish a horizontal reference control point. Figure 3 shows the location of the control point
established. This location was chosen due to the close proximity to the reservoir and the security of
the area.
Prior to the field survey, TWDB staff had researched locations of known first-order
benchmarks and requested BMA staff to physically locate the associated monuments. Of the
monuments found, the one chosen to provide horizontal control for the survey was a U. S. Geological
Survey first-order monument named SCHMIDT located approximately 10 miles east of Hondo, Tx..
The coordinates for the monument are published as Latitude 29° 22' 14.23872"N and Longitude 99°
00' 14.54646"W.
On July 5, 1995, TWDB staff performed a static survey to determine the WGS'84 coordinates
of the lake survey control point. The control point used for the shore station was a nail set in concrete
at the west end of the dam's crest. The GPS receivers were set up over each point and satellite data
were gathered for approximately one hour, with up to six satellites visible at the same time to the
receivers.
Once data collection ended, the data were retrieved and processed from both receivers, using
9
Trimble Trimvec software, to determine the coordinates for the control point. The WGS' 84
coordinates were determined to be North latitude 29° 32' 27.28214" and West longitude 98° 56'
12.47555".
Using the newly determined coordinates, a shore station was set up over the control point to
provide horizontal control during the survey. The coordinates from the static survey were entered into
the GPS receiver located over the control point to fix its location. Data received during the survey
could then be corrected and broadcast to the GPS receiver on the moving boat during the survey.
SURVEY PROCEDURES
The following procedures were followed during the hydrographic survey of Medina Lake
performed by the TWDB. Information regarding equipment calibration and operation, the field survey,
and data processing is presented.
Equipment Calibration and Operation
During the survey, the GPS receivers were operated in the following DGPS modes. The
reference station receiver was set to a horizontal mask of 0°, to acquire information on the rising
satellites. A horizontal mask of 10° was used on the roving receiver for the purpose of calculating
better horizontal positions. A PDOP (Position Dilution of Precision) limit of 7 was set for both
receivers. The DGPS positions are known to be within acceptable limits of horizontal accuracy when
the PDOP is seven (7) or less. An internal alarm sounds if the PDOP rises above seven to advise the
field crew that the horizontal position has degraded to an unacceptable level.
Prior to the survey, TWDB staff verified the horizontal accuracy of the DGPS used during the
Medina Lake survey to be within the specified accuracy of three meters by the following procedure.
The shore station was set up over a known United States Geological Service (USGS) first order
monument and placed in differential mode. The second receiver, directly connected to the boat with
its interface computer, was placed over another known USGS first order monument and data was

10
collected for 60 minutes in the same manner as during a survey. Based on the differentially-corrected
coordinates obtained and the published coordinates for both monuments, the resulting positions fell
within a three-meter radius of the actual known monument position.
At the beginning of each surveying day, the depth sounder was calibrated with the Innerspace
Velocity Profiler. The Velocity Profiler calculates an average speed of sound through the water
column of interest for a designated draft value of the boat (draft is the vertical distance that the boat
penetrates the water surface). The draft of the boat was previously determined to average 1.2 ft. The
velocity profiler probe is placed in the water to moisten and acclimate the probe. The probe is then
raised to the water surface where the depth is zeroed. The probe is lowered on a cable to just below
the maximum depth set for the water column, and then raised to the surface. The unit displays an
average speed of sound for a given water depth and draft, which is entered into the depth sounder.
The depth value on the depth sounder was then checked manually with a measuring tape to ensure that
the depth sounder was properly calibrated and operating correctly. During the survey of Medina Lake,
the speed of sound in the water column varied daily between 4,936 and 4,942 feet per second. Based
on the measured speed of sound for various depths, and the average speed of sound calculated for the
entire water column, the depth sounder is accurate to within +0.2 feet, plus an estimated error of +0.3
feet due to the plane of the boat for a total accuracy of +0.5 feet for any instantaneous reading. These
errors tend to be minimized over the entire survey, since some are plus readings and some are minus
readings. Further information on these calculations is presented in Appendix A.
Field Survey
Data was collected on Medina Lake during the period of July 18-20, 1995. Approximately
57,570 data points were collected over the 92.47 miles traveled along the pre-planned survey lines
and the random data-collection lines. These points were stored digitally on the boat's computer in 234
data files. Data were not collected in areas of shallow water (depths less than 3.0 ft.) or with
significant obstructions unless these areas represented a large amount of water. Random data points
were collected, when determined necessary by the field crew, by manually measuring the depth with
a surveying rod and entering the depth value into the data file. As each point was entered, the DGPS
horizontal position was stored automatically with each return keystroke on the computer. The boat

11
was moving slowly during this period so positions stored were within the stated accuracy of + 3
meters to the point poled. Figure 2 shows the actual location of the data collection points.
The collected data were stored in individual data files for each pre-plotted range line or
random data collection events. These files were downloaded to diskettes at the end of each day for
future processing.
Data Processing
The collected data were down-loaded from diskettes onto the TWDB's computer network.
The diskettes were then stored in a secured, safe location for future reference as needed. To process
the data, the EDIT routine in the Hypack Program was run on each raw data file. Data points such as
depth spikes or data with missing depth or positional information were deleted from the file. The
depth information collected every 0.1 seconds was averaged to get one reading for each second of
data collection. A correction for the lake elevation at the time of data collection was also applied to
each file during the EDIT routine. During the survey, the water surface elevation ranged daily from
1,056.37 to 1,056.40 feet. After all changes had been made to the raw data file, the edited file was
saved with a different extension. After all the files were edited, the edited files were combined into
a single data file, representative of the lake, to be used with the GIS software to develop a model of
the lake's bottom surface.
An aerial survey was flown by Tobin Surveys, Inc. of the lake in 1984 and 1985. Information
from this survey was used to supplement the TWDB survey for the area from elevation 994.88 to
elevation 1080.0. 39,947 data points inside the lake below elevation 1080.0 feet were determined
from the aerial photos using photo-metric processes.
The resulting DOS data file was imported into the UNIX operating system used to run
Environmental System Research Institutes's (ESRI) Arc/Info GIS software. The latitude and longitude
coordinates of each point were then converted to decimal degrees by a UNIX awk command. The awk
command manipulates the data file format into a MASS points format for use by the GIS software. The
graphic boundary file previously digitized was also imported.

12
To develop a model of the lake using both the TWDB and Tobin data, a new boundary was
digitized from the maps used to create the survey lines file in the Pre-survey Procedures. Contour
elevation 1080.0 was digitized upstream from the dam. The file was then converted from NAD ‘27
to NAD ‘83. The NAD ‘83 file was then converted to the Medina datum by adding 7.8 feet to the
contour elevation or elevation 1087.8. This file was then down-sized to elevation 1080 based on the
location of any of the Tobin data that was at elevation 1080 or less. The Board does not represent any
of the contour lines developed in this report to be actual land versus water boundaries. Instead, it is
a graphical approximation of the actual boundary used solely to compute the volume and area of the
lake.
The edited MASS points and modified boundary file were used to create a Digital Terrain
Model (DTM) of the reservoir's bottom surface using Arc/Info's TIN module. The module builds an
irregular triangulated network from the data points and the boundary file. This software uses a method
known as Delauney's criteria for triangulation. A triangle is formed between three non-uniformly
spaced points, including all points along the boundary. If there is another point within the triangle,
additional triangles are created until all points lie on the vertex of a triangle. All of the data points
are preserved for use in determining the solution of the model by using this method. The generated
network of three-dimensional triangular planes represents the actual bottom surface. Once the
triangulated irregular network (TIN) is formed, the software then calculates elevations along the
triangle surface plane by solving the equations for elevation along each leg of the triangle. Information
for the entire reservoir area can be determined from the triangulated irregular network created using
this method of interpolation.
There were some areas where values could not be calculated by interpolation because of a
lack of information along the boundary of the reservoir. "Flat triangles" were drawn at these
locations. Arc/Info does not use flat triangle areas in the volume or contouring features of the model.
These areas were determined to insignificant on Medina Lake. Therefore no additional points were
required for interpolation and contouring of the entire lake surface. The TIN product then calculated
the surface area and volume of the entire reservoir at one-tenth of a foot intervals from the three-
dimensional triangular plane surface representation. The computed reservoir volume table is

13
presented in Appendix B and the area table in Appendix C. An elevation-area-volume graph is
presented in Appendix D.
Other presentations developed from the model include a shaded relief map and a shaded depth
range map. To develop the shaded relief map, the three-dimensional triangular surface was modified
by a GRIDSHADE command. Colors were assigned to different elevation values of the grid. Using
the command COLORRAMP, a set of colors that varied from navy to yellow was created. The lower
elevation was assigned the color of navy, and the lake upper pool elevation was assigned the color
of yellow. Different color shades were assigned to the different depths in between. Figure 4 presents
the resulting depth shaded representation of the lake. Figure 5 presents a similar version of the same
map, using bands of color for selected depth intervals. The color increases in intensity from the
shallow contour bands to the deep water bands.
The DTM was then smoothed and linear smoothing algorithms were applied to the smoothed
model to produce smoother contours. The resulting contour map of the bottom surface at ten-foot
intervals is presented in Figure 6.
MEDINA LAKE SURVEY RESULTS
Medina Lake is located on the Medina River in Bandera and Medina Counties. The major
tributaries that flow into the main body of the lake are Mescal and Elm Creeks. This pristine lake with
it's clear waters lies west of San Antonio in the limestone outcrop of the Texas Hill Country. Over
one dozen coves and hollows with steep canyon walls are located along the shoreline from the dam
upstream to Turks Head on the west bank and Goat Hill on the east bank. The elevation relief
becomes more gentle in the upper reaches of the lake's head waters. While collecting data the field
crew rarely encountered any navigational hazards such as stumps. The crew did locate a few sand
bars in the flats and upper reaches. Lake grasses were also encountered in the shallow areas at the
upper end of the lake.
Results from the 1995 survey indicate Medina Lake now encompasses around 6,066 surface

14
acres and contains a volume of 254,843 acre-feet at the conservation pool elevation of 1072.0 feet.
The volume at elevation 1080.0 was 305,784 acre-feet and the surface area was 6,742 acres. The
shoreline at conservation pool was calculated to be 71.09 miles. The shoreline for elevation 1080.0
was calculated to be 87.76 miles. The lowest elevation encountered was around elevation 933.2 feet,
or 138.8 feet of depth when the lake is at the top of the conservation pool. This point was found 1,800
feet north of the dam.
The storage volume calculated by the 1995 survey is approximately 2.5 percent less than the
previous record information for the lake. The lowest gated outlet invert elevation is at elevation 920.0
feet. There is no dead storage volume at this elevation so the conservation storage capacity for the
lake is 254,843 acre-feet.
DIVERSION LAKE SURVEY RESULTS
The field survey on the Diversion Lake was performed on July 12, 1995. The method used
to performed the field survey was a modified range line survey. Cross-sections were located and an
electronic distance measuring device was used to determined the lengths of the cross-sections. A 14
foot boat with a recording fathometer was then driven at a constant speed across the lake to create a
bottom profile. The survey of Diversion Lake consisted of a total of 13 cross-sectional lines. After
the survey, the data was processed and coverages were created in ArcInfo. A TIN model similar to
the model created for Medina Lake was created. Additional data points were interpolated in between
the cross-sections for contouring purposes. An area-elevation-capacity table was created from the
resultant model. Figure 7 shows the cross-section locations and the contour lines that were created.
The volume of the Diversion Lake was calculated from this survey to be 2,555 acre-feet at elevation
926.5 and the surface area was 169 acres.
SUMMARY
Medina Lake and Dam were completed in 1913 and deliberate impoundment of water began
on May 7, 1913. Initial storage calculations estimated the volume of the lake at the conservation pool
elevation of 1072.0 to be 254,000 acre-feet with a surface area of 5,575 acres. There was no prior

15
information on the capacity of the Diversion Lake.
During the period July 18-20, 1995, a hydrographic survey of Medina Lake was performed
by the Texas Water Development Board's Hydrographic Survey Program. The water elevation of the
lake during this period ranged from 1056.37 - 1056.40 ft., or about 16 ft below the conservation pool
elevation. Additional data from an aerial survey performed by Tobin Surveys, Inc. in 1984 and 1985
provided additional information from elevation 994.88 to 1080.0. The Tobin data was merged with
the TWDB data at the request of BMA from which the TWDB developed a model of the entire depth
range of the lake up to elevation 1080.0. Results from the survey indicate that the lake's capacity at
the conservation pool elevation of 1072.0 feet was 254,843 acre-feet and the lake’s capacity at
elevation 1080.0 was 305,784 acre-feet. The previous storage capacity for Medina Lake, based on
a survey made prior to 1912, was estimated at 254,000 acre-feet for elevation 1072.0 and 300,000
acre-feet at elevation 1080.0. The storage information generated by the TWDB and Tobin Surveys,
Inc. shows no loss of storage during the last 84 years in Medina Lake.
In addition to the survey on Medina Lake, TWDB staff performed a modified range line
survey of Diversion Lake on July 12, 1995. From this survey, the capacity of Diversion Lake at
elevation 926.5 was determined to be 2,555 acre-feet.
It is difficult to compare the original design information and the information generated from
the TWDB and Tobin Surveys, Inc. because little is know about the original survey procedures and
data. However, the TWDB considers the 1995 survey to be a significant improvement over previous
survey procedures and recommends that the same methodology be used in five to ten years or after
major flood events to monitor changes to the lake's storage capacity. The second survey will remove
any noticeable errors between the previous survey and the 1995 survey and will facilitate accurate
calculations of sedimentation rates and storage losses presently occurring in Medina Lake.

A-1
CALCULATION OF DEPTH SOUNDER ACCURACY
This methodology was extracted from the Innerspace Technology, Inc. Operation Manual for the
Model 443 Velocity Profiler.
For the following examples, t = (D - d)/V
where: tD = travel time of the sound pulse, in seconds (at depth = D)D = depth, in feetd = draft = 1.2 feetV = speed of sound, in feet per second
To calculate the error of a measurement based on differences in the actual versus averagespeed of sound, the same equation is used, in this format:
D = [t(V)]+d
For the water column from 2 to 30 feet: V = 4832 fps
t30 = (30-1.2)/4832 = 0.00596 sec.
For the water column from 2 to 45 feet: V = 4808 fps
t45 =(45-1.2)/4808 =0.00911 sec.
For a measurement at 20 feet (within the 2 to 30 foot column with V = 4832 fps):
D20 = [((20-1.2)/4832)(4808)]+1.2 = 19.9' (-0.1')
For a measurement at 30 feet (within the 2 to 30 foot column with V = 4832 fps):
D30 = [((30-1.2)/4832)(4808)]+1.2 = 29.9' (-0.1')
For a measurement at 50 feet (within the 2 to 60 foot column with V = 4799 fps):
D50 = [((50-1.2)/4799)(4808)]+1.2 = 50.1' (+0.1')

A-2
For the water column from 2 to 60 feet: V = 4799 fps Assumed V80 = 4785 fps
t60 =(60-1.2)/4799 =0.01225 sec.
For a measurement at 10 feet (within the 2 to 30 foot column with V = 4832 fps):
D10 = [((10-1.2)/4832)(4799)]+1.2 = 9.9' (-0.1')
For a measurement at 30 feet (within the 2 to 30 foot column with V = 4832 fps):
D30 = [((30-1.2)/4832)(4799)]+1.2 = 29.8' (-0.2')
For a measurement at 45 feet (within the 2 to 45 foot column with V = 4808 fps):
D45 = [((45-1.2)/4808)(4799)]+1.2 = 44.9' (-0.1')
For a measurement at 80 feet (outside the 2 to 60 foot column, assumed V = 4785 fps):
D80 = [((80-1.2)/4785)(4799)]+1.2 = 80.2' (+0.2')

IIItIIIItTITTItIItI
: -av. fEET
9529t39519t t9569579t09t9
961962963
965
964
970
97297'3
9n
9Ta
980981942981904985986987988989990991992tn3
995
998
MEOINA LAKE JULY 1995 SLJRVEY
VOLL]IiIE IN ACRE. FEET. 1 . ?
8 930 3365 69
1 1 1 1 1 7171 181251 259318 317135 145512 554662 674794 808939 954
1A97 11141269 12841159 14791666 1684189
1922?154 21412138 246a2751 2fA43089 3124l45l 31911843 l8a34254 43014703 1749r 184 52315708 l76a6270 63286861 69227181 75118128 81948401 84699498 9569
10220 1029310968 1104511741 1142112511 1?62613369 1145514222 145061 5 1 0 3 1 5 1 9 31 6 0 1 8 1 6 1 1 11696t 1746117940 1805918,11 1901319969 2007t21024 21131221A6 ?22162a216 23429
. 0
?7
1 0 6167243329
531
780924
10811252111916151A73?12724092719ta54341538031 ? 1 '
5131565462136801
806287329427
1 0 1 4 610892116661?4631324414135150111592516€69178l.1188401986t2091721997?3104
. l
l l
36T3
1 ? ?189264356155t6t687422
1 1 3 01306
1711
2209?4992417316035293921
52455818638669Al760842608938
103671 1 1 2 11190?127071313711396152&�16205171r41811819115?017821Ea22326?3442
l
1 3
781 2 8
276166
,71700836985
114713211 5 1 917331972?2162529285031963567396541881413t3365874
7672832790079712
1 1 1 9 81194212749136221446311371162991725418258192172024321346
I1 543a2
2032453n
589
713
8t01000
13431t39175619972?64256028443232560640061432/.891
53845929650371057V6439190n9783
1 0 5 1 6112761?4611287113707145711516516395171521A$71931920388214542251723664
TEXAS TATER DEVELOPMENT BOARD
RESERVOIR VOLUI.4E IABLE
TENTH FOOT
, a , 9
4 52? 24
t5 100151 160227 235311 320404 414509 5246?5 63fn3 767a91 t09
1018 14641216 12341400 14191602 16?I1825 18492474 ?1012550 23792651 264729a' 30203311 33743723 37634131 11734166 46115036 50855516 56006099 615666a1 6741729? rJ517931 79968596 86649286 9356
10000 10021A711 10816r 1509 r 15871?302 1?34?13119 1320?13961 1404914836 1492515710 1543216678 1671317e44 1n$18618 1A73919658 19-16220705 ?081121779 21884228a0 22992?1010 24124
ELEVATION INCRETIENT ]S ONE
1 7 1 916 5086 91
211 ?19293 3A?385 5954A7 498601 6 l l7?6 740865 gn
1016 10321 1 8 1 1 1 9 91162 l38t1560 15011779 180220?7 2044?293 23212591 26Zt2917 2941326a 33043645 3684
4939 49A75110 1493t98t 60426162 66217167 72297001 7&68461 45299146 9?169856 9928
10591 1066611353 1113112141 1?2211?9ra 1305613792 138n14659 1471715556 156,1816488 1658317449 1f5471A437 18t3819452 1955520193 205992,562 2167022658 ?276923782 ?3496

TABLE
ELEVATION INCREMENT IS OI IE TENTI ] 'OOT
. 5 . 6 , 7 . A _ 9
I,IED I NA LAKE JULY 1995 SIIRVEY
VOLUI.IE IN ACRE. FEEI
. t . 2: . E V . F E E T
"000" 0 0 1' ,442
r , 0 0 3' , !04
i , 0 0 61 , 0 0 71 , 0 0 41 , 0 0 91 , 0 1 01 , 0 1 11 , 0 1 21 , 0 1 3
1 , 0 1 5r , 0 1 61 , 0 1 71 , 0 1 81 , 0 1 91 , 0 2 01 ,4211 ,4221,4231,4241 ,4251,4261,0271 , 0 2 81 , 0 ? 91 , 0 3 01 , 0 3 11 , 0 t ?r ,0331 , 0 3 41 , 0 3 51,0361,0371 ,038r ,0391 ,0401 , 0 4 11,4421,043
1,0451,0161 , 0 1 71 ,04E
. 0
242392514126599279?529083303723169333045344413t851373113881440161119574359445241470t848402,46345251754458564605851460620627n64987
719507UAs76929795174216184866876219Uza932889624?99171
142?0510530110a1661117071 1 t 0 3 011&�36121931125519129211133024137007
?1351?552226724
29210J050231826l l t82345713599'371193896710r201?119
4145'
$943t042052749546555666354722644346299765211671786980172192
n1a5
4243185139878999071293577
1425121456141Aa7A7112035I153661147821?2Zt)412t8al129589133111137415
?1170?56102684224074?9334l06ll3196111320347123611437604191?0146761?ZS?459314r62717371
t 1 0 0 7t29015445456466589116104663216654356no77003772435
n41280042426998541?88178909969386696n199775
10281910t928109108112365115744119128122641126249129966133801137421
. 5
2154525759269632419929166107613?0953315731453362453775739274408t642115
157991f548
5119453093,r05257070
6126J6313665660679347427172679751t5776998030582968856a78t458912819115797447
10002103127106243109410112695116041119475122994126616130344131192138?55
?17012t878270862442429594308963224413596
364343790739424409951?608
459724772649529511815t24655252572755935161474636t6658866816a7 0 5 1 17292175106779578056983218859618AB791566
97344100t791034t6r065581497531134?611638?1198231233151269831307231345a5138616
2181821997272442445429f?33t028323653373135136365f6380t7395814 l 1 5 412772
16145
49712t1t69t348055452574805t561
634776 6 1 1 158400707197316975654742168o8tl83508a6237890189185291nA97680
100682103715106€751100771133t811672212417212371312n521 3 1 1 0 1134985139059
?19312611727331?457629Ar?3 1 1 6 032t0033472352743672234247397354131412936
1631918082$49,5175853674556525764659772
64098663386463270988Z�111759117&�758109841774865128929992134950t097974
1009451040551471911 1 0 4 0 t1136901170631205?212107?12n221114E513t386139472
2t0r126?3727454247422994131?93326363141235421366683035839894
41101
1649t142625007951947t3869t t85l57492t998362126613196656568464712?77-3661761657An141361u01986749895409?1219532294276
10128910136510750911072611102111710'12Aa7i124432128093131868135749139887
25168 2528626357 2617827577 2770128828 28955tot 11 3024131126 315593?772 3294934151 3429135564 35TAT37015 3715338510 3466210019 40?0641635 1179613?66 4344211943 4511346664 468431U41 1 21,0244 54449,?1r7 5?3?754065 5126156055 t62r758099 58t0650195 6040862343 625616154? 6476466n? 6702069097 693317146a 7170873904 74156
78995 7925681630 81896u321 4459347066 87343a9a62 9014t92712 9300095615 959089A575 98471
101594 1019001U6n 104988107424 108146111053 111379114359 111691117744 118092121??5 121578121n1 12115612U6' 128€1913?252 13?637136191 t36600140304 114721

IITtTtttI
RESERVOIR VOL1IIEIASLE
I{EDI'IA LAKE JULY 1995 SURVEY
VOLUI4E IH ACRE-FEET ELEVAT]ON INCRENEIII IS ONE IENTII FOOT
. 5 . 6 . 7 . A
, , 0 5 0
' ,45?' , 0 5 3' ,054
. , 0 t 5' ,056
' ,a57
: , 0 5 9j , 0 6 0
1 , 0 6 t1 , 0 6 ?r , 0 6 3
1 . 0 6 51 , 0 61,067r ,0681,0691 , 0 7 0' | ,o71
1,0721 , 0 7 31 , 0 7 11,075r ,0761 , A n1,0781,0791,0801 , 0 8 11 , 0 8 21 ,0831,084
. 0
1 4 1 1 1 914fi741497231511761582J01633841641t2172947177434182600107637192972198188?031.85208a57?1/.104219819225464?31166236961242837248794254823260926267104272359279693246102?925E629914630r7u31?186319174326/.52333508
115ra1458071t01611516?S1591921630591686111734t3178331183101184t1719349019471424401920959821485422039722602623171223751t2434?924939t25543026154026n252ZJ9492803t0286747293239299406306419313271320172327154
11197411623E1506041550801596551641111690891n919178€�24185E01188857194008199211204554209940215405220956226594232319238129
249994256038262155268348274620280969?87393293A92100466307155313957320816327457
. 3
1423991466741 5 1 0 4 8155534160119161801169570
179319184104lE9l6919152919976920509021018,/{2159152215172271624?A972347152146162505952566472627712.a9722n252281608288040294517301129307814a146153?1562328561
1424221471031514911559841605651652n170050171a95179411r84806189881195049200297?0r62521142721650722ZO7A22771123317523930124121125119725725626tt6E269597?75844242214282tB7295201!0t7913064913151553???54129265
1432451171371519361561131610441557511705tr1753e41805101E5t09'190394
1955702A1AZf206162211572217060222640228!01u4454239888245806251800?57865?6100,
27651728288828955529585730215430917:,316022322955329970
14364911797215?aa?156898r 6 1 5 1 4166226171013175A7314040614581f190908196092?01t57?067002121172176112232022204722!463424047624640225240325447626462127|uB2r|150283529289983296513303118109E5431671132t655330676
114A9511810815ZA?9152J551619811667011714951763611811041863181911?3196415z01EEa20723421262e1816E223765229444?31214241065216999253006259047265212?714742m812U\7' l29063!297170303785310555317101321351ll1l8!
. 9
111522 144949148846 149244153277 153726157813 15A271162149 152914167174 1676551719n 172163176854 177146181802 182101186824 187310191959 19?415197139 197661202420 2029r?zoTm 204317213209 213n621a721 219241221t30 224895210017 ?305922t5797 8!3n241655 242245217597 244195253512 254217259700 26431226546? 26644227?102 27273027A420 279056244815 285458?912U 291915297824 29UU301119 3051161 1 1 2 1 9 1 1 1 9 0 ?316093 318785325051 32rn2332091 442799

TEXAS I,JATER DEVELOPI'IENT SOARD
RESERVOIR AREA TABLE
, 8
l 1
263748
89
1 1 01 ? Z1t5
16117'193
262290318
369395120411489515564596
653674702727754741805El0858848922953980
10071055106110841 1 1 5
I,IEDIIIA LAKE JULY 1995 SIRVEY
:!Ev, FEET
9 5 1952953914955956957958959960
962963
965
960969
971972973
975976977974
980981942983944965986947988949990991992995
995
997998999
AREA IN ACRES. 1
30
55
a291
1421 1 41261 3 9t 5 1165181196219244270?99
3513n4034244615015165n
63466068570973576478681?838067497
98410151041106910961124
ELEVAIION IIICREI'IENT IS ONE TENIII F@I
tTIi
. 0
283953
81
1011 1 31?11371 5 0
1it9196? 1 6
296
t4at74400426159497542574602631658645707
7607468 1 0656861
924919986
1 0 1 21018106610951121
. 2
11 6
57728393
1031 1 51 2 7140152
142200??1246
50252835337910,431
505549t80608
663647712EA
7908 1 58418709019t5
10171043107210991127
51 933
8595
1 0 51171101121 5 5170t862032262512781085313583854 1 0418
, 1 4556585
642668692717713n1795820u7476908
970
1023101910n1 1 0 41132
. 5
6
2 134
62
86
t061 t 8131
157171187
2542813 1 0
36135741t
519
588617
67069t719745
79Eg?z
8198n9 1 1944972999
10251052108011A71135
. 6
a2l
6377a7
1071 1 91t2145158172189207231257zut 1 1ll8t&390415
481525,62590620
673697
718n6800825E5Z88291'9479n
10021028105510621 1 1 01 1 3 8
. 7
1 02436
657A8a9a
1091 2 01t4
160
191?092342592871 1 63403663921144tA485530565593623650675700725un98028?E85588t914950974
10041030105410651 1 1 31 1 4 1
1 227385 1688090
1001 1 11231461181611n
?14
- ?6429332131637?398123455
519571599624
680704730n7783807833861891
956985
10101036106310911 1 1 81147
. 3
31 73242587384
116t?8141r54164144?02224249
30trr1356382408
5095535826 1 1639&5690
740769793417u4873
9lE967
102014461071110e1129

RESERVOIR AREA TABLE
IIEDINA LAKE JULY 1995 SI]RVEY
' , ! 0 0
' , 0 0 2' , 0 0 1
' ,005
' ,006
' , 4 4 7' , 0 0 8' , 0 0 9
: , 0 1 01 , 0 t 11 , 4 1 2r , 0 1 31 , 0 1 41 , 0 1 51 , 0 1 61 , 0 1 7t , 0 1 41 , 0 1 91 , 0 2 01 ,4211 ,4221 ,Aza1 ,4241 ,0251 ,4261 ,A271,4241 ,A291 , o t o1 , 0 3 1
1 ,0331,0341 , 0 3 51,0361,0371,0381 ,0391 , 0 4 01,0411,4421,443
1,A45
1 ,4171,01.81,019
. 0
1 1 5 01 1 8 0
124?12Zl130513371369140214391481152615711 6 1 81663l 7 t 01759180818571 9 1 019f220292081213221812?352?042319211921902558?6142674272927412844?&47291?3001t063312932013241
5450354036383E?38724076
. 3
1 1 5 8t1a9122412511283r 1 1 51316137814131151
15101t85163116771f?4
lSZZ1873192419912011?096?11821982251zl05237024412 5 1 02576263526?127152nf2450?9Al2960302010823 1 5 13??53306159031n35643671378639174109
1 1 6 111921223123112461 5 1 8135013821417
1r441t901616164217291774142718781931
24192 1 0 1215322032256?311237f244425172582?61126962750?80?28t t2904
3026t08a31t8
3414ll9a3445357436a2379439914121
1 1 9 51226125E128911211l5 l1345112Q1159150415191591
1686173117831612188319402002?0512106?1ra?2092261231623A52455252425ta2616274227552aa72A6A291129723032309531653211
3107319555EE3693381040041112
11671 1 9 812291251
1324135613881121
1508155315991645169117f9178418J71884
2008206021112163221122662322239224622531?59426522708?760?8122865291929n30383102317232193311311'350445971705342?4421
IS ONE
11701?0112321?64129513271359139?112811681 t 1 315t816041650r 696
179!1UZ149419532013206521172164?2192272?3292399
253826002654271427662E18?471292529al304431093180
33393423351336071717565410124155
. 9
1 1 7 7l20a1249127413021314116613991435
152115671 6 1 3161912054n418011852
J9051965202420762 1 2 7?1782?3022432312
2443255126122aa9272127762A292841293629953056312331943273335631113t31a627374058594065
AREA IN ACRES
1 1 5 1 1 1 5 51183 11861214 1?17124' 12181?76 12n1304 13121t40 13431472 13751406 1409
1445 149015J0 tSl t1176 15801622 16271664 167?1715 1719
1El l 181E1862 18641916 19221979 19852031 20392086 20912134 ?142188 21932240 22462294 2299?356 2tA32477 24!42197 ?5442561 25702624 262925gO ?6852751 271027 2791?6t9 264'2492 ?4972944 29543007 30143069 30753137 31443209 32173289 a29A33ZJ 33813159 31665550 15593619 36601763 37753886 19AZ4087 1099
ELEVATION INCRE ENT. 5 . 6
TEIITH FOOT. 8
1173120512361?6712991t l11462139514t114721517156216081654170017491na184718991959201820742 1 2 22173222122n213524052476
2646266!27192n1za23za762930294930503 1 1 631873265334834323522461737?Aaa464053116'

MEDINA LAKE JiILY 1995 SURVEY
RESERVOIR AREA TASLE
ELEVAI IOI I INCRENENT IS ONE TENTH F@T
. - :V . FEET .O
' ,c to 4186- c t1 4292' , .52 4399' ,a53 1508
' ,054 4617
' ,ot t 4706' ,056 17AA' ,a57 4454' ,058 4926
' , 0 1 9 5 0 0 0' ,060 toat' , 0 6 1 5 1 7 6:,ab7 5257r,06! 5536' , 0 5 4 5 4 1 0i ,065 '1U1,066 55421,A67 5651r,06a 57571,069 56141 ,070 ,9211,071 59941,A72 64661,AT3 61391,A74 62171,075 6295j ,076 6372
1,A7A 65221,079 65941,080 67421,081 &141,0a2 69311,083 70151,084 7098
, 1 , 2
1197 12Aa4303 4313
4120 45?84626 163!1715 172!
4861 406€49ll 49415007 50145099 511051t/ 5192
5313 53505118 54265192 55125590 55985669 56n,764 57725WZ '8l'95928 59356001 600860zJ 60816147 6154
6301 63106379 6347
6529 65376605 66136762 67n6f57 M6912 695070?3 7011
. 3
4Z1A432444424537
4801
19155A22t 1 1 9520052E15357,4335519,645568557n58585913601560886162621063186395
66216747687569587039
12?94331
4545
1fi448084883
t02951?A52095290,364514055275614569157475866595060226095616962186326&42
65526429
6884
7044
. 5
42394345
1r511657171548154490496250375136,2175Z9A5371,447553556215709579550745957602961036 1 n62566t546409
655966376805689269n7056
125013r5
456246654752$211897
,044514452245106,3795454
5629,717580?5885596460366 1 1 06146
6141
656766156a13690069817064
. 7
4260
1570
175948284905
5A5Z515?
5115538654615 5 5 1563757255 8 1 158915971
61176194627'l61496121
657566546422
69917an
. 8 . 9
1271 42414n 4J8a
4579 15874681 46494766 477348t5 1417
4985 199?5060 50675159 51675210 5248
,391 5401t468 54765561 15715645 5653tzJS 57155a18 5A265901 5909sg79 59A76051 605961?5 51326241 62096279 62476357 6361u32 64396506 651465A2 65906662 66716831 64406917 69?56999 70077081 7089
l
I)

700
1,400
2 ,100
^ 2.800
ag
1 3 , 5 0 0
JI
* 4,200l
4,900
5,600
6,300
7,000
300,000
270.000
240,000
210,000
90,000
60,000
30,000
180,000 HUJg.(.)
150,000 E(.)$o
120,000
0975 990 1,005 1,020 1,035
ELEVATION (FEET)
SURFACEAREA CAPACIry
- - - x - - -
MEDINA LAKEJuly 1995 SURVEY
PEpacd by: TWOB Apni 1996
' t ,050 1,065 1,080 1,095
\
\
\
\
x
\
\
I
\
K \
I
IIIIIIIIIIII!IIIIII
TEXAS I,JAIER DEVELoPl,tEllT BOARD
RESERVOIR VOLUiIE TABLE
OIVERSION LAKE JI]].Y 1995 SURVEY
oct 25 1995
l
l
2
91 21 72636
60
901091 1 0154100211?45282322364112165522583648719
878966
1059115712611369148516021f2718581995?136??u2114
VoLL E l{ ACnE- tEEt. 1 . 2.LEV. FEET
880881882883884885886887888889890891892891
895896497898899900901942903
9059069079089099 1 09 1 1912913
9 1 5
9179189 1 99209219?29239249?5926
. 3ELEVATIOII IIICRE'.!ENT IS ONE
'IEN'II IOOI
. 5 . 7 . 8. 0
112
l lt 8?al85062
9a1 1 11351 5 9t86
252249330373122
595661734412895941
10781 1 n12421392150616261753188520232166?3142472
1l
3
7i 0
1 92939
7g95
115137162149
256293
378427481539
668
820
99310841 1 8 8129314051 5 1 81639
14992a3f218025302449
l2
57
t 0
20lo
5 265
117140164192224259297338383433187,16608675
828912
100210971 1 9 81303
15301651
191220512195
?505
I
?357
1 01 5? 13 1
53
8 199
1 1 9'112
167195224261301342347/.38493
615685757
9211 0 1 111071208131414261512
179?192620652210?461212?
1z1t7
1 1t 5
32
5 '6a83
l 0 i
170198231267305317392
494t58621690
9501021111712191325113715511676180519392479222423762538
1l
?358
1 tt 6233l
566984
103124
172201
?70309351497
504561624697772851939
103011271?291336111�4156616491 8 1 819532093223923922r$
l
1235I
1 1
243445, 77186
t 0 5126
17.2042382743 1 3355lAZ4515 1 0570635
7aa861948
1040113712391317146015781702183219672104225421AA
112
68
1 21 72535
5a7288
1071281521742082112743 1 7360407
5 1 6,76
788870957
1117125013t8
159017151a4'r981?122??692124
l
2
l 31 82737486 l
, 7 5
911 1 1
- 133157183
218286326369
5245896557?6804847975
10681167127113801195
1744147220092151??992116

TEXAS I]ATER DEVELOPMENT BOARD
RESERVOIR AREA TABLE
DIVERSION LAKE JULY 1995 SIJRVEY
ocr 25 1995
ELEVATION INCREI.iENI IS ONE TENIH IooT
ELEV. TEET
880881882885884885886887888889890891892891894695896497898899900901902?Aa9049059069079089099109 1 19129159149 1 59169179 1 8919920921922
924925926
AREA IN ACRES
. 1
11123
5
1 01 1
1 61 9
?526l0
3639
525660
70
81a79297
1011041 1 31 1 81241 1 01351 4 1
155
' ? . 1. 0
1l2235
1 01 t1 21 31 61 8
3033363942
5 15660
70
8186
97
147112117124129135
151163
. 5 . T . 8
112z3
59
1 0t 1
1 9
z4263 1
3739
18
61
65
71
a2a7929a
1031081 1 31 1 6125130136111
156165
I122l
5
t 01 1
1 7
22
3154
40
4855
61
71
a28a9398
1041091141 1 9126131116112144156166
1221
5
1 01 11 l
1 71 9222426l 1
3740
n8366
99
109
1191261 3 1137112148157167
1
l
z?3
59
1 0
1 11 72A
32
555862
7a8589
n1 0 51 1 0115120127132137143119158
l
?23
5
1 11 21 5
1 720
50
58
737Aa4E995
1 0 01051 1 01 1 5121127113118
119159
11z25
51 01 11 Z1 5
1 8202?
32
38
50545963
79849095
1011061 1 11 1 6121128113139
150160
112zl
t 01 1
1 820
25
r5384 1
50555963
80859096
1 0 11061 1 11 1 61ZZ1241341391451 5 0161
l
122l
t 01 11 2
1 E21
28
!9
155 1t t59
6875808591
1 0 2147112117
12911411.01151 5 1162

fr l
1,800 quJccg
-
1,200 Q
6uJto 8 0g
LUE
LIJ
ff 120ccla
3,000
2,400
600
ELEVATION (FEET)
IIIIIIIIIIIIIIIII
IIt
880 885 890 89s 9oo 905 910 915 920 925r 030200 9875
SURFACEABEA CAPACITY
DIVERSION LAKEJulY 1995 Survey
Prepared bY: TWDB August 1996

iE
s1
i.
1F
i E
i;
e.
E!
"=
!3
Ir
IT
iE
YI
rl
st
'E
.l
(J
O
8"
F P
RaI
E E
E F
E !
E E
EE
g
; E
i E
: B
NO
II1. 'E
I
il
I

ql
.s5 t
aF
EE
F:
:q !
x;
ez
tl
FE
Rt
rg
PR
E
il
E
vl
tl
gP
P
I
Te
ee
eE
SE
EE
Ea
sE
ce
sE
NO
LIVA
iTE
I
I
t\
l
YI
/\
l
t F
!c
tE
i
2 f
,i
FA
tz
tE
EN
:
5u
5E
E'
gt
t
tt
,t
oo
EI
'E
t8
!IIttE
--
i.-.-
-il*
Bc
:sd
3i

a<
I
i
E.
rF
Eg
Ft
di
;L
85
.9
€g
tv
.E
E?
dq
3€
:<
)E
nt
fi
vl
ll
l
"r
u9
4E
E
TIIIIIII t
EE
EE
Eg
t!
!E
tE
tt
t:
3IIO
IIVA
iTE
I
brrril
1 E
E>
Fa
Z.
EE
'-
si
E U
EE
1.
;E
.E
Nr
r
E 9
';
i
;l
r
-
c
gQ
€.
6
= -
SO
rl
l:
o:
=I
.9
,9
er
v:
:
sE
is
E
ov
8q
--
8'
.
E*-*E
E s E
E B
E t
t I
t 3
$ :
sN
OIIY
A'N
A

z-ll
Eg
:6
=z
Ei
o;
-5
;.
ss
:e
B I
'E
vI
tl
E!
gN
OlI'\l rE
t
:zz;\
?C
F:
-F
a
g|
;;
Ei?;52
Ic8I
z
eE
EE
EE
El
EE
se
ss
s:
e
t
qEc-)
III!lIN
OIIV
AS
:EI

FIGURE 1
MEDINA LAKElrcation MaD
DINA COUNTY
PREPARED BY: TWDB August, 1996

FIGURE 2
MEDINA I-AKELocatiotr of Survey Data
PRIFARED BY: TWDB August, 1996


FIGURE 4
MEDINA LAKESh4ded Relief
It
$1'-5500'
Uovatio! FrcDn3.2F\.
Elovatio!10EO R.
PREPARED BY: TWDB August, 1996

FIGURE 5
MEDINA LAKEryh RaDges
Ii
I1"-5500'
PREPARED Bt TWDB Augurt, 1

BANDERA AND MEDINACOUNTIES
MEDINA LAKEContour Map
EXPLANATION10 Ft. Contour Lines
5 Ft. Contour Lines
Top of Dam Elevation1080 Ft.
Conservation Pool Elevation1072 Ft.
Cross Section Line
Cross Section Line FromDam to Headwaters
Match Line
Match Line
Medina Dam
G
G
A
A
B B
C
CD D
E E
F F
PREPARED BY: TWDB August, 1996