volumetric and sediment survey of lake … the hydrographic survey team of the twdb conducted a...
TRANSCRIPT

VOLUMETRIC and
SEDIMENT SURVEY OF
LAKE CHEROKEE
Prepared for:
CHEROKEE WATER COMPANY
Prepared by: Texas Water Development Board
December 1, 2004

Texas Water Development Board
J. Kevin Ward, Executive Administrator
Texas Water Development Board
E. G. Rod Pittman, Chairman Jack Hunt, Vice Chairman William W. Meadows, Member Thomas Weir Labatt III, Member Dario Vidal Guerra, Jr., Member James Herring, Member
Authorization for use or reproduction of any original material contained in this publication, i.e. not obtained from other sources, is freely granted. The Board would appreciate acknowledgment.
This report was prepared by:
Duane Thomas Randall Burns
Barney Austin, Ph.D.
Published and Distributed by the
Texas Water Development Board P.O. Box 13231
Austin, Texas 78711-3231

TABLE OF CONTENTS INTRODUCTION .........................................................................................................................1
METHODS, EQUIPMENT, AND PROCEDURES......................................................................3
RESULTS ......................................................................................................................................4
SUMMARY OF SEDIMENTATION ESTIMATES FOR LAKE CHEROKEE, TEXAS...........4
1959 Soil Conservation Service Bulletin 5912 ......................................................................5 1960 Soil Conservation Service Survey.................................................................................5 1979 Soil Conservation Service Report 268 ..........................................................................6 1986 TWDB Reconnaissance Survey ....................................................................................7 1996 TWDB Volumetric Survey............................................................................................7 2003 TWDB Volumetric and Sediment Survey.....................................................................8 DISCUSSION ........................................................................................................................8
REFERENCES ............................................................................................................................11
APPENDIX A – VOLUME TABLE 2003
APPENDIX B – VOLUME TABLE 1997 (revised)
APPENDIX C – AREA TABLE 2003
APPENDIX D – AREA TABLE 1997 (revised)
APPENDIX E – ELEVATION-VOLUME GRAPH
APPENDIX F – ELEVATION-AREA GRAPH
APPENDIX G – VOLUME OF SEDIMENTATION vs. ELEVATION RANGE GRAPH
APPENDIX H – RANGELINE ENDPOINTS
APPENDIX I – RANGELINE PLOTS
APPENDIX J – BAYLOR UNIVERSITY CORE SAMPLING REPORT
APPENDIX K – EQUIPMENT, PROCEDURES AND METHODS
VOLUMETRIC SURVEYING TECHNOLOGY...................................................................i Equipment.......................................................................................................i
PRE-SURVEY PROCEDURES .............................................................................................i SURVEY PROCEDURES .................................................................................................... ii
Equipment Calibration and Operation...........................................................ii Field Survey................................................................................................. iii Data Processing ............................................................................................iv

LIST OF TABLES
Table 1. Cherokee Dam and Lake Cherokee Pertinent Data .........................................................2
Table 2. Area, Volume, and Sedimentation Rate Comparisons for Lake Cherokee, Texas.
Sedimentation rates are based on a 158-mi2 watershed. ......................................................10
LIST OF FIGURES Figure 1 - Upstream reach of Lake Cherokee................................................................................1
Figure 2 - Lake Cherokee Watershed ............................................................................................6
Figure 3 - 1960 Boundary vs. 2003 Boundary...............................................................................9
Figure 4 - Location Map …………………………………………………………………….End
Figure 5 - Location of Survey Data …………………………………………………………End
Figure 6, 6a, 6b - Sediment Location and Thickness ……………………………………….End
Figure 7a - 7e - Sediment Depth Ranges ..………………………………………………….End
Figure 8 - Elevation Relief Map ………….…………………………………………………End
Figure 9 – 2-ft Contour Map ……………………………………………………………..Pocket

EXECUTIVE OVERVIEW
The Texas Water Development Board (TWDB) and Lake Cherokee Water Company
entered into contract TWDB 2004-4801-059 in December 2003 to survey the capacity of the lake
at the conservation pool elevation and to estimate the post-impoundment sediment volume. Staff
of the Hydrographic Survey Team of the TWDB conducted a volumetric and sediment survey of
Lake Cherokee during the period of November 10 through 13, 2003. During the November
survey, the water levels remained at a constant elevation of 278.6 ft. Staff returned on March 13,
2004, to verify estimated data in the lake’s upper reaches. During the March trip, the lake was
0.5 ft above the conservation pool elevation (CPE) of 280.0 ft elevation at elevation 280.5 ft.
For this survey, staff delineated the lake boundary (shoreline) using digital orthophoto
quadrangle images (DOQs) photographed in March 1995. Using the Global Positioning System
(GPS) and commercially available guidance software, depth and positional data were collected
along a layout of transects (pre-plotted navigation lines) spaced approximately 500 feet apart.
Acoustic sub-bottom profiles were taken with a three-frequency depth sounding system
operating at 200, 50, and 24 kilohertz (kHz). Eight core samples were taken throughout the lake
to physically validate the acoustic measurement of sediment thickness.
Approximately 68,000 data points were collected over 80 miles of pre-planned transects.
The results of the current survey indicate the lake encompasses 3,467 surface acres and has a
capacity of 43,737 acre-feet (ac-ft) at elevation 280.0 ft. The total post-impoundment sediment
volume was estimated to be 1,279 ac-ft or 23 ac-ft/yr. The average annual sedimentation rate
over 55 years in the Lake Cherokee watershed (158 mi2) was estimated to be 0.15 ac-ft/mi2/yr.

1
LAKE CHEROKEE VOLUMETRIC and SEDIMENTATION SURVEY
REPORT INTRODUCTION
The Hydrographic Survey Team of the Texas Water Development Board (TWDB)
conducted a volumetric and sediment survey of Lake Cherokee to determine its capacity at
conservation pool elevation and estimate the post-impoundment sediment volume. They first
visited the lake November 10 through 13, 2003, and then returned on March 13, 2004, to verify
estimated data in its upstream reach (Figure 1). Lake Cherokee impounds Mill Creek from the
south and Barnes, Bacon, and Tiawichi Creeks from the west. All four creeks feed into an area of
the lake known as Beaver Marsh southwest of FM 2011.
Figure 1. Upstream reach of Lake Cherokee
showing range lines established in 1960 by
the Soil Conservation Service (SCS).
Superimposed on 1995 aerial photos are the
2003 TWDB (blue) and 1960 SCS (light
gray) boundaries. The red points indicate
where TWDB staff verified depths during the
March visit. Smaller black points are
estimated depths used in the 2003 model.
The vertical datum used during this survey is referenced to the lake elevation gauge used
by the Cherokee Water Company. Volume and area calculations in this report are referenced to
water levels provided by the Cherokee Water Company gauge and are presented in Appendix A
and C respectively. The elevation volume and elevation area tables in the TWDB 1997 report

2
were revised in order to use the same boundary as this report (2003) and are presented here in
Appendix B and D.
A full discussion of the lake history and general information, including water rights
permits and adjudications, can be found in the 1997 TWDB report “Volumetric Survey of Lake
Cherokee.”1 Summaries of previous sedimentation rates for the Lake Cherokee watershed are
presented and discussed. The following table summarizes information for Cherokee Dam and
Lake Cherokee based on information furnished by the Cherokee Water Company2.
Table 1. Cherokee Dam and Lake Cherokee Pertinent Data
Owner of Dam and Facilities: Cherokee Water Company, Longview, Texas
Engineer (Design)
Powell and Powell Location:
On Cherokee Bayou in Gregg and Rusk Counties, 12 miles southeast of Longview, Texas (Figure 1).
Drainage area:
158 square miles. Dam: Type Earthfill
Length (including spillway) 4,000 ft Maximum height 42 ft structure, 39 ft hydraulic Top width 20 ft Top Elevation 295.0 above msl Spillway (emergency): Location Near right end of dam Type Cut in natural ground Crest Length 160 ft Crest elevation 287.7 ft above msl Spillway (service): Location Left end of dam Type Uncontrolled concrete structure Crest Length 828+ ft
3
Crest elevation 280.0 ft above msl Outlet works: Type Concrete pipe, 18-inch diameter Invert elevation (lowest gate) 260.0 ft above msl Control Gate valve operated from tower Reservoir Data: The following information was generated for this report: FEATURE ELEVATION CAPACITY AREA (Feet) (Acre-feet) (Acres) Top of Conservation Storage Space 280.0 43,737 3,467 Lowest gated outlet (invert) 260.0 4,714 849
METHODS, EQUIPMENT, AND PROCEDURES
A lake boundary, used in preparing a transect line file, was first developed using
Geographic Information System (GIS) software and recent aerial photos. Transects or range lines
were drawn using commercially available hydrographic surveying software. The survey crew
spaced these transects 500 ft apart and positioned them as perpendicular to existing creek and
streambeds as possible. During the data collection phase of the survey, the crew navigated the
boat along each transect line using a Global Positioning System (GPS) receiver integrated with
the surveying software. Depth reading from a multi-frequency sub-bottom profiler and positional
data from the GPS were recorded on an on-board computer for each transect line.
After all the depth and positional data were collected, they were stored for later retrieval.
The data were processed and imported into the GIS software for developing a triangular irregular
network3 (TIN) model of the lake bathymetry. Surface areas and volumes were calculated from
the TIN for 0.1 ft increments. Appendix K of this report contains a detailed description of all
methods, equipment, and procedures used for this survey.

4
RESULTS
Results from the 2003 TWDB survey indicate that Lake Cherokee is encircled by a
shoreline approximately 51 miles in length at gauge elevation 280.6 ft. The deepest point
measured during the survey was 34.1 ft, corresponding to gauge elevation 245.9 ft, and was
located approximately 5,000 ft upstream of Cherokee Dam.
Encompassing 3,467 surface acres, the lake contains a total volume of 43,737 ac-ft at
CPE 280.0 ft. The total post-impoundment sediment volume in the lake was estimated to be
1,279 ac-ft. The annual average sedimentation rate over 55 years was estimated to be 0.15 ac-
ft/mi2/yr using a contributing watershed size of 158 mi2. This rate of sedimentation is
significantly lower than previous estimates.
The bar graph presented in Appendix G illustrates the distribution of sediment volume in
the reservoir at 5-foot intervals. Each interval is labeled with its associated percentage of total
sediment. It is recommended that another survey using modern methods be performed in five to
ten years or after a major flood event to evaluate changes to the lake’s capacity.
SUMMARY OF SEDIMENTATION ESTIMATES FOR LAKE CHEROKEE, TEXAS The sedimentation rate established by theTWDB 2003 survey is the best estimate of average
annual sedimentation in the Lake Cherokee watershed for the 55-year period since impoundment.
Using differential GPS, multi-frequency sub-bottom profiler, and GIS, the survey team created
digital terrain models of the lake's pre- and post-impoundment bathymetry. In addition, TWDB staff
reviewed five previous estimates of sedimentation in the Lake Cherokee watershed, and they are
presented here in abbreviated form.
Out of the sources included, two are reports on sedimentation for the entire state and four are
surveys of Lake Cherokee, including the present 2003 survey. Presented in chronological order,
methodologies and results are briefly discussed.
5
1959 Soil Conservation Service Bulletin 5912
The Soil Conservation Service4 (SCS) published Bulletin 5912 “Inventory and Use of
Sedimentation Data in Texas” in January 1959. This report, which collected and analyzed available
data for use in planning and developing water resources in Texas, used a limited number of
sedimentation surveys and sediment load measurements to estimate sedimentation production rates
for watersheds in Texas. The methods used extrapolated data over large areas and the report states
that rates given in the report are “what can be expected from an average watershed.” Bulletin 5912
estimated a sediment production rate for the watershed containing the Lake Cherokee watershed to
be 0.23 ac-ft/mi2/yr.
1960 Soil Conservation Service Survey
The SCS performed a sedimentation survey5 of Lake Cherokee in April 1960. This survey
used an aerial mosaic of 1954 photographs and consisted of 34 range lines, from which
approximately 1,025 data points were collected. Two significant findings described in the report are
(1) conversion of cultivated land to pastureland, and (2) the effects of the1952-57 drought on those
and other conservation efforts. Trees and aquatic growth predominate the upstream area of the
reservoir; accordingly, the report described the difficulty in collecting data and comments on the
probable inaccuracy of calculations in this area. This portion of the reservoir continued to be
problematic during 1996 and 2003 surveys (see Figure 1).
The volumes were determined from the collected data by using the range contour formula
described in United States Department of Agriculture6 (USDA) Technical Bulletin No. 524. The
1960 capacity at elevation 280.0 was calculated to be 46,705 acre-feet, and the surface area at this
elevation was calculated as 3,987 acres. The average annual sedimentation rate for the 12-year
period from 1948 to 1968 was calculated to be 1.37 ac-ft/mi2/yr at this time.
6
1979 Soil Conservation Service Report 268
In 1979, the Soil Conservation Service revised and updated the sediment production rates
published in the 1959 “Bulletin 5912” by publishing Report 268 “Erosion and Sedimentation by
Water in Texas”7 for the Texas Department of Water Resources. This report, which included a more
comprehensive and updated data set compared to the data set used in Bulletin 5912, observed
substantial land use change in the 20-year period between the 1959 bulletin and the 1979 report. For
example, soil conservation measures had reduced cultivated acres by about 88% during that period.
The 1979 calculations used updated, suspended sediment data, whereas the 1959 report used data
that was sometimes 30 to 40 years old. Formulas for erosion rates used in the 1979 report were not
used in the 1959 report. In addition, the Universal Soil Loss equation was added to the analysis in
1979. Report 268 estimated a sediment production rate for the larger watershed containing the Lake
Cherokee watershed to be 0.25 ac-ft/mi2/yr.
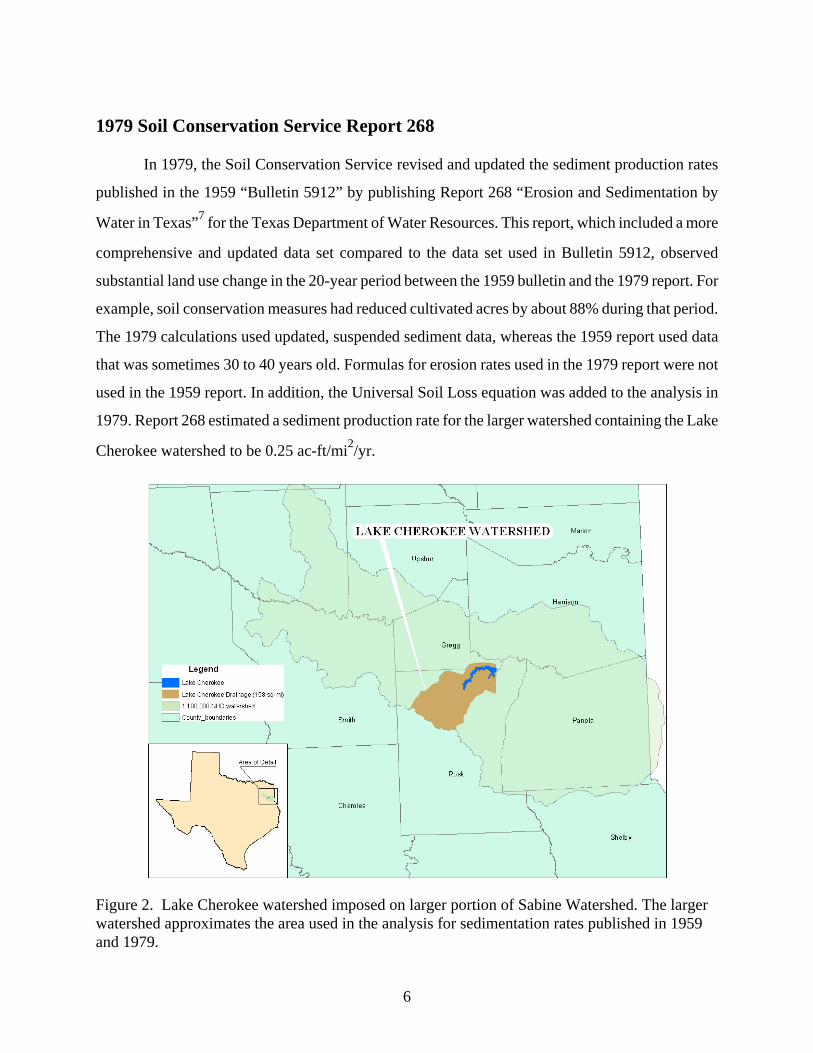
Figure 2. Lake Cherokee watershed imposed on larger portion of Sabine Watershed. The larger watershed approximates the area used in the analysis for sedimentation rates published in 1959 and 1979.
7
1986 TWDB Reconnaissance Survey
In February 1986, the Texas Water Development Board performed a reconnaissance survey
of Lake Cherokee. The TWDB survey ran the same range lines as the 1960 SCS survey1. A small
boat was driven at a constant speed across the lake, while tracing the bottom profile on a chart
recording depth sounder. Collected data was processed by the same formulas as the SCS survey.
However, it appears that the analysis used a significantly smaller lake boundary than the 1960 SCS
report. The capacity at elevation 280.0 ft. was calculated to be 45,186 acre-feet and an area of 3,367
acres. The average annual sedimentation production rate for the 26-year period between 1960 and
1986 was calculated to be 0.37 ac-ft/mi2/yr.
1996 TWDB Volumetric Survey
In October 1996, using modern depth sounding and Global Positioning System (GPS)
equipment, the Texas Water Development Board performed a volumetric survey of Lake Cherokee.
TWDB issued a final report in January 1997. This survey used a boundary digitized from 1986
USGS topographical maps and estimated most of the depths upstream of the FM 2011 bridge. This
survey collected over 41,000 data points on approximately 120 transect lines. These lines were
spaced parallel to one another, about 500 ft apart, and positioned as perpendicular to existing stream
and creek beds as possible. The capacity at gauge elevation 280.0 ft was calculated to be 41,560
acre-feet with a surface area of 3,083 acres1. The volume and area tables in the 1997 report were
revised in this report (2003) using the current boundary derived from 1995 aerial photographs. The
revised 1997 capacity and area at elevation 280.0 ft were recalculated to be 42,428 ac-ft and 3,443
acres respectively. The average annual sedimentation production rate for the 10-year period between
the 1986 and 1996 surveys was calculated to be 1.75 ac-ft/mi2/yr.

8
2003 TWDB Volumetric and Sediment Survey
The 2003 Texas Water Development Board volumetric and sediment survey of Lake
Cherokee used a multi-frequency, sub-bottom profiling depth sounder and differential GPS
equipment. The survey collected over 67,000 data points, while navigating over approximately the
same transect lines used in the 1996 survey (1997 report). An updated boundary file digitized from
1995 aerial photos was used in the volume and area calculations. While depths in a portion of the
lake upstream of FM 2011 were still estimated as in the 1996 survey, real data was collected over a
significantly larger area in the current survey (see Figures 1 and 5). The survey crew returned to the
lake in March 2004 after the vegetation had receded and verified, both manually and acoustically,
more of the estimated depths. The capacity at gauge elevation 280.0 ft. was calculated to be 43,737
acre-feet with an area of 3,467 acres. The volume of post-impoundment sediment was estimated to
be 1,279 ac-ft. The average annual sedimentation production rate for the 55-year period between the
1948 and 2003 surveys was calculated to be 0.15 ac-ft/mi2/yr.
DISCUSSION
The use of modern equipment and modeling techniques provides a valuable tool in
establishing the rate of sedimentation in reservoirs. Variations in the rate of sedimentation between
decades occur because of changes in the watershed, such as land use and new flood control
structures. The technologies and methodologies used also affect projections of sedimentation rates.
Based on the 2003 survey, the original total capacity of Lake Cherokee would have been
45,016 ac-ft. or 8% smaller than the original capacity of 49,295ac-ft calculated in the 1960 SCS
survey. These results are offset by the fact that the estimated sedimentation rate appears to be
smaller than previously thought.

9
Figure 3. The figure to the left illustrates
differences in surface acreage between the
1960 and 2003 boundaries. The area
containing segment-35, established for the
1960 SCS report, is about 120 acres smaller
in the 2003 report. Depths of 1 ft to 2 ft
were assumed for an area of approximately
500 acres, contained in segments 34 and 35.
Predominated by Beaver Marsh, this area
contains heavy aquatic vegetation.
Prior methodologies for calculating volumes, areas, and sedimentation from bathymetric data
included the range survey and contour survey methods6, 8, 9. Due to the different computational
methods, comparisons between those methods and the current method used for the 2003 survey are
not recommented9. While not recommended, these comparisons are presented here to illustrate the
variability and range for calculated sedimentation rates.
A summary of the historical data and the results of the TWDB 2003 survey are presented
below in Table 2. The uses of current positioning (GPS) technologies, navigation software, and
modeling techniques have provided us with the best possible estimates of sedimentation rate and
volumes available at this time.

10
Original Design
(established in the 1960
SCS Report)
*USDA SCS Bulletin
5912
USDA SCS Report on
Sedimentation
*USDA SCS
Report 268
TWDB Survey
TWDB Survey
TWDB Survey
Year 1948 1959 1960 1979 1986 1996(revised)**
2003
Area (acres) 3,987 NA 3,987 NA 3,367 3,443 3,452
Volume (ac-ft) 49,295 NA 46,705 NA 45,186 42,428 43,297
Change in volume from original design. (ac-ft)
NA NA 2,590 NA 4,109 6,867 1,279
Sedimentation Rate from year of impoundment. (ac-ft/mi2/yr)
NA 0.23 1.37 0.25 0.68 0.91 0.15
Table 2. Area, Volume, and Sedimentation Rate Comparisons for Lake Cherokee, Texas. Sedimentation rates are based on a 158-mi2 watershed.
Sedimentation rates presented above are calculated based on changes from the original volume established in the 1960 SCS report. The 2003 Survey sedimentation rate is based on measurements taken during the survey.
*The 1959 SCS Bulletin and the 1979 SCS Report addressed sedimentation rates for watersheds in Texas. While individual lake surveys were used in the analysis, individual volumes and areas were not reported in these two reports. ** Revisions to the 1996 Survey results are discussed in Appendix K in the section entitled “Data Processing.”

11
REFERENCES
1. Sullivan, Scot, et. al., Texas Water Development Board. 1966. Report 48. “Dams and
Lakes in Texas, Historical and Descriptive Information”, Austin, Texas
2. Dowell, P.E., C.L. and Petty, P.E., R.G., Texas Water Development Board. 1973.
Report 126. “Engineering Data on Dams and Reservoirs in Texas, Part II”, Austin,
Texas.
3. ESRI, Environmental Systems Research Institute, 1995. ARC/INFO Surface
Modeling and Display, TIN Users Guide.
4. Prepared for Texas Board of Water Engineers, 1959. Soil Conservation Service.
“Inventory and use of Sedimentation Data in Texas”: U.S. Department of Agriculture.
Technical Bulletin No. 5912
5. Evans, James C. and Bramblett, Herman L, U.S. Department of Agriculture. 1960.
Soil Conservation Service. “Report on Sedimentation of Lake Cherokee Gregg and
Rusk Counties, Texas”, Temple, Texas
6. Eakin, Henry M. and Brown, Carl B., 1939. Soil Conservation Service. “Silting of
Reservoirs”: U.S. Department of Agriculture. Technical Bulletin No. 524
7. Greiner, John H., U.S. Department of Agriculture. 1982. Soil Conservation Service.
“Erosion and Sedimentation by Water in Texas, Average annual Rates Estimated in
1979”, Report 268
8. U.S. Department of Agriculture. 1983. Soil Conservation Service. National
Engineering Handbook. Section 3, “Sedimentation”, Chapter 7, “Field Investigations
and Surveys”
9. Blanton III, James O., Bureau of Reclamation. 1982. “Procedures for Monitoring
Reservoir Sedimentation”
10. Specialty Devices, Incorporated. Paul D. Higley, 14 July 2004. <http://
www.specialtydevices.com> 9 August 2004
11. Knudsen Engineering Limited, 2002. “320B Series Echosounder Hardware Manual”
12. ESRI, Environmental Systems Research Institute, 2002. “What is ArcGIS”
13. Coastal Oceanographics, Inc., <http://www.coastalo.com>, 2003. “HYPACK MAX
Gold, v2.12A”

12
14. Odem Hydrographic Systems, Inc., 1999. “Digibar-Pro Profiling Sound Velocimeter
Operations Manual”
15. Payne, R.W. and Holley, E.R., University of Texas. March 1997. Center for Research
in Water Resources. “An Assessment of a Hydrographic Survey Technique”, Austin,
Texas
16. Omnistar USA, Inc., <http://www.omnistar.com> 15 October 2004

APPENDIX J – CORE SAMPLING REPORT

i
APPENDIX K – EQUIPMENT, PROCEDURES AND METHODS
VOLUMETRIC SURVEYING TECHNOLOGY
Equipment
The equipment used to perform the latest volumetric survey (TWDB 2003) consisted of a
20-foot aluminum, shallow-draft, flat bottom SeaArk craft (River-runner) with cabin and
equipped with a 100-horsepower Yamaha outboard motor. To collect data on board, we used a
Specialty Devices, Inc. (SDI) multi-frequency sub-bottom profiler10, a Trimble Navigation, Inc.
AG132 GPS receiver with Omnistar differential GPS correction signal, and a laptop computer. A
verification trip in March 2004 used a 17-foot Jon boat powered by a 9.9 Horsepower Evinrude
outboard motor. The on-board equipment was reconfigured to use a Knudsen 320 B/P
Echosounder11 (depth sounder) instead of the SDI sub-bottom profiler. The combination of
survey vessels, GPS equipment, and depth sounders provide efficient hydrographic survey
systems.
PRE-SURVEY PROCEDURES
The lake’s boundary was digitized using Environmental Systems Research Institute’s
(ESRI) 12 ArcGIS 8.3 from digital orthophoto quadrangle images (DOQs). VARGIS of Texas
LLC produced the DOQs for the Texas Orthoimagery Program (TOP). The DOQs produced for
the Department of Information Resources and the GIS Planning Council under the TOP reside in
the public domain. More information can be obtained on the Internet at
http://www.tnris.state.tx.us/DigitalData/doqs.htm. The lake elevation at the time the DOQs were
photographed on March 9, 1995 was 280.6 ft. The lake and island boundaries were given an
elevation of 280.6 ft and TWDB Staff used this updated boundary in modeling Lake Cherokee
for this report.

ii
The survey layout was designed by placing survey track lines at 500-foot intervals
(Figure 2) within the digitized lake boundary using HYPACK MAX11 software. The survey
design required the use of approximately 160 survey lines placed perpendicular to the original
creek channel and tributaries.
SURVEY PROCEDURES
Equipment Calibration and Operation
On board the River-runner boat, the SDI sub-bottom profiler depth sounder was
calibrated using the DIGIBAR-Pro Profiling Sound Velocimeter by Odem Hydrographic
Systems14. To determine the speed-of-sound, the probe was first placed in the water to acclimate
it, then raised to the water surface where the depth was considered zero. The probe was then
gradually lowered on a cable to a depth just above the lake bottom, and then raised again to the
surface. During this lowering and raising, local speed-of-sound measurements were collected,
from which the average speed was computed by the velocimeter. The speed of sound was then
entered into the SDI data collection system. The depth was then checked manually with a
surveying stadia rod or weighted measuring tape to ensure that the depth sounder was properly
calibrated and operating correctly.
The speed of sound in the water column ranged from 4,870 feet per second to 4,860 feet
per second during the Lake Cherokee survey. Based on the measured speed of sound for various
depths and the average speed of sound calculated for the entire water column, the depth sounder
is accurate to within +0.2 ft. An additional estimated error of +0.3 ft arises from variation in
boat inclination. These two factors combine to give an overall accuracy of +0.5 ft for any
instantaneous reading. These errors tend to be fairly minimal over the entire survey, since some
errors are positive and some are negative, canceling each other out15.
During the survey, the horizontal mask setting on the on-board GPS receiver was set to
10 degrees and the PDOP (Position Dilution of Precision) limit was set to seven to maximize the
accuracy of the horizontal positioning. If the PDOP rises above seven, an internal alarm sounds
to advise the field crew that the horizontal position has degraded to an unacceptable level.

iii
Further positional accuracy is obtained through differential corrections using the internal
Omnistar receiver16. The HYPACK initialization file for Lake Cherokee was set up to perform
an “on-the-fly” conversion from the collected Differential GPS positions to state-plane
coordinates.
Field Survey
During the two-day survey in November 2003, the water levels remained below CPE (280.0
ft) at a constant gauge elevation of 278.22 ft. The survey crew experienced excellent weather
conditions with no weather related delays. Upon arriving at Lake Cherokee, TWDB staff met with
personnel from the Cherokee Water Company and after discussing the logistics for the survey, the
crew began data collection.
The survey team made an additional field trip on March 10, 2004 to verify depths that were
estimated in the upper portion of Lake Cherokee. This area of the lake is characterized by a large
stand of cypress and other trees and dense aquatic vegetation, making data collection difficult. The
survey crew was able to progress further into this region in March. The bottom was probed with a
survey stadia rod in several locations and after the vegetative layer was penetrated, hard bottom was
found. Root crowns of the cypress trees were also visible in the areas the crew was able to approach.
Visible root crowns are another indication of no significant sediment build up in these areas.
Over 67,600 data points were collected during the survey (see Figure 5). Random data were
collected in those areas where the crew could not stay on course because of navigational
obstructions. As the channels became too narrow for perpendicular transects, data were collected in
a zigzag pattern. The boat's computer stored all data points in 154 data files.
TWDB contracted with Baylor University’s professors John A. Dunbar and Peter M. Allen to
collect core samples throughout the lake. The professors collected eight core samples in December
2003, which were used to validate the SDI sub-bottom profiler acoustic records. Their report
“Sediment Thickness from Coring and Acoustic, Lake Cherokee, Rusk County, TX” is presented in
this report as Appendix J.

iv
Data Processing
The collected data were transferred from the survey computers onto TWDB's network
computers and backups were made for future reference as needed. Each raw data file was
processed through the DEPTHPIC program, which graphically displayed the acoustic record
collected by the SDI sub-bottom profiler and allows the operator to change the weighting of each
frequency to highlight different sediment characteristics10. The lake post- and pre-impoundment
surfaces were then digitized and stored for further processing. Core sample information
(sediment thickness) can be displayed with the corresponding cross sectional acoustic record for
calibrating and verifying the sediment layer thickness with acoustic signal. (see Appendix J).
The 200 kHz frequency was used to define the present post-impoundment surface, and the
50kHz frequency was used to define the pre-impoundment surface. The water surface elevation
of the lake for each day was then added to the post-processed data converting depths into
elevations. After all changes had been made to the data files, they were then saved and combined
into a separate X, Y, Z data file for each frequency.
The resulting data files were imported into ESRI’s Arc/Info Workstation GIS 8.3
software12. This software was used to convert each data set to a MASS points file. The MASS
points and the boundary file were then used to create a Digital Terrain Model (DTM) of the
lake's pre- and post-impoundment surfaces using Arc/Info's TIN software module. The module
generates a triangulated irregular network (TIN) from the data points and the boundary file using
a method known as Delauney's criteria for triangulation3. Using this method, a triangle is
formed between three non-uniformly spaced points, including all points along the boundary. If
there is another point within the triangle, additional triangles are created until all points lie on the
vertex of a triangle. All of the data points are used in this method. The generated network of
three-dimensional triangular planes represents the bottom surface. With this representation of
the bottom, the software then calculates elevations along the triangular surface plane by
determining the elevation along each leg of the triangle. The lake area and volume can be
determined from the TIN created using this method of interpolation. Volumes were calculated
for the post-impoundment surface (200kHz frequency) and the pre-impoundment surface (50kHz
v
frequency) and then subtracted from each other to derive the estimated total post-impoundment
sediment.
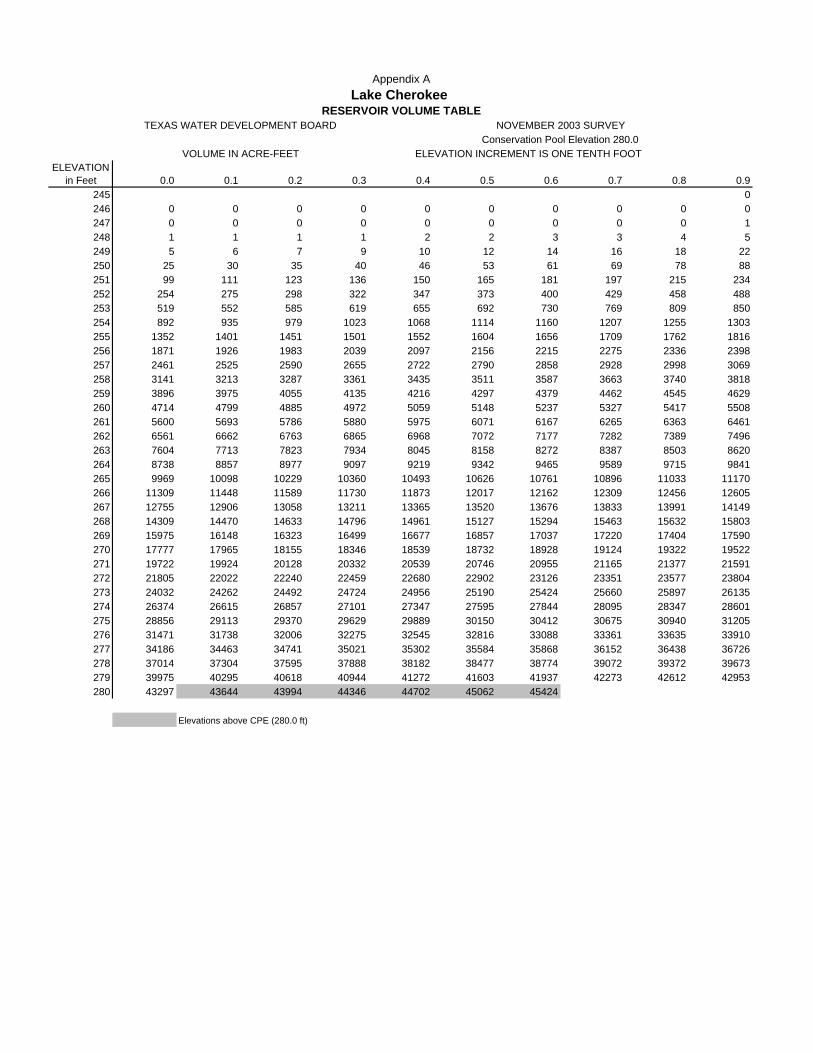
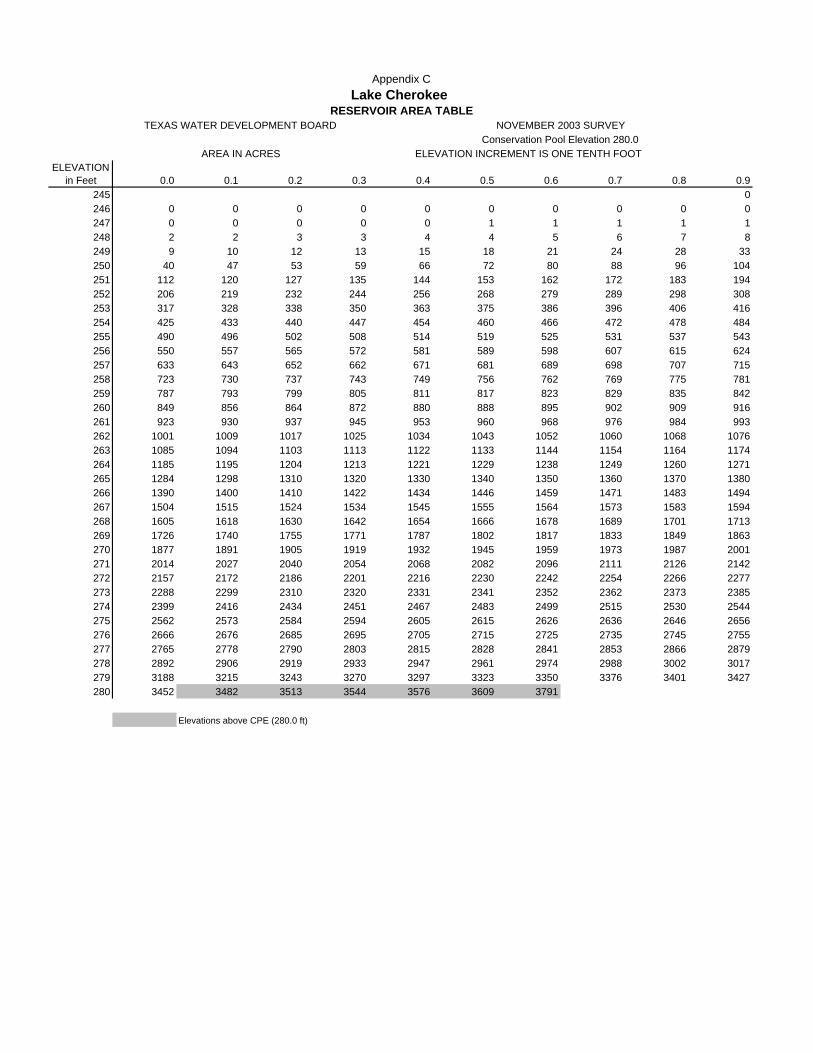
Volumes and areas were calculated from the 200 kHz TIN from elevation 245.9 ft to
280.6 ft at one-tenth foot intervals using Arc/Info software. Volumes were calculated from the
50 kHz TIN from elevation 240.9 ft to 280.6 ft at one-tenth foot intervals. The computed post-
impoundment volume table is presented in Appendix A and the area table in Appendix C. An
elevation-volume graph and an elevation-area graph are presented in Appendix E and Appendix
F respectively.
The volume and area tables in the 1997 TWDB report “Volumetric Survey of Lake
Cherokee” were revised to use the 2003 report boundary. The 1997 report boundary was digitized
from USGS topographical maps and the current boundary is considered more accurate. The area and
volume calculations in the 1997 survey report were further revised by substituting all 2003 data
upstream of the FM 2011 Bridge (Figure 2). This substitution was used in order to minimize errors
in the estimated depths between the two data sets and to allow for differences in the boundaries.
Two sets of figures were produced to illustrate the location and distribution of sediment
in the reservoir. The first set, Figures 6, 6a, and 6b were developed directly from a TIN model
derived from sediment isopack (thickness) values returned by the DEPTHPIC program. Figure 6
displays the complete reservoir while Figures 6a and 6b are enlarged views of the upper and
lower portions of the reservoir. All three figures show sediment location and thickness at 0.25-ft
intervals. The second set, Figures 7a through 7e were also developed from the isopack TIN
model, which was converted, to a lattice using the TINLATTICE command and then to a
polygon coverage using the LATTICEPOLY command. These five figures contain fourteen
views of the reservoir showing sediment thickness ranges throughout the reservoir.
Figure 8 shows the bottom relief of the lake in elevations. The Figure 8 map was developed
using the same processes as Figure 7 by substituting the TIN developed from the 200kHz data
points. Figure 9, a 2-ft interval contour map was also developed from this TIN. As with Figures
7 and 8, the TIN was converted to a lattice using the TINLATTICE command and then to a
polygon coverage using the LATTICEPOLY command. Linear filtration algorithms were
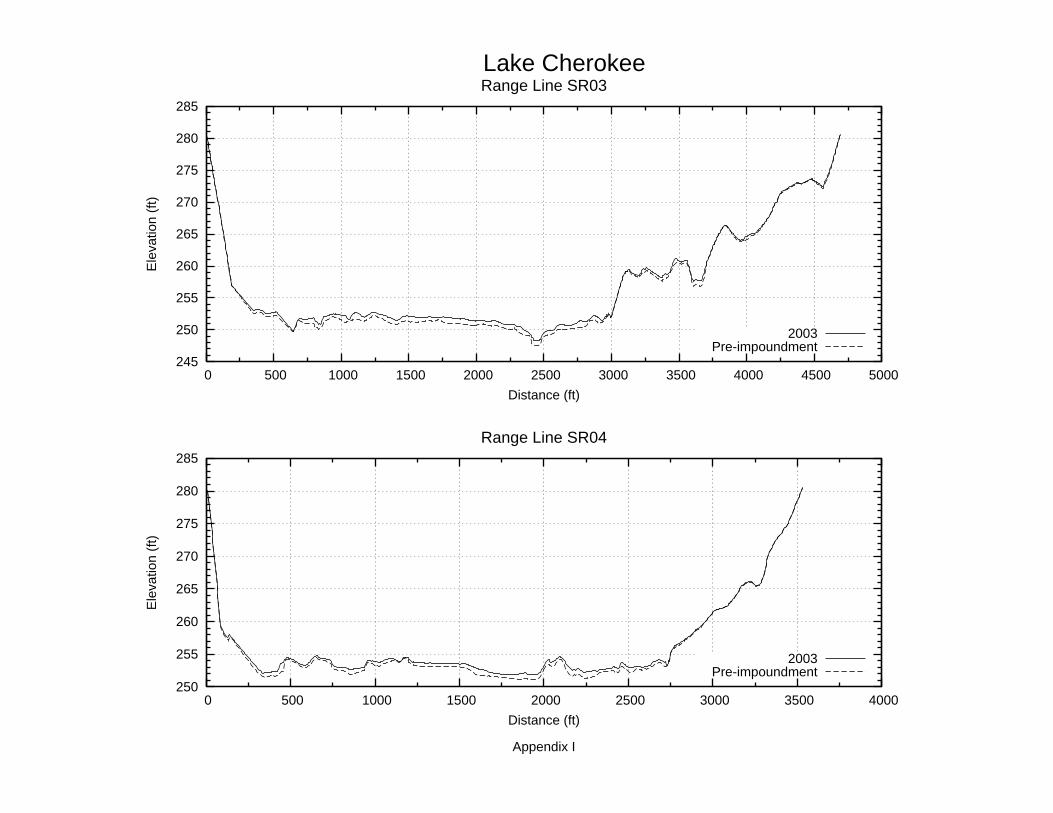
applied to the resultant DTM to produce smooth cartographic contours. Finally, thirty-four
cross-sections were produced from the TINs with positions that closely match cross-sections

vi
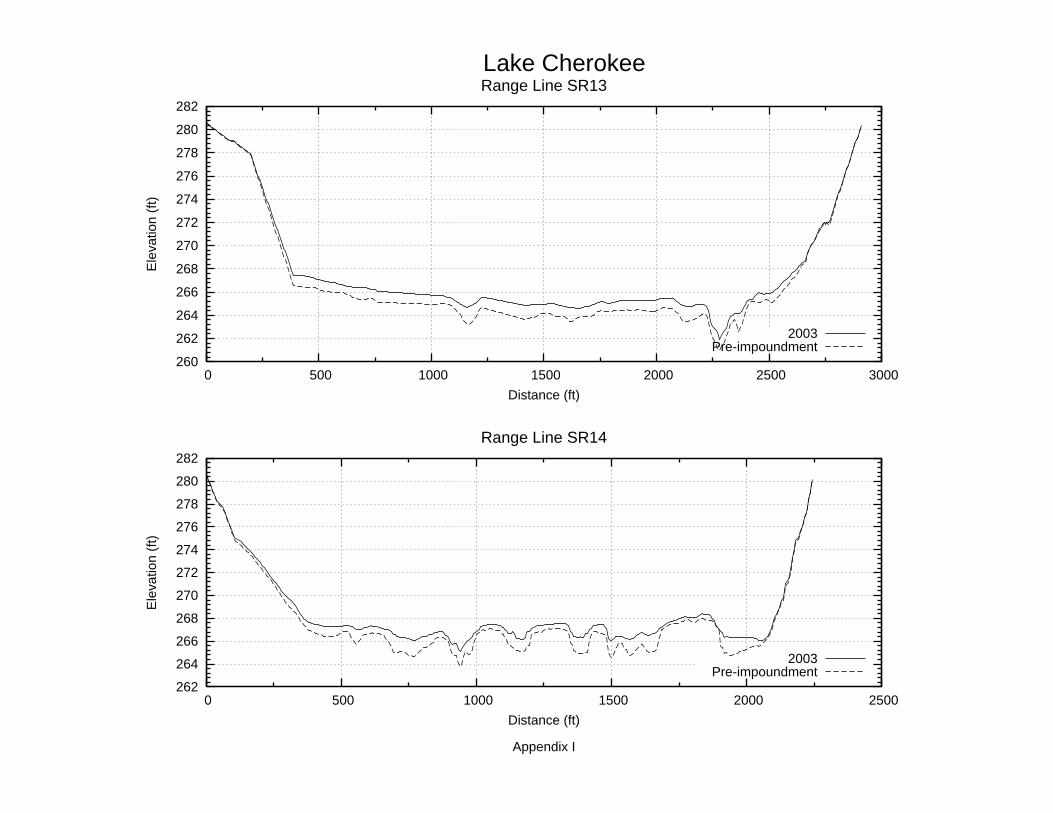
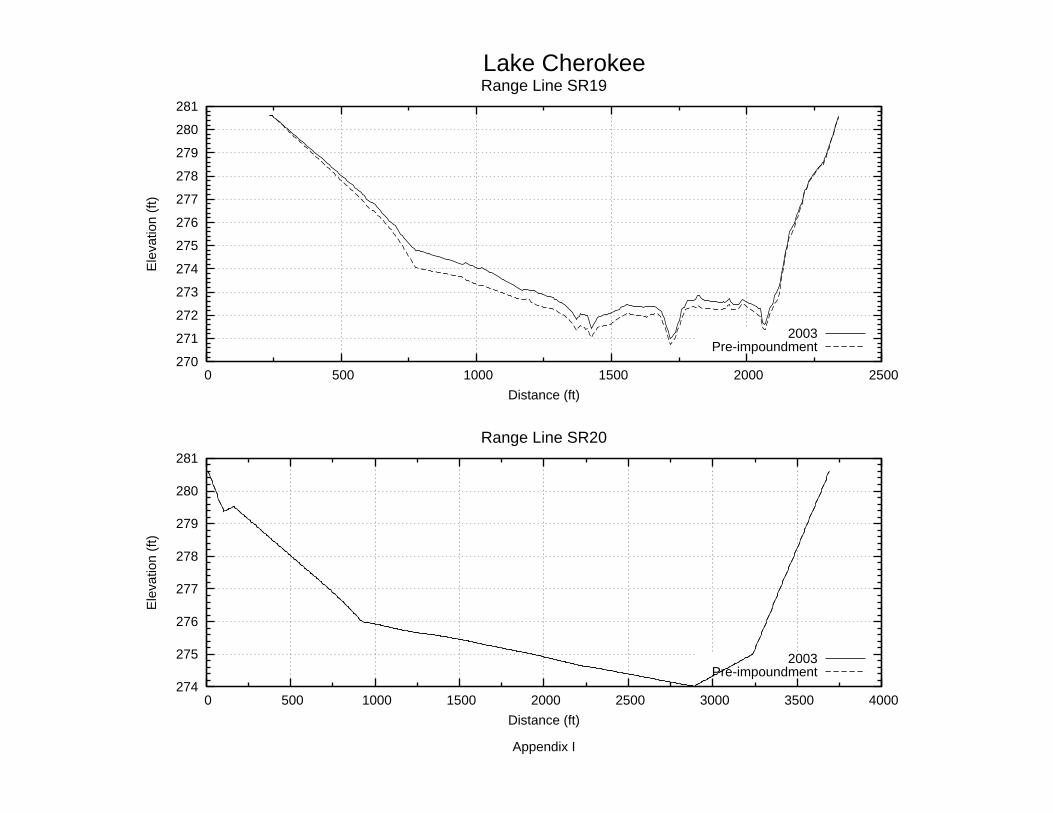
presented in the 1960 SCS report. The cross-section endpoints are presented in Appendix H with
the corresponding cross-section plots presented in Appendix I.

Volume of Sediment for Elevation Range
0 50 100 150 200 250 300 350
245.9-250
250-255
255-260
260-265
265-270
270-275
275-280.6
Elev
atio
n R
ange
s (fe
et)
Volume of Sediment (ac-ft) 42.1 223.7 154.0 286.0 325.7 172.9 21.5
245.9-250 250-255 255-260 260-265 265-270 270-275 275-280.6
14.1%
26.6%
1.8%
23.3%
12.6%
18.2%
3.4%
Volume of Sediment for Elevation Range (ac-ft)Percent of Total Sediment
Appendix G
ELEVATION in Feet 0.0 0.1 0.2 0.3 0.4 0.5 0.6 0.7 0.8 0.9
245 0246 0 0 0 0 0 0 0 0 0 0247 0 0 0 0 0 0 0 0 0 1248 1 1 1 1 2 2 3 3 4 5249 5 6 7 9 10 12 14 16 18 22250 25 30 35 40 46 53 61 69 78 88251 99 111 123 136 150 165 181 197 215 234252 254 275 298 322 347 373 400 429 458 488253 519 552 585 619 655 692 730 769 809 850254 892 935 979 1023 1068 1114 1160 1207 1255 1303255 1352 1401 1451 1501 1552 1604 1656 1709 1762 1816256 1871 1926 1983 2039 2097 2156 2215 2275 2336 2398257 2461 2525 2590 2655 2722 2790 2858 2928 2998 3069258 3141 3213 3287 3361 3435 3511 3587 3663 3740 3818259 3896 3975 4055 4135 4216 4297 4379 4462 4545 4629260 4714 4799 4885 4972 5059 5148 5237 5327 5417 5508261 5600 5693 5786 5880 5975 6071 6167 6265 6363 6461262 6561 6662 6763 6865 6968 7072 7177 7282 7389 7496263 7604 7713 7823 7934 8045 8158 8272 8387 8503 8620264 8738 8857 8977 9097 9219 9342 9465 9589 9715 9841265 9969 10098 10229 10360 10493 10626 10761 10896 11033 11170266 11309 11448 11589 11730 11873 12017 12162 12309 12456 12605267 12755 12906 13058 13211 13365 13520 13676 13833 13991 14149268 14309 14470 14633 14796 14961 15127 15294 15463 15632 15803269 15975 16148 16323 16499 16677 16857 17037 17220 17404 17590270 17777 17965 18155 18346 18539 18732 18928 19124 19322 19522271 19722 19924 20128 20332 20539 20746 20955 21165 21377 21591272 21805 22022 22240 22459 22680 22902 23126 23351 23577 23804273 24032 24262 24492 24724 24956 25190 25424 25660 25897 26135274 26374 26615 26857 27101 27347 27595 27844 28095 28347 28601275 28856 29113 29370 29629 29889 30150 30412 30675 30940 31205276 31471 31738 32006 32275 32545 32816 33088 33361 33635 33910277 34186 34463 34741 35021 35302 35584 35868 36152 36438 36726278 37014 37304 37595 37888 38182 38477 38774 39072 39372 39673279 39975 40295 40618 40944 41272 41603 41937 42273 42612 42953280 43297 43644 43994 44346 44702 45062 45424
Elevations above CPE (280.0 ft)
VOLUME IN ACRE-FEET ELEVATION INCREMENT IS ONE TENTH FOOT
Appendix ALake Cherokee
RESERVOIR VOLUME TABLETEXAS WATER DEVELOPMENT BOARD
Conservation Pool Elevation 280.0NOVEMBER 2003 SURVEY

ELEVATION IN FEET 0.0 0.1 0.2 0.3 0.4 0.5 0.6 0.7 0.8 0.9
245 0246 0 0 0 0 0 0 0 0 0 0247 0 0 0 0 0 0 0 0 0 0248 0 0 0 0 0 1 1 1 1 1249 2 2 2 3 3 4 5 6 7 8250 10 11 14 16 19 23 27 32 38 44251 51 59 67 76 86 96 107 118 130 143252 156 171 186 202 219 237 255 275 296 317253 340 363 388 413 440 467 496 526 556 588254 621 655 690 726 763 802 841 881 923 965255 1008 1053 1098 1144 1190 1238 1286 1335 1384 1434256 1485 1537 1589 1642 1696 1751 1806 1863 1919 1977257 2035 2094 2154 2214 2276 2338 2401 2465 2529 2595258 2662 2729 2798 2867 2937 3008 3080 3152 3226 3300259 3374 3450 3526 3603 3681 3759 3838 3918 3998 4079260 4161 4243 4326 4409 4494 4578 4664 4750 4838 4926261 5015 5105 5195 5287 5379 5473 5567 5662 5758 5854262 5952 6050 6149 6249 6350 6452 6554 6658 6762 6867263 6973 7080 7188 7297 7406 7516 7627 7739 7852 7966264 8082 8198 8315 8434 8554 8676 8799 8923 9049 9175265 9303 9432 9562 9693 9825 9958 10092 10227 10363 10500266 10639 10778 10919 11060 11203 11346 11491 11636 11782 11930267 12078 12227 12378 12530 12683 12837 12992 13149 13307 13466268 13627 13788 13950 14114 14278 14444 14611 14779 14948 15118269 15289 15462 15636 15811 15987 16165 16344 16524 16706 16888270 17072 17257 17444 17632 17821 18011 18203 18396 18590 18786271 18983 19182 19382 19583 19786 19990 20195 20402 20610 20820272 21031 21243 21458 21674 21891 22110 22331 22553 22776 23001273 23227 23454 23682 23912 24143 24376 24610 24845 25082 25319274 25558 25798 26040 26283 26527 26772 27019 27268 27517 27768275 28021 28275 28531 28788 29046 29306 29566 29828 30090 30354276 30619 30885 31152 31420 31689 31960 32231 32504 32778 33053277 33329 33606 33884 34163 34444 34727 35010 35295 35580 35868278 36156 36446 36737 37029 37323 37618 37914 38212 38511 38811279 39113 39432 39755 40080 40407 40738 41071 41406 41744 42085280 42428 42774 43122 43474 43829 44188 44549
Elevations above CPE (280.0 ft)
VOLUME IN ACRE-FEET ELEVATION INCREMENT IS ONE TENTH FOOT
Appendix BLake Cherokee
RESERVOIR VOLUME TABLETEXAS WATER DEVELOPMENT BOARD OCTOBER 1996 SURVEY
REVISED 2003
ELEVATION in Feet 0.0 0.1 0.2 0.3 0.4 0.5 0.6 0.7 0.8 0.9
245 0246 0 0 0 0 0 0 0 0 0 0247 0 0 0 0 0 1 1 1 1 1248 2 2 3 3 4 4 5 6 7 8249 9 10 12 13 15 18 21 24 28 33250 40 47 53 59 66 72 80 88 96 104251 112 120 127 135 144 153 162 172 183 194252 206 219 232 244 256 268 279 289 298 308253 317 328 338 350 363 375 386 396 406 416254 425 433 440 447 454 460 466 472 478 484255 490 496 502 508 514 519 525 531 537 543256 550 557 565 572 581 589 598 607 615 624257 633 643 652 662 671 681 689 698 707 715258 723 730 737 743 749 756 762 769 775 781259 787 793 799 805 811 817 823 829 835 842260 849 856 864 872 880 888 895 902 909 916261 923 930 937 945 953 960 968 976 984 993262 1001 1009 1017 1025 1034 1043 1052 1060 1068 1076263 1085 1094 1103 1113 1122 1133 1144 1154 1164 1174264 1185 1195 1204 1213 1221 1229 1238 1249 1260 1271265 1284 1298 1310 1320 1330 1340 1350 1360 1370 1380266 1390 1400 1410 1422 1434 1446 1459 1471 1483 1494267 1504 1515 1524 1534 1545 1555 1564 1573 1583 1594268 1605 1618 1630 1642 1654 1666 1678 1689 1701 1713269 1726 1740 1755 1771 1787 1802 1817 1833 1849 1863270 1877 1891 1905 1919 1932 1945 1959 1973 1987 2001271 2014 2027 2040 2054 2068 2082 2096 2111 2126 2142272 2157 2172 2186 2201 2216 2230 2242 2254 2266 2277273 2288 2299 2310 2320 2331 2341 2352 2362 2373 2385274 2399 2416 2434 2451 2467 2483 2499 2515 2530 2544275 2562 2573 2584 2594 2605 2615 2626 2636 2646 2656276 2666 2676 2685 2695 2705 2715 2725 2735 2745 2755277 2765 2778 2790 2803 2815 2828 2841 2853 2866 2879278 2892 2906 2919 2933 2947 2961 2974 2988 3002 3017279 3188 3215 3243 3270 3297 3323 3350 3376 3401 3427280 3452 3482 3513 3544 3576 3609 3791
Elevations above CPE (280.0 ft)
AREA IN ACRES ELEVATION INCREMENT IS ONE TENTH FOOT
TEXAS WATER DEVELOPMENT BOARD
Appendix CLake Cherokee
RESERVOIR AREA TABLE
Conservation Pool Elevation 280.0NOVEMBER 2003 SURVEY

ELEVATION IN FEET 0.0 0.1 0.2 0.3 0.4 0.5 0.6 0.7 0.8 0.9
245 0246 0 0 0 0 0 0 0 0 0 0247 0 0 0 0 0 0 0 0 0 0248 0 1 1 1 1 1 2 2 2 3249 3 4 4 5 6 7 9 10 12 14250 17 20 24 28 34 40 46 53 59 66251 73 80 86 92 99 105 111 117 124 131252 139 147 155 164 174 183 192 201 210 220253 230 240 250 260 270 282 292 302 312 322254 333 345 356 367 378 389 399 409 419 429255 438 447 455 463 471 478 484 491 498 506256 513 521 528 535 543 550 558 565 571 578257 585 593 601 609 618 626 635 643 652 662258 671 680 689 697 705 713 721 729 737 745259 752 759 767 774 780 787 794 800 806 812260 818 825 832 838 845 852 860 868 876 885261 894 904 912 920 929 938 946 954 962 970262 979 987 996 1004 1012 1021 1031 1040 1048 1056263 1065 1074 1082 1090 1098 1106 1115 1125 1135 1145264 1156 1168 1181 1195 1210 1223 1236 1248 1260 1272265 1283 1294 1304 1314 1325 1336 1346 1356 1368 1378266 1389 1399 1410 1420 1430 1440 1449 1459 1468 1478267 1488 1499 1511 1524 1537 1549 1562 1575 1586 1597268 1607 1617 1629 1639 1651 1662 1674 1686 1697 1709269 1721 1732 1744 1757 1770 1783 1796 1808 1821 1833270 1846 1859 1872 1884 1897 1911 1924 1938 1951 1965271 1979 1993 2006 2020 2034 2047 2060 2074 2088 2104272 2119 2135 2151 2168 2184 2199 2213 2226 2240 2252273 2265 2278 2292 2306 2319 2332 2345 2358 2371 2383274 2395 2409 2422 2435 2448 2462 2475 2489 2503 2518275 2538 2551 2564 2576 2588 2599 2610 2621 2632 2643276 2654 2665 2676 2687 2698 2709 2721 2732 2743 2754277 2764 2777 2790 2802 2816 2828 2840 2853 2865 2877278 2890 2903 2916 2930 2943 2957 2970 2984 2997 3011279 3182 3209 3236 3263 3290 3316 3342 3368 3393 3418280 3443 3473 3504 3535 3567 3599 3791
Elevations above CPE (280.0 ft)
Appendix D
OCTOBER 1996 SURVEY
Lake CherokeeRESERVOIR AREA TABLE
REVISED 2003AREA IN ACRES ELEVATION INCREMENT IS ONE TENTH FOOT
TEXAS WATER DEVELOPMENT BOARD

Lake CherokeeNovember 2003Prepared by: TWDB
050
0010
000
1500
020
000
2500
030
000
3500
040
000
4500
050
000
245
255
265
275
285
Volu
me
(acr
e-fe
et)
Pool Elevation 280.0' Volume 2003 FinalVolume 1996 revised Volume 1960
Poo
l Ele
vatio
n 28
0.0
ft.
Appendix E Elevation vs. Volume
Elevation(ft)

Lake CherokeeNovember 2003Prepared by: TWDB
040
080
012
0016
0020
0024
0028
0032
0036
0040
0024
5
255
265
275
285
Are
a (a
cres
)
Pool Elevation 280.0' Area 2003 Final Area 1996 Revised Area 1960
Poo
l Ele
vatio
n 28
0.0
ft.
Appendix F Elevation vs. Area
Elevation(ft)

Range Line X YSR 01-L 3170028.0 6838922.0SR 01-R 3169919.8 6835194.5
SR 02-L 3168492.3 6839448.0SR 02-R 3167957.5 6835400.5
SR 03-L 3167317.0 6839274.0SR 03-R 3166247.5 6834703.0
SR 04-L 3165108.3 6839165.5SR 04-R 3163977.0 6835819.0
SR 05-L 3163335.0 6839998.5SR 05-R 3162083.5 6837333.0
SR 06-L 3160718.8 6841199.0SR 06-R 3160693.0 6838412.0
SR 07-L 3158437.8 6840102.0SR 07-R 3158502.5 6838828.5
SR 08-L 3156195.0 6839613.5SR 08-R 3156242.8 6838071.5
SR 09-L 3154252.5 6840233.5SR 09-R 3154084.0 6838294.0
SR 10-L 3151921.5 6840634.0SR 10-R 3151753.5 6838476.5
SR 11-L 3150255.0 6840003.5SR 11-R 3150034.3 6838524.0
SR 12-L 3148388.3 6839960.5SR 12-R 3148836.8 6838400.5
SR-13-L 3145915.8 6838869.0SR-13-R 3148326.3 6837231.0
SR 14-L 3145161.3 6836958.5SR 14-R 3146662.5 6835292.5
SR 15-L 3143328.5 6835220.5SR 15-R 3145306.0 6833092.5
SR 16-L 3141308.5 6834033.0SR 16-R 3142767.0 6832093.5
L-Left endpointR-right endpoint
Range Line EndpointsState Plane NAD83 Units-feet
Appendix H
TEXAS WATER DEVELOPMENT BOARD
Lake Cherokee
NOVEMBER 2003 SURVEY

Range Line X YSR 17-L 3141130.0 6829907.5SR 17-R 3142763.8 6829918.0
SR 18-L 3139335.5 6828045.5SR 18-R 3141370.8 6827035.5
SR 19-L 3138420.5 6827090.0SR 19-R 3140592.8 6825820.5
SR 20-L 3135204.0 6825718.5SR 20-R 3138489.3 6824040.5
SR 21-L 3133644.0 6823114.0SR 21-R 3136099.8 6821795.0
SR 22-L 3140265.0 6824541.5SR 22-R 3140641.5 6825534.5
SR 23-L 3151373.5 6837887.5SR 23-R 3151649.3 6837641.0
3152077.3 6838684.5SR 24-L 3152806.3 6838668.5SR 24-R
SR 25-L 3155558.0 6838073.0SR 25-R 3155821.0 6838071.5
SR 26-L 3158111.8 6840226.5SR 26-R 3157556.8 6840423.5
SR 27-L 3168417.5 6839548.5SR 27-R 3168106.5 6839680.0
SR 28-L 3166254.5 6834486.0SR 28-R 3167557.5 6834110.5
SR 29-L 3165406.0 6833172.5SR 29-R 3166853.0 6832950.5
SR 30-L 3165864.3 6831736.0SR 30-R 3167390.5 6832183.0
SR 31-L 3166839.8 6829785.5SR 31-R 3167363.5 6829491.0
SR 32-L 3164932.5 6833293.5SR 32-R 3164781.3 6832251.0
Range Line EndpointsState Plane NAD83 Units-feet
L-Left endpointR-right endpoint
Appendix H (continued)Lake Cherokee
TEXAS WATER DEVELOPMENT BOARD NOVEMBER 2003 SURVEY

Range Line X YSR 33-L 3163669.8 6831708.5SR 33-R 3164051.3 6831457.0
SR 34-L 3162010.0 6829903.0SR 34-R 3162386.0 6829818.5
Range Line EndpointsState Plane NAD83 Units-feet
L-Left endpointR-right endpoint
Appendix H (continued)Lake Cherokee
TEXAS WATER DEVELOPMENT BOARD NOVEMBER 2003 SURVEY

245
250
255
260
265
270
275
280
285
0 500 1000 1500 2000 2500 3000 3500 4000
Ele
vatio
n (f
t)
Distance (ft)
Range Line SR01
2003Pre-impoundment
245
250
255
260
265
270
275
280
285
0 500 1000 1500 2000 2500 3000 3500 4000 4500
Ele
vatio
n (f
t)
Distance (ft)
Appendix I
Range Line SR02
Lake Cherokee
2003Pre-impoundment
245
250
255
260
265
270
275
280
285
0 500 1000 1500 2000 2500 3000 3500 4000 4500 5000
Ele
vatio
n (f
t)
Distance (ft)
Range Line SR03
2003Pre-impoundment
250
255
260
265
270
275
280
285
0 500 1000 1500 2000 2500 3000 3500 4000
Ele
vatio
n (f
t)
Distance (ft)
Appendix I
Range Line SR04
Lake Cherokee
2003Pre-impoundment

250
255
260
265
270
275
280
285
0 500 1000 1500 2000 2500 3000
Ele
vatio
n (f
t)
Distance (ft)
Range Line SR05
2003Pre-impoundment
250
255
260
265
270
275
280
285
0 500 1000 1500 2000 2500 3000
Ele
vatio
n (f
t)
Distance (ft)
Appendix I
Range Line SR06
Lake Cherokee
2003Pre-impoundment

255
260
265
270
275
280
285
0 200 400 600 800 1000 1200 1400
Ele
vatio
n (f
t)
Distance (ft)
Range Line SR07
2003Pre-impoundment
255
260
265
270
275
280
285
0 200 400 600 800 1000 1200 1400 1600
Ele
vatio
n (f
t)
Distance (ft)
Appendix I
Range Line SR08
Lake Cherokee
2003Pre-impoundment

255
260
265
270
275
280
285
0 200 400 600 800 1000 1200 1400 1600 1800 2000
Ele
vatio
n (f
t)
Distance (ft)
Range Line SR09
2003Pre-impoundment
255
260
265
270
275
280
285
0 500 1000 1500 2000 2500
Ele
vatio
n (f
t)
Distance (ft)
Appendix I
Range Line SR10
Lake Cherokee
2003Pre-impoundment

260
265
270
275
280
285
0 200 400 600 800 1000 1200 1400 1600
Ele
vatio
n (f
t)
Distance (ft)
Range Line SR11
2003Pre-impoundment
260
265
270
275
280
285
0 200 400 600 800 1000 1200 1400 1600 1800
Ele
vatio
n (f
t)
Distance (ft)
Appendix I
Range Line SR12
Lake Cherokee
2003Pre-impoundment
260
262
264
266
268
270
272
274
276
278
280
282
0 500 1000 1500 2000 2500 3000
Ele
vatio
n (f
t)
Distance (ft)
Range Line SR13
2003Pre-impoundment
262
264
266
268
270
272
274
276
278
280
282
0 500 1000 1500 2000 2500
Ele
vatio
n (f
t)
Distance (ft)
Appendix I
Range Line SR14
Lake Cherokee
2003Pre-impoundment

266
268
270
272
274
276
278
280
282
0 500 1000 1500 2000 2500 3000
Ele
vatio
n (f
t)
Distance (ft)
Range Line SR15
2003Pre-impoundment
255
260
265
270
275
280
285
0 500 1000 1500 2000 2500
Ele
vatio
n (f
t)
Distance (ft)
Appendix I
Range Line SR16
Lake Cherokee
2003Pre-impoundment

268
270
272
274
276
278
280
282
0 200 400 600 800 1000 1200 1400 1600 1800
Ele
vatio
n (f
t)
Distance (ft)
Range Line SR17
2003Pre-impoundment
271
272
273
274
275
276
277
278
279
280
281
0 500 1000 1500 2000 2500
Ele
vatio
n (f
t)
Distance (ft)
Appendix I
Range Line SR18
Lake Cherokee
2003Pre-impoundment
270
271
272
273
274
275
276
277
278
279
280
281
0 500 1000 1500 2000 2500
Ele
vatio
n (f
t)
Distance (ft)
Range Line SR19
2003Pre-impoundment
274
275
276
277
278
279
280
281
0 500 1000 1500 2000 2500 3000 3500 4000
Ele
vatio
n (f
t)
Distance (ft)
Appendix I
Range Line SR20
Lake Cherokee
2003Pre-impoundment

278.8
279
279.2
279.4
279.6
279.8
280
280.2
280.4
280.6
0 500 1000 1500 2000 2500 3000
Ele
vatio
n (f
t)
Distance (ft)
Range Line SR21
2003Pre-impoundment
276.5
277
277.5
278
278.5
279
279.5
280
280.5
281
0 200 400 600 800 1000 1200
Ele
vatio
n (f
t)
Distance (ft)
Appendix I
Range Line SR22
Lake Cherokee
2003Pre-impoundment

268
270
272
274
276
278
280
282
0 50 100 150 200 250 300 350 400
Ele
vatio
n (f
t)
Distance (ft)
Range Line SR23
2003Pre-impoundment
264
266
268
270
272
274
276
278
280
282
0 100 200 300 400 500 600 700 800
Ele
vatio
n (f
t)
Distance (ft)
Appendix I
Range Line SR24
Lake Cherokee
2003Pre-impoundment

266
268
270
272
274
276
278
280
282
0 50 100 150 200 250 300
Ele
vatio
n (f
t)
Distance (ft)
Range Line SR25
2003Pre-impoundment
266
268
270
272
274
276
278
280
282
0 100 200 300 400 500 600
Ele
vatio
n (f
t)
Distance (ft)
Appendix I
Range Line SR26
Lake Cherokee
2003Pre-impoundment

266
268
270
272
274
276
278
280
282
0 50 100 150 200 250 300 350
Ele
vatio
n (f
t)
Distance (ft)
Range Line SR27
2003Pre-impoundment
255
260
265
270
275
280
285
0 200 400 600 800 1000 1200 1400
Ele
vatio
n (f
t)
Distance (ft)
Appendix I
Range Line SR28
Lake Cherokee
2003Pre-impoundment

255
260
265
270
275
280
285
0 200 400 600 800 1000 1200 1400 1600
Ele
vatio
n (f
t)
Distance (ft)
Range Line SR29
2003Pre-impoundment
260
262
264
266
268
270
272
274
276
278
280
282
0 200 400 600 800 1000 1200 1400 1600
Ele
vatio
n (f
t)
Distance (ft)
Appendix I
Range Line SR30
Lake Cherokee
2003Pre-impoundment

266
268
270
272
274
276
278
280
282
0 50 100 150 200 250 300 350 400 450 500
Ele
vatio
n (f
t)
Distance (ft)
Range Line SR33
2003Pre-impoundment
268
270
272
274
276
278
280
282
0 50 100 150 200 250 300 350 400
Ele
vatio
n (f
t)
Distance (ft)
Appendix I
Range Line SR34
Lake Cherokee
2003Pre-impoundment

272
273
274
275
276
277
278
279
280
281
0 100 200 300 400 500 600 700
Ele
vatio
n (f
t)
Distance (ft)
Range Line SR31
2003Pre-impoundment
260
262
264
266
268
270
272
274
276
278
280
282
0 200 400 600 800 1000 1200
Ele
vatio
n (f
t)
Distance (ft)
Appendix I
Range Line SR32
Lake Cherokee
2003Pre-impoundment
Baylor University
Department of Geology
Baylor University Department of Geology
PO Box 979354 Waco, TX 76798-7354
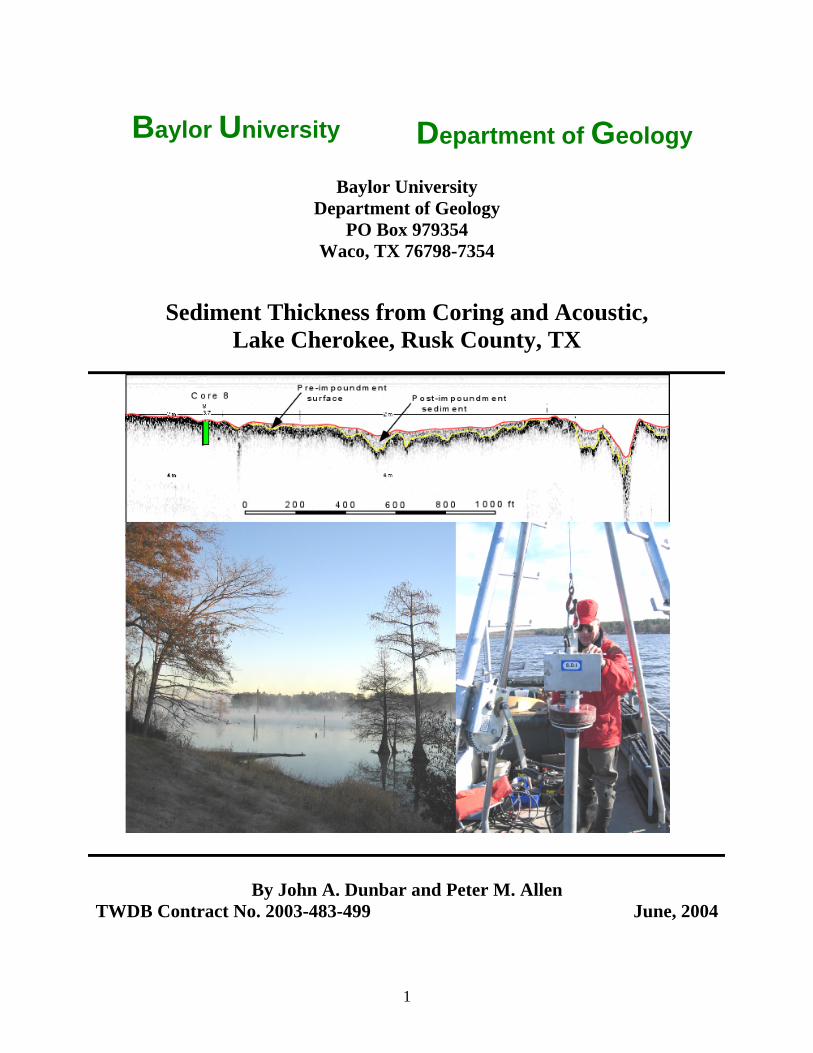
Sediment Thickness from Coring and Acoustic, Lake Cherokee, Rusk County, TX
By John A. Dunbar and Peter M. Allen TWDB Contract No. 2003-483-499 June, 2004
1

EXECUTIVE SUMMARY
In November, 2003 the Texas Water Development Board (TWDB) conducted an acoustic survey of Lake Cherokee, in Rusk County, Texas to determine the volume of sediment in the reservoir. The goal of the study described in this report was to validate the TWDB’s results by collecting core samples through the sediment at a number of locations along TWDB transects. We collected sediment cores at 8 locations in the reservoir using the vibracore technique, which produces continuous, undisturbed sediment samples. The cores ranged in length from 35 cm to 170 cm. The pre-impoundment surface was reached and sampled at all eight locations. Post-impoundment sediment at the core locations ranged in thickness from 0 to 25 cm. The cores were sub-sampled at 5 cm increments. The sub-samples were visually examined for evidence of the pre-impoundment surface and described. The sub-samples were also analyzed for water content and sediment shear strength. We found that the pre-impoundment surface was distinct and easily identified in all the cores. The post-impoundment sediment is a silty-clay, with high organic content and unusually high water continent (70-85%). Pre-impoundment materials range from nearly pure sand to clayey-sand. These sands are highly compacted, with shear strengths ranging up to 15 kg/cm2 and have relatively low water content (20-30%). In all cases the pre-impoundment material contained intact terrestrial plant roots.
The correlation between the cores and the acoustic data was achieved in two ways. First, the core samples were collected at positions along acoustic profiles previously surveyed by the TWDB, so that the coring results could be directly compared with the TWDB data. Second, short acoustic records were collected at each core site, using an acoustic profiling system of the same make as that used by the TWDB. This system collects sub-bottom acoustic images at three discrete acoustic frequencies (200, 48, and 24 kilohertz (kHz)). The 200 kHz data show no visible distinction between the pre- and post-impoundment material. However, in the 48 and 24 kHz data, the post-impoundment layer appears light gray and the underlying pre-impoundment material is dark gray to black. The clearest image of the pre-impoundment surface is given by the 48 kHz data. Thicknesses estimated from the acoustic data agree with the core results to within 1 cm, assuming a sediment velocity of 1480 m/s (4,854 ft/s). The profiling results show that the post-impoundment layer produces a distinct acoustic response that is easily traced on acoustic profiles.
2

ACKNOWLEDGEMENTS We gratefully acknowledge the financial support provided by the Texas Water Development Board and technical and logistical help provided by Randall Burns of the Texas Water Development Board. Author contact information: John A. Dunbar, Department of Geology, Baylor University, P.O. Box 97354, Waco, TX 76798-7354, (254) 710-2361, [email protected] Peter M. Allen, Department of Geology, Baylor University, P.O. Box 97354, Waco, TX 76798-7354, (254) 710-2361, [email protected]
3

1. INTRODUCTION
In the November, 2003 the Texas Water Development Board (TWDB) conducted a survey of Lake Cherokee, Rusk County, Texas. The goal of this survey was to determine the volume of sediments that have accumulated in the reservoir since its impoundment in 1948. The approach used by the TWDB was to determine the sediment thickness by acoustic sub-bottom profiling along profiles spaced 500 ft apart throughout the lake. On these profiles the water bottom and the original lake bottom or pre-impoundment surface are identified and traced throughout. In the study described in this report we corroborate the TWDB's acoustic results by physical measurement of sediment thickness using the vibracoring method. The core samples were collected at points along selected TWDB acoustic profiles to validate the identification of the pre-impoundment surface and the speed of sound used to convert from acoustic transit time to sediment thickness.
3. PROCEDURES The measurement of sediment thickness was done by collecting continuous, undisturbed
cores using a vibracore device. The correlation between the cores and the acoustic data was achieved in two ways. First, the cores were collected along selected TWDB profiles, by positioning the coring vessel using differential GPS navigation. Because errors in vessel positioning during the original TWDB survey compound with errors in our positioning of the coring vessel along the same profile, the core locations may differ from the actual profile track line by 10 to 30 ft. Hence, to insure accurate co-location of acoustic and core data, short acoustic records were collected using the same model SDI profiling system as that owned by the TWDB, at each core site at the time the cores were collected. Because the survey boat remained anchored at the core site, these short records image the bottom at points only a few feet away from where the core tube penetrated the bottom.
2.1 Sediment Coring A vibracoring system commercially available from SDI was used to core sediments within
Lake Cherokee. Vibracoring is a common approach for obtaining undisturbed cores of unconsolidated sediment in saturated or nearly saturated conditions (Lanesky et al., 1979; Smith, 1984). The SDI vibracore uses a 1-HP motor that drives a pair of weights that are eccentrically mounted on two counter rotating shafts. The motor and vibrator mechanism are housed within a watertight aluminum chamber so it can be immersed in water. The chamber is connected to the top of a 76 cm (3 in.) diameter aluminum core tube. The vibracore driver is powered by two 12-volt batteries connected in series through a 125-ft power cord, thus limiting the depth of operation. Lengths of core tube 4 to 12 ft (1.2 to 3.7 m) long were used. The gantry is mounted on a 24 ft pontoon boat that has a 4 ft square “moon pool” cut into its deck (Figures 2-1).
Cores were collected by lowering the vibrator with core tube attached to the bottom by hand winch, switching on the vibrator, and allowing the tube to slowly vibrate into the bottom. The vibration causes the sediment to liquefy in a region a few millimeters thick near the tube wall, allowing the tube to slide into the sediment with little drag. This results in less disturbance and compaction of the sediment cores than occurs with gravity-driven drop coring devices. Core
4

catchers made of thin sheet aluminum are attached inside of the leading end of the core tube. They allow the core to slide into the tube, but prevent it from sliding back out of the tube during retrieval. When the core had reached the point of refusal, the vibrator was turned off and the core was winched out of the bottom. On deck, the retrieved cores were capped top and bottom with rubber end-caps and stored upright during transport.
Figure 2-1. Coring boat with gantry. Schematic diagram of 24 ft coring boat and vibracoring system.
2.2 Core analysis:
The main goal of our core analysis was to determine the thickness of the post-impoundment sediment present in each core. In this analysis, we relied on visual examination of the sampled material, and measurements of the sediment water content and sediment shear strength versus depth in the cores. After the cores were brought back from the field, they were sub-sampled by cutting the core tube and sediment into 5-cm long slices using a pipe cutter. The sediment within each 5-cm slice was placed into pre-weighed containers, dried for 48 hours at 106º C, reweighed and stored for further analysis. The wet and dry weights of the samples were used to compute water content profiles along the cores. During the sub-sampling operation the strength of the sediment was determined using a pocket penetrometer that measures the force required to drive a 2.5 cm diameter disk into the sediment. These tests were performed on the top of each 5 cm sample, while the sample was confined in the core tube.
5

2.3 Discriminating Between Pre- and Post-impoundment materials
We determined the depth to the pre-impoundment surface in each core based on the following evidence: (1) a visual examination of the core for in place terrestrial materials, such as leaf litter, tree bark, twigs, intact roots, etc., concentrations of which would be expected on or just below the pre-impoundment surface, but not in the post-impoundment sediment and (2) variations in the physical properties of the sediment, particularly sediment water content and shear strength. Sediments deposited in reservoirs typically have water contents that range from 50 to 80% at the water bottom and decrease with burial to 30 to 40% at depths of several meters. Soils, in contrast, typically have water contents of 20 to 30% when saturated. The shear strength of reservoir sediments (as measured with penetration devices) typically ranges from 0 to 2 kg/cm2. The shear strength of saturated clay-rich soils typically ranges from 3 to over 10 kg/cm2.
2.4 Acoustic Profiling The acoustic profiling system used in this study is the same SDI profiler model as that used
by the TWDB in its sediment surveys. The system images the bottom and sub-bottom sediments with acoustic transducers with central frequencies of 200, 48, and 24 kHz. During acquisition, the system collects traces using each transducer independently in a rapid, round-robin succession. The high-frequency signals provide a sharp image of low-density mud at the water bottom, whereas the low-frequency signals penetrate many meters into the bottom to image the base of sediment fill, even in areas of high sediment accumulation. For the present study, the sound source was suspended over the side of the coring boat, adjacent to the coring gantry. Short acoustic records were collected at each core site. During post survey processing of the acoustic data, the core locations, and depths to the pre-impoundment surface were read into the acoustic processing program. The program posts core diagrams that show the interpreted post-impoundment sediment thickness on the acoustic data at the point of closest approach of the profile to the core location.
3. Results Eight cores were collected in Lake Cherokee at locations spaced along its length (Figure 3-
1). A summary of core locations, core lengths, and the interpreted depth to the pre-impoundment surface are given in Table 3-1. Tables describing the results of the physical analysis of cores from each site are given in Appendix A. Water content and shear strength versus depth in the cores are shown along side the visual description of the core material in Figures 3-2 to 3-9. The interpreted tops to the pre- and post-impoundment intervals on co-located acoustic profiles are also shown in Figures 3-2 to 3-9.
6

Figure 3-1. Map showing core locations in Lake Cherokee (circles). Map coordinates are Texas State Plane, North Central Zone, NAD 83, feet.
Table 3-1. Summary of sediment cores collected in Lake Cherokee. The core locations are given in Texas State Plane, North Central Zone, NAD 83, feet. Survey line numbers refer to acoustic profiles collected during the November, 2003 TWDB survey of Lake Cherokee that are closest to each core location.
Core ID Easting (ft) Northing (ft) Length (cm)
Depth to pre-impoundment
(cm)
TWDB Survey Line No.
CKE1 3166610.9 6838535.7 42 20 10
CKE2 3166598.6 6838031.6 170 25 10
CKE3 3166539.2 6837238.1 35 15 10
CKE4 3153784.0 6838936.0 38 15 62
CKE5 3153831.8 6839686.9 145 10 62
CKE6 3140811.8 6827655.5 82 10 111
CKE7 3139029.0 6825896.2 59 15 116
CKE8 3144277.2 6835057.9 78 0 92
7

Figure 3-2. Core and acoustic results for site CKE1. (a) Physical analysis of Core 1, showing 20 cm of post-impoundment sediment over pre-impoundment. (b) Short acoustic profile showing only the 48 kHz acoustic signal. On the acoustic data, the red line marks the water bottom and the yellow line marks the interpreted pre-impoundment surface. In the core diagrams yellow represents post-impoundment fill and green represents cored interval of pre-impoundment material. The location of core CKE1 is shown in Figure 3-1.
8

Figure 3-3. Core and acoustic results for site CKE2. (a) Physical analysis of Core 2, showing 25 cm of post-impoundment sediment over pre-impoundment. (b) Short acoustic profile showing only the 48 kHz acoustic signal. On the acoustic data, the red line marks the water bottom and the yellow line marks the interpreted pre-impoundment surface.
9

Figure 3-4. Core and acoustic results for site CKE3. (a) Physical analysis of Core 3, showing 15 cm of post-impoundment sediment over pre-impoundment. (b) Short acoustic profile showing only the 48 kHz acoustic signal. On the acoustic data, the red line marks the water bottom and the yellow line marks the interpreted pre-impoundment surface.
10

Figure 3-5. Core and acoustic results for site CKE4. (a) Physical analysis of Core 4, showing 15 cm of post-impoundment sediment over pre-impoundment. (b) Short acoustic profile showing only the 48 kHz acoustic signal. On the acoustic data, the red line marks the water bottom and the yellow line marks the interpreted pre-impoundment surface.
11

Figure 3-6. Core and acoustic results for site CKE5. (a) Physical analysis of Core 5, showing 10 cm of post-impoundment sediment over pre-impoundment. (b) Short acoustic profile showing only the 48 kHz acoustic signal. On the acoustic data, the red line marks the water bottom and the yellow line marks the interpreted pre-impoundment surface.
12

Figure 3-7. Core and acoustic results for site CKE6. (a) Physical analysis of Core 6, showing 10 cm of post-impoundment sediment over pre-impoundment. (b) Short acoustic profile showing only the 48 kHz acoustic signal. On the acoustic data, the red line marks the water bottom and the yellow line marks the interpreted pre-impoundment surface.
13

Figure 3-8. Core and acoustic results for site CKE7. (a) Physical analysis of Core 7, showing 15 cm of post-impoundment sediment over pre-impoundment. (b) Short acoustic profile showing only the 48 kHz acoustic signal. On the acoustic data, the red line marks the water bottom and the yellow line marks the interpreted pre-impoundment surface.
14

Figure 3-9. Core and acoustic results for site CKE8. (a) Physical analysis of Core 8, showing essentially no post-impoundment sediment over pre-impoundment at the core site. (b) Short acoustic profile showing only the 48 kHz acoustic signal. On the acoustic data, the red line marks the water bottom and the yellow line marks the interpreted pre-impoundment surface. Extended profile through Lake Cherokee Core site CKE8. Only the 48 kHz acoustic data are shown. On the acoustic data, the red line marks the water bottom and the yellow line marks the interpreted pre-impoundment surface. In the core diagrams yellow represents post-impoundment fill and green represents cored interval of pre-impoundment material. At the site of the core there is no post-impoundment sediment. Elsewhere along the profile the post-impoundment interval reaches a thickness of 60 cm.
15

4. Discussion
The goal of this study was to identify the pre-impoundment surface in a series of cores and on co-located acoustic data in support of the November, 2003 TWDB survey of Lake Cherokee. Two aspects of our results stand out as noteworthy. First, in the cores the layer of post-impoundment sediment fill is unusually thin (0 to 25 cm) for reservoirs of this age. This is partly an artifact of where the cores were collected. In many cases the sites that were pre-selected for coring from the TWDB's acoustic data could not be reached with the coring boat because of stumps and other obstructions. Alternate core locations were selected based on access to the site, rather than specific sediment targets. Somewhat thicker sediment accumulations (50 to 60 cm) with the same acoustic character are seen on the profiles at other points (Figure 3-9). Still, the amount of sedimentation is lower than is found in reservoirs of comparable age in the Backland Prairie, for example. We attribute this to the relatively small contributing watershed surface area (170 mi2) for a reservoir of this size and the sandy soils that dominate the watershed.
The second noteworthy finding is that the pre-impoundment surface and the post-impoundment sediment column is best imaged on the 48 kHz data. The 200 kHz signal scatters efficiently in both the post- and pre-impoundment material to the extent that the two material types are not distinguishable on the 200 kHz records. In contrast, the post-impoundment sediment scatters the 48 and 24 kHz signals much less efficiently than the pre-impoundment material. Hence, the two materials are distinct on both the 48 and 24 kHz records, but the pre-impoundment surface is more sharply imaged on the 48 kHz data.
5. CONCLUSIONS
The main conclusions of our study are listed below. 1. The post impoundment fill in Lake Cherokee has high water continent (70-85%) and low
shear strength throughout. At the core sites the post-impoundment layer is relatively thin, ranging in thickness from 0 to 25 cm thick.
2. The post-impoundment layer is acoustically distinct from the pre-impoundment material,
appearing light gray on the 48 kHz single frequency acoustic displays. The underlying pre-impoundment materials appear dark gray to black on the same displays.
6. REFERENCES Lanesky, D.E., B.W. Logan, R.G. Brown, and A.C. Hine, 1979. A new approach to portable vibracoring underwater and on land. Journal of Sedimentary Petrology, 49, 654-657. Smith, D.G., 1984. Vibracoring fluvial and deltaic sediments: Tips on improving penetration and recovery. Journal of Sedimentary Petrology, 54, 660-663.
16

Appendix A
Cherokee Core 1 Sample Top (cm) Bot (cm) Cont. wt (gr) Wet wt. (gr) Dry wt. (gr) Wat Cont. (%) Pen. At Top (kg) Comment 1
1 0 5 0.44 5.63 1.59 77.8 0Dark gray to black 2 5 10
0.44 6.83 1.97 76.1 0.1mud 3 10 15 0.44 4.97 1.54 75.7 0.5
4 15 20 0.45 8.44 5.43 37.7 0.9Pre-impoudment5 20 25 0.45 6.71 5.03 26.8 3.4Dark brown, roots
6 25 30 0.43 9.23 6.87 26.8 5.4 Cherokee Core 2 Sample Top (cm)
Bot (cm)
Cont. wt (gr) Wet wt. (gr) Dry wt. (gr) Wat Cont. (%) Pen. At Top (kg) Comment 1 1 0 5 8.5 218.5 43.36 83.4 0Soupy, silty-clay,2 5 10 8.42 247.95 62.45 77.4 0gray to black
3 10 15 8.27 220.59 60.09 75.6 04 15 20 8.18 204.29 66.53 70.2 05 20 25 8.58 280.17 177.26 37.9 0twigs, leaf fragments 6 25 30 8.12 298.65 209.6 30.7 1.1pre-impouundment7 30 35 8.32 339.05 260 23.9 2.2gray sand, plant roots
8 35 40 8.33 297.26 236.51 21.0 2.49 40 45 8.48 281.7 225.2 20.7 2.5
10 45 50 8.15 283.84 226.59 20.8 2.5 Cherokee Core 3 Sample Top (cm)
Bot (cm)
Cont. wt (gr) Wet wt. (gr) Dry wt. (gr) Wat Cont. (%) Pen. At Top (kg) Comment 1 1 0 5 0.65 7.54 1.99 80.6 0black mud2 5 10 0.43 13.31 5.49 60.7 0mass of twigs 3 10 15 0.44 9.48 6.9 28.5 0.9Pre-impoundment
4 15 20 0.45 8.18 6.12 26.6 1.4brown, roots 5 20 25 0.44 11.82 8.71 27.3 2.1
6 25 30 0.43 13.72 10.74 22.4 1.3
17

Cherokee Core 4 Sample Top (cm)
Bot (cm)
Cont. wt (gr) Wet wt. (gr) Dry wt. (gr) Wat Cont. (%) Pen. At Top (kg) Comment 1 1 0 5 0.44 8.24 4.98 41.8 0tan, sandy-clay
2 5 10 0.44 13.98 9.95 29.8 1.33 10 15 0.44 15.09 11.58 24.0 6.34 15 20 0.43 23.2 18.75 19.5 3.5twigs, leaf fragments
5 20 25 0.45 22.15 18.16 18.4 10.1pre-impoundment 6 25 30 0.45 20.04 16.65 17.3 8.5roots
Cherokee Core 5 Sample Top (cm) Bot (cm) Cont. wt (gr) Wet wt. (gr) Dry wt. (gr) Wat Cont. (%) Pen. At Top (kg) Comment 1
1 0 5 8.48 163.3 37.98 80.9 0Dark brown to black 2 5 10 8.07 222.62 93.6 60.1 0organic material
3 10 15 8.28 340.69 214.17 38.1 0.5pre-impoundment4 15 20 8.59 358.28 233.58 35.7 0.6Dark gray to black 5 20 25 8.77 364.74 262.76 28.6 0.8sand with roots
6 25 30 8.09 341.01 244.36 29.0 6.27 30 35 8.4 394.95 317.25 20.1 10.28 35 40 8.06 217.61 179.46 18.2 159 40 45 8.46 226.74 189.07 17.3 10.5
10 45 50 8.46 224.78 186.89 17.5 15
18

Cherokee Core 6 x= Sample Top (cm) Bot (cm) Cont. wt (gr) Wet wt. (gr) Dry wt. (gr) Wat Cont. (%) Pen. At Top (kg) Comment 1
1 0 5 7.97 145.54 24.86 87.7 0Dark brown-Black 2
5 10 8.12 205.37 68.81 69.2 0Mud3 10 15 8.54 379.43 242.55 36.9 2.3pre-impoundment4 15 20 8.46 357.74 252.1 30.2 1.2Gray pure sand with
5 20 25 8.42 373.44 270.67 28.2 1.9no roots 6 25 30 8.45 338.4 253.39 25.8 1.6
7 30 35 8.07 386.9 285.86 26.7 1.68 35 40 8.29 384.25 285.02 26.4 2.29 40 45 8.01 388.38 289.96 25.9 1.2
10 45 50 8.33 318.74 240.57 25.2 211 50 55 8.2 394.61 297.95 25.0 2.212 55 60 8.21 346.06 260 25.5 1.713 60 65 8.59 279.07 212.22 24.7 1.5
Cherokee Core 7 Sample Top (cm) Bot (cm) Cont. wt (gr) Wet wt. (gr) Dry wt. (gr) Wat Cont. (%) Pen. At Top (kg/25) Comment 1
1 0 5 0.44 7.87 1.13 90.7 0Dark brown-Black 2 5 10 0.44 10.59 1.66 88.0 0Mud
3 10 15 0.44 13.79 2.66 83.4 0.2twigs, leaf fragments 4 15 20 0.64 25.31 14.39 44.3 1.8Pre-impoundment5 20 25 0.43 15 10.23 32.7 1.1Gray pure sand with
6 25 30 0.43 20.51 15.01 27.4 1.4plant roots 7 30 35 0.45 13.66 9.44 31.9 1.3
8 35 40 0.44 16.43 11.58 30.3 1.49 40 45 0.43 18.83 12.53 34.2 2.5
10 45 50 0.44 16.14 11.31 30.8 4.2
19

Cherokee Core 8 Sample Top (cm)
Bot (cm)
Cont. wt (gr) Wet wt. (gr) Dry wt. (gr) Wat Cont. (%) Pen. At Top (kg/25) Comment 1 1 0 5 8.66 373.73 244.11 35.5 0.5Pre-impoundment
2 5 10 8.56 327.37 186.13 44.3 0.7Pebble-size lithic 3 10 15 8.51 321.75 166.99 49.4 0.5framgnets
4 15 20 8.64 387.61 240.5 38.8 0.6Uniform gray sand 5 20 25 8.66 354.29 277.78 22.1 3.5plant roots
6 25 30 8.43 358.02 289.26 19.7 4.57 30 35 8.59 330.81 264.85 20.5 28 35 40 8.81 382.48 304.91 20.8 1.49 40 45 8.55 345.56 272.39 21.7 1.1
10 45 50 8.76 350.08 278.58 20.9 1.111 50 55 8.56 352.56 280.3 21.0 112 55 60 8.58 390.6 312.18 20.5 1.513 60 65 8.01 284.79 230.59 19.6 1.4
20

3,140,000
3,140,000
3,155,000
3,155,000
3,170,000
3,170,000
6,8
28,0
00
6,8
28,0
00
6,8
43,0
00
6,8
43,0
00
TWDB Survey November 2003
N
Figure 5
0 10.5
Miles
Location of Survey Data and Core SamplesLocation of Survey Data and Core SamplesLAKE CHEROKEELAKE CHEROKEE
Surface Area @ 280.6'CPE 280.0' Islands
Estimated Points
Baylor Core Samples
Data Points
Verified Depths

TWDB Survey November 2003TWDB Survey November 2003
Figure 6Figure 6
Sediment Location and ThicknessSediment Location and ThicknessLAKE CHEROKEELAKE CHEROKEE
3138000
3138000
3148000
3148000
3158000
3158000
3168000
3168000
6815
000
6815
000
6825
000
6825
000
6835
000
6835
000
6845
000
6845
000
Sediment Thicknessin feet
1.26 - 1.50
1.01 - 1.25
0.76 - 1.00
0.51 - 0.75
0.26 - 0.50
0.01 - 0.25
Water Surface @ 280.6'
N
2,500 0 2,500 5,000Feet

TWDB Survey November 2003TWDB Survey November 2003
Figure 6a Figure 6a
Sediment Location and ThicknessSediment Location and ThicknessLAKE CHEROKEELAKE CHEROKEE
3158000
3158000
3168000
3168000
6828
000
6828
000
6838
000
6838
000
Area of DetailArea of Detail
Sediment Thicknessin feet
1.26 - 1.50
1.01 - 1.25
0.76 - 1.00
0.51 - 0.75
0.26 - 0.50
0.01 - 0.25
Water Surface @ 280.6'
2,500 0 2,500 5,000Feet
N

TWDB Survey November 2003TWDB Survey November 2003
Figure 6b Figure 6b
LAKE CHEROKEELAKE CHEROKEE
3136000
3136000
3146000
3146000
6829
000
6829
000
6839
000
6839
000
Sediment Thicknessin feet
1.26 - 1.50
1.01 - 1.25
0.76 - 1.00
0.51 - 0.75
0.26 - 0.50
0.01 - 0.25
Water Surface @ 280.6'
Sediment Location and ThicknessSediment Location and Thickness
Area of DetailArea of Detail
2,500 0 2,500 5,0001,250Feet
N

Sediment Depth Range 0.01 - 0.25 ft
Sediment Depth Range 0.75 - 1.0 ftSediment Depth Range 0.50 - 0.75 ft
Sediment Depth Range 0.25 - 0.50 ft
TWDB Survey November 2003
Figure 7aLAKE CHEROKEE
N
Modeled Sediment
Water Surface @ 280.6'
Modeled Sediment
Water Surface @ 280.6'
Modeled Sediment
Water Surface @ 280.6'
Modeled Sediment
Water Surface @ 280.6'

N
TWDB Survey November 2003
Figure 7bLAKE CHEROKEE
Sediment Depth Range 1.0 - 1.25 ft
Sediment Depth Range 1.75 - 2.0 ftSediment Depth Range 1.50 - 1.75 ft
Sediment Depth Range 1.25 - 1.50 ft
See Figure 5cSee Figure 5c
Modeled Sediment
Water Surface @ 280.6'
Modeled Sediment
Water Surface @ 280.6'
Modeled Sediment
Water Surface @ 280.6'
Modeled Sediment
Water Surface @ 280.6'

TWDB Survey November 2003
Figure 7cLAKE CHEROKEE
Sediment Depth Range 1.75 - 2.0 ft
Modeled Sediment
Water Surface @ 280.6'
Sediment Depth Range 1.50 - 1.75 ft
Modeled Sediment
Water Surface @ 280.6'

TWDB Survey November 2003
Figure 7dLAKE CHEROKEE
Sediment Depth Range 0.75 - 1.25 ft
Modeled Sediment
Water Surface @ 280.6'
Sediment Depth Range 0.25 - 0.75 ft
Modeled Sediment
Water Surface @ 280.6'

TWDB Survey November 2003
Figure 7eLAKE CHEROKEE
Sediment Depth Range 1.75 - 2.25 ft
Modeled Sediment
Water Surface @ 280.6'
Sediment Depth Range 1.25 - 1.75 ft
Modeled Sediment
Water Surface @ 280.6'

33
22
11
44
55
66
2020
1313
1515
99
2121
1919
1616
1818
88
1414
1010 77
1717
1212
3030
1111
2929
2828
2222
3232
2424
3131
2626
3333
3434
2323
2727
2525
3,140,000
3,140,000
3,150,000
3,150,000
3,160,000
3,160,000
3,170,000
3,170,000
6,81
7,00
0
6,81
7,00
0
6,82
7,00
0
6,82
7,00
0
6,83
7,00
0
6,83
7,00
0
TWDB Survey November 2003TWDB Survey November 2003
N
Figure 8 Figure 8
1 0 10.5
Miles
Elevation ReliefElevation ReliefLAKE CHEROKEELAKE CHEROKEE
ELEVATION IN FEET
Conservation PoolElevation 280.0
Islands @ 280.6'Cross Sections
246.1 - 252253 - 254255 - 258259 - 262263 - 266267 - 270271 - 274275 - 278279 - 280.6

3,144,000
3,144,000
3,154,000
3,154,000
3,164,000
3,164,000
6,82
7,00
06,
837,
000
N
273273
274274
275
275
276276
272272
271271270270
263
263
269269 268268
267267
266266
265
265
277
277
264
264
259
259
280280
261261
260260
262262
278278
279
279
257257256256
255
255
258
258
254
254
253253
251251
252252
250250
249249
252252
250250
269
269
252252
278278
261261
262262
280
280
274
274
254254
278278
266
266
260260
263263
254254
270270
259259
272
272
279279
252252
254254
269
269
280280
251251
265
265
271271
272
272
265
265 254254
252252
265
265
262
262
280280
269
269
258258
261261
260260
264
264
273273
271
271
272272
262262
279279
272
272
261261
257257
260260
251251
267
267
268
268
257257
256256
263
263
252252
269
269
262262
267
267
275275
280
280
280280
251251
278278
273273
262262
264
264
251251
280280
250250
257257
277277
254254
280
280
264264
261261
255255
254254
256256
258258
258258
272
272
257257
279279
249249
271271
265265
262262
256256
259259
250250
278
278
278278
260260
253253
263263
256256
271271
269269
266
266
257257
261261
254254
261261
279279
267267
255255
253253
279279
261
261
252252
257257
271
271
252252
257
257
264
264
267
267
264
264
263
263
258258
254254
260260
271
271
250250
251251
270
270
270
270
270
270
258258
271271
273273
270
270
257257
250250
255255
265
265
259259
257257
266
266
253253
280
280
267
267
264
264
269
269
267
267
262262
271271
251251
273273
251251
252252
259259
262262
254254
274274
263
263
258258
260
260
268
268
258258
275
275
256256
270270
269
269
269
269
254254
268
268
253253
275275
269269
280280
274274
272272
267
267
273273
263263
261261
249249
254254
256256
253253
272272
262262 259259
280280
262262
277277
262262
253253
253253
261261
273
273
264
264
254254
266
266
267
267
272272
271271
270
270
268
268
253253
270270
272
272
250250
266
266
268268
264
264
253253
273273
254254
269269
272272
269269
269269
268
268
269269
254254
279279
270270
252252
33
22
11
44
55
66
1313
1515
99
1616
1414
88
1010
77
1818
1717
1212
3030
1111
2929
2828
2222
3232
1919
2424
3131
2626
3333
3434
2323
2727
2525
Prepared by : TEXAS WATER DEVELOPMENT BOARD NOVEMBER 2003
Figure 9
LAKE CHEROKEE2' - Contour Map
0.4 0 0.40.2 Miles
* Pool 280.6'
Range Lines
Islands
Water Surface
This map is the product of a survey conductedby the Texas Water Development
Board's Hydrographic Survey Programto determine the capacity of Lake Cherokee.The Texas Water Development Board makesno representations or assumes any liability.
279
279
278
278
277277
276
276
280280
275275
274274
273
273
272
272270
270
271271
269
269
272272
275275
275
275
274274
272
272
274274
270270
280280
273
273
273
273
276
276
280280
273273
273
273
272
272
271
271
273273
272272
273273
273
273
272
272
276276
272
272
273
273
276
276
271
271
277277
2020
2121
1919
1818
2222
3135303.968134
3135303.968134
6816
839.
3795
59
6816
839.
3795
59
6826
839.
3795
59
6826
839.
3795
59
* Conservation Pool Elevation 280.0'
EA
SX
TT
ER
AW
M
EN
T
POLEDEV
BO
AR
D
Contours
272
274
276
278
280
250
252
254
256
258
260
262
264
266
268
270