volume - pdfs.semanticscholar.org · collecting system xvolume (1.0 ml) rate of flow (ml/sec)...
TRANSCRIPT

THE PULMONARYBLOODVOLUMEIN MAN*
By DONALDS. DOCK,t WILLIAM L. KRAUS,4 LOCKHARTB. McGUIRE,§ JOHNW. HYLAND,§ FLORENCEW. HAYNESAND LEWIS DEXTER
(From the Medical Clinic, Peter Bent Brigham Hospital, and the Department of Medicine,Harvard Medical School, Boston, Mass.)
(Submitted for publication August 8, 1960; accepted October 7, 1960)
The measurement of blood volume in the pulmo-nary vascular bed during life became theoreticallyfeasible with the introduction of indicator dilutionmethods by Stewart (1) and Hamilton, Moore,Kinsman and Spurling (2). The principles andformulas set forth by these investigators have sinceundergone extensive scrutiny by theoretical anal-ysis, in circulation models, and in vivo. As aresult of these studies, there exists now generalagreement that the introduction of an indicatorsubstance into the central circulation, either di-rectly or by peripheral venous injection, anddownstream recording of its concentration changewith time during the first transit permits thedetermination of three important circulatory pa-rameters: 1) the cardiac output, 2) the meantransit time from injection to sampling site, and3) by multiplication of cardiac output and meantransit time, the circulating volume of blood be-tween injection and sampling sites, including alltemporally equidistant points in the vascular bed.
Practically speaking, then, the measurement ofpulmonary blood volume in vivo requires deter-mination of the mean transit time of an indicatorfrom the pulmonary artery to the left atrium to-gether with cardiac output.
The development of right and left heart catheter-ization has made the pulmonary artery and leftatrium accessible as injection and sampling sitesin man. Injection of an indicator through a
* This work was supported in part by grants from theLife Insurance Medical Research Fund, the AmericanHeart Association, and the National Heart Institute,(Grant no. H-450), Bethesda, Md.
t Work done during the tenure of a Research Fellow-ship from the American Heart Association. Present ad-dress: Dept. of Pediatrics, Yale University School ofMedicine, New Haven, Conn.
t Work done during the tenure of a Postdoctoral Fel-lowship from the Life Insurance Medical Research Fund.
§ Work done during the tenure of a Postdoctoral Re-search Fellowship from the National Heart Institute,Bethesda, Md.
cardiac catheter into the pulmonary artery is easy.The recording of dilution curves by sampling fromthe left atrium is feasible but cumbersome. Fur-thermore, it is uncertain whether an indicator in-jected into the pulmonary artery and sampled fromthe left atrium will undergo complete mixing, sinceit does not traverse a ventricular chamber in whichturbulent flow exists.
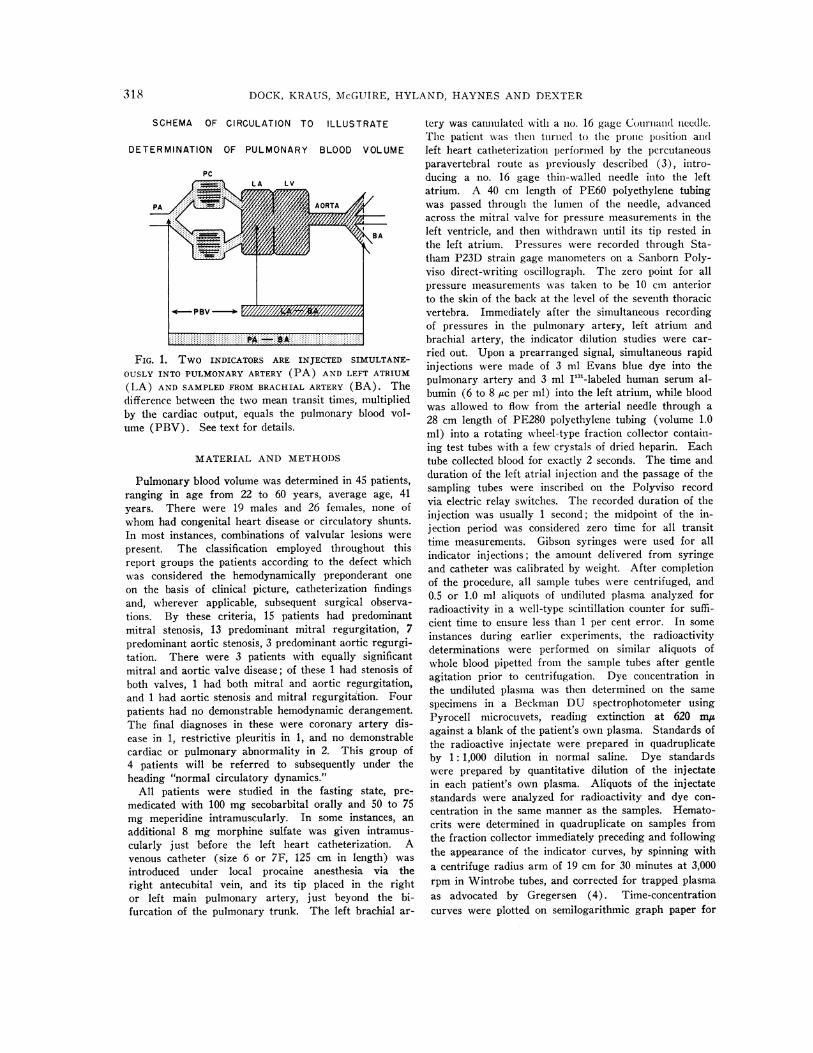
In the present study, an attempt was made tomeasure pulmonary blood volume in man by theStewart-Hamilton method and yet avoid left atrialsampling and the uncertainty of adequate mixingin the pulmonary circuit. The procedure em-ployed was the simultaneous injection of twodifferent indicators into the pulmonary artery andleft atrium, with sampling from the brachial ar-tery. This yields duplicate determinations ofcardiac output as well as the mean transit time ofindicator A from the pulmonary artery to thebrachial artery and of indicator B from the leftatrium to the brachial artery. By subtraction, themean transit time from pulmonary artery to leftatrium is obtained, and pulmonary blood volumecan be calculated. Both indicators traverse the leftventricle where they are exposed to a commondegree of turbulent mixing. The use of a commoncollecting system ensures that any distortion ofthe time-concentration curves due to its particularproperties would affect both indicators equally andthus, in effect, cancel out. The principle of thedetermination is represented schematically inFigure 1.
Since the method requires simultaneous cath-eterization of the right and left heart, no observa-tions in normal subjects were carried out. Thedeterminations were made in the course of diag-nostic studies on 45 adult patients who had orwere suspected of having mitral or aortic valvulardisease of sufficient complexity to warrant com-bined right and left heart catheterization for eval-uation of their cardiac status.
317
DOCK, KRAUS, McGUIRE, HYLAND, HAYNESAND DEXTER
SCHEMA OF CIRCULATION TO ILLUSTRATE
DETERMINATION OF PULMONARY BLOOD VOLUME
PC(a LA LV
BA~~~~B
4-PBV ---- EI /// //////
FIG. 1. Two INDICATORS ARE INJECTED SIMULTANE-OUSLY INTO PULMONARYARTERY (PA) AND LEFT ATRIUM(LA) AND SAMPLEDFROMBRACHIAL ARTERY (BA). Thedifference between the two mean transit times, multipliedby the cardiac output, equals the pulmonary blood vol-ume (PBV). See text for details.
MATERIAL AND METHODS
Pulmonary blood volume was determined in 45 patients,ranging in age from 22 to 60 years, average age, 41years. There were 19 males and 26 females, none ofwhom had congenital heart disease or circulatory shunts.In most instances, combinations of valvular lesions werepresent. The classification employed throughout thisreport groups the patients according to the defect whichwas considered the hemodynamically preponderant oneon the basis of clinical picture, catheterization findingsand, wherever applicable, subsequent surgical observa-tions. By these criteria, 15 patients had predominantmitral stenosis, 13 predominant mitral regurgitation, 7predominant aortic stenosis, 3 predominant aortic regurgi-tation. There were 3 patients with equally significantmitral and aortic valve disease; of these 1 had stenosis ofboth valves, 1 had both mitral and aortic regurgitation,and 1 had aortic stenosis and mitral regurgitation. Fourpatients had no demonstrable hemodynamic derangement.The final diagnoses in these were coronary artery dis-ease in 1, restrictive pleuritis in 1, and no demonstrablecardiac or pulmonary abnormality in 2. This group of4 patients will be referred to subsequently under theheading "normal circulatory dynamics."
All patients were studied in the fasting state, pre-medicated with 100 mg secobarbital orally and 50 to 75mg meperidine intramuscularly. In some instances, anadditional 8 mg morphine sulfate was given intramus-cularly just before the left heart catheterization. Avenous catheter (size 6 or 7F, 125 cm in length) wasintroduced under local procaine anesthesia via theright antecubital vein, and its tip placed in the rightor left main pulmonary artery, just beyond the bi-furcation of the pulmonary trunk. The left brachial ar-
tery was cannulated with a no. 16 gage Courinand needle.The patient was then turned to the pronc position andleft heart catheterization performe(l by the percutaneousparavertebral route as previously described (3), intro-ducing a no. 16 gage thin-walled needle into the leftatrium. A 40 cm length of PE60 polyethylene tubingwas passed through the lumen of the needle, advancedacross the mitral valve for pressure measurements in theleft ventricle, and then withdrawn until its tip rested inthe left atrium. Pressures were recorded through Sta-tham P23D strain gage manometers on a Sanborn Poly-viso direct-writing oscillograph. The zero point for allpressure measurements was taken to be 10 cm anteriorto the skin of the back at the level of the seventh thoracicvertebra. Immediately after the simultaneous recordingof pressures in the pulmonary artery, left atrium andbrachial artery, the indicator dilution studies were car-ried out. Upon a prearranged signal, simultaneous rapidinj ections were made of 3 ml Evans blue dye into thepulmonary artery and 3 ml I"3'-labeled human serum al-bumin (6 to 8 flc per ml) into the left atrium, while bloodwas allowed to flow from the arterial needle through a28 cm length of PE280 polyethylene tubing (volume 1.0ml) into a rotating wheel-type fraction collector contain-ing test tubes with a few crystals of dried heparin. Eachtube collected blood for exactly 2 seconds. The time andduration of the left atrial injection and the passage of thesampling tubes were inscribed on the Polyviso recordvia electric relay switches. The recorded duration of theinjection was usually 1 second; the midpoint of the in-jection period was considered zero time for all transittime measurements. Gibson syringes were used for allindicator injections; the amount delivered from syringeand catheter was calibrated by weight. After completionof the procedure, all sample tubes were centrifuged, and0.5 or 1.0 ml aliquots of undiluted plasma analyzed forradioactivity in a well-type scintillation counter for suffi-cient time to ensure less than 1 per cent error. In someinstances during earlier experiments, the radioactivitydeterminations were performed on similar aliquots ofwhole blood pipetted from the sample tubes after gentleagitation prior to centrifugation. Dye concentration inthe undiluted plasma was then determined on the samespecimens in a Beckman DU spectrophotometer usingPyrocell microcuvets, reading extinction at 620 myagainst a blank of the patient's own plasma. Standards ofthe radioactive injectate were prepared in quadruplicateby 1: 1,000 dilution in normal saline. Dye standardswere prepared by quantitative dilution of the injectatein each patient's own plasma. Aliquots of the injectatestandards were analyzed for radioactivity and dye con-centration in the same manner as the samples. Hemato-crits were determined in quadruplicate on samples fromthe fraction collector immediately preceding and followingthe appearance of the indicator curves, by spinning witha centrifuge radius arm of 19 cm for 30 minutes at 3,000rpm in Wintrobe tubes, and corrected for trapped plasmaas advocated by Gregersen (4). Time-concentrationcurves were plotted on semilogarithmic graph paper for
.318

PULMONARYBLOODVOLUMEIN MAN
each indicator and extrapolated through three logarithmiccycles from the onset of the straight-line downslope.Cardiac output and mean transit time were calculatedfrom each curve by the usual Stewart-Hamilton formulas(1, 2) as follows:
C. 0. (60) (Vol. I) (Conc. I)(2 Conc.) (1 - Hct)
MTT 2(Conc. X Time)2 Colnc.
where
C.O. = cardiac output (L/min)MTT= mean transit time (sec)Vol. I = volume of indicator injected (ml)
Conc. I = concentration of indicator injectedz Conc. = sum of the concentrations read at 1-second in-
tervals from the indicator dilution curve, extra-polated through 3 logarithmic cycles
Time = time at which each concentration occurred, inseconds, from midpoint of injection period
Hct = hematocrit, corrected for trapped plasma= observed Hct X 0.96.
Delay in the collecting system was calculated as follows:
collecting system Xvolume (1.0 ml)rate of flow (ml/sec)
The calculated delay was subtracted from all mean transittime measurements.
The average of the two cardiac output measurements as
calculated from the I'3l curve and from the Evans blue dyecurve was used for all volume calculations except for a fewinstances in which a part of either the radioactive iodine or
the dye was lost from the syringe during the process ofinjection. These situations do not involve an error in themean transit time calculation for that indicator. The fol-lowing volume calculations were carried out:
PA BA volume = C.O. (ml/sec)X MTTPA BA (sec)
LA BA volume = C.O. (ml/sec)
X MTTLA BA (see)Pulmonary blood volume = C.O. (ml/sec)
X (NiTT PA BA MTTLA BA)(sec).
RESULTS
The results of the study are listed in Table I,together with the pertinent hemodynamic param-
eters.
Cardiac output
There was substantial agreement between thesimultaneous cardiac output determinations, as
shown in Figure 2. The average ratio of the flowsas calculated from left atrial and pulmonary arterialinjections was 0.98, with a standard deviation,computed from the distribution of ratios, of 0.15.
v
ID
0
LLI
a.
-
0
0
A:
7i
6
5
3
2
..0
.
0
* 0
0*
* 0
,* e.Sf
.
*0 00"
0
0 2 3 4
AVE. COPA 098COLA
5 6 7 8
CARDIAC OUTPUT (L/min.) -LA INJECTION (RISA)
FIG. 2. SIMULTANEOUSCARDIAC OUTPUTSOBTAINED BY
INDICATOR DILUTION TECHNIQUE, USING T-1824 INJECTED
INTO PULMONARYARTERY AND RADIO-IODINATED SERUM
ALBUMIN (RISA) INJECTED INTO LEFT ATRIUM.
No systematic differences between the two deter-minations were found, although there were occa-
sional divergences for which no obvious explana-tion could be offered.
Mean transit time
Pulmonary mean transit time. The mean transittime from pulmonary artery to left atrium variedwidely between the extremes of 3.2 and 28.0 sec-
onds [1.9 and 15.2 seconds per m2 body surfacearea (BSA)], with an average of 9.1 seconds(5.6 per M2) for the entire group. It tended to bemore prolonged in the patients with mitral valvedisease-average 10.7 seconds (6.4 per M2) in themitral stenosis group; 9.2 seconds (5.9 per M2) inthe mitral regurgitant group; and 9.6 seconds (6.2per M2) in the three patients with combined mitraland aortic disease. The mean for the patients withaortic valve disease was 7.8 seconds (4.8 per M2)and for the group with normal circulatory dy-namics, 5.3 seconds (3.5 per M2). Much overlapof values was evident among the different groups.
Mean transit time from left atrium to brachialartery. With the exception of five outstandinglyprolonged values in patients with severe mitralregurgitation (18.4 to 34.5, 13.0 to 24.5 secondsper m2), the transit times between left atrium andbrachial artery ranged from 3.1 to 14.8 seconds
319
4
cielit ='

320 DOCK, KRAUS, McGUIRE, HYLAND, HAYNESAND DEXTER
'- N+ +++++++++++++++
ZZ-Z Nl44N N M M M zceqZZZN z (e14 NNN
cdCd C0;U N n M i WC--0SSS > S S- ~~ N ¢Wtltt0Now -C Cm
r.- r - t-
00,Y Nq~ om X e e - Y 0 OCq£- 'Y 0 0- 0 -~0- 40 oourz~~~~~~~~~~~o:Od N bO C'i M M -4 OOint_otvq MavMMe~O aesu u><
~ M MN .-4 '- q C1
Cd u
-~ w~0 4 )". N t 4 M In -l C4
Cd0,0d)~~ ~ ~ ~ ~ ~ ~ ~
0oiN n O \0 e \s _\estoM " 0_ C\ M t0-O M t\* as0\)\ olo \0 t- W0i- N N MMt 0rc Cr~v ooo \+O OO 0 Noo 4It \o 4 Ib0 Os1 u
O~~~~~~~~~~~~~~~~~~~~~~~~~~~~~~~~~~~~~~~~~~~~~~~~~~~~~C
>
st o '~~ C OX oo ov N0_On> XU000O O~ 4tOC~ O.-O roooOrO s e0o't- YU)e.O
m,¢ +Zo o ~ 00,-t- 0'£ O eo -£ ^ > >0%O<Oo00P+e>,o0-^, S,0f
¢--! *X\t 0 (40 .°in _'*Na 0-\ 0W4 n- ,0t 1 n\ 1 .4 1 0 0:3 Z., 0\ Mx ind 0-ON a,O- (7 M (7 in 00 N ul). _ -(. 0, int.M. .d 00 M 2+. 0 nMNC4 n
O-~ N N ,4 N N --N N M-'.NrC4! C4 N nM M MC.N Nc~ " N
tn 00 N- 0 i 2 n t O OU. Ooto OCt-tt-0('2"2 t'o \- C14 C14t
o+'t 0 - C7, " " 0\xt -- Mo00\0 0-0%O\0000 t- 4 COt> C
o4YM0~~~~~~~~~~~~~~~~~~~~~~~~~~~~
i¢Yr0 .Co *d r
00\0 0 0 u)0 0 02 4 M 0 0N0\0t)( UI! n \qe tn M
.i X O 0-0N v o"on 00ee~ Q 0%'*e.N UoN0 %U0U_0 ._>o @0\eEO0))
V. w
Y=dd9 z~~~~~~CC
C0¢ coO-V>uo NN~oS t ste ~ n n>
.A0
.1
Cd>o. 0 d.5o w n \ w\O~^- ON> ON+ X X ~ O +N_- +a ,0 wC!--0i 0 00 ot- O
*
II
ll

PULMONARYBLOODVOLUMEIN MAN
-J
>co
0
z
-J
a.
7OOr
600 F
500
400 F
300 F
200 p
100
0
0 0
* *
*g *t*
0 %agSS
1.0 2.0 3.0
CARDIAC INDEX - L /min./Sq.M. BS.A.
0
4.0
FIG. 3. RELATIONSHIP BETWEENCARDIAC OUTPUT ANDPULMONARYBLOODVOLUME. There is no evident correla-tion between pulmonary blood flow and pulmonary bloodvolume.
(2.0 to 8.1 per M2), with no notable differencesbetween the different groups. In the four patientswith normal circulatory dynamics, the range was
4.3 to 8.1 seconds (2.6 to 4.1 per M2).
Pulmonary blood volume
The pulmonary blood volume was found torange from 172 to 634 ml per M2 BSA, with a
mean of 322 ml per M2 for the entire group. Thepatients with mitral valve disease tended to showslightly higher values than the remainder, themean for the mitral stenosis group being 335, formitral regurgitation 335, for combined mitral andaortic disease 298, and for all patients with mitraldisease 331 ml per m2 as against 323 ml for thosewith aortic disease alone and 246 for the subjectswith normal circulatory dynamics. There was
much overlap among the groups, and the sampleof patients without mitral disease was too smallto assign statistical significance to the differencebetween the means.
Volumes between left atrium and brachial artery
Four patients with mitral regurgitation and one
with aortic regurgitation were found to havemarked increases of blood volume, relative to theother cases, in the compartment which includesthe chambers of the left heart and portions of theproximal arterial tree. The calculated volumes inthese five patients ranged from 540 to 1,039 ml perm2 BSA, and all showed marked enlargement of
the left atrium and ventricle by X-ray. All re-maining patients fell in a range of volumes from186 to 466 ml per m2, without significant differ-ences between the different groups. In general,the pulmonary blood volume and the volume be-tween left atrium and brachial artery tended to beof approximately equal size.
CorrelationsPossible correlations between the calculated pul-
monary blood volume and various simultaneouslymeasured hemodynamic parameters were exam-
ined. Since pulmonary blood volume is the prod-uct of cardiac output and mean transit time, acorrelation with one or the other of these twofactors is inherent in the calculation. No correla-tion with cardiac output was found (Figure 3),but higher pulmonary blood volumes were asso-
ciated with longer pulmonary mean transit times(Figure 4) (R = + 0.769). There was also an
inverse relationship between cardiac index andpulmonary mean transit times (Figure 5). Thecorrelation coefficient, utilizing the logarithmictransformation of the pulmonary mean transittime, was - 0.742. No correlation was foundbetween pulmonary blood volume and pulmonaryvascular resistance or pressure difference across
40
0
0~
28
26
24
22
20
18
16
14
1 2
I0
8
6
4
2
.
0
S Og
* 0' r
*
0
0
0
.
0
0 100 200 300 400 500 600 700
PULMONARY BLOOD VOLUME (PA-LA)cc. /sq. M. B.SA.
FIG. 4. RELATIONSHIP BETWEEN PULMONARY BLOOD
VOLUMEAND PULMONARYMEAN TRANSIT TIME. A sig-nificant direct correlation is seen between pulmonary bloodvolume and mean transit time, i.e., the pulmonary bloodvolume varies inversely with the velocity of blood flow.
321

DOCK, KRAUS, McGUIRE, HYLAND, HAYNESAND DEXTER
40 r
0
0 0 0
0*e *
0 50
. S 0gt~~~~
E 35El
a: 30
(ncn
25a-
-j
< 20
15
* LL
-J 10
0 1.0 2.0 3.0 4.0
CARDIAC INDEX - L./ min./ Sq. M.BSA
FIG. 5. RELATIONSHIP BETWEEN CARDIAC INDEX AND
PULMONARYMEANTRANSIT TIME. There is a direct cor-
relation between pulmonary blood flow and velocity.
5
x
I-
xx
xx
I-
0
0x
x
s.
.0 0
0. 0
S.
0
100 200 300 400 500 600
PULMONARY BLOOD VOLUME
cc /Sq. M. BSA
the pulmonary circulation (pulmonary arterialmean minus left atrial mean pressures). Figures 6and 7 show plots of pulmonary blood volumeagainst pulmonary arterial mean pressure and left
100 r
0'x
E
Iw
ci)
U)Ww
0-
w
1-
z0
-J
iL
90s
80
70x
x
60 F
50 x
40 [
30 P
20 F
10 [
0
0
0
x
0
*550
*. 0
0
x - PVR> 500
* ' PVR< 500
0 100 200 300 400 500 600 700
PULMONARYBLOOD VOLUME-cc./Sq.t BSA.
FIG. 6. RELATTONSHIP BETWEEN PULMONARYARTERY
PRESSURE AND PULMONARYBLOOD VOLUME. There is a
correlation between the volume of blood in the lungs andthe pulmonary arterial pressure, which is most evident inthose cases without marked elevation of pulmonary vascu-
lar resistance. See text for statistical significance.
FIG. 7. RELATIONSHIP BETWEENLEFT ATRIAL PRESSURE
AND PULMONARYBLOOD VOLUME. An apparent correla-tion exists between left atrial pressure and pulmonaryblood volume, particularly in the low resistance group.
atrial mean pressure. If all cases are included, no
significant correlation exists, the R values being0.258 and 0.283, respectively. On the other hand,if patients with pulmonary vascular resistancesabove and below 500 dynes-sec-cm-5 are con-
sidered separately, as in Figures 6 and 7, a tend-ency for increased pressures to be associated withincreased volumes becomes apparent as long as thevascular resistance remains below 500 dynes-sec-cm-5. Excluding the cases with resistances abovethis level, the correlation coefficients were 0.582and 0.524, respectively, both being highly signifi-cant (p < 0.001). Those patients with severelyelevated pulmonary vascular resistances tended tohave lower volumes than might have been ex-
pected from the pressure-volume relationship inthe low resistance group.
There was no evident correlation between thevolume of the pulmonary vascular compartmentand the age, sex or BRSA of these adult patients.
DISCUSSION
Consideration of possible errors of the method
The validity of measuring pulmonary bloodvolume by the method employed rests on certainassumptions,
322
28
X 26
, 24(01 22
-J 200° 18
417-
12
10
Ad 8
Z 60
4
Q- 2
700
.x r. PVR > 500e z PVR < 500
PULMONARYBLOODVOLUMEIN MAN
1. Proportiolnafily of ind1dicator to flow and veloc-ily of flow. through 1/Ic two lungs. Either theindicator injected into the l)llno1iary artery miustbe equally distributed to the two lungs, or if it isnot equally distributed, the velocity of flowthrough the two lungs must be identical. There isno reason to believe that indicator injected intothe main pulmonary artery or into one branchbecomes equally distributed in each main branch.In fact, the probability is that it does not. If thebolus of indicator is diverted predominantly to onelung, the pulmonary mean transit time affordscalculation of the blood volume of that lung plusthe volume of temporally equidistant vessels of theopposite lung. For the true blood volume of thelatter to be included, it is necessary to assumeequal velocity of blood flow through both lungs.This assumption has not been tested.
2. Bronchial circulation. The bronchial circula-tion anastomoses with the pulmonary circulation atthe arterial, capillary, and venous levels (5). Theflow is said to amount to between 2 and 5 per centof the cardiac output in normal man. The tem-porally equidistant portions of these bronchial col-laterals entering the lung are included in both thepulmonary arterial and left atrial injection vol-umes and therefore cancel out when these two aresubtracted from one another to arrive at the calcu-lation of pulmonary blood volume. If, however,blood passes from pulmonary artery to the bron-chial system as a result of a higher pressure in thepulmonary than in the corresponding systemiccirculation, the calculated pulmonary blood volumewould be artifactually large, due to an inclusion ofthis right to left volume which would not be in-cluded in the left atrial to brachial arterial volume.It seems unlikely that such a pulmonary tobronchial shunt would be of important magnitude.
3. Mixing of indicator in left atrium. In theevent of incomplete mixing of indicator injectedinto the left atrium, the calculated pulmonaryblood volume would include that portion of thechamber volume in which the left atrial injectatedid not mix and would thus be falsely high. Evi-dence indicates that there may indeed be incom-plete mixing of indicator within the left atrium,and the extent of incomplete mixing would pre-sumably be dependent upon the indicator's beinguniformly distributed in all parts of the atrium,and this would be affected in part by the time of
ifl(licator inijectionl relative to the cardiac cycle.1h1 (legrce to which this iniixiiio factor iinfluences
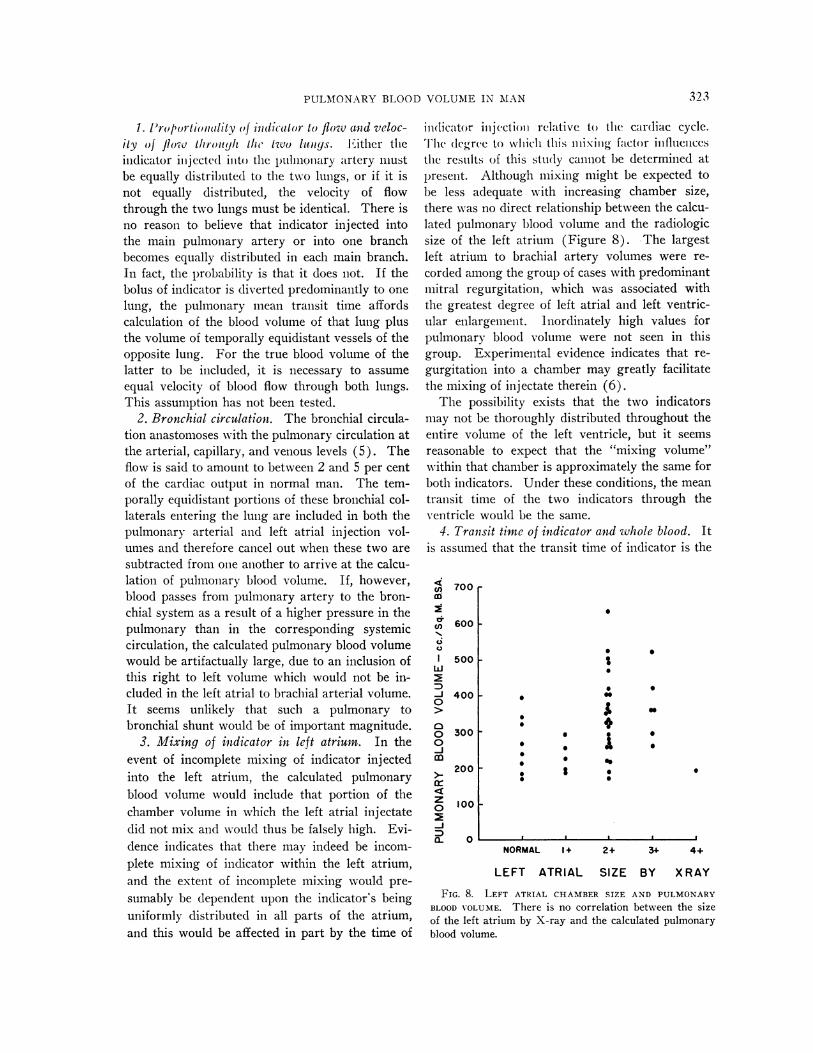
the resuilts of this study cannot be determined atpresellt. Although mixing might be expected tobe less adequate with increasing chamber size,there was no direct relationship between the calcu-lated pulmonary blood volume and the radiologicsize of the left atrium (Figure 8). The largestleft atrium to brachial artery volumes were re-corded among the group of cases with predominantmitral regurgitation, which was associated withthe greatest degree of left atrial and left ventric-ular enlargement. Inordinately high values forpulmonary blood volume were not seen in thisgroup. Experimental evidence indicates that re-gurgitation into a chamber may greatly facilitatethe mixing of injectate therein (6).
The possibility exists that the two indicatorsmay not be thoroughly distributed throughout theentire volume of the left ventricle, but it seemsreasonable to expect that the "mixing volume"within that chamber is approximately the same forboth indicators. Under these conditions, the meantransit time of the two indicators through theventricle would be the same.
4. Transit time of indicator and whole blood. Itis assumed that the transit time of indicator is the
cl)CD
nC.)
l
w-j
0
00
z0
-J)
0~
700 r
600 1
500 -
400 I
300 I
200 -
S
0S
0
S
0
4'* I
S
0
a
S
S
100 -
0NORMAL 1+ 2+ 34 4+
LEFT ATRIAL SIZE BY X RAY
FIG. 8. LEFT ATRIAL CHAMBERSIZE AND PULMONARYBLOOD VOLUME. There is no correlation between the sizeof the left atrium by X-ray and the calculated pulmonaryblood volume.
323

DOCK, KRAUS, McGUIRE, HYLAND, HAYNESAND DEXTER
same as that of whole blood Both the indicatorsutilized in this study were carried within theplasma fraction. Although there is evidence thatthe transit time for cells is faster than that forplasma within the central circulation (7), the errorintroduced into the pulmonary blood volume calcu-lation by this difference is not considered to besignificant.
5. Cardiac output. Cardiac output determina-tions by the indicator dilution method are believedto have an accuracy similar to that of the Fickmethod, both having an error of about 5 per cent(8, 9). The contribution of technical errors tothis percentage should be reduced by obtaining theaverage of two simultaneous cardiac output deter-minations with two different indicators. The ap-pearance of recirculating indicator before satis-factory recording of the exponential decay portionof the curve may cause errors in downslopeextrapolation which affect both the cardiac outputfigures and the mean transit time determination invarying degrees. This would be more likely tooccur in the dilution curve from pulmonary arterialinjection, due to the larger central volume and thelonger time required for inscription of the curve.However, the absence of a systematic differencebetween the pairs of simultaneous cardiac outputvalues, particularly in the range of the very lowoutputs, suggests that this has not been a sourceof significant error in these cases (Figure 2). Itwas necessary to eliminate several cases of severevalvular regurgitation from the study because theprolonged nature of the curves made it difficult todefine the exponential decay portion of the curvein the presence of recirculating indicator.
6. Measurement of mean transit time. The tim-ing of the beginning and duration of the two indi-cator injections was not independently recorded.Injection through the polyethylene catheter intothe left atrium requires 0.5 to 1.0 seconds, whileinjection into the pulmonary artery through theCournand catheter requires 1.0 to 1.5 seconds.Due to the larger volume of the latter, indicatorwill not reach the tip of the catheter until a finitelength of time after entry of the left atrial indicatorinto that chamber. The timing of both indicatorcurves was related to the midpoint of the leftatrial injection. This introduces an error in thedetermination of the mean transit time of the
pulmonary arterial indicator, which is assumed notto exceed 0.75 second. The two indicator curveswere sampled simultaneously in a fraction col-lector, thus avoiding a change in the state of thepatient. Samples were collected at 2-second inter-vals, producing a potential error in mean transittime of 1 second. An alternative technique usedby McGaff, Jose and Milnor, has been to injectindicators into the pulmonary artery and leftatrium consecutively rather than simultaneouslyand record the time-concentration curve at thebrachial artery with a densitometer (10). Thishas the advantage of potentially improving theaccuracy of timing, but the disadvantage of non-simultaneous determinations. It is currently notpossible to record accurately two different dyessimultaneously with two different densitometers.
Because the same aliquots of blood were an-alyzed for both indicators, errors in the calculatedpulmonary mean transit time due to faulty timingof the collecting system, measurement of delaywithin the sampling catheter, and irregular skew-ing of the time-concentration curve by the periph-eral arterial system have been eliminated.
In considering the above sources of error in thecardiac output and mean transit time determina-tions, it must be assumed that an over-all error of20 to 30 per cent may thus be introduced into thecalculation of the pulmonary blood volume.
Comparison with previous studies of central bloodvolume
The circulating blood volume of the pulmonaryvascular compartment has defied exact measure-ment despite Stewart's demonstration in 1897 ofthe theoretical basis for this calculation (1). Fur-ther theoretical and experimental confirmation ofthe validity of this volume determination, utilizingthe product of the mean transit time of indicatorparticles and the blood flow, has been given re-peatedly (2, 11-14).
Investigators have previously calculated "cen-tral," "intrathoracic," and "pulmonary" blood vol-umes by this method. However, the inability tomeasure the mean transit time of indicator par-ticles traveling from pulmonary artery to leftatrium has prevented determination of the pulmo-nary vascular volume alone. The results of sev-eral of the earlier studies are compared with the
324

PULMONARYBLOODVOLUMEIN MAN
TABLE II
Central blood volumes in man *
Subjects Average %Average of total
Compartment No. Type volume blood volume
mi/M2 BSAPeripheral vein to
systemic artery 91 Normal 1,370 60Pulmonary artery to
systemic artery 76 Normal 650 23Right ventricle to 46 Normal 690 28
left ventricle 12 Mitral stenosis 609 29Pulmonary artery to left atrium
Kunieda (23) 23 Rheum. heart disease 350 12-14tMilnor and associates (24) 19 Rheum. heart disease 365 12-15tPresent study 45 Rheum. heart disease 322 11-13t
* Stewart-Hamilton method adopted from Lammerant (15).t Assuming total blood volume = 2.5 to 3.0 L/m2 BSA.
volumes found in the present investigation in Ta-ble II, with the results grouped according to thevascular compartment measured. This table wasadapted from Lammerant (15). The first groupof studies (16-20), utilizing peripheral vein injec-tions with sampling from a systemic artery, re-vealed central volumes averaging 60 per cent oftotal blood volume comprising the heart, lungs,and large portions of the arterial and venous sys-tems. Pulmonary arterial injections, in the secondgroup, permitted calculation of the blood volumeof the lungs, left heart, and part of the systemicarterial compartment, with values averaging 23per cent of total blood volume (9, 21, 22). Lam-merant determined the pulmonary mean transittime from biphasic dilution curves recorded froma precordial surface counter following peripheralvein injection (15). The calculated central vol-umes, probably including significant portions ofthe heart chamber volumes, averaged 28 to 29 percent of the total blood volume.
Kunieda in 1955 (23) and, recently, Milnor,Jose and McGaff (24) have reported values forpulmonary blood volume closely approximatingthose of the current study, determined by similarmethods in comparable groups of patients. Thevalues obtained in these studies are of a signifi-cantly lower order of magnitude than those re-ported by others. Although the total blood volumewas not determined, by assuming it to averagebetween 2.5 and 3.0 L per m2 BSA (25, 26), thepulmonary blood volume was found to represent
approximately 12 per cent of the total blood vol-ume. In the four patients with normal circulatorydynamics, this figure was 9 per cent.
Factors influencing the pulmonary blood volumeA previous report from this laboratory by
Rapaport, Kuida, Haynes and Dexter (27) de-scribed the general lack of agreement in the litera-ture concerning the extent to which certain factorsmay influence the volume of the pulmonary vas-cular compartment. The values obtained in thisstudy, representing what is considered to be acloser approximation to the true pulmonary bloodvolume, have been correlated with other hemody-namic parameters measured during combined rightand left heart catheterization.
Contrary to the findings of Rapaport and co-workers (27), no relationship was noted betweencardiac output and pulmonary blood volume. Oneevident explanation for this divergence of resultsis that the earlier study contained a smaller num-ber of cases and pertained to the volume of bloodbetween pulmonary artery and brachial artery.The alternate possibility is that the present studyincluded a greater number of patients with severepulmonary vascular disease, in which case analtered vessel distensibility could obscure a directflow-volume relationship. No such relationshipwas evident, however, when the cases exhibitinghigh pulmonary vascular resistance wvere segre-gated from the remainder of the group.
It is reasonable to suspect that pressure eleva-
325

DOCK, KRAUS, McGUIRE, HYLAND, HAYNESAND DEXTER
tion within the left atrium would be reflected by avolume increase in the pulmonary vascular bedand perhaps in the calculated pulmonary bloodvolume. Indeed, it has been thought that pulmo-nary "congestion" is responsible for most of theclinical picture associated with mitral valve diseaseand/or left ventricular failure. A correlation wasfound in this study between the level of left atrialpressure and pulmonary blood volume, the meanpulmonary blood volume being 277 ml per m2 inthe group of cases with left atrial pressure 15 mmHg or less, and 357 ml in those patients withatrial pressures above this level (see Figure 7).The difference between these means is statisticallysignificant, the p value being less than 0.02. Ifthose cases with calculated pulmonary vascularresistance above 500 dynes-sec-cmn5 are excluded,the effect of elevated left atrial pressure uponpulmonary blood volume is even more evident, themeans of these two groups being 264 and 403 mlper m2 (p = <0.01).
A markedly elevated pulmonary vascular re-sistance is apparently associated with smaller vol-umes than would be expected from the pressure-volume relationship seen in the low resistancegroup. This is not a surprising finding if it isassumed that an elevated pulmonary vascularresistance represents vasoconstriction or mechan-ical obstruction of the pulmonary vessels. Theseprocesses may involve the pulmonary veins as wellas arteries. Simon has demonstrated radiologicevidence of regression of engorgement of the pul-monary venous system in a group of cases withsevere elevations of left atrial pressures as com-pared to a group with only moderate left atrialhypertension (28).
Figure 6 shows a similar relationship betweenthe pulmonary arterial pressure and pulmonaryblood volume. The association is more evident inthe absence of pulmonary vascular disease, whenmean pulmonary arterial pressure changes merelyreflect rises of left atrial pressures. With theonset of severe elevation of pulmonary vascularresistance, these three parameters no longer ex-hibit the same dependence upon one another.
As has been pointed out by Burton (29), thefactor which determines the volume of a vessel isthe transmural pressure, or the difference in pres-sures within the lumen and exterior of the vessel.
This transmural pressure does not necessarilybear a direct relationship to the gradient across avascular bed from arterial to venous segment.Thus, it is understandable that a correlation wasnot observed between the pulmonary blood volumeand the pressure difference across the pulmonarycirculation (pulmonary arterial mean - left atrialmean pressure) or the pulmonary vascular re-sistance.
In view of the varying severity of the diseaseprocess among the diagnostic groups, it was notunexpected that the type of lesion, age, sex, orsize of the patient had no apparent influence uponthe volume of the pulmonary vascular com-partment.
The studies of Lammerant (15) indicate asignificant reduction in pulmonary blood volumeduring exercise and following food intake. Re-distribution of blood with the upright position willresult in a shift of blood out of the thorax and tothe lower extremities. These influences, however,were not in effect in the patients of this study, whowere all fasting and in the prone position.
It is apparent that there is no single determiningfactor governing the pulmonary blood volume indisease states, and it is concluded that a number ofopposing influences are in operation whose com-bined effect is to maintain this volume of blood inthe lungs within a relatively narrow range. Whileit is probable that increased pulmonary venouspressure, by producing distention of that vascularsegment and also of the arterial compartment,tends to cause an increase of pulmonary bloodvolume, at the same time pulmonary vasoconstric-tion or vascular obliteration may be present andexert an opposite effect. Under such conditionsthe pulmonary blood volume as a whole mightshow no dramatic change.
SUMMARY
A method for the measurement of pulmonaryblood volume in man has been described, utilizingthe product of the cardiac output and the pulmo-nary mean transit time as determined by simul-taneous indicator injections into pulmonary arteryand left atrium.
The method has been applied to the study of 45patients during combined right and left heartcatheterization. The assumptions on which this
326

PULMONARYB3LOODVOLUMEIN MAN
miethod is based are discussed, possible sources oferror are considered, and the results are comparedwith previous studies of the pulmonary blood vol-ume. The values obtained are essentially the sameas those reported by Kunieda and Milnor andassociates. They are significantly smaller thanthose previously reported by others, and arethought to approach more closely the true volumeof the pulmonary vascular compartment.
In the absence of severe pulmonary vasculardisease, there appears to be a direct relationshipbetween the volume of blood in the lungs and thepressure within the pulmonary venous system.However, in the presence of vasoconstriction ormechanical obstruction of the pulmonary vessels,as reflected by an elevated vascular resistance,this relationship is altered and further elevationsin pressure are not accompanied by volume in-creases of the same magnitude.
It is evident that a number of interrelated andopposing forces determine the volume of blood inthe lungs, and their combined effect is to maintainthis volume within a relatively narrow range.
REFERENCES1. Stewart, G. N. Researches on the circulation time and
on the influences which affect it. IV. The outputof the heart. J. Physiol. (Lond.) 1897, 22, 159.
2. Hamilton, WV. F., Moore, J. WV., Kinsman, J. M., andSpurling, R. G. Studies on the circulation. IV.Further analysis of the injection method, and ofchanges in hemodynamics under physiological andpathological conditions. Amer. J. Physiol. 1932,99, 534.
3. Bj6rk, V. O., Malmstr6m, G., and Uggla, L. G. Leftauricular pressure measurements in man. Ann.Surg. 1953, 138, 718.
4. Gregersen, Mf. I. A practical method for the deter-mination of blood volume with the dye T-1824. J.Lab. clin. Med. 1944, 29, 1266.
5. Parker, B. M., and Smith, J. R. Pulmonary embo-lism and infarction. A review of the physiologicconsequences of pulmonary arterial obstruction.Amer. J. Med. 1958, 24, 402.
6. Phinney, A. 0. Personal communication.7. Dow, P., Hahn, P. F., and Hamilton, WV. F. The
simultaneous transport of T-1824 and radioactivered cells through the heart and lungs. Amer. J.Physiol. 1946, 147, 493.
8. \Verkb, L., Lagerlof, H., Bucht, H., Wehle, B., andHolmgren, A. Comparison of the Fick and Ham-ilton methods for the determination of cardiac out-put in man. Scand. J. clin. Lab. Invest. 1949, 1,109.
9. Doyle, J. T., Wilson, J. S., Le'pine, C., and Warren,J. V. An evaluation of the measurement of the car-diac output and of the so-called pulmonary bloodvolume by the dye-dilution method. J. Lab. clin.Med. 1953, 41, 29.
10. McGaff, C. J., Jose, A. D., and Milnor, XV. R. Pul-monary, left heart and arterial volume in valvularheart disease. Clin. Res. 1959, 7, 230.
11. Meier, P., and Zierler, K. L. On the theory of theindicator-dilution method for measurement of bloodflow and volume. J. appl. Physiol. 1954, 6, 731.
12. Dow, P. Estimations of cardiac output and centralblood volume by dye dilution. Physiol. Rev. 1956,36, 77.
13. Braunwald, E., Cournand, A., and Fishman, A. P.Evaluation in a model of Stewart-Hamilton andBradley methods for measurement of volume ofvascular segments. Fed. Proc. 1955, 14, 17.
14. Schlant, R. C., Novack, P., Kraus, W. L., Moore,C. B., Haynes, F. W., and Dexter, L. The de-termination of central blood volume. A comparisonof the Stewart-Hamilton method with direct meas-urements in dogs. Amer. J. Physiol. 1959, 196,499.
15. Lammnerant, J. Le Volume Sanguin des PoumonsChez l'Homme. Bruxelles, Editions Arscia, 1957.
16. Kopelman, H., and Lee, G. de J. The intrathoracicblood volume in mitral stenosis and left ventricularfailure. Clin. Sci. 1951, 10, 383.
17. Ball, J. D., Kopelman, H., and XVitham, A. C. Cir-culatory changes in mitral stenosis at rest and onexercise. Brit. Heart J. 1952, 14, 363.
18. Etsten, B., and Li, T. H. Hemodynamic changesduring thiopental anesthesia in humans: Cardiacoutput, stroke volume, total peripheral resistance,and intrathoracic blood volume. J. clin. Invest.1955, 34, 500.
19. Monge, C. C., Cazorla, A. T., XWhittembury, G. M.,Sakata, Y. B., and Rizo-Patron, C. A descriptionof the circulatory dynamics in the heart and lungsof people at sea level and at high altitude by meansof the dye dilution technique. Acta physiol. lat-amer. 1955, 5, 198.
20. Mills, H., and Kattus, A. A., Jr. A comparison ofvolumes calculated from median circulation timeand from slope of human dye dilution curves. J.Lab. clin. Med. 1956, 48, 413.
21. Doyle, J. T., W\ilson, J. S., Estes, E. H., and War-ren, J. V. The effect of intravenous infusions ofphysiologic saline solution on the pulmonary ar-terial and pulmonary capillary pressure in man.J. clin. Invest. 1951, 30, 345.
22. Doyle, J. T., Wilson, J. S., and Warren, J. V. Thepulmonary vascular responses to short-term hy-poxia in human subjects. Circulation 1952, 5, 263.
23. Kunieda, T. Determination of pulmonary blood vol-ume in patients with mitral valve disease by T-1824dye method. Kokyu to Junkan 1955, 3, 510.
327

DOCK, KRAUS, McGUIRE, HYLAND, HAYNESAND DEXTER
24. Milnor, W. R., Jose, A. D., and McGaff, C. J. Pul-monary vascular volume, resistance, and compli-ance in man. Circulation 1960, 22, 130.
25. Gibson, J. G., 2nd, and Evans, W. A., Jr. Clinicalstudies of the blood volume. I. Clinical applica-tion of a method employing the azo dye "Evansblue" and the spectrophotometer. J. clin. Invest.1937, 16, 301.
26. Gibson, J. G., 2nd, and Evans, W. A., Jr. Clinicalstudies of the blood volume. II. The relation ofplasma and total blood volume to venous pressure,blood velocity rate, physical measurements, age
and sex in ninety normal humans. J. clin. Invest.1937, 16, 317.
27. Rapaport, E., Kuida, H., Haynes, F. W., and Dexter,L. The pulmonary blood volume in mitral steno-sis. J. clin. Invest. 1956, 35, 1393.
28. Simon, M. The pulmonary veins in mitral stenosis.J. Fac. Radiol. (Lond.) 1958, 9, 25.
29. Burton, A. C. The relation between pressure andflow in the pulmonary bed in Pulmonary Circula-lation, W. Adams and I. Veith, Eds. New York,Grune and Stratton, 1959, p. 26.
328