volume 93, number 6, november-december 1988nvlpubs.nist.gov/nistpubs/jres/093/6/v93-6.pdfvolume 93,...
TRANSCRIPT


Volume 93, Number 6, November-December 1988
Journal of Research of the National Institute of Standards and Technology
News Briefs
Developments
EXPORTERS URGED TO FOLLOWPROPOSED EC STANDARDSThe Commission of the European Communities(EC) is acting swiftly to turn the 12 member coun-tries into a single integrated market of 320 millionpeople by the end of 1992. EC legislation dealingwith standardization is likely to have a profoundeffect on U.S. exports, predicts an NIST report.The report recommends U.S. business interestsshould establish communications with Europeansubsidiaries, distributors, or their American indus-try associations to obtain up-to-date information onthe development of European directives and stan-dards. U.S. companies also are urged to seek andtake opportunities to comment on, and attempt toinfluence, proposed European directives and stan-dards. The NIST report contains a list of EC andU.S. government contacts for information on vari-ous aspects of EC activities related to standardiza-tion.
To obtain a copy of A Summary of the NewEuropean Community Approach to Standards De-velopment (NBSIR 88-3793-1), send a self-ad-dressed mailing label to: Patrick W. Cooke, Officeof Standards Code and Information, A629 Admin-istration Building, National Institute of Standardsand Technology, Gaithersburg, MD 20899.
USING ELEVATORS FOR THE HANDI-CAPPED DURING A FIREEvacuating the handicapped during a fire has longbeen a concern to the fire protection community.Elevators would be an ideal solution, except for anumber of fire-related problems including the "pis-ton effect," which potentially can pull smoke andtoxic gases into an elevator lobby as the elevator
car moves upward. In a joint project, researchersat NIST and the National Research Council ofCanada (NRCC) are developing smoke controltechnology for elevators and, most recently, ana-lyzed the problem of piston effect. Several con-cepts for smoke control currently are being testedat NRCC's full-scale research tower. As part of theproject, NIST and NRCC jointly will developpractical engineering design information for eleva-tor smoke control.
NEW DIAGRAM FOR PREDICTING WELDPHASESNIST researchers have produced a new, more ac-curate diagram for predicting the ferrite content ofstainless steel welds. Knowledge of the ferrite con-tent is important because, when held to within acertain small range, it helps to control the proper-ties of the weld. Too low a ferrite content cancause cracking and too high a content can increasethe rate of corrosion. The new diagram, developedin cooperation with the Colorado School of Minesand the Welding Research Council, was producedfrom a database containing more than 950 alloycomposites from worldwide sources. It is more ac-curate than the two most commonly used dia-grams, termed DeLong and Schaeffer.
For more information, contact Thomas A.Siewert, Fracture and Deformation Division, Na-tional Institute of Standards and Technology,Boulder, CO 80303.
HIGH ACCURACY SATELLITE TIMETRANSFERSatellites have been used for over 25 years for dis-semination of highly accurate time information.The coverage, however, has been restricted to cer-tain areas of the Earth's surface. Now, NIST scien-tists can utilize several commercial communicationsatellites to disseminate a time signal whose even-tual coverage will be worldwide. It will be an
637

Volume 93, Number 6, November-December 1988
Journal of Research of the National Institute of Standards and Technology
extremely accurate signal-to within 1 nanosecond(1 billionth of a second). The experimental servicewas initiated recently using domestic U.S. satellitesand will be extended to an Intelsat satellite; usersrequire both a receiver and a transmitter. For moreinformation, contact Dave Howe, Time and Fre-quency Division, National Institute of Standardsand Technology, Boulder, CO 80303.
GOSIP APPROVED AS FEDERAL STANDARDThe Government Open Systems InterconnectionProfile known as GOSIP was approved recentlyby the Secretary of Commerce as a Federal Infor-mation Processing Standard. (FIPS are developedby NIST for use by the federal government.)GOSIP defines a common set of data communica-tion protocols which enable computer systems de-veloped by different vendors to communicate andenable the users of different applications on thesesystems to exchange information. GOSIP is basedon agreements reached by vendors and users ofcomputer networks in workshops organized by theNIST National Computer and Telecommunica-tions Laboratory.
Order FIPS PUB 146, Government Open Sys-tems Interconnection Profile (GOSIP) from theNational Technical Information Service, Spring-field, VA 22161.
EXPANDED COAXIAL NOISECALIBRATION AVAILABLENIST now can calibrate noise sources in the 8 to 12GHz range for government and industry. The cali-bration is achieved using an automated radiometerand a cryogenic coaxial noise standard. With theaddition, the system now routinely calibrates noisesources from 2 to 12 GHz at all frequencies and atall noise power spectral densities below 18,000 K.Measurement uncertainties range typically from 1to 3 percent. In principle, there is no limitation onthe type of coaxial connector. Current connectorsare precision N, APC7, and GR900 as well as vari-ous rectangular waveguide flange connectors. Theservice is valuable to users since noise is the ulti-mate limiting factor in electromagnetic system per-formance. Manufacturers and users of high-precision electronic and communications equip-ment desire low-noise products so the productsthemselves don't distort the signal being generated,amplified, and received.
For more information contact George J. Counas,Division 723.02, National Institute of Standardsand Technology, Boulder, CO 80303, 303/497-3664.
U.S., CANADA LABORATORY ACCREDITA-TION TO FACILITATE INTERNATIONALTRADEThe U.S. National Institute of Standards and Tech-nology (NIST) and the Standards Council ofCanada (SCC) signed an agreement that will helpreduce trade barriers between the world's twolargest trading partners.
The agreement-signed by Ernest Ambler,NIST director, and John R. Woods, SCC execu-tive director-provides mutual recognition of test-ing laboratories which are accredited by the NISTNational Voluntary Laboratory Accreditation Pro-gram (NVLAP) and SCC National AccreditationProgram for Testing Organizations (NAPTO).
The agreement is in accord with provisions ofthe assigned U.S.-Canada free trade agreement thatis to go into effect January 1, 1989 pending ap-proval by legislators in both countries. Under thefree trade agreement, each party shall providerecognition of the accreditation systems for testingfacilities, inspection agencies, and certification bod-ies of the other party.
The laboratory accreditation systems adminis-tered by NIST and SCC are voluntary; participa-tion is not mandated by law in either country.NIST and SCC base their decision to accredit atesting laboratory on similar but not identical crite-ria. Officials responsible for administering each sys-tem have participated in assessment visits to testinglaboratories accredited under the other nationalprogram.
The NVLAP program, established in 1976 andmanaged by the NIST Office of the Associate Di-rector for Industry and Standards, is a voluntary"umbrella" system designed to assess the compe-tence of laboratories to perform specific tests."Competence" is determined by evaluating appli-cant laboratories to assure that they have the equip-ment, staff, and procedures necessary to performprescribed tests in accordance with nationally orinternationally accepted standards or test methods.
Currently, approximately 200 laboratories areaccredited in programs administered by NIST forthermal insulation, carpet, solid-fuel room heaters,acoustical testing services, personnel radiationdosimeters, commercial products (paint, papers,and plastics), building seals and sealants, construc-tion materials testing services, electromagneticcompatibility and telecommunications equipment,computer network protocols, and asbestos.
The Canadian NAPTO program was establishedin 1980. Formal recognition of competence inmanaging and performing specific tests has beengranted to 49 private sector and government
638

Volume 93, Number 6, November-December 1988
Journal of Research of the National Institute of Standards and Technology
laboratories in scientific, engineering and techno-logical fields including: biological, chemical, elec-trical, mechanical, nondestructive, and physicaland calibration testing. Testing organizations ac-credited under the SCC program form part of theNational Standards System of Canada.
The agreement with the Standards Council ofCanada is the fourth pact between NIST and a for-eign laboratory accreditation system. NIST alsohas agreements with Australia's National Associa-tion of Testing Authorities, the National TestingLaboratory Scheme of the United Kingdom's Na-tional Physical Laboratory, and Testing Labora-tory Registration Council of New Zealand.
For further information on NAPTO, or theNIST NVLAP program, contact: Manager, Lab-oratory Accreditation, A527 Administration Build-ing, National Institute of Standards and Tech-nology, Gaithersburg, MD 20899, 301/975-4016.
FIVE NIST PROJECTS WIN 1988 R&D 100AWARDSFive research projects in instrumentation and mea-surement technology from the Commerce Depart-ment's National Institute of Standards andTechnology (NIST) received R&D 100 Awards.
R&D 100 Awards are bestowed annually by Re-search & Development magazine to highlight 100significant technical products of the precedingyear. NIST has now received 62 R&D 100 Awardssince first entering the competition in 1973.
The 1988 award-winning projects include:
Optical Waveguide Dosimeter
William L. McLaughlin of the NIST Center forRadiation Research and Branislav Radak, a guestscientist from the Boris Kidric Institute inYugoslavia, developed an extraordinarily versatileionizing radiation dosimeter around the concept ofradiation-sensitive dyes.
Colorless compounds that take on color whenirradiated, "radiochromic dyes" have been in usefor some years as one-shot, disposable dosimetersfor industrial radiation processing, an applicationthat McLaughlin pioneered.
In the new invention, the dyes are used in thecore of a long fiber-optic tube that can be coiledinto a small space, about 2 centimeters square. Alight source at one end and a detector at the otherread changes in the dye.
Because the light path can be quite long even ina small detector, the instrument can be made ex-
tremely sensitive. The optical waveguide dosime-ters can function over a range from about 0.005 to10,000 gray.
They will register either pulsed or steady radia-tion fields, and can measure accurately both doseand dose rates of x and gamma rays, neutrons, andcharged-particle beams.
By selecting from a variety of available ra-diochromic dyes and plastics, researchers can tailorthe dosimeters to have special properties, such asmatching the radiation interaction characteristicsof tissue for medical applications and radiation pro-tection.
Cone Calorimeter
Vytenis Babrauskas and William Twilley of theNIST Center for Fire Research developed an ap-paratus which provides the data critical to predict-ing the fire hazard of a product from a smallsample of material.
The instrument, known as the NIST ConeCalorimeter, measures the heat released and therate at which it is released, the time it takes for amaterial to ignite, the amount of smoke produced,and the amount of several known toxic gases.Equipment previously available could not measureas many fire properties.
Both the ASTM and the International Organiza-tion for Standardization are proposing voluntaryfire hazard test methods based on the NIST ConeCalorimeter. Commercial units now are sold bytwo U.S. manufacturers and a rapidly growingnumber are in use worldwide.
System for Absolute Determinationof Aqueous Electrolyte Conductivity
Three NIST researchers constructed a devicethat determines the "absolute" electrical conduc-tivity of aqueous (water-based) solutions and canbe used as a primary standard against which otherinstruments may be compared.
The unique feature of the device is its measure-ment cell. Other available systems rely on cells offixed geometry and work by comparing a solutionof unknown conductivity to a standard calibrationsolution of known conductivity. These instrumentstypically are accurate to 0.1 percent.
The NIST system uses a variable cell size anddoes not have to be calibrated. Because its resultsare traceable to the physical standards of mass,length, and electrical resistance, the new deviceprovides an "absolute" conductivity determinationwith an accuracy of 0.02 percent.
639

Volume 93, Number 6, November-December 1988
Journal of Research of the National Institute of Standards and Technology
It also features extremely accurate temperaturecontrol, which is important because conductivitymeasurements are dependent on temperature.
The device has many potential applications.Standards laboratories desiring an absolute measur-ing system could adapt it. Other laboratories coulduse the device to calibrate existing conductivitymeasuring instruments. Oceanographers could em-ploy it in measuring seawater salinity, and environ-mental scientists could determine dissolved solids.
With minor modifications, the device also couldbe used as a reliable indicator of water purity. Be-cause contaminants change the electrical conduc-tance of water, a measurement of a sample'sconductance is a test of its purity. Such an instru-ment would be valuable in the pharmaceutical,electrical power, and electronics industries, whichrely on pure water for their products.
The NIST system for absolute determination ofaqueous electrolyte conductivity was developed byDrs. Yung Chi Wu, Kenneth W. Pratt, and WilliamF. Koch, all of the NIST Center for AnalyticalChemistry.
Trace Measurement System
Computers known as multiprocessors use morethan one computing element, or "processor," tosimultaneously solve many pieces of a problem.While multiprocessors can speed the processing ofdata, they also have unique problems including un-balanced processing loads, uneven flow of informa-tion, and an increased likelihood of communi-cations bottlenecks.
Three researchers in the NIST National Com-puter and Telecommunications Laboratory devel-oped tools to help measure the performance ofmultiprocessors. The ability to measure perfor-mance helps users evaluate and compare machinesand manufacturers improve future designs.
Through a single circuit board added to thecomputer system, the Trace Measurement System(TRAMS), can measure key characteristics of aprogram such as the time it takes to execute a pieceof code and how frequently a piece of code is exe-cuted.
Unlike other measurement systems now on themarket, TRAMS is significantly simpler and, moreimportantly, does not disturb the operation beingmeasured. Disturbances, or "perturbations," can al-ter the performance of a multiprocessor, makingthe results of the measurement meaningless.
NIST researchers Robert J. Carpenter, John W.Roberts, and Alan Mink developed the measure-ment system with partial sponsorship from the De-fense Advanced Research Projects Agency.
Image-Preserving Optical Delay
Edward F. Kelley of the NIST Center for Elec-tronics and Electrical Engineering generated a pio-neering photographic "time machine" which,when used with a high-speed camera, permits pho-tographing events which occurred before the cam-era's shutter is opened.
The system, called an image-preserving opticaldelay, differs from conventional photographywhich records an event only when the shutter isopen.
This new device, an arrangement of optical com-ponents including mirrors and a crystal shutter, al-lows researchers to take detailed, high-speedphotographs of random-that is, non triggered-events.
It is now used for processes which last from 100nanoseconds, or billionths of a second, to 10 mi-croseconds, or millionths of a second, to study ma-terials utilized by the electric power industry.
This system stores optical images of a randomevent long enough so the shutter of a high-speedcamera can be opened and photographs taken ofthe processes leading to the random event. Kelleyhas filed a patent application on the system.
Functionally, the optical delay is equivalent toforcing the image to travel an additional 120 metersbefore it gets to the camera. Using a series of con-cave and planar mirrors, this path length is foldedinto about 4 meters.
The system is rugged enough to be used in avariety of settings. Situated on a table-top, thedevice contains optical components which requirealignment. However, normal vibration, air cur-rents, and airborne dust have minimal effect on thesystem's operation. Also, the system does not re-quire a clean room, an optical bench, or any otherspecial features.
U.S.-JAPAN TEST STANDARDSNIST, in cooperation with Japanese organizationsand the American Society for Testing and Materi-als (ASTM), is developing standard test methodsfor measuring the tensile and fracture toughnessproperties of steels at liquid helium temperature(4 K). Special considerations apply to mechanicaltests near absolute zero because of severe adiabaticheating during plastic deformation. The U.S. De-partment of Energy and the Japanese Atomic En-ergy Research Institute are supporting this work todevelop design standards for fusion energy applica-tions. The tensile and fracture standards are now intheir sixth drafts and have been submitted toASTM for formal approval.
640

Volume 93, Number 6, November-December 1988
Journal of Research of the National Institute of Standards and Technology
SILICON PHOTODETECTOR SELF-CALIBRA-TION ACCURACY VERIFIED IN INTERNA-TIONAL COMPARISONSilicon self-calibration, an accurate and convenientapproach to photodetector spectral responsivitycalibration founded on the fundamentals of solidstate physics, has been successfully implemented atNIST and six other national laboratories as theirabsolute radiometric base. This technique was de-veloped in 1980 by the Radiometric Physics Divi-sion.
The first intercomparison of spectral responsiv-ity scales (or equivalently, monochromatic radiantpower scales) that has occurred since a number ofnational laboratories adopted the new techniquehas been published recently in the report of the11th session of the CIPM Consultative Committeefor Photometry and Radiometry (CCPR). Thecomparison, which was run by NIST for theCCPR, included 11 national laboratories. Six usedthe silicon self-calibration method, four used elec-trical substitution radiometers, and one used bothapproaches to realize their scales of absolute spec-tral responsivity. The results showed that eight ofthe laboratories agree to within ±0.15 percent inmeasuring the responsivity of two different siliconphotodiodes at the 633 nm HeNe laser wavelength.This level of agreement is a factor of four betterthan the ±0.6 percent achieved by six of the eightnational laboratories in an earlier (1967) compari-son.
WIGGLER FOR THE NIST FREE-ELECTRONLASERThe Radiation Source and Instrumentation Divi-sion recently signed a contract for installation of awiggler. The wiggler is under construction andscheduled to be installed at NIST in October 1989.It is one of the key parts of the free-electron laser(FEL) facility being constructed as a joint projectwith the Naval Research Laboratory. The wiggleris a precise array of magnets with alternating fieldsthat cause an electron beam to follow a sine trajec-tory and to emit intense, coherent radiation. Thiswiggler will be 3.64 m long and will have 130 mag-netic periods. The electron beam will be providedby the racetrack microtron (RTM), which is near-ing completion.
The NIST FEL facility will be the most versatilein the country, providing a very large range ofwavelengths (200 nin to 10 pim) over which it willbe continuously tunable. The FEL output will con-sist of a continuous train of 3-ps wide pulses at74.375 MHz with an average power of 10 to 100
W. The facility will be operated for research inphysics, chemistry, biophysics, and biomedicine.
Standard Reference Material
STANDARD REFERENCE MATERIAL (SRM)1879-RESPIRABLE CRISTOBALITEThe various crystalline phases of silicon dioxidecause different physiological effects in the respira-tory system and it is necessary to identify the crys-talline phases in the industrial atmosphere to assessand monitor health risks. Standards 6f pure crys-talline phases are needed to determine their pres-ence by x-ray diffraction techniques.
The Office of Standard Reference Materials an-nounces the availability of a respirable cristobalitepowder certified for use as a quantitative x-raypowder diffraction standard. The powder is 98 per-cent crystalline cristobalite with no other de-tectable crystalline phases. The mass medianequivalent spherical diameter of the powder is 3.3microns, with 80 percent of the mass of the parti-cles in the range of 2 to 5 microns.
This SRM and SRM 1878, Respirable AlphaQuartz, provide two respirable powders of differ-ent crystalline phases of silicon oxide. The programfor the certification of these SRMs was begun incooperation with the National Institute of Occupa-tional Safety and Health.
Certification of this SRM was performed in theCeramics Division of the Institute for MaterialsScience and Engineering.
641
Volume 93, Number 6, November-December 1988
Journal of Research of the National Institute of Standards and Technology
Kinetic Studies Using a Highly SensitiveMicrophone Detector
Volume 93 Number 6 November-December 1988
Walter Braun, Philippe Dagaut, A very sensitive microphone detector is G(t). A Fourier analysis of X(t) and the
and Barry C. Cadoff used to study fast kinetic rate processes two relevant functions, f(t) and G(t), atin the gas phase resulting in the genera- a single frequency, allows direct deter-
National Institute of Standards tion of heat. The rate of heat evolution mination of the rate constant for the ki-
and Technology in turn produces a short duration pres- netic process under study. The methodGaithersburg, MD 20899 sure pulse which drives the microphone. is demonstrated by applying it to the
Gaithersburg, MDlLJ 20899 The frequency response of the micro- study of vibrational energy relaxation of
phone is somewhat slower than required pentafluorobenzene in argon buffer gasto record these pulses as they actually and gives results in agreement withappear at the detector. The theory of other experimental methods.the method used for the data reductionis presented. It is based upon the Key words: C0 2 laser; energy transfer;Green's Function method which ex-**
Green's Function method which ex- gas phase; kinetics; measurement; opto-presses the time dependent microphone acoustic; waveform analysis.signal, X, (t), as the convolution of thepressure pulse function, f(t), by the mi-crophone's impulse response function, Accepted: June 9, 1988
1. Introduction
Several direct methods have been used to studyenergy transfer (relaxation) processes from vibra-tionally excited molecules in the gas phase. Thesemethods can be distinguished by the way the vibra-tionally excited molecules are produced and howthey are detected. Production methods include i),electronic excitation via pulsed excimer lasers, fol-lowed by rapid internal conversion into vibrationalenergy or ii), direct vibrational excitation using apulsed CO2 laser. Detection methods involve real-time measurement of the relaxation process throughthe use of a number of different energy detectionprobes: ultraviolet absorption, infrared absorption,infrared fluorescence, pressure wave detection (op-toacoustics or interferometry), and broadening ofHg 254 nm absorption. Most of these energy detec-tion methods are well suited to detecting relaxation
in pulsed CO2 laser experiments when the fluenceof the laser is greater than about 0.25 J/cm 2 . In ex-periments using excimer laser excitation the fluenceis usually considerably attenuated in order to mini-mize photolysis by multi-photon absorption pro-cesses, resulting in a poorer signal-to-noise ratio.
Of all the detection methods employed, optoa-coustic techniques (using microphones or piezo-electric crystals) are probably the most sensitive.However, microphones used in such experimentsgenerally have a limited frequency responsethereby confining measurements to systems exhibit-ing relatively slow energy relaxation [1]. The lowpressure limit for performing such experiments isusually about 1 torr. Below this pressure the onsetof dispersion (energy loss) due to diffusion andthermal conductivity results in a decreased signal.
643
Volume 93, Number 6, November-December 1988
Journal of Research of the National Institute of Standards and Technology
The limitation of being able to measure only slowrelaxation processes has recently been circum-vented by Beck, Ringwelski, and Gordon (BRG)[2]. These workers employ a small surface areapiezoelectric crystal detector with a high-fre-quency response. Their method involves the directmonitoring of individual pressure pulses arriving atthe detector as a result of the pulsed CO2 laser exci-tation of a gas. The pressure pulse is characterizedby both a condensation (compression) and a rar-efaction portion and their relative magnitudes isdetermined by the rate of energy relaxation, thesize of the irradiated zone, the radiation distribu-tion within this zone, and the speed of sound in thegas medium. The important advantage of faster re-sponse time has, however, incurred the disadvan-tage of lower detection sensitivity.
In this paper we explore the application of a verysensitive microphone detector to the measurementof relaxation rates that are somewhat faster thanthe angular frequency response of the detector.The measurements basically involve the samplingof amplitude information as well as some limitedwaveform information [3]. As in the BRG [2] ex-periments, individual pressure pulses are moni-tored. These pulses are not viewed as they actuallyappear at the detector but rather as the detectorresponds to them. The detector generally developsa damped ringing sine wave at a single angular fre-quency, co0, termed the characteristic or natural fre-quency. If wo is much lower than the frequency ofthe pressure pulse then the pulse shape cannot beeffectively extracted; however, amplitude andsome waveform information remain so that it is stillpossible to measure accurate rate constants for vi-brational relaxation processes faster than cot.
Thus, the measurable range of rate constantswith the present method is about the same as withthe BRG [2] method. This range is limited by theapproximate condition co/(1Oro)Uk'P<3cO/rO,where k' is the bimolecular rate constant for en-ergy relaxation (torr s)- , P is the bath gas pressure(torr), co is the speed of sound in the bath gasmedium (cm/s), and ro (cm) is the radius of thecylindrical zone irradiated by the excitation laserbeam. The upper limit for measurable k'P values isapproximately the reciprocal of the time it takes fora pressure pulse to traverse the diameter of the irra-diated zone; the lower limit comes about becauselate contributions to the developing pressure wave(due to slow relaxation) ultimately interfere withearlier contributions and the resultant pressurepulse is strongly attenuated (de-phased).
2. Theory of the Method2.1 Background
We initially follow the procedure of Rothberg etal. [4] who described the use of microphones toperform photoacoustic calorimetry. Kinetic rateconstants were not obtained by these workers, butan analysis was made on how very rapid or veryslow kinetic processes (compared to coo) affect themicrophone's sensitivity. In addition, their workdealt with pulsed laser excitation of liquid phasesystems while here we concentrate entirely on thegas phase.
For convenience, in the following discussion thesymbol t is to be viewed as a retarded time. It is ameasure of time that begins (t =0) when the pres-sure pulse, originating from the laser irradiationzone, arrives at the detector.
We first deal with a simple model of the detectorwhich is taken to be that of a damped harmonicoscillator [5] and follows the differential equation,
u (d2X/dt2) + v(dX/dt) + wX =f(t), (1)
where X is the displacement of the mechanical di-aphragm from its equilibrium position, u is the di-aphragm mass, v is a damping constant, and w is aspring constant. The functional form of a drivingpressure pulse acting on the detector face as a func-tion of time t, will here and in the rest of the text begiven by the designation, f(t). We now employ theGreen's function method [6] to obtain the detec-tor's response to the driving pressure pulse. Wetake this to be equal to X(t) which is given by
X(t)= f G(t,r)f (7-) dr =G*f,where
(2)
(3)
is the suitable Green's function for the initial valueproblem given by the differential eq (1) (assumingthat X = 0 and dX/dt =0 at t =0) and representsthe impulse response function. Equation (3) de-scribes an underdamped sine wave where A is anarbitrary amplitude constant and /8 is the dampingconstant. The detector response, given by eq (2) isthus the convolution of the pressure wave pulseincident on the detector, given by f(r), by the im-pulse response, G(t,r) and the convolution is desig-nated by (G*J). It is understood from the limits ofintegration in eq (2) that G(t,T) is given by eq (3)for r<t but is zero for r>t. Thus, if bothf and Gare known, the signal given by the detector is
644
G (t,,r) =A sin(c,)O(t -,r)) exp(-,B(t -,r))

Volume 93, Number 6, November-December 1988
Journal of Research of the National Institute of Standards and Technology
completely specified by eq (2). The problem, infact, can be completely solved experimentally: if aknown pressure signal f(t) is presented to the de-tector and its response X(t) is measured, the func-tion G can be determined through a deconvolutionprocess. This is in principle possible through fastFourier transform methods (FFT). Taking theFourier transform of eq (2) gives, by the "Convolu-tion Theorem,"
F[X(t)]=F[G(t)] F[f(t)], (4)
that is, the Fourier transform of the convolution isthe product of the individual Fourier transforms. Itremains to divide F[X(t)] by F[f(t)] and then, tak-ing the inverse transform to recover G(t). OnceG(t) is known, we can, in principle, recover f(t)for any unknown pressure signal. However, weshould point out that the duration of pressure wavef(t) (see below) is frequently less than half of theperiod of the detector's impulse response so thatsuch a deconvolution would not be expected tocleanly recover the shape of f(t). This fact, cou-pled with inherent noise in the data and the use ofan imperfect representation for G(t) can frequentlyproduce unsatisfactory results. For this reason wereduce our data in a somewhat different way whichwe develop in the succeeding sections.
2.2 Development of Present Method
It would be helpful if we could separate thequantitiesf and G out from within the integral in eq(2). This can be achieved by taking either a single-frequency [7] Laplace or Fourier transform of eq(2). Subsequently, we will consider the latter trans-form as a special case of the former. Taking theLaplace transform of the convolution function asthe product of the individual Laplace transforms ofG(t) and f(t),
L [X(t)] =L [G(t)] * L [f(t)] , (5)
results in
{ X(t)exp(- at)dt =
{ G(t)exp(-at)dt f f(t)exp(- at)dt. (6)o o
Here a is an arbitrary real and positive constant.Using the function G, given by eq (3), the integralcontaining G in eq (6) is given by
{ G (t)exp(- at)dt = cto/[(a + )2 +0)02] . (7)
We have thus achieved the desired separation ofthe two functions G andf in eq (2). For the special(but frequently encountered) case where the func-tional form of G(t) remains unchanged over arange of experimental conditions, eq (6) becomes,
{ X(t)exp(- at)dt =
constant * f(t)exp(- at)dt .o,
It then remains to reduce the actual data accordingto the first integral in eq (8) and calculate the sec-ond integral from known representations of f(t).These representations will, as mentioned above, bea function of the irradiation geometry and the re-laxation rate constant.
The time-varying pressure, at an observationpoint somewhat distant from the cylindrical axis ofa laser irradiated zone, as obtained from the solu-tion of the linearized acoustic wave equation, hasbeen given by Bailey et al. [8], with some general-ization by BRG [2]. We present the results of thesetwo papers here in a notation similar to that ofBRG [2],
f~t)=o k J(12+k2) -1 {-k exp[-k(t+8)]
+Isin[l(t + 8)] + kcos[l(tt+ 8)]}
Jo(l rp) h (Ildl (-
At this point we will be dealing with dimensionlessquantities; the advantage of doing so will becomeclearer as we proceed. Also, for the sake of claritya bar will be placed over all dimensionless quanti-ties. In eq (9), dimensionless time is defined ast= tco/r0; dimensionless probe position is defined asrp= rp/ro; dimensionless pseudo-first-order rate con-stant k is given by k=kro/co. The dimensionalquantities consist of ro and c0, defined earlier; rp, theprobe position which is the distance of the micro-phone from the axis of laser beam, always >ro; k,the pseudo-first-ordered rate constant for energyrelaxation (s- ). This form allows us to arrive atany set of solutions regardless of the irradiation ge-ometry and sound speed. The delay between thelaser pulse and the arrival of the pressure wave atthe detector is given by, 8 = (rp- ro)/ro. In eq (9),h h(0)=J ()/l characterizes a uniformly irradiated"tophat" geometry [9], J0 and J1 the zero and first
645
(8)
(9)

Volume 93, Number 6, November-December 1988
Journal of Research of the National Institute of Standards and Technology
order Bessel functions, respectively, and Qo is aconstant. Two examples of calculated pressurewaves obtained under rapid relaxation and slow re-laxation conditions are shown in figure 1.
.GZ,C54S
I;cc
significance to the functional form given by eq (1 1),except that it best fits the results of the numericalintegration of eq (10). Replacing the 0.75 exponentby unity results in a poorer fit. The significance ofa should be addressed at this point. It could first ofall be viewed as a mathematical convenience al-lowing separation of the two terms,f and G, withinthe integral in eq (2). Alternatively the factorexp(-at) in eq (10) could be' viewed as a "timewindow" used to crudely sample the shape of thepulse (waveform) in the chosen time domain. It isultimately expected to distinguish between differ-ent waveforms with an accuracy sufficient to re-turn meaningful kinetic results. As we discussbelow it may or may not be adequate for the prob-lem at hand.
1 .2
1 .0
0.8
Figure 1. Two representative waveforms (in dimensionlessunits) of the pressure wave calculated from eq (9)-one forrapid relaxation, k=13, and one for slower relaxation, k-0.65.These two curves show approximately the full time span of thewaveforms encountered under fast and relatively slow relax-ation conditions. Curves are scaled by the factors indicated. Theduration of one cycle of the microphone's damped impulse re-sponse function, G(t) is shown for reference as 27r/6io.
0.6
0.4
0.2
0.00 5 10 15
2.3 Calculation of Calibration Curves
It remains to determine the integral on the right-hand side of eq (8) as a function of a variable relax-ation rate constant. This integral, expressed interms of dimensionless time, t; dimensionless rateconstant, k, and dimensionless alpha, defined asa= aro/c0, is given by,
L VQxk)]= f fct, k)exp(- &at)dt (10)0
Several curves were evaluated by numericallysolving eq (10) using the expression forf(t) givenby eq (9), as a function of k, for several values of a.There is some small error involved in the numeri-cal integration. Within this minor limitation we fitthese curves (normalized to unity for the fastest re-laxation rate constant) to the following empiricalexpression,
L [f(tk)] cc 1-exp(-a k 0 7 5). (I 1)
For reference, these curves are presented in figure2. It should be noted that there may be no physical
Figure 2. Several fits of L [(t)] eqeq (11) for different values of a.
(10) to the functional form of
- - - , a=0.8122, d=0.85, 6=0.4060, a=l.00
- ----, d=0.0812, a=0.65.. , . =0.0406, a=0.50
The results of figure 2 show that, while a variesby about a factor of 20, the calibration factor, a,varies by only a factor of two. In order to applythis methodology it is important to note that what-ever the value of a used to process the actual data,the same value for & must be used to calculate theappropriate calibration curve.
2.4 Analysis of Experimental Waveforms
We ultimately perform experiments in which apseudo-first-order relaxation rate constant is variedlinearly through a change of the bath gas pressure.The experimental signal curve is processed accord-ing to the left-hand side of eq (8),
L [X(,k)] = { X(tk)exp(- a t)d-t..
646
1Z

Volume 93, Number 6, November-December 1988
Journal of Research of the National Institute of Standards and Technology
These results must also fit the functional form (nor-malized to unity) of eq (11),
L [X(t,k)] cc 1-exp(-AP 0 7 ) (12)
The experimental parameter, A, is thus derivedfrom the experimental data. If the functional formof G(t) remains constant, eqs (11) and (12) can sim-ply be related according to eq (8) resulting in
1 - exp(-a(k'P)075)= 1 - exp(-AP0'5), (13)
stood here that we are transforming only at a singlefrequency, that in evaluating F(X), F(G) or F(f)the integration over time extends from zero to in-finity, and that the transformed result is in the com-plex plane.
When a=ico eq (4) becomes
F*(X) =F*(G)F .F*(/). (17)
The product of eqs (4) and (17) returns a resultwhich is a real number
where k'= k/P is the dimensionless rate constantper unit pressure (bimolecular rate constant). If thefunctional form of G(t) varies, eq (13) is still appli-cable, as discussed in section 4. However, the left-hand side of eq (12) must be replaced byL (X)/L (G). That is, the variation of L (G) must betaken into proper account. From eq (13), we arriveat
k (Ala)1/0.75 (4(14)
Equation (14) thus involves the experimentalparameter, A, and the appropriate calibration fac-tor, a. The dimensional rate constant per unit pres-sure, k', is related to the dimensionless rateconstant per unit pressure, k', according to
k'= k' (co/ro) .
F(X) * F*(X)=F(G) .F*(G) F(f) * F*(f). (18)
Equation (18) is entirely rigorous whether G(t) re-mains constant or not. However, if G(t) is constantthen the Fourier transform of X(t) multiplied by itscomplex conjugate is simply proportional to theFourier transform of the functionf(t) multiplied byits complex conjugate.
We now develop a set of calibration curves bycalculating F(f) * F*(f) which are the Fourier ana-logues of the Laplace calibrations depicted in fig-ure 2. These are presented in figure 3 for reference.
1 .0
0.8
(15)L..1
We have evaluated f(t) assuming that the micro-phone is a point detector. It actually occupies afinite width, do, in the radial direction of the propa-gating pressure wave. Thus the function, f(t),should be convolved using the suitable rectangularslit function (function of do= do/ca). However, wehere make the ad hoc assumption that the convolv-ing effect of do on f(t) is quite analogous to theeffect onf(t) produced by a simple increase in thediameter of the laser beam, 2ro, which should be agood approximation if do0 2r0 . Equation (15) is thenmodified to its final form,
k' =k' cO(rO+do/2)- =k' c/ro(effl), (16)
0.6
0.4
0.2
0.00
Figure 3. Numerical calculaticconditions Co= 1.256 and---, 0.5c
- - .*- , 2.0i.. . ., 4.0o
_ l.0)
5 10 15
ons F(f1) . F*(f), eq (18), for the
as fit to eq (19) with a=0.46.
where an effective ro is calculated as indicated.
2.5 Fourier Transform Method
An entirely analogous treatment can be appliedto the case of a Fourier transform viewed as a spe-cial case of aLplace transform. Then for a=-icr,where i = - -1, c being an arbitrary positive fre-quency, we refer back to eq (4), where it is under-
While a number of curves for variable a can be fitto the functional form of eq (11) for the Laplacetransform case, here for the case of the Fouriertransform multiplied by its complex conjugate,only a range of c6 values can be accurately fit bythe following simple functional form,
(19)
647
F(f) -F*(f)= 1 -exp(-C7 k).

Volume 93, Number 6, November-December 1988
Journal of Research of the National Institute of Standards and Technology
In all other respects the treatment given above ap-plies to the present case, with the one exceptionthat wherever the exponent 0.75 appears in anequation it is to be replaced by unity. Also, eq (19)should be used only for values of 6c around 1.0; forother values of co, the other curves shown in figure3 should be cast in suitable functional forms andcounterpart experimental results analyzed in thesame way.
2.6 Method Summary
The procedure outlined above involves takingsuitable transforms, i) of the pressure wave as afunction of the pseudo-first-order relaxation rateconstant, ii) of G(t), if its functional form variesover the range of experimental conditions and fi-nally, iii) of the experimental data as a function ofthe bath gas pressure. The processed results, whenexpressed in terms of the appropriate analyticalfunctional form, allow simple extraction of the en-ergy relaxation rate constant. Each operation in-volves taking a single-value transform. Thisaccurately samples the amplitude and also samplesthe waveform in sufficient detail to produce accu-rate kinetic results.
The alternative procedure using FFT methods,as mentioned earlier, is subject to failure under the
GaHancSysl
C02TEA Laser
Mirror 77
Variable Iris
T Microphonede Length= 8.2mm
w= Width= 5.5mmt= Thickness= 2.0mm
do= Aperture 2.5mm
present conditions (at least with respect to recover-ing a precise waveform) and further requires thetedious task of making additional waveform com-parisons in order to finally extract a relaxation rateconstant.
3. Experimental Procedure
The essential features of the experiment are pre-sented schematically in figure 4. A CO2 TEA laserdelivering about 0.5 J/cm 2 per pulse of about 200ns duration is directed into the spherical absorptionchamber through a variable iris as a quasi-parallelbeam. The diameter of the laser beam is adjustablefrom about 2 to 10 mm. A Knowles microphoneBT-1759 was used in the present work [10]. Theapproximate dimensions, orientation and positionof the microphone are given in figure 4. The deviceconsists of a rectangular thin-metal diaphragmplaced in close proximity to an electret disk behindwhich is positioned a ceramic printed circuit (PC)board containing an internal amplifier. This assem-bly is potted within a thin metal casing, the face ofwhich contains several rows of holes which allowthe diaphragm to respond to pressure changes inthe environment. An equivalent electrical circuitdescribing the microphone consists of a battery
I L IJ Micropr
ro = Radius of Laser Beamrp = Microphone Distance from Axis
Figure 4. Schematic diagram of apparatus showing microphone position and approximate dimen-sions. The symbols D and R designate the direct (primary) and reflected pressure waves, respec-tively.
648
Volume 93, Number 6, November-December 1988
Journal of Research of the National Institute of Standards and Technology
connected in series with a variable capacitance (thediaphragm) which is connected to the PC amplifierassembly. The assembly is biased with an external1.35 V battery. The output of the microphone am-plifier is connected with a short cable to an addi-tional pre-amplifier which is used to reduce theoutput impedance of the microphone from about3.5 kfl to 50 Q. The signal from this pre-amplifier isthen fed to a Tektronix Model AM502 high-gaindifferential amplifier, the frequency response ofwhich is set for a low-frequency 3-db cut-off of 10KHz and a high-frequency 3-db cut-off of 1 MHz.
The output of this high gain amplifier is thenconnected to a Biomation Model 8100 fast digitizerwhich transmits the signal through an interface tothe microcomputer assembly. The fast digitizer istriggered by a trigger pulse generated at the begin-ning of each CO2 laser pulse. The microphone sig-nal to the fast digitizer is further retarded by apre-set time delay equal to or less than the timerequired for the pressure wave to travel from thelaser-irradiated zone to the microphone detector.Multiple laser shots could thus be accumulated (av-eraged), viewed in real time, and finally stored ondisks for further data reduction.
A typical set of experiments consists of i) prepar-ing a dilute mixture (less than about one part perthousand) of an infrared absorbing gas in a non-ab-sorbing diluent gas, in the 5-liter vessel containingthe microphone assembly; ii) subjecting the mix-ture, at some total pressure, P, to one or more CO2laser pulses, simultaneously recording the micro-phone signal response and then storing the resul-tant waveform; iii) reducing the pressure of themixture in stages, each followed by laser excitationand data aquisition, in order to follow the kineticsof the relaxation process. The resultant waveformsare finally processed according to the method pre-sented in the previous section. Further details aregiven in section 4.
The gas handling system could be evacuated topressures less than 1 X 10⁶ torr. The infrared ab-sorbing gas used in the present work was pentaflu-orobenzene (PFB) and the diluent gas was argon.Pressures were measured with a calibrated capaci-tance manometer. Gas mixtures were introduced atpressures down to about 0.5 torr and could be mea-sured to better than 0.01 torr with the pressuremeasuring head.
4. Results4.1 Microphone Response Function, G(t)
Before analyzing a typical energy relaxation ex-periment, we first describe several tests performedon the microphone assembly to determine its oper-ating characteristics. These characteristics basi-cally determine the functional form of G(t).Whatever the functional form of G(t), it is impor-tant that it either remain constant under the vary-ing conditions of a set experiments, or if it varies,that its transform be independently obtained.
We first attempt to deduce an approximate func-tional form of G(t) for the specific microphone de-tector employed in these experiments and we thendetermine if G(t) varies under changing experi-mental conditions.
A computer algorithm was prepared to numeri-cally perform the convolution given by eq (2).When we convolved G(t), given by eq (3), with avariety of simple pressure pulses, f(t), we obtainedwaveforms exhibiting the same characteristic fea-ture: the first maximum was always significantlylarger than the absolute value of the first minimum.The reverse effect was always observed for the ex-perimental waveforms. Replacing eq (3) by
G(t,r)=A sin[600 (t -r)] {I -exp[-y(t -a-)]}exp[-j3(t -r)] (20)
resulted in a much better fit as can be seen in figure5. No attempt has been made to adjust the con-stants, 18 and y to produce an optimum fit. In fact,it may not be possible to achieve a perfect fit to thedata since the driving wave, f(t), used in the simu-lation consisted of a single cycle sine wave with anangular frequency, 2a&o, twice that of the detector.This idealized waveform forf(t) is only an approx-imation to the actual pressure waveform as shownin figure 1 (fast relaxation case). The actual detec-tor impulse response function may also contain mi-nor contributions at frequencies other than wo
which are not considered here. Approximate val-ues obtained for the parameters in eq (20) are listedin the caption of figure 5.
The following two speculative interpretations ofthe functional form of eq (20) are given: 1) the cir-cuit contains an RC of about 60 gts (value of X incaption of fig. 5), or 2) an initially excited micro-phone vibrational mode transfers energy to a sec-ond mode for which the microphone exhibits agreater response. Both explanations can accountfor the slowly developing signal as represented bythe {1-exp[-y(t-T)]} term in eq (20).
649

Volume 93, Number 6, November-December 1988
Journal of Research of the National Institute of Standards and Technology
We now consider how the microphone parame-ters change with variation of bath gas pressure andalso laser intensity.
.2'
U,
au2.9To
Time in ;s
Figure 5. Solid (appearing) line is experimental microphone sig-nal, 780 digitized data point, for a 4.7/1000 mixture of PFB inargon at a total pressure of 20 torr, time base extends from 0 to390 ps. Dashed curve is a numerical calculation of XQ) using eq (2)for the function G(t)=A sin(wot)- [1 -exp(-yt)] - exp(-13t),where A is arbitrary, wo=0.097 (ps)-', -y=0.017 (ixs)', 6=0.014 (,us)-', and the functionf(t) is taken as one cycle of a sinewave with an angular frequency of 2cwo and arbitrary amplitude.
4.2 Microphone Response to Laser Intensity
At a fixed total pressure, for a particular mix-ture, the laser light intensity was varied by a factorof about 100. This was effected by placing partiallyabsorbing CaF2 windows in front of the laser beamincident on the spherical chamber containingthe absorbing gas and microphone. Each windowwas expected (from previous calibrations) toattenuate the laser beam by 65 percent. Figure 6displays results of the microphone signal, measuredat the first maximum, as a function of a numberof windows placed in the path of the laser.
Z
-0
-oa
.
C
0)
20
10
00 2 4 6
Number of windows
Figure 6. Relative intensity (of the first positive peak of themicrophone signal) as a function of the number of attenuatingBaF2 windows.
The functional form which best fits the observedrelative intensity is given by
(21)
where Io is the incident laser intensity and I is theintensity after attenuation by n windows. The addi-tion of a single window reduces the intensity by afactor of 0.663. Since the experiments are all at aconstant pressure we expect that the microphoneimpulse function is strictly constant, and the pres-sure wave impinging on the microphone also has aconstant waveform. Because of the latter two con-ditions it is necessary that the microphone producea signal with a constant shape (waveform), regard-less of magnitude. This allows us to use any part ofthe resultant waveform (for example, the first max-imum) as a suitable measure of the laser intensityimpinging on the gas mixture. In fact, a careful re-view of the resultant waveforms showed that thescaled waveforms could always be precisely super-posed for a two orders of magnitude change in thelaser intensity. The good fit of the data to the func-tional form of eq (21) provides equivalent informa-tion. Figure 6 further verifies that the detector islinear over the range of excitation. Our experiencehas shown that pressure waves too intense cancause non-linearities in either the microphone orthe amplifier or both.
4.3 Fast Relaxation: Effect of Pressure onMicrophone
Experiments were performed by adding addi-tional argon to a starting mixture of about 1/1000PFB in argon. The starting pressure was chosenhigh enough (20 torr) so that energy relaxation wasvery fast as determined from previous measure-ments [11]. From a pressure of 20 torr and higher,the pressure waveform, f(t), is unchanged. Assum-ing that the microphone impulse function, G(t), isalso constant, the signal waveform must also re-main unchanged. We measure the amplitude of themicrophone signal at several convenient points (thefirst maximum, for example) and plot these in fig-ure 7 as a function of the gas pressure. Clearly, theamplitudes are not constant showing that the func-tional form of G(t) does indeed vary with pressure.We suggest that this comes about because thedamping constant, 18 [eq (20)] changes with pres-sure. On this basis the functional dependence ofG(t) with pressure is obtained and given in thecaption of figure 7.
650
1=1, (0.663)',

Volume 93, Number 6, November-December 1988
Journal of Research of the National Institute of Standards and Technology
Q.
EaE-._1
10.0
8.0
6.0
4.0
2.0 e
0.0 . , . , , , . , , e0 100 200 300 400 500
Pressure in Torr
Figure 7. Pressure effect on microphone response(arbitrary units) of microphone signal sampledpoints (to) vs total gas pressure. First pressure cotorr mixture of 5/1000 PFB in argon. Additionaltained through consecutive additions of purecircles (sampled at to=26.51 gs) fit to thc1=10 exp[-(1.18 X 10- 4 P-0.78X 10⁻⁷P2 ). t], s((sampled at to= 38.34 Ms) fit to theI=I0 exp[-(1.22X 10- 4P - 1.07X 10⁻⁷P2) * t], witWs, the pressure, P, in torr, I0 the amplitude exP=0, and I the amplitude at pressure P.
It is interesting to see from figure 7 tlnal decay is not a linear function of pressare, in fact, at least two decay rates, on(ably faster than the other, suggesting almicrophone characteristic frequencies.tively describe the fast decay to energyfrom a higher frequency mode of the nand the slow decay from a lower frequeWe cannot at this time quantitatively asure changes in 'y [eq (20)] and for preserassume it to be a constant.
The analysis of our experiments woukfied if G(t) were constant with pressure.is not the case, the data of figures 5 andto arrive at G(t) as a function of pressu:the use of eq (20) and the followinparameters
coo=0.097 (gts)`, y=0.017 (gs)'
,j=(0.01 + 1.2X 10⁻⁴ P - L.OX 10-7
p2
)(M
where the unit of time in eq (20a) is ;pressure P is in torr.
4.4 Analysis of Simulated Data
the convolution given by eq (2). The algorithmalso numerically calculates Laplace and Fouriertransforms of X(t), G(t) and f(t) performed at asingle frequency, a or co. Equations (6) and (18)were shown to be valid for a wide variety of arbi-trary pressure waveforms as well as values for theparameters a and co. That is, the transform of the"signal" was found to be equal to the product ofthe transform of the "pressure pulse" and the trans-form of G(t) as expected.
Using the above computer algorithm we were in600 700 a position to evaluate the effect of "noise" on the
results of data transformed at a single frequency.
Amplitude Thus, we performed simulations in which randomat two time as well as systematic "noise" was added to the "sig-nsists of a 20 nal data" to determine the effect on its transform.pressures ob- From these limited simulations we found (qualita-argon. Open tively) that introduction of systematic noise in theMeexpression
xlid circles form of baseline shifts (which we have observedexpression experimentally to be caused by stray electrostatic
h time, t, in signals from the laser) as well as random noise gavetrapolated to results in poor agreement for the Laplace trans-
form and in good agreement for the Fourier trans-form as compared with the respective noise-free
iat the sig- results.sure. There
consider-t least two 4.5 Analysis of Relaxation DataWe tenta- In agreement with the above simulations wedissipation found that the experimental data transformed usingticrophone the Laplace method were considerably more scat-ney mode. tered than data using the Fourier analogue. Typicalassess pres- Fourier data transforms as a function of bath gasit purposes pressure are given in figure 8. By contrast, because
of the poor quality of the Laplace results, we didnbe simpli not analyse the data by that method. However, we
Since this should point out that base line shifts in our data7 allow us which we have shown to yield poor results by there through Laplace method can in principle be subtracted out..g derived This was not attempted here; however, doing so in
the future may permit more effective use of theLaplace method.
We now describe the analysis of the data of fig-
.s)', (20a) ure 8 in order to obtain the rate constant for vibra-tional relaxation of PFB in argon. As expected, we
Its and the found that the Fourier transform returns the largestnumerical value when the transform is performedat coo and the results of figure 8 were so obtained.However, performing the transform at otherfrequencies is also possible.
Before analyzing laboratory data we describesimulated experiments in which the computer al-gorithm, described above, numerically calculates
651

Volume 93, Number 6, November-December 1988
Journal of Research of the National Institute of Standards and Technology
0 20 40 60Pressure in Torr
curve is presented in figure 9 where the data are fitto the functional form of eq (12) (replacing the 0.75power by unity, for this case). The best fit yieldsfor the parameter, A, the value, 0.25. According toeq (14) (again replacing 0.75 by unity) and using fora the value 0.46 results in k'=0.54. From eq (16),using ro=0.40 cm and co==3.078X10⁻² cm/,ts, wederive k =0.042 (J.s * torr)-'. This value is in goodagreement with k'=0.0428-± 0.0092 (pts * torr)-'and k'=0.053+0.014 (lts * torr)-' obtained from aprevious study employing two different methods
80 100 [13].
Figure 8. Data, X(t) transformed according to eq (18) and pre-sented as the solid points. The similar transform of G(t) is calcu-lated from eq (20) using the parameters listed in eq (20a). Theresults are displayed using the solid line.
1.0
0.8
For these experiments the laser beam dimensionro was set at 0.42 cm. The value for c0, the soundvelocity in argon, is 3.216X 104 cm/s, and the fre-quency used for the transform, co, is 0.097 (GLs)'.These values result in co= 1.256, chosen to corre-spond to the simple exponential calibration curvein figure 3 (C7=0.46). The experimental data, X(t)were transformed according to eq (18) and are pre-sented as points in figure 8. Data up to about 20torr mainly show the effect of vibrational relax-ation while data at higher pressures show predomi-nantly variation of the microphone's impulseresponse function, G(t), with pressure. While pres-sure data as presented in figure 7, on cursory exam-ination, suggest a moderate change of the functionG(t), it is seen that the operation F(G) -F*(G)produces a much larger variation. However, eq(18) is entirely rigorous and is capable of handlingvariations in G(t) and F(G) * F*(G) as long as theycan be quantitatively described.
There are two ways to characterize the variationof G(t) with pressure. The simplest procedure is tocurve fit the transformed high pressure data in fig-ure 8 and then assume that a short extrapolation tothe low pressure regime gives the proper transformof G(t). Instead, we calculated F(G) * F*(G) fromeqs (20) and (20a), resulting in the solid line offigure 8 [12]. This calculated curve fits the experi-mental points reasonably well at high pressures(where it should fit the data), and serves as a meansfor calculating F(G) * F*(G) for the low pressurepoints with an accuracy quite adequate for ourpurposes.
Finally, according to eq (18), dividingF(X) * F*(X) obtained at each pressure by the cal-culated F(G) * F*(G) at that pressure yieldsF(f) * F*(f), the quantity of interest. The resultant
0.6
0.4
0.2
0.0 5 10 15 20 25
Pressure in Torr30 35
Figure 9. Each transformed data point at a given pressure (fromfig. 8) divided by the transform of G(t) at the correspondingpressure (taken from the solid curve of fig. 8) yields, accordingto eq (18), the quantity of interest, F(f) * F*(fJ), and is presentedas a solid point in this figure. These values, as a function ofpressure, are best fit to the eq F(f) * F*(f)= 1-exp(- 0.25 * P),shown as the solid line.
4.6 Amplitude Method
For comparison, the amplitude of the first maxi-mum of the microphone signal was plotted as afunction of pressure in figure 10 and the functionalform [1 -exp(-0.4P` 7 5 )] was found to be a good fitto the data. The scatter in this data is somewhatgreater than in the transformed data presented infigure 8. It is interesting that the amplitude plot offigure 10 is so similar to the plot of figure 9. Thereis nothing in the treatment presented above thatwould suggest that the amplitude method shouldgive results roughly equivalent to those obtainedfrom the transform method.
The experimental observation that amplitudedata can be used in an alternative method to deriverate constants suggests that changes in the pressurepulse waveform have perhaps less influence on theoverall microphone response than changes in themagnitude of the pressure pulse, at least for the
652
1400
* 1200
' 1000
-a 800ax 600
L 400x
UL 200
0
.~

Volume 93, Number 6, November-December 1988
Journal of Research of the National Institute of Standards and Technology
present experimental conditions. In fact, we do ob-serve that the microphone signal waveforms do notchange markedly, particularly around the firstmaximum [14]. However, if the amplitude methodis used, then the calibration constant, & in eq (14),must be derived through separate means, i.e., & can-not be obtained absolutely. That need not necessar-ily be a limitation if calibrations can be developedfrom mixtures possessing known relaxation rateconstants or if the method described in the previ-ous section provides the absolute standard. Theamplitude method is simple and could be quite use-ful and worthy of further investigation.
1.0
0.8
aC
0)
0.6
0.4
0.2
0.00 5 1 0 1 5 20 25 30 35
Pressure in Torr
Figure 10. Amplitude data: Plot of the first positive peak of themicrophone signal as a function of pressure (low pressure do-main). Solid line is a fit of the data to the functional form,Signal= 1 -exp(-A * P0"5 ), where A =0.40.
5. Concluding Remarks
The method requires few assumptions; these canbe directly examined or verified through the use ofindependent methods. The assumptions include: i),the function G(t) exists and ii), the signal can berepresented by the simple convolution of G(t) byf(t) when terms involving the signal and its deriva-tive at t =0 are equal to zero; iii), the variation ofG(t) (or its transform) with pressure can be prop-erly dealt with; and finally, iv), the representationof f(t) suitably describes the relaxation-inducedpressure pulse. Assumptions i-ii have been evalu-ated experimentally and found to be valid; assump-tion iii can result in an additional source ofuncertainty in the kinetic analysis if the variation ofG(t) through the use of an extrapolation procedureor the use of an analytic expression is inaccurate.Other detectors may show less variation of G(t)with pressure and we plan to examine a number ofthese. Assumption iv can be assessed indepen-
dently. For example, the functional form off(t) hasbeen investigated in detail by Beck and Gordon[15] and found to be an excellent representation ofthe experimentally derived pressure pulse. In thederivation of f(t) the additional assumption wasmade that first order relaxation kinetics apply. Theadequacy of this assumption has been indepen-dently demonstrated for certain systems [16]. It canalways be checked by simply performing kineticmeasurements as a function of varying energy flu-ence and demonstrating the constancy of thederived "rate constant."
In the present work we employed the Fouriertransform method using a single frequency coinci-dent with the characteristic frequency of the detec-tor. Analysis at other frequencies are of coursepossible and the quality of the results obtained as afunction of frequency should be addressed in moredetail in future work. Additionally we plan to usethe Laplace transform method in experiments thatare more noise-free.
The kinetic application presented here involvesthe measurement of the rate of energy transfer.There are other kinetic measurements which useoptoacoustic detection and involve chemical reac-tions. Such reactions usually generate heat and therate of heat liberation is a measure of the rate ofreaction. Recently a number of such studies havebeen described in the literature [4,17,18]. So farthey have dealt entirely with the characterizationof the extent of reaction through a procedure in-volving amplitude analysis which has been aptlytermed photoacoustic calorimetry. The methodpresented here should be of value to this importantnew area of research since it could provide themeans of performing a temporal analysis fromwhich reaction rate constants could be derived. Amicrophone exhibiting very high sensitivity such asthe one used here would be required. We anticipateinitiating experiments of this kind.
About the authors: All the authors are in the NISTNational Measurement Laboratory. Walter Braun iswith the Chemical Kinetics Division, Philippe Dagautis a guest worker in the Chemical Kinetics Division,and Barry C. Cadoff is with the Gas and ParticulateScience Division.
6. References
[1] Smith, N. J. G., Davis, C. C., and Smith, I. W. M., J.Chem. Phys. 80, 6122 (1984).
[2] Beck, K. M., Ringwelski, A., and Gordon, R. J., Chem.Phys. Lett. 121; 529 (1985).
653

Volume 93, Number 6, November-December 1988
Journal of Research of the National Institute of Standards and Technology
[3] In order to simplify the discussion in the present paper we(somewhat unconventionally) refer to waveform or waveshape as being synonymous and distinct from intensity, orits equivalents, magnitude or amplitude. The latter term orterms, viewed as a scaling factor, convert each infinitesimalsegment of a given waveform into an equivalent waveformsegment of proportionally greater or lesser magnitude.
[4] Rothberg, L. J., Simon, J. D., Bernstein, M., and Peters, K.S., J. Amer. Chem. Soc. 105, 3464 (1983).
[5] Kreuzer, L. B., J. Appl. Phys. 42, 2934 (1971).[6] Greenberg, M. D., Application of Green's Functions in
Science and Engineering, Prentice-Hall, Inc., EnglewoodCliffs, NJ (1971).
[7] The transform of a function, F(t) is defined as
L[F(t)] exp(-st) * F(t) * dt =f(s) . We define a single-
frequency transform as,
L[F(t)]so= exp(-sot) * F(t) * dt =f(so), that is the value
returned by the specified operation using a fixed value of s,namely so. For the sake of clarity we identify the use of asingle-frequency transform using the former notation andby specifying the positive, real number, so, by the symbol a.The symbol X will subsequently be reserved for the case ofthe Fourier transform obtained at the fixed frequency, co.
[8] Bailey, R. T., Cruickshank, F. R., Guthrie, R., Pugh, D.,and Weir, I. J. M., Mol. Phys. 48, 81 (1983).
[9] Two independent studies have shown that "tophat" ratherthan Gaussian geometry best describes IR laser irradiation;Beck, K. M., and Gordon, R. J., J. Chem. Phys. 87, 5681(1987); and Braun, W., Wallington, T. J., andCvetanovic, R. J., J. Photochem. Photobiol.,A: Chemistry 42, 207 (1988).
[10] Certain commercial equipment and instruments are identi-fied in this article in order to adequately specify the exper-iments described here. Such identification does not implyrecognition or endorsement by the National Institute ofStandards and Technology, nor does it imply that the ma-terial or equipment identified are necessarily the best avail-able for the purpose.
[11] Wallington, T. J., Scheer, M. D., and Braun, W., Chem.Phys. Lett. 138, 538 (1987).
[12] It should be mentioned that while pressure changes cancause a variation in the microphone impulse response func-tion, G(t), it can also cause a variation in the energy/pres-sure derived from the laser beam. Since the latter entirelyproduces an amplitude effect it is properly accounted forby means of the procedure(s) described here.
[13] Wallington, T. J., Braun, W., Beck, K. M., and Gordon, R.J., J. Phys. Chem. 92, 3839 (1988).
[14] A similar observation was made by Barker, J. R., Brouwer,L., Patrick, R., Rossi, J. J., Trevor, P. L., and Golden, D.M., Int. J. Chem. Kinet. 17, 991 (1985).
[15] See reference cited in reference [91.[16] Braun, W., and Wallington, T. J., Chem. Phys. Lett. 140,
441 (1987).[17] See reference [14].[18] Anderson, V. E., Cheng, H. Z., Diebold, G. J., Mahmood,
A., and Sweigart, D. A., J. Amer. Chem. Soc. 109, 6191(1987).
654

Volume 93, Number 6, November-December 1988
Journal of Research of the National Institute of Standards and Technology
Solvent-Free Injection in SupercriticalFluid Chromatography Using Sintered
Glass Deposition
Volume 93 Number 6 November-December 1988
Thomas J. Bruno Sample injection in supercritical fluid sented which allow solvent-free injec-chromatography (SFC) is usually per- tion. Using these devices, sample (in aformed using a combination of apparatus solvent) is deposited on a sintered glass
National Institute of Standards from liquid chromatography and capil- bed. After removal of the solvent byand Technology lary gas chromatography. The device mild heating and evacuation, the sampleBoulder, CO 80303 most often consists of an injection valve loop is filled with the supercritical car-
(of the type used in liquid chromatogra- rier and the valve is switched to the in-phy) followed by a flow splitter con- ject position.trolled by a restrictor. It is sometimesdesirable to inject samples in the ab- Key words: chromatography; injection;sence of a solvent, as in physicochemi- supercritical fluid chromatography;cal applications of SFC. In this article, supercritical fluids.two simple modifications to a conven-tional sampling valve system are pre- Accepted: July 27, 1988
Sample introduction in analytical applications ofsupercritical fluid chromatography (SFC) is usu-ally performed using a high-pressure multiportsampling valve (of the type used for high-perfor-mance liquid chromatography-HPLC) equippedwith a flow splitter. The splitter is most often offixed split ratio (for a given pressure and tempera-ture): the ratio is determined and controlled by afused silica capillary restrictor. The sample, whichis usually a solid or liquid dissolved in an appropri-ate solvent, is syringe loaded into the sample loopof the multiport valve, and injection is achieved byswitching the position of the valve. The solventwill be separated from the sample species by thephysical and chemical interactions with the station-ary phase in the column.
In some nonanalytical applications of supercriti-cal fluid chromatography it is often desirable toinject a sample (which may be of low volatility) inthe absence of solvent. Such applications are typi-cally in physicochemical measurement studies. As
an example, we may consider the chromatographicdetermination of binary diffusion coefficients usingthe Taylor-Aris method [1-5]. In this technique, asample is injected onto the head of an open tubularcolumn as a sharply defined spike. As the carriermoves the sample through the length of the tube,the initial sharply defined spike will broaden into aGaussian-like profile. For this experiment, thecolumn is uncoated and ideally should be inert, andthe presence of a solvent would ruin the measure-ment.
In order to allow convenient injection of rela-tively nonvolatile solutes for this type of measure-ment, we have used two approaches to provide asolvent-free injection. In the first approach, astandard multiport injection valve has been modi-fied to accept the deposition of sample on a smallsection of sintered glass placed within the sampleloop. In the second approach, an extractor basedon sintered glass deposition precedes the samplingvalve. Sintered glass was chosen as the deposition
655
Volume 93, Number 6, November-December 1988
Journal of Research of the National Institute of Standards and Technology
material for several reasons. First, since glass has arelatively high energy surface, one would expect aconveniently-sized aliquot of sample to be easilyloaded. In addition, there is no danger of the sin-tered glass bed being displaced from its position inthe loop or extractor. An initial series of devicespacked with small beds of chromatographic sup-ports (such as Tenax-GC') was unsatisfactory forthis reason.
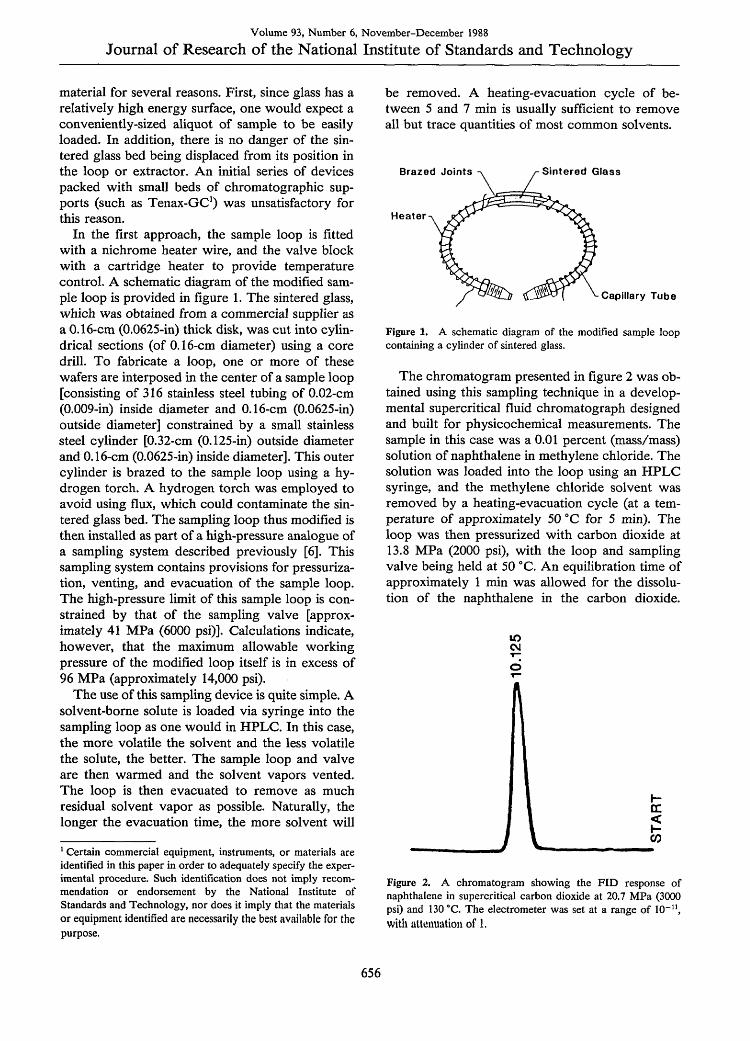
In the first approach, the sample loop is fittedwith a nichrome heater wire, and the valve blockwith a cartridge heater to provide temperaturecontrol. A schematic diagram of the modified sam-ple loop is provided in figure 1. The sintered glass,which was obtained from a commercial supplier asa 0.16-cm (0.0625-in) thick disk, was cut into cylin-drical sections (of 0.16-cm diameter) using a coredrill. To fabricate a loop, one or more of thesewafers are interposed in the center of a sample loop[consisting of 316 stainless steel tubing of 0.02-cm(0.009-in) inside diameter and 0.16-cm (0.0625-in)outside diameter] constrained by a small stainlesssteel cylinder [0.32-cm (0.125-in) outside diameterand 0.16-cm (0.0625-in) inside diameter]. This outercylinder is brazed to the sample loop using a hy-drogen torch. A hydrogen torch was employed toavoid using flux, which could contaminate the sin-tered glass bed. The sampling loop thus modified isthen installed as part of a high-pressure analogue ofa sampling system described previously [6]. Thissampling system contains provisions for pressuriza-tion, venting, and evacuation of the sample loop.The high-pressure limit of this sample loop is con-strained by that of the sampling valve [approx-imately 41 MPa (6000 psi)]. Calculations indicate,however, that the maximum allowable workingpressure of the modified loop itself is in excess of96 MPa (approximately 14,000 psi).
The use of this sampling device is quite simple. Asolvent-borne solute is loaded via syringe into thesampling loop as one would in HPLC. In this case,the more volatile the solvent and the less volatilethe solute, the better. The sample loop and valveare then warmed and the solvent vapors vented.The loop is then evacuated to remove as muchresidual solvent vapor as possible. Naturally, thelonger the evacuation time, the more solvent will
' Certain commercial equipment, instruments, or materials areidentified in this paper in order to adequately specify the exper-imental procedure. Such identification does not imply recom-mendation or endorsement by the National Institute ofStandards and Technology, nor does it imply that the materialsor equipment identified are necessarily the best available for thepurpose.
be removed. A heating-evacuation cycle of be-tween 5 and 7 min is usually sufficient to removeall but trace quantities of most common solvents.
Sintered Glass
Capillary Tube
Figure 1. A schematic diagram of the modified sample loopcontaining a cylinder of sintered glass.
The chromatogram presented in figure 2 was ob-tained using this sampling technique in a develop-mental supercritical fluid chromatograph designedand built for physicochemical measurements. Thesample in this case was a 0.01 percent (mass/mass)solution of naphthalene in methylene chloride. Thesolution was loaded into the loop using an HPLCsyringe, and the methylene chloride solvent wasremoved by a heating-evacuation cycle (at a tem-perature of approximately 50 'C for 5 min). Theloop was then pressurized with carbon dioxide at13.8 MPa (2000 psi), with the loop and samplingvalve being held at 50 CC. An equilibration time ofapproximately 1 min was allowed for the dissolu-tion of the naphthalene in the carbon dioxide.
to
ma)~~~~~~'
04
Figure 2. A chromatogram showing the FID response ofnaphthalene in supercritical carbon dioxide at 20.7 MPa (3000psi) and 130 'C. The electrometer was set at a range of 10-1",with attenuationi of 1.
656

Volume 93, Number 6, November-December 1988
Journal of Research of the National Institute of Standards and Technology
Switching of the sampling valve then resulted inthe injection into the carrier stream at a pressure of20.7 MPa (3000 psi) and 130 0C (the conditions ofthe chromatographic experiment). The pressuriza-tion step described above is done at a pressurelower than the column initial pressure so as tocounteract somewhat the deleterious effect of therelatively large volume of the modified loop. In thecase of figure 2, the column was a 3050-cm un-coated stainless steel tube [0.23-cm (0.009-in) insidediameter], and detection was done using a modifiedflame ionization detector [7]. The symmetry of thepeak is indicative of negligible adsorptive interfer-ence by the sintered glass bed.
There are a number of advantages associatedwith this method of injection. The first is, ofcourse, the removal of the solvent when solvent-free injection is required. In addition, there is agreatly reduced need to use a flow splitter sincemost of the applied sample is solvent, which is re-moved during the heating-evacuation step. Toreduce the amount of solute injected, one simplydilutes the solution applied to the sintered glass.The solute is then actually injected in a solution ofthe supercritical carrier. The major disadvantageexperienced with the technique is the relatively
4
1/16" NPT-\
1 2.7 mm
long time involved in completing an injection(approximately 8 min). Improvements along theselines are currently being pursued. Since anotherdisadvantage is the relatively large loop volume,attempts are being made to minimize the size of thesintered glass bed. The problems caused by largeloop volume (such as peak broadening and pressurepulsation) appear to be relatively minor, however,as judged from comparative HETP (height equiva-lent to a theoretical plate) determinations.
A second approach we have had success withmakes use of a small extractor placed ahead of thesampling valve. This approach is similar to thattaken by others in physicochemical measurements[8,9]. The extractor is shown schematically infigure 3. The manifold arrangement used with thisextractor is shown in figure 4. The extractor itselfwas machined from a section of 316 stainless steelbar, 12.7 cm in diameter and 4 cm in length. A hole(0.32-cm diameter) bored through the center of thebar accommodates a section of cut sintered glass, asin the sample loop approach described earlier. Theextractor is sealed at either end using threaded orbrazed fittings. A syringe loading tube is brazedonto the side of the extractor body, and is cappedusing a compression fitting plug.
iintered GlassTo Injectionand Sample
K- 411hLoop
Joints
SoyaringeLoading Tube
Figure 3. A schematic diagram of the extractor (which precedes the sampling valve). The manifoldfor this extractor is shown in figure 4.
657
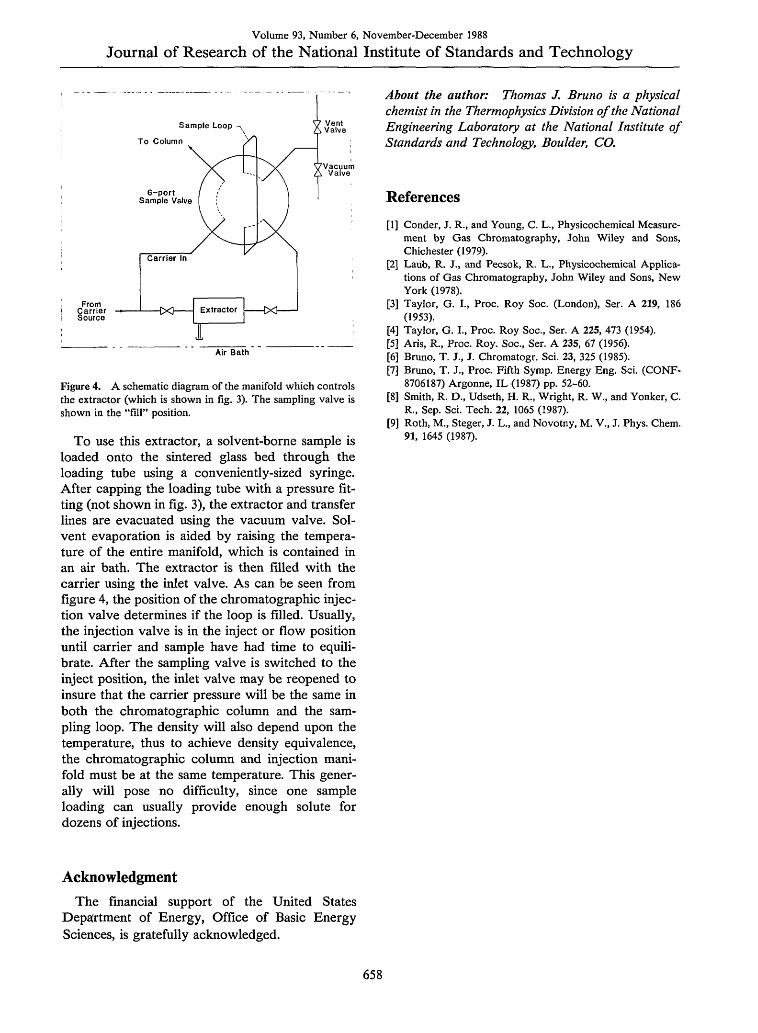
Volume 93, Number 6, November-December 1988
Journal of Research of the National Institute of Standards and Technology
7 Vent, Valve
?Vacuumi Valve
FromI Carrier Extractor
Source
A BI a
Air Bath
Figure 4. A schematic diagram of the manifold which controlsthe extractor (which is shown in fig. 3). The sampling valve isshown in the "fill" position.
To use this extractor, a solvent-borne sample isloaded onto the sintered glass bed through theloading tube using a conveniently-sized syringe.After capping the loading tube with a pressure fit-ting (not shown in fig. 3), the extractor and transferlines are evacuated using the vacuum valve. Sol-vent evaporation is aided by raising the tempera-ture of the entire manifold, which is contained inan air bath. The extractor is then filled with thecarrier using the inlet valve. As can be seen fromfigure 4, the position of the chromatographic injec-tion valve determines if the loop is filled. Usually,the injection valve is in the inject or flow positionuntil carrier and sample have had time to equili-brate. After the sampling valve is switched to theinject position, the inlet valve may be reopened toinsure that the carrier pressure will be the same inboth the chromatographic column and the sam-pling loop. The density will also depend upon thetemperature, thus to achieve density equivalence,the chromatographic column and injection mani-fold must be at the same temperature. This gener-ally will pose no difficulty, since one sampleloading can usually provide enough solute fordozens of injections.
About the author: Thomas J. Bruno is a physicalchemist in the Thermophysics Division of the NationalEngineering Laboratory at the National Institute ofStandards and Technology, Boulder, CO.
References
[1] Conder, J. R., and Young, C. L., Physicochemical Measure-ment by Gas Chromatography, John Wiley and Sons,Chichester (1979).
[2] Laub, R. J., and Pecsok, R. L., Physicochemical Applica-tions of Gas Chromatography, John Wiley and Sons, NewYork (1978).
[3] Taylor, G. I., Proc. Roy Soc. (London), Ser. A 219, 186(1953).
[4] Taylor, G. I., Proc. Roy Soc., Ser. A 225, 473 (1954).[5] Aris, R., Proc. Roy. Soc., Ser. A 235, 67 (1956).[6] Bruno, T. J., J. Chromatogr. Sci. 23, 325 (1985).[7] Bruno, T. J., Proc. Fifth Symp. Energy Eng. Sci. (CONF-
8706187) Argonne, IL (1987) pp. 52-60.[8] Smith, R. D., Udseth, H. R., Wright, R. W., and Yonker, C.
R., Sep. Sci. Tech. 22, 1065 (1987).[9] Roth, M., Steger, J. L., and Novotny, M. V., J. Phys. Chem.
91, 1645 (1987).
Acknowledgment
The financial support of the United StatesDepartment of Energy, Office of Basic EnergySciences, is gratefully acknowledged.
658
Volume 93, Number 6, November-December 1988
Journal of Research of the National Institute of Standards and Technology
Paper from the Accuracy in Trace Analysis Symposium Proceedings not included in J. Res. Natl. Bur. Stand., Vol. 93, No. 3 (1988)
Enzyme-Enhanced ElectrochemicalImmunoassay for Phenytoin
Mirtha Umafia, Jess Waller, MansukhWani, Carol Whisnant, and Edgar Cook
Research Triangle InstitutePost Office Box 12194
Research Triangle Park, NC 27709-2194
drug to be effective and safe, plasma levels must bebetween 5 and 20 mg/L [11]. Thus, the develop-ment of easy, real-time assays for this and othercritical-level drugs is highly desirable.
This paper also describes preliminary results onthe electron-transfer mediation of ferrocene deriva-tives to polypyrrole-immobilized GOx. The goal ofthese experiments is to couple the polypyrrole-im-mobilized GOx to the ferrocene-DPH system toproduce a reagentless electrochemical im-munoassay sensor, so that easy, real-time determi-nations may be realized.
Introduction
The use of electrochemically generated electron-transfer mediators to control the oxidation states ofenzymes has been the subject of considerable re-search [1,2]. Among these studies, the oxidation ofglucose by glucose oxidase (GOx) has been exten-sively studied. Ferrocene derivatives [3] and otherredox compounds [4,5] have been used to mediatethe oxidation of dissolved and immobilized GOx[6]. Polypyrrole has been used to immobilize GOxon the surface of electrodes [7,8,9]. This polymerprovides a simple and effective immobilizationmedium, and because it is an electronic conductor,it is expected to facilitate the electron transfer tothe enzyme.
An important application of enzyme-mediatedelectrocatalysis is in immunoassays where the cur-rent amplification of the enzyme reaction enhancesthe sensitivity of the measurement. The immuno-logical utility of the ferrocene/GOx system hasbeen demonstrated with lidocaine as the antigen[10]. The general scheme is illustrated in figure 1;ferrocene-antigen (Fer-Ag) is competitively dis-placed from the antibody (Ab) by Ag, the analyte,and it is determined as an enzyme-amplified oxida-tion current. This scheme has significance becauseit expands the applicability of electrocatalytic anal-ysis to analytes currently determined by im-munoassays, and thus, deserves further research todemonstrate its generality.
This paper describes experiments aimed at un-derstanding the kinetics and mechanism of the re-action, at determining the optimum conditions forthe assay, and at testing the generality of thescheme shown in figure 1. We have chosen pheny-toin [5,5-diphenylhydantoin (DPH)] as the modelantigen, because of its clinical importance. For this
Experimental
Electroanalysis was conducted with a PAR 175/173 potentiostat, in a three-electrode assembly(GC, Ag/AgCI, Pt). A two-compartment cell wasused for immunological experiments. Preparationand use of GOx-polypyrrole modified electrodes(GOx/PP/GC) have been described elsewhere[7,8]. The polyclonal anti-DPH serum was pre-pared at RTI [12].
Ferrocene-phenytoin (Fer-DPH) was synthe-sized inhouse. To a room-temperature stirredsolution of ferrocene carboxylic acid and 3-(2-aminoethyl)-5,5-diphenylhydantoin in anhydrousTHF, 1,3-dicyclohexylcarbodiimide was added inone portion. After 5 h, the solvent was removed invacuo. The residue was purified by elution fromsilica gel (5 g) using 20% acetone in hexane to yielda yellow solid with m.p. 248-251 'C. NMR, highresolution mass spectrometry, and elemental analy-sis confirmed the identity of the compound. Fer-DPH is insoluble in water but soluble in 10%CH 3CN. Typical cyclic voltammograms (CVs) ofDPH-Fer conjugate produced E"t =0.47 V vsAg/AgCl and 0.06 V peak separation.
Results and Discussion
The DPH antibody binding was compared tothat of Fer-DPH in a competitive inhibition RIAusing 3H-DPH (specific activity 40.3 Ci/mmol/L)as tracer. Anti-DPH antibodies (DPH affinity> 109 L/mol) showed 25% cross-reactivity (at 50%displacement of radioligand) with Fer-DPH. Thus,the Ab binding to Fer-DPH is sufficiently strong to
659

Volume 93, Number 6, November-December 1988
Journal of Research of the National Institute of Standards and Technology
Paper from the Accuracy in Trace Analysis Symposium Proceedings not included in J. Res. Natl. Bur. Stand., Vol. 93, No. 3 (1988)
form a stable Fer-DPH-Ab complex but DPH willreadily displace Fer-DPH as needed for thescheme shown in figure 1.
The CVs of Fer-DPH are completely quenchedby the formation of Fer-DPH-Ab upon addition of100 ZtL DPH antiserum. The inability of Fer-DPH-Ab to exchange electrons with the electrode maybe due to steric effects, since the antibody mayblock the redox center from the electrode.
Kinetic information on the electrocatalysis wasobtained with scan rate dependence studies. In theabsence of GOx, the current (id) is determined bydiffusion of the ferrocene derivative and is ex-pected to obey the Randles-Sevcik relationship fora reversible system:
id=2.69X 10⁵ nfl2A D1"2 C0 v 12 , (1)
where n is the number of electrons, A is the area ofthe electrode, D is the diffusion coefficient, C0 * isthe concentration of electroactive species in the so-lution, and v is the scan rate.
In the presence of GOx and excess glucose, thelimiting value of the current response (ik) is inde-pendent of v:
ik =n F A Co* (D k' Cz.*)l2 (2)
where F is the Faraday constant; C,,* is the enzymeconcentration, and k' is the rate constant for thecatalytic reaction. From scan rate dependencestudies [13], we estimated a pseudo first-order rateconstant for the catalytic reaction of GOx with fer-rocene carboxylic acid and Fer-DPH of approxi-mately 2X 10⁵ and 4X 10⁵ molL-', respectively.These values are comparable to the ones previ-ously reported for ferrocene derivatives [5]. In thepresence of 1.5 mmol/L GOx, the catalytic currentis about three times the Fer-DPH background cur-rent and increases with enzyme concentration butis independent of glucose (above 20 mmol/L).Thus, the overall current is governed by the rate ofreaction of the ferrocene with GOx rather than therate of reaction of GOx with glucose as needed forthe scheme of figure 1.
Experiments shown in figure 2 demonstrate thedevelopment of the DPH electrochemical im-munoassay. The CV of Fer-DPH is observed incurve a; upon addition of GOx and glucose, a largecatalytic current is observed in curve b; upon addi-
tion of DPH-antiserum the catalytic current is al-most completely inhibited in curve c; and afteraddition of DPH, due to the release of Fer-DPHfrom the antibody complex by the competitivebinding of DPH, the catalytic current is recoveredin curve d. The increase in current from curve c tocurve d, is proportional to the amount of DPHadded, and can be quantitated to produce a stan-dard curve of DPH (pharmacologically relevantrange) as shown in figure 3.
Currently, experiments aimed at producing areagentless electrochemical immunoassay using aGOx/PP/GC electrode are in progress. GOx/PP/GC electrodes were examined for their response toferrocene derivatives. The GOx/PP/GC elec-trodes were potentiostatted at 0.5 V, in an oxygen-free solution containing a measured amount offerrocene. After addition of an excess of oxygen-free glucose solution, the current increased as ex-pected from figure 1. The catalytic currentincreased linearly with ferrocene (l0' mol/L).Extrapolation to zero ferrocene shows a currentincrease (5 nA) due to the addition of glucose to asolution that contained no electron-transfer media-tor. An explanation for this current increase maybe that electrons are transferred directly from thepolypyrrole that surrounds the GOx to its activecenter. This hypothesis is currently under investi-gation by monitoring the disappearance of glucose.
Acknowledgment
We thank the Research Triangle Institute staff:E. Holt for the immunological studies and D.Rector for synthesis, and Dr. R. W. Murray ofUNC for helpful discussions. This work wasfunded by the Army Research Office under Con-tract Number 85-G-05201.
660

Volume 93, Number 6, November-December 1988
Journal of Research of the National Institute of Standards and Technology
Paper from the Accuracy in Trace Analysis Symposium Proceedings not included in J. Res. Natl. Bur. Stand., Vol. 93, No. 3 (1988)
Glucose Gluconolactone
GO, (ox) GOQ (red)
Fer Il-Ag -e Fer Ill-AgAg Abe Ab Ag Ab
Ag Fer-Ag Ab >< - -- Fer III-Ag Ag
a)0)
C)
a
0(3O
60
50
40
30
20
10
80 100 120 140 160 180 200
(DPHJ (jtM)
Figure 1. The catalytic cycle of GOx using ferrocene deriva-tives as electron-transfer mediators interrupted by the bindingof an antibody to a ferrocene-antigen conjugate.
Figure 3.DPH.
Calibration plot for electrochemical immunoassay of
0.1
Figure 2. Cyclic voltammograms of Fer-DPH conjugate inaqueous 0.5 mol/L KC1 at pH 7 with 10% CH 3CN. a) 200mmol/L Fer-DPH, b) after addition of 40 mmol/L glucose and0.8 rnmol/L GOx, c) after addition of anti-DPH serum, d) afteraddition of DPH.
References
[1] Schlapfer, P., Mindt, W., and Racine, Ph., Clin. Chem.Acta 57, 283 (1974).
[2] Alecsandrovskii, Y. A., Beshikina, L. V., and Rodionov,Y. V., Biokhimiya 46, 708 (1981).
[3] Cass, A. A. G., Davis, G., Graene, D. F., Hill, H. A. O.,Aston, W. J., Higgins, I. J., Plotkin, E. V., Scott, D. L.,and Turner, A. P. F., Anal. Chem. 56, 667 (1984).
[4] Crumliss, A. L., Hill, H. A. O., and Page, D. J., J. Elec-troanal. Chem. 206, 327 (1986).
[5] Albery, W. J., Bartlett, P. M., and Cransten, D. H., J. Elec-troanal. Chem. 194, 223 (1985).
[6] Lange, M. A., and Chambers, J. Q., Anal. Chim. Acta 175,89 (1985).
[7] Umafia, M., and Waller, J., Anal. Chem. 58, 2979 (1986).[81 Umafia, M., and Waller, J., Proc. of the U.S. Army
CRDEC Scientific Conference on Chemical Defense Re-search, Vol. 2, 18-21 November 1986, p. 879.
[9] Foulds, N. C., and Lowe, C. R., J. Chem. Soc. FaradayTrans., 1259 (1986).
[10] Glerian, K. D., Hill, H. A. O., McNeil, C. J., and Green,M. J., Anal. Chem. 58, 1203 (1986).
[11] Cook, C. E., Amerson, E., Poole, W. K., Lesser, P., andO'Tuama, L., Clin. Pharm. Therap. 18, 742 (1975).
[12] Cook, C. E., Kepler, J. A., and Christensen, H. D., Res.Comm. Chem. Pathol. Pharmacol. 5, 767 (1973).
[13] Nicholson, R. S., and Shain, I., Anal. Chem. 36, 707 (1964).
661

Volume 93, Number 6, November-December 1988
Journal of Research of the National Institute of Standards and Technology
Paper from the Accuracy in Trace Analysis Symposium Proceedings not included in J. Res. Natl. Bur. Stand., Vol. 93, No. 3 (1988)
Liposome-Based Flow InjectionImmunoassay System
Laurie Locascio-Brown, Anne L. Plant, andRichard A. Durst
Center for Analytical ChemistryNational Institute of Standards and Technology
Gaithersburg, MD 20899
The development of many biochemical assays isdependent upon the specific interaction of an anti-gen with its antibody. This interaction is usuallymonitored using secondary labels with the mostpopular immunoassays employing fluorescent orradioactive tracers for detection of a single bindingevent. We are developing a novel flow injectionanalysis (FIA) system which contains an im-munospecific reactor column and utilizes liposomesfor detection. The fluorophore-loaded liposomesused in this assay can be made to provide signalenhancement in the range of one thousand to onemillion times per binding event making fluorescentassays competitive in sensitivity with radioim-munoassays.
Liposomes are spherical structures composed ofphospholipid bilayers that form spontaneouslywhen phospholipid molecules are dispersed in wa-ter. The interior and exterior environments of lipo-somes are aqueous and, therefore, liposomes can beprepared with large numbers of water-solublemarker molecules trapped in their internal aqueousspace. Liposomes are prepared by the injectionmethod [1] from a mixture of dimyristoylphos-phatidylcholine: cholesterol: dicetyl phosphatewith a molar ratio of 5:4:1. Approximately 1 X 10³
carboxyfluorescein molecules are encapsulated in-side each liposome when the liposomes are formedin 3 mmol/L carboxyfluorescein solution. The lipo-somes may be "sensitized" to a particular antigenthrough covalent binding of that antigen to the po-lar head group of a phospholipid molecule which isincorporated into the lipid mixture at about 1 mol% prior to liposome formation. When the liposomeis formed in water, approximately half of the anti-gen will be exposed to the external solution, and,therefore, will be available to interact with anti-body binding sites. The combining of antigen on
these "sensitized" liposomes with antibody canthen be monitored through the fluorescence of theencapsulated marker molecule. In this assay, eachbinding event is amplified approximately 1000times. Liposomes containing 3 mmol/L car-boxyfluorescein are about 0.1 ,um in diameter, andhave a polydispersity of 0.1 which corresponds to asize distribution of 0.5% as determined by photoncorrelation spectroscopy with data analysis usingthe cumulants method [2]. The diffusion coefficientof these liposomes in water was determined to be5 X 10' cm2 /s, and the liposomes contained 1-5lamellae per liposome. These liposomes have beendetermined to be stable for greater than 3 monthsin TRIS buffer at room temperature.
The flow injection system contains a glass reac-tion column (2.0 mm i. d. X 99.5 mm; total volumeof 155 FtL) packed with nonporous glass beads250±40 ,tm in diameter (60-80 mesh) whichprovide the solid phase for the immuno-specific re-action. The antibody is covalently bound to thesolid support in a manner which ensures the properorientation of the antibody binding site such thatthere is very little loss in activity. The antibody isprepared for binding by initially cleaving the Fcportion of the antibody with pepsin leaving anF(ab')2 fragment attached in the hinge regionthrough a disulfide bond. Reducing this disulfidebond yields two Fab' fragments with equal affinityfor antigen binding and with a sulfhydryl group atthe base of the fragment available for attachment.Covalent immobilization of this Fab' fragment isachieved through silanization of the beads with anaminosilane reagent. An amide bond is formed be-tween the aminosilane and a difunctional succin-imidyl-maleimido linking agent. The Fab' fragmentis then easily attached to the maleimido groupthrough the sulfhydryl group at the base of the an-tibody fragment (fig. 1). Several preparations ofnonporous soda lime glass beads derivatized with amonofunctional silane have proven to be stable in apacked column for 7 d when subjected to a flowrate of 1 mL/min in slightly basic TRIS buffer.Quantitation of silanized sites is accomplishedthrough acetylation of the amino group using 1 4
C-
labeled acetic acid. Detection of the interaction be-tween sample antigen (analyte) molecules, and thecovalently immobilized antibodies is achieved bycompetition with liposomes that are "sensitized"with antigen.
663

Volume 93, Number 6, November-December 1988
Journal of Research of the National Institute of Standards and Technology
Paper from the Accuracy in Trace Analysis Symposium Proceedings not included in J. Res. Nati. Bur. Stand., Vol. 93, No. 3 (1988)
The flow properties of liposomes in flow injec-tion systems were investigated to determine opti-mal conditions for competitive immunochemicalbinding events in a heterogeneous sample. It wasfound that due to the large differences in diffusioncoefficients of liposomes and small solutionmolecules, some separation of the sample and lipo-some solution boluses occurred prior to the intro-duction of the mixture onto the column. Thisprecolumn separation reduces the sensitivity of theassay since the arrival of the liposome bolus pre-cedes the sample bolus, and many sites become sat-urated before any competition can take place.Precolumn mixing of the liposome suspension re-duces the separation of the boluses, and a simplesolution to the problem was found in simultaneousseparate injection of the liposome-antigens and freeantigens. The liposome-antigens were injected us-ing a knitted sample loop while sample solutionswere injected through a straight sample loop [3] asshown in figure 2. This manipulation was sufficientto cause significant precolumn bolus overlap, andallowed the full benefit of performing a competi-tive assay.
The stability of liposomes was studied when ex-posed to the materials and flow rates commonlyused in a flow injection apparatus. Liposomes werefound to be unstable when exposed to the under-ivatized glass bead column due to the loss of lipidfrom the liposome bilayer to hydrophobic sites onthe column. Conditioning of the system with lipidprior to the introduction of liposomes helped tostabilize the structures by saturating any exposedhydrophobic sites. The sites remained saturatedwith continuous use of the system for 2 weeks dueto the slow partitioning of the lipid into theaqueous phase. The liposomes were also tested un-der higher flow rates to determine the degree ofrupturing due to shear forces. No leakage of car-boxyfluorescein from the structures was observedwhen exposed to flow rates of 2 mL/min which istypical for use in FIA. The results obtained frominjections of liposome samples after conditioningwere very reproducible with consistency in disper-sion and peak symmetry.
The hydrodynamic characteristics of liposomeswere studied extensively to determine the feasibil-ity of using liposomes as analytical reagents inflowing systems. Liposomes are bulky structures ina typical flow injection system with a diameter that
corresponds to roughly 1/5000 of the tube diame-ter. The heterogeneity and the size of the liposomesin solution made it important to determine if thebehavior of these structures was consistent withthat predicted by the theory developed for a homo-geneous solution containing molecules of a similardiffusion coefficient. In theory, the dispersionsquared is linearly related to the length of straighttubing through which the sample flows. In a homo-geneous solution, the slope of this plot is a constantwhich is inversely proportional to the square rootof the diffusion coefficient. When heterogeneousmixtures are injected into a flowing stream, we canexpect some partitioning of the particulates out ofthe flow stream resulting in uncharacterized dis-persions. Plots of carboxyfluorescein-loaded lipo-somes and carboxyfluorescein solution behaviorgave straight lines with correlation coefficients of0.92 and 0.99, respectively. The ratio of the respec-tive slopes is approximately equal to the inverseratio of the square root of the diffusion coefficientssuggesting that liposome behavior closely followsthe behavior of a homogeneous solution. The be-havior of liposomes in other common componentsof a flow injection system, such as a knitted delaytube and a packed reactor column, showed thatliposome flow mimicked the theoretical behaviorof a homogeneous solution. Therefore, liposomesuspensions may be used in FIA as calibration solu-tions, and so are appropriate analytical reagents inmethods of continuous analysis.
664
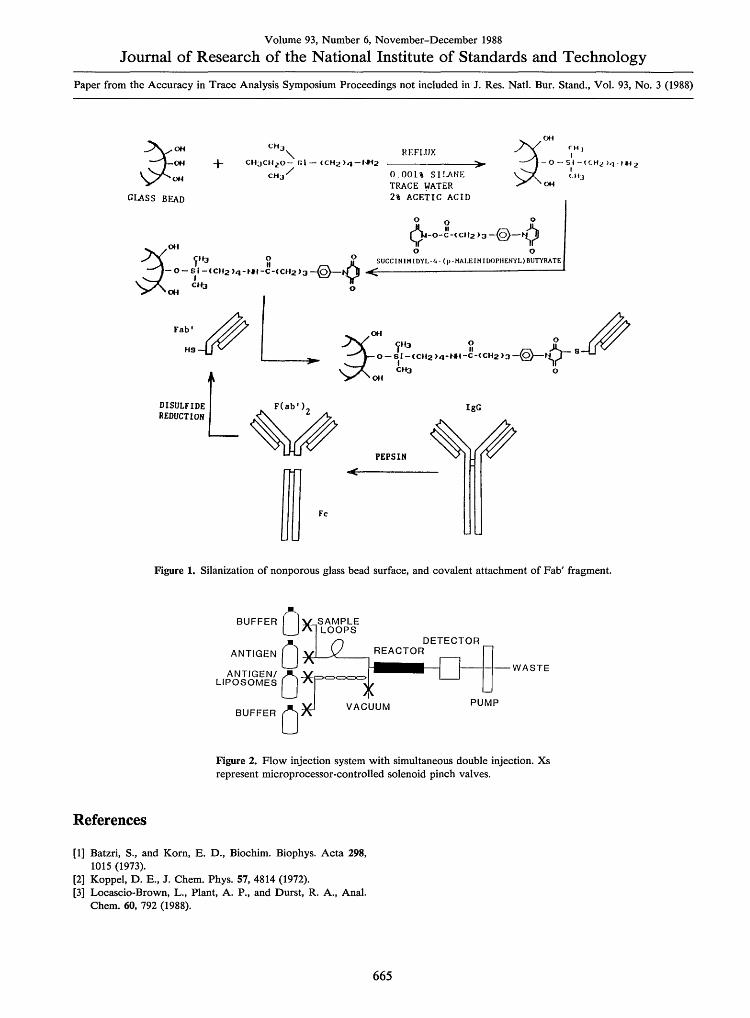
Volume 93, Number 6, November-December 1988
Journal of Research of the National Institute of Standards and Technology
Paper from the Accuracy in Trace Analysis Symposium Proceedings not included in J. Res. Natl. Bur. Stand., Vol. 93, No. 3 (1988)
-POOH + CHjCH2 O- S1-(CH 2 )q-eoH ~~~CHj/
CLASS BEAD
a-o- Si -(C112 ),-MC - _(0t2 )3 -4~C, t43 1o
Fab I
HSv
DISULFIDEREDUCTION
F(ab')
JJFc
K E FLUX
0.001% SI!ANETRACE WATER2% ACETIC ACID
0 QSUCCINIM IDYL-4 - (p- HA LEIN IDOPHENYL)BUTYRATE
) it <CH~ >4-ta 01cti3 0
IgG
PEPSIN
Figure 1. Silanization of nonporous glass bead surface, and covalent attachment of Fab' fragment.
BUFFER
DETECTORANTIGEN
ANTIGEN/ A-nLIPOSOMES |i
BUFFER f VACUUM PUMP
Figure 2. Flow injection system with simultaneous double injection. Xsrepresent microprocessor-controlled solenoid pinch valves.
References
[1] Batzri, S., and Korn, E. D., Biochim. Biophys. Acta 298,1015 (1973).
[2] Koppel, D. E., J. Chem. Phys. 57, 4814 (1972).[3] Locascio-Brown, L., Plant, A. P., and Durst, R. A., Anal.
Chem. 60, 792 (1988).
665
OHCH)I
_>_ 0- 51i -((H2 )q -t$42
C "JOH

Volume 93, Number 6, November-December 1988
Journal of Research of the National Institute of Standards and Technology
Conf erences/Even ts
WORKSHOP ONMICROSTR UCTUREANDMA CROMOLECULARRESEARCH WITHCOLD NEUTRONSNational Bureau ofStandards,Gaithersburg, MD,April 21-22, 1988
On April 21-22, 1988, over 160 scientists, including25 from industry, 70 from universities and 30 fromgovernment laboratories and agencies (not includ-ing NBS), gathered at NBS, Gaithersburg, for aWorkshop on Microstructure and MacromolecularResearch with Cold Neutrons. This workshop wasone of a series, each devoted to a major area ofresearch with cold neutrons, that are being held inconjunction with the development of the ColdNeutron Research Facility (CNRF) at the NBS20 MW research reactor as a national, user-oriented research facility. The dual aims of thisworkshop were to highlight research opportunitiesin the application of cold neutron techniques to thestudy of submicron structure in materials andmacromolecular systems, and to inform and in-volve the scientific community in the planning forinstrumentation for the CNRF.
The long wavelength neutrons that are producedby a cold moderator, such as the 40 K D2 0-icemoderator recently installed in the NBS reactor,
are a powerful probe of both the structure and dy-namics of materials. The emphasis of this workshopwas on the structural applications of cold neutrons.Thus techniques such as small angle neutron scat-tering (SANS), which probes structure in bulk ma-terials on the 1 to 100 nm scale, and the relativelynew technique of neutron reflectometry, whichprobes near surface structure to depths of tenths ofmicrons, were discussed in detail. For both of thesetechniques, cold neutrons substantially extend thedistance scale probed and improve the spatial reso-lution beyond what has been possible with thermalneutrons.
The first morning session of the workshop onScientific Opportunities with Cold Neutronsopened with a review by T. Russell (IBM AlmadenResearch Center) of the impact SANS has had onPolymer Science in general, and on the under-standing of the interactions and correlations inpolymer mixtures in particular. Russell also dis-cussed recent developments, important to the de-velopment of polymer composites, in the use ofgrazing incidence neutron and x-ray scattering forthe evaluation of conformation changes and con-centration gradients in polymer mixtures near sur-faces and at interfaces. The use of scatteringmethods to characterize such seemingly dissimilarmaterials as porous rock and agglomerated colloidswas the subject of the talk by S. K. Sinha (ExxonResearch and Engineering Co.). Sinha presented ageneral formalism which unified the concepts ofsurface and mass fractals and showed how the self-similar nature of fractal structures is most directlyrevealed through scattering measurements. Severalexamples were presented which underscored theneed for scattering instruments which probe a widerange of length scales in order to accurately deter-mine the nature and limits of fractal behavior.
The second half of this session was devoted toapplications of neutron reflectometry, reviewed by
667
Volume 93, Number 6, November-December 1988
Journal of Research of the National Institute of Standards and Technology
R. K. Thomas (Oxford University), and grazingincidence diffraction, covered by H. Zabel(University of Illinois). Thomas discussed the com-plementarity of neutron and x-ray reflection tech-niques for studying inhomogeneities normal to asurface or interface. He gave several examples ofreflection measurements on surfactants and poly-mers adsorbed at the surfaces of solutions whichdemonstrated the use of contrast variation to en-hance the scattering from the adsorbed layer,which is the particular advantage of the neutrontechnique. In his talk, H. Zabel outlined the basictheory of the novel technique of surface dynamicaldiffraction and reflection and presented the firstneutron results obtained for a Si(l 10) surface. Thistechnique, which exploits the interplay betweensimultaneous Bragg diffraction and surface reflec-tion to provide structural information both paralleland normal to a surface, is potentially a powerfulprobe of surface reconstruction, roughening transi-tions, and the nature of surface magnetic struc-tures.
The first afternoon session was devoted entirelyto reviewing the current status and future plans forthe NBS CNRF. NBS Deputy Director RayKammer opened the session by outlining the over-all scope of the CNRF as a national user facilityopen to all qualified researchers on the basis of sci-entific merit. He went on to describe the user pol-icy for the facility and the plan for instrumentdevelopment which allows for one-third of up to15 experimental stations to be developed by groupsoutside NBS, so-called Participating ResearchTeams, who would then receive three-fourths ofthe available beam time. Kammer's policyoverview was followed by a technical overview byJ. M. Rowe of NBS who described the architec-tural design of the experimental hall and officewing (scheduled for completion in early 1989) asso-ciated with the CNRF, and the network of totallyreflecting guide tubes that will transport neutronsfrom the reactor cold source to the CNRF. He alsopresented data on the performance of the D20-icecold source now in operation in the reactor andgave a timetable for projected instrument develop-ment.
The remaining four talks in this session each fo-cused on a specific cold neutron technique and pre-sented design concepts for its implementation inthe CNRF. Described were a novel SANS instru-ment that would utilize a doubly curved mirror tofocus a beam onto a detector, the current state ofdevelopment of neutron supermirrors and their useboth to enhance flux and to produce polarized neu-tron beams, a neutron reflectometer suitable for
measurements on both solid and liquid surfaces,and an improved facility for neutron depth profil-ing which would utilize a converging neutronguide to increase the sensitivity of this techniqueby more than one order of magnitude over what isnow possible using thermal neutrons.
The application of cold neutron methods to thestudy of submicron structure in specific classes ofmaterials was the theme of the second morning ses-sion of the workshop. J. Hayter (Oak RidgeNational Laboratory) opened the session with asurvey of submicron chemical systems such as col-loids and micellar solutions whose structure andinteractions can be probed effectively with coldneutrons, while G. Zaccai (Institut Laue-Langevin)gave a corresponding survey of applications to bio-logical systems such as protein solutions and DNA-complexes. Metallurgical applications, with anemphasis on time-resolved studies of phase separa-tion in binary alloys, were reviewed by B. Gaulin(Oak Ridge National Laboratory). Finally, R. Page(Southwest ResearchInstitute) gave a critical review of current and po-tential applications in the study of damage accumu-lation, phase transformations, and processing ofadvanced ceramics.
The final afternoon of the workshop consisted ofthree discussion sessions which provided partici-pants with the opportunity to comment upon orinquire further about any aspect of the CNRF. Thefirst session on Macromolecular Dynamics ex-plored the potential impact which cold neutron in-elastic scattering techniques could have in thestudy of molecular motions in macromolecular sys-tems. C. Han of the NBS Polymers Division alongwith Z. Akcasu and S. Krimm, both of the Univer-sity of Michigan, stimulated the discussion by giv-ing their views of the important scientific issueswhich could be addressed with advanced neutronscattering instrumentation. This discussion flowednaturally into the next session on Instrumentationand Techniques in which progress in several keyareas of cold neutron instrumentation were high-lighted. The final session on User Needs focused onthe practical needs of the potential user of theCNRF. This discussion was wide-ranging andtouched on security requirements for access to thefacility, proposal procedures, travel support, hous-ing availability, etc. Several participants stressedthe need for adequate sample preparation facilitiesparticularly for biological samples which oftenhave limited lifetimes and thus cannot be preparedfar in advance.
One clear impression that emerged from theworkshop is that there is a strong and growing in-
668

Volume 93, Number 6, November-December 1988
Journal of Research of the National Institute of Standards and Technology
terest in the scientific potential of the relativelynew techniques of neutron reflectometry and graz-ing incidence diffraction for the study of near sur-face and interface structure. As a result of thisexpressed interest, the development of a state-of-the-art neutron reflectometer for the CNRF will begiven increased priority. This instrument, alongwith a 30 m SANS machine, are expected to be thefirst instruments to go into operation when theCNRF guide hall is completed.
Copies of the workshop program containing theabstracts of the invited talks, and a 12-page bookletdescribing the CNRF may be obtained by contact-ing Carol O'Connor, National Institute of Stan-dards and Technology, Bldg. 235, Rm. A106,Gaithersburg, MD 20899, 301/975-6240.
C. J. Glinka, J. A. Gotaas, and C. O'ConnorInstitute for Materials Science and EngineeringNational Institute of Standards and TechnologyGaithersburg, MD 20899
669

Volume 93, Number 6, November-December 1988
Journal of Research of the National Institute of Standards and Technology
Conferences/Events
U.S.-JA PAN PANEL ONWIND AND SEISMICEFFECTSNational Bureau ofStandards,Gaithersburg, MD,May 17-20, 1988
The U.S.-Japan Panel on Wind and Seismic Effectsprovides for cooperative activities of 15 U.S. and 6Japanese Agencies to reduce damage from strongwinds and earthquakes. The Panel is part of theU.S.-Japan Natural Resources Development Pro-gram under the aegis of the U.S.-Japan Coopera-tive Science Program of 1961. The NationalBureau of Standards (NBS) provides the U.S.-sidechairman and secretariat; Dr. Richard N. Wright,Director of the Center for Building Technology(CBT) and Noel J. Raufaste of CBT, respectively.Annually, the Panel conducts a 1-week joint tech-nical meeting where recent research results are dis-cussed. A technical study tour follows the Panelmeetings.
This year (1988) the United States hosted the20th joint meeting and visits to U.S. laboratoriesand construction projects. The meeting was held atNBS during 17-20 May. Technical presentationsfocused on: Wind Engineering; Earthquake Engi-neering; Storm Surge; Tsunamis; U.S.-Japan Coop-erative Research Program (where NBS isperforming cooperative research in seismic behav-ior of large concrete bridge piers); summaries ofrecent Panel Workshops; and a report from eachside on Two Decades of Panel Accomplishmentsand Future Work.
During 1988-89, the Panel members agreed toperforming large-scale testing of precast seismicstructural systems, advance technologies in appli-cation of active and passive control of buildingsand other structures, improve knowledge of strongmotion data on performance of buried pipeline sys-tems, and verify the effectiveness of retrofittingand strengthening methods for structures and soils.Five workshops are being planned on: repair andretrofit of buildings, sensor technology applied tolarge engineered systems, earthquake hazard andrisk assessment, disaster prevention for lifeline sys-tems, and loads on bridges. Also, a planning meet-ing will address remedial treatment of liquefiablesoils.
Panel accomplishments during the past year in-cluded: more than six guest researchers exchangedbetween U.S. and Japanese laboratories; correla-tion of data from the Whittier Narrows and theMexico City earthquakes with Japanese and U.S.design practices; joint research in large-scale test-ing of masonry and lifeline structures; sharing re-pair methods for civil engineering structures;exchanged data from strong motion arrays to studycauses and effects of horizontal variations inground motions and effects of overburden on inten-sity of ground shaking; and translated into Englishand published the Japanese publication, ManualforRepair Methods of Civil Engineering StructuresDamaged by Earthquakes. This report is a valuablereference for development of U.S. building prac-tices. The data produced by the joint Panel influ-ence on-going U.S. and Japan structuralengineering research, and guide improvements ofbuilding codes and standards of both countries.
Noel J. RaufasteCenter for Building TechnologyNational Engineering LaboratoryNational Institute of Standards and TechnologyGaithersburg, MD 20899
671
Volume 93, Number 6, November-December 1988
Journal of Research of the National Institute of Standards and Technology
Subject and Author Index to Volume 93A
Abe, Amy, James E. Freeman,D. Scott Aldrich, and Steven J. Borchert,Pharmaceutical Trace Analysis ..................
Abramson, Fred P., andDonald H. Chace, Applicationsof the Reaction Interface/MassSpectrometer Technique to theAnalysis of Selected Elements andNuclides from Submicrogram Quantitiesof Biological Macromolecules andXenobiotics ...................................
Absolute Cross-Section Measurementsin XQQ Instruments: The NBS Round Robin.....
absorbed dose ...................................Accuracy in Analysis: The Role of
Standard Reference Materials ...................Accuracy in CPAA for C, N and
o and in ERDA and NRA for H................Accuracy in Furnace Atomic
Absorption Spectroscopy .......................Accuracy in Microanalysis by Electron
Energy-Loss Spectroscopy....................Accuracy in Quantitative Electron
Probe Microanalysis .........................Accuracy in the Determination of Chlorinated
Dibenzo-p-Dioxins and Dibenzofurans inEnvironmental Samples........................
Accuracy in Trace Analysis......................Accuracy of Surface Analyses, The ................Accurate Measurement of Vitamins in
Foods and Tissues .............................accurate trace chemical analysis ...................Ache, H. J., J. M. TorresLlosa,
H. Ruf, and K Schorb, StrippingVoltarnmetric Assay of Trace Technetiumwith a TOPO Coated Glassy CarbonElectrode .....................................
acidic and basic air pollutants .....................Ackerman, Stanley A., John G. Phillips,
Donald W. Thayer, Jay B. Fox, Jr., andRonald K Jenkins, Effects of IonizingRadiation on Nutrients in Foods.................
activity coefficients ..............................Adams, John R., Michael S. Epstein,
Barry I. Diamondstone, and Thomas E. Gills,A New River Sediment Standard ReferenceMaterial ......................................
adipose tissue....................................Adsorptive Stripping Voltammetry-
A New Electroanalytical Avenuefor Trace Analysis .............................
aerosol activation...............................Ahuja, S., G. Thompson, and J. Smith,
Trace/Ultratrace Analyses of UnstableCompounds: Investigations on Hydrazobenzeneand Azobenzene.............................
alcohols ........................................
Aldrich, D. Scott, Steven J. Borchert,AmyAbe, and James E. Freeman, PharmaceuticalTrace Analysis.
alkali uranyl(2 +)phosphates......................242 Alkylation of DNA In Vivo:
Development of AnalyticalMethodology for Trace QuantitativeAnalysis .
alkylbenzenes.Alofs D. J., D. E. Hagen, and D. R. White,
Condensation Method for HumidityMeasurement in the UMR Cloud
419 Simulation Chamber.ambient air ...................................... 281,
431 ambient levels .603 ammonium pyrrolidine dithicarbamate-
methyl isobutyl ketone-furnace213 atomic absorption spectrometry.
ammonium uranyl(2+)phosphate.482 analysis.
Analysis at the Atomic Level: The Atom445 Probe Field-Ion Microscope.
Analysis of Gaseous and Particle-Associated372 PAH and Nitroarenes in Ambient Air.
analysis of PCBs and pesticides in human509 adipose tissue.
Analysis of Trace Elements inMethamphetamine Hydrochloride by
241 Inductively Coupled Plasma-Mass217 Spectrometry.387 analytical balance.
analytical capabilities of inductively362 coupled plasma-mass spectrometry.228 analytical chemistry .
Analytical Chemistry and MaterialPurity in the Semiconductor Industry.
analytical electron microscope.analytical methodology.
493 analyzed reference materials.283 Anderson, T. M., R E. Thompson, and
J. R. Tuschall, U.S. EPA Reference Standardsand Quality Assurance Materials for theAnalysis of Environmental Pollutants.
364 anions to metals .161 Annular Denuders and Filter Packs Designed to
Measure Ambient Levels of Acidic and BasicAir Pollutants.
Application of Flame Spread Theory to234 Predict Material Performance, The.343 application of reduced palladium as
a chemical modifier .Applications of Lasers in
489 Bioanalytical Chemistry.551 Applications of Mass Spectrometry
in Polymer Analysis: Use ofGC-GC-High Resolution MS toIdentify Photo- and Oxidative
344 Degradation Products of BPA-161 Polycarbonate.
673
242557
419161
551279283
305557213
374
279
343
469565
433207
396369419264
237411
283
61
450
502
394

Volume 93, Number 6, November-December 1988
Journal of Research of the National Institute of Standards and Technology
Applications of the ReactionInterface/Mass Spectrometer Techniqueto the Analysis of Selected Elementsand Nuclides from Submicrogram Quantitiesof Biological Macromolecules and Xenobiotics ....
Appropriate Reference Parameters for theEvaluation of Elemental Analysis Datafrom Biomedical Specimens....................
arc (argon, blackbody, and hydrogen) ..............Arey, Janet, Barbara Zielinska, Roger Atkinson,
and Arthur M. Winer, Analysis of Gaseous andParticle-Associated PAH and Nitroarenes inAmbient Air ..................................
argon ..........................................aromatic compounds in natural samples
by Shpol'skii Spectroscopy.....................arsenic species in urine ...........................Arunachalam, J., S. Jaikuanar,
S. V. Burangey, S. Gangadharan, andS. Natarajan, MultitechniqueApproach to Trace Characterizationof High Purity Materials: Gallium...............
Assessment of the Analytical Capabilitiesof Inductively Coupled Plasma-MassSpectrometry................................
Atkinson, Roger, Arthur M. Winer,Janet Arey, and Barbara Zielinska, Analysis ofGaseous and Particle-Associated PAH andNitroarenes in Ambient Air .....................
atom probe field-ion microscope...................atomic absorption spectrometric
applications to clinical-biomedical tracemetal analyses................................
atomic absorption spectrometry...................atomic level.....................................atomic spectroscopy............................automated interpretation of large EPMA
data sets ......................................Automated Manufacturing Research Facility ........Automation and Application of a
Direct-Current Plasma EmissionSpectrometer................................
azobenzene.....................................
B
Bailey, George 9., and Daniel C Paschal,Determination of Manganese in Serumwith Zeeman Effect Graphite FurnaceAtomic Absorption ............................
Barker, Todd Q., Harlan R. WilkSteven L. Monfre, and Steven D. Brown,Multicomponent Analysis in Static andFlow Systems Using Digital Filters ..............
Barman, B. N., Daniel E. Martire, andMichele (Miller) Schantz, Partitioning ofAlkylbenzenes and Aliphatic Alcohols betweenHexadecane and Methanol-Water Mixtures........
Bavda.2 M., N. Gurker, P. Ketelsen,W. Petersen, M.H. Salehi, T. Dietrick,and A. Kn&chel, Synchrotron RadiationExcited Fluorescence Micro-AnalysisUsing a New Imaging Technique ................
Beach, L. M., T. M. Rettberg, andD. E. Shrader, Graphite Furnace AAS:Application of Reduced Palladium asa Chemical Modifier ...........................
Beekman, D. W., E. H. Taylor, V. Lorch,L. J. Moore, J.E. Parks, and M. T. Spaar,Ultra-Trace Elemental and IsotopicQuantification for Neonatal Nutrition
419 Studies.
Behne, Dietrich, and Venkatesh Iyengar,Appropriate Reference Parameters for
326 the Evaluation of Elemental Analysis21 Data From Biomedical Specimens.
Bellama, Jon M., Richard.A. Durstand Rosanne Kannuck, Homogeneous
279 Electrochemical Immunoassy Using85 a Chemically Modified Electrode.
Bennan, Eleanor, Some Atomic Absorption
441 Spectrometric Applications to Clinical-315 Biomedical Trace Metal Analyses.
Beugelsdijk Tony J., and Dan W. Knobeloch,Laboratory Robotics in RadiationEnvironments.
Biochemical Applications of400 Chromatography/SIMS.
biological macromolecules .biological reference materials.
433 Biological Reference Materials forTrace Element Analysis: What is New?.
blackbody.Blyshak, L., S. L. Neal, I. M. Warner,
279 G. Nelson, and G. Patonay, Enhanced374 Multidimensional Luminescence
Measurements Through CyclodextrinComplexation .
334 BODO.350 Borchert, Steven J., Amy.Abe,374 James E. Freeman, and D. Scott Aldrich,447 Pharmaceutical Trace Analysis .
260 BPA-Polycarbonate.539 Braun, Walter, Philippe Dagaut, and
Bany C. Cadoff, Kinetic Studies Usinga Highly Sensitive Microphone Detector.
458 Bridges, J. Mervin, William R. Ott, and344 Jules Z. Klose, Radiometric Calibrations of
Portable Sources in the Vacuum Ultraviolet.Brown, D., G. Legere, and P. Burgener,
ICP Trace Element Analyses fromFusion Dissolution.
Brown R., N. E. Sanderson,P. Charalambous, and D. J. Hall,
323 Quantitative Aspects of GlowDischarge Mass Spectrometry.
Brown, K K, P. Tomboulian, andS.M. Walters, Trace Level Quantitation
253 of Phenyltin Compounds Using HPTLC.Brw, Steven D., Todd Q. Barker,
Harlan R. WM; and Steven L. Monfre,Multicomponent Analysis in Static and Flow
161 Systems Using Digital Filters.Brawn, W. E., M. S. Tung, N. Eidelman, and
B. Sieck, Octacalcium PhosphateSolubility Product from 4 to 37 'C.
379 Bruno, Thomas J., Solvent-Free Injection inSupercritical Fluid Chromatography UsingSintered Glass Deposition.
Buckley, T. J., and J.M. Rukkers, A Computer450 Controlled Data Acquisition System for
Combustion Calorimetric Experiments .
674
328
326
506
334
268
499419360
3187
438311
242394
643
21
454
426
301
253
613
655
145

Volume 93, Number 6, November-December 1988
Journal of Research of the National Institute of Standards and Technology
Bulkin, Bernard J., The Importance of QuantitativeTrace Analysis in Industry Today ................ 189
Burangey, S. V., S. Gangadharan,S. Natarajan, J. Arunachalam, andS. Jaikumar, MultitechniqueApproach to Trace Characterizationof High Purity Materials: Gallium ............... 400
Burgener, P., D. Brown, and G. Legere,ICP Trace Element Analyses fromFusion Dissolution ............... .............. 454
Busch, K L., M.S. Stanley, K L. D4ffin,and J. C. Dunphy, Biochemical Applicationsof Chromatography/SIMS ...................... 499
Byrd, G. D., L. T. Sniegoski, andE. White V. Determination of 3-QuinuclidinylBezilate in Urine ............................... 293
C
Cadoff, Barry C., Walter Braun, andPhilippe Dagaut, Kinetic Studies Using a HighlySensitivie Microphone Detector ....... .......... 643
calibration ...................................... 7,53,565calibration, grid plate ............................. 41calibration, radiometric ................ ........... 21calibration standards ............... .............. 264calibration, uncertainty ............. .............. 53calibrations of portable sources in the
vacuum ultraviolet ............................. 21calorimeter ...................................... 603capillary electrophoresis ............ .............. 406CAPPIS ........ 298carbon-11 labelled carboxylic
acids ...................................... 338Carroll, Raymond J., Clifford H. Spiegelman,
and Robert L. Watters, Jr., HeteroscedasticCalibration Using Analyzed ReferenceMaterials as Calibration Standards ....... ........ 264
Caruso, Joseph A., Microwave InducedPlasmas as Sources for AtomicSpectroscopy .................................. 447
Chabala, J., Y. L. Wang, andR. Levi-Setti, Imaging Microanalysisof Materials With a Finely FocusedHeavy Ion Probe ................. ............. 377
Chace, Donald H., andFred P. Abramson, Applicationsof the Reaction Interface/MassSpectrometer Technique to theAnalysis of Selected Elements andNuclides from Submicrogram Quantitiesof Biological Macromolecules andXenobiotics ................................... 419
Chaconas, Karen, J., and Marilyn Nashman,The NBS Vision System in the AMRF ...... ..... 539
Chang, C.-j., R. G. Cok, andJ. R. O'Lear, Alkylation of DNA In Vivo:Development of Analytical Methodologyfor Trace Quantitative Analysis .................. 419
Chang, S. C., T. S. Kao, C. P. Tang, andMR. Lee, Studies of Limit ofDetection on 2,4,6-Trinitrotoluene(TNT) by Mass Spectrometry ........ ........... 428
Characterization of High Purity Silicides ...... ..... 239Charalambous, P., D. J. Hall, R. Brown,
and N.E. Sanderson, QuantitativeAspects of Glow Discharge MassSpectrometry .................................. 426
chemical blanks and chemical yields ................ 228chemically active electrode materials ............... 488chemically modified electrode ........ ............. 506Chemiluminescence Detection in Flowing
Streams-Immobilized and Solid-StateReagents ...................................... 501
Chemometrics in Europe: Selected Results ......... 257Chemometrics and Standards ...................... 193Cheung, Y. Y., C. W. McLeod, Y Zhang,
I. Cook, A. Cox, and A R. Date,Flow Injection-Inductively CoupledPlasma Spectrometry: A NewStrategy for Ultratrace Analysis ....... .......... 462
chlorinated dibenzo-p-dioxins ..................... 241chromatography ................................. 655chromatography, biochemical applications ...... .... 499chromatography, ion .411, 425chromatography, open tubular liquid .403chromatography, supercritcal fluid .409, 655Chromium (IH and Chromium (VI) .. .. 305Ciacdo, Leonard L., and Klaus Hameyer,
An Instrument for Determination ofEnergy Oxygen and BOD5. . ... 311
Classical Pitfalls in ContemporaryNuclear Data Analysis .... 479
clinical chemical analysis .... 336cloud drop growth .... 551CO 2 laser .... 643Cohen, A, P. Ellerbe, R. Schaffer,
L. T. Sniegoski, E. White V, and M. J. Welch,The Development of Definitive Methods forOrganic Serum Constituents .... 341
combustion .... 145compositional mapping .... 518Computer Assisted Pesticide and
PCB Identification System (CAPPIS) .. .. 298computer application .... 145Computer Controlled Data Acquisition
System for Combustion CalorimetricExperiments, A ... 145
computer vision .... 539Condensation Method for Humidity
Measurement in the UMR Cloud SimulationChamber .... 551
Conlon, T. W., and J. A. CooksonMeV Ion Beam Analysis .... 473
contamination or trends in the concentrationsof trace metals in marine environments ... . 321
convection .... 603convective velocity .... 603Convective Velocity Effects on a
Thermistor in Water .603Cook, Edgar, Mirtha Um-na, Jess Waller,
Mansukh Warn, and Carol ffldmant, Enzyme-Enhanced Electrochemical Immunoassay forPhenytoin ................................. 659
Cook, I., A Cox, A R. Date, Y. Y. Cheung,C. W McLeod, and Y. Zhang, FlowInjection-Inductively CoupledPlasma Spectrometry: A NewStrategy for Ultratrace Analysis ....... .......... 462
Cooks, R. G., J. R. O'Lear, andC.-j. Chang, Alkylation of DNA In Vivo:Development of Analytical Methodologyfor Trace Quantitative Analysis .................. 419
675

Volume 93, Number 6, November-December 1988
Journal of Research of the National Institute of Standards and Technology
Ccokson, J. A., and T. W. Conlon,MeV Ion Beam Analysis........................
Cox, A, A. R. Date, Y. Y. Cheung,C. W. McLeod4 Y. Zhang, and . Cook,Flow Injection-Inductively CoupledPlasma Spectrometry: A NewStrategy for Ultratrace Analysis .................
CPAA .........................................Creceliu;s, EricA., Detecting Contamination or
Trends in the Concentrations of TraceMetals in Marine Environments.................
Crews, H. M., R. Massey, D. J. McWeeny, andJ. R. Dean, Trace Element Speciation in Food:A Combined Enzymolysis-SEC-ICP-MSApproach....................................
Crews, H. M., R. C. Massey,D. J. McWeeny, J.R. Dean, andL. Ebdon, Some Applications ofIsotope Analysis of Leadin Food by ICP-MS............................
Crilly, Paid Benjamin, An Evaluationof Jansson's Method toDeconvolve Overlapped GasChromatographic Peaks ........................
cryogenic size reduction..........................crystal growth...................................Currie, Lloyd A., George A. Kida,
and Ann E. Sheffield, Trace RadiocarbonAnalysis of Environmental Samples ..............
Currie, L. A., Chemometrics and Standards .........cyclodextrin complexation ........................Czae, Myung-Zbon, and Jong-Hyup Lee,
Range-Programming Stripping Voltammetryfor Determination of Some Metals inSeawater .....................................
D
Dagaut, Philippe, Barry C Cadoff andWalter Braun, Kinetic Studies Using aHighly Sensitive Microphone Detector ...........
data acquisition................................Date, A R., Y. Y. Cheung, C. W. McLcod,
Y. Zhang, I. Cook, and.A. Cox,Flow Injection-Inductively CoupledPlasma Spectrometry: A NewStrategy for Ultratrace Analysis .................
Davis, R. S., and B. E. Welch, PracticalUncertainty Limits to the MassDetermination of a Piston-Gage Weight ..........
Davis, R. S., M. R. Moldover, J. P. M. Trusler,T. J. Edwards, and J. B. Meld, Measurement ofthe Universal Gas Constant R Using aSpherical Acoustic Resonator ...................
De Bi~vre, Paul, TransferringAccuracy to the Trace Leveland Then to the Field ..........................
De Wit, J. S. M., J. W. Jorgenson,R. T. Kennedy, R. L. St. Claire, III,J. G. White, and P. R. Diumeski, OpenTubular Liquid Chromatography andthe Analysis of Single Neurons ..................
De Kesel, A., J. Hoste, B. Wallaeys,473 J. Vandenhaute, J. Versieck, and
L. Vanballenberghe, Biological ReferenceMaterials for Trace Element Analysis:What is New? .
Dean, J. R., H. M. Crews, R. Massey, and462 D. J. McWeeny, Trace Element Speciation482 in Food: A Combined Enzymolysis-SEC-ICP-MS
Approach.Dean, J. R., L. Ebdon, H. M. Crews,
321 R. C. Massey, and D. J. McWeeny,Some Applications of IsotopeAnalysis of Lead in Food byICP-MS .
349 Dennis, M. J., N. Howarth, R. C. Massey,D. J. McWeeny, I. Parker, M Scotter, andJ. R. Startin, Ethyl Carbamate Analysis inFermented Products: A Comparsion ofMeasurements of Mass Spectrometry, Thermal
464 Energy Analyser, and Hall ElectrolyticConductivity Detector .
Depth Profiling of Trace ConstituentsUsing Secondary Ion Mass Spectrometry.
413 Design of Cost-Effective QC Procedures292 for Clinical Chemistry.577 Detecting Contamination or Trends in the
Concentrations of Trace Metals inMarine Environments.
289 Determination of Chromium (Iff) and193 Chromium (VI) by Ammonium Pyrrolidine
438 Dithiocarbamate-Methyl Isobutyl Ketone-Furnace Atomic Absorption Spectrometry
Determination of Manganese in Serum withZeeman Effect Graphite Furnace Atomic
296 Absorption.Determination of 3-Quinuclidinyl Benzilate
in Urine .Determination of Trace Elements in
Uranium Oxide (U308 ) by InductivelyCoupled Plasma Emission Spectrometryand Graphite Furnace Atomic Absorption
643 Spectrometry, The.145 Determination of Tributyltin in the
Marine Environment .Determination of Traces of Uranium
and Thorium in MicroelectronicsConstituent Materials.
462 determination of vitamin C in milk.development of analytical methodology
for trace quantitative analysis.565 Development of Definitive Methods for
Organic Serum Constituents, The.Development of Multi-Purpose Biological
Reference Materials.85 de Wit, J. S. M., J. W. Jorgenson, R T. Kennedy,
P. L. St. Claire III, J. G. White, andP. R. Dluzneski, Open Tubular Liquid
520 Chromatography and the Analysis of SingleNeurons.
DeZwaan, Jack, and Douglas B. Hooker, OrganicMicroanalysis of Submicrogram Samples.
diagnostic probe.403 Diamondstone Barry I., Thornas E. Gills;
John R. Adams, and Michael S. Epstein, A NewRiver Sediment Standard Reference Material..
676
318
349
464
249
390
218
321
305
323
293
452
277
398367
419
341
360
403
245484
234

Volume 93, Number 6, November-December 1988
Journal of Research of the National Institute of Standards and Technology
dibenzo-p-dioxins ................................dibenzofurans ...................................Dierkes, Joseph E., Computer Assisted
Pesticide and PCB IdentificationSystem (CAPPIS).............................
Dietrich, T., A Knahel, M. Bavdaz,N. Gurker, P. Ketelsen, W. Petersen,and M. H. Salehi, Synchrotron RadiationExcited Fluorescence Micro-AnalysisUsing a New Imaging Technique ................
Diffraction Imaging (Topography) withMonochromatic Synchrotron Radiation...........
digital filters ....................................direct-current plasma emission
spectrometer ..................................direct digital synthesis...........................Direct Solids Analysis Using Sputter
Initiated Resonance IonizationSpectroscopy (SIRIS) ..........................
dithiocarbamates and relatedcompounds..................................
Djordjevic, Nebojsa, Karin E. Madddes,and Milton L. Lee, SupercriticalFluid Chromatography: Applicationto Trace Analysis.............................
DluznesAi, P. R., J. S. M. de Wit,J. W. Jorgenson, R. T. Kennedy,R. L. St. Claire III, and J. G. White,Open Tubular Liquid Chromatography andthe Analysis of Single Neurons ..................
DNA ..........................................Dobbyn, Ronald C., Un Laor,
Bruce Steiner, and Masao Kuriyama,Diffraction Imaging (Topography)with Monochromatic Synchrotron Radiation.
Doiron, Theodore D., Grid Plate Calibrationat the National Bureau of Standards..............
Domen, Steve R., Convective VelocityEffects on a Thermistor in Water ................
Doyle, Matthew J., D. Scott Wright;H. Brian Halsal, William R. Heineman,Sarah H. Jenkins, and Kenneth R. Wehmeyer,Electrochemical Enzyme Immunoassay...........
Duffin, K L., J. C. Dunphy, K L. Buschand M. S. Stanley, BiochemicalApplications of Chromatography/SIMS ..........
Dumn, WMilia J., III, S. L. Emery, andDonald R. Scott, Pattern RecognitionClassification and Identification of TraceOrganic Polutants in Ambient Air fromMass Spectra.................................
Dunphy, J. C., K L. Busch, M. S. Stanley,and K L. Duffin, Biochemical Applicationsof Chromatography/SIMS ....................
Durst, R., S. Gomiscek, M. Verber,and V. Francetic, ElectrochemicalStudies of Dithiocarbamates andRelated Compounds..........................
Durst, RichardA., Lauie Locascio-BrowB,and Anne L. Plant, Liposome-Based FlowInjection Immunoassay System..................
Durst, Richard A, Rosanne Kannuck;and Jon M. Bellama, HomogeneousElectrochemcial Immunoassy Usinga Chemically Modified Electrode ................
241241
E
Eatherton, Randy L., and Herbert H. Hill, Jr.,Ion Mobility Spectrometry after
298 Chromatography -Accomplishments,Goals, Challenges .............................. 425
Ebdon, L., H. M. Crews; R. C. Massey,D. J. McWeeny, and J.R. Dean,Some Applications of Isotope
379 Analysis of Lead in Food byICP-MS .................................. 464
577 Edwards; T. J., J.B. Mehl, R. S. Davis,253 M. R. Moldover, and J. P. M. Trusler, Measurement
of the Universal Gas Constant R Using a458 Spherical Acoustic Resonator ................... 8553 Effects of Ionizing Radiation on Nutrients
in Foods .364Egerton, Ray F., Accuracy in Microanalysis
383 by Electron Energy-Loss Spectroscopy .372Eidelman, N., B. Sieck, W. E. Brow;
496 and M. S. Thng, Octacalcium PhosphateSolubility Product from 4 to 37 'C .613
Elder, Robert S., Statistical Models inQuality Control for Trace Analysis .221
409 electroanalytical avenue fortrace analysis .489
Electrochemical Enzyme Immunoassay .491Electrochemical Studies of
Dithiocarbamates and Related Compounds .496403 electron energy-loss spectroscopy. 372419 electron probe microanalysis .509
electrooptic materials .577elemental analysis .269Ellerbe, P., L. T. Sniegoski, J. M. Miller,
577 and E. White V, An Isotope Dilution MassSpectrometric (IDMS) Method for the
41 Determination of Vitamin C in Milk .367Ellerbe, P., R. Schaffer, L. T. Sniegoski,
603 E. White V, M. J. Welch, and A. Cohen,The Development of Definitive Methods forOrganic Serum Constituents .341
Emery, S. L., Donald R. Scott, and491 Iliam J. Dunn III, Pattern Recognition
Classification and Identification of TraceOrganic Polutants in Ambient Air from
499 Mass Spectra .281energy oxygen .311energy transfer ......... . 643Enhanced Multidimensional Luminescence
Measurements Through Cyclodextrin281 Complexation .438
environmental samples .289, 307Enzyme-Enhanced Electrochemical
499 Immunoassay for Phenytoin .659enzymolysis, combined .349epithermal neutron activation .224Epler, K S., T. C O'Haver, M. S. Epstein,
496 and R. E. Jenkins, Automation and Applicationof a Direct-Current Plasma EmissionSpectrometer ........ . . . . .. 458
663 EPMA data sets .260Epstein, Michael S., Barry I. Diamondstone,
Thomas E. Gills, and John R. Adams, A New RiverSediment Standard Reference Material .234
506
677

Volume 93, Number 6, November-December 1988
Journal of Research of the National Institute of Standards and Technology
Epstein, M. S., R. E. Jenkins, K S. Epler,and T. C O'Haver, Automation and Applicationof a Direct-Current Plasma EmissionSpectrometer................................
equilibrium constants............................error estimation in gamma-ray
spectrometry ..................................Espourteille, F. A., C. D. Rice, R. G. Huggett,
and M. A. Unger, Determination of Tributyltinin the Marine Environment .....................
Ethyl Carbamate Analysis in Fermented Products:A Comparsion of Measurements of MassSpectrometry, Thermal Energy Analyser, andHall Electrolytic Conductivity Detector..........
evaluation of elemental analysisdata from biomedical specimens .................
Evaluation of Jansson's Method toDeconvolve Overlapped GasChromatographic Peaks, An ....................
Evensorn, Merle A., Inaccuracies inClinical Chemical Analysis......................
Evolutionary Factor Analysis .....................Emld, M., P. Garriques, and
E. Parlanti, Trace Analysis ofAromatic Compounds in Natural Samplesby Shpol'skii Spectroscopy.....................
expansion cloud chamber .........................expert system...................................Expert Systems and Robotics......................exposure assessment studies .......................extraction.....................................
F
factor analysis..................................Factor, Arnold, Ralph J. May, and
Woodfin V. Ligon, Jr., Applicationsof Mass Spectrometry in PolymerAnalysis: Use of GC-GC-HighResolution MS to Identify Photo-and Oxidative Degradation Productsof BPA-Polycarbonate .......................
Fairbank, W. M., Jr., J. M. R Hutcidnson,J. E. Parks, M. T. Spaar, and L. J. Moore,Direct Solids Analysis Using SputterInitiated Resonance IonizationSpectroscopy (SIRIS) ..........................
Fa&sett, J. D., Inorganic TraceAnalysis by Isotope DilutionMass Spectrometry-New Frontiers..............
Fast-Neutron Diagnostic Probe, A .................fermented products ..............................Field, Bnrce, and Liu Ruimin, An Improvement
in the Reliability of Standard Cell Enclosures .....filter packs......................................Finn, Ronald, and Patrica Landais,
Technical Difficulties Associated With theFormation of Carbon-11 Labelled CarboxylicAcids ........................................
flame spread ....................................flow calorimetry...............................Flow Injection-Inductively Coupled
Plasma Spectrometry: A NewStrategy for Ultratrace Analysis .................
Fluorescence Spectrometric Determinationof Nonfluorescent Compounds viaMolecular Fragmentation.
458 fluorescent and chemiluminescent613 detection in BHLC.
fluorometrix analysis.481 food analysis.
formation of carbon-11 labelledcarboxylic acids.
277 Fox, Jay B., Jr., Ronald K Jenkins,Stanley A. Ackerman, John G. Phillips,and Donald W. Thayer, Effects of IonizingRadiation on Nutrients in Foods.
249 Francetic, V., R. Durst,S. Gomiscek, and M Veber,
326 Electrochemical Studies ofDithiocarbamates and RelatedCompounds .
413 Freeman, Jamnes E., D. Scott Aldrich,Steven J. Borchert, and Amy Abe, Pharmaceutical
336 Trace Analysis .256 Frost, J. H., J. H. Phillips,
C. A. Potera, and P. M. Michalko, The Use ofCryogenic Size Reduction to ImprovePurgeable Priority Pollutant Analyses
441 in Soil Samples .551 fundamental constants.260 furnace atomic absorption spectroscopy.209 fusion dissolution.315274
G
437
504443358
338
364
496
242
29285
445454
gallium ....................................... 400gamma-ray spectrometry .......................... 481
256 Gangadharan, S., S. Natarajan,J. Arunachalam, S. Jaikiunar, andS. V. Burangey, MultitechniqueApproach to Trace Characterizationof High Purity Materials: Gallium ............... 400
Garbarinc J. R., and H. E. Taylor,Assessment of the Analytical
394 Capabilities of InductivelyCoupled Plasma-Mass Spectrometry .433
Garrigues, P., E. Parlant:4 andM. Emld, Trace Analysis of AromaticCompounds in Natural Samples by
383 Shpol'skii Spectroscopy .441gas phase .643GC/MS ... 331, 365
417 geological samples .224484 geometry correction .41249 Gilbert, John, and James R. Startin,
Stable Isotope Dilution GC/MS for the533 Quantification of Food Contaminants............. 365283 Gills, Thomas E., John R. Adams,
Michael S. Epstebn and Barry I. Diamondstone,A New River Sediment Standard ReferenceMaterial ..................................... 234
338 glow discharge mass spectrometry ................. 392, 42661 Gomiscek, S., M. Veber, V. Franceti4
145 and R. Durst, Electrochemical Studiesof Dithiocarbamates and RelatedCompounds ................................. 496
462
678

Volume 93, Number 6, November-December 1988
Journal of Research of the National Institute of Standards and Technology
Gordon, C. M., C. W. Peters, andT. K Olson, A Fast-NeutronDiagnostic Probe ............... ............... 484
Graphite Furnace AAS: Application ofReduced Palladium as a ChemicalModifier ...................................... 450
graphite furnace analysis .......................... 307graphite furnace atomic absorption
spectrometry ........... ......... 323,452,467Grasserbauer, M., Quantitative
Secondary Ion MassSpectrometry .................................. 510
grid plate ....................................... 41Grid Plate Calibration at the National
Bureau of Standards ........................... 41Gurker, N., P. Ketelsen, W. Petersen,
M. H. Salehi, T. Dietrich, A. Knf&hel,and M. Bavdaz, Synchrotron RadiationExcited Fluorescence Micro-AnalysisUsing a New Imaging Technique ....... ......... 379
H
Haag, Werner R., Measurement of Sunlight-Induced Transient Species in Surface Waters ...... 285
Hagen, D. E., D. R. White, and D. J. Alofs,Condensation Method for HumidityMeasurement in the UMR CloudSimulation Chamber ............... ............ 551
Hall, D. J., R. Bromw, N. E. Sanderson,and P. Charalambous, QuantitativeAspects of Glow Discharge MassSpectrometry .................................. 426
Hall electrolytic conductivity detector .............. 249Halsall, H. Brian, William R. Heineman,
Sarah H. Jenkins, Kenneth R. Wehmeyer,Matthew J. Doyle, and D. Scott Wright,Electrochemical Enzyme Immunoassay ........... 491
Hameyer, KlauS, and Ciaccio, Leonard L.,An Instrument for Determination ofEnergy Oxygen and BOD 5 ........ ............. 311
heat transfer .................................... 61heavy ion probe ................................. 377Heineman, William R., Sarah H. Jenkins;
Kenneth R. Wehmeyer, Matthew J. Doyle,D. Scott Wright, and H. Brian Halsall,Electrochemical Enzyme Immunoassay ........... 491
Heinric, K F. J., Accuracy inQuantitative Electron ProbeMicroanalysis ................................. 509
Herold, DavidA., Judy C. Hundley,Michael R. Wills, John Savory, andMichael Kinter, Use of High ResolutionGC/MS for Obtaining Accuracy in LipidMeasurements ................................. 331
Heteroscedastic Calibration Using AnalyzedReference Materials as Calibration Standards ...... 264
hexadecane ..................................... 161Heydorn, K, Classical Pitfalls in
Contemporary Nuclear Data Analysis ...... ...... 479hierarchical design ............................... 539High Performance Capillary Electrophoresis ........ 406high purity materials .......... .................. 400high purity siicides .............. ................ 239high resolution GC/MS ........... ............... 331
fHigh Resolution NonlinearLaser Spectroscopy.
Hill, Herbert H., Jr., and Randy L. Eatherton,Ion Mobility Spectrometry afterChromatography-Accomplishments,Goals, Challenges.
History of Trace Analysis.Holler, J. S., D. G. Patterson,
and S. J. Smith, Quantification ofToxic Chemicals in Selected HumanPopulations.
Homogeneous Electrochemical ImmunoassayUsing a Chemically Modified Electrode.
Hooker, Douglas B., and Jack DeZwaan, OrganicMicroanalysis of Submicrogram Samples.
Hoste, J., B. Wallaeys, J. Vandenhaute,J. Versieck, L. Vanballenberghe, andA. De Kesel, Biological Reference Materialsfor Trace Element Analysis: What is New? .
Hotes, S. A., and W. R. Kelly, Importance ofChemical Blanks and Chemical Yields inAccurate Trace Chemical Analysis.
Howarth, N., R. C. Massey, D. J. McWeeny,.L Parker, M. Scotter, J. R. Startin, andM. J. Dennis, Ethyl Carbamate Analysis inFermented Products: A Comparsion ofMeasurements of Mass Spectrometry, ThermalEnergy Analyser, and Hall ElectrolyticConductivity Detector.
HPLC..........................................HPTLC ............. ... .........Huber, Calvin 0., Voltammetric
Sensors Using ChemicallyActive Electrode Materials..
Huggett, R. G., M. A. Unger, F. A. Espourteille,and C. D. Rice, Determination of Tributyltinin the Marine Environment .....................
humidity measurement..........................Hundley, Judy C., Michael R. Wills,
John Savory, Michael Kinter, andDavid A. Herold, Use of High ResolutionGC/MS for Obtaining Accuracy in LipidMeasurements .................................
Huneke, J. C., Relative Sensitivity andQuantitation in Glow Discharge MassSpectrometry: A Progress Report ...............
Hutchinson, J. M. R., J. E. Parks, M. T. Spaar,L. J. Moore, and W. M. Fairbank, Jr., DirectSolids Analysis Using Sputter InitiatedResonance Ionization Spectroscopy (SIRIS).......
hydrazobenzene.hydrolysis.....................................
I
lannello, Robert M., Trace Analysesof Impurities in Povidoneby Square Wave Voltannetry...
ICP Trace Element Analyses fromFusion Dissolution.
ICP-AES: A Realistic Assessment of ItsCapabilities for Food Analysis.
ICP-MS.ideal gas .IDMS.
679
440
425175
412
506
245
318
228
249504.301
488
277551
331
392
383344613
487
454
35846485
367

Volume 93, Number 6, November-December 1988
Journal of Research of the National Institute of Standards and Technology
ignition........................................Ihnat, Milan, Reliable Measurement of
Major, Minor, and Trace ElementalNutrients .....................................
Imaging Microanalysis of MaterialsWith a Finely Focused Heavy Ion Probe .........
image processing ................................imaging technique ...............................Importance of Chemical Blanks and Chemical
Yields in Accurate Trace Chemical Analysis.Importance of Quality Assurance in Trace
Analysis, The .................................Importance of Quantitative Trace Analysis in
Industry Today, The...........................Improvement in the Reliablity of Standard
Cell Enclosures, An............................Improving Accuracy in Graphite
Furnace Atomic Absorption SpectrometryThrough Peak Shape Monitoring ................
impurities in povidone by squarewave voltammetry ...........................
Inaccuracies in Clinical Chemical Analysis..........Increased Accuracy in the Automated
Interpretation of Large EPMA Data Setsby the Use of an Expert System .................
In-Situ Filtration Sampler for theMeasurement of Trace Metals inPrecipitation ..................................
inductively coupled plasma-massspectrometry ..................................
injection ..........................Inorganic Trace Analysis by Isotope Dilution
Mass Spectrometry -New Frontiers..............Instrument for Determination of
Energy Oxygen and BODs, An..................international comparison.........................International Comparisons of Pressure
Standards: A Status Report .....................ion beam analysis...............................Ion Chromatography: From Anions
to Metals .....................................Ion Mobility Spectrometry after
Chromatography-Accomplishments,Goals, Challenges ............................
ionizing radiation on nutrients in foods .............irradiance.....................................Isenhour, T. L. and J. C. Marshall,
Expert Systems and Robotics....................isotope analysis of lead in food ....................Isotope Dilution Mass
Spectrometry (IDSM)..........................Isotope Dilution Mass Spectrometric
(IDMS) Method for the Determination ofVitamin C in Milk, An .........................
isotopic quantification ..........................1yengar, Venkatesh, and Dietrich Behne,
Appropriate Reference Parameters forthe Evaluation of Elemental AnalysisData From Biomedical Specimens ...............
Iyengar, Venkatesh, James Tanner, Wayne Wolf,and Rolf Zeisler, Development of Multi-Purpose Biological Reference Materials...........
61 J
Jackson, John K, Donald A. McSparron,354 Jamnes H. Walker, and Robert D. Saunders, The
NBS Scale of Spectral Irradiance .377 Jaikwnnar, S., S. V. Burangey,539 S. Gangadharan, S. Natarajan, and379 J. Anmachalam, Multitechnique
Approach to Trace Characterization228 of High Purity Materials: Gallium.
Janssens, K, W. Van Bormn, and P. Van Espen,232 Increased Accuracy in the Automated
Interpretation of Large EPMA Data Sets189 by the Use of an Expert System .
Jansson's Method .533 Jassie, L. B., and H. M. Kingston, Microwave
Acid Sample Decomposition for ElementalAnalysis.
467 Jenkins, Sarah H., Kenneth R. Wehmeyer,Matthew J. Doyle, D. Scott Wright,
487 H. Brian Halsall, and William R. Heineman,336 Electrochemical Enzyme Immunoassay
Jenkins, R. E., K S. Epler, T. C. O'Haver,and M. S. Epstein, Automation and Application
260 of a Direct-Current Plasma EmissionSpectrometer.
Jenkins; Ronald K, Stanley A Ackermnan,312 John G. Phillips, Donald W. Thayer, and
Jay B. Fox, Jr., Effects of Ionizing Radiation469 on Nutrients in Foods.
655 Jones; J. W., ICP-AES: A Realistic Assessmentof Its Capabilities for Food Analysis.
417 Jorgenson, J. W., R. T. Kennedy,R. L. St. Claire III, J. G. White,
311 P. R. Dlumesk&4 and J. S. M. de Wit, Open545 Tubular Liquid Chromatography and the
Analysis of Single Neurons .545 Junk; GregorA., and John J. Richard,473 Solid Phase Extraction on a Small Scale.
411 K
Kalman, David A., Quantitation of Arsenic425 Species in Urine for Exposure364 Assessment Studies.21 Kannuck; Rosanue, Jon M. Bellama,
and Richard A. Durst, Homogeneous209 Electrochemical Immunoassy Using a464 Chemically Modified Electrode.
Kao, T. S., C. P. Tang, M. R. Lee, and419 S. C. Chang, Studies of Limit of
Detection on 2,4,6-Trinitrotoluene(TNT) by Mass Spectrometry.
367 Karger, B. L., High Performance328 Capillary Electrophoresis.
Kateman, G., Accuracy in Trace Analysis Kawasaki T., 0. Wong, C. Wang, and
T. Kuwana, Trace Biogenic Amine326 Analysis with Pre-Column Derivatization
and with Fluorescent and ChemiluminescentDetection in HPLC .
360 Keller, Barbara J., In-SituFiltration Sampler for theMeasurement of Trace Metals inPrecipitation.
680
7
400
260413
269
491
458
364
358
403
274
315
506
428
406217
504
312

Volume 93, Number 6, November-December 1988
Journal of Research of the National Institute of Standards and Technology
Kelly, W R., and S. A. Hotes, Importance ofChemical Blanks and Chemical Yields inAccurate Trace Chemical Analysis...............
Kennedy, R. T., R. L. St. Claire III,J. G. White, P. R. Dlumeski J. S. M. de Wit,and J. W. Jorgenson, Open Tubular LiquidChromatography and the Analysis ofSingle Neurons ................................
Ketelsen, P., W. Petersen, M. H. Salehi,T. Dietrich, A Knachel, M. Bavdaz, andN. Gurker, Synchtroton RadiationExcited Fluorescence Micro-AnalysisUsing a New Imaging Technique ................
Kinetic Studies Using a Highly SensitiveMicrophone Detector ..........................
kinetics........................................Kingston, H. M., and L. B. Jassie, Microwave
Acid Sample Decomposition for ElementalAnalysis ......................................
Kinter, Michael, David A. Herold,Judy C. Hundley, Michael R. Wills, andJohn Savory, Use of High Resolution GC/MSfor Obtaining Accuracy in LipidMeasurements .................................
Kishi Tohru, Analysis of TraceElements in MethamphetamineHydrochloride by InductivelyCoupled Plasma-Mass Spectrometry..............
Klose, Jules Z., J. Mervin Bridges, andWilliam R. Ott, Radiometric Calibrations ofPortable Sources in the Vacuum Ultraviolet.......
Klouda, George.A., Ann E. Sheffield,and Lloyd A. Currie, Trace RadiocarbonAnalysis of Enviornmental Samples ..............
Knobeloch Dan, and Tony J. Beugelskyjk,Laboratory Robotics in RadiationEnvironments .................................
Knache4 A., M. Bavdaz, N. Gurker,P. Ketelsen, W. Petersen, M. H. Salehi,and T. Dietrich, Synchrotron RadiationExcited Fluorescence Micro-AnalysisUsing a New Imaging Technique ................
Koch, William F., Ion Chromatography:From Anions to Metals.........................
Kowalski, Bruce R., Process AnalyticalChemistry ....................................
Kuriyama, Masao, Ronald C. Dobbyn,Uri Laor, and Bruce Steiner, DiffractionImaging (Topography) with MonochromaticSynchrotron Radiation .........................
Kuwana, T., T. Kawasak, 0. Wong, andC. Wang, Trace Biogenic AmineAnalysis with Pre-Column Derivatizationand with Fluorescent and ChemiluminescentDetection in HPLC ............................
L
Laboratory Robotics in RadiationEnvironments .................................
Laitinew4 H. A., History of Trace Analysis ..........lamp (deuterium) ................................Lampaarski, L. L. and T. J. Nestnick, Accuracy
in the Determination of ChlorinatedDibenzo-p-Dioxins and Dibenzofurans inEnvironmental Samples........................
Landais, Patrica, and Ronald Finn,Technical Difficulties Associated With the
228 Formation of Carbon-11 Labelled CarboxylicAcids .
Laor, Urn, Bruce Steiner,Masao Kuriyama, and Ronald C. Dobbyn,Diffraction Imaging (Topography) with
403 Monochromatic Synchrotron Radiation.lasers in bioanalytical chemistry.Lee, Jong-Hyup and Myung-Zoon Czae,
Range-Programming Stripping Voltammetryfor Determination of Some Metals in
379 Seawater.Lee, M. R., S. C Chang, T. S. Kao, and
643 C. P. Tang, Studies of Limit of643 Detection on 2,4,6-Trinitrotoluene
(TNT) by Mass Spectrometry.Lee, Milton L., Nebojsa Djordjevi*,
269 and Karin E. Markides, SupercriticalFluid Chromatography: Applicationto Trace Analysis.
Legere, G., P. Burgener, and D. Brown,3ICP Trace Element Analyses from
331 Fusion Dissolution.Levi-Seti R., J Chabala, and
Y. L. Wang, Imaging Microanalysis
469 of Materials with a Finely FocusedHeavy Ion Probe .
Ligon, Woodfin, V., Jr., Arnold Factor,21 and Ralph J. May, Applications of
Mass Spectrometry in PolymerAnalysis: Use of GC-GC-High
289 Resolution MS to Identify Photo-and Oxidative Degradation Productsof BPA-Polycarbonate.
268 limit of detection on 2,4.6-Trinitrotoluene(TNT) by Mass Spectrometry.
lipid measurements.Liposome-Based Flow Injection
Immunoassay System.379 Lippone, Maija and Rolf Rosenberg, Quality
Control in Routine Instrumental Epithermal
411 Neutron Activation Analysis of GeologicalSamples.
207 Little, James N., The Role of Robotics in theLaboratory of the 80s.
Locasco-Brown, Laurie; Anne L. Plant, andRichardA. Durst, Liposome-Based Flow
577 Injection Immunoassay System .Lochrmuller, C. H., The Role of the Robot in
the Chemical Laboratory.Lorch, V, L. J. Moore, J. E. Parls, M. T. Spaar,
D. W. Beekman, and E. H. Taylor, Ultra-Trace504 Elemental and Isotopic Quantification for
Neonatal Nutrition Studies.lower oxygenated organic compounds.luminescence measurements.
268175
M
21 Magee, Charles, W., Depth Profilingof Trace Constituents Using SecondaryIon Mass Spectrometry .......................
major, minor, and trace elemental239 nutrients....................................
681
338
577502
296
428
409
454
377
394
428331
663
224
191
663
267
328299438
390
354

Volume 93, Number 6, November-December 1988
Journal of Research of the National Institute of Standards and Technology
Malinowsk-i, E. R., K Schostack;P. Parekh, and S. Patel,Evolutionary Factor Analysis ...................
manganese in serum..............................Markides, Karin E., Milton L. Lee,
and Nebojsa Djordjevic, SupercriticalFluid Chromatography: Applicationto Trace Analysis.............................
Markovi, Milenko, Nevenka Pavkovi,and Neven D. Pavkovic, Precipitation ofNH4UO2 PO4 . 3H 20-Solubility and StructuralComparison with Alkali Uranyl(2+) Phosphates...
Marshall, J. C., and T. L. Isenhour,Expert Systems and Robotics....................
Martinez, Richard I., Absolute Cross-Section Measurements in XQQ Instruments:The NBS Round Robin.........................
Martire, Daniel E., Michele (Miller) Schantzand B. N. Barman, Partitioning ofAlkylbenzenes and Aliphatic Alcohols betweenHexadecane and Methanol-Water Mixtures........
mass ...........................................mass spectrometer technique ......................mass spectrometry ...............................mass spectrometry, glow discharge.................mass spectrometry in polymer analysis..............Massey, R., D. J. McWeeny, J. R. Dean, and
H. M. Crews, Trace Element Speciation inFood: A Combined Enzymolysis-SEC-ICP-MSApproach...................................
Massey, R. C., D. J. McWeeny,J. R. Dean, L. Ebdon, andH. M. Crews, Some Applications ofIsotope Analysis of Lead in Foodby ICP-MS ...................................
Massey, R. C., D. J. McWeeny, I. Parker,M. Scotter, J. R. Startin, M. J. Dennis,and N. Howarth, Ethyl Carbamate Analysis inFermented Products: A Comparsion ofMeasurements of Mass Spectrometry, ThermalEnergy Analyser, and Hall ElectrolyticConductivity Detector .........................
Material Handling Workstation ....................material properties ...............................material purity ..................................May, Ralph J., Woodfin V. Ligon, Jr.,
and Arnold Factor, Applications ofMass Spectrometry in PolymerAnalysis: Use of GC-GC-HighResolution MS to Identify Photo- and OxidativeDegradation Products of BPA-Polycarbonate .....
McGowia Linda B., and Kasem Nithzpatikom,Sodium Taurocholate Micelles inFluorometrix Analysis.........................
McKinney, Gerald L., Precision and Biasof Graphite Furnace Analysis ofEnvironmental Samples........................
McLeod, C. W., Y. Zhang, L. Cook,A. Cox, A. R. Date, and Y. Y. Cheung,Flow Injection-Inductively CoupledPlasma Spectrometry: A NewStrategy for Ultratrace Analysis .................
MaSparron, Donald A., James H. Walker,Robert D. Saunders, and John K Jackson, TheNBS Scale of Spectral Irradiance ................
McWeeny, D. J., J. R. Dean, L. Ebdon,H. M. Crews; and R. C. Massey, SomeApplications of Isotope Analysisof Lead in Food by ICP-MS ....................
McWeeny, D. J., I. Parker, M. Scotter,J. R. Startin, M. J. Dennis, N. Howarth, and
256 R. C. Massey, Ethyl Carbamate Analysis in323 Fermented Products: A Comparsion of
Measurements of Mass Spectrometry, ThermalEnergy Analyser, and Hall ElectrolyticConductivity Detector.
* 409 McWeeny, D. J., J. R. Dean, H. M. Crews,and R. Massey, Trace Element Speciationin Food: A Combined Enzymolysis-SEC-ICP-MSApproachp...
measurement.209 .....Measurement of Sunlight-Induced Transient
Species in Surface Waters.Measurement of the Universal Gas Constant
431 R Using a Spherical Acoustic Resonator.measurements in XQQ instruments .measuring machine.Mehl, J. B., R. S. Davis, M. R. Moldover,
161 J. P. M. Trusler, and T. J. Edwards, Measurement565 of the Universal Gas Constant R Using a419 Spherical Acoustic Resonator .
249, 428 mercury .392 methanol-water mixtures.394 metrology.
MeV Ion Beam Analysis.Michaelis; Markus, Wolfhard Wegscheider,
and Hugo M. Ortner, ImprovingAccuracy in Graphite Furnace AtomicAbsorption Spectrometry ThroughPeak Shape Monitoring.
Michalko, P. M., J. H. Frost,464 J. H. Phillips, and C. A. Potera, The Use of
Cryogenic Size Reduction to ImprovePurgeable Priority Pollutant Analysesin Soil Samples.
microanalysis.microelectronics constituent materials.micrometer scale..
249 microscope.539 Microwave Acid Sample Decomposition61 for Elemental Analysis .
396 Microwave Induced Plasmas asSources for Atomic Spectroscopy.
Miller, J. M., E. White V, P. Ellerbe,and L. T. Sniegoski, An Isotope DilutionMass Spectrometric (IDMS) Method for theDetermination of Vitamin C in Milk.
394 Miller, M. K, Analysis at the AtomicLevel: The Atom Probe Field-IonMicroscope.
* 443 Miller-Ihli, Nancy J., Trace ElementDeterminations in Biologicals Using
307 Atomic Absorption Spectrometry.mixing ratio.modular programming.molar gas constant.Moldover, M. R., J. P. M. Trusler, T. J. Edwards,
462 J. B. Mehl, and R. S. Davis, Measurement ofthe Universal Gas Constant R Using aSpherical Acoustic Resonator.
7 molecular fragmentation.Monfre, Steven L., Steven D. Browa,
Todd Q. Barker, and Harlan R. Wilk,Multicomponent Analysis in Static and
464 Flow Systems Using Digital Filters .
682
249
349643
285
8543141
8585
16141
473
467
292372, 377
398518374
269
447
367
374
35055114585
85437
253

Volume 93, Number 6, November-December 1988
Journal of Research of the National Institute of Standards and Technology
monochromatic diffraction imaging ................Moore, L. J., J. E. Parks, M. T. Spaar,
D. W. Beekman, E. H. Taylor, and V. Lorch,Ultra-Trace Elemental and IsotopicQuantification for Neonatal NutritionStudies .......................................
Moore, L. J., W. M. Fairbank, Jr.,J. M. R. Hutchinson, J. E. Parks, andM. T. Spaar, Direct Solids AnalysisUsing Sputter Initiated ResonanceIonization Spectroscopy (SIRIS).................
Mori Eji, Hideo Saisho,Masataka Tanaka, and Koichi Nakamura,Determination of Traces ofUranium and Thorium in MicroelectronicsConstituent Materials..........................
Morrison, George H., Trace Analysis byDegrees: An Academic Perspective..............
multi-processor .................................multi-programming. ..............................multi-purpose biological reference
materials.....................................Multicomponent Analysis in Static and
Flow Systems Using Digital Filters ..............multidimensional luminescence measurements
through Cyclodextrin Complexation..............Multitechnique Approach to Trace
Characterization of High PurityMaterials: Gallium.............................
N
Nagy, Lajos Gyargy, Peter Zagyva4, andJ6zsef Solymosi, A Uniform Concept forError Estimation in Gamma-Ray Spectrometry....
Nakamura, Koichi, Eiji Mori,Hideo Saisho, and Masataka Tanaka,Determination of Traces ofUranium and Thorium in MicroelectronicsConstituent Materials..........................
Nashman, Marilyn, and Karen J. Chaconas,The NBS Vision System in the AMRF ...........
Natarajan, S., J. Arunachalamn,S. Jaikumar, S. V. Burangey, andS. Gangadharan, MultitechniqueApproach to Trace Characterizationof High Purity Materials: Gallium...............
NBS Round Robin...............................NBS Scale of Spectral Irradiance, The .............NBS Vision System in the AMRF, The.............Neal, S. L., I. M. Warner, G. Nelson.
G. Patonay, and L. Blyshak, EnhancedMultidimensional LuminescenceMeasurements Through CyclodextrinComplexation .................................
Nelson, G., G. Patonay, L. Blyshak,S. L. Neal, and I. M. Warner, EnhancedMultidimensional LuminescenceMeasurements Through CyclodextrinComplexation .................................
neonatal nutrition studies .........................Nestrick, T. J., and L. L. Lamparshi, Accuracy
in the Determination of ChlorinatedDibenzo-p-Dioxins and Dibenzofurans inEnvironmental Samples........................
577 New River Sediment Standard ReferenceMaterial, A.
Newbury, Dale E., QuantitativeCompositional Mapping on aMicrometer Scale.
328 Nieman, TimothyA., ChemiluminescenceDetection in Flowing Streams-Immobilizedand Solid-State Reagents.
Nithipatikoin, Kasem, and Linda B. McGowa,Sodium Taurocholate Micelles in
383 Fluorometrix Analysis.nitroarenes.nonfluorescent compounds via
molecular fragmentation.nonlinear laser spectroscopy.
398 Nozaki, T., Accuracy in CPAA forC, N and 0 and in ERDA and
187 NRA forH..539 nuclear data analysis .145 nuclides from submicrogram
quantities of biological macromolecules360 and xenobiotics.
253 0octacalcium phosphate.
438 Octacalcium Phosphate Solubility
Product from 4 to 37 'C.O'Haver, T. C., M. S. Epstein, R. E. Jenkins,
400 and K S. Epler, Automation and Applicationof a Direct-Current Plasma EmissionSpectrometer................................
O'Lear, J. R., C.-j. Chang, andR. G. Cooks, Alkylation of DNA In Vivo:Development of Analytical Methodology
481 for Trace Quantitative Analysis.Olson, T. K, C. M. Gordon, and
C. W. Peters, A Fast-Neutron DiagnosticProbe.
Open Tubular Liquid Chromatography
398 and the Analysis of Single Neurons.opto-acoustic.
539 Organic Microanalysis of Submicrogram Samplesorganic serum constituents.Ortner, Hugo M., Markus Michaelis;
and Woljhard Wegscheider, ImprovingAccuracy in Graphite Furnace Atomic
400 Absorption Spectrometry Through431 Peak Shape Monitoring.
7 Ott, William R., Jules Z. KIose, and539 J. Mervin Bridges, Radiometric Calibrations of
Portable Sources in the Vacuum Ultraviolet.
P
438 PAH .Parekl, P., S. Patel, E. R. Malinowski,
and K Schostack, EvolutionaryFactor Analysis.
Parker, I., M. Scotter, J. R. Startin,438 M. J. Dennis; N. Howarth, R. C. Massey,328 and D. J. McWenny, Ethyl Carbamate Analysis
in Fermented Products: A Comparsion ofMeasurements of Mass Spectrometry, ThermalEnergy Analyser, and Hall Electrolytic
241 Conductivity Detector.
683
234
518
501
443279
437440
482479
419
613
613
458
419
484
403643245341
467
21
279
256
249
Volume 93, Number 6, November-December 1988
Journal of Research of the National Institute of Standards and Technology
Parks, J. E., M. T. Spaar, D. W. Beekman,E. H. Taylor, V: Lorcr, and L. J. Moore,Ultra-Trace Elemental and IsotopicQuantification for Neonatal NutritionStudies ....................................... 328
Parks, J. E., M. T. Spaar, L. J. Moore,W. M. Fairbank, Jr., and J. M. R. Hutchinson,Direct Solids Analysis Using SputterInitiated Resonance IonizationSpectroscopy (SIRIS) ........... ............... 383
Parlanti, E., M Ewald, andP. Garrigues, Trace Analysis ofAromatic Compounds in Natural Samplesby Shpol'skii Spectroscopy ...................... 441
partition coefficients ............................. 161Partitioning of Alkylbenzenes and
Aliphatic Alcohols between Hexadecaneand Methanol-Water Mixtures ................... 161
Paschal, Daniel C., and George G. Bailey,Determination of Manganese in Serumwith Zeeman Effect Graphite FurnaceAtomic Absorption ............. ............... 323
Patel, S., E. R. Malinowski,K Schostack, and P. Parekh,Evolutionary Factor Analysis ........ ........... 256
Patonay, G., L. Blyshak, S. L. Neal,I. M. Warner, and G. Nelson, EnhancedMultidimensional LuminescenceMeasurements Through CyclodextrinComplexation ................................. 438
Pattern Recognition Classification andIdentification of Trace Organic Pollutantsin Ambient Air from Mass Spectra ............... 281
Patterson, D. G., S. J. Smith andJ. S. Holler, Quantification ofToxic Chemicals in Selected HumanPopulations ................................... 412
Pavkovi(, Neven D., Nevenka Pavkwi(and Milenko Markovit, Precipitation ofNH4UO 2 POY4 .3HO-Solubility and StructuralComparison with Alkali Uranyl(2+)Phosphates .................................... 557
Pavkov4 Nevenka, Neven D. Pavkovi4and Milenko Markovi, Precipitation ofNH 4 UO2 PO4 .3H 2 0-Solubility and StructuralComparison with Alkali Uranyl(2+)Phosphates .................................... 557
PCB ....................................... 343PCB Identification System .......... .............. 298pesticide ....................................... 298, 343Peters, C. W., T. K Olson, and
C. M Gordon, A Fast-Neutron DiagnosticProbe ....................................... 484
Petersen, W., M. H. Salehi, T. Dietrich,A KnGchel, M. Bavday, N. Gurker, andP. Ketelsen, Synchrotron RadiationExcited Fluorescence Micro-AnalysisUsing a New Imaging Technique ....... ......... 379
Peterson, James C., and Peter Robinson,Recent Advances in the Analysis of PCBs andPesticides in Human Adipose Tissue ............. 343
Pharmaceutical Trace Analysis ........ ............ 242phase angle ..................................... 53phase angle standard .............. ............... 53phase meter ..................................... 53
Phase Meter Calibration at NBS ...................phenyltin Compounds ............................Phillips; John G., Donald W. Thayer,
Jay B. Fox, Jr., Ronald K Jenkins, andStanley A. Ackennan, Effects of IonizingRadiation on Nutrients in Foods.................
Phillips, J. H., C. A. Potera,P. M. Michalko, and J. H. Frost, The Use ofCryogenic Size Reduction to ImprovePurgeable Priority Pollutant Analysesin Soil Samples...............................
piston-gage .........Plant; Anne, L., Richard A. Durst, and
Laurie Locascio-Brown, Liposome-BasedFlow Injection Immunoassay System.............
plasma-mass spectrometry.......................plume ..........................................point source heater...............................Potera, C A., P. M. Michalko,
J. H. Frost, and J. H. Phillzps, The Use ofCryogenic Size Reduction to ImprovePurgeable Priority Pollutant Analysesin Soil Samples...............................
Powell, C. J., The Accuracy of SurfaceAnalyses....................................
Practical Uncertainty Limits to theMass Determination of a Piston-Gage Weight.................................
pre-column derivatization.......................precipitation ....................................Precipitation of NH4 UO2PO 4.3H 2 0-
Solubility and Structural ComparisonWith Alkali Uranyl(2+) Phosphates..............
Precision and Bias of Graphite FurnaceAnalysis of Environmental Samples ..............
pressure standards ...............................primary standards...............................Process Analytical Chemistry .....................Prospects for Trace Analysis in the
Analytical Electron Microscope .................purgeable priority pollutant analyses ...............
Q
quality assurance...............................quality assurance materials for the
analysis of environmental pollutants..............quality control for trace analysis...................Quality Control in Routine Instrumental
Epithermal Neutron Activation Analysisof Geological Samples.........................
quantification of food contaminants ................Quantification of Toxic Chemicals
in Selected Human Populations.................Quantitation of Arsenic Species in
Urine for Exposure Assessment Studies...........Quantitative Aspects of Glow Discharge
Mass Spectrometry. .......................Quantitative Compositional Mapping
on a Micrometer Scale .quantitative electron probe
microanalysisc.Quantitative Secondary Ion Mass
Spectrometry.
684
53301
364
292565
663433603603
292
387
565504557
557
307545545207
369292
232
237221
224365
412
315
426
518
509
510
Volume 93, Number 6, November-December 1988
Journal of Research of the National Institute of Standards and Technology
quantitative trace analysis inindustry today.................................
Quintiere, J. G., The Application of Flame SpreadTheory to Predict Material Performance..........
R
R..............................................radiance .......................................Radiometric Calibrations of Portable Sources in
the Vacuum Ultraviolet........................radiometry ......................................Range-Programming Stripping Voltammetry
for Determination of Some Metalsin Seawater ...................................
Rasberry, Stanley D., Accuracy inAnalysis: The Role of StandardReference Materials..........................
reaction interface ................................Recent Advances in the Analysis of PCBs and
Pesticides in Human Adipose Tissue.............reduced palladium ...............................reference parameters .............................real-time.......................................Real-Time Control System........................Relative Sensitivity and Quantitation
in Glow Discharge Mass Spectrometry:A Progress Report.............................
Reliable Measurement of Major, Minor, andTrace Elemental Nutrients......................
reliable temperature controller....................resonator .......................................response linearity ................................Rettberg. T. M., D. E. Shrader, and
L. M. Beach, Graphite Furnace AAS:Application of Reduced Palladium asa Chemical Modifier ...........................
reversed phase liquid chromatography..............Rice, C. D., R. G. Huggett, M. A. Unger, and
F. A. Espourteille, Determination of Tributyltinin the Marine Environment .....................
Richard, John J., and GregorA. Junk,Solid Phase Extraction on a Small Scale..........
Robinson, Peter, and James C Peterson,Recent Advances in the Analysis of PCBs andPesticides in Human Adipose Tissue.............
robotics and expert systems .......................robotics in radiation environments .................robotics in the laboratory .........................Role of the Robot in the Chemical
Laboratory, The...............................Role of Robotics in the Laboratory
of the 80s, The ................................Rosenberg, Rolf, and Maija Lipponen, Quality
Control in Routine Instrumental EpithermalNeutron Activation Analysis of GeologicalSamples ......................................
round robins ....................................Ruf, H., K Schorb, H. J. Ache, and
J. M. TorresLlosa, StrippingVoltammetric Assay of Trace Technetiumwith a TOPO Coated Glassy CarbonElectrode .....................................
Ruimin, Lit; and Bruce F. Field, An189 Improvement in the Reliability of
Standard Cell Enclosures.61 Rukkers, J. M., and T. J. Buckley, A Computer
Controlled Data Acquistion System forCombustion Calorimetric Experiments.
8521
533
145
S
Saisho, Hideo, Masataka Tanaka,21 Koichi Nakamura, and Eiji Mon,
7, 21 Determination of Traces of Uraniumand Thorium in MicroelectronicsConstituent Materials ........................... 398
296 Salehi, M. H., T. Dietrich, A. KnbchelM. Bavdaz, N. Gurker, P. Ketelsen, andW. Petersen, Synchrotron Radiation
213 Excited Fluorescence Micro-Analysis419 Using a New Imaging Technique .379
Sanderson, N. E., P. Charalambous,343 D. J. Hall, and R. Brown, Quantitative450 Aspects of Glow Discharge Mass326 Spectrometry .426539 Santoliaido, Patricia, M., The Determination539 of Trace Elements in Uranium Oxide @U308)
by Inductively Coupled Plasma EmissionSpectrometry and Graphite Furnace Atomic
392 Absorption Spectrometry .452Saunders, Robert D., John K Jackson,
354 Donald A. McSparron, and James H. Walker, The533 NBS Scale of Spectral Irradiance. 785 Savory, John, Michael Kinter, David A. Herold,7 Judy C. Hundley, and Michael R. Wils, Use
of High Resolution GC/MS for ObtainingAccuracy in Lipid Measurements ................ 331
Schaffer, R., L. T. Sniegosk, E. White V,450 M. J. Welch, A. Cohen, and P. Ellerbe, The161 Development of Definitive Methods for
Organic Serum Constituents ..................... 341Schantz, Michele (Miller), B. N. Barman, and
277 Daniel E. Martire, Partitioning ofAlkylbenzenes and Aliphatic Alcohols between
274 Hexadecane and Methanol-Water Mixtures 161Schorb, K, H. J. Ache, J. M. Torres Llosa,
and H. Ruf, Stripping Voltammetric343 Assay of Trace Technetium with a209 TOPO Coated Glassy Carbon Electrode .493268 Schostack; K, P. Parekh, S. Patel,191 and E. R. Malinowski, Evolutionary
Factor Analysis ............................... 256267 Scott, Donald R., William J. Dunn III, and
S. L. Emery, Pattern Recognition Classification191 and Identification of Trace Organic
Pollutants in Ambient Air from Mass Spectra ..... 281Scotter, M., J. R. Starti, M. J. Dennis,
N. Howardt, R. C. Massey, D. J. McWenny,224 and I. Parker, Ethyl Carbamate Analysis545 in Fermented Products: A Comparsion of
Measurements of Mass Spectrometry, ThermalEnergy Analyser, and Hall ElectrolyticConductivity Detector ........... .............. 249
SEC-ICP-MS approach ........................... 349493 secondary ion mass
spectrometry ....... 390, 510
685

Volume 93, Number 6, November-December 1988
Journal of Research of the National Institute of Standards and Technology
Seegopaid, Purneshwar, and Maria C. L. Wdlliams,Characterization of High Purity Silicides .........
Seegopaul, Purneshwar, AnalyticalChemistry and Material Purityin the Semiconductor Industry ..................
semiconductor industry...........................sensitivity and quantitation.......................Sequential Automated Analysis System
for Lower Oxygenated OrganicCompounds in Ambient Air.....................
Sheffield, Ann E., Lloyd A. Currie,and George A. Klouda, Trace RadiocarbonAnalysis of Environmental Samples ..............
Shpol'skii Spectroscopy ..........................Shrader, D. E., L. M. Beach, and
T. M. Rettberg, Graphite Furnace AAS:Application of Reduced Palladium asa Chemical Modifier ...........................
Sieck, B., W. E. Brown, M. S. Tung,and N. Eidelman, Octacalcium. PhosphateSolubility Product from 4 to 37 'C ...............
SIMS ..........................................single neurons ...................................SIRIS ..........................................Slavin, W., Accuracy in Furnace
Atomic Absorption Spectroscopy...............slit-scattering function ............................small scale fire tests ..............................Smith, J., S. Ahuja, and G. Thompson,
Trace/Ultratrace Analyses of UnstableCompounds: Investigations on Hydrazobenzeneand Azobenzene .............................
Smith, S. J., J. S. Holler, andD. G. Patterson, Quantification ofToxic Chemicals in Selected HumanPopulations ...................................
Sniegoski, L. T., E. White V, andG. D. Byrd, Determination of 3-QuinuclidinylBenzilate in Urine..............................
Sniegoski, L. T., E. White V, M. J. Welch,A. Cohen, P. Ellerbe, and R. Schaffer,The Development of Definitive Methods forOrganic Serum Constituents....................
Sniegoski, L. T., J. M. Miller, E. White V,and P. Ellerbe, An Isotope Dilution MassSpectrometric (IDMS) Method for theDetermination of Vitamin C in Milk .............
Sodium Taurocholate Micelles inFluorometrix Analysis.........................
Solid Phase Extraction on a Small Scale............solid-state reagents..............................solubility .......................................solubility product................................Solvent-Free Injection in Supercritical
Fluid Chromatography Using SinteredGlass Deposition.............................
Solymosi, Jozsef, Peter Zagyvaw, andLajos Gyargy Nagy, A Uniform Concept forError Estimation in Gamma-RaySpectrometry ...............................
Some Applications of Isotope Analysisof Lead in Food by ICP-MS ....................
Some Atomic Asborption SpectrometricApplications to Clinical-BiomedicalTrace Metal Analyses ..........................
Spaar, M. T., D. W. Beekman, E. H. Taylor,239 V. Lorch, L. J. Moore and J.E. Parks,
Ultra-Trace Elemental and IsotopicQuantification for Neonatal Nutrition
396 Studies.396 Spaar, M. T., L. J. Moore, W. M. Fairbank, Jr.,392 J. M. R. Hutchinson, and J. E. Parks, Direct
Solids Analysis Using SputterInitiated Resonance Ionization
299 Spectroscopy (S[RIS).spectral irradiance .speed of sound .
289 spherical resonator.441 Spiegelman, Clifford H., Robert L. Watters, Jr.,
and Raymond J. Carroll, HeteroscedasticCalibration Using Analyzed ReferenceMaterials as Calibration Standards.
450 sputter initiated resonanceionization spectroscopy.
square wave voltauetry...613 St. Claire, R. L., III, J. G. White,499 P. R. DlauneskA J. S. M. de Wit,403 J. W. Jorgenson, and R. T. Kennedy,383 Open Tubular Liquid Chromatography
and the Analysis of Single Neurons.445 Stable Isotope Dilution GC/MS for the
7 Quantification of Food Contaminants.61 standard cell enclosure.
standards.standards and chemometrics.standards (radiometric).
344 standard reference materials.Stanley, M. S., K L. Duffin,
J. C. Dunphy, and K L. Busch, BiochemicalApplications of Chromatography/SIMS
412 Startin, J. R., M. J. Dennis, N. Howartz,R. C. Massey, D. J. McWeeny, L Parker, andM. Scotter, Ethyl Carbamate Analysis
293 in Fermented Products: A Comparison ofMeasurements of Mass Spectrometry, ThermalEnergy Analyser, and Hall ElectrolyticConductivity Detector.
341 Startin, James R., and John Gilbert,Stable Isotope Dilution GC/MS for theQuantification of Food Contaminants.
static and flow systems .
367 Statistical Models in Quality Control forTrace Analysis .443 Steiner, Bruce, Masao Kuriyama,274 Ronald C. Dobbyn, and Uri Laor,501 Diffraction Imaging (Topography) with613 Monochromatic Synchrotron Radiation.
557 613 Stevens, Robert K, Annular Denuders and Filter5'7, 613 Packs Designed to Measure Ambient Levels of
Acidic and Basic Air Pollutants .
655 Stripping Voltammetric Assay of TraceTechnetium with a TOPO Coated GlassyCarbon Electrode.
Studies of Limit of Detection on481 2,4,6-Trinitrotoluene (TNI) by
Mass Spectrometry.464 submicrogram samples.
Subramanian, K S., Determination of Chromium (M)and Chromium (VI) by Ammonium Pyrrolidine
334 Dithiocarbamate-Methyl Isobutyl Ketone-FurnaceAtomic Absorption Spectrometry.
686
328
3837
8585
264
383487
403
365533
7193
21213
499
249
365253
221
577
283
493
428245
305

Volume 93, Number 6, November-December 1988
Journal of Research of the National Institute of Standards and Technology
sunlight-induced transient species ..................Supercritical fluid chromatography ................Supercritical Fluid Chromatography:
Application to Trace Analysis...................supercritical fluids ...............................surface analyses.................................surface effects...................................surface waters...................................Synchrotron Radiation Excited Fluorescence
Micro-Analysis Using a New ImagingTechnique ....................................
synchrotron topography ..........................
T
Tanaka, Masataka, Koichi Nakiamura,Eiji Mori, and Hideo Saisho,Determination of Traces ofUranium and Thorium in MicroelectronicsConstituent Materials..........................
Tang, C. P., M. R. Lee, S. C. Chang, andT. S. Kao, Studies of Limit ofDetection on 2,4,6-Trinitrotoluene(TNT) by Mass Spectrometry ...................
Tanner, James, Wayne Wolf, Rolf Zeisler,and Iyengar Venkatesh, Development ofMulti-Purpose Biological ReferenceMaterials .....................................
Taylor, John K, The Importance of QualityAssurance in Trace Analysis ....................
Taylor, H. E., and J. R. Garbarino,Assessment of the AnalyticalCapabilities of InductivelyCoupled Plasma-Mass Spectrometry..............
Taylor, E. H., V. Lorch, L. J. Moore, J. E. Parks,M. T. Spaar, and D. W. Beekaman, Ultra-TraceElemental and Isotopic Quantification forNeonatal Nutrition Studies......................
Technical Difficulties Associated with theFormation of Carbon-11 Labelled CarboxylicAcids ........................................
temperature .....................................temperature protection circuit .....................temperature-regulated oven .......................Thayer, Donald W., Jay B. Fox, Jr.,
Ronald K Jenkins, Stanley A. Ackenran,and John G. Phillips, Effects of IonizingRadiation on Nutrients in Foods.................
thermal energy analyser ..........................thermal radiation ................................thermistor ......................................thermometry ....................................Thompson, R. E., J. R. Tuschall, and T. M. Anderson,
U.S. EPA Reference Standards and QualityAssurance Materials for the Analysis ofEnvironmental Pollutants......................
Thompson J. N., Accurate Measurement ofVitamins in Foods and Tissues..................
Thompson, G., J. Smith, and S. Ahuja,Trace/Ultratrace Analyses of UnstableCompounds: Investigations on Hydrazobenzeneand Azobenzene .............................
thorium and uranium in microelectronicsconstituent materials ...........................
285 Tilford, Charles R., International655 Comparisons of Pressure Standards:
A Status Report ................. .............. 545409 TNT .................................... 428655 Tomboidian, P., S. M. Walters, and387 K K Brown, Trace Level Quantitation565 of Phenyltin Compounds Using HPTLC .......... 301285 TOPO coated glassy carbon electrode .............. 493
Torres Llosa, J. M., H. Ruf, K Schorb,and H. J. Ache, Stripping Voltammetric
379 Assay of Trace Technetium with a TOPO577 Coated Glassy Carbon Electrode ....... ......... 493
toxic chemicals .................................. 412Trace Analyses of Impurities in Povidone
by Square Wave Voltammetry ................... 487trace analysis .175, 409trace analysis, accuracy ........................... 217Trace Analysis by Degrees:
An Academic Perspective ...................... 187398 trace analysis, inorganic ........... ............... 419
Trace Analysis of Aromatic Compoundsin Natural Samples by Shpol'skUSpectroscopy .................................. 441
428 trace analysis, pharmaceutical ........ ............. 242trace analysis, quality assurance .................... 232Trace Biogenic Amine Analysis with
Pre-Column Derivatization and with
360 Fluorescent and ChemiluminescentDetection in HPLC .504
232 trace characterization of highpurity materials .400
trace constituents .390trace element analysis .318
433 Trace Element Determinations in BiologicalsUsing Atomic Absorption Spectrometry .350
Trace Element Speciation in Food: A CombinedEnzymolysis-SEC-ICP-MS Approach .349
328 trace elements in MethamphetamineHydrochloride ................................. 469
trace elements in Uranium Oxide (U30s) ............ 452
338 trace level, accuracy .............. ............... 52085 Trace Level Quantitation of Phenyltin
533 Compounds Using HPTLC ........ ............. 301533 trace metal analyses, clinical-biomedical ...... ...... 334
trace metals in marine environments ................ 321trace metals in precipitation .......... ............. 312trace organic pollutants ........................... 281
364 trace quantitative analysis ......................... 419249 Trace Radiocarbon Analysis of Environmental61 Samples ...................................... 289
603 trace technetium ................................. 49385 Trace/Ultratrace Analyses of Unstable
Compounds: Investigations on Hydrazobenzeneand Azobenzene ............................... 344
Transferring Accuracy to the Trace
237 Level and Then to the Field ........ ............ 520trends ....................................... 321
362 tributyltin ....................................... 277Truler, J. P. M., T. J. Edwards, J.B. Mehl,
R. S. Davis, and M. R. Moldover, Measurement ofthe Universal Gas Constant R Using a
344 Spherical Acoustic Resonator ........ ........... 85Tung, M. S., N. Eidelman, B. Sieck,
398 and W. E. Brown, Octacalcium PhosphateSolubility Product from 4 to 37 C .613
687

Volume 93, Number 6, November-December 1988
Journal of Research of the National Institute of Standards and Technology
Turgel, Raymond S., Phase MeterCalibration at NBS.............................
Tuschall, J. R., T. M. Anderson, andR. E. Thompson, U.S. EPA Reference Standardsand Quality Assurance Materials for theAnalysis of Environmental Pollutants.............
two dimensional metrology .......................
U
ultratrace analysis...............................Ultra-Trace Elemental and Isotopic
Quantification for Neonatal NutritionStudies .......................................
ultraviolet ......................................Umtna, Mirtha, Jess Waller, Mansukh Wani,
Carol Whisnant, and Edgar Cook-, Enzyme-Enhanced Electrochemical Immunoassay forPhenytoin...................................
Unger, M. A., F. A. Espourteille, C. D. Rice,and R. G. Huggett, Determination of Tributyltinin the Marine Environment .....................
Uniform Concept for Error Estimationin Gamma-Ray Spectrometry, A.................
unit-cell dimensions ..............................Universal Gas Constant..........................unstable compounds............................uranium oxide @U308).............................
uranium and thorium in microelectronicsconstituent materials ...........................
U.S. EPA Reference Standards and QualityAssurance Materials for the Analysis ofEnvironmental Pollutants......................
Use of Cryogenic Size Reduction toImprove Purgeable Priority PollutantAnalyses in Soil Samples, The...................
use of GC-GC-high relolution MS toidentify photo- and oxidativedegradation products of BPA-Polycarbonate ......
Uses of High Resolution GC/MS for ObtainingAccuracy in Lipid Measurements...............Polycarbonate ..............................
V
vacuum standards...............................vacuum ultraviolet..............................Van Born, W., P. Van Espen, and
K Janssens, Increased Accuracy in theAutomated Interpretation of Large EPMAData Sets by the Use of an Expert System.....
Van Espen, K Janssens, and W. Van Borm,Increased Accuracy in the AutomatedInterpretation of Large EPMA Data Setsby the Use of an Expert System .........
Vanballenberghe, L., A. De Kesel, J. Hoste,B. Wallaeys, J. Vandenhaute, and J. Versieck,Biological Reference Materials for TraceElement Analysis: What is New?.........
Vandenhaute, J., J. Versieck,L. Vanballenberghe, A. De Kesel,J. Hoste, and B. Wallaeys, BiologicalReference Materials for Trace ElementAnalysis: What is New? ........................
Veber, M., V. Francetic, R. Durst,53 and S. Gorniscek, Electrochemical
Studies of Dithiocarbamates andRelated Compounds ............................ 496
Versieck; J., L. Vanballenberghe, A. De Kesel,237 J. Hoste, B. Wallaeys, and J. Vandenhaute,41 Biological Reference Materials for
Trace Element Analysis: What is New? ...... .... 318vitamins in foods and tissues .......... ............ 362voltammetric assay of trace technetium ............. 493
462 Voltammetric Sensors Using ChemicallyActive Electrode Materials ..................... 488
voltammetry .................................... 296, 48932821
Walker, James H., Robert D. Saunders,John K Jackson, and Donald A. McSparron, The
659 NBS Scale of Spectral Irradiance.Wallaeys, B., J. Vandenhaute, J. Versieck,
L. Vanballenberghe, A. De Kesel, and277 J. Hoste, Biological Reference Materials
for Trace Element Analysis: What is New?.481 Waller, Jess; Mansukh Wani, Carol Whisnant,557 Edgar Cook, and Mirtha Umana, Enzyme-Enhanced85 Electrochemical Immunoassay for Phenytoin.
344 Walters, S. M., K K Brown, and452 P. Tomboulian, Trace Level Quantitation
of Phenyltin Compounds Using HPTLC.398 Wang, C., T. Kuwana, T. Kawasaki, and
0. Wong, Trace Biogenic AmineAnalysis with Pre-Column Derivatization
237 and with Fluorescent and ChemiluminescentDetection in HPLC.
Wang, Joseph, Adsorptive Stripping292 Voltammetry-A New Electroanalytical
Avenue for Trace Analysis.Wang, Y. L., R. Levi-Setti, and
394 J. Chabala, Imaging Microanalysisof Materials With a Finely Focused
331 Heavy Ion Probe .394 Wani, Mansukh, Carol WHisnant, Edgar Cook,
Mirtha Umn4a, and Jess Waller, Enzyme-Enhanced Electrochemical Immunoassay forPhenytoin.
545 Warner, I. M., G. Nelson, G. Patonay,
21 L. Blyshak, and S. L. Neal, EnhancedMultidimensional LuminescenceMeasurements Through CyclodextrinComplexation .
260 Watanabe, Ikuo, Sequential AutomatedAnalysis System for Lower OxygenatedOrganic Compounds in Ambient Air.
water.260 water vapor.
Watters, Robert L., Jr., Raymond J. Carroll,and Clifford H. Spiegelman, HeteroscedasticCalibration Using Analyzed ReferenceMaterials as Calibration Standards.
318 waveform analysis.Wegscheider, Wolfhard. Hugo M. Ortner,
and Markus Michaelis, ImprovingAccuracy in Graphite Furnace Atomic
318 Absorption Spectrometry ThroughPeak Shape Monitoring.
7
318
659
301
504
489
377
659
438
299603551
264643
467
688
W

Volume 93, Number 6, November-December 1988
Journal of Research of the National Institute of Standards and Technology
Wegscheider, Wolfhard, Chemometricsin Europe: Selected Results .....................
Weh/neyer, Kenneth R., Matthew J. Doyle,D. Scott Wright, H. Brian Halsall,William R. Heineman, and Sarah H. Jenkins,Electrochemical Enzyme Immunoassay...........
Wehry, E. L., Fluorescence SpectrometricDetermination of NonfluorescentCompounds via Molecular Fragmentation.........
weighing .......................................weighing errors..................................Welch, B. E., and R. S. Davis, Practical
Uncertainty Limits to the MassDetermination of a Piston-Gage Weight ..........
Welch, M. J., A. Cohen, P. Ellerbe, R. Schaffer,L. T. Sniegoski, and E. White V, The Developmentof Definitive Methods for Organic SerumConstituents.................................
Westgar4 James O., Design of Cost-EffectiveQC Procedures for Clinical Chemistry............
Whisnant, Carol, Edgar Cook, Mirtha Umnzna,Jess Waller, and Mansukh Wani, Enzyme-Enhanced Electrochemical Immunoassayfor Phenytoin .................................
White, D. R., J. F. Alofs and D. E. Hagen,Condensation Method for HumidityMeasurement in the UMR CloudSimulation Chamber ...........................
White, E., V, G. D. Byrd, andL. T. Sniegoski, Determination of 3-Quinuclidinyl Benzilate in Urine .................
Whute, E., V, M. J. Welch, A. Cohen,P. Ellerbe, R. Schaffer, and L. T. Sniegoski,The Development of Definitive Methods forOrganic Serum Constituents....................
White, E., V, P. Ellerbe, L. T. Sniegoskiand J. M. Miller, An Isotope Dilution MassSpectrometric (IDMS) Method for theDetermination of Vitamin C in Milk .............
White, J. G., P. R. Dlurneski, J. S. M. de Wit,J. W. Jorgenson, R. T. Kennedy, andR. L. St. Claire III, Open Tubular LiquidChromatography and the Analysis ofSingle Neurons ................................
Wilk Harlan R., Steven L. Monfre,Steven D. Brown, and Todd Q. Barker,Multicomponent Analysis in Static andFlow Systems Using Digital Filters ..............
Williams, D. B., Prospects for TraceAnalysis in the Analytical ElectronMicroscope ...................................
Williams, Maria C. L., and Seegopaul Purneshwar,Characterization of High Purity Silicides .........
Wls; Michael R., John Savory, Michael Kinter,David A. Herold, and Judy C. Hundley, Useof High Resolution GC/MS for ObtainingAccuracy in Lipid Measurements...............
Winer, Arthur M., Janet Arey,Barbara Zieunska, and RogerAtkinson,Analysis of Gaseous and Particle-AssociatedPAH and Nitroarenes in Ambient Air ............
Wolf, Wayne, Rolf Zeisler, Venkatesh Iyengar,and James Tanner, Development of Multi-Purpose Biological Reference Materials...........
Wong, 0., C. Wang, T. Kuwana, and257 T. Kawasaki, Trace Biogenic Amine
Analysis with Pre-Column Derivatizationand with Fluorescent and ChemiluminescentDetection in HPLC .
491 Wright, D. Scott, H. Brian Halsall,William R Heineman, Sarah H. Jenkins;Kenneth R. Wehmeyer, and Matthew J. Doyle,
437 Electrochemical Enzyme Immunoassay.565 Wright, John C., High Resolution565 Nonlinear Laser Spectroscopy.
565 x
xenobiotics.XQQ instruments .
341 x-ray diffraction pattern .
218Y
Yeung, Edward S., Applications659 of Lasers in Bioanalytical
Chemistry ....................................
551 zZagyvai, Peter, Lajos Gyorgy Nagy, and
293 Jozsef Sdymosi, A Uniform Concept forError Estimation in Gamma-RaySpectrometry.
Zeeman Effect .341 Zeisler, Rolf, Venkatesh Iyengar, James Tanner,
and Wayne Wolf, Development of Multi-Purpose Biological Reference Materials.
Zhang, Y., I. Cook; A. Cox, A.R. Date,367 Y. Y. Cheung, and C W. McLeod, Flow
Injection-Inductively CoupledPlasma Spectrometry: A NewStrategy for Ultratrace Analysis.
Zielinska, Barbara, Roger Atkinson,403 Arthur M. Winer, and JanetArey, Analysis of
Gaseous and Particle-Associated PAH andNitroarenes in Ambient Air .
253
369
239
331
279
360
689
504
491
440
419431557
502
481323
360
462
279