volume 4 number 2 december 2016tsm.ac.in/wp-content/uploads/2019/08/tsm business review... ·...
TRANSCRIPT
ISSN 2348 - 3784
Volume 4 Number 2 December 2016
Articles
Ÿ
Technology in Rural Business by Rural People in Madurai District
- N Asha and R Vetrickarthick
Ÿ How Receptive Consumers are Towards Green Advertisements: A Case of Western Uttar Pradesh, India
- Parikshit Joshi and Richa Rastogi
Ÿ Understanding Financial Inclusion in India: A Case Study of Sattur Taluk,
Tamil Nadu
- R Neelamegam
Ÿ Octapace Culture Profiling - A Study Among Employees Working in a Legal
Compliance Firm in Madurai
- N Suga Dharshini and Kajal J Mehta
Ÿ Determinants of Demand for Money (M1) Using Cointegration Approach- K P Radhika and Dr P Ambiga Devi
Perspective
Ÿ Goods and Services Tax (GST): A Paradigm Shift in Indian Tax System- Vidya Suresh and Bipasha Maity
Ÿ A Study on Consumer Perception of E-Tailing Services for Electronic Goods in Kolkata
- Biswajit Roy
A Research on Examining Critical Success Factors Towards the Application of Green
Indexed in ProQuest, EBSCO, Google Scholar

TSM Business Review INTERNATIONAL JOURNAL OF MANAGEMENT
(A Double Blind, Peer Reviewed Bi- Annual Journal)
Volume 4 Number 2 December 2016
Chief Editor Prof. Gautam Ghosh
Pambanswamy Nagar Thiruparankundram Madurai Tamil Nadu www.tsm.ac.in

TSM Business Review (TBR) is the official bi-annual publication of Thiagarajar School of Management, Madurai, India. TBR is published since 2013 regularly during the months of June and December. It provides an open platform for reading and sharing articles, research papers and case studies that have a high impact on the management field. It has a special emphasis on management issues that are relevant to emerging economies and aims at providing a link between academic research and practical implications. CONTACT ADDRESS Chief Editor TSM Business Review Office Thiagarajar School of Management Pambanswamy Nagar, Thiruparankundram, Madurai – 625005, India Email Journal office: [email protected] Editor: [email protected] DISCLAIMER The authors are solely accountable for the contents of the papers compiled in this volume. The publishers or editors do not take any responsibility for the same in any way. Errors, if any, are purely involuntary and readers are requested to communicate such errors to the editors or publishers to avoid discrepancies in future. PUBLISHING CONSULTANCY Shanlax Press 61, TPK Main Road, Vasantha Nagar, Madurai – 625 003 E-mail: [email protected] Web: www.shanlaxpress.com
TSM Business Review INTERNATIONAL JOURNAL OF MANAGEMENT (A Double Blind, Peer Reviewed, Bi- Annual Journal)
Volume 4 Number 2 December 2016
Chief Editor Prof. Gautam Ghosh, Director, TSM, Madurai
Associate Editors Dr. Vidya Suresh, Associate Professor, TSM, Madurai Dr. Bipasha Maity, Associate Professor, TSM, Madurai
Editorial Board Dr. Kamal Ghose, Director, International Relations, Lincoln University, New Zealand Dr. K. Prakash Vel, Associate Professor, University of Wollongong, Dubai Dr. Sethu. G, Professor, IIM Tiruchirappalli Dr. M. Ramakrishnan, Sr., VP- HR Loyal Textiles Ltd., Chennai Dr. Sanjeev Prashar, Professor, IIM Raipur
Advisory Board
Shri. B. T. Bangera, MD, Hi-Tech Arai Limited, Madurai Shri. Joseph Zachariah, Director, Vikaasa School, Madurai Dr. R. Kannan, Prof. & Head, Department of Sociology, Madurai Kamaraj University, Madurai Mr. Nagaraj K, MD, Aparajitha Corporate Services, Madurai Mr. Srinivasa Varadhan, President, TVS Tyres, Madurai Prof. A. Uma Rani, Chief Executive Officer, Kalanjiam Foundation, Madurai Dr. N. Chandrasekaran, VP- Corporate Affairs, Take Solutions Ltd., Chennai

EDITORIAL
This volume is a collation of six research articles and one perspective. Topics from diverse areas have made it to this volume. Biswajit has contributed in the area of retail marketing and talks about consumer perception of e-tailing services for electronic goods with reference to Kolkata. Impact of green technology is studied by Asha and Vetrickarthick, whereas green marketing by Parikshit Joshi and Richa Rastogi. Financial inclusive growth in
Sattur Taluk, Tamil Nadu is studied by Neelamegam. Suga Dharshini and Kajal Mehta did a qualitative research in OB area where they discussed cultural ethos using OCTAPACE (openness, confrontation, trust, authenticity, pro-action, autonomy, collaboration and experimentation) profile. We have two contributions from the area of macroeconomics; one is on determinants of demand for money (M1) using cointegration approach by Radhika and Ambiga Devi and the other one is a perspective on GST by Bipasha Maity and Vidya Suresh. From this issue onwards, we are providing DOI that is Digital Object Identifier for all articles, cases, teaching notes and perspectives of TSM Business Review. Authors of previous issues of TBR who have been associated with us in the above mentioned form of contents were also provided with DOI. The efforts of being associated with us shall not go vain. Congratulations to the contributors of this issue. I wish you a happy scholarly reading.
Gautam Ghosh

CONTENTS Articles…. A Study on Consumer Perception of E-Tailing Services for Electronic Goods in Kolkata....................................................................................................................................001 Biswajit Roy The term “retailing” also has been continuously changing its meaning and scope as the organization progress. With the advent of internet and the World Wide Web, a lot of effort has been given to discover new and sophisticated e-tailing approaches than the traditional approach of retailing. In fact the entire world has become a virtual market for a common man nowadays, since it can provide faster and easier way of buying and selling of goods and services. The study investigates consumer perception on e-Service quality of e-tailing activities with reference to Kolkata city. A Research on Examining Critical Success Factors Towards the Application of Green Technology in Rural Business by Rural People in Madurai District.........................014 N Asha and R Vetrickarthick This paper analyses the interaction of two areas: green technology and rural business persons and presents a finding on Critical Success Factors (CSFs) in the implementation of Enterprise Resource Planning (ERP) across rural areas in and around Madurai. How Receptive Consumers are Towards Green Advertisements: A Case of Western Uttar Pradesh, India..............................................................................................................023 Parikshit Joshi and Richa Rastogi Green advertising is becoming increasingly popular in today's society across product categories and sectors. Many researchers have examined consumer receptivity to green ad claims and the effects of claim presence and claim type on ad credibility. But a question still prevails that if consumers have positive attitudes towards environmental protection and they are willing to accept green marketing, why that doesn’t translate into positive ad response and consumption behaviors. This study aims at identifying how individual characteristics may influence consumers to be more or less receptive to ecologically themed ad claims.
Understanding Financial Inclusion in India: A Case Study of Sattur Taluk, Tamil Nadu.............................................................................................................................041 R Neelamegam Financial inclusive growth is said to be real only when it has registered an all inclusive growth, namely, all the strata of the society including the vulnerable group is brought to the ambit of financial inclusion. The present paper sheds light on criteria / indicators of financial inclusion with special reference to Sattur Taluk, Tamil Nadu. Octapace Culture Profiling - A Study Among Employees Working in a Legal Compliance Firm in Madurai..............................................................................................049 N Suga Dharshini and Kajal J Mehta Every human being has certain personality traits which help them stand apart from the crowd. No two individuals behave in a similar way. In the same way organizations have certain values, policies, rules and guidelines which help them create an image of their own. An individual working for any organization with a firmly established culture will be trained on values, beliefs, and expected behaviors of that organization. This study is an attempt to understand the cultural ethos using OCTAPACE (openness, confrontation, trust, authenticity, pro-action, autonomy, collaboration and experimentation) profile (studies how much each ethos is valued and believed by the individuals) in a legal compliance firm in Madurai. Determinants of Demand For Money (M1) Using Cointegration Approach.................................................................................................................................054 K P Radhika and Dr P Ambiga Devi Estimating the demand for money in an economy and understanding its relationship with various macroeconomic variables is an essential element in the planning of the issue and distribution of currency. This paper attempts to analyze the major determinants of demand for money via M1 for India for the period 2005-06 to 2014-15. Perspective....... Goods and Services Tax (GST): A Paradigm Shift in Indian Tax System.....................................................................................................................................067 Vidya Suresh and Bipasha Maity The political and economic case for GST is straight and simple: Income is taxed irrespective of source and use and therefore, consumption should also be taxed on the same principle. India has witnessed many reforms in indirect taxes over the past two decades with the replacement of state sales taxes by Value Added Tax (VAT) in 2005. This paper attempts to provide descriptive analysis of GST with reference to India.

Article ISSN: 2348-3784
Biswajit Roy, Assistant Professor, Future Business School, Kolkata. Email: [email protected], Phone: 09883015054, Mailing Address: 18N, Kalupara Lane, Dhakuria, Kolkata – 700031, (Corresponding Author)
A Study on Consumer Perception of E-Tailing Services for Electronic Goods in Kolkata
Digital Object Identifier: 10.23837/tbr/2016/v4/n2/128858
Biswajit Roy Abstract The term “retailing” also has been continuously changing its meaning and scope as the organization progress. With the advent of internet and the World Wide Web, a lot of effort has been given to discover new and sophisticated e-tailing approaches than the traditional approach of retailing. In fact the entire world has become a virtual market for a common man nowadays, since it can provide faster and easier way of buying and selling of goods and services. Retailing is emerging as a big service industry in India, following the footsteps of the other parts of the world.
E-tailing is the concept of selling of retail goods using electronic media, in particular, the internet (as well as fax or phone or Digital TV), to a place defined by the customer (Sharma, 2009).
The study investigates consumer perception on e-Service quality of e-tailing activities. Service quality refers to an attitude formed by a long term overall evaluation of a firm’s performance. It is closely related to customer satisfaction. It can be said that satisfaction assists consumers in formulating a revised opinion about their service quality perception (Srinivasan, 2010).Customer satisfaction could be defined as a comparison of perceptions and predicted service expectations, in association with various marketing activities.
The present study covers the different perceptual factors of e-tailing. The study is important for measuring the e-service quality and satisfaction level of e-customers. It provides an outline to revalidate different dimensions and factors involved with e-retailing and can help to find out new model in e-retailing by identifying new dimensions and factors. For the purpose of measure e-customers’ satisfaction level for electronics goods, a satisfaction index is developed in the paper. For identifying perceptual dimensions, confirmatory factor analysis is applied with multiple regression analysis. The study is limited to the geographical region of Kolkata city only and no forward or backward linkages of e-retailing is taken into consideration.
Keywords: e-tailing, Consumer perception, Customer satisfaction, Factor analysis, Regression 1. Introduction E-business is getting extensive growth, on the consequence of it, the consumer experience, expectations of online businesses are increasing day by day (Grewal, H et al.
2 A Study on Consumer Perception of E-Tailing Services for Electronic Goods in Kolkata
TSM Business Review, Vol. 4, No. 2, December 2016
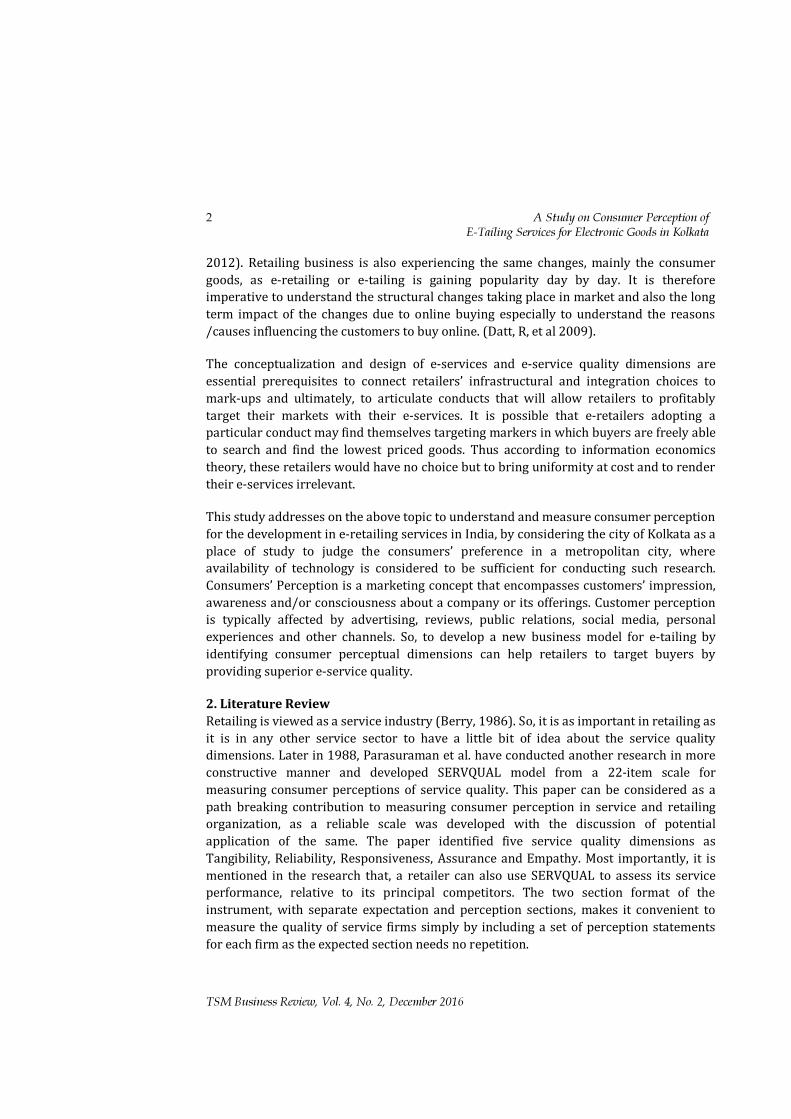
2012). Retailing business is also experiencing the same changes, mainly the consumer goods, as e-retailing or e-tailing is gaining popularity day by day. It is therefore imperative to understand the structural changes taking place in market and also the long term impact of the changes due to online buying especially to understand the reasons /causes influencing the customers to buy online. (Datt, R, et al 2009). The conceptualization and design of e-services and e-service quality dimensions are essential prerequisites to connect retailers’ infrastructural and integration choices to mark-ups and ultimately, to articulate conducts that will allow retailers to profitably target their markets with their e-services. It is possible that e-retailers adopting a particular conduct may find themselves targeting markers in which buyers are freely able to search and find the lowest priced goods. Thus according to information economics theory, these retailers would have no choice but to bring uniformity at cost and to render their e-services irrelevant. This study addresses on the above topic to understand and measure consumer perception for the development in e-retailing services in India, by considering the city of Kolkata as a place of study to judge the consumers’ preference in a metropolitan city, where availability of technology is considered to be sufficient for conducting such research. Consumers’ Perception is a marketing concept that encompasses customers’ impression, awareness and/or consciousness about a company or its offerings. Customer perception is typically affected by advertising, reviews, public relations, social media, personal experiences and other channels. So, to develop a new business model for e-tailing by identifying consumer perceptual dimensions can help retailers to target buyers by providing superior e-service quality. 2. Literature Review Retailing is viewed as a service industry (Berry, 1986). So, it is as important in retailing as it is in any other service sector to have a little bit of idea about the service quality dimensions. Later in 1988, Parasuraman et al. have conducted another research in more constructive manner and developed SERVQUAL model from a 22-item scale for measuring consumer perceptions of service quality. This paper can be considered as a path breaking contribution to measuring consumer perception in service and retailing organization, as a reliable scale was developed with the discussion of potential application of the same. The paper identified five service quality dimensions as Tangibility, Reliability, Responsiveness, Assurance and Empathy. Most importantly, it is mentioned in the research that, a retailer can also use SERVQUAL to assess its service performance, relative to its principal competitors. The two section format of the instrument, with separate expectation and perception sections, makes it convenient to measure the quality of service firms simply by including a set of perception statements for each firm as the expected section needs no repetition.
A Study on Consumer Perception of E-Tailing Services for Electronic Goods in Kolkata 3
TSM Business Review, Vol. 4, No. 2, December 2016
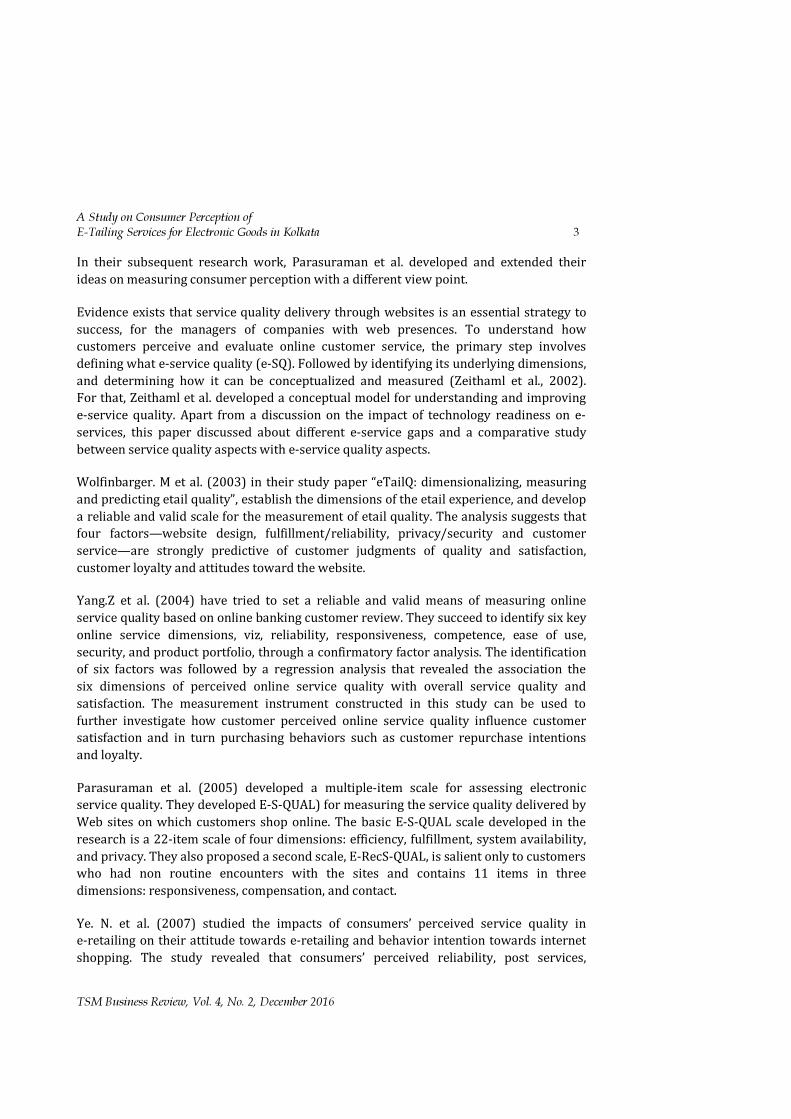
In their subsequent research work, Parasuraman et al. developed and extended their ideas on measuring consumer perception with a different view point. Evidence exists that service quality delivery through websites is an essential strategy to success, for the managers of companies with web presences. To understand how customers perceive and evaluate online customer service, the primary step involves defining what e-service quality (e-SQ). Followed by identifying its underlying dimensions, and determining how it can be conceptualized and measured (Zeithaml et al., 2002). For that, Zeithaml et al. developed a conceptual model for understanding and improving e-service quality. Apart from a discussion on the impact of technology readiness on e-services, this paper discussed about different e-service gaps and a comparative study between service quality aspects with e-service quality aspects. Wolfinbarger. M et al. (2003) in their study paper “eTailQ: dimensionalizing, measuring and predicting etail quality”, establish the dimensions of the etail experience, and develop a reliable and valid scale for the measurement of etail quality. The analysis suggests that four factors—website design, fulfillment/reliability, privacy/security and customer service—are strongly predictive of customer judgments of quality and satisfaction, customer loyalty and attitudes toward the website. Yang.Z et al. (2004) have tried to set a reliable and valid means of measuring online service quality based on online banking customer review. They succeed to identify six key online service dimensions, viz, reliability, responsiveness, competence, ease of use, security, and product portfolio, through a confirmatory factor analysis. The identification of six factors was followed by a regression analysis that revealed the association the six dimensions of perceived online service quality with overall service quality and satisfaction. The measurement instrument constructed in this study can be used to further investigate how customer perceived online service quality influence customer satisfaction and in turn purchasing behaviors such as customer repurchase intentions and loyalty. Parasuraman et al. (2005) developed a multiple-item scale for assessing electronic service quality. They developed E-S-QUAL) for measuring the service quality delivered by Web sites on which customers shop online. The basic E-S-QUAL scale developed in the research is a 22-item scale of four dimensions: efficiency, fulfillment, system availability, and privacy. They also proposed a second scale, E-RecS-QUAL, is salient only to customers who had non routine encounters with the sites and contains 11 items in three dimensions: responsiveness, compensation, and contact. Ye. N. et al. (2007) studied the impacts of consumers’ perceived service quality in e-retailing on their attitude towards e-retailing and behavior intention towards internet shopping. The study revealed that consumers’ perceived reliability, post services,
4 A Study on Consumer Perception of E-Tailing Services for Electronic Goods in Kolkata
TSM Business Review, Vol. 4, No. 2, December 2016
pay-delivery easiness and personalized care have impact over consumers’ attitude towards online retailing. And this attitude has a strong impact on consumers’ online shopping intention. Earlier in another research paper “Customers’ perceived service quality of internet retailing”, YE, N. et al. (2005) identified eight dimensions of e-retailing service quality consumer perception. Applying a confirmatory factor analysis, they have identified reliability, convenience, diversify, availability, responsiveness, empathy, post-service and security as eight consumer perception dimensions. Li. H et al (2008) investigated e-service quality dimensions from both e-service provider’s and customer’s perspectives. They proposed a 10-dimension scale for measuring e-service quality: Website design, reliability, fulfillment, security, responsiveness, personalization, information and empathy from the e-service provider’s perspective, and trust and experience from the customer’s perspective. 3. Objectives The basic objectives of this study are enumerated below: • To identify perception based E-QUAL service dimensions to measure e-service
quality of electronics goods in Kolkata • To measure the e-retailing customer satisfaction based on e-service quality of
electronics goods in Kolkata 4. Research Methodology 4.1 Research design The research is based on Causal research design. Causal research, as the name specifies, tries to determine the cause underlying a given behavior. It finds the cause and effect relationship between variables. It seeks to determine how the dependent variable changes with variations in the independent variable. 4.2 Data Collection For present study, mainly primary data is used. For the purpose a range of response based close ended questions, providing limited answers to specific responses or on a numeric scale is used. Face-to-face interview was conducted to develop the interview questions including open-ended questions and close ended questions and carefully eliminating leading questions. Samples were drawn following simple random sampling method. All sample units was personally contacted and interviewed. 4.3 Sample Size: 437 4.4 Tools of Collecting Primary Data A structured, undisguised questionnaire is used based on rating scale. Questions were both open ended & closed ended.
A Study on Consumer Perception of E-Tailing Services for Electronic Goods in Kolkata 5
TSM Business Review, Vol. 4, No. 2, December 2016
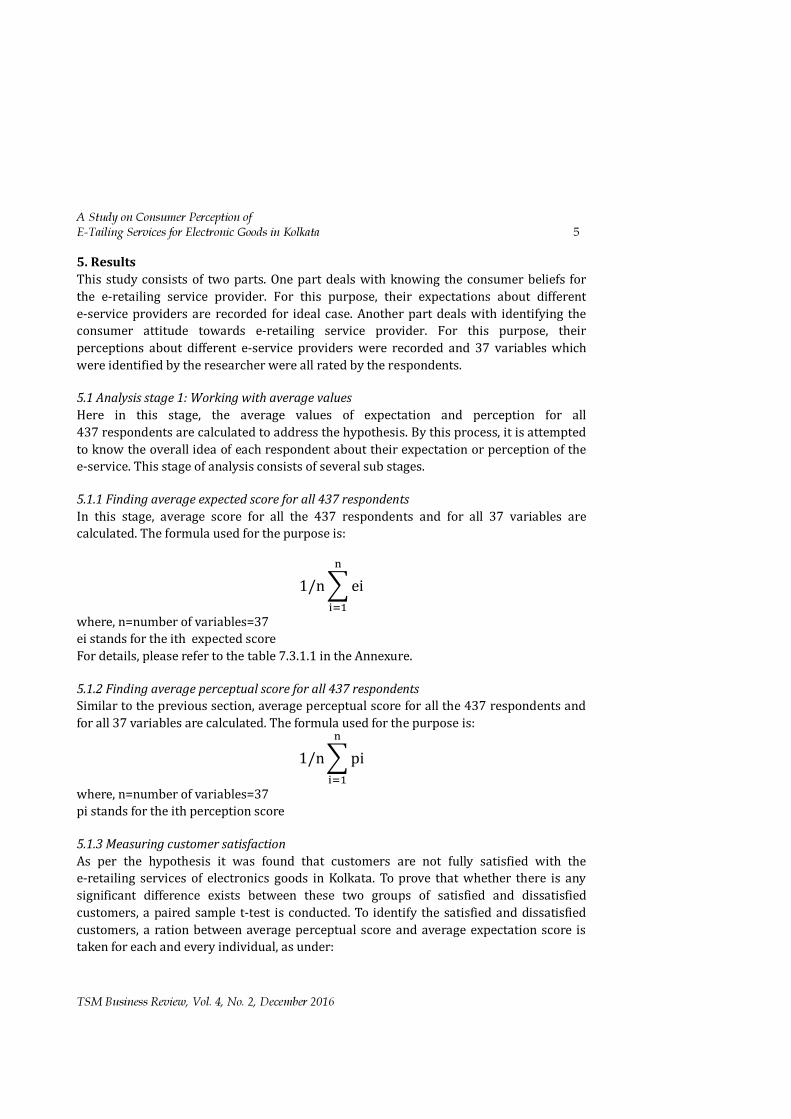
5. Results This study consists of two parts. One part deals with knowing the consumer beliefs for the e-retailing service provider. For this purpose, their expectations about different e-service providers are recorded for ideal case. Another part deals with identifying the consumer attitude towards e-retailing service provider. For this purpose, their perceptions about different e-service providers were recorded and 37 variables which were identified by the researcher were all rated by the respondents. 5.1 Analysis stage 1: Working with average values Here in this stage, the average values of expectation and perception for all 437 respondents are calculated to address the hypothesis. By this process, it is attempted to know the overall idea of each respondent about their expectation or perception of the e-service. This stage of analysis consists of several sub stages. 5.1.1 Finding average expected score for all 437 respondents In this stage, average score for all the 437 respondents and for all 37 variables are calculated. The formula used for the purpose is:
1/n�ei�
���
where, n=number of variables=37 ei stands for the ith expected score For details, please refer to the table 7.3.1.1 in the Annexure. 5.1.2 Finding average perceptual score for all 437 respondents Similar to the previous section, average perceptual score for all the 437 respondents and for all 37 variables are calculated. The formula used for the purpose is:
1/n�pi�
���
where, n=number of variables=37 pi stands for the ith perception score 5.1.3 Measuring customer satisfaction As per the hypothesis it was found that customers are not fully satisfied with the e-retailing services of electronics goods in Kolkata. To prove that whether there is any significant difference exists between these two groups of satisfied and dissatisfied customers, a paired sample t-test is conducted. To identify the satisfied and dissatisfied customers, a ration between average perceptual score and average expectation score is taken for each and every individual, as under:

6 A Study on Consumer Perception of E-Tailing Services for Electronic Goods in Kolkata
TSM Business Review, Vol. 4, No. 2, December 2016
i.e; ∑ pi����∑ ei����
This ratio is considered as “satisfaction index”. 5.2 Analysis stage 2: Identification of Perception dimensions The researcher then analyzed those 37 variables of perception to extract dimensions of perception. For the purpose factor analysis was conducted with Principle Component Analysis. Factor Analysis for Perception dimension
Table 1: KMO and Bartlett's test Kaiser-Meyer-Olkin Measure of Sampling Adequacy. .857
Bartlett's Test of Sphericity Approx. Chi-Square 9511.785
Df 666 Sig. .000
Figure I: Screen plot for perception factors
A Study on Consumer Perception of E-Tailing Services for Electronic Goods in Kolkata 7
TSM Business Review, Vol. 4, No. 2, December 2016
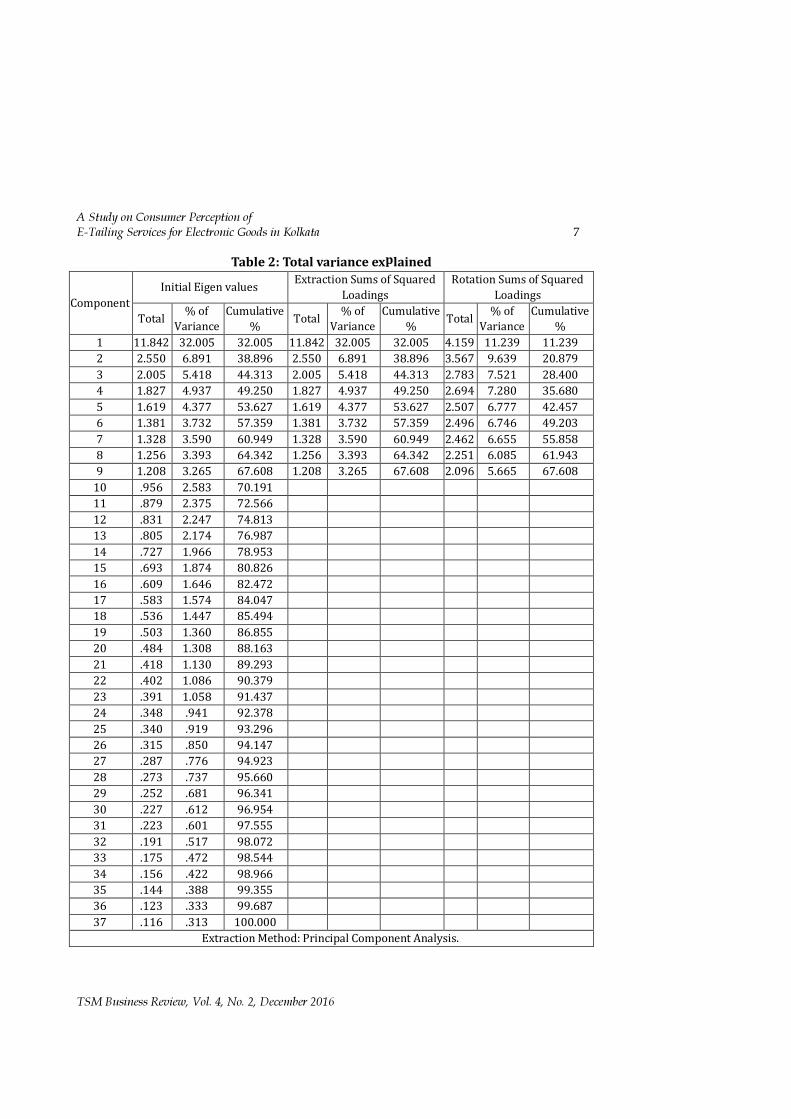
Table 2: Total variance explained
Component Initial Eigen values Extraction Sums of Squared
Loadings Rotation Sums of Squared
Loadings Total % of
Variance Cumulative
% Total % of Variance
Cumulative % Total % of
Variance Cumulative
% 1 11.842 32.005 32.005 11.842 32.005 32.005 4.159 11.239 11.239 2 2.550 6.891 38.896 2.550 6.891 38.896 3.567 9.639 20.879 3 2.005 5.418 44.313 2.005 5.418 44.313 2.783 7.521 28.400 4 1.827 4.937 49.250 1.827 4.937 49.250 2.694 7.280 35.680 5 1.619 4.377 53.627 1.619 4.377 53.627 2.507 6.777 42.457 6 1.381 3.732 57.359 1.381 3.732 57.359 2.496 6.746 49.203 7 1.328 3.590 60.949 1.328 3.590 60.949 2.462 6.655 55.858 8 1.256 3.393 64.342 1.256 3.393 64.342 2.251 6.085 61.943 9 1.208 3.265 67.608 1.208 3.265 67.608 2.096 5.665 67.608
10 .956 2.583 70.191 11 .879 2.375 72.566 12 .831 2.247 74.813 13 .805 2.174 76.987 14 .727 1.966 78.953 15 .693 1.874 80.826 16 .609 1.646 82.472 17 .583 1.574 84.047 18 .536 1.447 85.494 19 .503 1.360 86.855 20 .484 1.308 88.163 21 .418 1.130 89.293 22 .402 1.086 90.379 23 .391 1.058 91.437 24 .348 .941 92.378 25 .340 .919 93.296 26 .315 .850 94.147 27 .287 .776 94.923 28 .273 .737 95.660 29 .252 .681 96.341 30 .227 .612 96.954 31 .223 .601 97.555 32 .191 .517 98.072 33 .175 .472 98.544 34 .156 .422 98.966 35 .144 .388 99.355 36 .123 .333 99.687 37 .116 .313 100.000
Extraction Method: Principal Component Analysis.
8 A Study on Consumer Perception of E-Tailing Services for Electronic Goods in Kolkata
TSM Business Review, Vol. 4, No. 2, December 2016
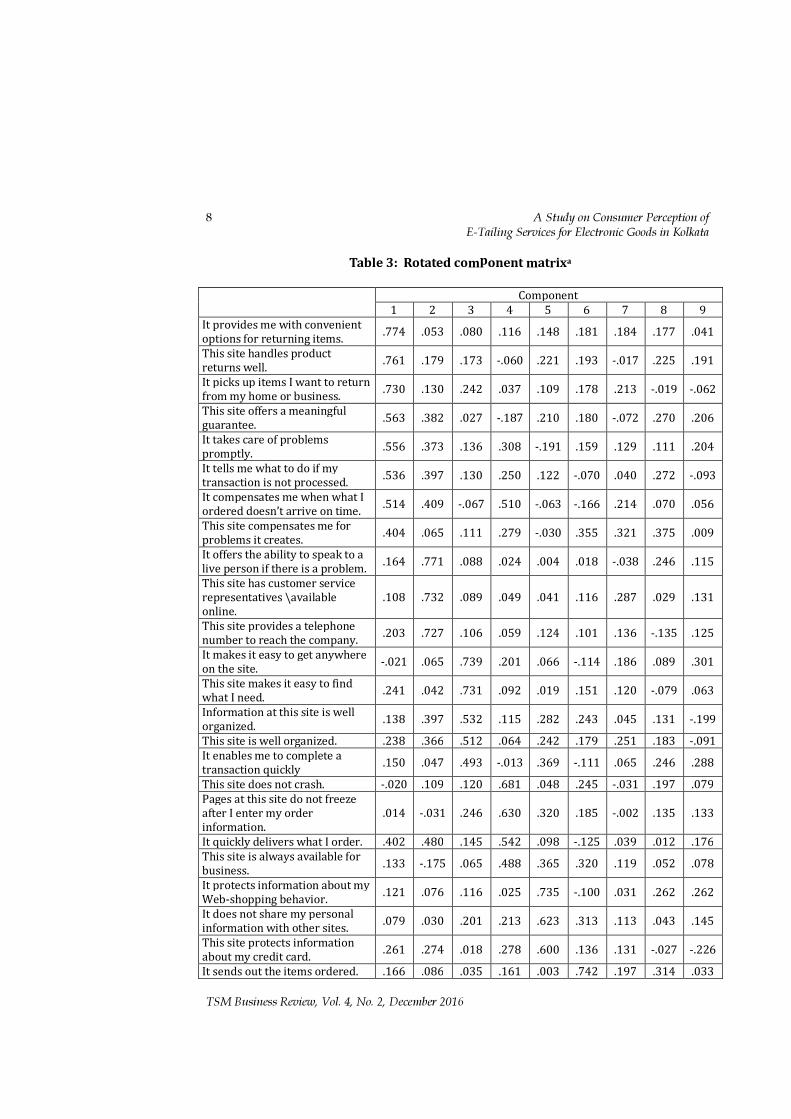
Table 3: Rotated component matrixa
Component
1 2 3 4 5 6 7 8 9 It provides me with convenient options for returning items. .774 .053 .080 .116 .148 .181 .184 .177 .041 This site handles product returns well. .761 .179 .173 -.060 .221 .193 -.017 .225 .191 It picks up items I want to return from my home or business. .730 .130 .242 .037 .109 .178 .213 -.019 -.062 This site offers a meaningful guarantee. .563 .382 .027 -.187 .210 .180 -.072 .270 .206 It takes care of problems promptly. .556 .373 .136 .308 -.191 .159 .129 .111 .204 It tells me what to do if my transaction is not processed. .536 .397 .130 .250 .122 -.070 .040 .272 -.093 It compensates me when what I ordered doesn’t arrive on time. .514 .409 -.067 .510 -.063 -.166 .214 .070 .056 This site compensates me for problems it creates. .404 .065 .111 .279 -.030 .355 .321 .375 .009 It offers the ability to speak to a live person if there is a problem. .164 .771 .088 .024 .004 .018 -.038 .246 .115 This site has customer service representatives \available online.
.108 .732 .089 .049 .041 .116 .287 .029 .131
This site provides a telephone number to reach the company. .203 .727 .106 .059 .124 .101 .136 -.135 .125 It makes it easy to get anywhere on the site. -.021 .065 .739 .201 .066 -.114 .186 .089 .301 This site makes it easy to find what I need. .241 .042 .731 .092 .019 .151 .120 -.079 .063 Information at this site is well organized. .138 .397 .532 .115 .282 .243 .045 .131 -.199 This site is well organized. .238 .366 .512 .064 .242 .179 .251 .183 -.091 It enables me to complete a transaction quickly .150 .047 .493 -.013 .369 -.111 .065 .246 .288 This site does not crash. -.020 .109 .120 .681 .048 .245 -.031 .197 .079 Pages at this site do not freeze after I enter my order information.
.014 -.031 .246 .630 .320 .185 -.002 .135 .133
It quickly delivers what I order. .402 .480 .145 .542 .098 -.125 .039 .012 .176 This site is always available for business. .133 -.175 .065 .488 .365 .320 .119 .052 .078 It protects information about my Web-shopping behavior. .121 .076 .116 .025 .735 -.100 .031 .262 .262 It does not share my personal information with other sites. .079 .030 .201 .213 .623 .313 .113 .043 .145 This site protects information about my credit card. .261 .274 .018 .278 .600 .136 .131 -.027 -.226 It sends out the items ordered. .166 .086 .035 .161 .003 .742 .197 .314 .033
A Study on Consumer Perception of E-Tailing Services for Electronic Goods in Kolkata 9
TSM Business Review, Vol. 4, No. 2, December 2016
It has in stock the items the company claims to have. .289 .101 .119 .177 .192 .693 .092 .029 .082 It is truthful about its offerings. .020 .358 .007 .080 .342 .392 .038 .369 .055 The overall convenience of using this site. .135 .168 .152 -.115 .153 .100 .770 -.012 -.063 The overall value you get from this site for your money and effort.
-.002 -.034 .310 .068 -.049 .167 .665 .210 .176
The extent to which the site gives you a feeling of being in control.
.180 .195 -.060 .360 .034 .021 .635 .198 .226
The prices of the products and services available at this site (how economical the site is).
.320 .386 .175 -.058 .278 .021 .515 .010 .014
It delivers orders when promised. .276 .048 .146 .207 .159 .167 .102 .695 .232 This site makes items available for delivery within a suitable time frame.
.334 .038 -.007 .183 .240 .188 .321 .643 -.014
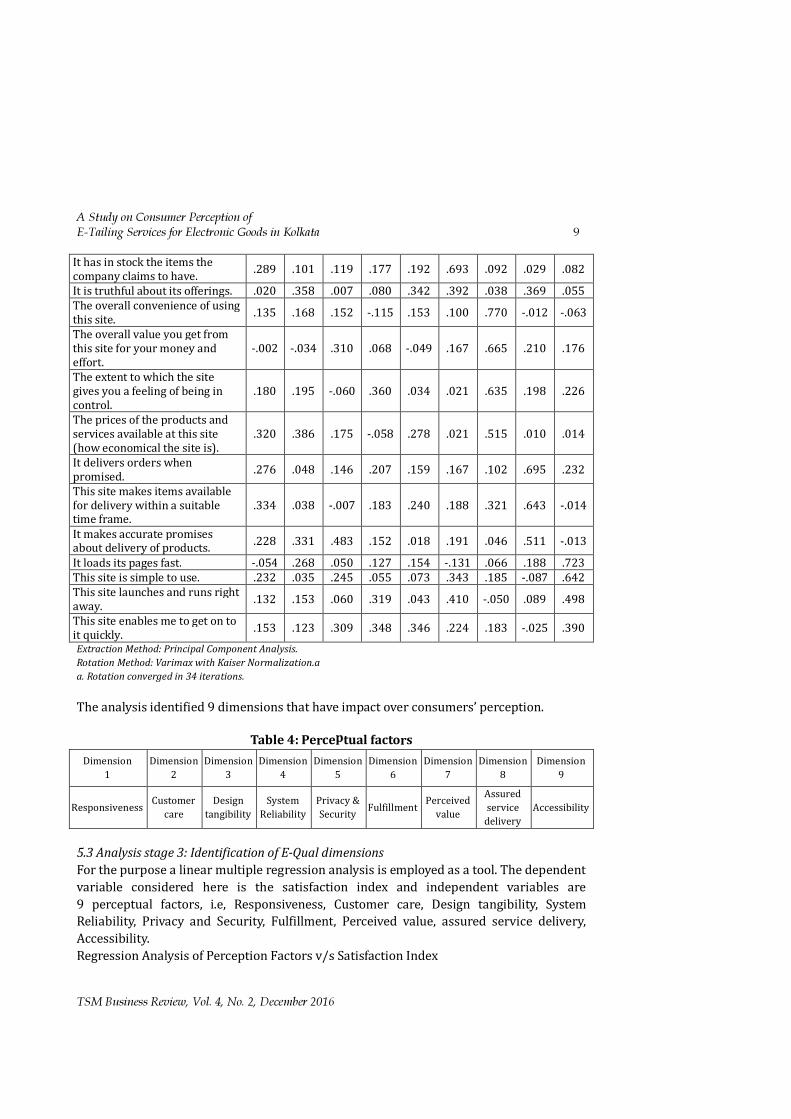
It makes accurate promises about delivery of products. .228 .331 .483 .152 .018 .191 .046 .511 -.013 It loads its pages fast. -.054 .268 .050 .127 .154 -.131 .066 .188 .723 This site is simple to use. .232 .035 .245 .055 .073 .343 .185 -.087 .642 This site launches and runs right away. .132 .153 .060 .319 .043 .410 -.050 .089 .498 This site enables me to get on to it quickly. .153 .123 .309 .348 .346 .224 .183 -.025 .390 Extraction Method: Principal Component Analysis. Rotation Method: Varimax with Kaiser Normalization.a a. Rotation converged in 34 iterations. The analysis identified 9 dimensions that have impact over consumers’ perception.
Table 4: Perceptual factors Dimension
1 Dimension
2 Dimension
3 Dimension
4 Dimension
5 Dimension
6 Dimension
7 Dimension
8 Dimension
9
Responsiveness Customer care
Design tangibility
System Reliability
Privacy & Security Fulfillment Perceived
value Assured service
delivery Accessibility
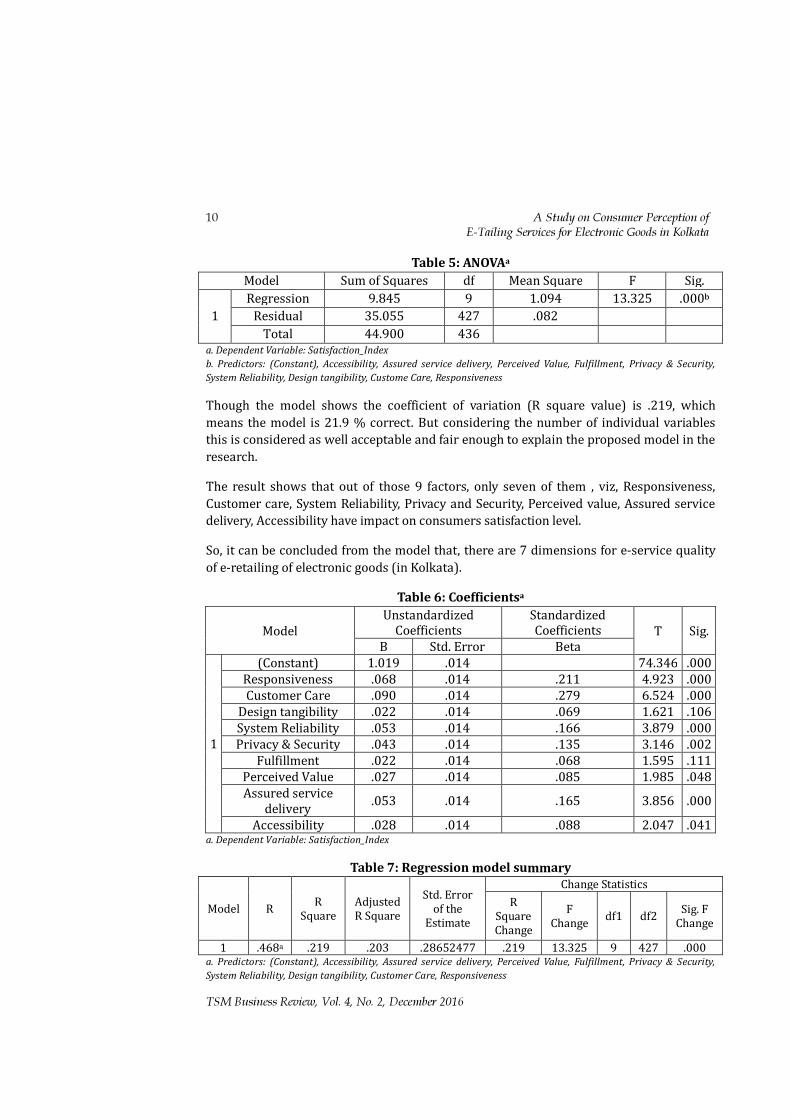
5.3 Analysis stage 3: Identification of E-Qual dimensions For the purpose a linear multiple regression analysis is employed as a tool. The dependent variable considered here is the satisfaction index and independent variables are 9 perceptual factors, i.e, Responsiveness, Customer care, Design tangibility, System Reliability, Privacy and Security, Fulfillment, Perceived value, assured service delivery, Accessibility. Regression Analysis of Perception Factors v/s Satisfaction Index
10 A Study on Consumer Perception of E-Tailing Services for Electronic Goods in Kolkata
TSM Business Review, Vol. 4, No. 2, December 2016
Table 5: ANOVAa Model Sum of Squares df Mean Square F Sig.
1 Regression 9.845 9 1.094 13.325 .000b
Residual 35.055 427 .082 Total 44.900 436
a. Dependent Variable: Satisfaction_Index b. Predictors: (Constant), Accessibility, Assured service delivery, Perceived Value, Fulfillment, Privacy & Security, System Reliability, Design tangibility, Custome Care, Responsiveness Though the model shows the coefficient of variation (R square value) is .219, which means the model is 21.9 % correct. But considering the number of individual variables this is considered as well acceptable and fair enough to explain the proposed model in the research. The result shows that out of those 9 factors, only seven of them , viz, Responsiveness, Customer care, System Reliability, Privacy and Security, Perceived value, Assured service delivery, Accessibility have impact on consumers satisfaction level. So, it can be concluded from the model that, there are 7 dimensions for e-service quality of e-retailing of electronic goods (in Kolkata).
Table 6: Coefficientsa
Model Unstandardized
Coefficients Standardized Coefficients T Sig.
B Std. Error Beta
1
(Constant) 1.019 .014 74.346 .000 Responsiveness .068 .014 .211 4.923 .000 Customer Care .090 .014 .279 6.524 .000
Design tangibility .022 .014 .069 1.621 .106 System Reliability .053 .014 .166 3.879 .000 Privacy & Security .043 .014 .135 3.146 .002
Fulfillment .022 .014 .068 1.595 .111 Perceived Value .027 .014 .085 1.985 .048 Assured service
delivery .053 .014 .165 3.856 .000 Accessibility .028 .014 .088 2.047 .041
a. Dependent Variable: Satisfaction_Index
Table 7: Regression model summary
Model R R Square
Adjusted R Square
Std. Error of the
Estimate
Change Statistics R
Square Change
F Change df1 df2 Sig. F
Change 1 .468a .219 .203 .28652477 .219 13.325 9 427 .000
a. Predictors: (Constant), Accessibility, Assured service delivery, Perceived Value, Fulfillment, Privacy & Security, System Reliability, Design tangibility, Customer Care, Responsiveness
A Study on Consumer Perception of E-Tailing Services for Electronic Goods in Kolkata 11
TSM Business Review, Vol. 4, No. 2, December 2016
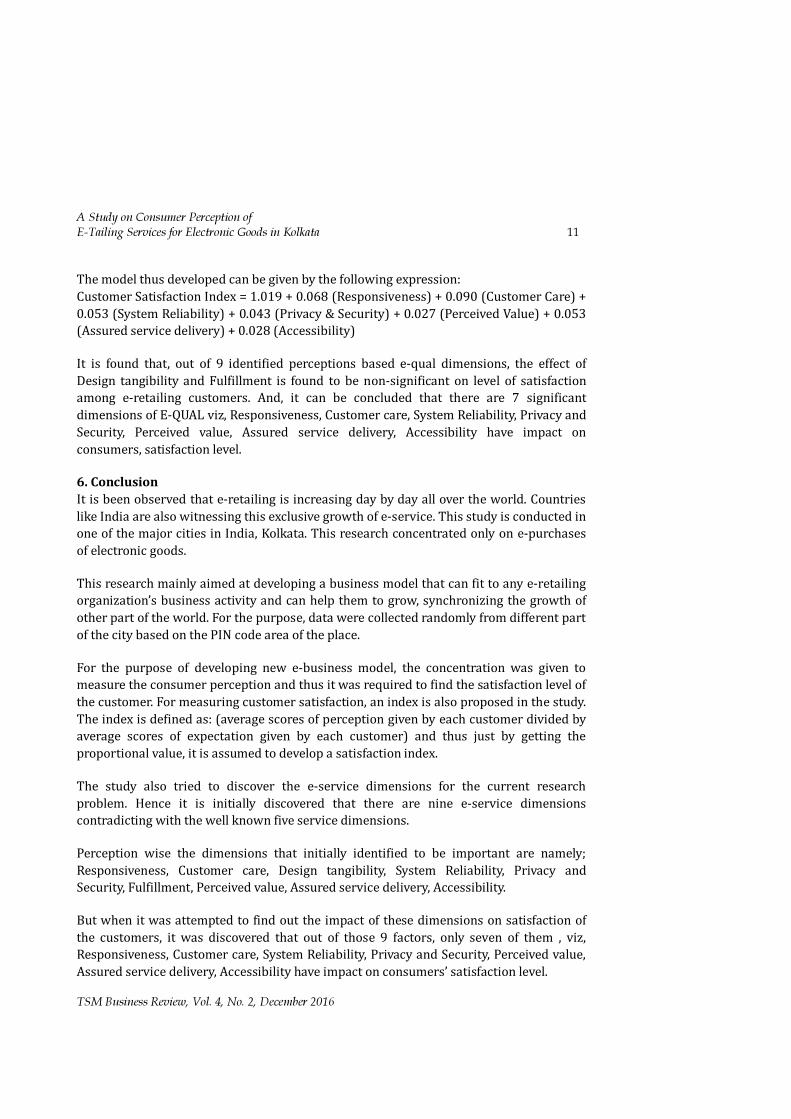
The model thus developed can be given by the following expression: Customer Satisfaction Index = 1.019 + 0.068 (Responsiveness) + 0.090 (Customer Care) + 0.053 (System Reliability) + 0.043 (Privacy & Security) + 0.027 (Perceived Value) + 0.053 (Assured service delivery) + 0.028 (Accessibility) It is found that, out of 9 identified perceptions based e-qual dimensions, the effect of Design tangibility and Fulfillment is found to be non-significant on level of satisfaction among e-retailing customers. And, it can be concluded that there are 7 significant dimensions of E-QUAL viz, Responsiveness, Customer care, System Reliability, Privacy and Security, Perceived value, Assured service delivery, Accessibility have impact on consumers, satisfaction level. 6. Conclusion It is been observed that e-retailing is increasing day by day all over the world. Countries like India are also witnessing this exclusive growth of e-service. This study is conducted in one of the major cities in India, Kolkata. This research concentrated only on e-purchases of electronic goods. This research mainly aimed at developing a business model that can fit to any e-retailing organization’s business activity and can help them to grow, synchronizing the growth of other part of the world. For the purpose, data were collected randomly from different part of the city based on the PIN code area of the place. For the purpose of developing new e-business model, the concentration was given to measure the consumer perception and thus it was required to find the satisfaction level of the customer. For measuring customer satisfaction, an index is also proposed in the study. The index is defined as: (average scores of perception given by each customer divided by average scores of expectation given by each customer) and thus just by getting the proportional value, it is assumed to develop a satisfaction index. The study also tried to discover the e-service dimensions for the current research problem. Hence it is initially discovered that there are nine e-service dimensions contradicting with the well known five service dimensions. Perception wise the dimensions that initially identified to be important are namely; Responsiveness, Customer care, Design tangibility, System Reliability, Privacy and Security, Fulfillment, Perceived value, Assured service delivery, Accessibility. But when it was attempted to find out the impact of these dimensions on satisfaction of the customers, it was discovered that out of those 9 factors, only seven of them , viz, Responsiveness, Customer care, System Reliability, Privacy and Security, Perceived value, Assured service delivery, Accessibility have impact on consumers’ satisfaction level.

12 A Study on Consumer Perception of E-Tailing Services for Electronic Goods in Kolkata
TSM Business Review, Vol. 4, No. 2, December 2016
The model thus developed can be given by the following expression: Customer Satisfaction Index = 1.019 + 0.068 (Responsiveness) + 0.090 (Customer Care) + 0.053 (System Reliability) + 0.043 (Privacy & Security) + 0.027 (Perceived Value) + 0.053 (Assured service delivery) + 0.028 (Accessibility) Thus, it can be concluded from the model that, there are 7 dimensions for e-service quality of e-retailing of electronic goods (in Kolkata). References Andam. Z. A. (2003). E-commerce and e-business; e-ASEAN Task Force UNDP-APDIP. Babich, P. (1995). Customer satisfaction: How good is good enough, Quality Progress,
65-67. Barnes, S. J. & Vidgen, R. (2001). An evaluation of cyber-bookshops: The Webqual Method,
International Journal of Electronic Commerce, 6 (1), 11-30. Berry, L. L. (1986), Retail businesses are service businesses, Journal of Retailing, 62, 3-6. Cox, J. & Dale, B. G. (2001). Service quality and E-Commerce: An exploratory analysis,
Managing Service Quality, 11(2), 121-31. Cox J, & Dale, B. G (2002). Key quality factors in web site design and use: An examination,
International Journal of Quality & Reliability Management, 19(7), 862-88. Datt, R. M. (2009), Impact of electronic marketing in a globalizing world: Indian
perspective, Computer Science and Information Technology - Spring Conference, IEEE explore, ISBN: 978-0-7695-3653-8.
Grewal, H. S. (2012), A study of ethical and social issues in E-Commerce, International Journal of Advanced Research in Computer Science and Software Engineering, 2 (7), ISSN: 2277 128X.
http:// www.internetworldstats.com, 2015. https://www.statista.com/markets/413/e-commerce, 2016. Kaynama, S. A. (2000). A conceptual model to measure service quality of online
companies: E-QUAL, Annual Academy of Marketing Science Conference, Montreal, Canada, 46-51.
Kaynama, S. A. & Black, C. I. (2000). A proposal to assess the service quality of online travel agencies: An exploratory study, Journal of Professional Services Marketing, 21(1), 63-88.
Parasuraman A., Berry L. L., & Zeithaml V. A. (1991). Refinement and reassessment of the SERVQUAL scale. Journal of Retailing, 67 (winter), 420-450.
Parasuraman A., Zeithaml V. A., Malhotra, A. (2005). E-S-QUAL: A multiple-item scale for assessing electronic service quality, Journal of Service Research, 7(3), 213-33.
Parasuraman, A., Zeithaml V. A, & Berry L. L (1985). A conceptual model of service quality and its implications for future research. Journal of Marketing (Fall), 41-50.
A Study on Consumer Perception of E-Tailing Services for Electronic Goods in Kolkata 13
TSM Business Review, Vol. 4, No. 2, December 2016
Pather, S, & Usabuwera, S. (2010). Implications of e-service quality dimensions for the information systems function, Proceedings of the 43rd Hawaii International Conference on System Sciences, IEEE explore ISBN 978-0-7695-3869-3/10.
NASSCON and BCG, 2001, E-commerce opportunities for India Inc. (study report prepared by NASSCOM and The Boston Consulting Group).
Rastogi, R. (2003). INDIA: Country report on E-commerce initiatives; Part Three: Country presentations, 133-146.
Santos, J. (2003). E-Service quality: A model of virtual service quality dimensions, Managing Service Quality, 13(3), 233-46.
Sharma, D. P. (2009). E-retailing principles and practice; First Edition, Himalaya Publishing House.
Siadat. S. H, Buyut. V. C, & Selamat, H. (2008). Measuring service quality in E-retailing using SERVQUAL Model, International Symposium on Information Technology, IEEE Xplore, ISBN 978-1-4244-2327-9.
Siadat. S. H, Buyut. V. C, & Selamat, H. (2008), Measuring service quality in E-retailing using SERVQUAL model, International Symposium on Information Technology, IEEE Xplore, ISBN 978-1-4244-2327-9.
Srinivasan, R. (2010). Services marketing-The Indian context, 2nd ed., Prentice Hall of India, New Delhi.
Strauss, J. & Frost, R. (2009), E-Marketing; Fifth Edition; Prentice Hall of India. Wan H. A, (2000). Opportunities to enhance a commercial Web site. Information and
Management, 38(1), 15-21. Wolfinbarger, M. & Gilly. M. C. (2003). ETailQ: dimensionalizing, measuring and
predicting etail quality, Journal of Retailing 79,183–198. Yang. Z, Jun. Minjoon & Peterson. R. T (2004). Measuring customer perceived online
service quality- scale development and managerial implications, International Journal of Operations & Production Management, 24 (11), 1149-1174.
Zaheer, A. (2011). E-retailing strategy boom across the globe, Amity Business Review, 12 (1).
Zeithaml, V. A., Parasuraman, A. and Malhotra, A. (2001), “A conceptual framework for understanding e-service quality: implications for future research and managerial practice”, MSI Working Paper Series, Report No. 00-115, Cambridge, MA
Zeithaml, V. A., Parasuraman, A. & Malhotra, A. (2002). Service quality delivery through Web sites: a critical review of extant knowledge. Journal of the Academy of Marketing Science, 30(4), 362-75.
Zhao, W. & Xiong, X. (2011), E-Tail-SERVQUAL: Conceptualization and its validity, IEEE explore, ISBN 978-1-4244-9763-8/11.
Article ISSN: 2348-3784
N. Asha, Assistant professor, MBA Department, Fatima college (autonomous), Maryland, Madurai – 18 (Corresponding Author), Phone: 8122884019, Email: [email protected] Dr. R. Vetrickarthick, Assistant Professor, Department of Gandhian Thought and Peace Science, GRI – Deemed University, Ghandhigram, Gandhigram- 624302, Phone: 7200014025, Email: [email protected]
A Research on Examining Critical Success factors towards the Application of Green Technology in Rural
Business by Rural People in Madurai District Digital Object Identifier: 10.23837/tbr/2016/v4/n2/128861
N Asha and R Vetrickarthick Abstract This paper analyses the interaction of two areas: green technology and rural business persons and presents a finding on Critical Success Factors (CSFs) in the implementation of Enterprise Resource Planning (ERP) across rural areas in and around Madurai. The study finds that appropriate business and IT legacy systems, business plan/ vision/ goals/ justification, business process reengineering, change management culture and programme, communication, ERP teamwork and composition, monitoring and evaluation of performance, project champion, project management, software/system development, testing and troubleshooting, top management support, data management, ERP strategy and implementation methodology, ERP vendor, organizational characteristics, fit between ERP and business/process, Rural culture and Area-related functional requirement were the commonly extracted factors across these rural areas. In these 18 CSFs, top management support and training and education were the most frequently cited as the critical factors to the successful implementation of Green Technology by rural businesspersons. Keywords: Green technology, Internet, e-logistics, SRM, CRM, E – business, ERP 1. Introduction The Indian green technology industry has witnessed excellent growth in the past two decades. Capitalizing on its advantages of talent pool, lower cost of operation and the innovative remote delivery model, India has established itself as a global leader in the green technology sector. Today, India is clearly acknowledged as the global services hub. However, the industry today is facing many challenges in terms of rising costs, availability of quality talent pool, security and IP protection and infrastructure concerns. This coupled with changing customer expectations and emergence of other low cost locations is further deepening the threat to the Indian green technology industry. To sustain the growth and achieve global leadership, the Indian green technology industry needs to move from being a low cost service provider to a high end solution

A Research on Examining Critical Success factors towards the Application of Green Technology in Rural Business by Rural People in Madurai District 15
TSM Business Review, Vol. 4, No. 2, December 2016
provider. The industry needs to provide innovative solutions of higher value to the global customers. This innovation need not necessarily be in products but could be in services, processes and even business models. Innovation will lead to exponential growth and help the industry break out of the linear business growth. The ongoing development of the green technology industry is due to the government and industry's commitment to create and support the policy framework, infrastructure, capital pool, partnerships and skill base. The growth of the industry is also driven by another factor - the convergence of communications and IT where knowledge can be disseminated in real time. With the adoption of a liberalized regulatory framework in the telecom sector, the local operators are well on their way to join global operators. It is very important for the rural people to think globally and act globally and they have to integrate their business operations with the global trend. Many cottage industries are having well grown market potential in the foreign countries especially in America, South Africa, etc. This is the need of the hour to apply green technology in their business. 2. Literature review Various initiatives in the recent past portrayed the significant role that the green technology plays in the realm of rural development. Several projects have reduced the costs, and it also has increased transparency. A large number of rural e-Governance applications, developed as pilot projects were aimed at offering easy access to citizen services and improved processing of government to citizen transactions. This paper presents a brief review of the innovative projects in Information and communication technologies for rural development and how far it has contributed. The other aim is to ponder over the achievements and the failures of green technology in the sustainable development march. The analysis also indicates communication related initiatives and projects for development before media liberalization and post media liberalization. Rajendran (2013) carried out a study in PURA scheme villages of Thanjavur District, India. The investigation was to determine the impact of education on green technologies and business practice among the villagers, who deals with micro-enterprises. A random sampling method was used in collect the data from seven clusters in the village. Chi-square test and T-test was used in determining the role of green technologies on the villagers’ performance towards green technology management and practices. The research study was carried out before and after the implementation of green technologies-based farming. The result revealed that the villagers have changed their method of farming after getting the education on green technologies and business practices. In India the farmers in the state of Punjab are selling their produce through online auctioning at farmerbazaar.com. Here the farmer is informed of the best price throughout the country before clinching a deal, thus the middlemen who used to make a lot of money
16 A Research on Examining Critical Success factors towards the Application of Green Technology in Rural Business by Rural People in Madurai District
TSM Business Review, Vol. 4, No. 2, December 2016
has given way to farmers getting the profits. The Warna Wired Village Project in Maharashtra, India is another such project. This project serves the information needs of the farmers for different crop cultivation practices of major crops, sugarcane cultivation practices, pest and disease control, marketing information, dairy and sugarcane processing information upto the village level. Amul in Anand district of Gujarat is another success story. Dhan Foundation, Madurai and SKS are experimenting with Green technologies for use in its Microcredit activities. They are currently expanding their micro-finance and micro-enterprise program to reduce poverty by reaching out to 25,000 poor families in 1,000 villages of rural Medak District Technology of AP, where they have 4 branches. Online Marketing and CAD of Artisanal Goods by AsCent, a Bangalore-based NGO, is working with several state agencies to implement Computer Aided Design (CAD) systems in sections of northern Karnataka, to enhance the artisanal production of Kolhapuri style of chappals. The India Agriline Project, by the EID Parry enterprise of the Murugappa group, is aimed at enhancing e-Commerce in the agricultural sector. Khanduja & Kaushik (2008), have discussed a case study of a hub to analyze the prospects of business incubation for socioeconomic upliftment of rural masses in India. The paper draws a profile of 'rural business hubs' currently being established in India. They further emphasized that India is a developing nation with rural-based economy and in this context, the paper analyses the prospects of 'incubated business' in fostering rural entrepreneurship by downsizing technology directly to the rural masses. Since there is huge potential in harnessing the existing abundance of resources, manpower and infrastructure in the rural areas of the country, a systematic approach is emphasised to build linkages between education, research, enterprises, finance and government by dwelling upon the concept of business incubation. Karshaka Pragati is a project launched by Cooption’s Technologies in rural Andhra Pradesh. It is aimed at providing convenient banking, trade and agricultural services to farmers, including village banking and trade, procurement of production and investment credit, information on fertilizers, pesticides, and other agri-products market prices. TAFE Ltd. has launched its portal ww.jfarmindia.com in order to make J-Farm’s agri-information available to farmers across several states in their regional languages. The portal will also provide information on research and field tests of crops conducted on the J-Farm premises by various universities. The website has bilingual browsing facilities in English and in Tamil. Karnataka Microfinance Project The project helps a NGO to track farmer loans across 124 centres spread over 110 villages. Tribal Monsoon is a project aimed at preserving the creative cultural heritage by connecting 7 artisan communities from the Indian subcontinent with arts/crafts enthusiasts worldwide. The website tribalmonsoon.com connects global demand for eastern decorative arts to the supply of cottage industries of South Asia and beyond. e-Choupal, the unique web based initiative of ITC's International Business Division, offers the farmers of India all the information,
A Research on Examining Critical Success factors towards the Application of Green Technology in Rural Business by Rural People in Madurai District 17
TSM Business Review, Vol. 4, No. 2, December 2016
products and services they need to enhance farm productivity, improve farm-gate price realization and cut transaction costs. 3. Objectives of the Study • To analyse the critical success factors towards the application of green
technology in rural business by rural businesspersons • To know about the influences of various factors in the application of green
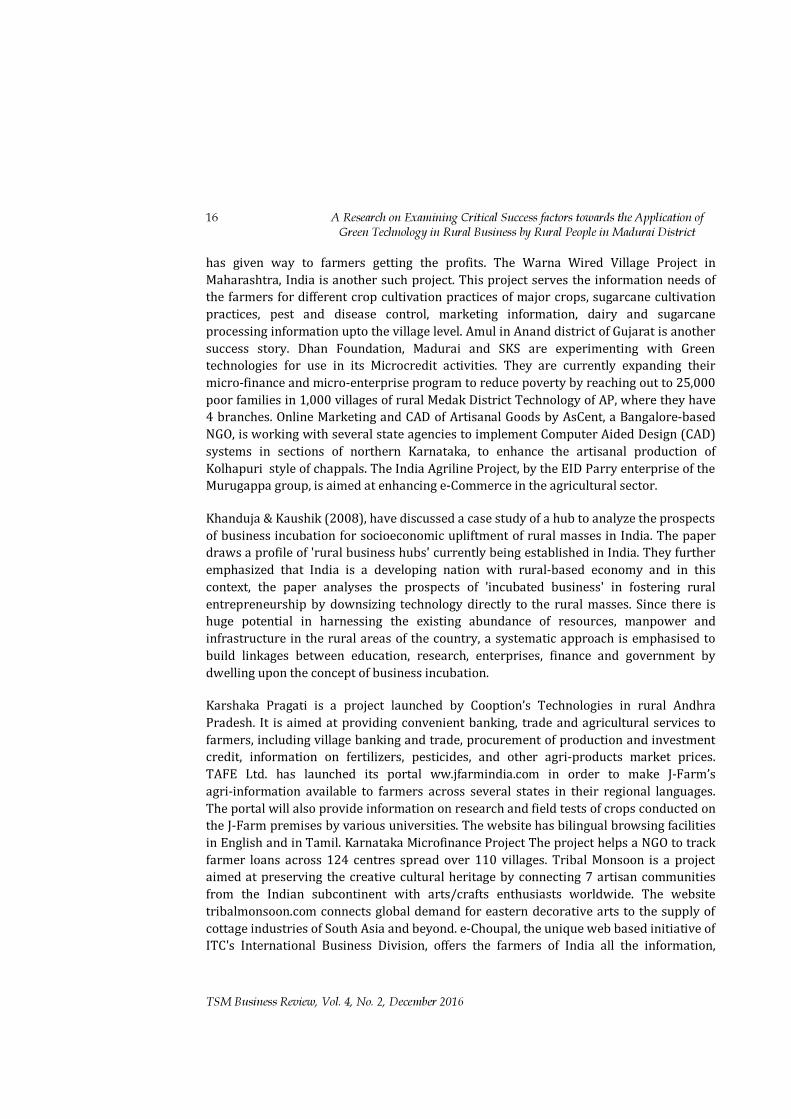
technology Research Methodology The questionnaire used in this research consists of two parts. The first part is connected with personal profile of the respondents. The second part is concerned with the main topic of the research with subdivisions of 8 critical success factors. Respondents were asked to indicate their level of agreement with the items of this part based on 5 point Likert Scale. Simple Random Sampling method was adopted to collect samples out of 125 questionnaires distributed, 100 responses were collected. The study covers a period of one month from December 2015 to January 2016. The data were analyzed by using appropriate statistical techniques such as Percentage analysis, weighted average Analysis and Garret ranking and bar chart. Since the sample size (100) selected are small in character. Due to time and resource constraints, the researcher has restricted only to Madurai district and these findings cannot be generalized in other areas. 4. Analysis The form of organization of the rural business has been analyzed using percentage analysis method depicted in Table 1. It is identified that most of the respondents fall under the Hindu Joint family system i.e, the family members themselves govern the entire business operations.
Table 1 S.No Form of Organization Frequency Percentage (%)
1. Public Limited - - 2. Private limited 5 5 3. Partnership firm 25 25 4. Sole proprietorship 20 20 5. Hindu Joint family System 50 50 Total 100 100
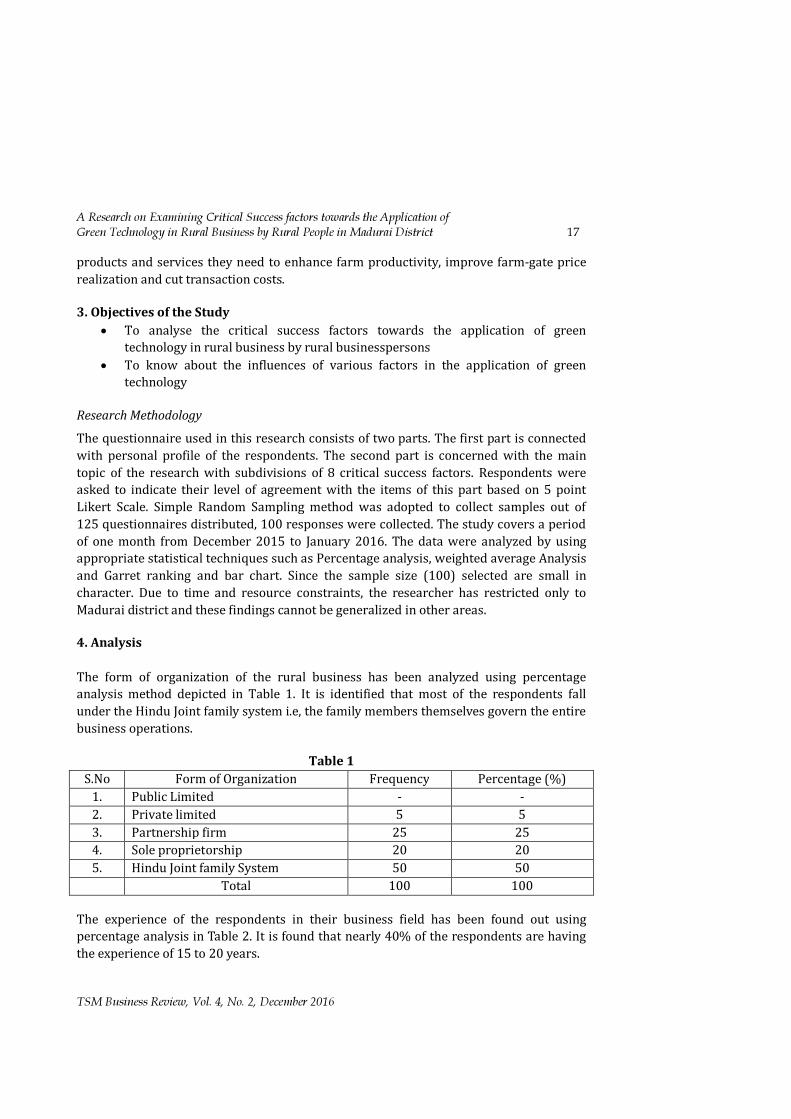
The experience of the respondents in their business field has been found out using percentage analysis in Table 2. It is found that nearly 40% of the respondents are having the experience of 15 to 20 years.
18 A Research on Examining Critical Success factors towards the Application of Green Technology in Rural Business by Rural People in Madurai District
TSM Business Review, Vol. 4, No. 2, December 2016
In Table 3, the nature of business undertaken by the respondents is considered to fine tune their level of acceptance towards Green Technology. It is estimated that 30 % of the people are performing Arts and Crafts related business in the rural areas.
Table 2 S.No Category Frequency Percentage (%)
1. Below 5 years 5 5 2. 5 – 10 Years 20 20 3. 10 – 15 Years 25 25 4. 15 – 20 Years 40 40 5. Above 20 Years 10 10 Total 100 100
Table 3
S.No Category Frequency Percentage (%) 1. Groceries trading 25 25 2. Rice merchant 20 20 3. Services 5 5 4. Arts and Crafts 30 30 5. Dealers 20 20 Total 100 100
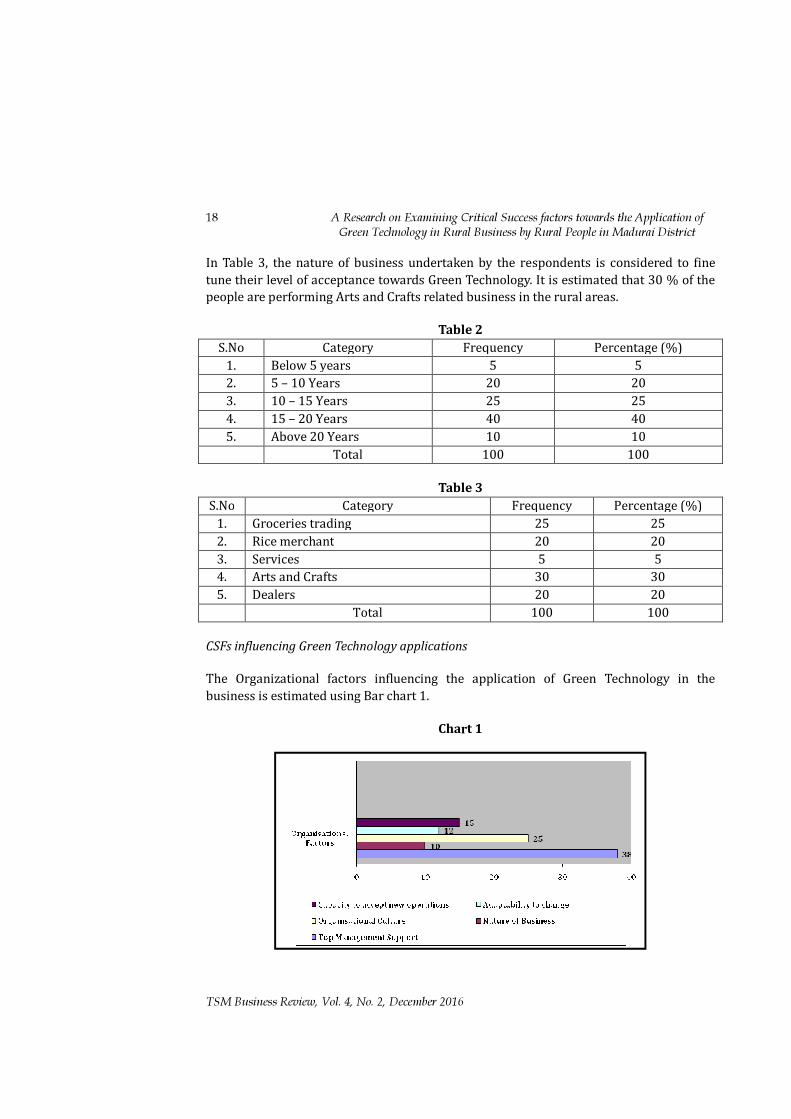
CSFs influencing Green Technology applications The Organizational factors influencing the application of Green Technology in the business is estimated using Bar chart 1.
Chart 1
A Research on Examining Critical Success factors towards the Application of Green Technology in Rural Business by Rural People in Madurai District 19
TSM Business Review, Vol. 4, No. 2, December 2016
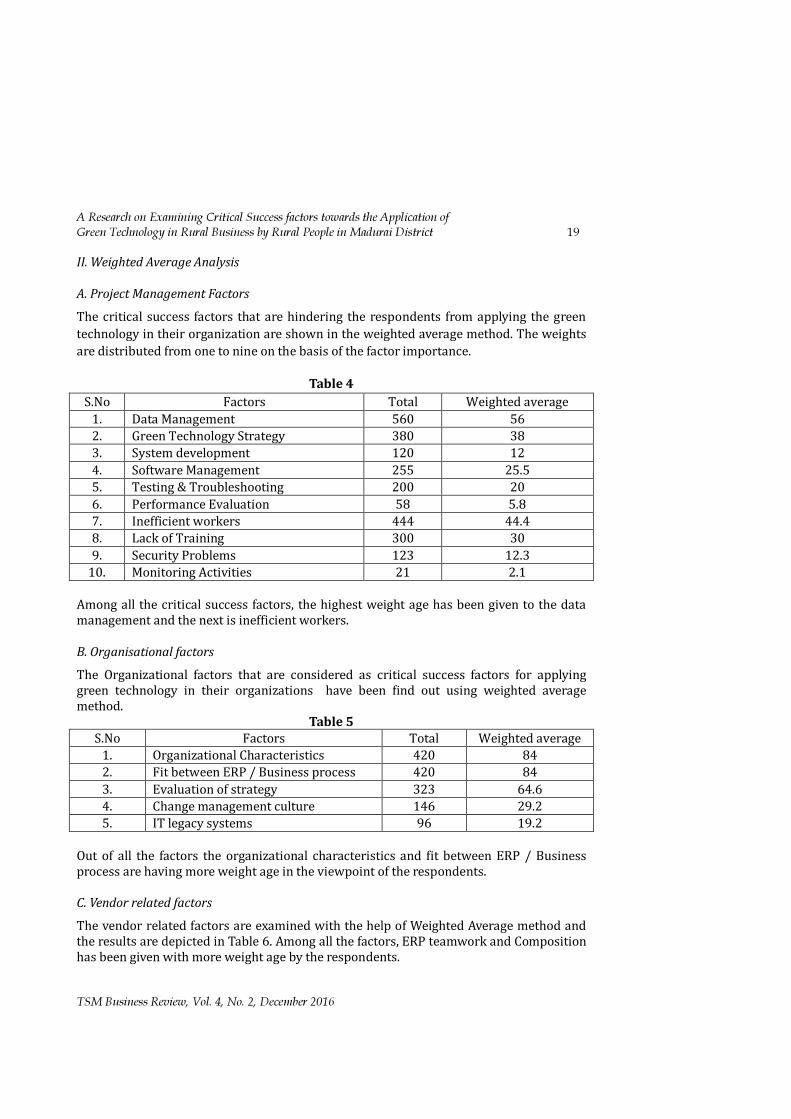
II. Weighted Average Analysis A. Project Management Factors The critical success factors that are hindering the respondents from applying the green technology in their organization are shown in the weighted average method. The weights are distributed from one to nine on the basis of the factor importance.
Table 4 S.No Factors Total Weighted average
1. Data Management 560 56 2. Green Technology Strategy 380 38 3. System development 120 12 4. Software Management 255 25.5 5. Testing & Troubleshooting 200 20 6. Performance Evaluation 58 5.8 7. Inefficient workers 444 44.4 8. Lack of Training 300 30 9. Security Problems 123 12.3
10. Monitoring Activities 21 2.1 Among all the critical success factors, the highest weight age has been given to the data management and the next is inefficient workers. B. Organisational factors The Organizational factors that are considered as critical success factors for applying green technology in their organizations have been find out using weighted average method.
Table 5 S.No Factors Total Weighted average
1. Organizational Characteristics 420 84 2. Fit between ERP / Business process 420 84 3. Evaluation of strategy 323 64.6 4. Change management culture 146 29.2 5. IT legacy systems 96 19.2
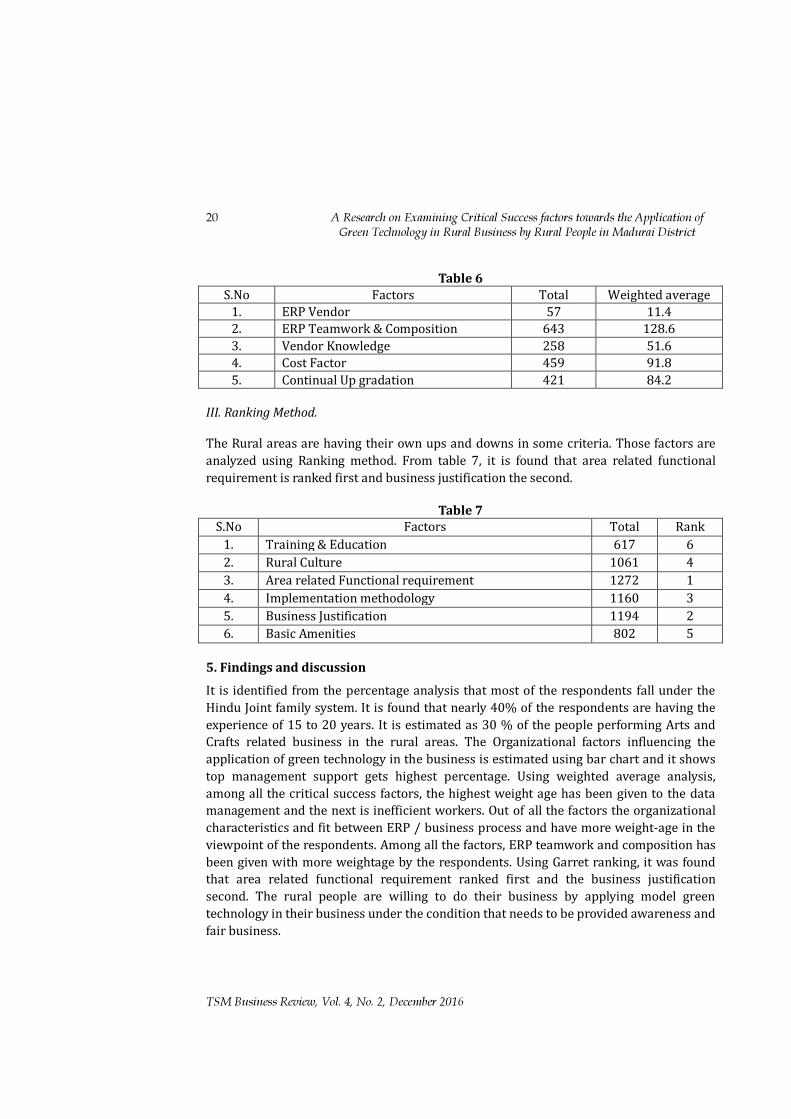
Out of all the factors the organizational characteristics and fit between ERP / Business process are having more weight age in the viewpoint of the respondents. C. Vendor related factors The vendor related factors are examined with the help of Weighted Average method and the results are depicted in Table 6. Among all the factors, ERP teamwork and Composition has been given with more weight age by the respondents.
20 A Research on Examining Critical Success factors towards the Application of Green Technology in Rural Business by Rural People in Madurai District
TSM Business Review, Vol. 4, No. 2, December 2016
Table 6
S.No Factors Total Weighted average 1. ERP Vendor 57 11.4 2. ERP Teamwork & Composition 643 128.6 3. Vendor Knowledge 258 51.6 4. Cost Factor 459 91.8 5. Continual Up gradation 421 84.2
III. Ranking Method. The Rural areas are having their own ups and downs in some criteria. Those factors are analyzed using Ranking method. From table 7, it is found that area related functional requirement is ranked first and business justification the second.
Table 7 S.No Factors Total Rank
1. Training & Education 617 6 2. Rural Culture 1061 4 3. Area related Functional requirement 1272 1 4. Implementation methodology 1160 3 5. Business Justification 1194 2 6. Basic Amenities 802 5
5. Findings and discussion It is identified from the percentage analysis that most of the respondents fall under the Hindu Joint family system. It is found that nearly 40% of the respondents are having the experience of 15 to 20 years. It is estimated as 30 % of the people performing Arts and Crafts related business in the rural areas. The Organizational factors influencing the application of green technology in the business is estimated using bar chart and it shows top management support gets highest percentage. Using weighted average analysis, among all the critical success factors, the highest weight age has been given to the data management and the next is inefficient workers. Out of all the factors the organizational characteristics and fit between ERP / business process and have more weight-age in the viewpoint of the respondents. Among all the factors, ERP teamwork and composition has been given with more weightage by the respondents. Using Garret ranking, it was found that area related functional requirement ranked first and the business justification second. The rural people are willing to do their business by applying model green technology in their business under the condition that needs to be provided awareness and fair business.
A Research on Examining Critical Success factors towards the Application of Green Technology in Rural Business by Rural People in Madurai District 21
TSM Business Review, Vol. 4, No. 2, December 2016
6. Conclusion The recent changes in the rural markets seem to be more influencing and challenging one. The nature and the type of traditional rural market have been completely transformed into new versatile modern markets. The revolution which took almost 60 years has been more interesting and confirmed its dimension at all part of the country. Rural markets have been witnessing all the developments and the amendment with reference to the business. The rural market boom is a currently hot topic. But the level of acceptance in the rural business by the rural people is something different. They thought that it is highly risky nature to change everything into green technology and are bit cautious as well as slow and steady. References Agawam, B. C. (1981). SITE Social Evaluation: Research experiences, and implications:
Space Application Centre, Ahmedabad Agrawal, B. (2006). Communication technologies and rural development in India:
promises and performances. Indian Media Studies Journal. Vol 1.july-dec. www.satishserial.com/issn0972-9348/finaljournal01.pdf
Andersen, K. V. & Henriksen, H. Z. (2006). E-Government maturity models: Extension of the Layne and Lee model. Government Information Quarterly, 23(2), 236-248.
Annamalai, K. & Rao, S. (2003). What works: ITC’s e-choupal and profitable rural transformation web-Based information and procurement tools for Indian farmers, Jointly published as “What Works Case Study” by World Resources Institute, Digital Dividend and University of Michigan, (August 2003) (accessed in March, 2005 from <http://www. digitaldividend.org / pdf/echoupal_case.pdf>, via Google, http://www.google.com).
Bronwyn, H. H. , Helmerse, C. (2013). Innovation and diffusion of clean/green technology: Can patent commons help?, Journal of Environmental Economics and Management, 66(1), 33–51
Coyne, K. P. (1986). Sustainable competitive advantage—What it is, what it isn’t. Business Horizons 29(1),54–61.
Hart, S. L. (1995). A natural-resource-based view of the firm. Academy of Management Review 20(4):986–1014.
Kelly, S. G. & Erich, M. (2011). Giving green to get green? Incentives and consumer adoption of hybrid vehicle technology, Journal of Environmental Economics and Management, 61(1), 1–15.
Khanduja, D., & Prabhakar K., (2008). Synergising entrepreneurship, incubated business and socioeconomic upliftment in rural India, International journal of Entrepreneurship and Small Business, 6(1).
Rajandran, K. V. R. (2013). Green technologies and business practices: a study on rural microenterprises in PURA scheme villages of Thanjavur District, Tamil Nadu, India, International Journal of Environment and Sustainable Development, 12(2).
22 A Research on Examining Critical Success factors towards the Application of Green Technology in Rural Business by Rural People in Madurai District
TSM Business Review, Vol. 4, No. 2, December 2016
Shrivastava, P. (1995). Environmental technologies and competitive advantage. Strategic Management Journal 16(Special issue),183–200.
Tin, S., Frank, T. & Cornelius, H. (2012). Green innovation in technology and innovation management – an exploratory literature review. R & D Management, 42 (2). 180–192.
Vetrickarthick , R., Swarna, l. C. & Asha, N. (2015). Conceptual frame work for the mapping of management process with information technology in a business process, Scientific World Journal, Article ID 983832(Issn : 1537-744x (Online)
Vetrickarthick, R., Swarnalatha, C. (2014). Fundamentals of Enterprise Resource Planning, Himalaya Publishing House, Mumbai, ISBN: 978-93-5142-137-5, first edition .
Yu-Shan, C., Shyh-Bao, L., & Chao-Tung, W.(2006) The influence of green innovation performance on corporate advantage in Taiwan, Journal of Business Ethics, 67(4), 331–339.
Article ISSN: 2348-3784
Dr. Parikshit Joshi, Assistant Professor, Amity Business School, Amity University Uttar Pradesh, Noida, UP, India. E Mail: [email protected]. Postal Address: C-51, Kurmanchal Nagar, Near Alma Mater School, Bareilly, (U.P.) – 243001. Phone: +91-9719945689 Richa Rastogi, Assistant Professor, BBA department, Bareilly college, Bareilly -U.P. Postal Address: 89 Gandhi Nagar, near M.B. inter college, Bareilly (U.P.) - 243122. Phone: +91-8126694140. E Mail: [email protected]
How Receptive Consumers are towards Green Advertisements: A Case of Western Uttar Pradesh, India
Digital Object Identifier:10.23837/tbr/2016/v4/n2/128862
Parikshit Joshi and Richa Rastogi Abstract Green advertising is becoming increasingly popular in today's society across product categories and sectors. Many researchers have examined consumer receptivity to green ad claims and the effects of claim presence and claim type on ad credibility. But a question still prevails that if consumers have positive attitudes towards environmental protection and they are willing to accept green marketing, why that doesn’t translate into positive ad response and consumption behaviors. This study aims at identifying how individual characteristics may influence consumers to be more or less receptive to ecologically themed ad claims. Washing detergent was chosen as the product with three different ad themes based on strong claim, weak claim and cause related-marketing claim, one control ad was also designed. Ad claims were related to environment protection. On the basis of constructs of theoretical model a questionnaire was framed and same questionnaire was used with all ad claims. The respondents for the study were those customers who are visiting washing powder section of 4 supermarkets of Western Uttar Pradesh (U.P). 400 respondents were targeted but only 218 completely filled questionnaires came back. Factor analysis and reliability analysis were used at initial stage of data analysis then Structural Equation Modeling was used to plot the factors. The results suggest that consumers with positive attitudes toward environmental protection are equally receptive to all conditions tested. Findings also reveal that higher the degree of perceived consumer effectiveness in an individual, higher will be his concern for environment. Keywords: Green marketing, Green ads, Strong Product claim, Weak product claim, Cause-related marketing appeal 1. Introduction Mankind is becoming ever more susceptible to disasters (Huppert HE, Sparks R.S., 2006). Some of the disasters are natural such as tsunami, earthquakes and so on whereas for
24 How Receptive Consumers are towards Green Ads: A Case of Western Uttar Pradesh, India
TSM Business Review, Vol. 4, No. 2, December 2016
some disasters, such as depletion of ozone, contamination of ground water, human actions are responsible. Even the small human activity like use of household detergents contribute to phosphate loading in ground water and contaminate it and hence had significant contribution towards environment pollution (Richards A., 2003). On the contrary it has also been observed in last few years human concern and sensitivity towards environment had tremendously increased (Chitra, 2007 ; Haytko Diana L. and MatulichErika, 2008) due to certain issues such as - escalating environmental regulations by governments, growing pressures by stakeholder groups on organizations to defend the environment, and rising concern of the community regarding the destructive consequence of certain industry practices on the ecology (Gura˘u and Ranchhod, 2005; Menon and Menon, 1997; Polonsky and Rosenberger, 2001; Sriram and Forman, 1993). The solution to budding environmental problems could be augmented use of environment friendly products or green products which can be marketed through green marketing. Green marketing as defined by American Marketing Association is the efforts by organizations to produce, promote, package, and reclaim products in a manner that is sensitive or responsive to ecological concerns. One of the marketing tools used by organizations is environmental or green advertising (Haytko Diana L. and Matulich Erika, 2008). Green marketing activities include launching and promoting green products and services that satisfy customers’ environmental wants and needs without a harmful impact on the environment (Polonsky, 1994). Green Marketing and advertising has become a buzz word now a day. Recent evidence has shown that green advertising has grown exponentially in the last two decades (Futerra, 2008; Dai Xin, GohTiong-Thye and Cheng Si, 2014)). Green advertising is becoming increasingly common in today's society and across product categories and sectors (Crane 2000). Indian firms develop green marketing innovations that are intended to serve as competitive advantage in the market (Kumar P. 2015). In spite of increase in green advertising activity still consumers are skeptical about its credibility validity, and usefulness (Tucker et al., 2012) also they doubt the reliability of information on which to base buying decisions about products that make claims about environmental benefits (Ad Complaints Report, 2007). Currently, an overwhelming majority of consumers voice concern about the state of the environment; however, only a select few mirror their intentions with actual green behaviours (Gleim M., Lawson S.J., 2014). Understanding consumer response toward environmentally based advertisements is an essential problem in green marketing due to consumer skepticism about environmental claims in ads in general (Kangun et al. 1991 and Mayer et al. 1993). The tremendous support voiced for protecting the planet through green consumption has been met with
How Receptive Consumers are towards Green Ads: A Case of Western Uttar Pradesh, India 25
TSM Business Review, Vol. 4, No. 2, December 2016
underwhelming results (Gleim M. and Lawson S.J., 2014). There has been little or no research that looks at immediate consumer response to greening commercials. Many researches have examined consumer receptivity to green ad claims (e.g., Ellen, Wiener, and Cobb-Walgren 1991) and the effects of claim presence and claim type on credibility (Carlson, Grove, and Kangun 1993). But a question still prevail that if consumers have positive attitudes toward environmental protection and they are willing to accept green marketing, why doesn't that translate into positive ad response and consumption behaviors (Gleim and Lawson, 2014; Tucker et al., 2012; Rahbar and Wahid, 2011; Lee, 2009; Lee 2008; D Souza 2004). Few studies examined consumer response to reasonable claims (Tucker et al., 2012; Manrai et al. 1997; Thorson, Page, and Moore 1995), leaving a significant gap in this research stream. Hence the following study been planned to understand:
• How individual characteristics may influence consumers to be more or less receptive to ecologically themed ad claims.
• Up to what extent environment conscious consumer(s) prefer green product(s). Green ads are capable of changing the opinion of the customers by convince the customer for the product. This study will be useful for the companies to design their advertisements to attract more customers towards green products. In order to address the issue raised, we have started our study by developing a theoretical model showing the impact of perceived consumer effectiveness on advertisement credibility. Three forms of eco-ad appeals are compared for their relative effects on consumer response, using a non-ecological appeal as a control. The three types of appeals that are compared are the use of (1) a strong product claim, (2) a weak product claim, and (3) a cause-related marketing appeal that makes no product claims, but offers to support environmental protection with a donation to a not-for-profit environmental advocacy group. Based on types of above three types of claim, three different ad themes of a single product were developed (Annexure 1). Washing detergent was chosen as the product and an imaginary company was conceptualized with three different ad themes. On the basis of constructs of theoretical model a questionnaire was framed and same questionnaire is used with all ad claims. Data was collected through questionnaire and using structural equation modelling approach constructs were modelled. 2. Literature Review Among the top 10 predictors of environmentally conscious behavior, PCE was found to be the best to predict ecological attitude (Kinnear et al., 1974) and resulted in ecologically conscious consumption and ecological responsible consumption patterns such as energy saving and purchase of non-polluting products (Tan, 2011). Also people with higher PCE have proven to be more environmentally concerned (Kim and Choi, 2005). Theory model (Figure 1) for the research is based on the model proposed by Tucker et al., 2012.
26 How Receptive Consumers are towards Green Ads: A Case of Western Uttar Pradesh, India
TSM Business Review, Vol. 4, No. 2, December 2016
The model proposed by Tucker establishes a relationship between Perceived Consumer Effectiveness (PCE) and Ad Credibility. Perceived Consumer Effectiveness (PCE) Many studies have analyzed the premise that consumers' attitudes and responses to environmental concerns are directly related to their belief that they can make a positive difference in the results of those concerns (Gul, 2013). This belief is termed as perceived consumer effectiveness (PCE). Perceived consumer effectiveness (PCE) is a trait-like personality characteristic (Tucker et al., 2012) which shows that even if consumers are concerned about the environment, they may not act on this concern without a sense of empowerment. PCE is one of the most important constructs in a model of ecological consumption behavior and in explaining the relationship between individual consumer behaviors and environmental attitudes (Berger and Corbin 1992). Environmental Concerns The concern of companies towards Environment is an important force that immensely influences the decision making ability of consumers (Jain &Kaur, 2004). Many studies exemplify that consumers having immense environmental concern are more likely to assess the effects of their purchase behaviors on the environment (Follows & Jobber, 2000; Nath et al., 2013). With the increasing environmental concerns, leads to an increase in environmentally friendly purchase behaviors (Manakotla&Jauhari, 2007; Laroche et al., 2001; Kalafatis et al., 1999;). Kim and Choi (2005) affirm that consumers who are more aligned towards environmental concerna are expected to buy more green products in contrast to others. Thus, such an elevated degree of environmental concern of the consumers will lead to an increase in green buying behavior. Outcomes of several studies advocated the consumer with higher levels of environmental concern are more liable to engage in ecologically conscious consumer behavior (Shetzer, Stackman, and Moore 1991; Hiñes, Hungerford, and Tomera 1987). Gill, Crosby, and Taylor (1986) found that specific attitudinal, normative, and behavioral intention variables facilitate the effects of environmental concern on buying behavior. Zimmer, Stafford, and Stafford (1994) recognized over 50 different "green" issues that could cause consumer concern, and they highlighted the necessity to distinguish between a generalized concern of the consumers for the environment and issue-specific concerns of the consumers, whose prospective to drive behavior research profiling environmentally concerned consumers often integrates a behavioral component intended to distinguish the merely concerned from action-oriented eco-consumers (Henion 1976; Henion, Gregory, and Clee 1981). Kinnear and Taylor (1973) and Kinnear, Taylor, and Ahmed (1974) suggested two dimensions of environmental concern: (i) Environment Behavior (ii)Environmental Activism Behavior.
How Receptive Consumers are towards Green Ads: A Case of Western Uttar Pradesh, India 27
TSM Business Review, Vol. 4, No. 2, December 2016
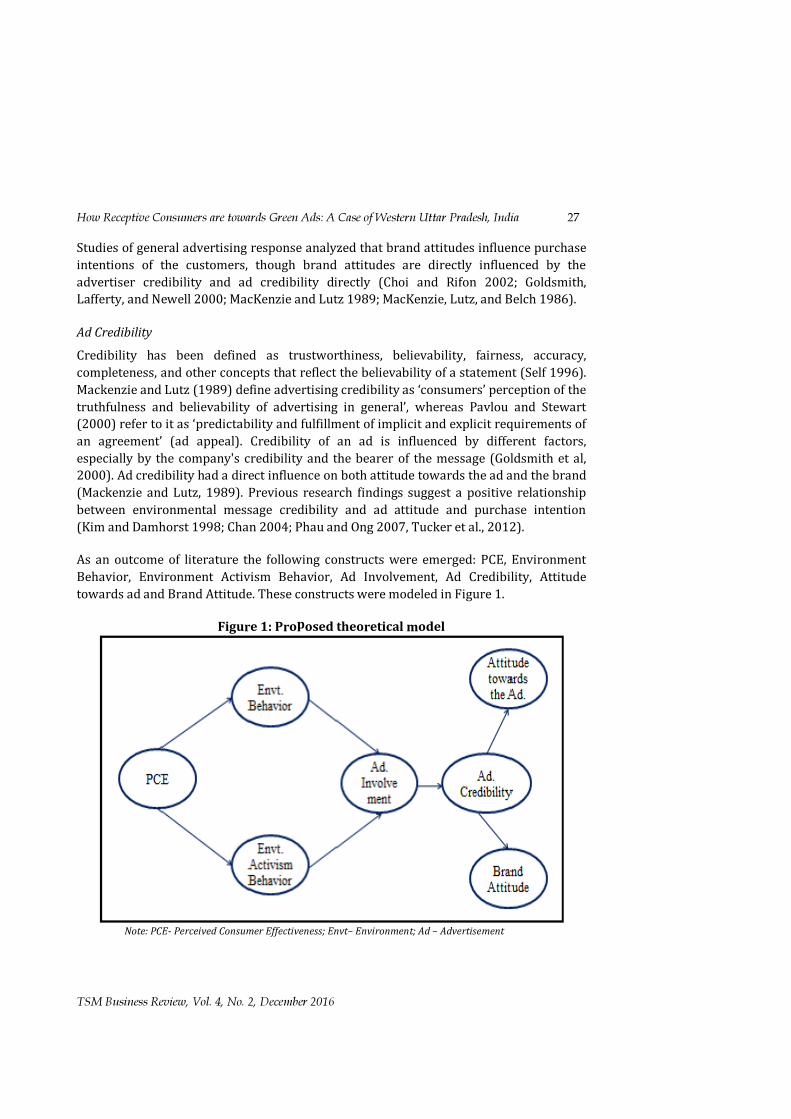
Studies of general advertising response analyzed that brand attitudes influence purchase intentions of the customers, though brand attitudes are directly influenced by the advertiser credibility and ad credibility directly (Choi and Rifon 2002; Goldsmith, Lafferty, and Newell 2000; MacKenzie and Lutz 1989; MacKenzie, Lutz, and Belch 1986). Ad Credibility Credibility has been defined as trustworthiness, believability, fairness, accuracy, completeness, and other concepts that reflect the believability of a statement (Self 1996). Mackenzie and Lutz (1989) define advertising credibility as ‘consumers’ perception of the truthfulness and believability of advertising in general’, whereas Pavlou and Stewart (2000) refer to it as ‘predictability and fulfillment of implicit and explicit requirements of an agreement’ (ad appeal). Credibility of an ad is influenced by different factors, especially by the company's credibility and the bearer of the message (Goldsmith et al, 2000). Ad credibility had a direct influence on both attitude towards the ad and the brand (Mackenzie and Lutz, 1989). Previous research findings suggest a positive relationship between environmental message credibility and ad attitude and purchase intention (Kim and Damhorst 1998; Chan 2004; Phau and Ong 2007, Tucker et al., 2012). As an outcome of literature the following constructs were emerged: PCE, Environment Behavior, Environment Activism Behavior, Ad Involvement, Ad Credibility, Attitude towards ad and Brand Attitude. These constructs were modeled in Figure 1.
Figure 1: Proposed theoretical model
Note: PCE- Perceived Consumer Effectiveness; Envt– Environment; Ad – Advertisement
28 How Receptive Consumers are towards Green Ads: A Case of Western Uttar Pradesh, India
TSM Business Review, Vol. 4, No. 2, December 2016
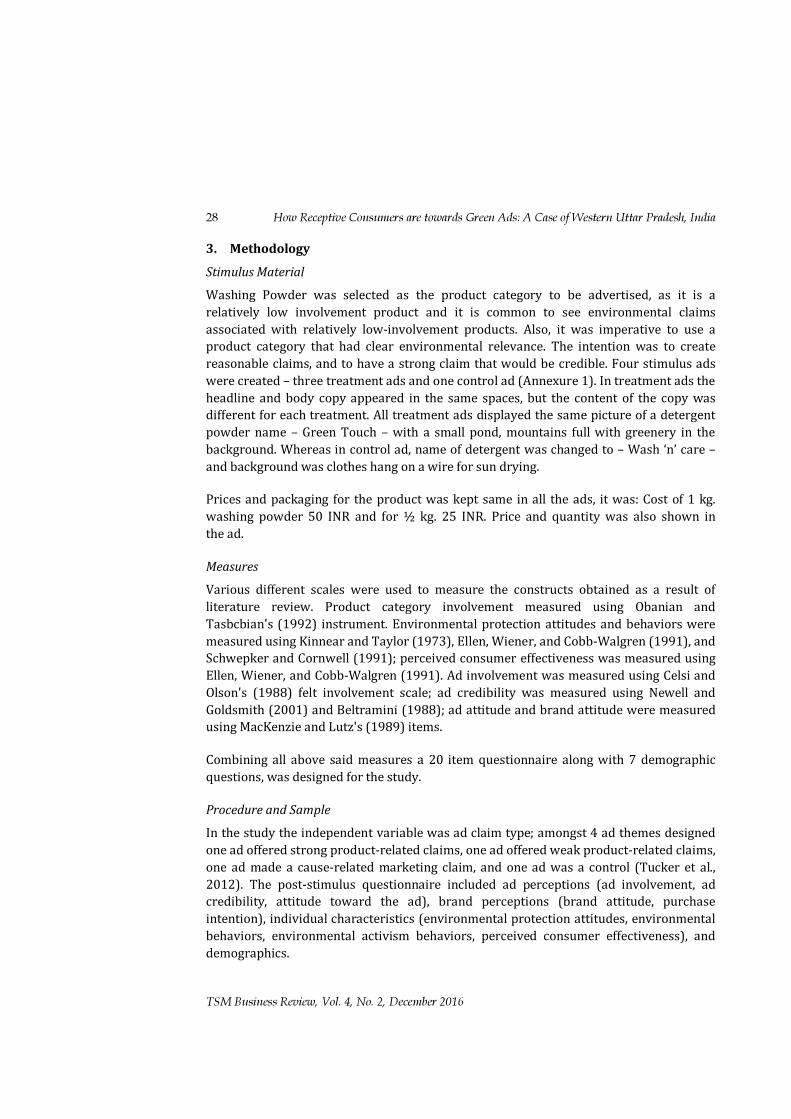
3. Methodology Stimulus Material Washing Powder was selected as the product category to be advertised, as it is a relatively low involvement product and it is common to see environmental claims associated with relatively low-involvement products. Also, it was imperative to use a product category that had clear environmental relevance. The intention was to create reasonable claims, and to have a strong claim that would be credible. Four stimulus ads were created – three treatment ads and one control ad (Annexure 1). In treatment ads the headline and body copy appeared in the same spaces, but the content of the copy was different for each treatment. All treatment ads displayed the same picture of a detergent powder name – Green Touch – with a small pond, mountains full with greenery in the background. Whereas in control ad, name of detergent was changed to – Wash ‘n’ care – and background was clothes hang on a wire for sun drying. Prices and packaging for the product was kept same in all the ads, it was: Cost of 1 kg. washing powder 50 INR and for ½ kg. 25 INR. Price and quantity was also shown in the ad. Measures Various different scales were used to measure the constructs obtained as a result of literature review. Product category involvement measured using Obanian and Tasbcbian's (1992) instrument. Environmental protection attitudes and behaviors were measured using Kinnear and Taylor (1973), Ellen, Wiener, and Cobb-Walgren (1991), and Schwepker and Cornwell (1991); perceived consumer effectiveness was measured using Ellen, Wiener, and Cobb-Walgren (1991). Ad involvement was measured using Celsi and Olson's (1988) felt involvement scale; ad credibility was measured using Newell and Goldsmith (2001) and Beltramini (1988); ad attitude and brand attitude were measured using MacKenzie and Lutz's (1989) items. Combining all above said measures a 20 item questionnaire along with 7 demographic questions, was designed for the study. Procedure and Sample In the study the independent variable was ad claim type; amongst 4 ad themes designed one ad offered strong product-related claims, one ad offered weak product-related claims, one ad made a cause-related marketing claim, and one ad was a control (Tucker et al., 2012). The post-stimulus questionnaire included ad perceptions (ad involvement, ad credibility, attitude toward the ad), brand perceptions (brand attitude, purchase intention), individual characteristics (environmental protection attitudes, environmental behaviors, environmental activism behaviors, perceived consumer effectiveness), and demographics.
How Receptive Consumers are towards Green Ads: A Case of Western Uttar Pradesh, India 29
TSM Business Review, Vol. 4, No. 2, December 2016
For data collection work supermarkets located at Bareilly, Moradabad, Ghaziabad and Noida were identified. All identified cities lie in western U.P. 4 different teams each having 5 students (20 students total) were made and were given a separate ad theme (see Annexure 1 for ad themes). 100 questionnaires were given to each team (400 questionnaires total). Research team was appointed in the following stores Bareilly – Big Bazar, Phoenix Mall; Moradabad – Lasa Mart; Ghaziabad – Big Bazar and Noida – Big Bazar.Team targeted people (respondents) who are visiting washing detergent sections in respective stores. Respondents were chosen randomly, every third visitor was asked to look ad and fill questionnaire. 400 respondents were targeted, but only 218 usable questionnaires were obtained. A breakdown of the sample reveals that 15% of the respondents were males and 85% female. Data Analysis The data was entered into Microsoft Excel-2007 and then transferred to Statistical Package for Social Sciences (SPSS 19.0). Reliability (Cronbach’s alpha) of the study was tested for individual items (Joshi P. et.al, 2015). Then using factor analysis (Principal axis factoring with Varimax rotation) 5 factors were extracted and then those factors were plotted using Lisrel 8.54. 4. Results Data collected was entered into MS excel – 2007 sheet and then imported to SPSS (19.0). Data analysis was started with data cleaning and then factor analysis was run, as a result of which 7 factors were obtained which were in accordance with our theory model shown in Figure 1. The obtained factors are further treated as summated scales for reliability analysis. Result of reliability analysis reveal that all the scales (factors) are reliable as there individual reliability is more than .7. At last all the obtained factors were plotted using Structural Equation Modeling. Factor Analysis Factor analysis is a generic name for one multivariate technique used to ascertain the underlying structure of a data matrix (Hair et al., 1995). The exploratory factor analysis was used and the number of factors (seven factors) extracted were in accordance with literature. 20 item of the questionnaire were treated with the Principal Axis Factoring method along with varimax rotation and as a result following five factors were generated: Ad involvement, Environment Activism Behavior, Ad Credibility, Brand Attitude and Environment Behavior, PCE attitude towards ad. The extracted factors along with their sample questions are shown in table 1. Only those factors have been taken into consideration whose Eigen values are 1 or greater (Hair et al., 1995) (Table 1). The percentage of variance extracted by factors 1 to 7 were 17.761%, 16.537%, 13.035%, 8.441%, 7.735%, 6.713%, 5.836% respectively.

30 How Receptive Consumers are towards Green Ads: A Case of Western Uttar Pradesh, India
TSM Business Review, Vol. 4, No. 2, December 2016
The rotation converged in 7 iterations to yield seven factors explaining 76.058 % of total variance. Reliability Analysis Factor analysis results in 7 summated scales (factors). Next task is to test reliability of every individual scale to measure the internal consistency among the variables of the scale. Table 2 shows result for reliability analysis. Cronbach’s alpha value scale is greater than .7 (Hair et al., 1995) for every individual item of the and also for every summated scale (Factor) which indicates a very high internal consistency amongst the items of summated scale (Factors) (see Table 2).
Table 1: Factor analysis
ROTATED FACTOR MATRIX EIGEN VALUES
% OF VARIANCE FACTOR NAME ITEM FACTOR
1 2 3 4 5 6 7f AD INVOLVEMENT
The message in the ad was important to me. .531
2.935 17.761 The advertisement did not do anything to meet my needs. .525
ENVIRONMENT ACTIVISM BEHAVIOR
I have worked for environmental groups or causes. .699
2.467 16.537 I have donated money to an environmental protection group(s). .833
I have signed a petition in favor of protection of some part of the environment. .695
AD CREDIBILITY Product displayed in the advertisement is: Believable / Unbelievable .508
2.182 13.035
Product displayed in the advertisement is: convincing / non convincing .590
Product displayed in the advertisement is: Honest /dishonest .892
Product displayed in the advertisement is: authentic / Non authentic .634
BRAND ATTITUDE Buying this brand (displayed on advertisement) of washing powder is a good decision. .837
1.849 8.441
I think this is a satisfactory brand of washing powder. .864 I have a favorable opinion of this brand of washing powder. .830 I like this brand of washing powder. .827
ENVIRONMENT BEHAVIOR
When I buy products, I try to consider how my use will affect the environment. .611
1.067 7.735 Whenever possible, I buy the
products I consider environmental friendly. .875

How Receptive Consumers are towards Green Ads: A Case of Western Uttar Pradesh, India 31
TSM Business Review, Vol. 4, No. 2, December 2016
PCE There is not much that any one individual can do to protect the environment.
.734 1.041 6.713 An individual can protect the
environment by buying products that are kind to the environment.
.631
ATTITUDE TOWARDS AD
Good/bad .545 1.003 5.836 Pleasant/unpleasant .508
Favorable/unfavorable .501 Note: Extraction Method: Principal Axis Factoring. Rotation Method: Varimax with Kaiser Normalization. Rotation converged in 10 iterations.
Total Variance:
76.058
Table 2: Reliability analysis
FACTOR NAME ITEM Scale
Mean if Item
Deleted
Scale Variance
if Item Deleted
Corrected Item-Total Correlation
Cronbach’s Alpha if
Item Deleted
Total Reliability
of the summated
scale
AD INVOLVEMENT
The message in the ad was important to me. 24.82 55.957 .694 .912
.830 The advertisement did not do anything to meet my needs.
25.18 53.278 .746 .909
ENVIRONMENT ACTIVISM BEHAVIOR
I have worked for environmental groups or causes.
25.02 52.775 .793 .904
.920 I have donated money to an environmental protection group(s).
24.16 60.534 .718 .913
I have signed a petition in favor of protection of some part of the environment.
25.01 54.052 .775 .906
AD CREDIBILITY
Product displayed in the advertisement is: Believable / Unbelievable
24.36 58.707 .759 .909
.766
Product displayed in the advertisement is: convincing / non convincing
25.35 54.868 .724 .910
Product displayed in the advertisement is: Honest /dishonest
24.89 54.068 .729 .910
Product displayed in the advertisement is: authentic / Non authentic
23.41 26.899 .757 .879
BRAND ATTITUDE
Buying this brand (displayed on advertisement) of washing powder is a good decision.
17.71 29.939 .732 .882 .840
I think this is a satisfactory brand of washing powder.
17.61 30.860 .706 .886
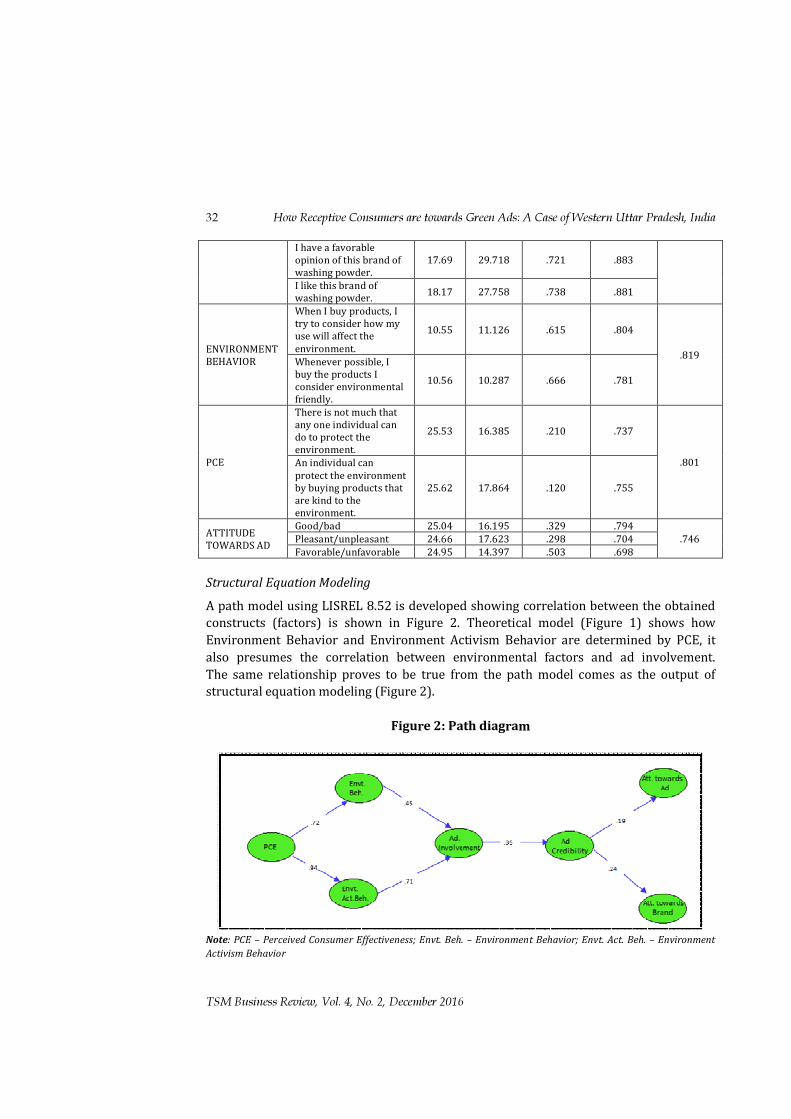
32 How Receptive Consumers are towards Green Ads: A Case of Western Uttar Pradesh, India
TSM Business Review, Vol. 4, No. 2, December 2016
I have a favorable opinion of this brand of washing powder.
17.69 29.718 .721 .883
I like this brand of washing powder. 18.17 27.758 .738 .881
ENVIRONMENT BEHAVIOR
When I buy products, I try to consider how my use will affect the environment.
10.55 11.126 .615 .804
.819 Whenever possible, I buy the products I consider environmental friendly.
10.56 10.287 .666 .781
PCE
There is not much that any one individual can do to protect the environment.
25.53 16.385 .210 .737
.801 An individual can protect the environment by buying products that are kind to the environment.
25.62 17.864 .120 .755
ATTITUDE TOWARDS AD
Good/bad 25.04 16.195 .329 .794 .746 Pleasant/unpleasant 24.66 17.623 .298 .704
Favorable/unfavorable 24.95 14.397 .503 .698 Structural Equation Modeling A path model using LISREL 8.52 is developed showing correlation between the obtained constructs (factors) is shown in Figure 2. Theoretical model (Figure 1) shows how Environment Behavior and Environment Activism Behavior are determined by PCE, it also presumes the correlation between environmental factors and ad involvement. The same relationship proves to be true from the path model comes as the output of structural equation modeling (Figure 2).
Figure 2: Path diagram
Note: PCE – Perceived Consumer Effectiveness; Envt. Beh. – Environment Behavior; Envt. Act. Beh. – Environment Activism Behavior
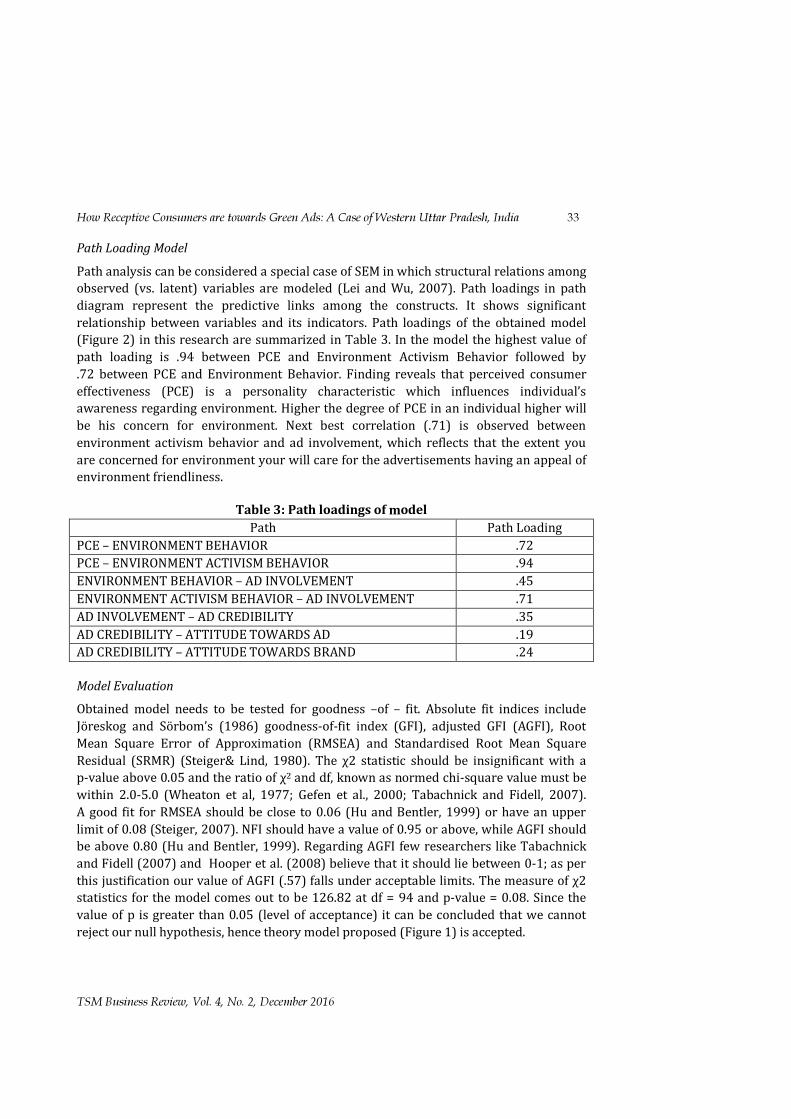
How Receptive Consumers are towards Green Ads: A Case of Western Uttar Pradesh, India 33
TSM Business Review, Vol. 4, No. 2, December 2016
Path Loading Model Path analysis can be considered a special case of SEM in which structural relations among observed (vs. latent) variables are modeled (Lei and Wu, 2007). Path loadings in path diagram represent the predictive links among the constructs. It shows significant relationship between variables and its indicators. Path loadings of the obtained model (Figure 2) in this research are summarized in Table 3. In the model the highest value of path loading is .94 between PCE and Environment Activism Behavior followed by .72 between PCE and Environment Behavior. Finding reveals that perceived consumer effectiveness (PCE) is a personality characteristic which influences individual’s awareness regarding environment. Higher the degree of PCE in an individual higher will be his concern for environment. Next best correlation (.71) is observed between environment activism behavior and ad involvement, which reflects that the extent you are concerned for environment your will care for the advertisements having an appeal of environment friendliness.
Table 3: Path loadings of model
Path Path Loading PCE – ENVIRONMENT BEHAVIOR .72 PCE – ENVIRONMENT ACTIVISM BEHAVIOR .94 ENVIRONMENT BEHAVIOR – AD INVOLVEMENT .45 ENVIRONMENT ACTIVISM BEHAVIOR – AD INVOLVEMENT .71 AD INVOLVEMENT – AD CREDIBILITY .35 AD CREDIBILITY – ATTITUDE TOWARDS AD .19 AD CREDIBILITY – ATTITUDE TOWARDS BRAND .24 Model Evaluation Obtained model needs to be tested for goodness –of – fit. Absolute fit indices include Jöreskog and Sörbom’s (1986) goodness-of-fit index (GFI), adjusted GFI (AGFI), Root Mean Square Error of Approximation (RMSEA) and Standardised Root Mean Square Residual (SRMR) (Steiger& Lind, 1980). The χ2 statistic should be insignificant with a p-value above 0.05 and the ratio of χ2 and df, known as normed chi-square value must be within 2.0-5.0 (Wheaton et al, 1977; Gefen et al., 2000; Tabachnick and Fidell, 2007). A good fit for RMSEA should be close to 0.06 (Hu and Bentler, 1999) or have an upper limit of 0.08 (Steiger, 2007). NFI should have a value of 0.95 or above, while AGFI should be above 0.80 (Hu and Bentler, 1999). Regarding AGFI few researchers like Tabachnick and Fidell (2007) and Hooper et al. (2008) believe that it should lie between 0-1; as per this justification our value of AGFI (.57) falls under acceptable limits. The measure of χ2 statistics for the model comes out to be 126.82 at df = 94 and p-value = 0.08. Since the value of p is greater than 0.05 (level of acceptance) it can be concluded that we cannot reject our null hypothesis, hence theory model proposed (Figure 1) is accepted.
34 How Receptive Consumers are towards Green Ads: A Case of Western Uttar Pradesh, India
TSM Business Review, Vol. 4, No. 2, December 2016
As shown in Table 4, RMSEA is 0.017, RMR is 0.028, SRMS is .109, GFI is 0.90, AGFI is 0.57, CFI is 0.96 and NFI is 0.97 for the model which satisfies the criteria for goodness-of-fit. So it can be interpreted that hypothesis model is perfect fit with the data collected.
Table 4: Goodness – of – fit measures for SEM S.No Goodness of fit measure Model
Value Level of Acceptance 1 Degree of freedom (df) 85 2 p-value .08 3 Chi-square 359.00 4 Normed chi-square (χ2/df) 4.22 5.0 – 2.0 (Wheaton et al, 1977;
Tabachnick and Fidell, 2007) 5 RMSEA (Root mean square
error of approximation) .017 0-0.8(MacCallum et al, 1996; McQuitty, 2004)
6 SRMR (standardised root mean square residual) .109 0 – 1 (Byrne, 1998; Diamantopoulos
and Siguaw, 2000) 7 Goodness of Fit Index (GFI) .90 0 – 1 (Tabachnick and Fidell,
2007;Hooper et al., 2008) 8 Adjusted Goodness of Fit Index
(AGFI) .57 0 – 1 (Tabachnick and Fidell, 2007; Hooper et al., 2008)
9 Comparative Fit Index (CFI) .96 CFI ≥ 0.90 (Hu and Bentler, 1999) 10 Normed Fit Index (NFI) .97 NFI ≥ .95 (Hu and Bentler, 1999).
5. Conclusion The study was laid its foundation on the presumed reality drawn from the studies of Glaim and Lawson, 2014; Tucker et al., 2012; Manrai et al. 1997; Thorson, Page, and Moore 1995; Mayer et al. 1993; Kangun et al. 1991; Ellen, Wiener, and Cobb-Walgren 1991, and many more researchers. The base theoretical model conceptualized for this study was the model framed by Tucker et al., 2012. In accordance with the same four advertisements were designed from which three were showing a detergent powder with a claim of environment protection and one is control ad having no concern with the environment. On the basis of survey, it is found that it consumers who care about the environment are more receptive to the ecological theme ads (green ads), irrespective of the claim type. In terms of consumer response to green ads, environmental behaviors in general predicted interest in ads with green claims (ad involvement), subsequently enhancing ad credibility. Further it is found that Greater ad credibility generated more positive attitude toward brand attitudes. Consumers who have a high level of involvement perceive the green ad to be more truthful and believable. Therefore, findings of the research suggest that individual consumers who believe that one person's actions can make a difference in environmental protection will engage in more environmental protection behaviors, and

How Receptive Consumers are towards Green Ads: A Case of Western Uttar Pradesh, India 35
TSM Business Review, Vol. 4, No. 2, December 2016
will be more receptive to ecologically themed ads with strong or weak claims, and even cause-related marketing efforts. Based on our study, it is recommended that advocates of environmental protection try to influence an individual's belief that he or she can make a difference with his or her individual behaviors. 6. Limitations and Future Leads to Study Poor response rate is the major limitation of the study. Study was conducted in Bareilly, Moradabad, Ghaziabad and Noida future researches can be carried out on a large scale by taking respondents across the length and width of the country (India). Environmental attitudes are also considered as a construct as it has a direct influence on Perceived Consumer Effectiveness (Berger and Corbin 1992). We have taken low involvement product (washing detergent) for the study, further studies can examine how consumers respond towards claims for high-involvement, high priced products. This study focused only on an imaginary product, future research may be conducted on real green products which consumers may be using, in order to get the most accurate indication of green behaviors (Gleim M., Lawson S.J., 2014). Ecoliteracy can also be a good predictor of consumer willingness to choose green products (Laroche M et al., 2001).In future researches researchers may also include ecoliteracy as a construct for determining green purchase behavior. References Advertisement Complaint Report 2007 Canada.
http://www.adstandards.com/en/consumerComplaints/2007AdComplaintsReport.pdf accessed on 29.11.2015
Barbara, A., Lafferty, Goldsmith, R. E. & Stepben J. N., (2000). The Impact of corporate credibility and celebrity credibility on consumer reaction to advertisements and Bmnds. Journal of Advertising, 29 (3), 43-54.
Beltramini, R. F. (1988). Perceived believability of warning information presented in cigarette aávtrúsmg. Journal of Advertising. 17(2), 26-32.
Berger, Ida E., & Ruth, M. C. (1992). Perceived consumer effectiveness and faith in others as moderators of environmentally responsible behaviors. Journal of Public Policy and Marketing, 11(2), 79-89.
Byrne, B. M. (1998). Structural equation modeling with LISREL, PRELIS and SIMPLIS: basic concepts, applications and programming. Mahwah, New Jersey: Lawrence Erlbaum Associates.
Carlson, L., Stephen, J. G., & Norman, K., (1993). A content analysis of environmental advertising claims: A matrix approach method. Journal of Advertising, 22 (3), 27-39.
Celsi, R. L., & Jerry, C. O., (1988). The Role of Involvement in Attention and Comprehension Processes. Journal of Consumer Research, 15 (2), 210-224.
36 How Receptive Consumers are towards Green Ads: A Case of Western Uttar Pradesh, India
TSM Business Review, Vol. 4, No. 2, December 2016
Chan, R. Y. K., (2004). Consumer responses to environmental advertising in China. Marketing Intelligence and Planning, 22 (4), 427-437.
Chitra, K. (2007). In search of the green consumers: A perceptual study, Journal of Services Research, 7(1), 173-191.
Choi, S. M., & Nora, J. R. (2002). Antecedents and consequences of web advertising credibility: A study of consumer response to banner ads. Journal of Interactive Advertising, 3 (1), 12-24.
Crane, A. (2000). Facing the backlash: Green marketing and strategies reorientation in the l9Ws. Journal of Strategic Marketing. 8(3):277-296.
Dai, X., GohTiong, T. & Cheng Si (2014). A content analysis of green advertising in China, Journal of Marketing Research and Case Studies, Article ID 850595, 19 pages DOI: 10.5171/2014.850595, http://www.ibimapublishing.com/journals/JMRCS/jmrcs.html
Diamantopoulos, A. & Siguaw, J. A. (2000). Introducing LISREL. London: Sage Publications
D'Souza, C. (2004). Eco-label programmes: a stakeholder (consumer) perspective. corporate communications. An International Journal, 9(3), 179-188.
Ellen, P. S., Joshua, L. W., & Cathy, C. W. (1991). The role of perceived consumer effectiveness in motivating environmentally conscious behaviors. Journal of Public Policy and Marketing, 10 (2), 102-117.
Follows, S. B., & Jobber, D. (2000). Environmentally responsible purchase behaviour: a test of a consumer model. European Journal of Marketing, 34(5/6), 723-746. http://dx.doi.org/10.1108/03090560010322009
Futerra (2008), “The greenwash guide”, available at: www.futerra.co.uk/ (accessed 10 August 2010).
Gefen, D., Straub, D., & Boudreau, M. (2000), Structural equation modeling techniques and regression: guidelines for research practice. Communications of the Association for Information Systems, 4 (7), 71-78.
Gill, J. D., Lawrence, A. C., & James, R. T. (1986). Ecological concern, attitudes, and social norms in voting behavior. Public Opinion Quarterly, 50 (4), 537-554.
Gleim, M., Lawson, S. J., (2014). Spanning the gap: an examination of the factors leading to the green gap. Journal of Consumer Marketing, 31(6/7 ), 503 – 514.
Goldsmith, R. E., Lafferty, B. A., & Newell, S. J. (2000). The impact of corporate credibility and celebrity credibility on consumer reaction to advertisements and brands. Journal of Advertising, 29(3), 43-54.
Gul, M. C. (2013). Long-term orientation, perceived consumer effectiveness, and environmentally conscious consumer behavior: The case of Turkey. International Journal of Marketing Studies; 5 (5), ISSN 1918-719X E-ISSN 1918-7203
Gura˘u, C. & Ranchhod, A. (2005). International green marketing: a comparative study of British and Romanian firms, International Marketing Review, 22( 5), 547-62.
Hair J. F. (Jnr.), Anderson R. E., Tatham R. L. & Black, W. C. (1995). Multivariate data analysis ,4th edn., Englewood Cliffs, N.J.: Prentice Hall.
How Receptive Consumers are towards Green Ads: A Case of Western Uttar Pradesh, India 37
TSM Business Review, Vol. 4, No. 2, December 2016
Haytko, D. L. & Matulich, E. (2008). Green advertising and environmentally responsible consumer behaviors: Linkages examined, Journal of Management and Marketing Research, 1, 2-11.
Henion, K., E., Russell, G, & Mona, A. C. (1981). Trade-Offs in attribute levels made by ecologically concerned unconcerned consumers when buying detergents. in Advances in Consumer Research.
Henion, K. E. (1976), Environmental marketing, Columbus, OH: Grid. Hines, J. M., Harold, R. H., & Audrey, N. T. (1987). Analysis and synthesis of research on
responsible environmental behavior: A Meta-Analysis. The Journal of Environmental Education, 18(2), 1-8.
Hooper, D., Coughlan, J., & Mullen, M. (2008). Structural equation modelling: Guidelines for determining model fit structural equation modelling: Guidelines for determining model fit. The Electronic Journal of Business Research Methods, 6(1), 53–60. Retrieved from
Hu, L. & Bentler, P.M. (1999). Cutoff criteria for fit indexes in covariance structure analysis: conventional criteria versus new alternatives. Structural Equation Modeling: A Multidisciplinary Journal, 6 (1), 1-55.
Huppert, H. E, & Sparks, R. S. (2006). Extreme natural hazards: population growth, globalization and environmental change. Philosophical transactions Series A, Mathematical, Physical and engineering science. 364(1845):1875-88.
Jain, S. K., & Kaur, G. (2004). Green marketing: An attitudinal and behavioural analysis of Indian consumer. Global Business Review, 5(2), 187-205. http://dx.doi.org/10.1177/097215090400500203
Jöreskog, K. G. & Sörbom, D. (1986), LISREL VI: Analysis of linear structural relationships by maximum likelihood and least square methods, Mooresville, IN: Scientific Software, Inc.
Joshi, P., Suman, S. K. & Sharma, M.(2015). The effect of emotional intelligence on job satisfaction of faculty: A Structural equation modeling approach. The IUP Journal of Organizational Behavior, XIV (3), pp. 58-70.
Kalafatis, S. P., Pollard, M., East, R., & Tsogas, M. H. (1999). Green marketing and Ajzen’s theory of planned behavior: a cross-market examination. Journal of Consumer Marketing, 16 (5), 441-460. http://dx.doi.org/10.1108/07363769910289550
Kangun, N., Carlson, L. and Grove, S. J. (1991). Environmental advertising claims: A preliminary investigation. Journal of Public Policy & Marketing, 10 (2), 47-58.
Kim, H. S., & Mary, L D. (1998). Environmental concern and apparel consumption, Clothing and Textiles Research Journal, 16(3), 126-133.
Kim, Y. & Choi, S. M. (2005). Antecedents of green purchase behavior: An examination of collectivism, environmental concern and PCE. Advances in Consumer Research. 32: 592-59.
Kinnear, T. C., James, R. T., & Sadrudin, A. A. (1974). Ecologically concerned consumers: Who are they?. Journal of Marketing, 38 (2), 20-24.
Kinnear, T. C, & James, R. T. (1973). The effect of ecological concern on brand perceptions. Journal of Marketing Research, 10 , 191-197.
38 How Receptive Consumers are towards Green Ads: A Case of Western Uttar Pradesh, India
TSM Business Review, Vol. 4, No. 2, December 2016
Kumar, Prashant (2015). Green marketing innovations in small Indian firms. World Journal of Entrepreneurship, Management and Sustainable Development, 11 (3), 176 – 190
Laroche, M., Bergeron, J., & Barbaro-Forleo, G. (2001). Targeting consumers who are willing to pay more for environmentally friendly products. Journal of Consumer Marketing, 18(6), 503-520. http://dx.doi.org/10.1108/EUM0000000006155
Lee, K. (2008). Opportunities for green marketing: young consumers. Marketing Intelligence & Planning, 26(6), 573-586. http://dx.doi.org/10.1108/02634500810902839
Lee, K. (2009). Gender Differences in Hong Kong Adolescent Consumers Green Purchasing Behavior. Journal of Consumer Marketing, 26(2), 87-96. http://dx.doi.org/10.1108/07363760910940456
Lei, P. W., & Wu, Q. (2007). Introduction to Structural equation modeling: Issues and practical considerations, Instruction topic in Educational Measurement, The Pennsylvania State University.
MacCallum, R.C., Browne, M.W., & Sugawara, H., M. (1996), Power analysis and determination of sample size for covariance structure modeling. Psychological Methods, 1 (2), 130-49.
MacKenzie, S. B., & Richard, J. L. (1989). An empirical examination of tbe structural antecedents of attitude toward the ad in an advertising pretesting conitxt. Journal of Marketing, 53 (2), 48-65.
Manakotla, K., & Jauhari, V. (2007). Exploring consumer attitude and behavior towards green practices in the lodging industry in India. International Journal of Contemporary Hospitality Management, 19 (5), 364–377. http://dx.doi.org/10.1108/09596110710757534
Manrai, L. A., Manrai, A. K., Dana, N., & Ryarrs, J. K. (1997). How green claim strength and country disposition affect product evaluation and company image. Psychology and Marketing, 14 (5), 511-537.
Mayer, R. N., Scammon, D. L. & Zick, C. D. (1993). Poisoning the well: Do environment claims strain consumer credulity? , Advances in Consumer Research, 20, 698-703.
McQuitty, S. (2004). Statistical power and structural equation models in business research, Journal of Business Research, 57 (2), 175-83.
Menon, A. & Menon, A. (1997), Entrepreneurial marketing strategy: the emergence of corporate environmentalism as marketing strategy, Journal of Marketing, 61(1), 51-67.
Nath, V., Kumar, R., Agrawal, R., Gautam, A., & Sharma, V. (2013). Consumer adoption of green products: Modeling the enablers. Global Business Review, 14(3), 453-470. http://dx.doi.org/10.1177/0972150913496864
Newell, S. J., and Ronald, E. G. (2001). The Development of a scale to measure perceived corporate credibility, Journal of Business Research, 52 (3), 235-247.
Ohanian, R., & Armen, T. (1992). Consumers' shopping effort and evaluation of store image attributes: The roles of purchasing involvement and recreational shopping interest. Journal of Applied Business Research, 8 (6).
How Receptive Consumers are towards Green Ads: A Case of Western Uttar Pradesh, India 39
TSM Business Review, Vol. 4, No. 2, December 2016
Pavlou, P. A. & Stewart, D. W. (2000). Measuring the effects and effectiveness of interactive advertising: A research agenda, Journal of Interactive Advertising .
Phau, I., & Denise, O. (2007). An investigation of the effects of environmental claims in promotional messages for clothing brands, Marketing Intelligence and Planning, 23 (7), 772-788.
Polonsky, M. J. & Rosenberger, P. J. (2001). Re-evaluating green marketing: a strategic approach, Business Horizons, 44 ( 5), 21-30.
Polonsky, M. J. (1994). Green marketing regulation in the US and Australia: The Australian checklist, Greener Management International, 5: 44-53.
Rahbar, E., & Wahid, N. A. (2011). Investigation of green marketing tools' effect on consumers' purchase behavior. Business Strategy Series, 12(2), 73–83.
Richards, A. (2003).Effects of Detergent Use on Water Quality in Kathmandu, Nepal. Thesis Submitted to the Department of Civil and Environmental Engineering in Partial Fulfillment of the Requirements for the Degree of Master of Engineering in Civil and Environmental Engineering at the Massachusetts Institute of Technology.
http://web.mit.edu/watsan/Docs/Student%20Theses/Nepal/Richards2003.pdf accessed on July 30.2015
Self, C. C. (1996). "Credibility," in An Integrated Approachto Communication Theory and Research, Michael B. Salwen and Don W. Stacks, eds., Mahwah, NJ: Lawrence Erlbaum, 421-441.
Shetzer, L., Richard, W. S, & Latty, F. M. (1991). Business environment attitudes and the new environmental paradigm, Journal of Environmental Education, 22 (4), 14-21.
Sriram, V., & Forman, A. M. (1993). The relative importance of product’s environmental attributes: a cross-cultural comparison, International Marketing Review, 10(3), 51-70.
Steiger, J. H. (2007). Understanding the limitations of global fit assessment in structural equation modeling, Personality and Individual Differences, 42(5), 893-898.
Steiger, J. H. & Lind J. C. (1980). Statistically based tests for the number of common factors, Paper presented at the annual meeting of the Psychometric Society, Iowa City, IA.
Tabachnick, B. G. & Fidell, L. S. (2007). Using multivariate statistics (5th ed.). New York: Allyn and Bacon
Tan, B. C. (2011). The roles of knowledge, threat, and PCE on green purchase behavior, International Journal of Business and Management, 6 (12).
Thorson, E., Thomas P., & Jeri, M. (1995). Consumer Response to Four Categories of 'Green' Television Commercials, in Advances in Consumer Research, vol. 22, Frank R. Kardes and MitaSujan, eds., Provo, UT: Association for Consumer Research, 243-250.
Tucker, E. M., Rifon, N. J., Lee, E. M., & Reece, B. B. (2012). Consumer receptivity to green ads test of green claim types and the role of individual consumer characteristics for green ad response, Journal of Advertising, 41 (4), pp. 9 – 23.
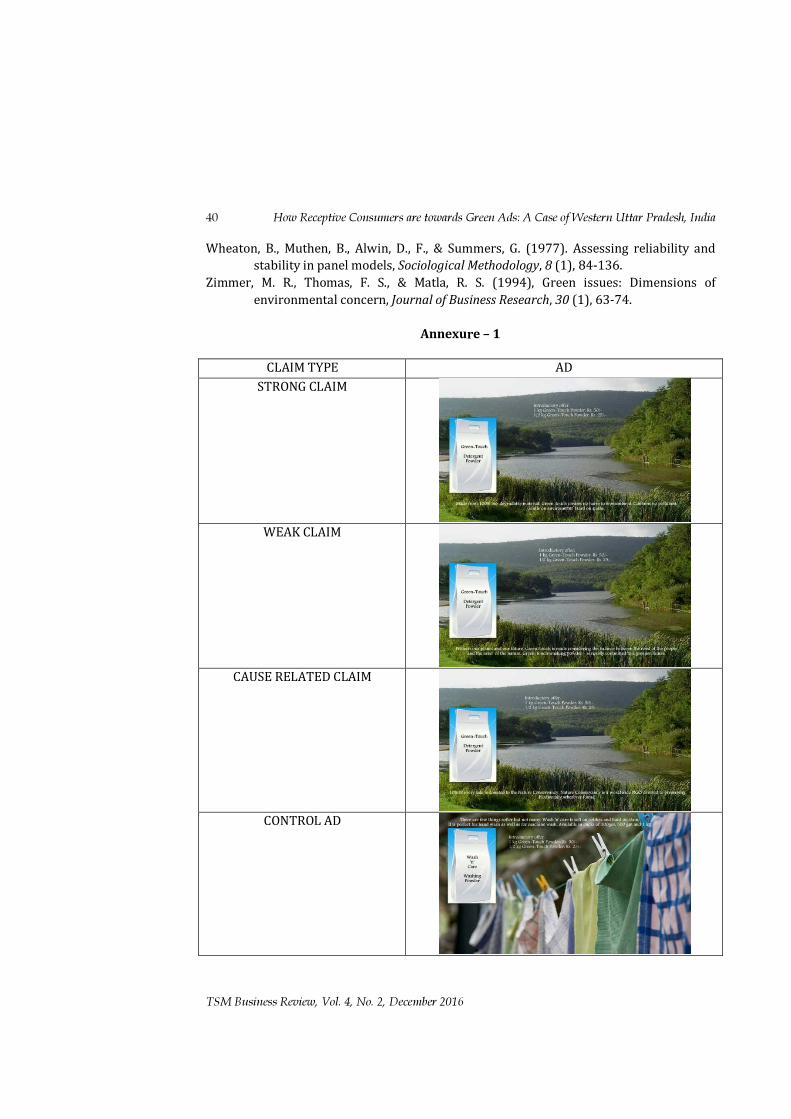
40 How Receptive Consumers are towards Green Ads: A Case of Western Uttar Pradesh, India
TSM Business Review, Vol. 4, No. 2, December 2016
Wheaton, B., Muthen, B., Alwin, D., F., & Summers, G. (1977). Assessing reliability and stability in panel models, Sociological Methodology, 8 (1), 84-136.
Zimmer, M. R., Thomas, F. S., & Matla, R. S. (1994), Green issues: Dimensions of environmental concern, Journal of Business Research, 30 (1), 63-74.
Annexure – 1
CLAIM TYPE AD
STRONG CLAIM
WEAK CLAIM
CAUSE RELATED CLAIM
CONTROL AD
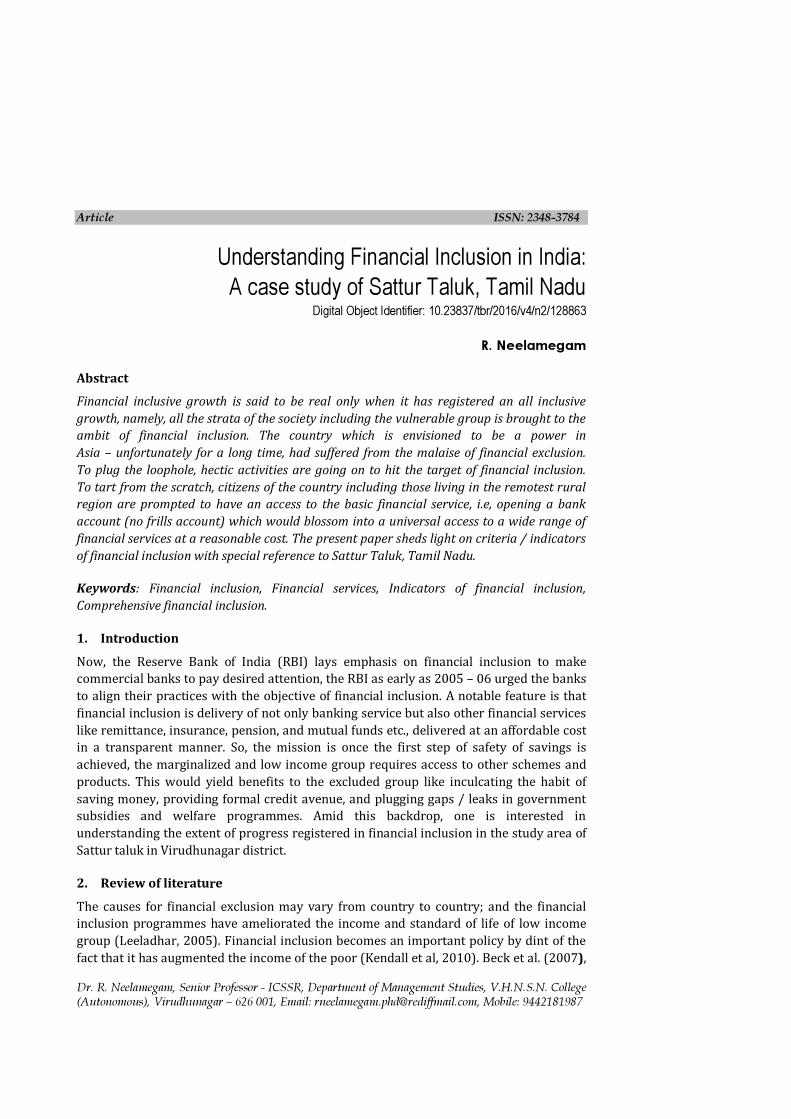
Article ISSN: 2348-3784
Dr. R. Neelamegam, Senior Professor - ICSSR, Department of Management Studies, V.H.N.S.N. College (Autonomous), Virudhunagar – 626 001, Email: [email protected], Mobile: 9442181987
Understanding Financial Inclusion in India: A case study of Sattur Taluk, Tamil Nadu
Digital Object Identifier: 10.23837/tbr/2016/v4/n2/128863
R. Neelamegam Abstract Financial inclusive growth is said to be real only when it has registered an all inclusive growth, namely, all the strata of the society including the vulnerable group is brought to the ambit of financial inclusion. The country which is envisioned to be a power in Asia – unfortunately for a long time, had suffered from the malaise of financial exclusion. To plug the loophole, hectic activities are going on to hit the target of financial inclusion. To tart from the scratch, citizens of the country including those living in the remotest rural region are prompted to have an access to the basic financial service, i.e, opening a bank account (no frills account) which would blossom into a universal access to a wide range of financial services at a reasonable cost. The present paper sheds light on criteria / indicators of financial inclusion with special reference to Sattur Taluk, Tamil Nadu. Keywords: Financial inclusion, Financial services, Indicators of financial inclusion, Comprehensive financial inclusion. 1. Introduction Now, the Reserve Bank of India (RBI) lays emphasis on financial inclusion to make commercial banks to pay desired attention, the RBI as early as 2005 – 06 urged the banks to align their practices with the objective of financial inclusion. A notable feature is that financial inclusion is delivery of not only banking service but also other financial services like remittance, insurance, pension, and mutual funds etc., delivered at an affordable cost in a transparent manner. So, the mission is once the first step of safety of savings is achieved, the marginalized and low income group requires access to other schemes and products. This would yield benefits to the excluded group like inculcating the habit of saving money, providing formal credit avenue, and plugging gaps / leaks in government subsidies and welfare programmes. Amid this backdrop, one is interested in understanding the extent of progress registered in financial inclusion in the study area of Sattur taluk in Virudhunagar district. 2. Review of literature The causes for financial exclusion may vary from country to country; and the financial inclusion programmes have ameliorated the income and standard of life of low income group (Leeladhar, 2005). Financial inclusion becomes an important policy by dint of the fact that it has augmented the income of the poor (Kendall et al, 2010). Beck et al. (2007),
42 Understanding Financial Inclusion in India: A Case Study of Sattur Taluk, Tamil Nadu
TSM Business Review, Vol. 4, No. 2, December 2016
studied the access to and availing of bank services in various countries. He concluded that access to bank services and frequency in the usage of bank deposit and bank loan are the main indicators of the degree of financial inclusion. To tackle the problems of financial exclusion, it is necessary to ensure a wide range of financial services to all. The financial services encompass opening a bank account, savings, availing of credit, remittance, payment and the like, (Rangarajan, 2008). Chakrabarty, 2009 said that financial inclusion is the process of ensuring access to appropriate financial products and services needed by all sections of the society in general and vulnerable groups such as weaker sections and low income groups in particular at an affordable cost in a fair and transparent manner by mainstream institutional players. Financial institutions play a crucial and wider role in fostering financial inclusion. Lack of financial literacy is the major hindrance in spreading financial inclusion. This has resulted in more than 50 per cent of the savings of the household sector getting drained in non-financial investments (Massey, 2010). Including the low income groups in the financial sector will tend to raise the stability of loan and deposit bases. It is suggested that financial institutions catering to the lower and tend to weather macro crises and help sustain economic activity (Hanning and Jansen, 2010). Financial inclusion is most commonly thought of in terms of access to credit from a formal financial institution, but the concept has more dimensions. There may be alternatives to formal account like mobile money. The main other financial service besides banking is insurance especially for health and agriculture (Kunt and Klapper, 2012). The advantage of educating youth is that they grow up into financially literate adults (Hogarth, 2002). Financial education can be taught using a variety of strategies; however, those involving active learning such as simulation and role playing are suggested for youth (Varcoe and Fitch, 2003). Active learning methods of financial education help to make abstract concepts more tangible to students; they are likely to influence transfer of learning (Haskell, 2001). Financial advisors can be particularly valuable for individuals who lack financial literacy and are prone to cognitive biases (Fischer and Gerhardt, 2007). Financial literacy is strongly and positively associated with seeking financial advice (Lusardi, Annamaria and Mitchell, 2008). Default counseling helps mortgage borrowers who are behind on their payments and foreclosure and receive more favorable loan modifications (Mayer et al., 2009). In a study by Hung and Yoong (2010) on the relationship between financial advisors and investors in the light of the current financial crisis, it was found that advisors can help clients avoid panicking and acting irrationally. The investors who are older, female, married are risk reverse and wealthier are more likely to use financial advisors (Gerhardt, Ralf and Hackethal, 2009). Low financial literacy is correlated with negative financial behavior. Financial counseling can help individuals develop better financial
Understanding Financial Inclusion in India: A Case Study of Sattur Taluk, Tamil Nadu 43
TSM Business Review, Vol. 4, No. 2, December 2016
practices. Financial counseling and financial literacy interventions are promising ways to improve individuals’ financial security (Agarwal, 2010). In a survey of bank officials across the country the officials agreed that the task of financial inclusion was a social obligation, and they did not consider it as a big business opportunity (Rao, 2010). Financial advice, bank payments (saving or current) remittance, insurance, affordable credit and credit card empowerment of SHGs are the factors determining financial inclusion (Rao and Rahat, 2011). Financial inclusion largely depends on the credit spread by the organized sector. A structured programme is needed to achieve financial inclusion. The earlier steps were inadequate for the objective equity growth of the nation (Pandi and Selvakumar, 2012). 3. Problem and objective of the study In a developing country like India, one needs a comprehensive financial inclusion so as to mitigate the rising income inequality. This casts a greater responsibility on the financial services sector to drag on the entire vulnerable group to the ambit of financial inclusion. With this background in view, the objective of the present study is to explore the extent of financial inclusion in India in terms of parameters like opening of bank account, frequency of bank transactions, loan borrowed and financial advice. The study has been made with special reference to Sattur taluk in Tamil Nadu. 4. Data and methodology The study mainly depended on primary data which were collected from a structured questionnaire. In the absence of a concrete sampling frame, quota sampling method was applied to select more or less an equal number of samples of 144 and 142 respectively from rural and urban areas in the study region of Sattur taluk in Tamil Nadu. The sample survey was conducted during the period, January 2016 – March 2016. Relevant statistical tools such as percentage calculation, weighted average, chi square test, t- test and one way ANOVA were applied for the analysis of survey data. 5. Results and discussion 1. Bank Account Found that cent per cent of the respondents opened a bank account; of them, 64.7 per cent had savings bank / current account. Friends and relatives helped the respondents to open an account with the bank. Found that 26.2 per cent respondents were not aware of the existence of zero minimum bank account. A significant revelation was that only 35.7 per cent respondents deposited money into their savings account once in a month. ‘t’ test was performed to verify the following null hypothesis, and the results of the test are shown in Table 1.
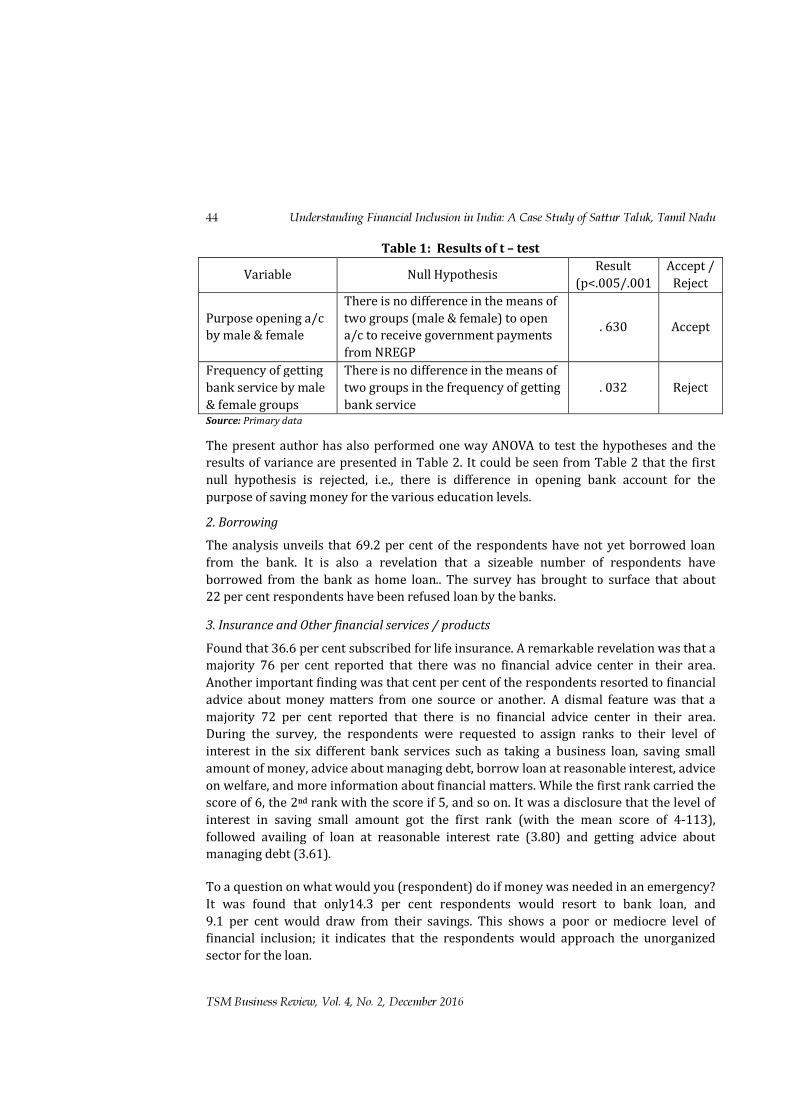
44 Understanding Financial Inclusion in India: A Case Study of Sattur Taluk, Tamil Nadu
TSM Business Review, Vol. 4, No. 2, December 2016
Table 1: Results of t – test Variable Null Hypothesis Result
(p<.005/.001 Accept /
Reject
Purpose opening a/c by male & female
There is no difference in the means of two groups (male & female) to open a/c to receive government payments from NREGP
. 630 Accept
Frequency of getting bank service by male & female groups
There is no difference in the means of two groups in the frequency of getting bank service
. 032 Reject
Source: Primary data
The present author has also performed one way ANOVA to test the hypotheses and the results of variance are presented in Table 2. It could be seen from Table 2 that the first null hypothesis is rejected, i.e., there is difference in opening bank account for the purpose of saving money for the various education levels.
2. Borrowing The analysis unveils that 69.2 per cent of the respondents have not yet borrowed loan from the bank. It is also a revelation that a sizeable number of respondents have borrowed from the bank as home loan.. The survey has brought to surface that about 22 per cent respondents have been refused loan by the banks.
3. Insurance and Other financial services / products Found that 36.6 per cent subscribed for life insurance. A remarkable revelation was that a majority 76 per cent reported that there was no financial advice center in their area. Another important finding was that cent per cent of the respondents resorted to financial advice about money matters from one source or another. A dismal feature was that a majority 72 per cent reported that there is no financial advice center in their area. During the survey, the respondents were requested to assign ranks to their level of interest in the six different bank services such as taking a business loan, saving small amount of money, advice about managing debt, borrow loan at reasonable interest, advice on welfare, and more information about financial matters. While the first rank carried the score of 6, the 2nd rank with the score if 5, and so on. It was a disclosure that the level of interest in saving small amount got the first rank (with the mean score of 4-113), followed availing of loan at reasonable interest rate (3.80) and getting advice about managing debt (3.61). To a question on what would you (respondent) do if money was needed in an emergency? It was found that only14.3 per cent respondents would resort to bank loan, and 9.1 per cent would draw from their savings. This shows a poor or mediocre level of financial inclusion; it indicates that the respondents would approach the unorganized sector for the loan.
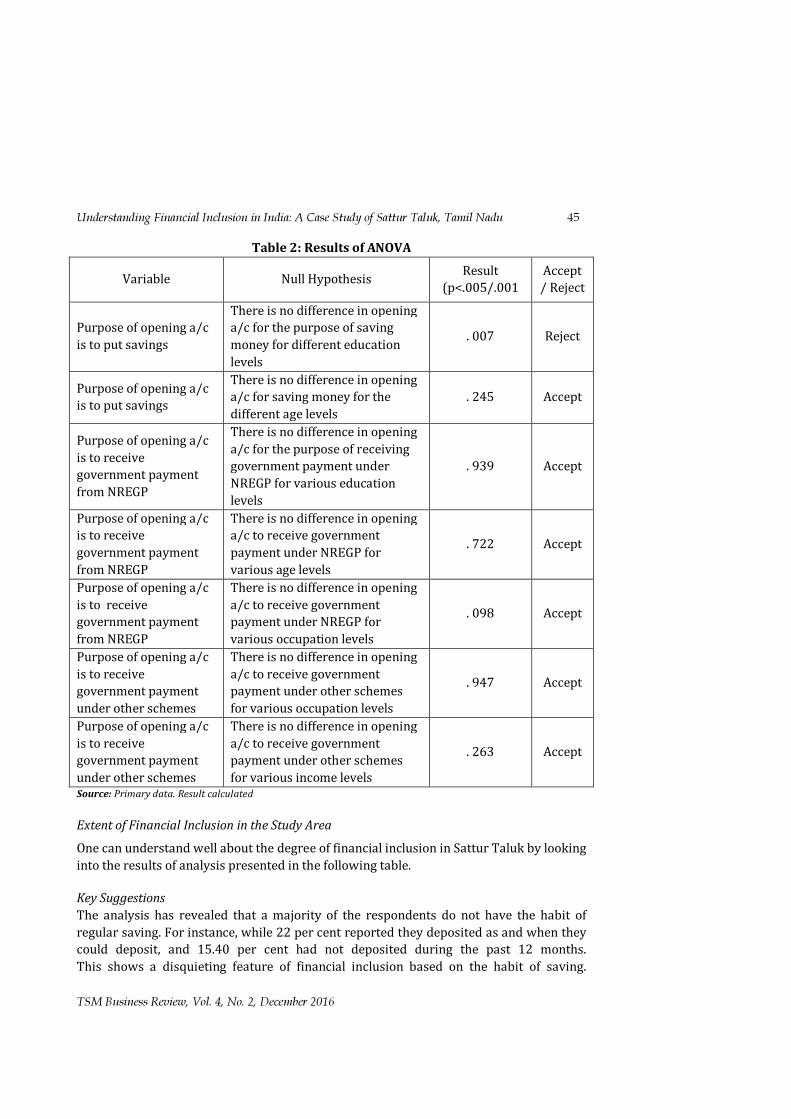
Understanding Financial Inclusion in India: A Case Study of Sattur Taluk, Tamil Nadu 45
TSM Business Review, Vol. 4, No. 2, December 2016
Table 2: Results of ANOVA Variable Null Hypothesis Result
(p<.005/.001 Accept
/ Reject
Purpose of opening a/c is to put savings
There is no difference in opening a/c for the purpose of saving money for different education levels
. 007 Reject
Purpose of opening a/c is to put savings
There is no difference in opening a/c for saving money for the different age levels
. 245 Accept
Purpose of opening a/c is to receive government payment from NREGP
There is no difference in opening a/c for the purpose of receiving government payment under NREGP for various education levels
. 939 Accept
Purpose of opening a/c is to receive government payment from NREGP
There is no difference in opening a/c to receive government payment under NREGP for various age levels
. 722 Accept
Purpose of opening a/c is to receive government payment from NREGP
There is no difference in opening a/c to receive government payment under NREGP for various occupation levels
. 098 Accept
Purpose of opening a/c is to receive government payment under other schemes
There is no difference in opening a/c to receive government payment under other schemes for various occupation levels
. 947 Accept
Purpose of opening a/c is to receive government payment under other schemes
There is no difference in opening a/c to receive government payment under other schemes for various income levels
. 263 Accept
Source: Primary data. Result calculated Extent of Financial Inclusion in the Study Area One can understand well about the degree of financial inclusion in Sattur Taluk by looking into the results of analysis presented in the following table. Key Suggestions The analysis has revealed that a majority of the respondents do not have the habit of regular saving. For instance, while 22 per cent reported they deposited as and when they could deposit, and 15.40 per cent had not deposited during the past 12 months. This shows a disquieting feature of financial inclusion based on the habit of saving.
46 Understanding Financial Inclusion in India: A Case Study of Sattur Taluk, Tamil Nadu
TSM Business Review, Vol. 4, No. 2, December 2016
The authorities concerned have to boost employment opportunity so as to enable the low income group to save money and deposit it into the bank. Another parameter of financial inclusion is the respondents availing bank credit. A shocking revelation was a majority 69.29 per cent have not yet borrowed bank loan; the survey noted that earlier 26.6 per cent were refused the bank loan. The indicates a task remains, namely, to drag on a substantial number of respondents to the ambit of bank credit. A comprehensive financial inclusion suggests the use of banks as a credit channel by the low income group.
An important finding was that 36 per cent respondents subscribed for life insurance policy. A dismal feature was only 6.6 per cent and 1.4 per cent respectively subscribed to social security insurance schemes of Atal insurance scheme and Pradhan Manthiri accidental insurance scheme. It is learnt during the survey lack of awareness has led to the respondents meagre amount of subscription to social insurance schemes. It is suggested that awareness programmes are to be organized by the banks, insurance companies and SHGs to popularize the social insurance schemes. Importantly, these programmes should be conducted in vernacular language. The respondents would have sought advice about money matters at one time or other. It came to light that 71.3 percent reported that their getting advice about money matter was helpful to them. At the same time, a majority 72 per cent reported that were was no financial advice centre in their area. This suggests for opening the advice centre either in banks or in some other places of financial agencies - a place that may serve as a centre covering four or five villages. It was found that 58.4 per cent respondents were not satisfied with the existing business correspondent (BC) model. This strongly suggests for improving the present BC model by means of imparting training and providing incentives to the correspondents. It was found that if money was needed at times of emergency, 14.3 per cent respondents would raise bank loan and 9.1 per cent would draw from savings bank account. This indicates the respondents would fall back on unorganized credit. This suggests for ease and speedy disbursal of bank credit. 6. Conclusion and Implication Financial inclusion is a process. Started with a simple step of opening up of bank account for the vulnerable group would blossom into a comprehensive / total financial inclusion which ensures a range of financial services to every citizen. These services encompass: • No frills account for receiving and making payments. • A savings account suited to the pattern of cash flows of a poor household. • Small loan and overdraft for productive and personal purposes. • Money transfer facility and • Micro insurance – life and non life.
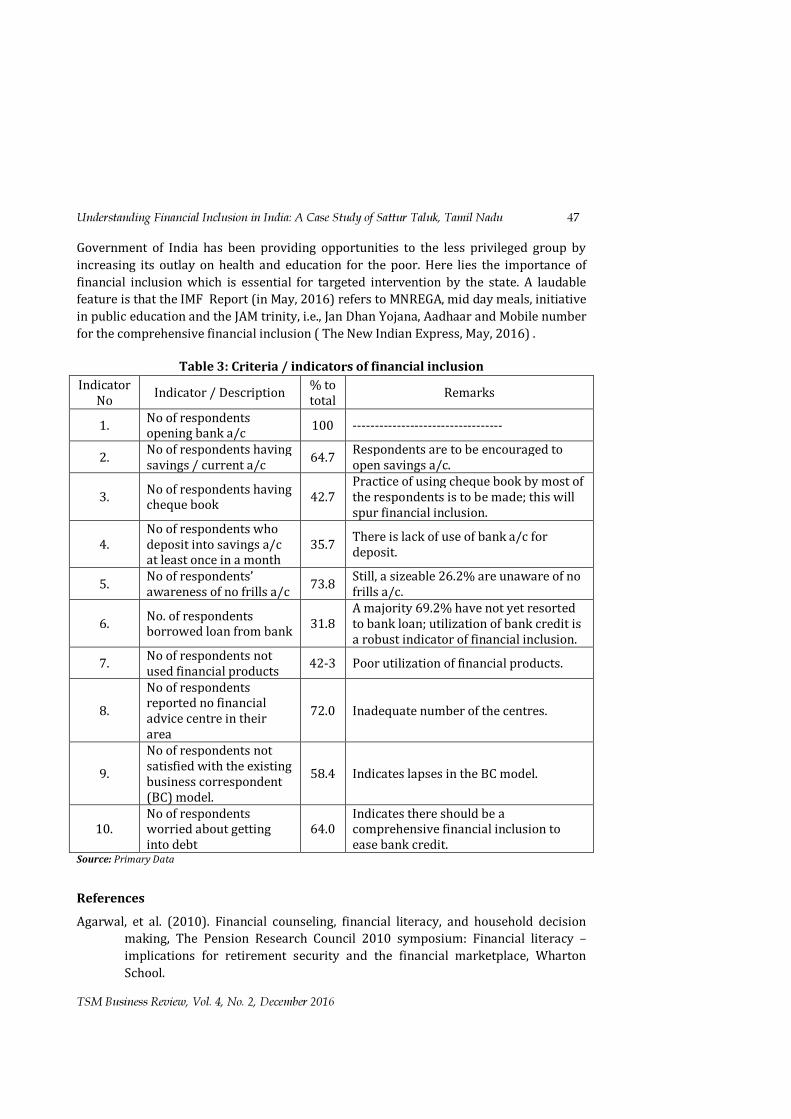
Understanding Financial Inclusion in India: A Case Study of Sattur Taluk, Tamil Nadu 47
TSM Business Review, Vol. 4, No. 2, December 2016
Government of India has been providing opportunities to the less privileged group by increasing its outlay on health and education for the poor. Here lies the importance of financial inclusion which is essential for targeted intervention by the state. A laudable feature is that the IMF Report (in May, 2016) refers to MNREGA, mid day meals, initiative in public education and the JAM trinity, i.e., Jan Dhan Yojana, Aadhaar and Mobile number for the comprehensive financial inclusion ( The New Indian Express, May, 2016) .
Table 3: Criteria / indicators of financial inclusion
Indicator No Indicator / Description % to
total Remarks
1. No of respondents opening bank a/c 100 ----------------------------------
2. No of respondents having savings / current a/c 64.7 Respondents are to be encouraged to
open savings a/c.
3. No of respondents having cheque book 42.7
Practice of using cheque book by most of the respondents is to be made; this will spur financial inclusion.
4. No of respondents who deposit into savings a/c at least once in a month
35.7 There is lack of use of bank a/c for deposit.
5. No of respondents’ awareness of no frills a/c 73.8 Still, a sizeable 26.2% are unaware of no
frills a/c.
6. No. of respondents borrowed loan from bank 31.8
A majority 69.2% have not yet resorted to bank loan; utilization of bank credit is a robust indicator of financial inclusion.
7. No of respondents not used financial products 42-3 Poor utilization of financial products.
8. No of respondents reported no financial advice centre in their area
72.0 Inadequate number of the centres.
9. No of respondents not satisfied with the existing business correspondent (BC) model.
58.4 Indicates lapses in the BC model.
10. No of respondents worried about getting into debt
64.0 Indicates there should be a comprehensive financial inclusion to ease bank credit.
Source: Primary Data References Agarwal, et al. (2010). Financial counseling, financial literacy, and household decision
making, The Pension Research Council 2010 symposium: Financial literacy – implications for retirement security and the financial marketplace, Wharton School.
48 Understanding Financial Inclusion in India: A Case Study of Sattur Taluk, Tamil Nadu
TSM Business Review, Vol. 4, No. 2, December 2016
Beck, T.et al. (2007). Reaching out: access to and use of banking services across countries. Journal of Financial Economics, No.85, 234 – 266.
Chakrabarty, K. C. (2009). Financial inclusion – RBI initiatives. National seminar on launching a national initiative for financial inclusion , Government of India.
Demirguc – Kunt, A. & Klapper, L.(2012). Measuring financial inclusion. Fischer, et al. (2007). Investment mistakes of individual investors and the impact of
financial advice. Working paper series, Social sciences research network, http:// paper.ssrn.com / 13 / papers.cfm? abstract_id=100911196.
Gerhardt, R., & Hackethal, A. (2009). The influence of financial advisors on household portfolios: A study on private investors switching to financial advice. Working paper series, social science research network. http: // papers.ssrn.com /&o13/ papers.cfm? abstract_id= 134 3607.
Hannig & Janson. (2010). Financial inclusion in Africa. pp. 13 -16. Haskell, R. E. (2001). Transfer of learning: cognition, instruction and reasoning. Academic
press, San Diego, CA. Hegarth, J. M(2002). Financial literacy and family and consumer sciences. Journal of
Family and Consumer Sciences, 94(1), 14 – 28. Hung & Yoong (2010). Asking for help: survey and experimental evidence on financial
advice and behavior change. Santa Monica, CA: Rank working paper series WR -7. Joseph, M. (2010). Role of financial institutions in financial inclusion. FICCI’s Banking and
Finance journal, No.4, October. Kendall, J. et al. (2010). Measuring financial access around the world. Policy research
working paper, World Bank, Washington, DC. Leeladhar, V. (2005). Taking banking services to the common man – financial inclusion.
Commemorative lecture at the Fedbank Hormis Foundation, Ernakulam. Lusardi, A., & Mitchell, S. (2008). Planning and financial literacy: how do women fare?
American Economic Review, 98(2), 413 – 417. Mayer, et al. (2009). National foreclosure mitigation counseling program evaluation:
Preliminary analysis of program effects. The urban institute, Washington, DC. Nagewara, R., N.D.S.V. (2010). Financial inclusion – Bankers’ perspective, Bank Quest,
81(4), 20 – 26. Pandi, R. & Selvakumar, M. (2012). Financial inclusion in India. Economic affairs, 57(2),
119 – 125. Rangarajan, C. (2008). Report of the committee on financial inclusion. Government of
India, New Delhi. Rao, S., & Rahat, V. (2011). Financial inclusion the question unanswered. Indian journal of
finance, 4(10), pp. 48 – 54. The Editorial. The New Indian Express, Madurai edition, 6th May, 2016, p.8. The Global Findex Database. Policy research Working paper 6025, World Bank,
Washington, DC. Varcoe, K. P., & Fitch, P. R. (2003). Money talks – A program to improve financial literacy
of teens. International journal of Consumer Studies, 27(3), 225 – 226.
Article ISSN: 2348-3784
N. Suga Dharshini, PGDHRD, Lady Doak College, Madurai. Kajal J. Mehta, Assistant Professor, Department of Business Administration, Lady Doak College, Madurai. Postal Address: 19A Krishnapuram Colony, SF6 Malligai Apartment, Madurai: 625014. Phone: 9443927754, EMail: [email protected]
Octapace Culture Profiling - A Study among Employees Working in a Legal Compliance Firm in Madurai
Digital Object Identifier: 10.23837/tbr/2016/v4/n2/128864
N Suga Dharshini and Kajal J Mehta Abstract Every human being has certain personality traits which help them stand apart from the crowd. No two individuals behave in a similar way. In the same way organizations have certain values, policies, rules and guidelines which help them create an image of their own. An individual working for any organization with a firmly established culture will be trained on values, beliefs, and expected behaviors of that organization. Employees are affected by culture in which they live. Employees working in organizations may be from different cultures which may be a big obstacle in their working environment. There is some evidence that variations in cultural values may have a significant impact on employee turnover and possibly employees' job performance. This study is an attempt to understand the cultural ethos using OCTAPACE (openness, confrontation, trust, authenticity, pro-action, autonomy, collaboration and experimentation) profile (studies how much each ethos is valued and believed by the individuals) in a legal compliance firm in Madurai. This is a descriptive research and a census study drawing all employees working in EC and accounts department of the firm. From the study it was observed that irrespective of qualification of respondents confrontation is high whereas trust and autonomy are low. Keywords: Organizational culture, OCTAPACE profile 1. Introduction Organizational culture is the collective behavior of people that are a part of an organization. Organizational culture is defined as a pattern of basic assumptions invented, discovered or developed by a given group, as it learns to cope with the problems of external adaption and internal investigation that has worked well enough to be considered valid and therefore is to be taught to the new members as the correct way to perceive, think, and feel in relation to those problems. It is a set of shared understandings, norms, values, attitudes and beliefs of an organization which can foster or impede change.
50 Octapace Culture Profiling - A Study Among Employees Working in a Legal Compliance Firm in Madurai
TSM Business Review, Vol. 4, No. 2, December 2016
Every organization develops and maintains a unique culture, which provides guidelines and boundaries for the behavior of the members of the organization. The eight important values relevant to organizations are Openness, Confrontation, Trust, Authenticity, Proaction, Autonomy Collaboration, and Experimentation. In addition to being an acronym for these values, OCTAPACE is a term indicating the eight (octa) steps (pace) needed to create a functional ethos. Openness is a spontaneous expression of feelings and thoughts and the sharing of these without defensiveness. Confrontation is facing rather than shying away from problems. Trust is maintaining the confidentiality of information shared by others and in not misusing it. Authenticity is the congruence between what one feels, says and does. Proaction means taking initiative, pre-planning, taking preventive action, and calculating the pay-offs of an alternative course before taking action. Autonomy is using and giving freedom to plan and act in one's own sphere. Collaboration is giving help to, and asking for help from, others. Experimentation means using and encouraging innovative approaches to solve problems, using feedback for improvement, taking a fresh look at things, and encouraging creativity. While reviewing various studies, it was found that there is a positive correlation between organizational culture, organizational performance, individual effectiveness and success (Wallach, 1983). In 12 Indian organizations covering financial services, consumer products, electronics, cement, tyres and automobile shows that value of autonomy was favourable (Rao, Raju and Yadav, 2001). In IT sector mean score on openness, proaction and experimentation (Pareek, 1997) is high. In financial and banking sector it is found that employees have a strong feeling of belongingness and there is sense of equality with common facilities provided to the employees (Priyadarshini and Venkatapathy, 2004). Openness (Rohmetra, 1998; Raval 2014), proactive, experimentation (Raval, 2014) and trust (Famina, 2009) is found low. Proactive (Mishra, Dhar & Dhar, 1999 and Azmi & Sharma, 2007) confrontation, trust, authenticity, autonomy and collaboration (Rohmetra, 1998 and Famina, 2009) experimetation and proactive (Famina, 2009) is found high. In manufacturing sector proactive (Mishra, Dhar and Dhar, 1999) is high and autonomy (Krishna and Rao, 1997) is low. In hospital openness (Alphonsa, 2000) is high and experimentation (Mufeed, 2006) is low. In a public sector there is positive intra-correlation among eight ethos (Solkhe, 2013). 2. Research Methodology 2.1. Objectives of study To understand the level of the OCTAPACE culture viewed and shared by the respondents in the organization. 2.2. Hypothesis Ho - There is no significant difference between qualification and ethos of organizational culture.
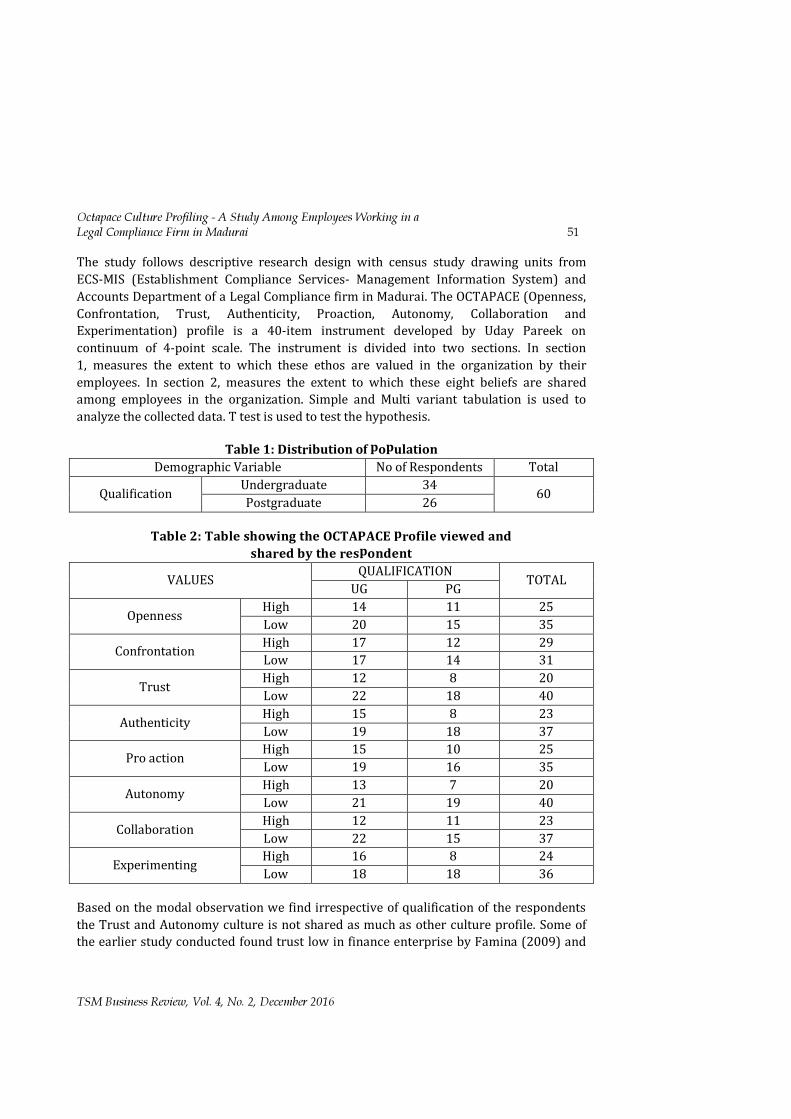
Octapace Culture Profiling - A Study Among Employees Working in a Legal Compliance Firm in Madurai 51
TSM Business Review, Vol. 4, No. 2, December 2016
The study follows descriptive research design with census study drawing units from ECS-MIS (Establishment Compliance Services- Management Information System) and Accounts Department of a Legal Compliance firm in Madurai. The OCTAPACE (Openness, Confrontation, Trust, Authenticity, Proaction, Autonomy, Collaboration and Experimentation) profile is a 40-item instrument developed by Uday Pareek on continuum of 4-point scale. The instrument is divided into two sections. In section 1, measures the extent to which these ethos are valued in the organization by their employees. In section 2, measures the extent to which these eight beliefs are shared among employees in the organization. Simple and Multi variant tabulation is used to analyze the collected data. T test is used to test the hypothesis.
Table 1: Distribution of population Demographic Variable No of Respondents Total
Qualification Undergraduate 34 60 Postgraduate 26
Table 2: Table showing the OCTAPACE profile viewed and shared by the respondent
VALUES QUALIFICATION TOTAL UG PG Openness High 14 11 25
Low 20 15 35 Confrontation High 17 12 29
Low 17 14 31 Trust High 12 8 20
Low 22 18 40 Authenticity High 15 8 23
Low 19 18 37 Pro action High 15 10 25
Low 19 16 35 Autonomy High 13 7 20
Low 21 19 40 Collaboration High 12 11 23
Low 22 15 37 Experimenting High 16 8 24
Low 18 18 36 Based on the modal observation we find irrespective of qualification of the respondents the Trust and Autonomy culture is not shared as much as other culture profile. Some of the earlier study conducted found trust low in finance enterprise by Famina (2009) and
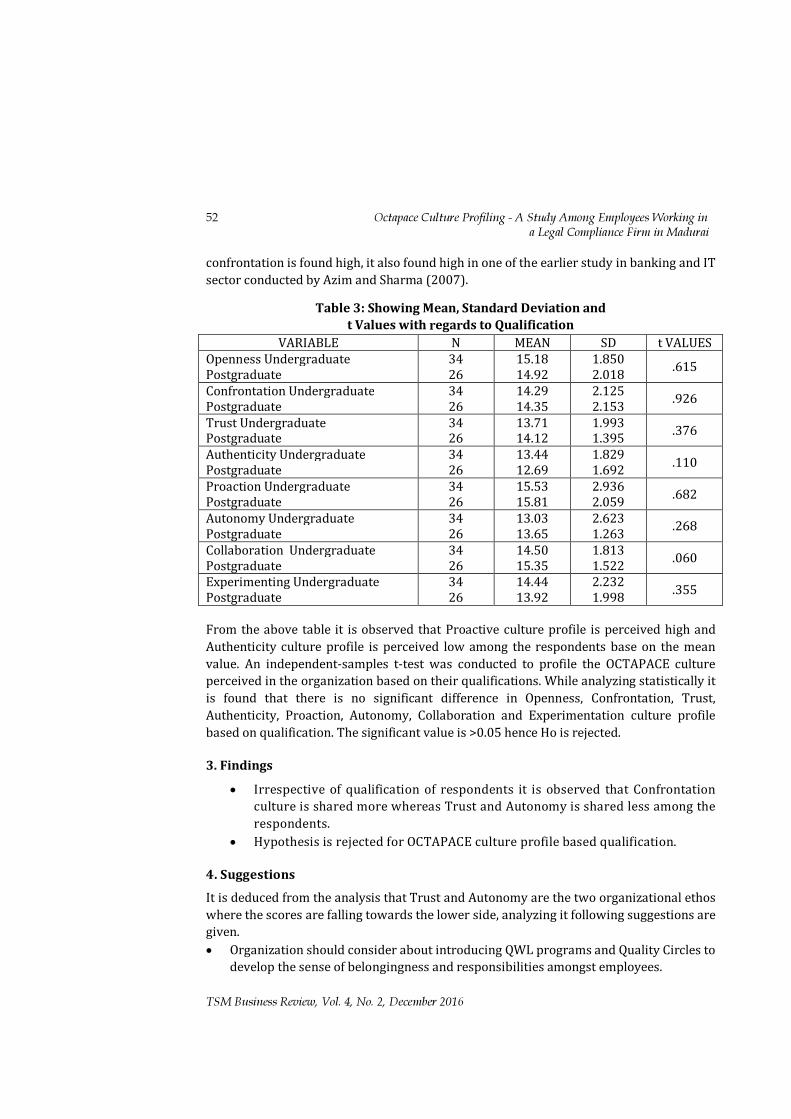
52 Octapace Culture Profiling - A Study Among Employees Working in a Legal Compliance Firm in Madurai
TSM Business Review, Vol. 4, No. 2, December 2016
confrontation is found high, it also found high in one of the earlier study in banking and IT sector conducted by Azim and Sharma (2007).
Table 3: Showing Mean, Standard Deviation and t Values with regards to Qualification
VARIABLE N MEAN SD t VALUES Openness Undergraduate Postgraduate
34 26
15.18 14.92
1.850 2.018 .615
Confrontation Undergraduate Postgraduate
34 26
14.29 14.35
2.125 2.153 .926
Trust Undergraduate Postgraduate
34 26
13.71 14.12
1.993 1.395 .376
Authenticity Undergraduate Postgraduate
34 26
13.44 12.69
1.829 1.692 .110
Proaction Undergraduate Postgraduate
34 26
15.53 15.81
2.936 2.059 .682
Autonomy Undergraduate Postgraduate
34 26
13.03 13.65
2.623 1.263 .268
Collaboration Undergraduate Postgraduate
34 26
14.50 15.35
1.813 1.522 .060
Experimenting Undergraduate Postgraduate
34 26
14.44 13.92
2.232 1.998 .355
From the above table it is observed that Proactive culture profile is perceived high and Authenticity culture profile is perceived low among the respondents base on the mean value. An independent-samples t-test was conducted to profile the OCTAPACE culture perceived in the organization based on their qualifications. While analyzing statistically it is found that there is no significant difference in Openness, Confrontation, Trust, Authenticity, Proaction, Autonomy, Collaboration and Experimentation culture profile based on qualification. The significant value is >0.05 hence Ho is rejected. 3. Findings • Irrespective of qualification of respondents it is observed that Confrontation
culture is shared more whereas Trust and Autonomy is shared less among the respondents.
• Hypothesis is rejected for OCTAPACE culture profile based qualification. 4. Suggestions It is deduced from the analysis that Trust and Autonomy are the two organizational ethos where the scores are falling towards the lower side, analyzing it following suggestions are given. • Organization should consider about introducing QWL programs and Quality Circles to
develop the sense of belongingness and responsibilities amongst employees.
Octapace Culture Profiling - A Study Among Employees Working in a Legal Compliance Firm in Madurai 53
TSM Business Review, Vol. 4, No. 2, December 2016
• Organization should promote more of Informal Communication structure to improve the inter-personal relations amongst employees.
• Employees should be encouraged to innovate within the system processes so as to try and find out new ways of doing the same work.
• Organization should conduct sensitivity and diversity training programs at regular intervals so that it can facilitate more interaction amongst employees.
5. Conclusion Organizational culture is the basic pattern of shared assumptions, values, and beliefs that govern behavior within a particular organization. Since many employees spend more hours at their workplace, their organization’s culture obviously affects both their work lives as well as their personal lives. It is found that the culture profile is based on 8 ethos, Openness, Confrontation, Trust, Authenticity, Proaction, Autonomy, Collaboration and Experimenting of which Confrontation culture profile was found to be perceived high and Trust and Autonomy were perceived to be the lowest. From the study it shows that there is no significant differences in the OCTAPACE culture profile on qualification with the organization.
References Adewale, O. & Anthonia, A. (2013). Impact of organizational culture on human resource
practices: A study of selected Nigerian private universities. Journal of Competitiveness, 5(4), 115-133.
Famina A. S. (2009). OCTAPACE profile and human resource climate in a South Asian public sector undertaking with special reference on KSFE. Pranjana, 12 (2), 72-85
Feza, T. A. & Sharma, R. (2007)- Profiling the OCTAPACE Culture: An Empirical Study [Online].India, December.
Gurkoo & Mufeed S. A (2007). Need to focus on key elements of OCTAPACE culture in Universities-An Empirical Assessment, The journal Contemporary management Research Tiruchirappalli, PP-28-51.
Kumara, N. (2013). A study on the OCTAPACE culture of an organization, Open Journal of Social science Research, 1(8), 211-225.
Panchamia, J. (2013). A study of OCTAPACE culture in civil hospital, Gandhinagar. IUP Journal of Organizational Behavior, 12(2), 43-51.
Pareek, U. (1997). Training instruments in HRD and OD, 2nd ed., New Delhi: Tata McGraw-Hill Publishing Company Limited.
Punia, B. K & Luxmi, (2005). Organizational culture in service sector: An exploration, Delhi Business Review, 6 (1).
Jafri, M. H. (2012). An Empirical Study of OCTAPACE culture and organizational commitment. International Journal of Retailing & Rural Business Perspectives, 1(2),187-195.
Article ISSN: 2348-3784
K. P. Radhika, PhD Research Scholar, Avinashilingam Institute for Home Science and Higher Education for Women University, Coimbatore: 641043. Phone: 9840953494, EMail: [email protected] Dr. P. Ambiga Devi Professor of Economics and Dean of Humanities, Avinashilingam Institute for Home Science and Higher Education for Women University, Coimbatore: 641043. Phone: 9894835234 Email: [email protected]
Determinants of Demand for Money (M1) using Cointegration Approach
Digital Object Identifier: 10.23837/tbr/2016/v4/n2/128865
K.P. Radhika and P. Ambiga Devi
Abstract Estimating the demand for money in an economy and understanding its relationship with various macroeconomic variables is an essential element in the planning of the issue and distribution of currency (Nachane et al., 2013). The penetration of several innovative instruments in the financial sector has changed the behavior and relationship of demand for money. Understanding the significance of estimating money demand function in this evolving financial innovation era, this paper attempts to analyze the major determinants of demand for money via M1 for India for the period 2005-06 to 2014-15. The demand for M1 was estimated applying the Johansen’s Cointegration Technique and the estimated results revealed that there existed long run relationship among the explanatory variables of the function, with specific reference to debit cards that form the major substitute for cash in the country. The findings suggests that the financial innovations in the banking sector have influenced the demand for money, specifically M1 , indicating that the transaction demand for money in India is influenced by the innovations. Keywords: Demand for money, M1, Cointegration technique, Transaction demand for money 1. Introduction Demand for money investigates what motivates people to hold money balances. Deducing from the estimations of money demand equations, the monetary authority can decide which monetary policies are better to implement under the current economic conditions. A stable demand function for money has long been perceived as a prerequisite for the use of monetary aggregates in the conduct of policy (Goldfeld and Sichel, 1990). The money demand functions can enhance our understanding of the behaviour of key monetary aggregates. The financial assets that can serve the medium of the payments role of money have changed over time, as has the elasticity of substitution of the monetary assets, which has led to the definition of money change over time. 2. Financial Innovations – The Buzzword Financial Innovation is the key to financial inclusion, which is considered as the watch word of the 29th India Economic Summit of the World Economic Forum held at New Delhi
Determinants of Demand for Money (M1) using Co-integration Approach 55
TSM Business Review, Vol. 4, No. 2, December 2016
during November 2014. The emergence of financial innovations has turned the phase of financial transactions across the world and India is no exception. Universal banking and globalization has led to the introduction and adoption of various innovations in the payment mechanism options across countries today. In India, the RBI is today walking on the roadmap of cashless economy with all its monetary and financial policies targeting the same. Technical innovations in the deposit and withdrawal mechanisms and practices for various types of assets like the introduction of ATM and telephonic and computer-based transfers of funds between accounts, debit cards and credit cards began in the late 1990s but in common usage in this century. The general specification of money demand in most macroeconomic literature postulates money demand as a function of income and interest rates. With the changing structure of the monetary mechanism and the functioning of banks, it becomes vital to understand the impact of modern developments in the money and banking sectors on the demand for money in India. The potential of digital money to replace currency in the payment for retail goods and its ability to flow freely across international borders has alarmed central bankers, the media, and scholars (Tanaka 1996). 3. Literature Review The demand for money studies using the cointegration approach to determine the long run determinants of demand for money function was found to be adequately supported in the literature with the studies for various economies by Dekle and Pradhan (1997), OyaCelasun and MangalGoswami (2002), Reilly and Sumner (2007) and Ajmi et al; (2015). Butkiewicz and McConnell (1995) estimated the demand for money using funds flow data for household and business sectors in USA during 1952 (3rd quarter) – 1990 (1st quarter). The study concluded that business and household sectors in USA were co-integrated with interest rates and incomes. It was also noted that instability in money demand can be attributed to deregulations and financial innovations in USA. Subramanian Sriram (1999) analyzed the demand for money (M2) in Malaysia from 1973 to 1995 under both the closed and open economy framework. Based on the co-integration and weak-exogenity test results, the short run dynamic error correction models were specified and estimated. The results indicated that the demand for real M2 both in the long and short run were well specified and fairly stable. The long run income elasticity was close to one with the opportunity cost variables carrying the expected signs. Oskooee and Karacal (2006) investigated the demand for money in Turkey by taking into account the currency substitution in the form of exchange rate in addition to income, interest rate and inflation rate. Using monthly data over the period 1987:1–2004:6 the research was an attempt to study the cointegrating properties of real M1 and M2 money demand in Turkey using the bounds testing approach to cointegration incorporating the
56 Determinants of Demand for Money (M1) using Co-integration Approach
TSM Business Review, Vol. 4, No. 2, December 2016
CUSUM and CUSUMSQ tests to estimate the demand for money function. The results showed that in Turkey, while both M1 and M2 are cointegrated with their determinants and both are more or less stable, the two important determinants, i.e. income and interest rate do not belong to the cointegrating space in M2 formulation. Haghighat (2011) empirically investigated the long-run money demand function and its stability in Iran. The Johansen-Juselius co-integration test was employed to see the determinants of money demand like real income, inflation rate and exchange rate. The results showed that money demand function has been stable and financial reforms were yet to have any significant effect. The negative sign of inflation supports the theory, i.e. people prefer to substitute physical assets for money balances. The positive sign of the exchange rate implies that as the currency of Iran depreciate, the demand for M2 increases, possibly supporting the wealth argument in literature. In the Indian context, the money demand function has been a subject to several empirical investigations with pertinent studies in the last decade of Samarjit Das and Kumarjit Mandal (2000), Bhattacharya and Joshi (2001), Purna Chandra Padhan (2005), Rao and Singh (2006), Inoue and Hamori (2008), Prakash Singh and Pandey (2009), Bharadwaj and Pandit (2010), Dasgupta and Gupta (2011), and JyotiKumari and Jitendra (2012) found stable money demand function for India. 4. Objectives of the Study The Indian literature in the past two decades has basically focused on the stability of demand for money and factors affecting it. The recent financial innovations in the payment mechanism of the banking industry have been a boost to form the substitute for currency based transactions. This has led to the scope for the present study to capture and analyze the impact of adoption of financial innovations in the payment mechanism on the demand for money in India, with specific reference to M1, considering the policy implications on the money supply arena by the Reserve Bank of India. Hence the present study is confined to estimate the demand for money using the monetary aggregate M1 for India and its long term determinants. The study was carried out with the following objectives 1. To study the growth and trend of the financial innovations that form substitutes for
cash transactions in India during the study period 2005-06 to 2014-15. 2. To verify the existence of long run relationship between M1 and its determinants for
the study period 2005-06 to 2014-15. 5. Data and Methodology The current study is set on the background of the Baumol model of transaction demand for cash adopted by economic systems. Following Hamori (2008) and Bahmani-Oskooee (1996) and Rauf and Khan (2012) the functional form of the model for demand for money M1 in India was specified using a log linear specification as follows:

Determinants of Demand for Money (M1) using Co-integration Approach 57
TSM Business Review, Vol. 4, No. 2, December 2016
log M1t = β0 + β1logYt + β2 logPt + + β3 logRt + β4 logRTGSt + β5 logDCt + β6 logCCt + β7logETFt + εt……….1 where the dependent and explanatory variables are • M1t is the demand for narrow money to be estimated; • Yt is the Index of Industrial Production measured as a proxy for national income
(GDP); • Ptis the price level measuring inflation through Consumer Price Index; • Rt is the interest rate measured by term deposit rate of commercial banks in India • RTGSt denotes the value of (Real Time Gross Settlement) RTGS transactions
recorded • DCt denotes the value of transactions using debit cards • CDt denotes the value of transactions using credit cards • ETFt denotes the value of (National Electronic Funds Transfer) NEFT transactions • εt refers to the error term
The data for the above variables were obtained from the Reserve Bank of India’s database drawn from the statistical reports ‘Statistics of the Indian Economy’ and ‘Time Series Publication of Statistical Tables Relating to Banks in India’ and ‘Payment System Indicators’ for the period 2005-06 to 2014-15.The data recorded consisted of 120 monthly observations collected from the RBI data base on Payment System Indicators, for the period 2005 to 2015.
6. Empirical Findings Growth and Trend of the variables of study The financial innovations data adopted in the banking industry, which are considered in the study, are the predominant electronic payment mechanism innovations via; RTGS, NEFT, debit cards and credit cards and ATMs in the banking sector and form gateway of financial transactions in the country. These form close substitutes to the currency in transaction in India during the study period. Table 1 shows the growth in the major financial innovations in the payment mechanisms adopted in India from 2004-05 to 2014-15. From the table it can be inferred that the volume of RTGS has increased from 1.77 million to 83.11 million in 2014-15. The value of transactions using RTGS has increased from 115408.36 billion in2005-06 to 1026350.05 in 2012-13 and thereof showed a decline to 822620.81 billion in 2014-15.This can be attributed to increased innovative instruments in the banking sector like IMPS, which enables instant transfers of money and also the fact that there is no threshold limits to transferable amounts in NEFT like RTGS. The volume of EFT/NEFT increased from 3.07 million in 2005-06 to a record of 821.54 million in 2014-15 and the value of EFT/NEFT transactions also showed a positive trend with increase from 612.86 billion in 2005-06 to 52711.50 billion in 2014-15, which clearly depicted the large scale popularity of NEFT among the Indian banking population for transfer of funds online.

58 Determinants of Demand for Money (M1) using Co-integration Approach
TSM Business Review, Vol. 4, No. 2, December 2016
Table 1 Growth of Financial Innovations in Payment Mechanism in India 2005-06 to 2014-15
Year RTGS EFT/NEFT Credit Cards Debit Cards Number of ATMs
Volume Value Volume Value Volume Value Volume Value (in actuals)
2005-06 1.77 115408.36 3.07 612.86 156.09 338.86 45.69 58.97 54791 2006-07 3.88 246191.83 93.65 6460.17 169.55 413.62 182.74 295.74 57042 2007-08 5.86 482945.59 73.26 6263.14 228.21 579.85 155.49 240.80 61129 2008-09 13.38 611399.12 32.17 2519.56 259.63 653.54 127.65 185.47 64608 2009-10 33.27 1011699.3 66.34 4095.09 234.25 618.23 170.17 264.18 60153 2010-11 49.28 941039.33 132.33 9391.49 265.16 755.16 237.06 386.91 74505 2011-12 55.05 1079790.6 226.1 17903.49 322.16 978.72 5409.45 14532.04 95686 2012-13 68.52 1026350.05 394.13 29022.42 399.23 1244.268 5775.25 17426.39 114014 2013-14 81.11 904968.04 661.01 43785.52 512.03 1556.72 6707.10 20602.86 160055 2014-15 83.11 822620.81 821.54 52711.50 562.06 1741.29 7103.85 21396.31 1198008 CAGR** 31.44 51.51 19.01 72.37 32.61 Source: RBI, Payment System Indicators 2014-15, Volume in Million and Value in Rs. Billion, **Compound Annual Growth Rate Estimates based on data from above table With regard to the credit cards, it can be observed that the volume of credit cards issued in India has increased from 156.09 million in 2005-06 to 562.06 million in 2014-15, and the value of the transactions using credit cards also showed remarkable increase from 338.86 billion in 2005-06 to 1741.29 billion in 2014-15. The debit cards volume increased from 45.69 million in 2005-06 to 7103.85 million in 2014-15, which showed the spectacular growth of debit cards issued by banks in India during this period. The volume of transactions using debit cards increased from 58.97 billion in 2005-06 to the highest levels of 21396.31 billion in 2014-15, which clearly is the positive response of the efficient and easy usage of debit cards as the instrument which makes banks move towards cashless society. Debit cards usage at point of sale (POS) and permission to withdraw cash at POS using debit cards introduced in 2010 have boosted the growth of volume and value of debit cards as the widely accepted innovation and substitute for cash. Number of ATMs in the country has grown from 54791 in 2005-06 to 1198008 in 2014-15. Much of the ATMS opened since 2011 have been in the rural areas of India, thus enabling innovations to become inclusive and efficient. ATMS enable customers to have ease of access to banking operations and make banking an anywhere anytime service to them. ATMs are used mainly for cash withdrawals and balance enquiries. Savings bank customers can use a different bank’s ATM free of charge for the first five transactions (of any type, financial or non-financial) in a month, with subsequent transactions being charged (the charge not to exceed INR 20). Customers pay no charges for using the ATMs of their own bank. The Compound Annual Growth Rate (CAGR) estimates clearly indicated that debit cards as an alternative payment mechanism is on the rise with 72 percent growth rate during 2005-06 to 2014-15 in India followed by EFT//NEFT transactions with 51 percent growth rate. This depicted the fact that the adoption of financial innovations in payment mechanism has increased. The number of ATMs also showed a CAGR of 32 percent
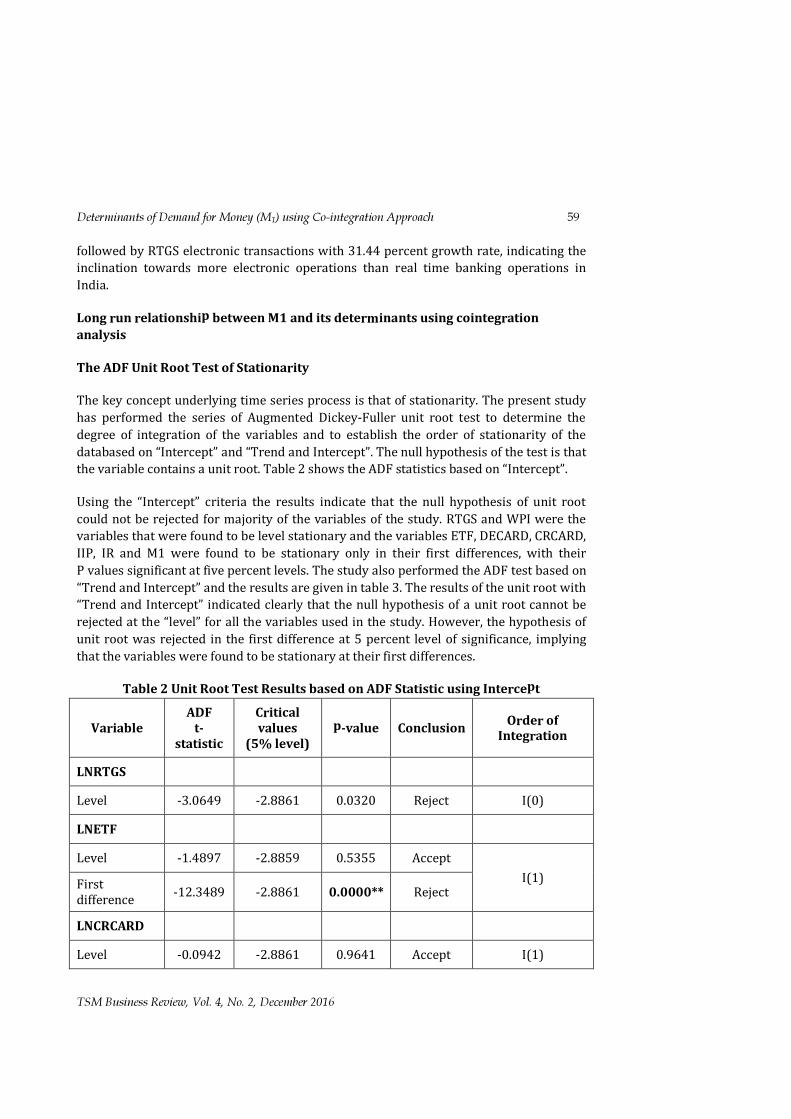
Determinants of Demand for Money (M1) using Co-integration Approach 59
TSM Business Review, Vol. 4, No. 2, December 2016
followed by RTGS electronic transactions with 31.44 percent growth rate, indicating the inclination towards more electronic operations than real time banking operations in India. Long run relationship between M1 and its determinants using cointegration analysis The ADF Unit Root Test of Stationarity The key concept underlying time series process is that of stationarity. The present study has performed the series of Augmented Dickey-Fuller unit root test to determine the degree of integration of the variables and to establish the order of stationarity of the databased on “Intercept” and “Trend and Intercept”. The null hypothesis of the test is that the variable contains a unit root. Table 2 shows the ADF statistics based on “Intercept”. Using the “Intercept” criteria the results indicate that the null hypothesis of unit root could not be rejected for majority of the variables of the study. RTGS and WPI were the variables that were found to be level stationary and the variables ETF, DECARD, CRCARD, IIP, IR and M1 were found to be stationary only in their first differences, with their P values significant at five percent levels. The study also performed the ADF test based on “Trend and Intercept” and the results are given in table 3. The results of the unit root with “Trend and Intercept” indicated clearly that the null hypothesis of a unit root cannot be rejected at the “level” for all the variables used in the study. However, the hypothesis of unit root was rejected in the first difference at 5 percent level of significance, implying that the variables were found to be stationary at their first differences.
Table 2 Unit Root Test Results based on ADF Statistic using Intercept
Variable ADF
t-statistic
Critical values
(5% level) p-value Conclusion Order of
Integration
LNRTGS Level -3.0649 -2.8861 0.0320 Reject I(0) LNETF Level -1.4897 -2.8859 0.5355 Accept
I(1) First difference -12.3489 -2.8861 0.0000** Reject
LNCRCARD Level -0.0942 -2.8861 0.9641 Accept I(1)
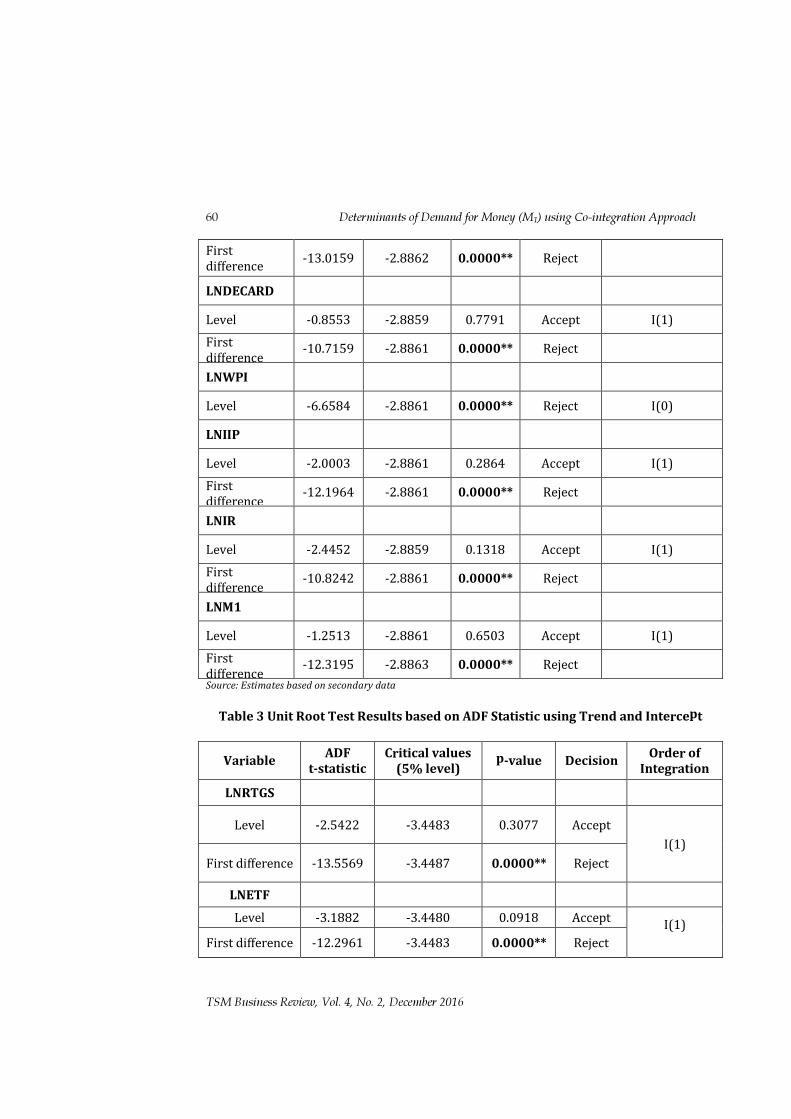
60 Determinants of Demand for Money (M1) using Co-integration Approach
TSM Business Review, Vol. 4, No. 2, December 2016
First difference -13.0159 -2.8862 0.0000** Reject
LNDECARD Level -0.8553 -2.8859 0.7791 Accept I(1) First difference -10.7159 -2.8861 0.0000** Reject LNWPI Level -6.6584 -2.8861 0.0000** Reject I(0) LNIIP Level -2.0003 -2.8861 0.2864 Accept I(1) First difference -12.1964 -2.8861 0.0000** Reject LNIR Level -2.4452 -2.8859 0.1318 Accept I(1) First difference -10.8242 -2.8861 0.0000** Reject LNM1 Level -1.2513 -2.8861 0.6503 Accept I(1) First difference -12.3195 -2.8863 0.0000** Reject Source: Estimates based on secondary data
Table 3 Unit Root Test Results based on ADF Statistic using Trend and Intercept
Variable ADF
t-statistic Critical values
(5% level) p-value Decision Order of Integration
LNRTGS
Level -2.5422 -3.4483 0.3077 Accept I(1)
First difference -13.5569 -3.4487 0.0000** Reject LNETF Level -3.1882 -3.4480 0.0918 Accept I(1)
First difference -12.2961 -3.4483 0.0000** Reject
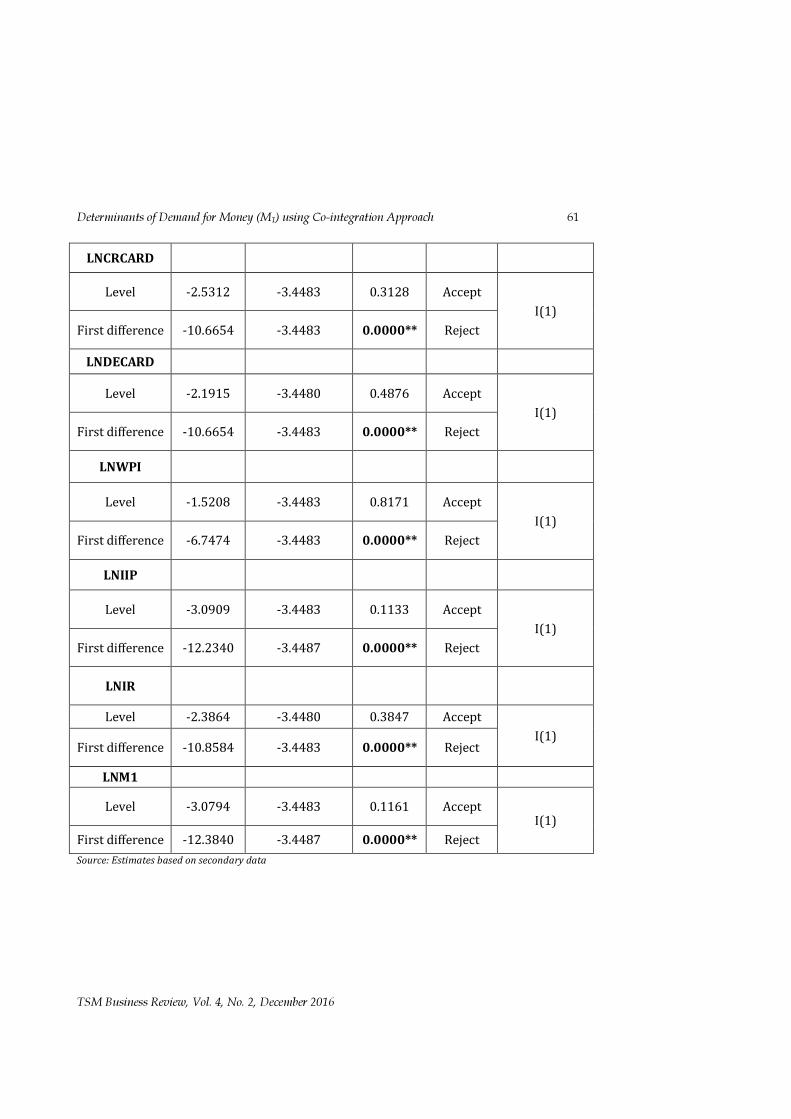
Determinants of Demand for Money (M1) using Co-integration Approach 61
TSM Business Review, Vol. 4, No. 2, December 2016
LNCRCARD
Level -2.5312 -3.4483 0.3128 Accept I(1)
First difference -10.6654 -3.4483 0.0000** Reject LNDECARD
Level -2.1915 -3.4480 0.4876 Accept I(1)
First difference -10.6654 -3.4483 0.0000** Reject
LNWPI
Level -1.5208 -3.4483 0.8171 Accept I(1)
First difference -6.7474 -3.4483 0.0000** Reject
LNIIP
Level -3.0909 -3.4483 0.1133 Accept I(1)
First difference -12.2340 -3.4487 0.0000** Reject
LNIR Level -2.3864 -3.4480 0.3847 Accept
I(1) First difference -10.8584 -3.4483 0.0000** Reject LNM1 Level -3.0794 -3.4483 0.1161 Accept
I(1) First difference -12.3840 -3.4487 0.0000** Reject Source: Estimates based on secondary data
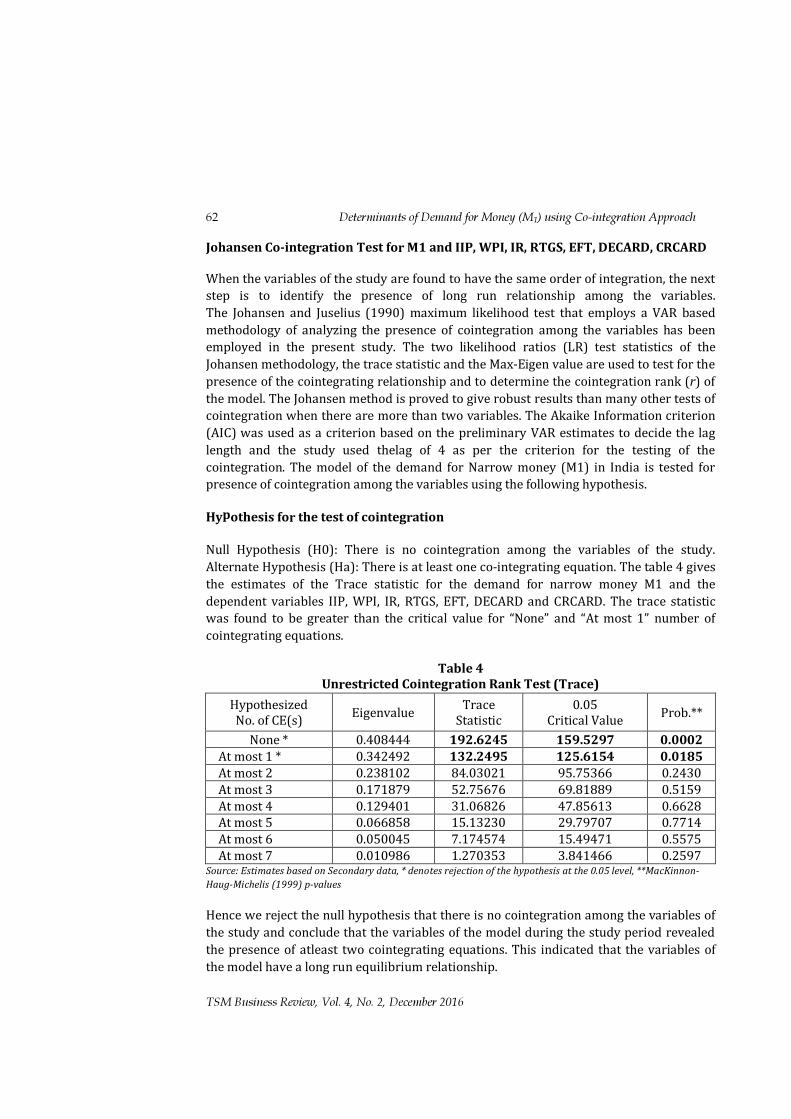
62 Determinants of Demand for Money (M1) using Co-integration Approach
TSM Business Review, Vol. 4, No. 2, December 2016
Johansen Co-integration Test for M1 and IIP, WPI, IR, RTGS, EFT, DECARD, CRCARD When the variables of the study are found to have the same order of integration, the next step is to identify the presence of long run relationship among the variables. The Johansen and Juselius (1990) maximum likelihood test that employs a VAR based methodology of analyzing the presence of cointegration among the variables has been employed in the present study. The two likelihood ratios (LR) test statistics of the Johansen methodology, the trace statistic and the Max-Eigen value are used to test for the presence of the cointegrating relationship and to determine the cointegration rank (r) of the model. The Johansen method is proved to give robust results than many other tests of cointegration when there are more than two variables. The Akaike Information criterion (AIC) was used as a criterion based on the preliminary VAR estimates to decide the lag length and the study used thelag of 4 as per the criterion for the testing of the cointegration. The model of the demand for Narrow money (M1) in India is tested for presence of cointegration among the variables using the following hypothesis. Hypothesis for the test of cointegration Null Hypothesis (H0): There is no cointegration among the variables of the study. Alternate Hypothesis (Ha): There is at least one co-integrating equation. The table 4 gives the estimates of the Trace statistic for the demand for narrow money M1 and the dependent variables IIP, WPI, IR, RTGS, EFT, DECARD and CRCARD. The trace statistic was found to be greater than the critical value for “None” and “At most 1” number of cointegrating equations.
Table 4
Unrestricted Cointegration Rank Test (Trace) Hypothesized
No. of CE(s) Eigenvalue Trace Statistic
0.05 Critical Value Prob.**
None * 0.408444 192.6245 159.5297 0.0002 At most 1 * 0.342492 132.2495 125.6154 0.0185 At most 2 0.238102 84.03021 95.75366 0.2430 At most 3 0.171879 52.75676 69.81889 0.5159 At most 4 0.129401 31.06826 47.85613 0.6628 At most 5 0.066858 15.13230 29.79707 0.7714 At most 6 0.050045 7.174574 15.49471 0.5575 At most 7 0.010986 1.270353 3.841466 0.2597
Source: Estimates based on Secondary data, * denotes rejection of the hypothesis at the 0.05 level, **MacKinnon-Haug-Michelis (1999) p-values
Hence we reject the null hypothesis that there is no cointegration among the variables of the study and conclude that the variables of the model during the study period revealed the presence of atleast two cointegrating equations. This indicated that the variables of the model have a long run equilibrium relationship.
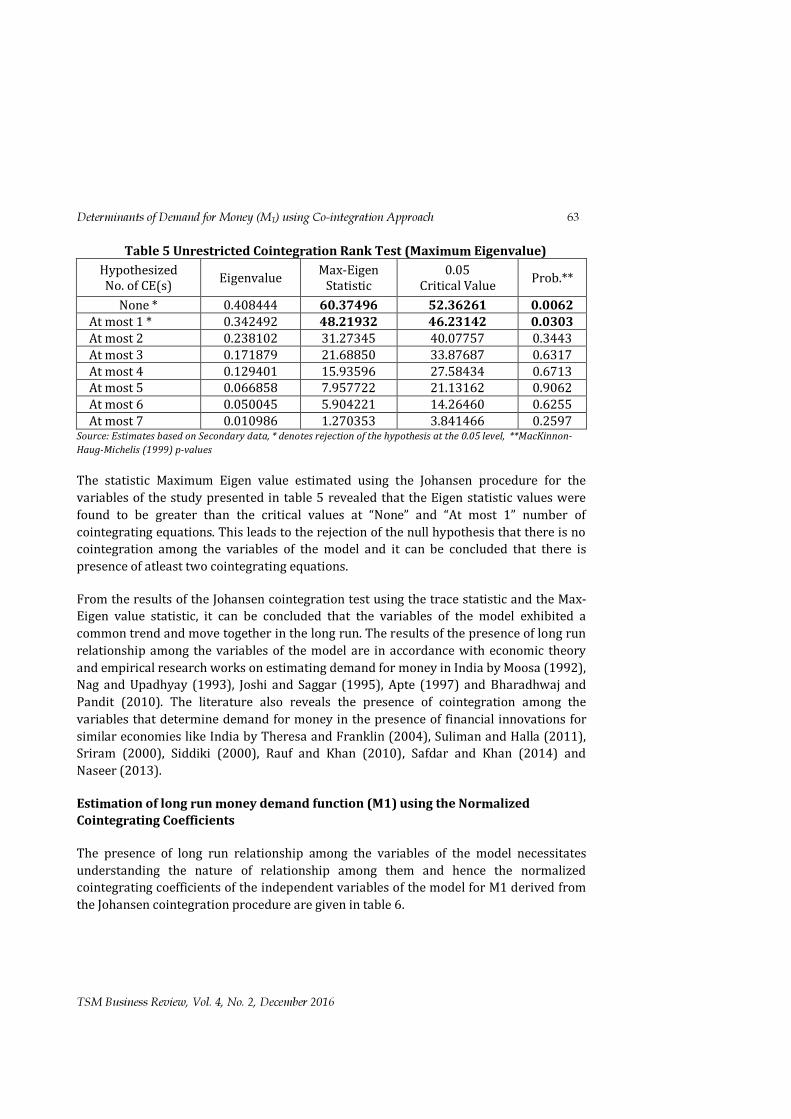
Determinants of Demand for Money (M1) using Co-integration Approach 63
TSM Business Review, Vol. 4, No. 2, December 2016
Table 5 Unrestricted Cointegration Rank Test (Maximum Eigenvalue) Hypothesized No. of CE(s) Eigenvalue Max-Eigen
Statistic 0.05
Critical Value Prob.** None * 0.408444 60.37496 52.36261 0.0062
At most 1 * 0.342492 48.21932 46.23142 0.0303 At most 2 0.238102 31.27345 40.07757 0.3443 At most 3 0.171879 21.68850 33.87687 0.6317 At most 4 0.129401 15.93596 27.58434 0.6713 At most 5 0.066858 7.957722 21.13162 0.9062 At most 6 0.050045 5.904221 14.26460 0.6255 At most 7 0.010986 1.270353 3.841466 0.2597
Source: Estimates based on Secondary data, * denotes rejection of the hypothesis at the 0.05 level, **MacKinnon-Haug-Michelis (1999) p-values
The statistic Maximum Eigen value estimated using the Johansen procedure for the variables of the study presented in table 5 revealed that the Eigen statistic values were found to be greater than the critical values at “None” and “At most 1” number of cointegrating equations. This leads to the rejection of the null hypothesis that there is no cointegration among the variables of the model and it can be concluded that there is presence of atleast two cointegrating equations. From the results of the Johansen cointegration test using the trace statistic and the Max-Eigen value statistic, it can be concluded that the variables of the model exhibited a common trend and move together in the long run. The results of the presence of long run relationship among the variables of the model are in accordance with economic theory and empirical research works on estimating demand for money in India by Moosa (1992), Nag and Upadhyay (1993), Joshi and Saggar (1995), Apte (1997) and Bharadhwaj and Pandit (2010). The literature also reveals the presence of cointegration among the variables that determine demand for money in the presence of financial innovations for similar economies like India by Theresa and Franklin (2004), Suliman and Halla (2011), Sriram (2000), Siddiki (2000), Rauf and Khan (2010), Safdar and Khan (2014) and Naseer (2013). Estimation of long run money demand function (M1) using the Normalized Cointegrating Coefficients The presence of long run relationship among the variables of the model necessitates understanding the nature of relationship among them and hence the normalized cointegrating coefficients of the independent variables of the model for M1 derived from the Johansen cointegration procedure are given in table 6.
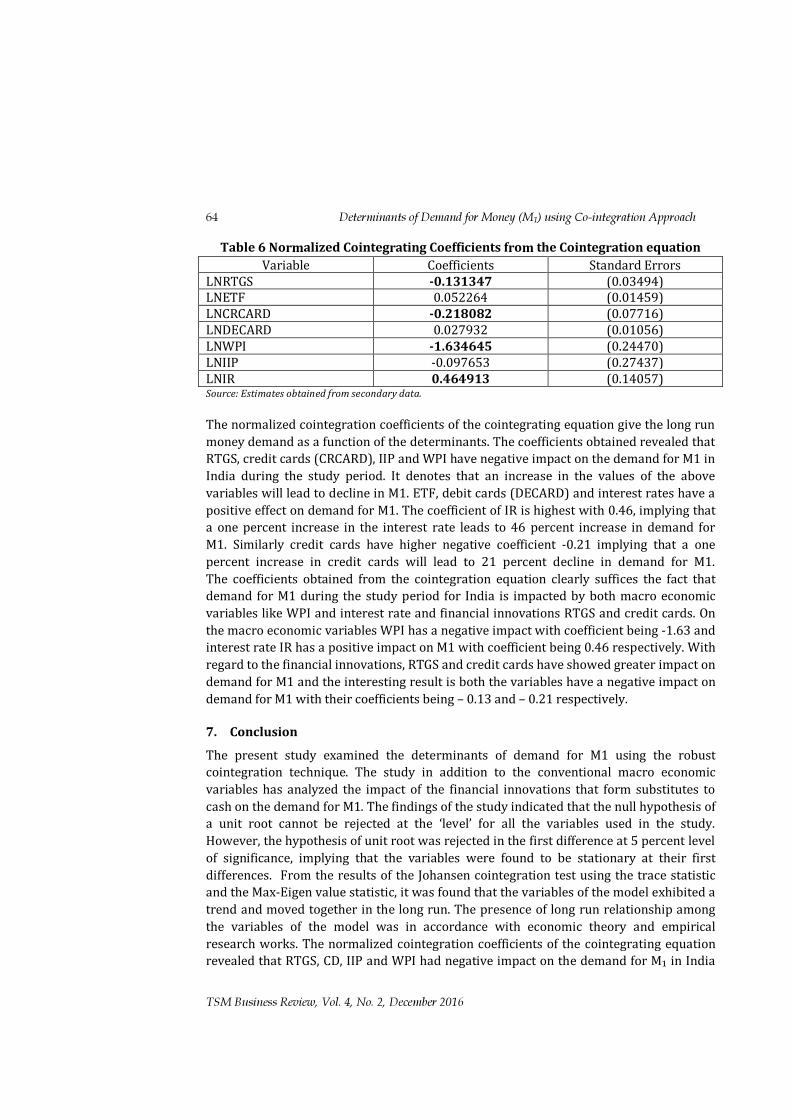
64 Determinants of Demand for Money (M1) using Co-integration Approach
TSM Business Review, Vol. 4, No. 2, December 2016
Table 6 Normalized Cointegrating Coefficients from the Cointegration equation Variable Coefficients Standard Errors
LNRTGS -0.131347 (0.03494) LNETF 0.052264 (0.01459) LNCRCARD -0.218082 (0.07716) LNDECARD 0.027932 (0.01056) LNWPI -1.634645 (0.24470) LNIIP -0.097653 (0.27437) LNIR 0.464913 (0.14057) Source: Estimates obtained from secondary data. The normalized cointegration coefficients of the cointegrating equation give the long run money demand as a function of the determinants. The coefficients obtained revealed that RTGS, credit cards (CRCARD), IIP and WPI have negative impact on the demand for M1 in India during the study period. It denotes that an increase in the values of the above variables will lead to decline in M1. ETF, debit cards (DECARD) and interest rates have a positive effect on demand for M1. The coefficient of IR is highest with 0.46, implying that a one percent increase in the interest rate leads to 46 percent increase in demand for M1. Similarly credit cards have higher negative coefficient -0.21 implying that a one percent increase in credit cards will lead to 21 percent decline in demand for M1. The coefficients obtained from the cointegration equation clearly suffices the fact that demand for M1 during the study period for India is impacted by both macro economic variables like WPI and interest rate and financial innovations RTGS and credit cards. On the macro economic variables WPI has a negative impact with coefficient being -1.63 and interest rate IR has a positive impact on M1 with coefficient being 0.46 respectively. With regard to the financial innovations, RTGS and credit cards have showed greater impact on demand for M1 and the interesting result is both the variables have a negative impact on demand for M1 with their coefficients being – 0.13 and – 0.21 respectively. 7. Conclusion The present study examined the determinants of demand for M1 using the robust cointegration technique. The study in addition to the conventional macro economic variables has analyzed the impact of the financial innovations that form substitutes to cash on the demand for M1. The findings of the study indicated that the null hypothesis of a unit root cannot be rejected at the ‘level’ for all the variables used in the study. However, the hypothesis of unit root was rejected in the first difference at 5 percent level of significance, implying that the variables were found to be stationary at their first differences. From the results of the Johansen cointegration test using the trace statistic and the Max-Eigen value statistic, it was found that the variables of the model exhibited a trend and moved together in the long run. The presence of long run relationship among the variables of the model was in accordance with economic theory and empirical research works. The normalized cointegration coefficients of the cointegrating equation revealed that RTGS, CD, IIP and WPI had negative impact on the demand for M1 in India
Determinants of Demand for Money (M1) using Co-integration Approach 65
TSM Business Review, Vol. 4, No. 2, December 2016
during the study period. ETF, DC and interest rates had positive effect on demand for M1. The coefficient of R was highest with 0.46, implying that a one percent increase in the interest rate leads to 46 percent increase in demand for M1.
References Ahdi, N. A, Nicholas, A., & Ghassen, E. M. (2015). Old wine in a new bottle: money demand causality for 10 Asian countries, International Journal of Emerging Markets; 10 (3), 491 – 503. Dasgupta, B., & Gupta, R. (2011). The macro economic reform and the demand for money in India, International Business & Economics Research Journal, 10 (10), 61 – 70. Rao, B., & Singh, R. (2006). Demand for money in India: 1953 – 2003, Applied Economics, 38 (11), 1319 – 1326. Butkiewicz, J. J. & McConnell, M. M. (1995) The stability of the demand for money and M1 velocity: Evidence from the sectoral data. Quarterly Review of Economics and Finance. 35 (3) Available at SSRN https://ssrn.com/abstract=6599. Dekle, R. & Pradhan, M. (1997). Financial liberalization and money demand in ASEAN Countries: Implication for monetary policy. IMF, Working Paper WP/97/36, IMF. Washington D.C. Goldfeld, S. M., & Daniel, E. S. (1990). The demand for money,” in B. Friedman and F. Hahn (eds.), Handbook of Monetary Economics, Elsevier, 300-356. Haghighat, J. (2011). Real Money Demand, Income and Interest Rates in Iran: Is there a Long-run Stable Relation?, World Journal of Social Sciences, 1(2), 95-107. Inoue, T., & Shigeyuki, H. (2008). An empirical analysis of the money demand function in India. Institute of Developing Economies Discussion Paper, 166, September. Kumar, J. & Mahakud, J. (2012). Relationship between stock prices, exchange rate and the demand for money in India, Economics, Management, and Financial Markets, 7(3), 31–52, ISSN 1842-3191 Bhattacharya, K., & Himanshu, J. (2001). Modelling currency in circulation in India, Applied Economics Letters; ISSN: 1350-4851, 8:9, 585-592. Bahmani, M. O., & Rehman, H. (2005). Stability of the money demand function in Asian developing countries, Applied Economics, 37(7), 773 — 792. Bahmani, M. O. & Karaca, M.l (2006). The demand for money in Turkey and currency substitution, Applied Economics Letters, 13(10), 635-642. Nachane, D. M., Chakraborty, A. B, Mitra. A. K. & Bordoloi, S. (2013). Modelling currency demand in India: An empirical study, DRG-RBI Study No.39. Nag, A. K., & Upadhyay, G. (2003). Estimating money demand function: A co-integration approach” pp in Vasudevan. A. (ed) “Money and Banking – selected Research paper by the Economists of Reserve Bank of India” – Academic Foundation, New Delhi (India); pp: 99 – 106. Oya, C. & Goswam, M. (2002). An analysis of money demand and inflation in the Islamic Republic of Iran”; IMF working paper WP/02/205; Pp: 2- 21. Singh, P., & Pandey, M. K. (2009). Structural break, stability and demand for money in India”; The Australia South Asia Research Centre (ASARC) Working Paper 2009; 07; percolation ponds 1 -15. Padhan, P. C. (2005). Money and economic activity : some empirical relationship for India. The ICFAI Journal of Monetary Economics; 52 – 69.
66 Determinants of Demand for Money (M1) using Co-integration Approach
TSM Business Review, Vol. 4, No. 2, December 2016
Rauf A. S., & Masud, K. Saad, M. (2012). The effect of financial innovation on cash demand, Journal of Business and Economics, 4(1). 89 – 105. Reilly, S. (2008). Demand for money in Sri Lanka 1952-2002, Applied Economics Letters, 15, 343– 347. Das, S. & Mandal, K. (2000). Modeling money demand in India: Testing weak, strong and super exogenity, Indian Economic Review, XXXV(1), 1 – 19. Subramanian, S. (1999), Demand for M2 in an Emerging-Market Economy: An ErrorCorrection Model for Malaysia, IMF Working Paper 99/173 (Washington: International Monetary Fund). Tatsuo, T. (1996). Possible economic consequences of digital cash, First Monday, Vol.1 No.2 – August.

Perspective ISSN: 2348-3784
Dr. Vidya Suresh, Associate Professor, Thiagarajar School of Management, Pamban Swamy Nagar, Thirupparankundram, Madurai – 625005. EMail: [email protected], Phone: 9750420360 Dr. Bipasha Maity, Associate Professor, Thiagarajar School of Management, Pamban Swamy Nagar, Thirupparankundram, Madurai–625005. EMail: [email protected], Phone: 9786199889 (Corresponding Author)
Goods and Services Tax (GST): A Paradigm Shift in Indian Tax System
Digital Object Identifier: 10.23837/tbr/2016/v4/n2/128866
Vidya Suresh and Bipasha Maity Abstract The political and economic case for GST is straight and simple: Income is taxed irrespective of source and use and therefore, consumption should also be taxed on the same principle. India has witnessed many reforms in indirect taxes over the past two decades with the replacement of state sales taxes by Value Added Tax (VAT) in 2005. Prior to VAT implementation, the tax structure was complicated due to the “cascading effect of taxes” whereby an item is taxed more than once from the production to the final retail sales stage. VAT was introduced to avoid this irrational tax system and taxes are paid on the “value added portion” by each producer and the hurdles of the cascading effect are done away with. Due to shortcomings in VAT, government realized the real need for harmonization of Goods and Services Tax (GST). This paper attempts to provide descriptive analysis of GST with reference to India. Keywords: GST, Goods and Services Tax, Indirect Tax in India, Direct and indirect taxes 1. What is GST? Addressing the press media, Honourable Finance Minister Shri Arun Jaitely said on August 8, 2016:
“Implementation of the Goods and Services Tax (GST) will reduce tax evasion and improve ease of doing business by engendering a common market throughout the country. GST will ensure one tax in the entire country. It will result in seamless transfer of goods and services in the country. This is a major indirect tax reform which in long run will be in interest of the country and Centre has addressed concerns of all the states.”
FM Jaitley moved the modified constitution amendment bill in the Lok Sabha while appreciating political parties for showing unanimity in passing the bill in the Upper House and suggesting the modifications as well. The Lok Sabha, which had already passed the GST Constitution Amendment Bill in May 2015, took it up again to approve the modifications made in it by the Rajya Sabha. The Constitution Amendment Bill for Goods and Services Tax (GST) got approved by The President of India after its acceptance in the Parliament (Rajya Sabha on 3 August
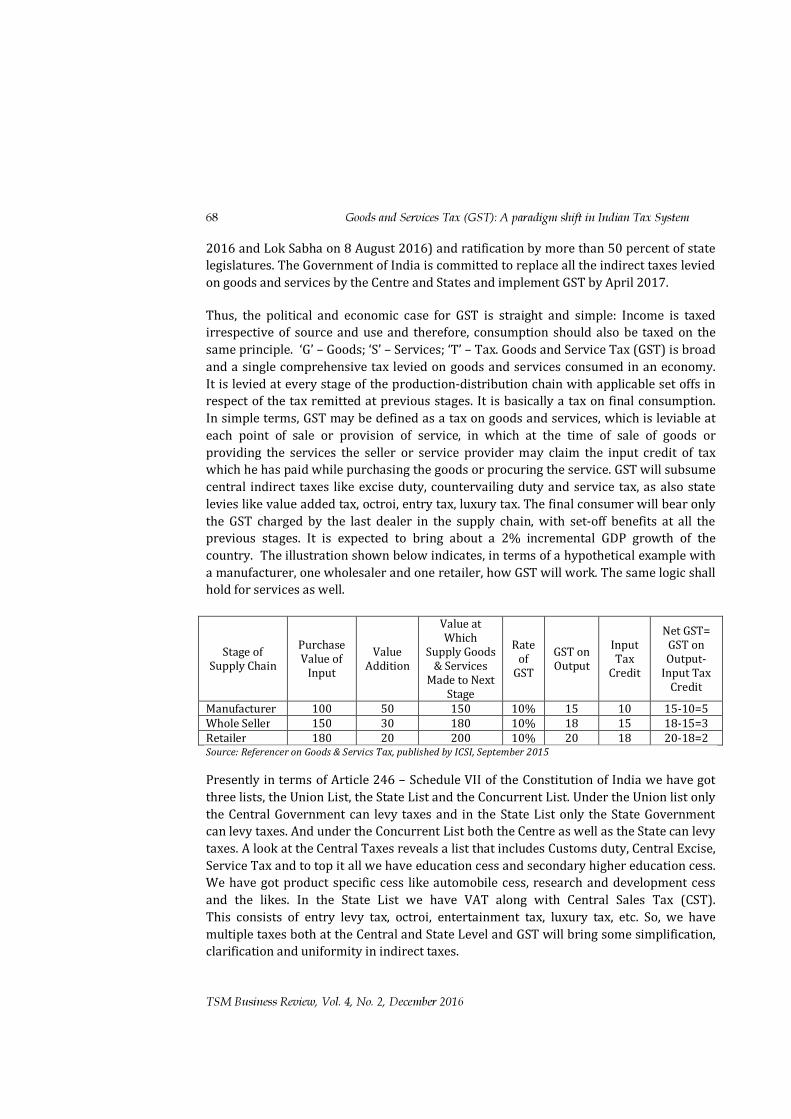
68 Goods and Services Tax (GST): A paradigm shift in Indian Tax System
TSM Business Review, Vol. 4, No. 2, December 2016
2016 and Lok Sabha on 8 August 2016) and ratification by more than 50 percent of state legislatures. The Government of India is committed to replace all the indirect taxes levied on goods and services by the Centre and States and implement GST by April 2017. Thus, the political and economic case for GST is straight and simple: Income is taxed irrespective of source and use and therefore, consumption should also be taxed on the same principle. ‘G’ – Goods; ‘S’ – Services; ‘T’ – Tax. Goods and Service Tax (GST) is broad and a single comprehensive tax levied on goods and services consumed in an economy. It is levied at every stage of the production-distribution chain with applicable set offs in respect of the tax remitted at previous stages. It is basically a tax on final consumption. In simple terms, GST may be defined as a tax on goods and services, which is leviable at each point of sale or provision of service, in which at the time of sale of goods or providing the services the seller or service provider may claim the input credit of tax which he has paid while purchasing the goods or procuring the service. GST will subsume central indirect taxes like excise duty, countervailing duty and service tax, as also state levies like value added tax, octroi, entry tax, luxury tax. The final consumer will bear only the GST charged by the last dealer in the supply chain, with set-off benefits at all the previous stages. It is expected to bring about a 2% incremental GDP growth of the country. The illustration shown below indicates, in terms of a hypothetical example with a manufacturer, one wholesaler and one retailer, how GST will work. The same logic shall hold for services as well.
Stage of Supply Chain
Purchase Value of
Input Value
Addition
Value at Which
Supply Goods & Services
Made to Next Stage
Rate of
GST GST on Output
Input Tax
Credit
Net GST= GST on Output-
Input Tax Credit
Manufacturer 100 50 150 10% 15 10 15-10=5 Whole Seller 150 30 180 10% 18 15 18-15=3 Retailer 180 20 200 10% 20 18 20-18=2 Source: Referencer on Goods & Servics Tax, published by ICSI, September 2015 Presently in terms of Article 246 – Schedule VII of the Constitution of India we have got three lists, the Union List, the State List and the Concurrent List. Under the Union list only the Central Government can levy taxes and in the State List only the State Government can levy taxes. And under the Concurrent List both the Centre as well as the State can levy taxes. A look at the Central Taxes reveals a list that includes Customs duty, Central Excise, Service Tax and to top it all we have education cess and secondary higher education cess. We have got product specific cess like automobile cess, research and development cess and the likes. In the State List we have VAT along with Central Sales Tax (CST). This consists of entry levy tax, octroi, entertainment tax, luxury tax, etc. So, we have multiple taxes both at the Central and State Level and GST will bring some simplification, clarification and uniformity in indirect taxes.
Goods and Services Tax (GST): A paradigm shift in Indian Tax System 69
TSM Business Review, Vol. 4, No. 2, December 2016
2. Background of Goods and Services Tax (GST) in India Goods and Services Tax also known as the Value Added Tax (VAT) or Harmonized Sales Tax (HST) was first devised by a German economist during the 18th century. He envisioned a sales tax on goods that did not affect the cost of manufacture or distribution but was collected on the final price charged to the consumer. Thus it did not matter how many transactions the goods went through, the tax was always a fixed percentage of the final price. India has witnessed many reforms in indirect taxes over the past two decades with the replacement of state sales taxes by Value Added Tax (VAT) in 2005. The Kelkar Task Force on implementation of the Fiscal Responsibility and Budget Management (FRBM) Act, 2003 had pointed out that although the indirect taxation in India has been steadily progressing in the direction of VAT principle since 1986, the existing system of taxation still suffers from many problems. The tax base is fragmented between the Centre and the States. Services, which make up half of the GDP, are taxed inadequately. Kelkar Task Force in this context had suggested a comprehensive GST based on VAT principle. In May 2007 Empowered Committee (EC) of State Finance Ministers in consultation with the Central Government, constituted a Joint Working Group (JWG), to recommend the GST model. Within 7 months of its constitution, the Committee has sent its recommendations to the Government of India in the form of ‘A Model and Roadmap for Goods and Services Tax in India’ dated April 30, 2008. It was outline of the proposed GST. JWG recommendations with regard to GST are: 1. GST should have two components, a Central tax and a single uniform state tax across
the country. 2. A tax over and above GST may be levied by the states on tobacco, petroleum and
liquor. 3. The GST may not have a dual VAT structure but a quadruple tax structure namely:
a. a central tax on goods extending up to the retail level b. a central service tax c. a state-VAT on goods d. a state-VAT on services
Given the four-fold structure, there may be at least four-rate categories- one for each of the components given above. In this system the taxpayer may be required to calculate tax liability separately for the different rates of tax.
1. The JWG report suggested that states must tax intra-state services while inter-state services must remain with the Centre. Petroleum products, including crude, high-speed diesel and petrol, may remain outside the ambit of GST. The report had also mooted elimination of the area-based and sectoral excise duty exemptions that are being given by the Centre.
2. Central cess like education and oil cess may be kept outside the dual GST structure to be introduced from April 2010. Besides central cess, the EC of State
70 Goods and Services Tax (GST): A paradigm shift in Indian Tax System
TSM Business Review, Vol. 4, No. 2, December 2016
Finance Ministers has also recommended to keep purchase tax and octroi, which are collected at state and local levels, outside the GST framework.
3. The working group had suggested including cess and surcharges, which are levied for specific purposes on taxes at central and state levels, and had suggested to meet the specific requirement through budgetary allocation.
4. The report has also recommended keeping stamp duty, which is a good source of revenue for states, out of the purview of the GST. Stamp duty is levied on transfer of assets like houses and land.
5. Suggested to keep levies like the toll tax, environment tax and road tax outside the GST ambit, as these are user charges.
6. Recommended that if the levies are in the nature of user chargers and royalty for use of minerals, and then they must be kept out of the purview of the proposed tax.
The then FM, Mr. P. Chidambaram remarked that there is a large consensus that the country must move towards a national level GST that must be shared between the center and the states. He proposed 1st April 2010 as the date for introducing GST. Subsequently the Empowered Committee of State Finance Ministers agreed to work with the Central Government to prepare a roadmap for introducing a national level GST with effect from 1st April 2010. Finally, The Constitution Amendment Bill for Goods and Services Tax (GST) got approved by The President of India after its acceptance in the both the Parliament. The Government of India is committed to implement GST by April 2017. 3. Importance of GST to the economy A National Council of Applied Economic Research (NCAER) study, commissioned by the Thirteenth Finance Commission has stated: “GST across goods and services is expected, ceteris paribus, to provide gains to India‘s GDP somewhere within a range of 0.9 to 1.7 per cent. The corresponding change in absolute values of GDP over 2008-09 is expected to be between Rs. 42,789 crore and Rs. 83,899 crore, respectively. The comparable dollar value increment is estimated to be between $ 18, 550 million, respectively. The additional gain in GDP, originating from the GST reform, would be earned during all years in future over and above the growth in GDP which would have been achieved otherwise. The present value of the GST-reform induced gains in GDP may be computed as the present value of additional income stream based on some discount rate. Assuming a discount rate as the long-term real rate of interest at about 3 per cent, the present value of total gain in GDP has been computed as between Rs 1,469 thousand crores and 2,881 thousand crores. The corresponding dollar values are $325 billion and $637 billion.” Exports shall gain between 3.2 and 6.3 per cent with absolute value of Rs. 24,669 crore to Rs. 48,661 crore. GST would lead to efficient allocation of factors of production with decline in overall price reduction. Real returns to the factors of production would go up. Returns to land between 0.42 and 0.82 per cent; wage between 0.68 and 1.33 per cent; capital would gain somewhere between 0.37 and 0.74 per cent.
Goods and Services Tax (GST): A paradigm shift in Indian Tax System 71
TSM Business Review, Vol. 4, No. 2, December 2016
When asked as to how GST would help fiscal consolidation, Dr. Vijay L. Kelkar, Ex-Chairman, Thirteenth Finance Commission in his post-evidence replies stated as under:
“The changeover to GST is designed to be revenue neutral at existing levels of compliance. Given the design of the flawless GST, the producers and distributors will only by-pass through for the GST. Further, given the single and low rate of tax the benefit from evasion will significantly reduce. Therefore, there will be little incentive for the producers and distributors to evade their turnover. Accordingly, this policy initiative should witness a higher compliance and an upsurge in revenue collections. This will also have an indirect positive impact on direct tax collections. Further, given the fact that GST will trigger an increase in the GDP, this in turn would yield higher revenues even at existing levels of compliance. Another important source of gain for the Government would be the savings on account of reduction in the price levels of a large number of goods and services consumed by the Government. However, to the extent, the Central Government will be required to incentivize the States to adopt the GST, there will be an increase in the budgetary outgo. Given the smallness of the size of the compensation, it is expected that there would be a net gain in the tax revenues. This should enable the Central Government to better manage its finances. As regards the State Governments, the design and the road map of the GST recommended by us would lead to substantial gain in revenues. While the revenue neutral rate for the States is estimated to be 6 percent, we have recommended that the states should be allowed to impose GST at the rate of 7 percent. An increase in the RNR of the States by 1 percent implies a revenue gain of Rs. 31381 crores per annum in the base year 2007-08 (i.e., 16.67 percent increase in the revenues). This gain will be further augmented by better compliance. Therefore, overall the implementation of GST should enable the Government at both levels to better meet the challenges of fiscal correction. GST will positively impact the common man in many ways. Firstly, it will add to the overall economic growth by removing economic distortions. It will create new employment opportunities (about 20 million high end jobs over a period of time) thereby increasing the levels of income across a large section of the society. Secondly, it will reduce inflation if GST is levied at the combined rate of 12 percent as recommended by the Thirteenth Finance Commission. Thirdly, it will e-centralize production to areas enjoying comparative advantage so more jobs can be expected to be created in rural areas. This will in turn slow down the pace of migration to urban areas. Fourthly, it will improve governance since the introduction of a comprehensive GST will bring about more transparency and an end to crony capitalism. Finally, GST can create further opportunities for relief under direct taxes over time since it is viewed as a revenue generating machine. Alternately, it will facilitate fiscal consolidation thereby reducing the debt burden of citizens in general.”
Responding to the question on the impact of GST on prices, Dr. Vijay L. Kelkar, Ex- Chairman, Thirteenth Finance Commission in his post-evidence reply stated:
“Prices of agricultural commodities and services are expected to rise. Most of the manufactured goods would be available at relatively low prices especially textiles and readymade garments. There are two opposing forces which determine the changes in price levels. First, increased payments to the primary factors of production, viz. land, labour and capital, increase the cost of production and hence tend to have upward pull on prices. Second, sectors under imperfect competition (manufacturing sectors) get benefits of cost reduction through increasing returns to scale which are not reaped by sectors assumed to be in perfect competition. The relative impact of the force determines the overall price change. It may also be noted that the share of primary inputs (land, labour and capital) in total output is relatively high in agricultural and services sectors. Another factor that impacts the price levels refers to the quantum of intermediate input purchases from sectors under perfect competition versus imperfect competition. Relatively low proportions of intermediate inputs purchased by agriculture and service sectors (i.e., sectors under perfect competition) are sourced from manufacturing sectors and hence these sectors do not reap the benefit of relatively low cost inputs from manufacturing sectors. Therefore fall in prices of manufactured goods should benefit agriculture and services sectors. Further, the terms of trade can also be expected to improve in favour of
72 Goods and Services Tax (GST): A paradigm shift in Indian Tax System
TSM Business Review, Vol. 4, No. 2, December 2016
agriculture vis-à-vis manufactured goods. The prices of agricultural goods would increase between 0.61 percent and 1.18 percent whereas the overall prices of all manufacturing sector would decline between 1.22 percent and 2.53 percent. Consequently, the terms of trade will move in favour of agriculture between 1.9 percent and 3.8 percent. The increase in agricultural prices would benefit millions of farmers in India. Similarly, the urban poor will also benefit from new employment opportunities. With regard to the food crops the poor would continue to remain secured through the public distribution system. The prices of many other consumer goods are expected to decline. These include sugar; beverages; cotton; textiles; wool, silk and synthetic fibre textiles; and textile products and wearing apparel. Therefore, overall inflationary impact of GST will be negative through lower prices, lower fiscal deficit and higher output.”
4. Conclusion The overall macroeconomic effect of reduction in economic distortions due to GST would be to provide an impetus to economic growth. The NCAER study commissioned by the Thirteenth Finance Commission estimates the impact of the introduction of a GST which would eliminate all taxes on production and distribution and rest on final consumption only. It will lead to efficient allocation of factors of production thus leading to gain in GDP and exports. The switch over to GST will be neutral to vertical and horizontal integration and thus will encourage industries to be located in states which enjoy a comparative advantage. Resource rich backward states will also attract natural resources based industries regardless of the fact that the consumer is located elsewhere. In nutshell, GST would generate greater employment as it helps to increase labor intensive sectors and thus, along with growth in GDP, economic welfare will also be enhanced. References
http://www.answers.com/Q/When_did_VAT_start_in_UK http://www.gstindiaexpert.com/Home/AboutGST/GST-and-its-Benefits http://www.ncaer.org/news_details.php?nID=171 https://iasaspirant.wordpress.com/2010/03/04/13th-finance-commission https://www.scribd.com/document/325930414/Comparativeratioanalysis. “Referencer on Goods and Service tax”, ICSI report, September 2015.
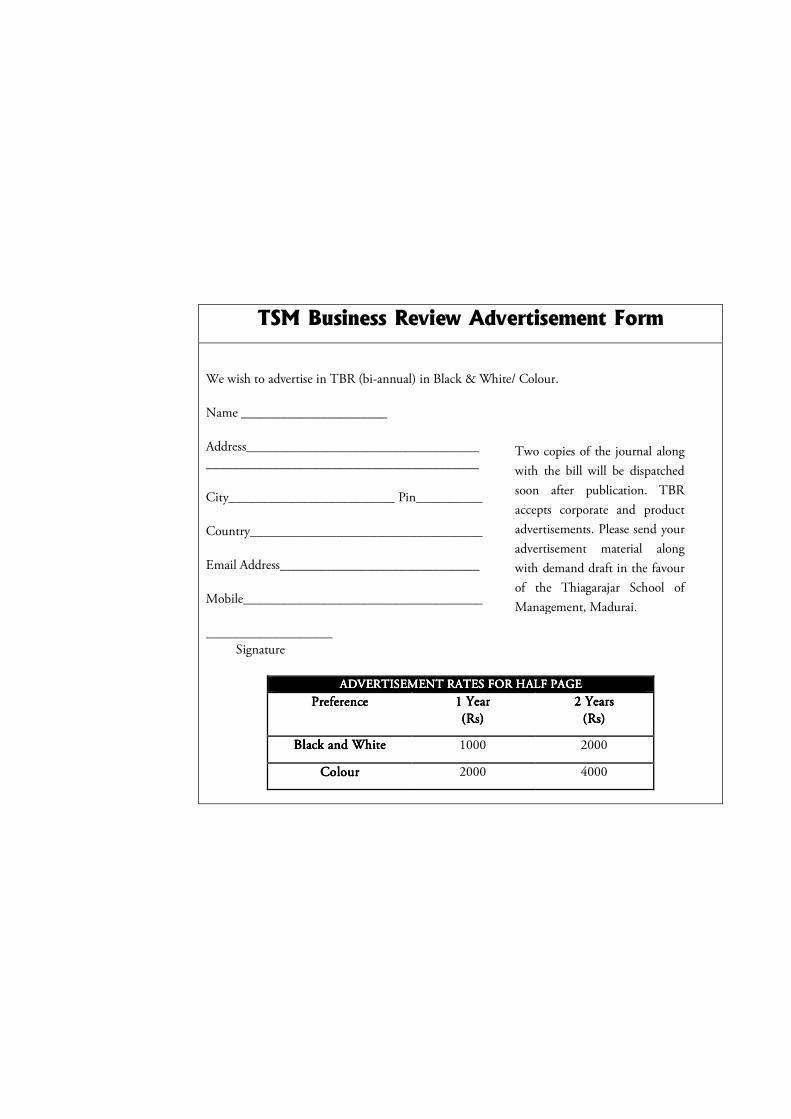
ITC: The Indian Tobacco Major’s Corporate Social Responsibilities and Sustainable Initiatives Ethical Leadership 88
TSM Business Review Advertisement Form
We wish to advertise in TBR (bi-annual) in Black & White/ Colour.
Name ______________________
Address___________________________________
_________________________________________
City_________________________ Pin__________
Country___________________________________
Email Address______________________________
Mobile____________________________________
___________________
Signature
ADVERTISEMENT RATES FOR HALF PAGEADVERTISEMENT RATES FOR HALF PAGEADVERTISEMENT RATES FOR HALF PAGEADVERTISEMENT RATES FOR HALF PAGE
PreferencePreferencePreferencePreference 1 Year1 Year1 Year1 Year
(Rs)(Rs)(Rs)(Rs)
2 Years2 Years2 Years2 Years
(Rs)(Rs)(Rs)(Rs)
Black and WhiteBlack and WhiteBlack and WhiteBlack and White 1000 2000
ColourColourColourColour 2000 4000
Two copies of the journal along
with the bill will be dispatched
soon after publication. TBR
accepts corporate and product
advertisements. Please send your
advertisement material along
with demand draft in the favour
of the Thiagarajar School of
Management, Madurai.
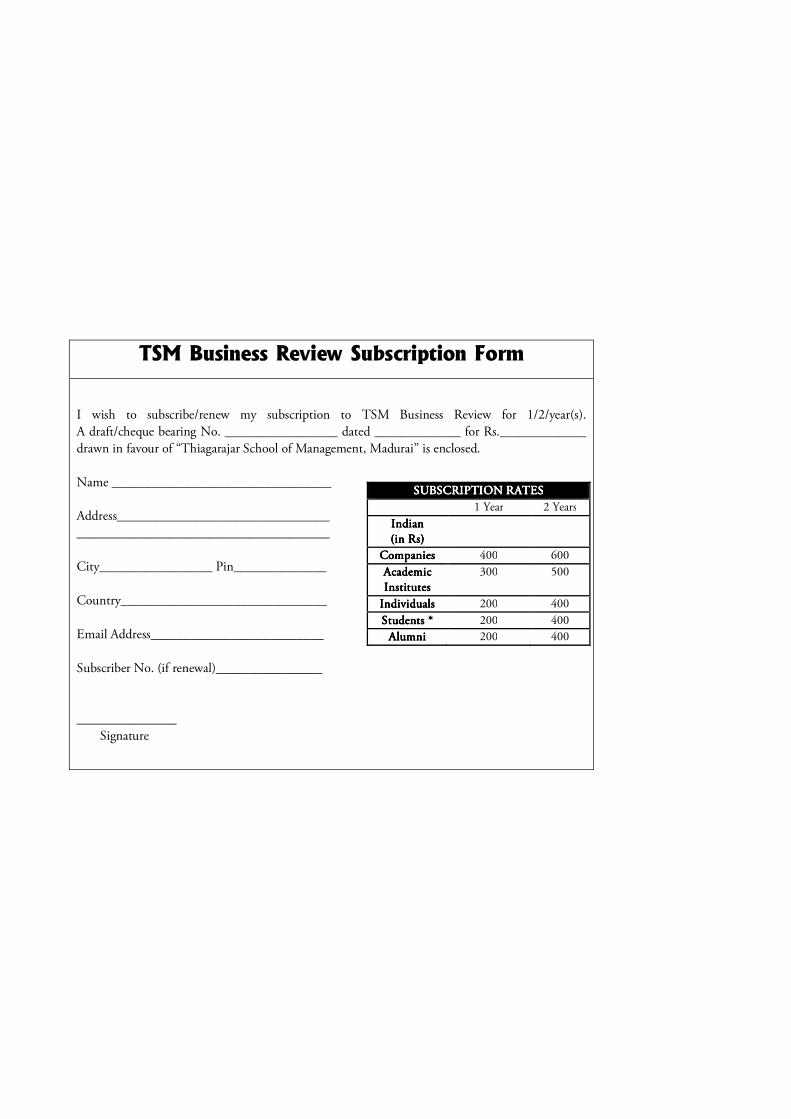
ITC: The Indian Tobacco Major’s Corporate Social Responsibilities and Sustainable Initiatives Leadership 89
TSM Business Review Subscription Form
I wish to subscribe/renew my subscription to TSM Business Review for 1/2/year(s).
A draft/cheque bearing No. _________________ dated _____________ for Rs._____________
drawn in favour of “Thiagarajar School of Management, Madurai” is enclosed.
Name _________________________________
Address________________________________
______________________________________
City_________________ Pin______________
Country_______________________________
Email Address__________________________
Subscriber No. (if renewal)________________
_______________
Signature
SUBSCRIPTION RATESSUBSCRIPTION RATESSUBSCRIPTION RATESSUBSCRIPTION RATES
1 Year 2 Years
Indian Indian Indian Indian
(in Rs)(in Rs)(in Rs)(in Rs)
CompaniesCompaniesCompaniesCompanies 400 600
Academic Academic Academic Academic
InstitutesInstitutesInstitutesInstitutes
300 500
IndividualsIndividualsIndividualsIndividuals 200 400
Students *Students *Students *Students * 200 400
AlumniAlumniAlumniAlumni 200 400
ITC: The Indian Tobacco Major’s Corporate Social Responsibilities and Sustainable Initiatives Ethical Leadership 90
Faculty Requirements at TSM In view of growing student numbers, and the need to introduce additional/new courses at both core and elective levels to keep pace with industry requirements, we have requirements of full-time Faculty and Faculty Associates across different areas such as Finance, HRM, Marketing, Operations Management & Quantitative Methods, and Economics. The following attributes will be desirable in respect of faculty across all the above areas: • A doctorate (preferably full-time) or at an advanced stage of competing a
doctoral programme • MBA/PGDM from a reputed B-school • Teaching experience of at least 3-4 years in a reputed B-school • Industry experience of 2-3 years or more • A proven track record in one or more of the following areas:
o Doing research and publishing papers in refereed journals o Consulting, including securing consultancy and research contracts
from Govt. depts., PSUs and private sector companies o Organizing MDPs and management conferences/seminars o Handling additional responsibilities such as programme
management, placements & corporate relations, admissions, and alumni relations.
The desired age range for all the above functional areas is 28-35 for Faculty and 25-32 for Faculty Associates. The requirements in respect of experience may be relaxed or waived for Faculty Associate candidates.TSM offers an attractive salary package which is at par, if not superior to, most private B-schools, and is commensurate with qualifications, track record, and experience. TSM also supports its faculty’s efforts in engaging in consultancy and MDPs, and has a revenue sharing arrangement for such activities. All positions are based in Madurai in the State of Tamil Nadu.Applications are also invited from existing faculty and senior executives in industry, who wish to teach in a visiting capacity. Such candidates should ideally be based in Madurai, Chennai, Bangalore or Coimbatore. Please apply in confidence, mentioning all relevant details, including present salary, to the Director, Thiagarajar School of Management, at [email protected]
ITC: The Indian Tobacco Major’s Corporate Social Responsibilities and Sustainable Initiatives Leadership 91 CALL FOR CONTRIBUTIONS TSM Business Review, published by Thiagarajar School of Management, Madurai is an international bi-annual, double blind, peer-reviewed journal with ISSN 2348 –3784. TBR welcomes original research papers, case studies with teaching note, book reviews, discussion papers and perspectives on various functional areas of management science. It aims to present the latest thinking and research on major management topics in form of articles that meet high academic quality standards, while still being accessible to non-specialists. The journal has a distinguished editorial board composed of leading experts/researchers from around the world. We encourage authors to bring rigorous empirical and high quality research work from the areas of Human Resource Management, Organizational Behavior, Marketing Management, Accounting Research, Financial Management, Banking and Financial Institutions, Microeconomics, Macroeconomics, Development Economics, Operations Management, Business Innovation Business Information and Technology, Project Management, Knowledge Management Organizational Development, Strategic Management, Business Process, Reengineering and Benchmarking, Productivity, Competitiveness and Business Growth, Entrepreneurship and Small Business, New Product Development, Leadership and Organizational Change, Service and Manufacturing Management, Supply Chain and Value Analysis, General Management, Banking, Insurance, Corporate Governance, Information Technology and emerging trends in allied subjects across the globe. Papers should not have been simultaneously submitted for publication to another journal or any other source. If the paper has appeared earlier in a different version, we would appreciate you to send a copy of the same with your contribution. Authors are requested to follow TBR guidelines to fine tune their contributions. It will help immensely to speed up the review process and would lead to zero error. The writers are requested to strictly follow the submission guidelines especially with regard to citation and preparation of the bibliography. The back volumes, submission guidelines and sample paper are available on the below URL: http://www.tsm.ac.in/TSMBusinessReview.html Kindly send your manuscript (research paper/ case/article/book review) on the following email address: [email protected]
ITC: The Indian Tobacco Major’s Corporate Social Responsibilities and Sustainable Initiatives Ethical Leadership 92 JOURNAL INFORMATION Journal name TSM Business Review ISSN 2348-3784 Frequency of Publication Biannual Month of Publication December and June Submission of research paper/case/reviews Throughout the year Notification of acceptance
Within 20 working days of submission through email
Processing and Publication fees There is no processing and publication fee
Who can contribute Academicians, research scholars, experts from corporate, NGO’s, Politicians, Government officers
Author’s receivable Authors shall receive free copy of the journal.
General enquiries for journal [email protected] Submission of articles [email protected]
ITC: The Indian Tobacco Major’s Corporate Social Responsibilities and Sustainable Initiatives Leadership 93 CALL TO JOIN REVIEW BOARD
Academic fraternity is welcome to join the review board of TBR. Please email your CV to TBR office. Since TBR is not for profit, we shall not pay any honorarium for review. Your name shall be recognized in the journal. Decision of acceptance of your request as reviewers shall be done by editorial board. INDEXING PARTNERS
Google Scholar, ABI/INFORM Global, ProQuest Asian Business & Reference, ECONIS / EconBiz (ZBW – German National Library of Economics), Research Bible, EBSCO, i-scholar, DOI (research articles, cases & perspectives)
ITC: The Indian Tobacco Major’s Corporate Social Responsibilities and Sustainable Initiatives Ethical Leadership 94
GUIDELINES FOR AUTHORS Description TSM Business Review (TBR), published by Thiagarajar School of Management, Madurai is an international bi-annual peer-reviewed journal. The journal publishes full length articles but review papers, case studies, book reviews and research notes are welcome. TBR provides a dynamic platform for all functional areas of management but is not limited to Human Resource Management, Organizational Behavior, Marketing Management, Accounting Research, Financial Management, Banking and Financial Institutions, Microeconomics and Macroeconomics, Development Economics, Operations Management, Business Innovation Business Information and Technology, Project Management, Knowledge Management Organizational Development, Strategic Management, Business Process, Reengineering and Benchmarking, Productivity, Competitiveness and Business Growth, Entrepreneurship and Small Business, New Product Development, Leadership and Organizational Change, Service and Manufacturing Management, Supply Chain and Value Analysis. TBR aims to present the latest thinking and research on major management topics in form of articles that meet high academic quality standards, while still being accessible to non-specialists. The journal has a distinguished editorial board composed of leading experts/researchers from around the world. Manuscript requirement Author name In order to facilitate a blind review, author’s name should appear on the first page containing article title, author’s name and affiliation, mailing address, phone and fax numbers and email address. Details of authors should not appear elsewhere in the manuscript. Corresponding author In case of multiple authors, the first page should indicate the author to whom correspondence should be addressed. Make sure that along with e-mail address and the complete postal address of that author, his/her telephone number (with country and area code) must also be written.
ITC: The Indian Tobacco Major’s Corporate Social Responsibilities and Sustainable Initiatives Leadership 95 Title Title of your work should be very crisp and meaningful and to be less than 20 words. Title will appear in the first page of the manuscript where you are providing author’s information and also in the second page from where the content begins. Abstract Your research work should be accompanied by an abstract which should not exceed 200 words. This abstract should entail the purpose of the study, methodology employed and findings of the study. Abstracts should be in italics. Keywords Right after the abstract, write down a maximum of 3-6 keywords. Try to avoid general and plural terms and multiple concepts (avoid, for instance, ‘and’, ‘of’). Be very careful while using abbreviations in keywords; use only those abbreviations which are definitely recognized in the field of study. Guidelines for text in Manuscript Authors should adopt the following rules for the text to be written in their manuscript. These rules are meant to be for whole text which may include abstract, keywords, headings and references. Font: Times New Roman; Size: 12 Line Spacing: Double Heading 1: Times New Roman; Size-12; Bold; for example, 1. Introduction Heading 2: Times New Roman; Size-12; Italic; for example, 1.1 Leadership Heading 3: Times New Roman; Size-13; for example, 1.1.1 Leadership Theories Tables, Figures, and Formulae Note that tables and figures should be numbered one after another according to their appearance in the text. Title of tables and figures should be presented right above the body of the table, left aligned. Footnote of the table and figure should contain the source of information. Where possible, avoid vertical rules. Kindly make that data presented in the table do not duplicate the results presented in the manuscript elsewhere. The text size of the formula, if any, should be similar to the normal text size of the manuscript. References Authors are advised to follow the referencing style used by American Psychological Association (APA). The whole citation should follow the APA style. Book with Single Author:
ITC: The Indian Tobacco Major’s Corporate Social Responsibilities and Sustainable Initiatives Ethical Leadership 96 Gore, A. (2006). An inconvenient truth: The planetary emergency of global warming and what we can do about it. Emmaus, PA: Rodale. In-text reference:(Gore, 2006) Book with Two Authors: Michaels, P. J., & Balling, R. C., Jr. (2000).The satanic gases: Clearing the air about global warming. Washington, DC: Cato Institute. In-text reference:(Michaels & Balling, 2000) Book with Editor as Author: Galley. K. E. (Ed.). (2004). Global climate change and wildlife in North America.Bethesda, MD: Wildlife Society. In-text reference:(Galley, 2004) Brochure or Pamphlet: New York State Department of Health. (2002). After a sexual assault. [Brochure]. Albany, NY: Author. In-text reference:(New York, 2002) Magazine Articles: Allen, L. (2004, August). Will Tuvalu disappear beneath the sea? Global warming threatens to swamp a small island nation. Smithsonian, 35(5), 44-52. Begley, S., &Murr, A. (2007, July 2). Which of these is not causing global warming? A. Sport utility vehicles; B. Rice fields; C. Increased solar output. Newsweek, 150(2), 48-50. In-text references:(Allen, 2004) (Begley, 2007) Newspaper Articles : College officials agree to cut greenhouse gases. (2007, June 13). Albany Times Union, p. A4. Landler, M. (2007, June 2). Bush’s Greenhouse Gas Plan Throws Europe Off Guard. New York Times, p. A7. In-text references:(“College Officials”, 2007) (Landler, 2007) Journal Articles: Bogdonoff, S., & Rubin, J. (2007). The regional greenhouse gas initiative: Taking action in Maine. Environment, 49(2), 9-16. In-text reference: (Bogdonoff& Rubin, 2007)
ITC: The Indian Tobacco Major’s Corporate Social Responsibilities and Sustainable Initiatives Leadership 97 Miller-Rushing, A. J., Primack, R. B., Primack, D., &Mukunda, S. (2006). Photographs and herbarium specimens as tools to document phonological changes in response to global warming.American Journal of Botany, 93, 1667-1674. In-text reference:(Miller-Rushing, Primack, Primack, &Mukunda, 2006) Website: United States Environmental Protection Agency. (2007, May 4). ClimateChange. Retrievedfrom the Environmental Protection Agency website: http://www.epa.gov/climatechange In-text reference: (United States Environmental, 2007) Gelspan, R. (2007). The Heat Is Online. Lake Oswego, OR: Green House Network. Retrieved from The Heat Is Online website: http://www.heatisonline.org In-text reference:(Gelspan, 2007)
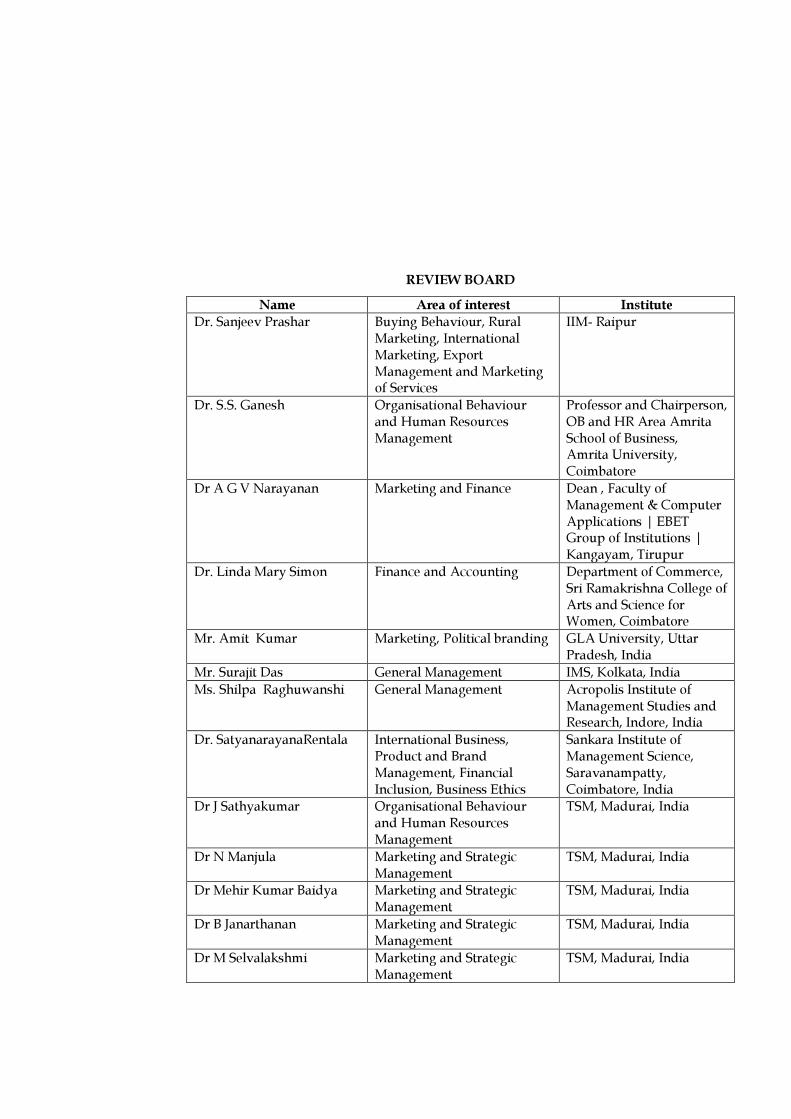
ITC: The Indian Tobacco Major’s Corporate Social Responsibilities and Sustainable Initiatives Ethical Leadership 98
REVIEW BOARD Name Area of interest Institute
Dr. Sanjeev Prashar Buying Behaviour, Rural Marketing, International Marketing, Export Management and Marketing of Services
IIM- Raipur
Dr. S.S. Ganesh
Organisational Behaviour and Human Resources Management
Professor and Chairperson, OB and HR Area Amrita School of Business, Amrita University, Coimbatore
Dr A G V Narayanan Marketing and Finance Dean , Faculty of Management & Computer Applications | EBET Group of Institutions | Kangayam, Tirupur
Dr. Linda Mary Simon Finance and Accounting Department of Commerce, Sri Ramakrishna College of Arts and Science for Women, Coimbatore
Mr. Amit Kumar Marketing, Political branding GLA University, Uttar Pradesh, India
Mr. Surajit Das General Management IMS, Kolkata, India Ms. Shilpa Raghuwanshi General Management Acropolis Institute of
Management Studies and Research, Indore, India
Dr. SatyanarayanaRentala International Business, Product and Brand Management, Financial Inclusion, Business Ethics
Sankara Institute of Management Science, Saravanampatty, Coimbatore, India
Dr J Sathyakumar Organisational Behaviour and Human Resources Management
TSM, Madurai, India
Dr N Manjula Marketing and Strategic Management
TSM, Madurai, India Dr Mehir Kumar Baidya Marketing and Strategic
Management TSM, Madurai, India
Dr B Janarthanan Marketing and Strategic Management
TSM, Madurai, India Dr M Selvalakshmi Marketing and Strategic
Management TSM, Madurai, India
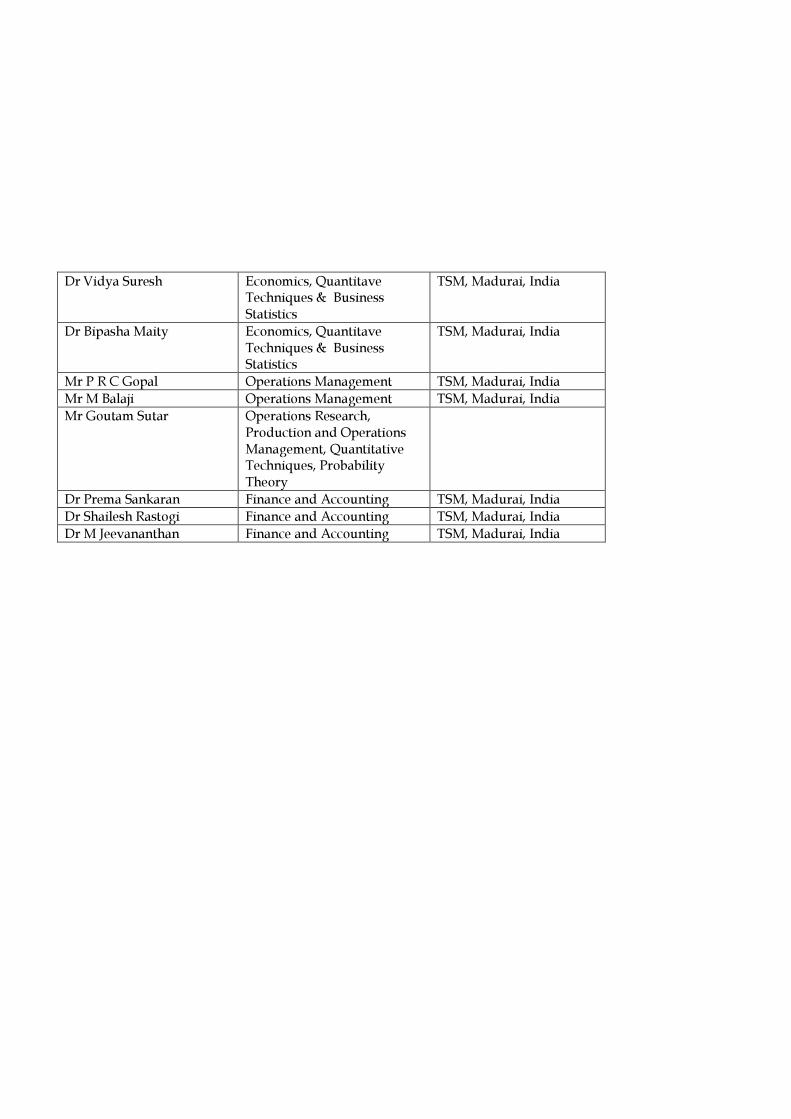
ITC: The Indian Tobacco Major’s Corporate Social Responsibilities and Sustainable Initiatives Leadership 99
Dr Vidya Suresh Economics, Quantitave Techniques & Business Statistics
TSM, Madurai, India
Dr Bipasha Maity Economics, Quantitave Techniques & Business Statistics
TSM, Madurai, India
Mr P R C Gopal Operations Management TSM, Madurai, India Mr M Balaji Operations Management TSM, Madurai, India Mr Goutam Sutar Operations Research,
Production and Operations Management, Quantitative Techniques, Probability Theory
Dr Prema Sankaran Finance and Accounting TSM, Madurai, India Dr Shailesh Rastogi Finance and Accounting TSM, Madurai, India Dr M Jeevananthan Finance and Accounting TSM, Madurai, India
Thiagarajar School of Management (TSM), Madurai has established itself in the Southern part of India as one
of the premier citadels of learning, rendering creditable service to the cause of higher education. TSM was
founded in 1962 by the doyen of the South Indian textile industry, Mr. Karumuttu Thiagarajar Chettiar - a
great philanthropist who also founded several engineering and arts colleges, polytechnics; teacher's training
institutes, and primary and secondary schools.
TSM offers a choice of management education streams: All India Council of Technical Education (AICTE)
approved PGDM (Post Graduate Diploma in Management) programme which was launched in 2011 and the
MBA (Master of Business Administration) programme - approved by AICTE, accredited by National Board
of Accreditation (NBA), autonomous status granted by UGC and affiliated to Madurai Kamaraj University.
Both the programmes are 2-year full-time, fully residential. PGDM is the flagship programme of TSM. .
TSM is run by the Manickavasagam Charitable Foundation - an organization that has been actively involved
in several primary and higher educational projects. Mr. Manickavasagam Chettiar, the prime mover behind
TSM, was its Founder Correspondent. TSM prides itself on being one of the few institutions that does not
accept any capitation fees from students seeking admission. The school is fully supported and funded by the
Loyal Textiles Group. The Chairman & Managing Director of the group, Mr. Manikam Ramaswami, a Gold
Medalist from IIT Chennai, is the present Correspondent of TSM. .
Eminent faculty members in the areas of Marketing, Finance, Human Resources, Operations and Systems
give wider and deeper insights both in theory & practice to the students. Situated in a picturesque location,
equipped with a state of art infrastructure, TSM delivers more than what it promises and it is no wonder that
a TSM student is academically sound, professionally proficient and ethically correct. The outcome, TSM's
excellent placement record and academic performance are the result of the processes that are in place at TSM
–processes for excellence in management education.
About Thiagarajar School of Management
tbr
Chief Editor