volume 4 no: 1 (2019) adoption of technologies and crop
TRANSCRIPT

Volume 4 No: 1 (2019)
Adoption of Technologies and Crop Productivity in
Ethiopia: The Role of Agricultural Information
Getachew Ahmed and Tigabu Degu
January 2019

Citation Getachew Ahmed and Tigabu Degu, (2019). Adoption of Technologies and Crop Productivity in
Ethiopia: The Role of Agricultural Information. FARA Research Report 4(1): PP29
Corresponding Author Tigabu Getahun ( [email protected] ) FARA encourages fair use of this material. Proper citation is requested
Forum for Agricultural Research in Africa (FARA) 12 Anmeda Street, Roman Ridge PMB CT 173, Accra, Ghana Tel: +233 302 772823 / 302 779421 Fax: +233 302 773676 Email: [email protected] Website: www.faraafrica.org Editorials Dr. Fatunbi A.O ([email protected]); Dr. Abdulrazak Ibrahim ([email protected] ), Dr. Augustin Kouevi([email protected] ) and Mr. Benjamin Abugri([email protected])
ISSN: 2550-3359
.
About FARA The Forum for Agricultural Research in Africa (FARA) is the apex continental organisation responsible for coordinating and advocating for agricultural research-for-development. (AR4D). It serves as the entry point for agricultural research initiatives designed to have a continental reach or a sub-continental reach spanning more than one sub-region. FARA serves as the technical arm of the African Union Commission (AUC) on matters concerning agricultural science, technology and innovation. FARA has provided a continental forum for stakeholders in AR4D to shape the vision and agenda for the sub-sector and to mobilise themselves to respond to key continent-wide development frameworks, notably the Comprehensive Africa Agriculture Development Programme (CAADP). FARA’s vision is; “Reduced poverty in Africa as a result of sustainable broad-based agricultural growth and improved livelihoods, particularly of smallholder and pastoral enterprises” its mission is the “Creation of broad-based improvements in agricultural productivity, competitiveness and markets by strengthening the capacity for agricultural innovation at the continental-level”; its Value Proposition is the “Strengthening Africa’s capacity for innovation and transformation by visioning its strategic direction, integrating its capacities for change and creating an enabling policy environment for implementation”. FARA’s strategic direction is derived from and aligned to the Science Agenda for Agriculture in Africa (S3A), which is in turn designed to support the realization of the CAADP vision.
About FARA Research Result (FRR) FARA Research Report (FRR) is an online organ of the Forum for Agricultural Research in Africa (FARA). It aims to promote access to information generated from research activities, commissioned studies or other intellectual inquiry that are not structured to yield journal articles. The outputs could be preliminary in most cases and in other instances final. The papers are only published after FARA secretariat internal review and adjudgment as suitable for the intellectual community consumption.
Disclaimer “The opinions expressed in this publication are those of the authors. They do not purport to reflect the opinions or views of FARA or its members. The designations employed in this publication and the presentation of material therein do not imply the expression of any opinion whatsoever on the part of FARA concerning the legal status of any country, area or territory or of its authorities, or concerning the delimitation of its frontiers”.

Abstract
Understanding how diffusion of new agricultural technology works and investigating the role of
agricultural information in this process has an important contribution to inform policy and
improve how diffusion policies function. Using a unique and two-round panel dataset, this study
attempts to identify the type and channels of acquiring, agricultural information; and whether
this information helps them in their decisions to adopt new technologies, and how using such
inputs is translated into better and higher yield. The study suggests that community gatherings
are an important source of agricultural information and encourage wheat and barley farmers to
use more modern inputs such as chemical fertilizers and improved seeds. On-farm services of
extension workers were also instrumental in encouraging wheat farmers to use more chemical
fertilizers than wheat farmers who didn't benefit from such services. Moreover, the result also
reveals that wheat yield responded to the use of chemical fertilizers, improved seeds and other
chemicals (pesticides, fungicides etc.), while yield for barley farmers responded only to chemical
fertilizers and other chemicals. Although a significant number of farmers reported that they use
mass media as a source of information, the data doesn't support any link between the use of
media and application of modern inputs. Moreover, a link between visiting demonstration plot
and application of chemical fertilizers and improved seeds couldn't be established partly due to
the fact that only few farmers used these plots as a resource in their decisions due to the limited
number of demonstration plots. These findings suggest that community meetings and on-farm
advisory services have the capacity to convince farmers to use new and improved technologies
such as chemical fertilizers and improved seeds and need to be expanded. Furthermore,
demonstration plots should be expanded to allow farmers access to a first-hand and
experimental showcase of modern agriculture.

Introduction
Central to the transformation and commercialization of the Ethiopian agriculture is to increase
smallholder productivity of the sector. Official sources from the Central Statistics Agency (CSA)
indicate that productivity grew in Ethiopia for the last one and half decades. Across the main
cereals, productivity has been growing in unison. Production increased from a level of 14 and 11
quintals per hectare in 1997 to 25 and 20 quintals per hectare in 2016 for wheat and barley,
respectively. Growth has been steady, with a temporary decrease in some years.
Despite this productivity growth, performance still falls short of the target set in order to
transform smallholder agriculture. The major factor for the short fall in achieving the planned
level of agricultural productivity is related to the coverage and quality of implementation of
agricultural extension system (National Planning Commission, 2016). As part of the general
agricultural innovation system, the Ethiopian agricultural extension system disseminates
available technologies and farming practices to end users (i.e. smallholder farmers) in the system.
Well-functioning agricultural innovation system is crucial for smallholder farming in Ethiopia.
Investments in research and development (R&D) of new agricultural technologies and their
diffusion have been a steady component of the Ethiopian agricultural development strategy to
improve and maintain productivity. Conducting R&D in high yielding varieties for selected crops,
imports and distribution of chemical fertilizers and pesticides and an expansion of extension
advisory services have been part of this effort to enhance crop productivity.
On average, 2.5 million quintals of chemical fertilizers were utilized annually during the period
2003-2015 for meher (i.e. main) season. In the same period, 0.2 million quintals of improved
seeds were used; and 1.6 million ha of land was covered by pesticides and extension service each
(Table 1).
Table 1:Actual utilization of modern inputs by small holder farmers (in millions): 2003-2016
Period Modern inputs Number of
holders Are covered
(ha) Quantity utilized
(quintals)
2003/04-2009/10
Chemical fertilizer-DAP & Urea 2.5 1.5 2.4 Improved Seeds 1.4 0.4 0.2 Pesticides 2.6 1.5 - Extension package 2.5 1.5
2010/11-2015/16
Chemical fertilizer (DAP & Urea) 3.9 2.4 3.4 Improved Seeds 2.2 0.7 0.4 Pesticides 3.5 2.2 - Extension package 3.6 2.2
Source: Agricultural Sample Survey, Central Statistics Agency
However, adoption rate is still low. The share of area covered with improved seeds from total
area cultivated is only 5 percent and that of pesticides 20 percent from total area cultivated using
all cereal crops. Depending on sources, area covered with chemical fertilizer is also low ranging

from 17 percent to 35 percent of total area of land cultivated with all cereal crops(Asrat,
Getachew, and Taffesse 2012; CSA 2011, 2012).
Investigating the factors for the sluggish adoption rate and examining the dissemination
apparatus and flow of agricultural information from extension agents to end users help policy
makers identify important bottlenecks of diffusion and adoption mechanisms. There are some
existing evidences on some of these factors. Given the supply of inputs, farmers willingness to
adopt new technologies depends on household characteristics such as gender where male
headed wheat farmers tend to adopt high yielding variety (Hailu, Abrha, and Woldegiorgis 2014;
Tesfaye, Bedada, and Mesay 2016). Agricultural inputs such as land ownership security, use of
irrigation, access to credit (Hailu et al., 2014); and ownership of livestock (Tesfaye et al., 2016)
were found to be instrumental to an increasing adoption rates of modern inputs. Access to
agricultural information plays a role in adoption behavior.
The flow of information through social networks contributes to adoption of improved seeds
(Mekonnen et al., 2016). The use of mass media methods of information transfer has the
potential to greatly help farming community (Ali, 2011). Furthermore, farmers who own radios
tend to choose high yielding wheat varieties (Kelemu, Haregewoin, and Daniel 2016).
This study focuses on this last strand of the literature. The contribution of a new agricultural
technology to enhance productivity can only be realized if the new technology is widely diffused,
and if farmers have enough and applicable information about that technology. The type and
content of agricultural information influences production decisions and farmers' willingness to
use new technologies in a variety of ways. It is therefore imperative that the functions and use
of a particular agricultural information system be understood in order to manage and improve
its creation and dissemination.
Looking at the Ethiopian agricultural innovation process and the role of agricultural information
in this process helps us understand the mechanisms of adoption and inform policy to improve
the effectiveness of the agricultural extension system and in particular the diffusion of new
technologies. This will allow us to answer a number of important questions. They include, among
others: What are the sources and types of farmers' information set on new agricultural
technologies and the channels for acquiring this information? Do farmers actually utilize existing
stock of agricultural information in adopting new technologies? Do modern inputs and market
information help farmers get productivity gains? The study is an attempt to identify the type and
channels of acquiring agricultural information by farmers; and whether this information helps
them in their decisions to adopt new and improved technologies, which can then be translated
into higher yield.
We use a unique two-period panel data sets that come from surveys conducted in 2011 and 2013
by the Central Statistical Agency in collaboration with Ethiopian Strategic Support Program to
evaluate Agricultural Growth Program (AGP). We do the analysis on wheat and barley farmers.
These crops were chosen for a couple of reasons. First, production of wheat and barley account
for 28 percent of total cereal crop output covering 26 percent of the area cultivated using these
crops. Second, these crops are among a few cereal crops for which high yielding varieties have
been developed. A particular emphasis is given to Oromia region, because 55 percent of total
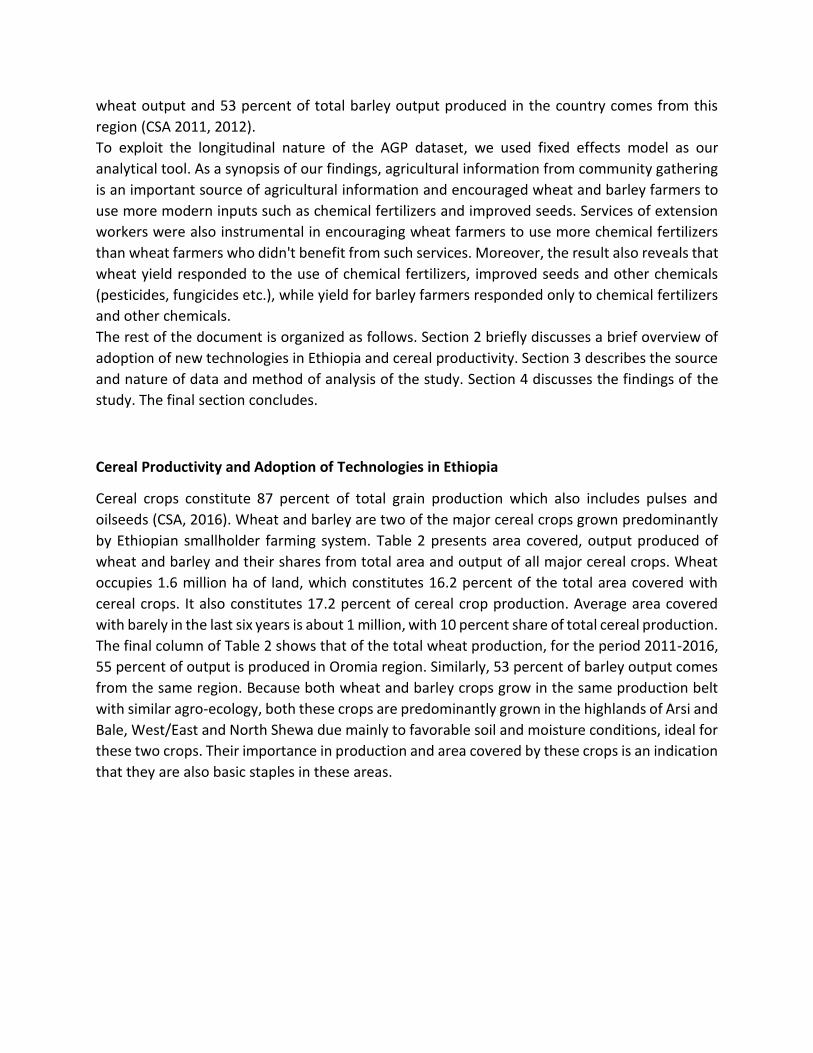
wheat output and 53 percent of total barley output produced in the country comes from this
region (CSA 2011, 2012).
To exploit the longitudinal nature of the AGP dataset, we used fixed effects model as our
analytical tool. As a synopsis of our findings, agricultural information from community gathering
is an important source of agricultural information and encouraged wheat and barley farmers to
use more modern inputs such as chemical fertilizers and improved seeds. Services of extension
workers were also instrumental in encouraging wheat farmers to use more chemical fertilizers
than wheat farmers who didn't benefit from such services. Moreover, the result also reveals that
wheat yield responded to the use of chemical fertilizers, improved seeds and other chemicals
(pesticides, fungicides etc.), while yield for barley farmers responded only to chemical fertilizers
and other chemicals.
The rest of the document is organized as follows. Section 2 briefly discusses a brief overview of
adoption of new technologies in Ethiopia and cereal productivity. Section 3 describes the source
and nature of data and method of analysis of the study. Section 4 discusses the findings of the
study. The final section concludes.
Cereal Productivity and Adoption of Technologies in Ethiopia
Cereal crops constitute 87 percent of total grain production which also includes pulses and
oilseeds (CSA, 2016). Wheat and barley are two of the major cereal crops grown predominantly
by Ethiopian smallholder farming system. Table 2 presents area covered, output produced of
wheat and barley and their shares from total area and output of all major cereal crops. Wheat
occupies 1.6 million ha of land, which constitutes 16.2 percent of the total area covered with
cereal crops. It also constitutes 17.2 percent of cereal crop production. Average area covered
with barely in the last six years is about 1 million, with 10 percent share of total cereal production.
The final column of Table 2 shows that of the total wheat production, for the period 2011-2016,
55 percent of output is produced in Oromia region. Similarly, 53 percent of barley output comes
from the same region. Because both wheat and barley crops grow in the same production belt
with similar agro-ecology, both these crops are predominantly grown in the highlands of Arsi and
Bale, West/East and North Shewa due mainly to favorable soil and moisture conditions, ideal for
these two crops. Their importance in production and area covered by these crops is an indication
that they are also basic staples in these areas.

Table 2: Area, output and share (percent) of wheat and barley from cereal crops*
crop Period National Oromia share of Oromia
Area Share Output share
area
share Output
share area output
Wheat
1997-2001
0.9 14.1 12.0 15.1 0.5 18.3 7.6 19.1 57.9 63.3
2002-2010
1.4 17.1 22.3 18.6 0.7 19.0 12.9 20.3 53.8 58.0
2011-2016
1.6 16.2 35.3 17.2 0.8 18.1 19.4 19.4 51.9 54.8
Barley
1997-2001
0.8 11.6 8.0 10.0 0.4 12.5 4.3 10.9 48.1 54.4
2002-2010
0.8 10.0 13.8 11.5 0.4 9.5 5.7 8.9 56.1 41.0
2011-2016
1.0 10.1 17.3 8.4 0.5 10.2 9.1 9.2 52.7 52.8
Source: Central Statistical Agency, Annual Agricultural Sample Survey (1996-2016).
Note: The area column is in millions of hectares, and the output column is in millions of quintals
Official sources show that cereal yield grew in Ethiopia for the last one and a half decades. Across
the main cereals, production increased from a level of 14 and 11 quintals per hectare in 1997 to
25 and 20 quintals per hectare in 2016 respectively for wheat and barley; growth has been
steady, with a temporary decrease in some years (Source: Central Statistical Agency, Annual
Agricultural Sample Survey (1996-2016)
Figure 1). Production of major cereal crops seems to have been increasing in unison especially in
recent years. There is no significant difference in yield growth of these crops unlike the
experiences of other countries, which showed high yield growth during the green revolution,
where crop specificity is an important feature.
Source: Central Statistical Agency, Annual Agricultural Sample Survey (1996-2016)
Figure 1 presents trends of wheat yield over the last 16 years at national level and for Oromia
region separately. At national level, wheat yield, measured in quintals per ha of land, has been
growing in the last one and a half decades from 14 quintals per ha in 2001 to 25 quintals per ha
in 2016 with an average yield of 17 quintals. Overall, productivity of wheat is modestly higher in
Oromia region with 15 quintals in 2001 and 28 quintals in 2016. Yield growth for is not peculiar
just to wheat: other cereal crops have shown a tremendous yield growth (Taffesse, Dorosh, and
Asrat 2012). Barley, for example, grew from 11 quintals in 2001 to 20 quintals in 2016.
Increases in productivity growth might have come with an increase in land cultivated for cereal
crops provided (marginal) land joining these crops is more productive than existing land already
cultivated. Data from CSA indicates that the average area covered with cereal crops increased

from 6.7 million ha during the period 1996/97-2000/01 to 7.9 million ha during 2001/02-2009/10
period. For the period 2010/11-2015/16, this figure further increased to 9.8 million ha.
However, some research works in this area indicated that, despite the increase in area cultivated
during the above periods, productivity gains appear to come mainly from intensification of
modern inputs such as chemical fertilizers, improved seed varieties, and pesticides etc. A result
of decomposition analysis of cereal production reveals that, although, during the 1990s, most of
the increase in cereal production came from increases in area, in the 2000s, when area and yield
increases each accounted for about half of production growth, and with initial start of increasing
intensification (Taffesse et al. 2012).
Another study argues that production instability was caused more by increased yield instability
than instability in an area; and that yield instability could be the result of changes in technology,
changes in policy and changes in weather conditions (Alemu, 2005). Furthermore, modern inputs,
though their adoption rate is low, helped households with sufficient land and fewer crops to gain
efficiency benefits and increase productivity(Bachewe, Koru, and Taffesse 2015). Yield response
of cereal crops were also found to be significant to chemical fertilizers and improved seeds, with
some yield growth unrelated to modern inputs (Abegaz, 2011).
Source: Central Statistical Agency, Annual Agricultural Sample Survey (1996-2016)
Figure 1: Trends of yield in wheat and barley: National and Oromia Region-2000-2016
Table 3 presents utilization of the four major modern inputs (chemical fertilizers, improved seed
varieties, pesticides and extension services) by wheat farmers for the last 14 years using data
from agricultural sample survey of CSA. At national level, an average 0.6 million ha of land
cultivated with wheat was applied with chemical fertilizer for the period 2011-2016, representing
36 percent. Application of pesticides and use extension advisory service are relatively on the high-
-
5.00
10.00
15.00
20.00
25.00
30.00
wheat_Ethiopia Wheat_Oromia barley_Ethiopia barley_Oromia

end covering 50 percent and 38 percent respectively. Improved seeds were used for 0.1 million
ha of land, constituting only 6 percent of total land covered with wheat. The table also shows
that little change was registered by these shares over the period 2002-2016, especially for
improved seeds. Similar stories can be told of barley farmers in the use of modern inputs.
Table 3: Use of modern inputs by wheat farmers: National and Oromia: 2001-2016*
Coverage Period
Chemical Fertilizer Improved Seeds Pesticides Extension
coverage
Area
(milli
on
ha)
Shar
e
(perc
ent)
Quantit
y
(million
quintals
)
Area
(million
ha)
Shar
e
(perc
ent)
Quantity
(million
quintals)
Area
(million
ha)
Shar
e
(per
cent
)
Area
(million
ha)
Share
(perce
nt)
National 2002-2010 0.4 28.3 0.6 0.0 3.3 0.1 0.5 36.3 0.3 22.1
2011-2016 0.6 36.1 1.0 0.1 6.4 0.2 0.8 50.2 0.6 38.4
Oromia 2002-2010 0.2 25.1 0.3 0.0 3.1 0.0 0.4 52.6 0.2 19.6
2011-2016 0.2 27.0 0.4 0.0 5.0 0.1 0.6 75.1 0.3 33.6
Source: Central Statistical Agency, Annual Agricultural Sample Survey (1996-2016).
Note: share (in percent) of area applied with modern inputs is in comparison to total utilization of such
inputs for cereal crops.
Some empirical evidence on the slow adoption rate include household and community
characteristics, availability of other agricultural inputs, use of irrigation and access to credit,
ownership of livestock, and land ownership security(Hailu et al. 2014; Tesfaye et al. 2016)
Information on the presence and application of new technologies through radios and social
networks have also an important role in influencing farmers adoption behavior (Kelemu et al.,
2016; Mekonnen et al., 2016).
Data and Methods
Data
The data for this study comes from two-round surveys supervised by the Central Statistics Agency
and Ethiopian Strategy Support Program. The first round of the surveys was conducted in 2011
and the second in 2013. A total of 7,927 households sampled from 93 woredas during the
baseline and 7,503 during the midline surveys were interviewed. The sample covers Tigray,
Amhara, Oromia and SNNP. The attrition rate (around 5%) was low compared to similar large
surveys and appeared to be unrelated to the outcome variables of interest (Bachewe et al. 2013).
Because the data was collected specifically to evaluate the performance of the AGP, we have
enough information pertinent to this study. The modules in the questionnaire include basic
household characteristics and demographics, land characteristics and utilization, crop
production, input use, crop output and its utilization and marketing, agricultural extension,
technology, and information networks, and household assets.

Table 4: Distribution of the Sample across Regions and Year Baseline (2011) Midline (2013)
Region AGP Non-AGP Total AGP Non-AGP Total
Tigray 1222 390 1,612 1126 383 1,509 Amhara 1404 702 2,106 1301 671 1,972 Oromiya 1402 701 2,103 1326 675 2,001 SNNP 1404 702 2106 1341 680 2021
Total 5302 2625 7927 5094 2409 7503
Source: Bachewe et al. 2013
Sampling design
The sampling design is based on purposive woreda selection due to the objectives and nature of
the program (i.e. AGP) itself. Woredas eligible for the AGP are those where existing location
factors are conducive for agricultural growth. The criteria for the selection of AGP woredas
include access to markets; natural resource endowments; suitable rainfall and soil for crop and
fodder production; potential for development of small-scale irrigation facilities; institutional
plurality of service providers, including good basis and growth of viable cooperatives and farmer
groups; and existing partnership engagements with private sector.
The sample households for this study were taken as follows: first, 61 woredas were randomly
selected from among the 83 AGP woredas. Similarly, 32 woredas were randomly selected from
among non-PSNP and non-AGP woredas in the four regions, namely Tigray, Amhara, Oromiya,
SNNP, and Tigray, within which AGP operates. At the second stage, 3 EAs where randomly chosen
from among EAs in each woreda. Tigray is the exception to this rule because, though the same
number of households is demanded by the desired level of precision and power, there are fewer
woredas to include. Thus, 5 EAs each from ten woredas and 6 EAs each from two woredas were
selected in Tigray.
The final step is the selection of 26 households from within each EA. This is done based on a fresh
listing of households residing within each EA and selecting households randomly until the desired
number and composition of households is obtained. Each household included in the AGP baseline
sample represents a certain number of households reflecting the selection probability associated
with it, which is its sample weight (Berhane et al. 2011).
Methods
Linking farmers access to agricultural information with the use of new technology, and adoption
of new technology with productivity, we need a more structured and controlled analysis. An ideal
strategy to make this inference would be a random assignment of the treated and control groups

(Angrist and Pischke 2010). However, the AGP sample has the following important characteristics
due to the very nature of the program itself (Berhane et al. 2011).
1. woreda selection of AGP is purposive,
2. the services (interventions) of AGP is demand driven (i.e. participation in the program comes
from the farmers themselves, entailing potential for self-selection),
3. presence of multiple interventions and possible spillover effects.
Consequently, there exist problems that make the use of randomized experiments and even
regression discontinuity designs infeasible; because these methods produce estimates of the
counterfactual through an explicit program assignment rules that the researcher knows and
understands. The fact that participation in the AGP interventions such as use of modern inputs
comes from the farmers themselves has a potential of self-selection in using these inputs due to
unobservable characteristics such as motivation-to-use-inputs of farmers. This is an important
challenge in using propensity score matching, which matches farmers based on an observable
characteristic only.
Furthermore, at least for the purpose of this study, the control woredas are not strictly controlled
because the type of AGP interventions that constitute the major components of the program
(e.g. enhancing productivity through modern inputs, expanding extension package etc.) also exist
in other non-AGP woredas. Consequently, in this study we use fixed effects model to exploit the
longitudinal nature of the data. This method helps us control time-invariant confounding factors.
Methods of data analysis
Fixed effects model
Following Cameroon and Trivedi (2005), given a very general linear model for panel data with the
intercept and slope coefficients allowed to vary over both farmers and time,
yit = αit + xit′ β + εi … … … … … … … . (i)
where yit is a scalar dependent variable (quantity of inputs, or crop productivity measures such
as yield), xit′s are repressors (household socio-economic and community characteristics), αit′s
are random individual-specific effects and εit is an idiosyncratic error.
The individual-specific-effects model for the dependent variable yit specifies that
yit = αi + xit′ β + εit … … … … … … … . . (ii)
where all the variables in equation (i) also hold for equation (ii) except that, αi are random
individual-specific effects that vary only across farmers, and that capture any time-invariant
unobserved heterogeneity. The αi′s represent motivation to use modern inputs, cultural attitude
towards modern agriculture etc, that would potentially be correlated with one of the explanatory
variables. In the fixed effects model, these individual -specific effects are permitted to be
correlated with the repressors xit.
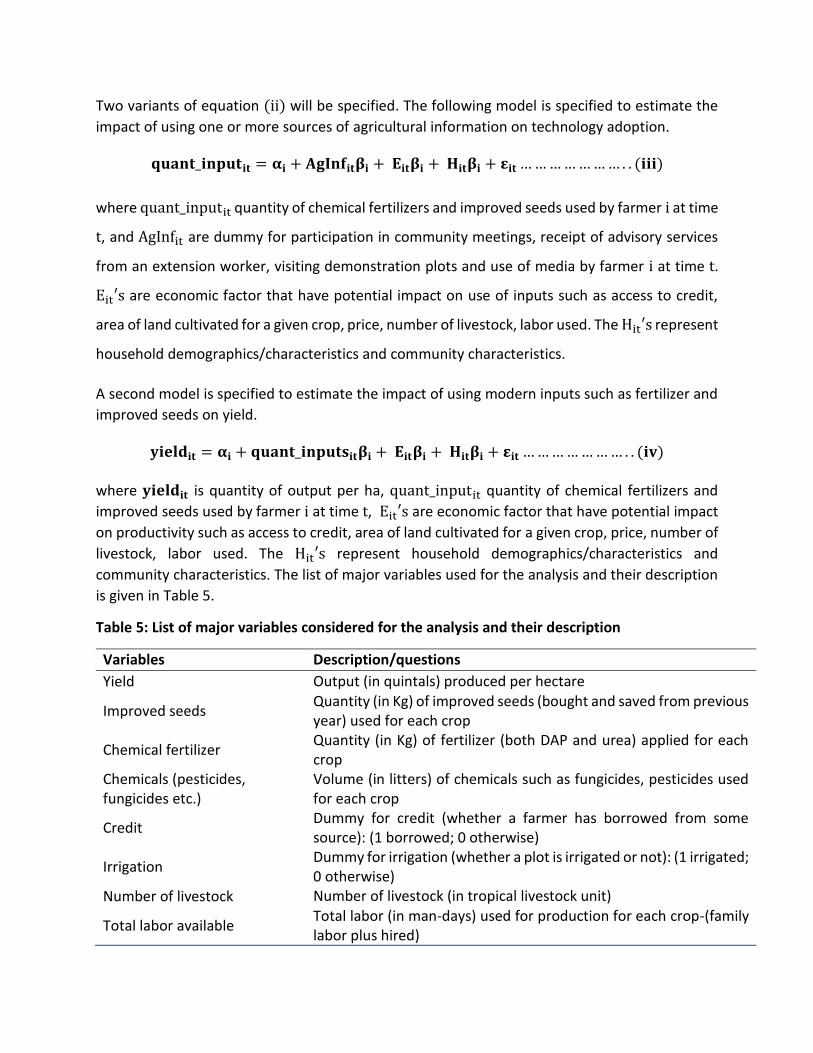
Two variants of equation (ii) will be specified. The following model is specified to estimate the
impact of using one or more sources of agricultural information on technology adoption.
𝐪𝐮𝐚𝐧𝐭_𝐢𝐧𝐩𝐮𝐭𝐢𝐭 = 𝛂𝐢 + 𝐀𝐠𝐈𝐧𝐟𝐢𝐭𝛃𝐢 + 𝐄𝐢𝐭𝛃𝐢 + 𝐇𝐢𝐭𝛃𝐢 + 𝛆𝐢𝐭 … … … … … … … . . (𝐢𝐢𝐢)
where quant_inputit quantity of chemical fertilizers and improved seeds used by farmer i at time
t, and AgInfit are dummy for participation in community meetings, receipt of advisory services
from an extension worker, visiting demonstration plots and use of media by farmer i at time t.
Eit′s are economic factor that have potential impact on use of inputs such as access to credit,
area of land cultivated for a given crop, price, number of livestock, labor used. The Hit′s represent
household demographics/characteristics and community characteristics.
A second model is specified to estimate the impact of using modern inputs such as fertilizer and
improved seeds on yield.
𝐲𝐢𝐞𝐥𝐝𝐢𝐭 = 𝛂𝐢 + 𝐪𝐮𝐚𝐧𝐭_𝐢𝐧𝐩𝐮𝐭𝐬𝐢𝐭𝛃𝐢 + 𝐄𝐢𝐭𝛃𝐢 + 𝐇𝐢𝐭𝛃𝐢 + 𝛆𝐢𝐭 … … … … … … … . . (𝐢𝐯)
where 𝐲𝐢𝐞𝐥𝐝𝐢𝐭 is quantity of output per ha, quant_inputit quantity of chemical fertilizers and
improved seeds used by farmer i at time t, Eit′s are economic factor that have potential impact
on productivity such as access to credit, area of land cultivated for a given crop, price, number of
livestock, labor used. The Hit′s represent household demographics/characteristics and
community characteristics. The list of major variables used for the analysis and their description
is given in Table 5.
Table 5: List of major variables considered for the analysis and their description
Variables Description/questions
Yield Output (in quintals) produced per hectare
Improved seeds Quantity (in Kg) of improved seeds (bought and saved from previous year) used for each crop
Chemical fertilizer Quantity (in Kg) of fertilizer (both DAP and urea) applied for each crop
Chemicals (pesticides, fungicides etc.)
Volume (in litters) of chemicals such as fungicides, pesticides used for each crop
Credit Dummy for credit (whether a farmer has borrowed from some source): (1 borrowed; 0 otherwise)
Irrigation Dummy for irrigation (whether a plot is irrigated or not): (1 irrigated; 0 otherwise)
Number of livestock Number of livestock (in tropical livestock unit)
Total labor available Total labor (in man-days) used for production for each crop-(family labor plus hired)

Total land area cultivated Total land area cultivated (in hectare)
Participation in meetings Dummy for participation in community meetings/ discussions (1 participated; 0 otherwise)
Advised by an ext. worker Dummy for extension worker advice (1 advised by an extension agent; 0 otherwise)
Use of media Dummy for use of mass media to get agricultural information (1 used mass media; 0 otherwise)
Visited demonstration Dummy for visiting demonstration plots (1 visited; 0 otherwise)
Age Age (in years) of household head
Marital status Dummy for marital status of household head (1 married; 0 otherwise)
Major occupation of head Dummy for occupation of household head (1 agriculture; 0 otherwise)
Family size Number of household members
Education Level of education of household head
Discussion of Results
Sources and types of agricultural information
The common channels through which farmers get access to agricultural information include on-
farm advice by extension advisory services, broadcasts through the media, discussions in
community meetings and through visiting demonstration plots. Apart from local and national
mass media where general topics of adoption techniques are discussed, agricultural extension
workers are the core players in all other three means of transferring agricultural information (i.e.
providing on-farm advice, encouraging farmers to visit demonstration plots, organizing
community meetings).
Figure 2 presents channels of acquiring information based on the total AGP sample and on the
sample for Oromia region separately. The graph shows the proportion of wheat and barley
farmers who use a given means of obtaining agricultural information. Extension worker visiting
farmers' plots, participation in discussions on modern inputs application, and the media are the
major sources of agricultural information available to farmers. A relatively fewer farmers used
demonstration visits as a source of information for their decisions to adopt new technologies.
On average, 50 percent of wheat farmers participated in community meetings discussing on one
or more of topics on agricultural technologies during the years 2011 and 2013. This figure was 52
percent in Oromia region.
Another important means of providing agricultural information to farmers is through on-farm
extension advisory services visiting farmers plots. Fifty two percent of wheat farmers were visited
by extension workers during the two years. Extension service in Oromia region is much lower (i.e.
37 percent) than the total sample for these farmers. Media as a source of agricultural information
is also considerably used by farmers to get market/price information and/or information on
different production methods. According to the AGP sample survey, on-farm demonstration visits

by farmers is the least utilized means of diffusion of new agricultural technologies. Although
there is minor differences across the two years, the importance of the above channels of diffusion
have a similar pattern in 2013.
Figure 2: Sources of agricultural information: total sample and Oromia region
Moreover, this pattern extends to barley farmers both in the total sample and in the sample for
Oromia region. Over the two periods, barley farmers reported that they used community
discussions (48 percent), extension workers (47 percent), and the media (30 percent) to get
different types of agricultural information such as importance and application of fertilizers, use
of improved seed, pesticides, land preparation techniques etc. Although small in terms of
percentages, there are still a significant number of barley farmers who acquired information from
visiting demonstration plots especially in 2013.
Looking further into Oromia, where the bulk of wheat and barley production comes from, we
presented the same graph as above for Arsi zone and Tiyo woreda, which is one of the woredas
in Arsi zone. As in the total sample and Oromia region, we find that extension services,
community meetings and the media are the major sources of agricultural information in Arsi zone
and Tiyo woreda with some varying degree across the two periods, and crops (Figure 3).
0.2
.4.6
2011 2013 2011 2013
wheat barley
Total sample
0.2
.4.6
2011 2013 2011 2013
wheat barley
meeting extension media visit
Oromia
Source: Agricultural Growth Program (AGP) Surveys

Figure 3: Sources of agricultural information: Arsi Zone and Tiyo Woreda
Extension advisory service is the major sources of agricultural information in other developing
countries. For example, 62 percent of small holder farmers in Nigeria use the agricultural
extension system as a source of information (Daudu S., Chado S. 2009). Using mass media, still
important in Ethiopia (e.g. Kelemu, Haregewoin, and Daniel 2016) and in other developing
countries, is a leading means of acquiring information in the context of commercial agriculture in
more developed countries (e.g. Breathnach (1970).
On-farm extension advisory services
Agricultural extension service is one of the institutional supports provided by the Ethiopian
government to smallholder farmers. Different approaches have been designed and implemented
over the history of the Ethiopian agricultural extension program since the 1930's, which differ
with each successive political regimes in the country. Since the 1980s, Ethiopia’s extension
system has followed a “training and visit system” that was introduced under the PADETES (Belay
2003; Spielman, Kelemwork, and Alemu 2011).
The objective of the current Ethiopian extension system is "to transform Ethiopia’s agriculture
through implementation of pluralistic extension system by providing demand-driven and market-
led extension services..." (MoARD 2014). This pluralistic extension system recognizes the
inherent diversity of farmers and farming systems and the need to address challenges in rural
development with different services and approaches (World Bank 2012).
0.2
.4.6
2011 2013 2011 2013
wheat barley
Arsi0
.2.4
.6.8
2011 2013 2011 2013
wheat barley
meeting extension media visit
Tiyo
Source: Agricultural Growth Program (AGP) Surveys

In this subsection, we identified a number of skills farmers acquire from on-farm visits of
extension workers. These include importance and application of fertilizers, use of improved
seeds, pesticides, land preparation techniques, timing of seed planting, and harvesting and
threshing techniques. By far the most important ones are, however, on improved seeds, chemical
fertilizers and farming methods. The proportion of farmers who were visited and advised on
these three major components of advisory services is presented in Error! Reference source not f
ound..
Figure 4: Advice by an Extension Worker by Type of Advice
In both 2011 and 2013, close to half of wheat farmers reported that they discussed with an
extension worker on the importance and application of chemical fertilizers. Advices on seed
planting and land preparation is also the leading points of discussions between these farmers and
an extension worker during these periods. We can see the same pattern, but with less importance
than the total sample, on these services for Oromia region and Arsi zone. In Tiyo woreda, we see
a soaring proportion of wheat farmers in 2013 compared to 2011, especially in chemical fertilizers
application. On the other hand, the share of barley farmers who received agricultural extension
services turned down in 2013 all in the four regions.
0.1
.2.3
.4.5
2011 2013 2011 2013
wheat barley
Total sample
0.1
.2.3
.4
2011 2013 2011 2013
wheat barley
seed planting fertilizer app land prep.
Oromia
0.1
.2.3
.4.5
2011 2013 2011 2013
wheat barley
Arsi
0.2
.4.6
.8
2011 2013 2011 2013
wheat barley
seed planting fertilizer app. land prep.
Tiyo
Source: Agricultural Growth Program (AGP) Surveys

Community meetings
Community meetings and discussions are other major sources of agricultural information. By far
the most important organizers of these discussions are the local government (for 80 percent of
farmers in 2011 and 87 percent in 2013) and agricultural cooperatives (for 17 percent in 2011
and 13 percent in 2013).
Figure 5: Meeting organizers and major agenda of discussion: Oromia region
The major agendas of the discussions were on improved seeds, application of fertilizers,
application of pesticides, protection of crops from pesticides, crop rotation, agro-forestry and
soil conservation (Figure 5).
The share of farmers who benefited from these discussions on the topics just mentioned has
increased during the two periods. The two main agendas of discussions in these community
gatherings, improved seeds and fertilizer application, were discussed respectively by 23 percent
and 13 percent of the farmers in 2011. In 2013, close to 50 and 34 percent of farmers discussed
about these agendas (Figure 5).
Demonstration visits and using mass media
Plot demonstration visits serve as one of the means of channeling agricultural information to
farmers. Although only few farmers (less than 1 percent) participated in visiting demonstration
plots in 2011, there was an improvement in 2013, when, among those who visited, 45 percent
and 20 percent of wheat and barley farmers had discussion on improved seeds and fertilizer
applications during their visits (Figure 6). The fact that there are few demonstration plots, hence
poor access to these plots, might be a major factor for the smallest share of farmers visiting these
plots.
80%
0%
17%
4%
87%
1%
13%
2011 2013
Government NGOs
Agricultural Cooperatives Others
Meeting Organizers
0.1
.2.3
.4.5
2011 2013
Major Agenda of Discussion
Improved Seeds Pesticides
Fertilizer Agroforestry
Crop Rotation Soil Conservation
Other topics

0.2
.4.6
.80
.2.4
.6.8
2011 2013 2011 2013
2011 2013 2011 2013
No Schooling Primary
Secondary Higher Education
Production Market Price
Source: Agricultural Growth Program (AGP) Surveys
Figure 6: Proportion of farmers who visited demonstration plots
Local and national mass media play an important role in providing agricultural information to
farmers. Two such information types are on methods of production and market price
information. Classifying wheat farmers by the level of education, we find that farmers whose
level of education is either primary, secondary or higher education tend to use the media more
often than those with no schooling or having other forms of education (Figure 7). This pattern
exists in the total sample and for Arsi zone.
Figure 7: Sources of agricultural information: Oromia
0.1
.2.3
.4.5
2011 2013 2011 2013
wheat barley
Improved Seeds Pesticides Fertilizer Crop Rotation Other
Source: Agricultural Growth Program (AGP) Surveys

Information and adoption of new technologies
Providing farmers with agricultural information on new technologies is only a first step in
diffusing modern inputs and making them accessible to farmers. The utilization of this
information in actually applying new technologies is a necessary undertaking, if not an ultimate
objective, in the innovation process; because, in addition to farmers' awareness on the
importance and application of new technologies, there might be a problem in accessing these
technologies.
The objective of this section is to see whether farmers who have participated in community
meetings, consulted an extension worker, visited demonstration plots or used the media also
applied more modern inputs. In Figure 8, a graph is drawn based on the fact that farmers acquire
agricultural information in at least one of the channels: community meetings, extension advice,
demonstration visit or using the media.
Figure 8: Quantity of modern inputs and source of on information: total sample
Overall, wheat farmers used more of chemical fertilizers and improved seeds in 2013 compared
to 2011. Among these farmers, those who were exposed to one of the channels of agricultural
information applied more chemical fertilizers and used more improved seeds than farmers who
were not exposed to such sources of information.
02
04
06
08
0
2011 2013 2011 2013
No Yes No Yes No Yes No Yes
wheat barley
Participated in community meetings0
20
40
60
80
2011 2013 2011 2013
No Yes No Yes No Yes No Yes
wheat barley
Receive extension advice
02
04
06
08
0
2011 2013 2011 2013
No Yes No Yes No Yes No Yes
wheat barley
All Fertilizer Improved Seeds
Visited demonstration plots
02
04
06
08
01
00
2011 2013 2011 2013
No Yes No Yes No Yes No Yes
wheat barley
Fertilizer Improved Seeds
Used media

Barely farmers also intensified their plots with both chemical fertilizers and improved seeds over
the two years. Moreover, farmers who benefited from the services of extension advisory services
or visited demonstration plots or used the media for information used both these inputs than
those who didn't. Use of inputs follows similar patterns and trends over the different source of
formation and over the two years ( Error! Reference source not found. and Error! Reference so
urce not found.).
A pair-wise correlation coefficient between modern inputs use and sources of agricultural
information were estimated (Table 6). The correlation between wheat farmers who participated
in community discussions, received on-plot advisory services, visited demonstration visits also
used improved seeds and applied chemical fertilizer for their farms. There appears to be a
correlation between barley farmers using the different source of information and input
application, with less significance though. We can also note a high complimentarily of using
modern inputs and between means acquiring information for both wheat and barley farmers.
Table 6: Pair-wise correlation coefficients between input use and sources of information
Variables Improved Seeds
Chemical Fertilizer
Other chemicals
Participation Receiving advice
Use of media
Demonstration visit
Wheat Improved Seeds 1
Chemical Fertilizer
0.192** 1
Other chemicals
0.042** 1
Participation 0.064** 0.033*
1
Receiving advice 0.071** 0.062**
0.232** 1
Use of media 0.050** 0.058**
0.248** 0.116** 1
Demo. visit
0.052**
0.229** 0.161** 0.140** 1
Barley Improved Seeds 1
Chemical Fertilizer
1
Other chemicals
0.034* 1
Participation 0.059**
1
Receiving advice 0.056** 0.036*
0.234** 1
Use of media 0.061**
0.0379* 0.240** 0.139** 1
Demo. visit
0.229** 0.143** 0.146** 1
** p<0.01, * p<0.05, empty spaces p>0.1
To see whether the above differences in the use of information significantly explain the
divergence in the utilization of chemical fertilizers and improved seeds, a fixed effects
estimations were made following the model specified in Data and Methods section. Panel data
descriptive statistics of the outcome variable and a partial list of major explanatory variables of
interest are provided in Table 7.
Fixed effects estimations were made to control for individual heterogeneity of farmers. However,
a formal test was made to choose between fixed effects and random effects estimations using

Hausman test. The results of the test was provided in Error! Reference source not found.Error! Re
ference source not found.. Observable household and community characteristics such as age,
education level, gender, marital status, major occupation of household head and family size were
taken as covariates. Other variables such as number of livestock, labor devoted to the production
of wheat and barley were also used.
Table 7: Descriptive statistics of yield and major variables
Wheat
Variable Variation Mean Std. Dev. Min Max Observations
Yield (quintal per ha) overall 14.5 15.6 0.0 400.0 N = 4159 between
13.2 0.0 256.0 n = 2710
within
8.8 -179.5 208.5 T-bar = 1.53
Improved seeds (log) overall 6.0 38.0 0.0 1510.0 N = 4106 between
24.8 0.0 755.0 n = 2683
within
26.6 -749.0 761.0 T-bar = 1.53
Chemical fertilizer (log) overall 42.4 70.4 0.0 1400.0 N = 4106 between
54.5 0.0 700.0 n = 2683
within
41.3 -657.6 742.4 T-bar = 1.53
Barley
Yield (quintal per ha) overall 15.9 45.75 0.00 2020.00 N = 3901 between
45.13 0.00 2020.00 n = 2611
within
21.97 -726.14 757.86 T-bar = 1.49 Improved seeds (log) overall 2.76 21.64 0.00 500.00 N = 3905
between
15.87 0.00 300.00 n = 2614 within
14.20 -247.24 252.76 T-bar = 1.49
Chemical fertilizer (log) overall 20.42 154.95 0.00 8000.00 N = 3905 between
166.99 0.00 8000.00 n = 2614
within
59.66 -2467.08
2507.92 T-bar = 1.49
Estimates of the coefficients Table 8 point out that application of chemical fertilizers responds to
participation in community meetings by both wheat and barley farmers, given other factors that
can potentially affect use of this input. Participation in community meetings resulted in a
difference of 63 percent more chemical fertilizers and 67 percent more improved seeds for wheat
farmers.
In the same vein, these meetings made a difference in the use of inputs for barley farmers. That
is, 86 percent more chemical fertilizers and 44 percent more improved seeds were used by barley
farmers who participated in community discussions. Most of the farmers participate in meetings
mainly organized through the local government, and more adoption might be expected given
that access to credit is facilitated and provided by the government and by institutions close to
the local government. Membership to farmers cooperatives might have helped farmers use more
chemical fertilizers (Abebaw and Haile 2013).

Table 8: Fixed effects estimates of coefficients of factors of technology adoption
Explanatory variables Chemical Fertilizer
(log) Improved Seeds
(log)
Wheat Barley Wheat Barley Participation in meetings (1 participated) 0.63** 0.86* 0.67** 0.44*
(0.32) (0.48) (0.30) (0.23) Advised by an ext. worker (1 advised) 0.68*** 0.72* -0.21 -0.17
(0.26) (0.43) (0.29) (0.20) Visited demonstration (1 visited) 0.62 0.27 0.07 -0.19
(0.63) (0.65) (0.35) (0.24) Use of media (1 used) -0.01 0.49 0.78** -0.05
(0.33) (0.44) (0.32) (0.12) Credit (1 borrowed) 0.11 0.57 -0.20 0.02
(0.34) (0.50) (0.30) (0.20) Area of land cultivated (ha) -0.37 0.35 -0.20 0.83**
(0.32) (0.57) (0.44) (0.36) Value of production of crop 0.00*** 0.00 0.00 0.00
(0.00) (0.00) (0.00) (0.00) Number of livestock (in TLU) 0.02 0.04 -0.04 0.02
(0.05) (0.03) (0.04) (0.01) Total labor utilized 0.01 0.01 -0.00 -0.00
(0.01) (0.01) (0.00) (0.00) Age of household head 0.06* 0.02 0.01 0.03*
(0.03) (0.04) (0.02) (0.02) Marital status (1 married) 0.21 -0.21 -1.60** 0.04
(1.54) (1.93) (0.75) (0.93) Major occupation (1 agriculture) 0.68 0.18 -0.45 0.16
(0.58) (1.15) (0.73) (0.30) Family size (number of household members) 0.15 0.24 0.07 0.17 (0.15) (0.16) (0.10) (0.12) Education (comparison: no education)
Primary 0.15 2.14*** 0.90 -0.37 (0.67) (0.56) (0.67) (0.26)
Secondary -0.55 2.65*** -0.00 1.11** (1.00) (0.99) (0.98) (0.45)
Higher education -0.22 0.73* 0.42 0.60** (0.37) (0.42) (0.52) (0.28)
Constant -3.85** -3.91** -0.76 -2.53** (1.72) (1.85) (0.82) (1.13)
Observations 2,265 2,173 2,248 2,160 R-squared 0.43 0.33 0.21 0.34 Household FE YES YES YES YES Region FE YES YES YES YES
Robust standard errors in parentheses *** p<0.01, ** p<0.05, * p<0.1

Use of on-farm visits by agricultural extension services were found to have an effect on the use
of chemical fertilizers for wheat and barley farmers. Farmers' learning through an extension
worker led to use of 68 percent and 72 percent more chemical fertilizers. The data doesn't
support any relationship between the application of improved seeds and advisory services of
extension workers.
The level of education of household heads influences whether farmers used more inputs for
barley. Farmers whose level of education is either primary, secondary or higher education, would
use more modern inputs compared with farmers who cannot read and write.
Technology adoption and productivity
Yield, measured in output in quintal per hectare, is presented in Table 9 for the total sample and
sample for Oromia region (total and by administrative zones). Overall, wheat and barley
producers had a productivity gain of 29.6 percent during the two intervening periods (i.e.
between 2011 and 2013). Overall, wheat yield increased from 14.2 quintal per ha in 2011 to 18
quintal per ha in 2013. Yield for barely was also spurred from 14 quintals to 18 quintals during
the same period resulting in a 26 percent of growth.
Table 9: Estimates of Yield
Wheat Barley
Zone, Woreda 2011 2013 growth rate 2011 2013 growth rate
Overall 14.2 18.3 29.6 14.2 18.0 26.4
Oromia 15.9 20.9 31.8 17.3 22.2 28.3
Zon
es in
Oro
mia
West-Shewa 9.6 9.2 -4.2 16.3 19.2 17.8
North-Shewa 18.6 21.7 17.1 11.3 5.9 -48.1
East-Shewa 17.0 15.1 -11.6 15.5 10.4 -32.5
Arsi 25.4 35.3 38.9 26.4 30.7 16.4
Tiyo woreda 26.2 25.5 -2.8 30.1 29.7 -1.6
Bale 13.3 24.2 82.1 10.1 23.5 132.6
Horo-Gudru-Wellega 12.1 11.8 -2.5 12.9 11.8 -8.2
Other zones (avg.) 9.5 11.9 26.2 8.4 11.9 41.5
Source: Agricultural Growth Program (AGP) Surveys
We also note that yield growth in Oromia zone is higher than overall growth for both crops. The
mean wheat yield for the region was 16 quintals per ha in 2011 and 21 quintals per ha in 2013,
leading a growth rate of 32 percent over this period; while the productivity of barley was 17
quintals and 22 quintals for 2011 and 2013 respectively. The highest yield was registered in Arsi
where 25 and 35 quintals per ha were produced in 2011 and 2013 respectively. Wheat production
in Bale zone exhibited the highest growth (82 percent) from a low base of 13 quintals in 2011 to
24 quintals in 2013.

Figure 9 shows differences in the levels of yield between farmers who applied chemical fertilizers
and/or used improved seeds and those who didn't. Wheat productivity for fertilizer adopters is
higher both in the overall sample and Oromia region. We also note that, except for farmers who
didn't apply fertilizer where yield declined, there was yield growth during the period 2011-2013.
The result on use of improved seeds and yield is rather mixed, however. While both adopters and
non-adaptors of improved varieties gained higher yield in 2013 compared to 2011, yield for non-
adopters is a little higher than adopters.
Figure 9: Wheat yield and application of modern inputs: total sample
Evidently, grouping farmers based on use of improved seeds is blemishes the exact relationships
between those groups, mainly due to other variables that have potentially an impact on yield.
Quantifying the difference and giving them a little statistical context, Table 10 presents a group
mean t-test. Chemical fertilizer application matters for both wheat and barley farmers. However,
we cannot see any correlation between use of improved seeds and productivity gains for both
crops.
13.312.4
14.3
16.115.1
19.6
14.0
19.2
05
1015
20
wheat barley wheat barley
2011 2013 2011 2013 2011 2013 2011 2013
with no fertlizer with fertlizer
Yie
ld
Total sample
14.2
18.6
14.3
17.9
13.2
17.0
11.9
19.3
05
1015
20wheat barley wheat barley
2011 2013 2011 2013 2011 2013 2011 2013
with no improved seeds with improved seeds
Yie
ld
Total sample
16.2
9.5
17.6
11.5
15.4
22.5
15.4
27.0
010
2030
wheat barley wheat barley
2011 2013 2011 2013 2011 2013 2011 2013
with no fertlizer with fertlizer
Yie
ld
Oromia
15.9
21.2
17.3
22.0
14.8
17.9
27.625.3
010
2030
wheat barley wheat barley
2011 2013 2011 2013 2011 2013 2011 2013
with no improved seeds with improved seeds
Yie
ld
Oromia
Source: Agricultural Growth Program (AGP) Surveys

Table 10: Group mean t test based on total sample
Crop Modern input Not used Used Difference p value
(Diff<0)
Wheat Chemical
fertilizer
13.1 15.2 -2.1 0.00
Improved seeds 14.5 14.2 0.3 0.70
Barley Chemical
fertilizer
14.8 17.5 -2.7 0.05
Improved seeds 15.8 17.6 -1.8 0.23
In a more structured setting, estimations from fixed effects specification reveals that wheat yield
responds to the use of chemical fertilizers, improved seeds and use of other chemicals (such as
pesticides, fungicides etc.) based on the total sample. As argued by Bachewe, Koru, and Taffesse
(2015), Alemu (2005) and Abegaz (2011) these inputs, though their adoption rate is low, helped
households gain efficiency benefits and increase productivity. However, using the Oromia
sample, while farmers who applied chemical fertilizers had higher yield than those who didn't
use these inputs, we could not find any evidence on the impact of improved seed variety on yield.
Yield for barley farmers also increased with more application of fertilizers. The magnitude of
coefficients is low, however. As argued by Endale (2011) specifically, for chemical fertilizers, this
might be because of problems arising from applying below recommended rates and failure to
use the two nutrients (i.e. DAP and urea) in proper combination.
Table 11: Estimates of coefficients of fixed effects on yield wheat Barley
VARIABLES total sample Oromia total sample Oromia Improved seeds (log) 0.001** 0.003 0.000 0.002
(0.00) (0.00) (0.00) (0.00) Chemical fertilizer (log) 0.002*** 0.004*** 0.000 0.004***
(0.00) (0.00) (0.00) (0.00) Chemicals (pesticides, fungicides etc.) 0.001*** -0.000 0.010* 0.000
(0.00) (0.00) (0.00) (0.00) Credit (borrowed=1; 0 other wise) 0.012 0.010 0.084 0.461***
(0.07) (0.08) (0.08) (0.13) Irrigation (1 irrigated; 0 otherwise) 0.020 0.353** -0.081 0.060
(0.12) (0.16) (0.16) (0.27) Number of livestock (in TLU) 0.010** 0.000 0.001** 0.000
(0.01) (0.01) (0.01) (0.01) Total labor available 0.000 0.001 0.001 0.000
(0.00) (0.00) (0.00) (0.00)
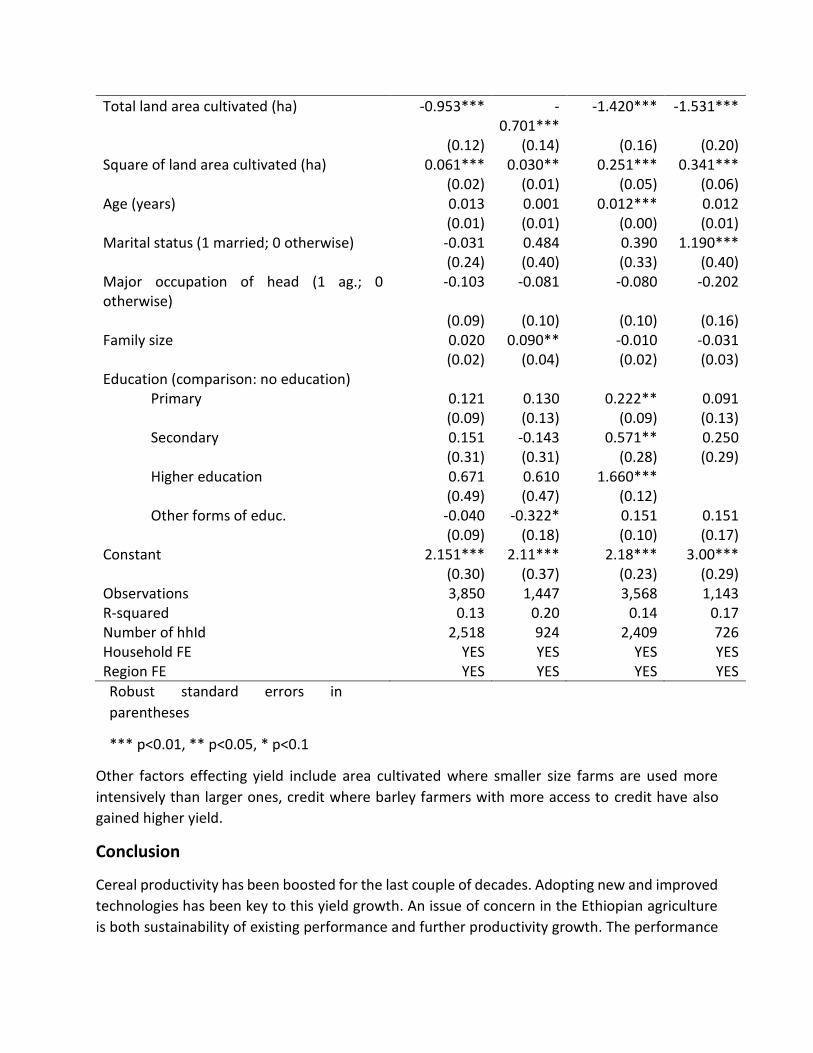
Total land area cultivated (ha) -0.953*** -0.701***
-1.420*** -1.531***
(0.12) (0.14) (0.16) (0.20)
Square of land area cultivated (ha) 0.061*** 0.030** 0.251*** 0.341*** (0.02) (0.01) (0.05) (0.06)
Age (years) 0.013 0.001 0.012*** 0.012 (0.01) (0.01) (0.00) (0.01)
Marital status (1 married; 0 otherwise) -0.031 0.484 0.390 1.190*** (0.24) (0.40) (0.33) (0.40)
Major occupation of head (1 ag.; 0 otherwise)
-0.103 -0.081 -0.080 -0.202
(0.09) (0.10) (0.10) (0.16)
Family size 0.020 0.090** -0.010 -0.031 (0.02) (0.04) (0.02) (0.03)
Education (comparison: no education)
Primary 0.121 0.130 0.222** 0.091 (0.09) (0.13) (0.09) (0.13)
Secondary 0.151 -0.143 0.571** 0.250 (0.31) (0.31) (0.28) (0.29)
Higher education 0.671 0.610 1.660***
(0.49) (0.47) (0.12)
Other forms of educ. -0.040 -0.322* 0.151 0.151 (0.09) (0.18) (0.10) (0.17)
Constant 2.151*** 2.11*** 2.18*** 3.00*** (0.30) (0.37) (0.23) (0.29)
Observations 3,850 1,447 3,568 1,143 R-squared 0.13 0.20 0.14 0.17 Number of hhId 2,518 924 2,409 726 Household FE YES YES YES YES Region FE YES YES YES YES
Robust standard errors in
parentheses
*** p<0.01, ** p<0.05, * p<0.1
Other factors effecting yield include area cultivated where smaller size farms are used more
intensively than larger ones, credit where barley farmers with more access to credit have also
gained higher yield.
Conclusion
Cereal productivity has been boosted for the last couple of decades. Adopting new and improved
technologies has been key to this yield growth. An issue of concern in the Ethiopian agriculture
is both sustainability of existing performance and further productivity growth. The performance

of agricultural extension system in the country has improved over the years. However, the
diffusion mechanisms of new and improved technologies need further scrutiny.
In agricultural innovation systems, R&D is only a first stage in actually using a new technology.
New and improved technologies need to reach the farmer; and information in the proper
application of these agricultural inputs is key to attain the expected outcomes from these inputs.
How farmers are informed of the availability of new technologies and their proper application is
therefore central to this process. This study focused on this last component of the innovation
system. The Ethiopian government uses different means of diffusing new technologies: through
on-farm extension advisory services, discussions with farmers during community gatherings,
creating awareness through mass media and through encouraging farmers to visit on-farm
demonstration plots.
This study indicates that the majority of farmers used on-farm advisory services of the extension
worker, community meetings and mass media as a major source of agricultural information which
includes, among other things, how chemical fertilizers, improved seeds and other chemicals are
applied, and how land is prepared. However, only few farmers used demonstration plots to
acquire such information.
Furthermore, application of chemical fertilizers responds to participation in community meetings
by both wheat and barley farmers, given other factors that can potentially affect use of this input.
It resulted in a difference of 63 percent more chemical fertilizers and 67 percent more improved
seeds for wheat farmers. For barley farmers who participated, 86 percent more chemical
fertilizers and 44 percent more improved seeds were used. Yield responds to the use of chemical
fertilizers, improved seeds and use of other chemicals (such as pesticides, fungicides etc.) for
wheat farmers. Yield for barley farmers also increased with more application fertilizers. We could
not find any evidence on the impact of improved seed variety on barley yield.
These findings suggest that making modern inputs available to farmers is only a necessary
condition for effective utilization of new and or improved technologies. Farmers should be
informed of the availability of such inputs and be convinced to use them. Community meetings
and on-farm advisory services have the capacity to influence farmers to use new and improved
technologies such as chemical fertilizers and improved seeds and need to be expanded.
Furthermore, demonstration plots should be expanded to allow farmers access to a first-hand
and experimental showcase of modern agriculture.

References
Abebaw, Degnet and Mekbib G. Haile. (2013). “The Impact of Cooperatives on Agricultural
Technology Adoption: Empirical Evidence from Ethiopia.” Food Policy 38(1):82–91. Retrieved
(http://dx.doi.org/10.1016/j.foodpol.2012.10.003).
Abegaz, Getachew. (2011). “Cereal Productivity in Ethiopia: Ana Analysis Based on ERHS DAta.”
Ethiopian Journal of Economics XX(2).
Alemu, Z. G. (2005). Causes of Instability In Cereal Production in Ethiopia.
Ali, Jabir. (2011). “Adoption of Mass Media Information for Decision-Making Among Vegetable
Growers in Uttar Pradesh.” Indian Journal of Agricultural Economics 66(2).
Angrist, Joshua D. and Jorn-Steffen Pischke. (2010). Mostly Harmless Econometrics : An Empiricist
’ S Companion.
Asrat, Sinafikeh, Gerawork Getachew, and Alemayehu Seyoum Taffesse. (2012). Trends and
Determinants of Cereal Productivity.
Bachewe, Fantu et al. (2013). Agricultural Growth Program ( AGP ) of Ethiopia -Midline Evaluation
Report (2013) Ethiopia Strategic Support Program ( ESSP ) EDRI/IFPRI.
Bachewe, Fantu Nisrane;, Bethlehem; Koru, and Alemayehu Seyoum Taffesse. (2015). Cereal
Productivity and Its Drivers: The Case of Ethiopia. Retrieved
(http://ebrary.ifpri.org/cdm/ref/collection/p15738coll2/id/129230).
Belay, Kassa. (2003). “Agricultural. Extension in Ethiopia: The Case of Participatory
Demonstration And’training Extension System.” Journal of Social Development in Africa 18(1):49–
84.
Berhane, Guush et al. (2011). “Agricultural Growth Program ( AGP) of Ethiopia — Baseline Report
2011 Agricultural Growth Program ( AGP ) of Ethiopia — Baseline Report 2011.” (March).
Breathnach, J. .. M. ..Bohlen T. .. (1970). “Irish Farmers Uses of Information Sources.” Irish Journal
of Agricultural Economics and Rural Sociology 3(1):1–28.
Cameroon, A.Colin and Pravin K. Trivedi. (2005). Microeconometrics: Methods and Applications.
CSA. (2011). CSA, [Ethiopia] Agricultural Sample Survey 2010/2011 (2003 E.C.) (September -
December 2010) Volume I, Report on Area and Production of Major Crops (Private Peasant
Holdings, Meher Season). Retrieved (www.csa.gov.et).
CSA. (2012). CSA, [Ethiopia] Agricultural Sample Survey 2011/2012 (2004 E.C.) (September -
December 2011) Volume I, Report on Area and Production of Major Crops (Private Peasant
Holdings, Meher Season). Retrieved (www.csa.gov.et).

CSA. (2016). The Federal Democratic Republic of Ethiopia Central Statistical Agency Report on
Area and Production of Major.
Daudu S., Chado S., and Igbashal A. A. (2009). “Agricultural Information Sources Utilized By
Farmers In Benue State, Nigeria.” 5(1):39–48.
Endale, Kefyalew. (2011). Fertilizer Consumption and Agricultural Productivity in Ethiopia.
Hailu, Berihun Kassa, Bihon Kassa Abrha, and Kibrom Aregawi Woldegiorgis. (2014). “Adopiton
and Impact of Agricultural Technologies on Farm Income: Evidence From Southern Tigray,
Northern Etiopia.” 2(4):91–106.
Kelemu, Kaleb, Tesfaye Haregewoin, and Fitsum Daniel. (2016). “Impact of Radio on Technical
Efficiency of Farmers : The Case of Wheat Producing Farmers in Ethiopia.” 7(1).
Mekonnen, Daniel Ayalew, Nicolas Gerber, Julia Anna Matz, and C. John. (2016). “Social Networks
, Agricultural Innovations , and Farm Productivity in Ethiopia.” (235).
MoARD. (2014). National Strategy for Ethiopia ’ S Agricultural Extension System.
National Planning Commission, NPC. (2016). Growth and Transformation Plan II (GTP II). Federal
Democratic Republic of Ethiopia Volume I : Main Text.
Spielman, David J., Dawit Kelemwork, and Dawit Alemu. (2011). Seed , Fertilizer , and Agricultural
Extension in Ethiopia.
Taffesse, Alemayehu Seyoum, Paul Dorosh, and Sinafikeh Asrat. (2012). “Crop Production in
Ethiopia: Regional Patterns and Trends.” Food and Agriculture in Ethiopia: progress and
challenges 53–82.
Tesfaye, S., B. Bedada, and Y. Mesay. (2016). “Impat of Improved Wheat Technology Adoption
on Productivity.” 24:127–35.
World Bank. (2012). Agricultural Innovation Systems: An Investment Sourcebook. The World
Bank. Washington D.C.