volume 3, 2013 - rst-tto · donyo ganchev, marin marinov, stefan krustev, milena zlateva, nadezhda...
TRANSCRIPT

�JOURNAL SCIENTIFIC AND APPLIED RESEARCH Vol. 3, 20�3JOURNAL SCIENTIFIC AND APPLIED RESEARCH Vol. 3, 20�3
VOLUME 3, 2013
JOURNAL
SCIENTIFIC AND APPLIED RESEARCH
Association Scientific and Applied Research
International Journal The journal publishes scientific information and articles which present new
and unpublished results from research in the spheres of the mathematical, physical, chemical, natural, humanitarian, social, medical, Earth, forest and agricultural sciences.
Every article is to be read by two independent anonymous reviewers. After their acceptance and after the author presents a bank statement for the paid publishing fee, the article is published in the refereed JOURNAL SCIENTIFIC AND APPLIED RESEARCH, which is licensed in EBSCO, USA.
The papers in this Volume of the Journal Scientific and Applied Research are supported by the Project BG0��Po00l-3.3.0�-0003 “Building and steady developing of PhD students, post-PhD and young scientists in the areas of the natural, technical and mathematical sciences” (2012-20��)
2 JOURNAL SCIENTIFIC AND APPLIED RESEARCH Vol. 3, 20�3JOURNAL SCIENTIFIC AND APPLIED RESEARCH Vol. 3, 20�3
Editor – in - Chief:
Prof. DSc. Petar Getsov – Director of Space Research and Technologies Institute – BAS Chairman of Bulgarian Astronautic Federation
Vice – Editor- in- Chief: Scientific Secretary: Prof. DSc Garo Mardirosian – Scientific Secretary of Space Research and Technologies Institute – BAS
International Editorial Board: Acad. Prof DSc Lev Zelyonii – Russia Acad. Prof. DSc Mykhailo Khvesyk – Ukraine Acad. Prof. DSc Zhivko Zhekov – Bulgaria Acad. Prof. DSc Genadiy Maklakov – Ukraine Assoc. Member Prof. DSc Filip Filipov – Bulgaria Assoc. Member Prof. DSc Petar Velinov – Bulgaria Prof DSc Vyacheslav Rodin – Russia Prof. DSc Viktor Mukhin – Russia Prof. Dr. Habil. Margarita Georgieva – Bulgaria Prof. Dr. Habil. Georgi Kolev – Bulgaria Prof. DSc Tsvetan Dachev – Bulgaria Prof. DSc. Antonio Antonov – Bulgaria Prof. DSc Rumen Kodjeykov – Bulgaria Prof. Dr. Alen Sarkisyan – France Prof. Dr. Maria Franekova – Slovakia Prof. Dr. Larisa Yovanovich – Serbia Prof. Dr. Naziya Suleymanova – Kazakhstan Prof. Dr. Georgi Kamarashev – Bulgaria Assoc. Prof. Dr. Rumen Nedkov – Bulgaria Assoc. Prof. Dr. Hristo Krachunov – Bulgaria Assoc. Prof. Dr. Margarita Filipova – Bulgaria Assoc. Prof. Dr. Mihail Zhelyazov – Bulgaria Ch. Assist. Prof. Dr. Stiliyan Stoyanov – Bulgaria Ch. Assist. Prof. Dr. Anton Antonov – Bulgaria Dr. Stoyan Sargoychev – Canada Dr. Stoyan Velkoski – Macedonia Dr. Zoya Hubenova – Bulgaria Dr. Mihail Vladov – Moldova Assist. Prof. Angel Manev – Bulgaria Editor – Aneliya Karagyozyan– Bulgaria Dek: TOPEX/POSEIDON altimeter data reveal our Ocean Planet, mission for NASA.
JOURNAL SCIENTIFIC AND APPLIED RESEARCH Vol. 3, 20�3
CONTENTS
Space Research
SATELLITE SPECTROPHOTOMETER FOR RESEARCH OF THE TOTAL OZONE CONTENT................................................................................................................................................5 Stiliyan Stoyanov, Garo Mardirossian
Ecology
TWO METHODS FOR 3- AMINOCYCLOPENTANESPIRO – 5 – HYDANTOIN THIONATION.......................................................................................................................................10 Marin Marinov
INHIBITION EFFECTS OF CYCLOHEXANESPIRO-5-HYDANTOIN AND 1-AMINOCYCLOHEXANECARBOXYLIC ACID TOWARDS SOUR CHERRY POLLEN..................................................................................................................................................15 Donyo Ganchev, Marin Marinov, Angel Nikolov, Stefan Krustev, Milena Zlateva, Nadezhda Atanasova and Neyko Stoyanov
PHYTOTOXICOLOGICAL STUDY OF SOME SPIROHYDANTOINS AND THEIR DERIVATIVES TOWARDS PSEUDOCROSSIDIUM REVOLUTUM ..................................20 Donyo Ganchev, Marin Marinov, Stefan Krustev, Milena Zlateva, Nadezhda Atanasova and Neyko Stoyanov
ANALYTICAL APPARATUS AND PROCEDURE TO JUSTIFY THE ACTIONS IN THE MANAGEMENT OF ENVIRONMENTAL SECURITY ............................................................26 Lubomir Vladimirov
MEASURING THE RISK OF ECOLOGICALLY DANGEROUS ECONOMIC ACTIVITIES ..........................................................................................................................................35 Lyubomir Vladimirov, Mariana Todorova
ENVIRONMENT MANAGEMENT IN STUDENTS HIGHER EDUCATION .....................42 Lyubomir V. Vladimirov, Nikolai Y. Kovachev, Plamen M. Manev, Vladimir T. Vladimirov
Technical Sciences APPLICATION OF SUMMARIZED FUNCTIONS FOR INFORMATION SOURCE PROTECTION ......................................................................................................................................51 Valerij Dzhurov
SPECTROPHOTOMETER FOR RESEARCH OF THE ATMOSPHERIC OZONE - POSITIONING OF THE EXECUTIVE OPERATING PARTS.................................................56 Chlhs`q Bgdqudmjnu+ Ok`ldm Bgdqmnjnygdu
3JOURNAL SCIENTIFIC AND APPLIED RESEARCH Vol. 3, 20�3JOURNAL SCIENTIFIC AND APPLIED RESEARCH Vol. 3, 20�3
Editor – in - Chief:
Prof. DSc. Petar Getsov – Director of Space Research and Technologies Institute – BAS Chairman of Bulgarian Astronautic Federation
Vice – Editor- in- Chief: Scientific Secretary: Prof. DSc Garo Mardirosian – Scientific Secretary of Space Research and Technologies Institute – BAS
International Editorial Board: Acad. Prof DSc Lev Zelyonii – Russia Acad. Prof. DSc Mykhailo Khvesyk – Ukraine Acad. Prof. DSc Zhivko Zhekov – Bulgaria Acad. Prof. DSc Genadiy Maklakov – Ukraine Assoc. Member Prof. DSc Filip Filipov – Bulgaria Assoc. Member Prof. DSc Petar Velinov – Bulgaria Prof DSc Vyacheslav Rodin – Russia Prof. DSc Viktor Mukhin – Russia Prof. Dr. Habil. Margarita Georgieva – Bulgaria Prof. Dr. Habil. Georgi Kolev – Bulgaria Prof. DSc Tsvetan Dachev – Bulgaria Prof. DSc. Antonio Antonov – Bulgaria Prof. DSc Rumen Kodjeykov – Bulgaria Prof. Dr. Alen Sarkisyan – France Prof. Dr. Maria Franekova – Slovakia Prof. Dr. Larisa Yovanovich – Serbia Prof. Dr. Naziya Suleymanova – Kazakhstan Prof. Dr. Georgi Kamarashev – Bulgaria Assoc. Prof. Dr. Rumen Nedkov – Bulgaria Assoc. Prof. Dr. Hristo Krachunov – Bulgaria Assoc. Prof. Dr. Margarita Filipova – Bulgaria Assoc. Prof. Dr. Mihail Zhelyazov – Bulgaria Ch. Assist. Prof. Dr. Stiliyan Stoyanov – Bulgaria Ch. Assist. Prof. Dr. Anton Antonov – Bulgaria Dr. Stoyan Sargoychev – Canada Dr. Stoyan Velkoski – Macedonia Dr. Zoya Hubenova – Bulgaria Dr. Mihail Vladov – Moldova Assist. Prof. Angel Manev – Bulgaria Editor – Aneliya Karagyozyan– Bulgaria Dek: TOPEX/POSEIDON altimeter data reveal our Ocean Planet, mission for NASA.
JOURNAL SCIENTIFIC AND APPLIED RESEARCH Vol. 3, 20�3
CONTENTS
Space Research
SATELLITE SPECTROPHOTOMETER FOR RESEARCH OF THE TOTAL OZONE CONTENT................................................................................................................................................5 Stiliyan Stoyanov, Garo Mardirossian
Ecology
TWO METHODS FOR 3- AMINOCYCLOPENTANESPIRO – 5 – HYDANTOIN THIONATION.......................................................................................................................................10 Marin Marinov
INHIBITION EFFECTS OF CYCLOHEXANESPIRO-5-HYDANTOIN AND 1-AMINOCYCLOHEXANECARBOXYLIC ACID TOWARDS SOUR CHERRY POLLEN..................................................................................................................................................15 Donyo Ganchev, Marin Marinov, Angel Nikolov, Stefan Krustev, Milena Zlateva, Nadezhda Atanasova and Neyko Stoyanov
PHYTOTOXICOLOGICAL STUDY OF SOME SPIROHYDANTOINS AND THEIR DERIVATIVES TOWARDS PSEUDOCROSSIDIUM REVOLUTUM ..................................20 Donyo Ganchev, Marin Marinov, Stefan Krustev, Milena Zlateva, Nadezhda Atanasova and Neyko Stoyanov
ANALYTICAL APPARATUS AND PROCEDURE TO JUSTIFY THE ACTIONS IN THE MANAGEMENT OF ENVIRONMENTAL SECURITY ............................................................26 Lubomir Vladimirov
MEASURING THE RISK OF ECOLOGICALLY DANGEROUS ECONOMIC ACTIVITIES ..........................................................................................................................................35 Lyubomir Vladimirov, Mariana Todorova
ENVIRONMENT MANAGEMENT IN STUDENTS HIGHER EDUCATION .....................42 Lyubomir V. Vladimirov, Nikolai Y. Kovachev, Plamen M. Manev, Vladimir T. Vladimirov
Technical Sciences APPLICATION OF SUMMARIZED FUNCTIONS FOR INFORMATION SOURCE PROTECTION ......................................................................................................................................51 Valerij Dzhurov
SPECTROPHOTOMETER FOR RESEARCH OF THE ATMOSPHERIC OZONE - POSITIONING OF THE EXECUTIVE OPERATING PARTS.................................................56 Chlhs`q Bgdqudmjnu+ Ok`ldm Bgdqmnjnygdu
� JOURNAL SCIENTIFIC AND APPLIED RESEARCH Vol. 3, 20�3JOURNAL SCIENTIFIC AND APPLIED RESEARCH Vol. 3, 20�3
Educational Technology
PROJECT WORK AS AN EDUCATIONAL TECHNOLOGY AND ELEMENT OF ACMEOLOGY IN THE LEARNING STUDENTS.......................................................................60 Neli Dimitrova
Optical
METHODS FOR DETERMINING THE AMOUNT OF MULTI-ELECTRONIC SCINTILLATIONS ON THE SCREEN OF ELECTRO – OPTIC TRANSFORMER OF IMAGES..................................................................................................................................................68 Zhivko Zhekov
STUDY AND ANALYSIS OF AN IMAGE BY AN OPTICAL-ELECTRONIC SYSTEM ..74 Stiliyan Stoyanov
Physics
THE COMPLEXES OF CO2+ IN BI12SIO20 AND CO3+ IN BI12TIO20 ............................ 78 Petya Petkova, Petko Vasilev, Genoveva Nedelcheva
TETRAHEDRAL AND OCTAHEDRAL COMPLEXES OF MN2+ IN THE AQUEOUS SOLUTIONS OF MNCL2.4H2O ........................................................84 Petya Petkova, Vesselin Nedkov, Jordanka Tacheva, Petko Vasilev, Dian Hristov, Genoveva Nedelcheva, Ivaylo Dimitrov, Atanas Ivanov and Ibrahim Ahmed
National Security
SURVEY AND ANALYSIS OF INTERCULTURAL COMMUNICATION IN BULGARIA AND ABROAD.................................................................................89 Gergana Andreeva, Andrey Andreev
RESEARCH OF MATHEMATICAL MODEL FOR OPERATIONS TO DETERMINE RISKS FOR PROTECTIONS OF CRITICAL INFRASTRUCTURE ............................................................................................98 Lyubomir Pashov
RESEARCH OF THE CRITERIA FOR EFFICIENCY AND OPTIMALITY OF THE CRITICAL INFRASTRUCTURE PROTECTION MANAGEMENT........101 Lyubomir Pashov
RESEARCH OF THE OPPORTUNITIES FOR IMPLEMENETATION OF POLICES WHEN PLANNING THE POROTECTION OF CRITICAL INFRASTRUCTURE ..........................................................................................108 Lyubomir Pashov
A TAXONOMY OF THE CYBER ATTACKS ...................................................114 Petar Boyanov
JOURNAL SCIENTIFIC AND APPLIED RESEARCH Vol. 3, 20�3
Original Contribution
Journal scientific and applied research, vol. 3, 20�3 Association Scientific and Applied Research
International Journal ISSN �3��-�2��
SATELLITE SPECTROPHOTOMETER FOR RESEARCH OF THE TOTAL OZONE CONTENT
Stiliyan Zh. Stoyanov, Garo H. Mardirossian
SPACE RESEARCH AND TECHNOLOGIES INSTITUTE – BULGARIAN ACADEMY
OF SCIENCES SOFIA 1113, ACAD. GEORGI BONCHEV ST., BL. 1
Abstract: The measurement of the atmospheric ozone and its influence upon the climate and life on Earth
is undoubtedly one of the most current issues of the present time. The paper presents the functional scheme of a satellite optoelectronic spectrophotometer for measuring
the total content of the atmospheric ozone and other gas components of the atmosphere, which has increased precision, smaller weight and energy consumption, increased space and time resolution, quickness of reaction and increased volume of useful information.
The object of the paper is the design of an appliance which ensures research of the ozone content in the atmosphere from the board of a satellite.
Key words:
The research of the gas content of the Earth atmosphere by means of different methods has been performed during the last few decades. The interest in this problem has greatly increased because of the following facts:
- The anthropogenic influence on the gases and aerosols in the atmosphere has significantly increased;
- The different physical mechanisms which influence the change in the gas and aerosol content of the atmosphere and thus having an impact over the different characteristics of the environment and more specifically over the weather and climate on Earth, are becoming clearer.
In earlier times, special attention was paid to the concentration growth of carbon oxide, but now the contemporary trends show that the increase of other small gas content such as O3, CH�, CO, N2O, freons, etc. may in the near future induce a considerable total influence on the Earth climate, rather than the concentration growth of carbon oxide.
The most dramatic example for regional change of the gas content of the atmosphere is the Antarctic ozone hole – a phenomenon which has been widely discussed and researched by specialists from different countries and which is connected with direct or indirect influence of the anthropogenic factors. According to
�JOURNAL SCIENTIFIC AND APPLIED RESEARCH Vol. 3, 20�3JOURNAL SCIENTIFIC AND APPLIED RESEARCH Vol. 3, 20�3
Educational Technology
PROJECT WORK AS AN EDUCATIONAL TECHNOLOGY AND ELEMENT OF ACMEOLOGY IN THE LEARNING STUDENTS.......................................................................60 Neli Dimitrova
Optical
METHODS FOR DETERMINING THE AMOUNT OF MULTI-ELECTRONIC SCINTILLATIONS ON THE SCREEN OF ELECTRO – OPTIC TRANSFORMER OF IMAGES..................................................................................................................................................68 Zhivko Zhekov
STUDY AND ANALYSIS OF AN IMAGE BY AN OPTICAL-ELECTRONIC SYSTEM ..74 Stiliyan Stoyanov
Physics
THE COMPLEXES OF CO2+ IN BI12SIO20 AND CO3+ IN BI12TIO20 ............................ 78 Petya Petkova, Petko Vasilev, Genoveva Nedelcheva
TETRAHEDRAL AND OCTAHEDRAL COMPLEXES OF MN2+ IN THE AQUEOUS SOLUTIONS OF MNCL2.4H2O ........................................................84 Petya Petkova, Vesselin Nedkov, Jordanka Tacheva, Petko Vasilev, Dian Hristov, Genoveva Nedelcheva, Ivaylo Dimitrov, Atanas Ivanov and Ibrahim Ahmed
National Security
SURVEY AND ANALYSIS OF INTERCULTURAL COMMUNICATION IN BULGARIA AND ABROAD.................................................................................89 Gergana Andreeva, Andrey Andreev
RESEARCH OF MATHEMATICAL MODEL FOR OPERATIONS TO DETERMINE RISKS FOR PROTECTIONS OF CRITICAL INFRASTRUCTURE ............................................................................................98 Lyubomir Pashov
RESEARCH OF THE CRITERIA FOR EFFICIENCY AND OPTIMALITY OF THE CRITICAL INFRASTRUCTURE PROTECTION MANAGEMENT........101 Lyubomir Pashov
RESEARCH OF THE OPPORTUNITIES FOR IMPLEMENETATION OF POLICES WHEN PLANNING THE POROTECTION OF CRITICAL INFRASTRUCTURE ..........................................................................................108 Lyubomir Pashov
A TAXONOMY OF THE CYBER ATTACKS ...................................................114 Petar Boyanov
JOURNAL SCIENTIFIC AND APPLIED RESEARCH Vol. 3, 20�3
Original Contribution
Journal scientific and applied research, vol. 3, 20�3 Association Scientific and Applied Research
International Journal ISSN �3��-�2��
SATELLITE SPECTROPHOTOMETER FOR RESEARCH OF THE TOTAL OZONE CONTENT
Stiliyan Zh. Stoyanov, Garo H. Mardirossian
SPACE RESEARCH AND TECHNOLOGIES INSTITUTE – BULGARIAN ACADEMY
OF SCIENCES SOFIA 1113, ACAD. GEORGI BONCHEV ST., BL. 1
Abstract: The measurement of the atmospheric ozone and its influence upon the climate and life on Earth
is undoubtedly one of the most current issues of the present time. The paper presents the functional scheme of a satellite optoelectronic spectrophotometer for measuring
the total content of the atmospheric ozone and other gas components of the atmosphere, which has increased precision, smaller weight and energy consumption, increased space and time resolution, quickness of reaction and increased volume of useful information.
The object of the paper is the design of an appliance which ensures research of the ozone content in the atmosphere from the board of a satellite.
Key words:
The research of the gas content of the Earth atmosphere by means of different methods has been performed during the last few decades. The interest in this problem has greatly increased because of the following facts:
- The anthropogenic influence on the gases and aerosols in the atmosphere has significantly increased;
- The different physical mechanisms which influence the change in the gas and aerosol content of the atmosphere and thus having an impact over the different characteristics of the environment and more specifically over the weather and climate on Earth, are becoming clearer.
In earlier times, special attention was paid to the concentration growth of carbon oxide, but now the contemporary trends show that the increase of other small gas content such as O3, CH�, CO, N2O, freons, etc. may in the near future induce a considerable total influence on the Earth climate, rather than the concentration growth of carbon oxide.
The most dramatic example for regional change of the gas content of the atmosphere is the Antarctic ozone hole – a phenomenon which has been widely discussed and researched by specialists from different countries and which is connected with direct or indirect influence of the anthropogenic factors. According to
� JOURNAL SCIENTIFIC AND APPLIED RESEARCH Vol. 3, 20�3JOURNAL SCIENTIFIC AND APPLIED RESEARCH Vol. 3, 20�3
Fig.
�. O
ptoe
lect
roni
c sp
ectro
phot
omet
er fo
r res
earc
h of
the
tota
l con
tent
of t
he a
tmos
pher
ic o
zone
and
oth
er g
ases
in th
e at
mos
pher
e
JOURNAL SCIENTIFIC AND APPLIED RESEARCH Vol. 3, 20�3
predictions, during the next �0 to �0 years, the ice around the Pole will melt during the summer season.
The change of the gas content and the possible consequences from these changes stimulate the creating and functioning of different observation systems for control of the gas content of the Earth atmosphere.
The problem is solved by inventing an optoelectronic spectrophotometer for research of the total content of the atmospheric ozone which has spectral, electronic and photometric channel which has greater precision, lighter weight and energy consumption, greater space and time resolution, quick response, better reliability and increased volume of the useful information.
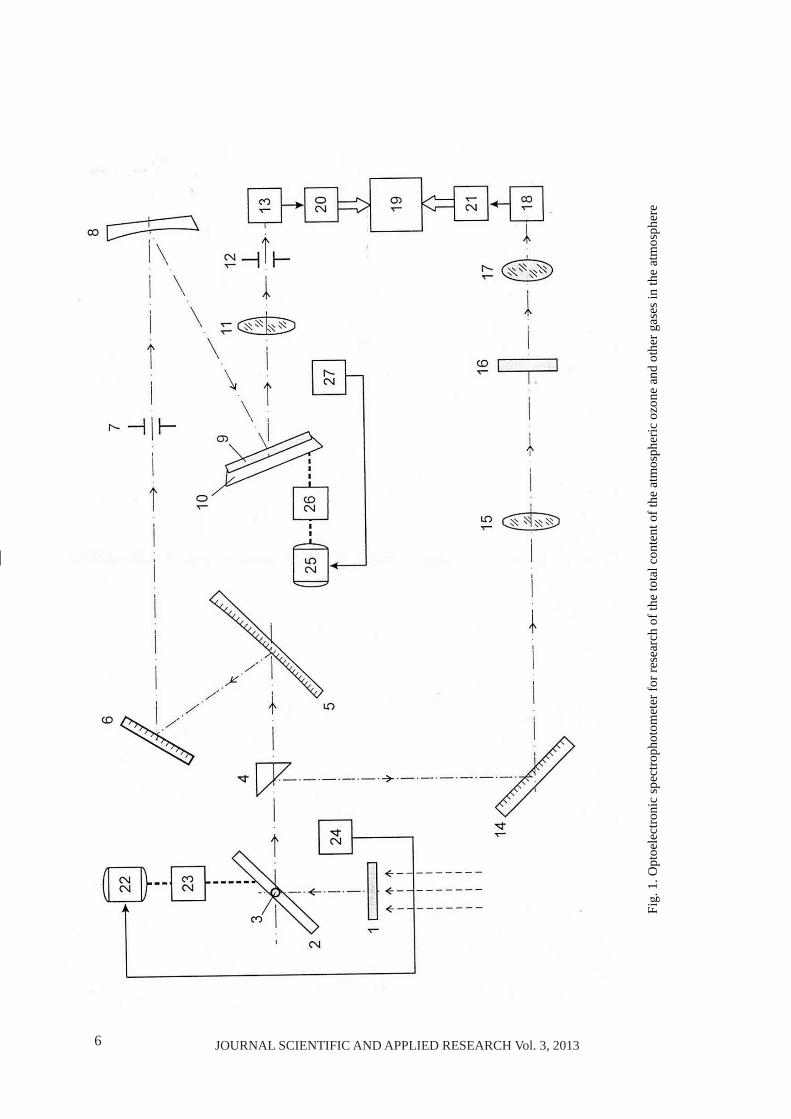
An example is shown on Fig. �, which is a block scheme of optoelectronic spectrophotometer for research of the total content of the atmospheric ozone and other small gases in the atmosphere.
According to Fig. �, the opto-electronic spectrophotometer for research of small gas content in the atmosphere consists of light-protective blend � which is situated in front of a plane scanning mirror 2 with mounted etalon source 3 in it, which serve the photometric and spectrometric channel and they are inlet scanning system, controlled by step electro-engine 22, which by means of gear 23 is mechanically connected with scanning mirror 2 and electronically connected with photoelectric transformer angle-code 2� for feedback.
A concave mirror � is mounted
in front of the plane mirror 2 on the same optical axis and a reflective prism � is fixed between them and it guides part of the optical system towards the spectrometric tract and another part of it towards the photometric tract of the spectrophotometer. The concave mirror � from the spectrometric tract is optically connected with plane mirror � which goes through inlet hole � and by means of concave mirror � – with diffraction grating �, which is mounted on a flexible carrier �0 and from it through camera lens �� and outlet hole �2 with sensor �3. Reflective prism � is optically connected with the photometric tract and through plane mirror ��, objective ��, interference filter �� and optical lens �� with sensor ��. The sensors �3 and �� correspondingly from the spectrometric and photometric tract are connected with microprocessor system �� through analog-digital transformers respectively 20 and 2�.
The step electro engine 2� is connected mechanically by means of a mechanical block 2� with the carrier �0 of the diffraction grating � and the photoelectrical transformer angle-code 2� is electrically connected with the electro engine 2�. HOW THE SPECTROPHOTO- METER WORKS
The plane scanning mirror 2, which is moved by the step electric engine 22 and the gear 23 perform scanning at angle β=±45° which is regulated by the reverse connection, done by the photoelectric transformer
�JOURNAL SCIENTIFIC AND APPLIED RESEARCH Vol. 3, 20�3JOURNAL SCIENTIFIC AND APPLIED RESEARCH Vol. 3, 20�3
Fig.
�. O
ptoe
lect
roni
c sp
ectro
phot
omet
er fo
r res
earc
h of
the
tota
l con
tent
of t
he a
tmos
pher
ic o
zone
and
oth
er g
ases
in th
e at
mos
pher
e
JOURNAL SCIENTIFIC AND APPLIED RESEARCH Vol. 3, 20�3
predictions, during the next �0 to �0 years, the ice around the Pole will melt during the summer season.
The change of the gas content and the possible consequences from these changes stimulate the creating and functioning of different observation systems for control of the gas content of the Earth atmosphere.
The problem is solved by inventing an optoelectronic spectrophotometer for research of the total content of the atmospheric ozone which has spectral, electronic and photometric channel which has greater precision, lighter weight and energy consumption, greater space and time resolution, quick response, better reliability and increased volume of the useful information.
An example is shown on Fig. �, which is a block scheme of optoelectronic spectrophotometer for research of the total content of the atmospheric ozone and other small gases in the atmosphere.
According to Fig. �, the opto-electronic spectrophotometer for research of small gas content in the atmosphere consists of light-protective blend � which is situated in front of a plane scanning mirror 2 with mounted etalon source 3 in it, which serve the photometric and spectrometric channel and they are inlet scanning system, controlled by step electro-engine 22, which by means of gear 23 is mechanically connected with scanning mirror 2 and electronically connected with photoelectric transformer angle-code 2� for feedback.
A concave mirror � is mounted
in front of the plane mirror 2 on the same optical axis and a reflective prism � is fixed between them and it guides part of the optical system towards the spectrometric tract and another part of it towards the photometric tract of the spectrophotometer. The concave mirror � from the spectrometric tract is optically connected with plane mirror � which goes through inlet hole � and by means of concave mirror � – with diffraction grating �, which is mounted on a flexible carrier �0 and from it through camera lens �� and outlet hole �2 with sensor �3. Reflective prism � is optically connected with the photometric tract and through plane mirror ��, objective ��, interference filter �� and optical lens �� with sensor ��. The sensors �3 and �� correspondingly from the spectrometric and photometric tract are connected with microprocessor system �� through analog-digital transformers respectively 20 and 2�.
The step electro engine 2� is connected mechanically by means of a mechanical block 2� with the carrier �0 of the diffraction grating � and the photoelectrical transformer angle-code 2� is electrically connected with the electro engine 2�. HOW THE SPECTROPHOTO- METER WORKS
The plane scanning mirror 2, which is moved by the step electric engine 22 and the gear 23 perform scanning at angle β=±45° which is regulated by the reverse connection, done by the photoelectric transformer
� JOURNAL SCIENTIFIC AND APPLIED RESEARCH Vol. 3, 20�3JOURNAL SCIENTIFIC AND APPLIED RESEARCH Vol. 3, 20�3
angle-code 2�. The optical signal, reflected by the concave mirror � and the plane mirror � through entrance whole �, goes to the concave mirror � and from there parallel beams go to diffraction grating � which is mounted on the carrier �0. The monochromatic signal from the diffraction grating � goes through camera objective �� and exit whole �2 and reaches sensor �3. The electrical signal from the sensor exit �3 is transformed into digital type in the analogue-digital transformer 20 and is sent into �-order binary code for transformation in the microprocessor ��. The gradual scanning of diffraction grating � which is mounted on the mobile carrier �0 is done by a mechanical block 2� which is coupled with the step electrical engine 2� and the reverse connection for the position of the diffraction grating � is done by the photoelectrical transformer angle-code 2�. Part of the optical system from the reflecting prism � goes to the photometric channel and is reflected by the plane �� and from the objective �� goes to the interference filter ��. From there, the monochromatic optical signal through lens �� is focused on the sensor ��. The electrical signal which is obtained in the sensor, is passed towards analogue-digital transformer and it goes to a microprocessor system �� in the form of �-order binary code.
The inside calibration of the spectrophotometric and photometric
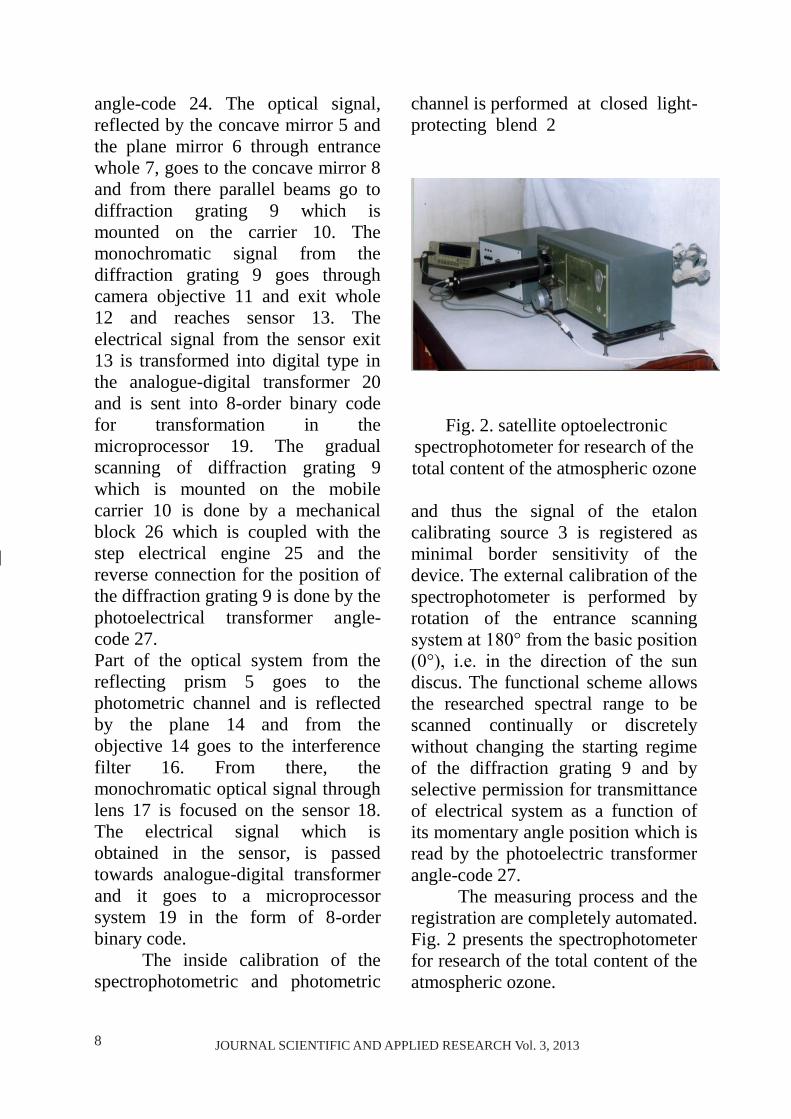
channel is performed at closed light-protecting blend 2
Fig. 2. satellite optoelectronic spectrophotometer for research of the total content of the atmospheric ozone
and thus the signal of the etalon calibrating source 3 is registered as minimal border sensitivity of the device. The external calibration of the spectrophotometer is performed by rotation of the entrance scanning system at 180° from the basic position (0°), i.e. in the direction of the sun discus. The functional scheme allows the researched spectral range to be scanned continually or discretely without changing the starting regime of the diffraction grating � and by selective permission for transmittance of electrical system as a function of its momentary angle position which is read by the photoelectric transformer angle-code 2�. The measuring process and the registration are completely automated. Fig. 2 presents the spectrophotometer for research of the total content of the atmospheric ozone.
JOURNAL SCIENTIFIC AND APPLIED RESEARCH Vol. 3, 20�3
CONCLUSION A satellite optoelectronic
spectrophotometer for research of the total content of the atmospheric ozone and other gases in the atmosphere has been developed. It has greater
precision, smaller weight and energy use and also increased space and time resolution, quick response, better reliability and larger volume of useful information. It is copy righted by a Patent BG ���00�B� by the Patent Authority of Republic of Bulgaria.
REFERENCES:
�. Velchev N. Fizicheska optoelektronika. Universitetsko izdatelstvo “Paisii hilendarski”, Plovdiv, 2008, 141 p. 2. Getzov P. Sputnikovi sistemi za ekologichen monitoring. Sb. Nauchni trudove “Nauchno-tehnologichen transfer”, IKI-BAN, Shumen, 2000, p. �-� 3. Zhekov ZH. Optichni metodi I sredstva za otkrivane na otdalecheni obekti ot borda na kosmicheski letatelni aparati. Universitetsko izdatelstvo “Episkop K. Preslavski”, Shumen, 2006, 308 p.
�. Mardirossian G. Aerokosmicheski metodi v ekologiata I izuchavane na okolnata sreda. Acad. Izdatelstvo “Prof. Marin Drinov”, Sofia, 2003, 208 p. �. Patent BG ���00�B� issued 2�.0�.200� Satellite optoelectronic spectrophotometer for research of the total content of the atmospheric ozone and other gases in the atmosphere. Zhekov Zh., MArdirossian G., Getzov P., Stoyanov S., Hristov I. Patent Authority of Republic of Bulgaria
�JOURNAL SCIENTIFIC AND APPLIED RESEARCH Vol. 3, 20�3JOURNAL SCIENTIFIC AND APPLIED RESEARCH Vol. 3, 20�3
angle-code 2�. The optical signal, reflected by the concave mirror � and the plane mirror � through entrance whole �, goes to the concave mirror � and from there parallel beams go to diffraction grating � which is mounted on the carrier �0. The monochromatic signal from the diffraction grating � goes through camera objective �� and exit whole �2 and reaches sensor �3. The electrical signal from the sensor exit �3 is transformed into digital type in the analogue-digital transformer 20 and is sent into �-order binary code for transformation in the microprocessor ��. The gradual scanning of diffraction grating � which is mounted on the mobile carrier �0 is done by a mechanical block 2� which is coupled with the step electrical engine 2� and the reverse connection for the position of the diffraction grating � is done by the photoelectrical transformer angle-code 2�. Part of the optical system from the reflecting prism � goes to the photometric channel and is reflected by the plane �� and from the objective �� goes to the interference filter ��. From there, the monochromatic optical signal through lens �� is focused on the sensor ��. The electrical signal which is obtained in the sensor, is passed towards analogue-digital transformer and it goes to a microprocessor system �� in the form of �-order binary code.
The inside calibration of the spectrophotometric and photometric
channel is performed at closed light-protecting blend 2
Fig. 2. satellite optoelectronic spectrophotometer for research of the total content of the atmospheric ozone
and thus the signal of the etalon calibrating source 3 is registered as minimal border sensitivity of the device. The external calibration of the spectrophotometer is performed by rotation of the entrance scanning system at 180° from the basic position (0°), i.e. in the direction of the sun discus. The functional scheme allows the researched spectral range to be scanned continually or discretely without changing the starting regime of the diffraction grating � and by selective permission for transmittance of electrical system as a function of its momentary angle position which is read by the photoelectric transformer angle-code 2�. The measuring process and the registration are completely automated. Fig. 2 presents the spectrophotometer for research of the total content of the atmospheric ozone.
JOURNAL SCIENTIFIC AND APPLIED RESEARCH Vol. 3, 20�3
CONCLUSION A satellite optoelectronic
spectrophotometer for research of the total content of the atmospheric ozone and other gases in the atmosphere has been developed. It has greater
precision, smaller weight and energy use and also increased space and time resolution, quick response, better reliability and larger volume of useful information. It is copy righted by a Patent BG ���00�B� by the Patent Authority of Republic of Bulgaria.
REFERENCES:
�. Velchev N. Fizicheska optoelektronika. Universitetsko izdatelstvo “Paisii hilendarski”, Plovdiv, 2008, 141 p. 2. Getzov P. Sputnikovi sistemi za ekologichen monitoring. Sb. Nauchni trudove “Nauchno-tehnologichen transfer”, IKI-BAN, Shumen, 2000, p. �-� 3. Zhekov ZH. Optichni metodi I sredstva za otkrivane na otdalecheni obekti ot borda na kosmicheski letatelni aparati. Universitetsko izdatelstvo “Episkop K. Preslavski”, Shumen, 2006, 308 p.
�. Mardirossian G. Aerokosmicheski metodi v ekologiata I izuchavane na okolnata sreda. Acad. Izdatelstvo “Prof. Marin Drinov”, Sofia, 2003, 208 p. �. Patent BG ���00�B� issued 2�.0�.200� Satellite optoelectronic spectrophotometer for research of the total content of the atmospheric ozone and other gases in the atmosphere. Zhekov Zh., MArdirossian G., Getzov P., Stoyanov S., Hristov I. Patent Authority of Republic of Bulgaria
�0 JOURNAL SCIENTIFIC AND APPLIED RESEARCH Vol. 3, 20�3JOURNAL SCIENTIFIC AND APPLIED RESEARCH Vol. 3, 20�3
Original Contribution
Journal scientific and applied research, vol. 3, 20�3 Association Scientific and Applied Research
International Journal ISSN �3��-�2��
TWO METHODS FOR 3-AMINOCYCLOPENTANESPIRO-5-HYDANTOIN THIONATION
Marin N. Marinov
FACULTY OF PLANT PROTECTION AND AGROECOLOGY,
AGRICULTURAL UNIVERSITY – PLOVDIV
Abstract: This article presents two methods for 3-aminocyclopentanespiro-5-hydantoin thionation. These methods are based on the treatment of the titled compound with P4S10 or Lawesson’s reagent. The corresponding dithio-analogue was synthesized as a result of these interactions. The structure of the product obtained was verified by 1H NMR, 13C NMR and mass spectral data.
Key words: 3-aminocyclopentanespiro-5-hydantoin, thionation
I. Introduction The interaction between
cyclohexanespiro-�-(2-thiohydan-toin) and hydrazine hydrate at different reaction conditions was studied and presented in a previous publication [�].
It was found that conducting the reaction at normal conditions resulted in formation of the corresponding 2-hydrazone of the initial compound [�].
Unlike the aforementioned case, the refluxing of cyclohexane-spiro-�-(2-thiohydantoin) and hydrazine hydrate led to obtaining of the relevant 3-amino derivative [�].
The thionation of 3-aminocy-clohexanespiro-�-hydantoin by using P�S�0 and Lawesson’s reagent (LR) as thionation reagents led to preparing of the corresponding dithioanalogue [�].
The aim of this paper is to present the application of the thionation techniques, described above, to 3-aminocyclopentane-spiro-�-hydantoin.
The interest in obtaining 3-aminocycloalkanespiro-�-(2,�-di-thiohydantoins) is determined by their presumed biological activities and future studies planned thereon.
Available data published in the literature represent a further support to this suggestion.
It is well known, for example, that different 3-aminocycloalkane-spiro-�-hydantoins exert well pronounced, atropine-sensitive, contractile effects on guinea-pig ileum longitudinal muscle preparations [2].
II. Experimental II.1. Materials and methods
JOURNAL SCIENTIFIC AND APPLIED RESEARCH Vol. 3, 20�3
All chemicals used were purchased from Merck and Sigma-Aldrich.
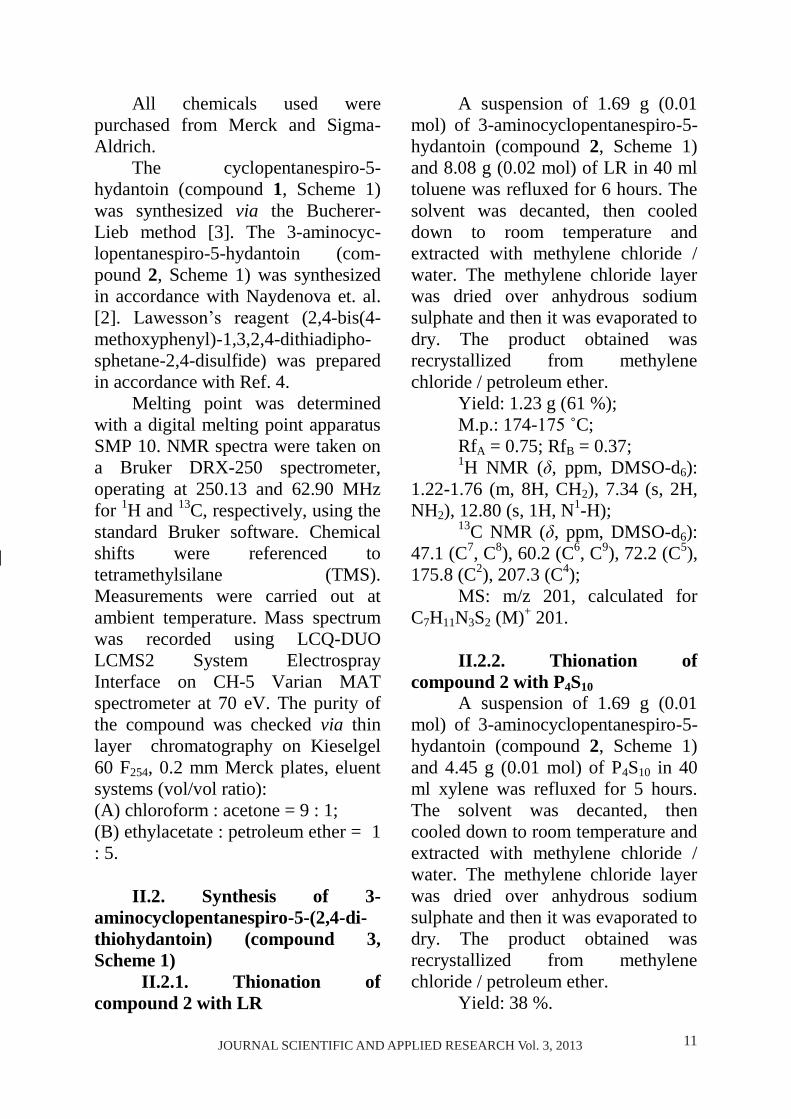
The cyclopentanespiro-�-hydantoin (compound 1, Scheme �) was synthesized via the Bucherer-Lieb method [3]. The 3-aminocyc-lopentanespiro-�-hydantoin (com-pound 2, Scheme �) was synthesized in accordance with Naydenova et. al. [2]. Lawesson’s reagent (2,�-bis(�-methoxyphenyl)-�,3,2,�-dithiadipho-sphetane-2,�-disulfide) was prepared in accordance with Ref. �.
Melting point was determined with a digital melting point apparatus SMP �0. NMR spectra were taken on a Bruker DRX-2�0 spectrometer, operating at 2�0.�3 and �2.�0 MHz for �H and �3C, respectively, using the standard Bruker software. Chemical shifts were referenced to tetramethylsilane (TMS). Measurements were carried out at ambient temperature. Mass spectrum was recorded using LCQ-DUO LCMS2 System Electrospray Interface on CH-� Varian MAT spectrometer at �0 eV. The purity of the compound was checked via thin layer chromatography on Kieselgel �0 F2��, 0.2 mm Merck plates, eluent systems (vol/vol ratio): (A) chloroform : acetone = � : �; (B) ethylacetate : petroleum ether = � : �.
II.2. Synthesis of 3-aminocyclopentanespiro-5-(2,4-di-thiohydantoin) (compound 3, Scheme 1) II.2.1. Thionation of compound 2 with LR
A suspension of �.�� g (0.0� mol) of 3-aminocyclopentanespiro-�-hydantoin (compound 2, Scheme �) and �.0� g (0.02 mol) of LR in �0 ml toluene was refluxed for � hours. The solvent was decanted, then cooled down to room temperature and extracted with methylene chloride / water. The methylene chloride layer was dried over anhydrous sodium sulphate and then it was evaporated to dry. The product obtained was recrystallized from methylene chloride / petroleum ether. Yield: �.23 g (�� %); M.p.: ���-175 ˚C; RfA = 0.��; RfB = 0.3�; �H NМR (δ, ppm, DMSO-d�): �.22-�.�� (m, �H, CH2), �.3� (s, 2H, NH2), �2.�0 (s, �H, N�-H); �3C NМR (δ, ppm, DMSO-d�): ��.� (C�, C�), �0.2 (C�, C�), �2.2 (C�), ���.� (C2), 20�.3 (C�); МS: m/z 20�, calculated for C�H��N3S2 (M)+ 20�. II.2.2. Thionation of compound 2 with P4S10 A suspension of �.�� g (0.0� mol) of 3-aminocyclopentanespiro-�-hydantoin (compound 2, Scheme �) and �.�� g (0.0� mol) of P�S�0 in �0 ml xylene was refluxed for � hours. The solvent was decanted, then cooled down to room temperature and extracted with methylene chloride / water. The methylene chloride layer was dried over anhydrous sodium sulphate and then it was evaporated to dry. The product obtained was recrystallized from methylene chloride / petroleum ether. Yield: 3� %.
��JOURNAL SCIENTIFIC AND APPLIED RESEARCH Vol. 3, 20�3JOURNAL SCIENTIFIC AND APPLIED RESEARCH Vol. 3, 20�3
Original Contribution
Journal scientific and applied research, vol. 3, 20�3 Association Scientific and Applied Research
International Journal ISSN �3��-�2��
TWO METHODS FOR 3-AMINOCYCLOPENTANESPIRO-5-HYDANTOIN THIONATION
Marin N. Marinov
FACULTY OF PLANT PROTECTION AND AGROECOLOGY,
AGRICULTURAL UNIVERSITY – PLOVDIV
Abstract: This article presents two methods for 3-aminocyclopentanespiro-5-hydantoin thionation. These methods are based on the treatment of the titled compound with P4S10 or Lawesson’s reagent. The corresponding dithio-analogue was synthesized as a result of these interactions. The structure of the product obtained was verified by 1H NMR, 13C NMR and mass spectral data.
Key words: 3-aminocyclopentanespiro-5-hydantoin, thionation
I. Introduction The interaction between
cyclohexanespiro-�-(2-thiohydan-toin) and hydrazine hydrate at different reaction conditions was studied and presented in a previous publication [�].
It was found that conducting the reaction at normal conditions resulted in formation of the corresponding 2-hydrazone of the initial compound [�].
Unlike the aforementioned case, the refluxing of cyclohexane-spiro-�-(2-thiohydantoin) and hydrazine hydrate led to obtaining of the relevant 3-amino derivative [�].
The thionation of 3-aminocy-clohexanespiro-�-hydantoin by using P�S�0 and Lawesson’s reagent (LR) as thionation reagents led to preparing of the corresponding dithioanalogue [�].
The aim of this paper is to present the application of the thionation techniques, described above, to 3-aminocyclopentane-spiro-�-hydantoin.
The interest in obtaining 3-aminocycloalkanespiro-�-(2,�-di-thiohydantoins) is determined by their presumed biological activities and future studies planned thereon.
Available data published in the literature represent a further support to this suggestion.
It is well known, for example, that different 3-aminocycloalkane-spiro-�-hydantoins exert well pronounced, atropine-sensitive, contractile effects on guinea-pig ileum longitudinal muscle preparations [2].
II. Experimental II.1. Materials and methods
JOURNAL SCIENTIFIC AND APPLIED RESEARCH Vol. 3, 20�3
All chemicals used were purchased from Merck and Sigma-Aldrich.
The cyclopentanespiro-�-hydantoin (compound 1, Scheme �) was synthesized via the Bucherer-Lieb method [3]. The 3-aminocyc-lopentanespiro-�-hydantoin (com-pound 2, Scheme �) was synthesized in accordance with Naydenova et. al. [2]. Lawesson’s reagent (2,�-bis(�-methoxyphenyl)-�,3,2,�-dithiadipho-sphetane-2,�-disulfide) was prepared in accordance with Ref. �.
Melting point was determined with a digital melting point apparatus SMP �0. NMR spectra were taken on a Bruker DRX-2�0 spectrometer, operating at 2�0.�3 and �2.�0 MHz for �H and �3C, respectively, using the standard Bruker software. Chemical shifts were referenced to tetramethylsilane (TMS). Measurements were carried out at ambient temperature. Mass spectrum was recorded using LCQ-DUO LCMS2 System Electrospray Interface on CH-� Varian MAT spectrometer at �0 eV. The purity of the compound was checked via thin layer chromatography on Kieselgel �0 F2��, 0.2 mm Merck plates, eluent systems (vol/vol ratio): (A) chloroform : acetone = � : �; (B) ethylacetate : petroleum ether = � : �.
II.2. Synthesis of 3-aminocyclopentanespiro-5-(2,4-di-thiohydantoin) (compound 3, Scheme 1) II.2.1. Thionation of compound 2 with LR
A suspension of �.�� g (0.0� mol) of 3-aminocyclopentanespiro-�-hydantoin (compound 2, Scheme �) and �.0� g (0.02 mol) of LR in �0 ml toluene was refluxed for � hours. The solvent was decanted, then cooled down to room temperature and extracted with methylene chloride / water. The methylene chloride layer was dried over anhydrous sodium sulphate and then it was evaporated to dry. The product obtained was recrystallized from methylene chloride / petroleum ether. Yield: �.23 g (�� %); M.p.: ���-175 ˚C; RfA = 0.��; RfB = 0.3�; �H NМR (δ, ppm, DMSO-d�): �.22-�.�� (m, �H, CH2), �.3� (s, 2H, NH2), �2.�0 (s, �H, N�-H); �3C NМR (δ, ppm, DMSO-d�): ��.� (C�, C�), �0.2 (C�, C�), �2.2 (C�), ���.� (C2), 20�.3 (C�); МS: m/z 20�, calculated for C�H��N3S2 (M)+ 20�. II.2.2. Thionation of compound 2 with P4S10 A suspension of �.�� g (0.0� mol) of 3-aminocyclopentanespiro-�-hydantoin (compound 2, Scheme �) and �.�� g (0.0� mol) of P�S�0 in �0 ml xylene was refluxed for � hours. The solvent was decanted, then cooled down to room temperature and extracted with methylene chloride / water. The methylene chloride layer was dried over anhydrous sodium sulphate and then it was evaporated to dry. The product obtained was recrystallized from methylene chloride / petroleum ether. Yield: 3� %.
�2 JOURNAL SCIENTIFIC AND APPLIED RESEARCH Vol. 3, 20�3JOURNAL SCIENTIFIC AND APPLIED RESEARCH Vol. 3, 20�3
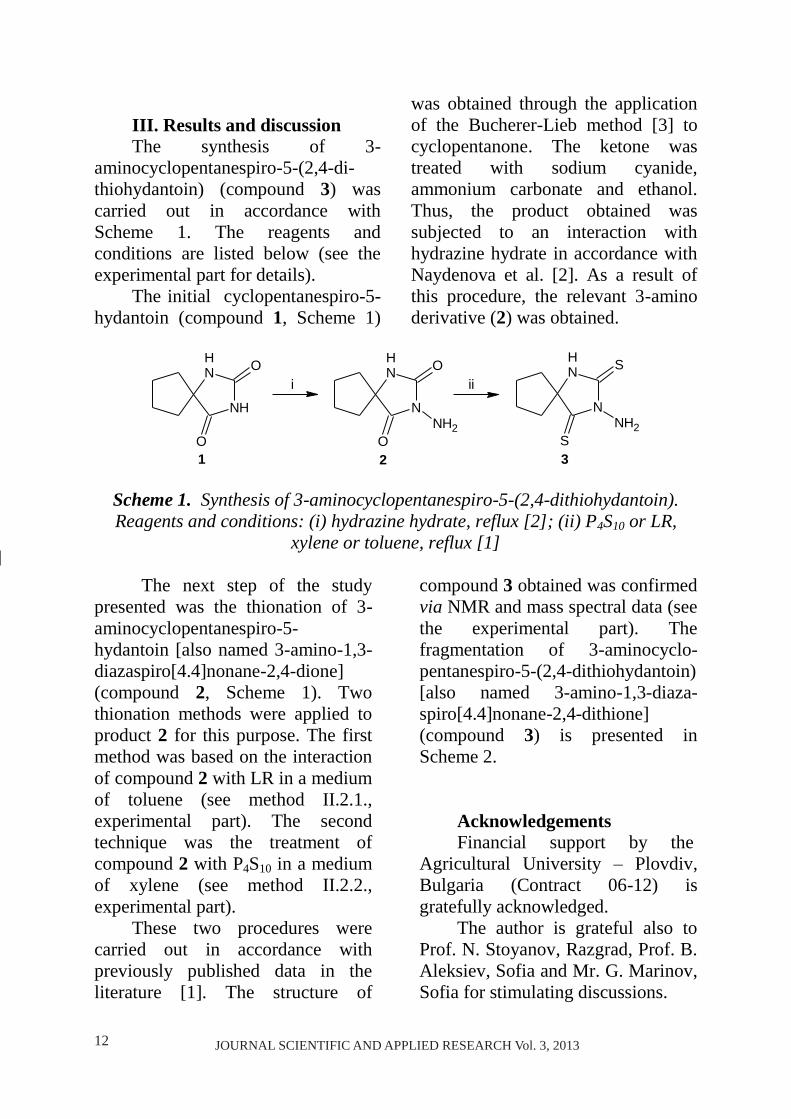
III. Results and discussion The synthesis of 3-
aminocyclopentanespiro-�-(2,�-di-thiohydantoin) (compound 3) was carried out in accordance with Scheme �. The reagents and conditions are listed below (see the experimental part for details).
The initial cyclopentanespiro-�-hydantoin (compound 1, Scheme �)
was obtained through the application of the Bucherer-Lieb method [3] to cyclopentanone. The ketone was treated with sodium cyanide, ammonium carbonate and ethanol. Thus, the product obtained was subjected to an interaction with hydrazine hydrate in accordance with Naydenova et al. [2]. As a result of this procedure, the relevant 3-amino derivative (2) was obtained.
NH
NH
O
O
NH
N
O
ONH2
1 2 3
i iiNH
N
S
SNH2
Scheme 1. Synthesis of 3-aminocyclopentanespiro-5-(2,4-dithiohydantoin). Reagents and conditions: (i) hydrazine hydrate, reflux [2]; (ii) P4S10 or LR,
xylene or toluene, reflux [1]
The next step of the study presented was the thionation of 3-aminocyclopentanespiro-�-hydantoin [also named 3-amino-�,3-diazaspiro[�.�]nonane-2,�-dione] (compound 2, Scheme �). Two thionation methods were applied to product 2 for this purpose. The first method was based on the interaction of compound 2 with LR in a medium of toluene (see method II.2.�., experimental part). The second technique was the treatment of compound 2 with P�S�0 in a medium of xylene (see method II.2.2., experimental part).
These two procedures were carried out in accordance with previously published data in the literature [�]. The structure of
compound 3 obtained was confirmed via NMR and mass spectral data (see the experimental part). The fragmentation of 3-aminocyclo-pentanespiro-�-(2,�-dithiohydantoin) [also named 3-amino-�,3-diaza-spiro[�.�]nonane-2,�-dithione] (compound 3) is presented in Scheme 2.
Acknowledgements Financial support by the
Agricultural University – Plovdiv, Bulgaria (Contract 0�-�2) is gratefully acknowledged.
The author is grateful also to Prof. N. Stoyanov, Razgrad, Prof. B. Aleksiev, Sofia and Mr. G. Marinov, Sofia for stimulating discussions.
JOURNAL SCIENTIFIC AND APPLIED RESEARCH Vol. 3, 20�3
N
NS
SNH2
H
m/z 20� (�3)
-CN2H (��)
SHN
S
H
m/z ��0 (�)
N
Sm/z �2� (�)
-H2S (3�)
C N
m/z �� (�)
m/z �0 (�)
C N
m/z �� (�)
C N
-S(32)
-CH2 (��)
-CH� (��)
-CHN (2�) m/z �� (��)
-C�H� (��)
NH
HS
m/z �2 (2)
-N(��)
H2C C S
m/z �� (�) m/z �� (�00)-C(�2)
H2C S S CH3
m/z �� (��)
-C(�2)
H2S
m/z 3� (�0)
Scheme 2. Fragmentation of compound 3

�3JOURNAL SCIENTIFIC AND APPLIED RESEARCH Vol. 3, 20�3JOURNAL SCIENTIFIC AND APPLIED RESEARCH Vol. 3, 20�3
III. Results and discussion The synthesis of 3-
aminocyclopentanespiro-�-(2,�-di-thiohydantoin) (compound 3) was carried out in accordance with Scheme �. The reagents and conditions are listed below (see the experimental part for details).
The initial cyclopentanespiro-�-hydantoin (compound 1, Scheme �)
was obtained through the application of the Bucherer-Lieb method [3] to cyclopentanone. The ketone was treated with sodium cyanide, ammonium carbonate and ethanol. Thus, the product obtained was subjected to an interaction with hydrazine hydrate in accordance with Naydenova et al. [2]. As a result of this procedure, the relevant 3-amino derivative (2) was obtained.
NH
NH
O
O
NH
N
O
ONH2
1 2 3
i iiNH
N
S
SNH2
Scheme 1. Synthesis of 3-aminocyclopentanespiro-5-(2,4-dithiohydantoin). Reagents and conditions: (i) hydrazine hydrate, reflux [2]; (ii) P4S10 or LR,
xylene or toluene, reflux [1]
The next step of the study presented was the thionation of 3-aminocyclopentanespiro-�-hydantoin [also named 3-amino-�,3-diazaspiro[�.�]nonane-2,�-dione] (compound 2, Scheme �). Two thionation methods were applied to product 2 for this purpose. The first method was based on the interaction of compound 2 with LR in a medium of toluene (see method II.2.�., experimental part). The second technique was the treatment of compound 2 with P�S�0 in a medium of xylene (see method II.2.2., experimental part).
These two procedures were carried out in accordance with previously published data in the literature [�]. The structure of
compound 3 obtained was confirmed via NMR and mass spectral data (see the experimental part). The fragmentation of 3-aminocyclo-pentanespiro-�-(2,�-dithiohydantoin) [also named 3-amino-�,3-diaza-spiro[�.�]nonane-2,�-dithione] (compound 3) is presented in Scheme 2.
Acknowledgements Financial support by the
Agricultural University – Plovdiv, Bulgaria (Contract 0�-�2) is gratefully acknowledged.
The author is grateful also to Prof. N. Stoyanov, Razgrad, Prof. B. Aleksiev, Sofia and Mr. G. Marinov, Sofia for stimulating discussions.
JOURNAL SCIENTIFIC AND APPLIED RESEARCH Vol. 3, 20�3
N
NS
SNH2
H
m/z 20� (�3)
-CN2H (��)
SHN
S
H
m/z ��0 (�)
N
Sm/z �2� (�)
-H2S (3�)
C N
m/z �� (�)
m/z �0 (�)
C N
m/z �� (�)
C N
-S(32)
-CH2 (��)
-CH� (��)
-CHN (2�) m/z �� (��)
-C�H� (��)
NH
HS
m/z �2 (2)
-N(��)
H2C C S
m/z �� (�) m/z �� (�00)-C(�2)
H2C S S CH3
m/z �� (��)
-C(�2)
H2S
m/z 3� (�0)
Scheme 2. Fragmentation of compound 3
�� JOURNAL SCIENTIFIC AND APPLIED RESEARCH Vol. 3, 20�3
JOURNAL SCIENTIFIC AND APPLIED RESEARCH Vol. 3, 20�3
References [�] Marinov M., 20�2. Synthesis
of amino derivatives of monothio- and dithio- analogues of cyclohexanespiro-�-hydantoin. J. Sci. Appl. Res.
[2] Naydenova, E., N. Pencheva, J. Popova, N. Stoyanov, M. Lazarova, B. Aleksiev, 2002. Aminoderivatives of cycloalkanespi-rohydantoins: Synthesis and biological activity. Il Farmaco, �� (3), ���-���.
[3] Bucherer, H. T., V. Lieb, ��34. Über die Bildung substituierter Hydantoine aus Aldehyden und Ketonen. Synthese von Hydantoinen. J. Prakt. Chem., ���, �-�3.
[�] Thomsen I., K. Clausen, S. Scheibye and S.-O. Lawesson, ���0. Thiation with 2,�-bis(�-methoxy-phenyl)-�,3,2,�-dithiadiphosphetane 2,�-disulfide: n-methylthiopyrro-lidone. Org. Synth. Coll. Vol. �, 3�2.
JOURNAL SCIENTIFIC AND APPLIED RESEARCH Vol. 3, 20�3
Original Contribution
Journal scientific and applied research, vol. 3, 20�3 Association Scientific and Applied Research
International Journal ISSN �3��-�2��
INHIBITION EFFECTS OF CYCLOHEXANESPIRO-5-HYDANTOIN AND 1-AMINOCYCLOHEXANECARBOXYLIC ACID TOWARDS
SOUR CHERRY POLLEN
Donyo H. Ganchev,a Marin N. Marinov,a Angel S. Nikolov,a Stefan V. Krustev,a Milena R. Zlateva,a Nadezhda I. Atanasova a and Neyko M.
Stoyanov b
a FACULTY OF PLANT PROTECTION AND AGROECOLOGY, AGRICULTURAL UNIVERSITY – PLOVDIV
b DEPARTMENT OF CHEMISTRY AND CHEMICAL TECHNOLOGY, UNIVERSITY OF RUSE - BRANCH RAZGRAD
Abstract: Possible deleterious effects of cyclohexanespiro-5-hydantoin and 1-
aminocyclohexanecarboxylic acid to sour cherry pollen were examined with the current study. Dose-response modeling was carried out by R language for Statistical Computing, drc package.
Key words: cyclohexanespiro-5-hydantoin, 1-aminocyclohexanecarboxylic acid, sour cherry pollen, drc, R language
I. Introduction The interest in studying
cyclohexanespiro-�-hydantoin and �-aminocyclohexanecarboxylic acid is caused by their biological activity.
Certain cyclohexanespiro-�-hydantoins have analgesic and anti-inflammatory activity [�].
Regional transport of l-aminocyclohexanecarboxylic acid, a nonmetabolizable amino acid, across the blood-brain barrier is studied in pentobarbital-anesthetized rats using an in situ brain perfusion technique [2]. Different derivatives of cyclohexanespiro-�-hydantoin are
obtained in order to investigate their possible biological activity.
Some examples of such compounds include monotiho- and dithio- analogues of cyclohexanespiro-�-hydantoin, as well as copper complexes of the latter and its dithio- analogue [3, �].
For ecotoxicological characterization and determination of eventual deleterious effects of biocides onto plants, pollen germination tests are from significant importance, due to the major impact of the pollen on plants’ lives.
Quantification of pollen tube growth will allow this inhibitory effect to be expressed in a numerical
��JOURNAL SCIENTIFIC AND APPLIED RESEARCH Vol. 3, 20�3
JOURNAL SCIENTIFIC AND APPLIED RESEARCH Vol. 3, 20�3
References [�] Marinov M., 20�2. Synthesis
of amino derivatives of monothio- and dithio- analogues of cyclohexanespiro-�-hydantoin. J. Sci. Appl. Res.
[2] Naydenova, E., N. Pencheva, J. Popova, N. Stoyanov, M. Lazarova, B. Aleksiev, 2002. Aminoderivatives of cycloalkanespi-rohydantoins: Synthesis and biological activity. Il Farmaco, �� (3), ���-���.
[3] Bucherer, H. T., V. Lieb, ��34. Über die Bildung substituierter Hydantoine aus Aldehyden und Ketonen. Synthese von Hydantoinen. J. Prakt. Chem., ���, �-�3.
[�] Thomsen I., K. Clausen, S. Scheibye and S.-O. Lawesson, ���0. Thiation with 2,�-bis(�-methoxy-phenyl)-�,3,2,�-dithiadiphosphetane 2,�-disulfide: n-methylthiopyrro-lidone. Org. Synth. Coll. Vol. �, 3�2.
JOURNAL SCIENTIFIC AND APPLIED RESEARCH Vol. 3, 20�3
Original Contribution
Journal scientific and applied research, vol. 3, 20�3 Association Scientific and Applied Research
International Journal ISSN �3��-�2��
INHIBITION EFFECTS OF CYCLOHEXANESPIRO-5-HYDANTOIN AND 1-AMINOCYCLOHEXANECARBOXYLIC ACID TOWARDS
SOUR CHERRY POLLEN
Donyo H. Ganchev,a Marin N. Marinov,a Angel S. Nikolov,a Stefan V. Krustev,a Milena R. Zlateva,a Nadezhda I. Atanasova a and Neyko M.
Stoyanov b
a FACULTY OF PLANT PROTECTION AND AGROECOLOGY, AGRICULTURAL UNIVERSITY – PLOVDIV
b DEPARTMENT OF CHEMISTRY AND CHEMICAL TECHNOLOGY, UNIVERSITY OF RUSE - BRANCH RAZGRAD
Abstract: Possible deleterious effects of cyclohexanespiro-5-hydantoin and 1-
aminocyclohexanecarboxylic acid to sour cherry pollen were examined with the current study. Dose-response modeling was carried out by R language for Statistical Computing, drc package.
Key words: cyclohexanespiro-5-hydantoin, 1-aminocyclohexanecarboxylic acid, sour cherry pollen, drc, R language
I. Introduction The interest in studying
cyclohexanespiro-�-hydantoin and �-aminocyclohexanecarboxylic acid is caused by their biological activity.
Certain cyclohexanespiro-�-hydantoins have analgesic and anti-inflammatory activity [�].
Regional transport of l-aminocyclohexanecarboxylic acid, a nonmetabolizable amino acid, across the blood-brain barrier is studied in pentobarbital-anesthetized rats using an in situ brain perfusion technique [2]. Different derivatives of cyclohexanespiro-�-hydantoin are
obtained in order to investigate their possible biological activity.
Some examples of such compounds include monotiho- and dithio- analogues of cyclohexanespiro-�-hydantoin, as well as copper complexes of the latter and its dithio- analogue [3, �].
For ecotoxicological characterization and determination of eventual deleterious effects of biocides onto plants, pollen germination tests are from significant importance, due to the major impact of the pollen on plants’ lives.
Quantification of pollen tube growth will allow this inhibitory effect to be expressed in a numerical
�� JOURNAL SCIENTIFIC AND APPLIED RESEARCH Vol. 3, 20�3JOURNAL SCIENTIFIC AND APPLIED RESEARCH Vol. 3, 20�3
value: ED�0, ED2� (LOAEL), ED0� (NOAEL). In the past two decades, pollen grains and pollen tubes of various plant species have been used to determine the cytotoxic effects of environmental pollutants [�].
Sour cherry (Cerasus vulgaris, Prunus cerausus, tart cherry) is a very popular and important orchard culture for the food industry. The sour cherry is cultivated in all parts of Bulgaria, especially near the towns of Sofia, Pazardzik and Plovdiv district [�].
We are examining the possible deleterious effects of cyclohexanespiro-�-hydantoin and �-aminocyclohexanecarboxylic acid to sour cherry pollen in the current study.
II. Materials and methods II.1. Synthetic compounds All chemicals used were
purchased from Merck and Sigma-Aldrich.
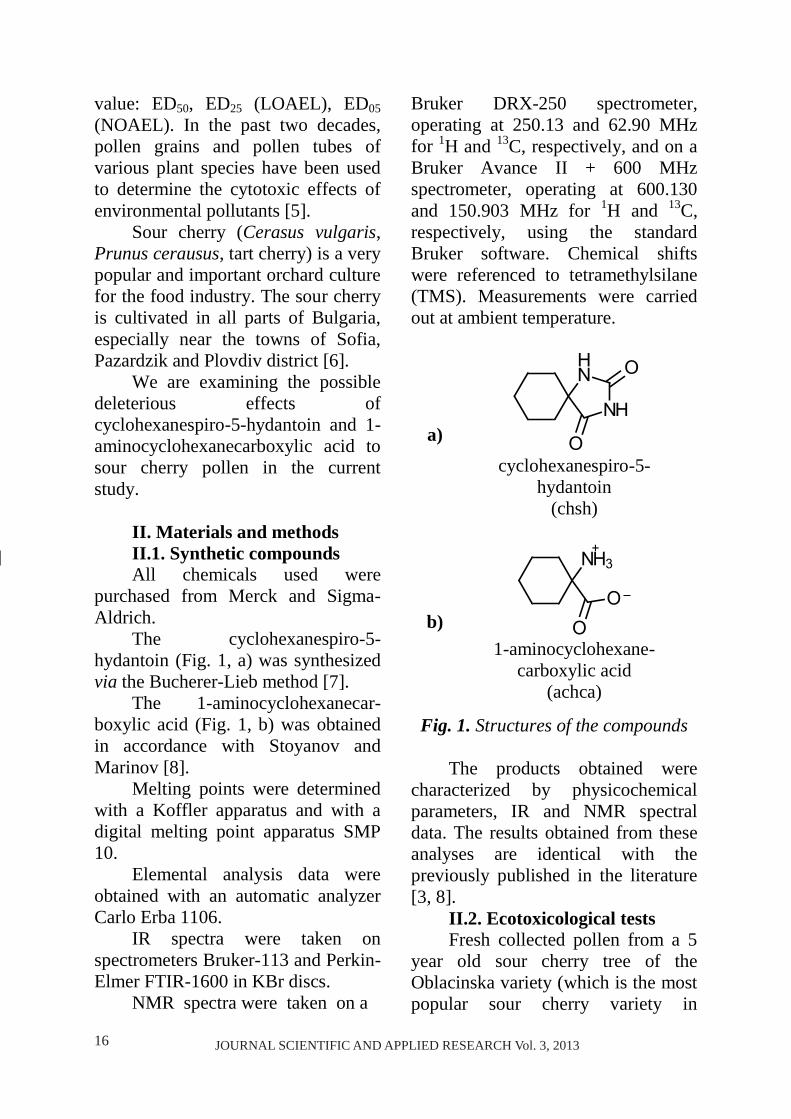
The cyclohexanespiro-�-hydantoin (Fig. �, a) was synthesized via the Bucherer-Lieb method [�].
The �-aminocyclohexanecar-boxylic acid (Fig. �, b) was obtained in accordance with Stoyanov and Marinov [�].
Melting points were determined with a Koffler apparatus and with a digital melting point apparatus SMP �0.
Elemental analysis data were obtained with an automatic analyzer Carlo Erba ��0�.
IR spectra were taken on spectrometers Bruker-��3 and Perkin-Elmer FTIR-��00 in KBr discs.
NMR spectra were taken on a
Bruker DRX-2�0 spectrometer, operating at 2�0.�3 and �2.�0 MHz for �H and �3C, respectively, and on a Bruker Avance II + �00 MHz spectrometer, operating at �00.�30 and ��0.�03 MHz for �H and �3C, respectively, using the standard Bruker software. Chemical shifts were referenced to tetramethylsilane (TMS). Measurements were carried out at ambient temperature.
a)
cyclohexanespiro-�-hydantoin
(chsh)
b) �-aminocyclohexane-
carboxylic acid (achca)
Fig. 1. Structures of the compounds The products obtained were
characterized by physicochemical parameters, IR and NMR spectral data. The results obtained from these analyses are identical with the previously published in the literature [3, �].
II.2. Ecotoxicological tests Fresh collected pollen from a �
year old sour cherry tree of the Oblacinska variety (which is the most popular sour cherry variety in
JOURNAL SCIENTIFIC AND APPLIED RESEARCH Vol. 3, 20�3
Bulgaria) was used. In order to stimulate pollen germination, 20 % (m/v) of sugar added to distilled water was used for dilution and preparation of the solution of tested compounds. Pollen suspensions with tested compounds in various concentrations were prepared with pollen grains density 2*�0e-0� grains per ml determined with haemocydometer.
After a 2� h stay in a thermostat
(22 ⁰C), the germination of grains and length of elongation tube were
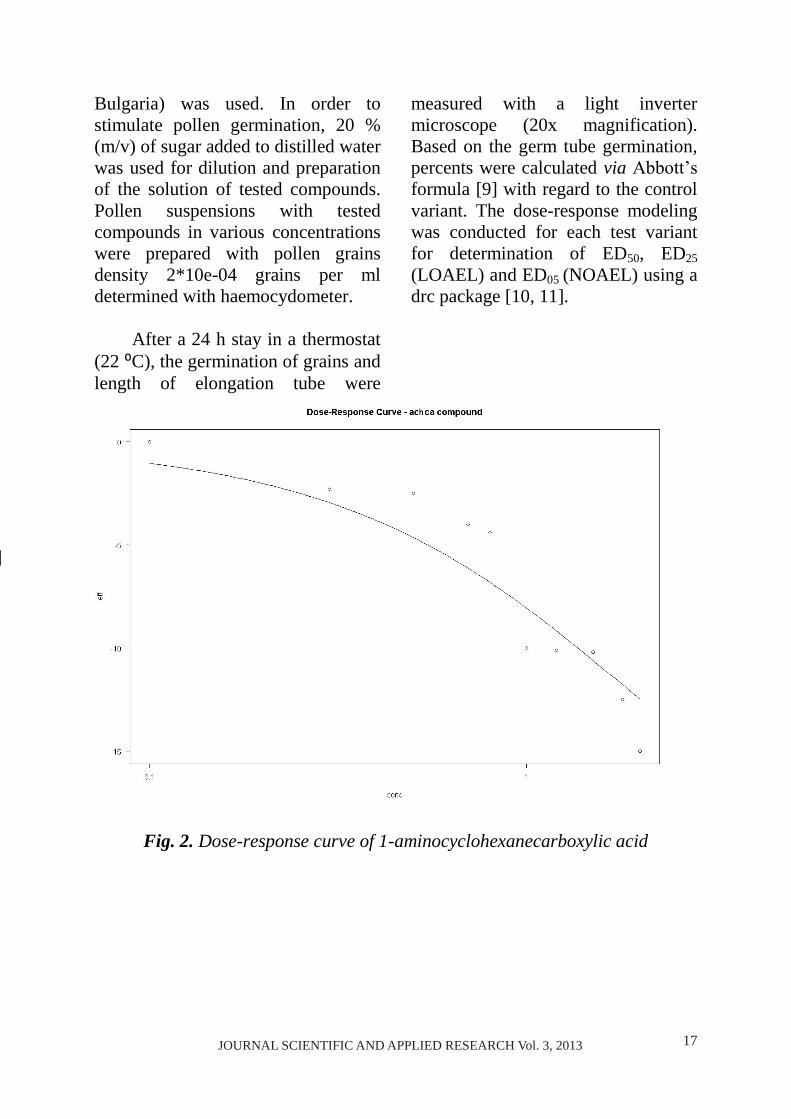
measured with a light inverter microscope (20x magnification). Based on the germ tube germination, percents were calculated via Abbott’s formula [�] with regard to the control variant. The dose-response modeling was conducted for each test variant for determination of ED�0, ED2� (LOAEL) and ED0� (NOAEL) using a drc package [�0, ��].
Fig. 2. Dose-response curve of 1-aminocyclohexanecarboxylic acid
��JOURNAL SCIENTIFIC AND APPLIED RESEARCH Vol. 3, 20�3JOURNAL SCIENTIFIC AND APPLIED RESEARCH Vol. 3, 20�3
value: ED�0, ED2� (LOAEL), ED0� (NOAEL). In the past two decades, pollen grains and pollen tubes of various plant species have been used to determine the cytotoxic effects of environmental pollutants [�].
Sour cherry (Cerasus vulgaris, Prunus cerausus, tart cherry) is a very popular and important orchard culture for the food industry. The sour cherry is cultivated in all parts of Bulgaria, especially near the towns of Sofia, Pazardzik and Plovdiv district [�].
We are examining the possible deleterious effects of cyclohexanespiro-�-hydantoin and �-aminocyclohexanecarboxylic acid to sour cherry pollen in the current study.
II. Materials and methods II.1. Synthetic compounds All chemicals used were
purchased from Merck and Sigma-Aldrich.
The cyclohexanespiro-�-hydantoin (Fig. �, a) was synthesized via the Bucherer-Lieb method [�].
The �-aminocyclohexanecar-boxylic acid (Fig. �, b) was obtained in accordance with Stoyanov and Marinov [�].
Melting points were determined with a Koffler apparatus and with a digital melting point apparatus SMP �0.
Elemental analysis data were obtained with an automatic analyzer Carlo Erba ��0�.
IR spectra were taken on spectrometers Bruker-��3 and Perkin-Elmer FTIR-��00 in KBr discs.
NMR spectra were taken on a
Bruker DRX-2�0 spectrometer, operating at 2�0.�3 and �2.�0 MHz for �H and �3C, respectively, and on a Bruker Avance II + �00 MHz spectrometer, operating at �00.�30 and ��0.�03 MHz for �H and �3C, respectively, using the standard Bruker software. Chemical shifts were referenced to tetramethylsilane (TMS). Measurements were carried out at ambient temperature.
a)
cyclohexanespiro-�-hydantoin
(chsh)
b) �-aminocyclohexane-
carboxylic acid (achca)
Fig. 1. Structures of the compounds The products obtained were
characterized by physicochemical parameters, IR and NMR spectral data. The results obtained from these analyses are identical with the previously published in the literature [3, �].
II.2. Ecotoxicological tests Fresh collected pollen from a �
year old sour cherry tree of the Oblacinska variety (which is the most popular sour cherry variety in
JOURNAL SCIENTIFIC AND APPLIED RESEARCH Vol. 3, 20�3
Bulgaria) was used. In order to stimulate pollen germination, 20 % (m/v) of sugar added to distilled water was used for dilution and preparation of the solution of tested compounds. Pollen suspensions with tested compounds in various concentrations were prepared with pollen grains density 2*�0e-0� grains per ml determined with haemocydometer.
After a 2� h stay in a thermostat
(22 ⁰C), the germination of grains and length of elongation tube were
measured with a light inverter microscope (20x magnification). Based on the germ tube germination, percents were calculated via Abbott’s formula [�] with regard to the control variant. The dose-response modeling was conducted for each test variant for determination of ED�0, ED2� (LOAEL) and ED0� (NOAEL) using a drc package [�0, ��].
Fig. 2. Dose-response curve of 1-aminocyclohexanecarboxylic acid
�� JOURNAL SCIENTIFIC AND APPLIED RESEARCH Vol. 3, 20�3JOURNAL SCIENTIFIC AND APPLIED RESEARCH Vol. 3, 20�3
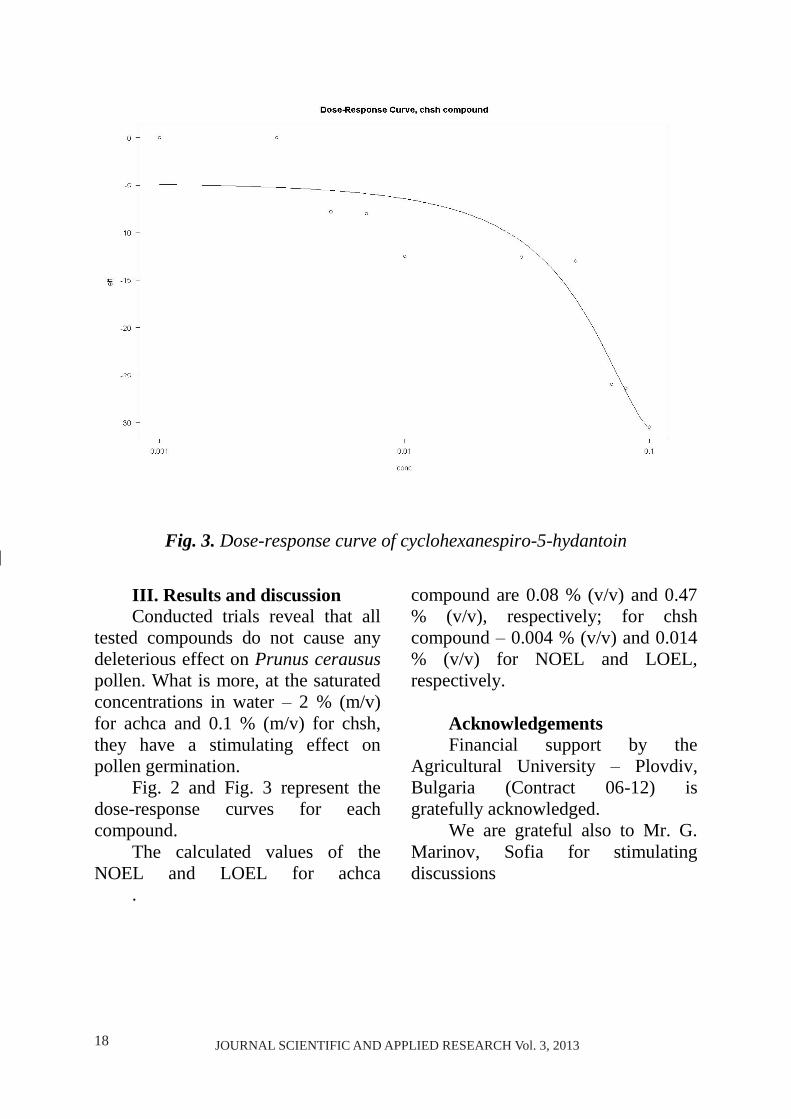
Fig. 3. Dose-response curve of cyclohexanespiro-5-hydantoin
III. Results and discussion Conducted trials reveal that all
tested compounds do not cause any deleterious effect on Prunus cerausus pollen. What is more, at the saturated concentrations in water – 2 % (m/v) for achca and 0.� % (m/v) for chsh, they have a stimulating effect on pollen germination.
Fig. 2 and Fig. 3 represent the dose-response curves for each compound.
The calculated values of the NOEL and LOEL for achca
compound are 0.0� % (v/v) and 0.�� % (v/v), respectively; for chsh compound – 0.00� % (v/v) and 0.0�� % (v/v) for NOEL and LOEL, respectively.
Acknowledgements Financial support by the
Agricultural University – Plovdiv, Bulgaria (Contract 0�-�2) is gratefully acknowledged.
We are grateful also to Mr. G. Marinov, Sofia for stimulating discussions
.
JOURNAL SCIENTIFIC AND APPLIED RESEARCH Vol. 3, 20�3
References [�] Oldfield, W., C. H. Cashin,
����. The chemistry and pharmacology of a Series of cycloalkanespiro-�'-hydantoins. J. Med. Chem., �, 23�-2��.
[2] Aoyagi, M., B. W. Agranoff, L. C. Washburn, Q. R. Smith, ����. Blood-brain barrier transport of �-aminocyclohexanecarboxylic acid, a nonmetabolizable amino acid for in vivo studies of brain transport. J. Neurochem., �0, �220-�22�.
[3] Enchev, V., N. Stoyanov, V. Mateva, J. Popova, M. Kashchieva, B. Aleksiev, M. Mitewa, ����. Copper (II) complexes of spirohydantoins. Synthesis, quantum-chemical, and spectroscopic study. Struct. Chem., �0 (�), 3��-3��.
[�] Ahmedova, A., P. Marinova, G. Tyuliev, M. Mitewa, 200�. Copper complexes of two cycloalkanespiro-�-dithiohydanto-ins: Synthesis, oxidation states and characterization. Inorg. Chem. Commun., ��, ���-���.
[�] Kristen, U., R. Kappler,
����. The pollen tube growth test. In vitro toxicity testing protocols. Methods Mol. Biol., �3, ���-���.
[�] Mitov, P., G. Pepeljankov, D. Djakov, ����. Orchard plants breeding. VSI-Plovdiv, �2�.
[�] Bucherer, H. T., V. Lieb, 1934. Über die bildung substituierter hydantoine aus aldehyden und ketonen. Synthese von hydantoinen. J. Prakt. Chem., ���, �-�3.
[�] Stoyanov, N., M. Marinov, 20�2. Two methods for spirothiohydantoin synthesis. Acta Chim. Slov., �� (3), ��0-���.
[�] Abbot, S., ��2�. A method for computing the effectiveness of an insecticide. J. Econ. Enthomol., ��, 3��-2��.
[�0] R Foundation for Statistical Computing, Vienna, Austria. ISBN 3-�000��-0�-0, URL http://www.R-project.org/).
[��] Ritz, C., J. C. Streibig, 200�. Bioassay analysis using R. J. Statist. Software, Vol �2, Issue �.
��JOURNAL SCIENTIFIC AND APPLIED RESEARCH Vol. 3, 20�3JOURNAL SCIENTIFIC AND APPLIED RESEARCH Vol. 3, 20�3
Fig. 3. Dose-response curve of cyclohexanespiro-5-hydantoin
III. Results and discussion Conducted trials reveal that all
tested compounds do not cause any deleterious effect on Prunus cerausus pollen. What is more, at the saturated concentrations in water – 2 % (m/v) for achca and 0.� % (m/v) for chsh, they have a stimulating effect on pollen germination.
Fig. 2 and Fig. 3 represent the dose-response curves for each compound.
The calculated values of the NOEL and LOEL for achca
compound are 0.0� % (v/v) and 0.�� % (v/v), respectively; for chsh compound – 0.00� % (v/v) and 0.0�� % (v/v) for NOEL and LOEL, respectively.
Acknowledgements Financial support by the
Agricultural University – Plovdiv, Bulgaria (Contract 0�-�2) is gratefully acknowledged.
We are grateful also to Mr. G. Marinov, Sofia for stimulating discussions
.
JOURNAL SCIENTIFIC AND APPLIED RESEARCH Vol. 3, 20�3
References [�] Oldfield, W., C. H. Cashin,
����. The chemistry and pharmacology of a Series of cycloalkanespiro-�'-hydantoins. J. Med. Chem., �, 23�-2��.
[2] Aoyagi, M., B. W. Agranoff, L. C. Washburn, Q. R. Smith, ����. Blood-brain barrier transport of �-aminocyclohexanecarboxylic acid, a nonmetabolizable amino acid for in vivo studies of brain transport. J. Neurochem., �0, �220-�22�.
[3] Enchev, V., N. Stoyanov, V. Mateva, J. Popova, M. Kashchieva, B. Aleksiev, M. Mitewa, ����. Copper (II) complexes of spirohydantoins. Synthesis, quantum-chemical, and spectroscopic study. Struct. Chem., �0 (�), 3��-3��.
[�] Ahmedova, A., P. Marinova, G. Tyuliev, M. Mitewa, 200�. Copper complexes of two cycloalkanespiro-�-dithiohydanto-ins: Synthesis, oxidation states and characterization. Inorg. Chem. Commun., ��, ���-���.
[�] Kristen, U., R. Kappler,
����. The pollen tube growth test. In vitro toxicity testing protocols. Methods Mol. Biol., �3, ���-���.
[�] Mitov, P., G. Pepeljankov, D. Djakov, ����. Orchard plants breeding. VSI-Plovdiv, �2�.
[�] Bucherer, H. T., V. Lieb, 1934. Über die bildung substituierter hydantoine aus aldehyden und ketonen. Synthese von hydantoinen. J. Prakt. Chem., ���, �-�3.
[�] Stoyanov, N., M. Marinov, 20�2. Two methods for spirothiohydantoin synthesis. Acta Chim. Slov., �� (3), ��0-���.
[�] Abbot, S., ��2�. A method for computing the effectiveness of an insecticide. J. Econ. Enthomol., ��, 3��-2��.
[�0] R Foundation for Statistical Computing, Vienna, Austria. ISBN 3-�000��-0�-0, URL http://www.R-project.org/).
[��] Ritz, C., J. C. Streibig, 200�. Bioassay analysis using R. J. Statist. Software, Vol �2, Issue �.
20 JOURNAL SCIENTIFIC AND APPLIED RESEARCH Vol. 3, 20�3JOURNAL SCIENTIFIC AND APPLIED RESEARCH Vol. 3, 20�3
Original Contribution
Journal scientific and applied research, vol. 3, 20�3 Association Scientific and Applied Research
International Journal ISSN �3��-�2��
PHYTOTOXICOLOGICAL STUDY OF SOME SPIROHYDANTOINS AND THEIR DERIVATIVES TOWARDS PSEUDOCROSSIDIUM
REVOLUTUM
Donyo H. Ganchev,a Marin N. Marinov,a Stefan V. Krustev,a Milena R. Zlateva,a Nadezhda I. Atanasova a and Neyko M. Stoyanov b
a FACULTY OF PLANT PROTECTION AND AGROECOLOGY,
AGRICULTURAL UNIVERSITY – PLOVDIV b DEPARTMENT OF CHEMISTRY AND CHEMICAL TECHNOLOGY,
UNIVERSITY OF RUSE - BRANCH RAZGRAD
Abstract: This article presents a novel ecotoxicological investigation of probable deleterious effect of cyclopentanespiro-5-hydantoin, cyclohexanespiro-5-hydantoin, cyclopentanespiro-5-(2,4-dithiohydantoin) and 1-aminocyclopentanecarboxylic acid towards some of the most widespread moss species in the World – Pseudocrossidium revolutum.. Dose-response modeling was carried out by R language for Statistical Computing, drc package.
Key words: spirohydantoins, Pseudocrossidium revolutum , phytotoxicology, drc, R language
I. Introduction Hydantoins and their different
derivatives are compounds which possess antitumor [3], anticonvulsant, antiepileptic [�], antiarrhythmic [�] and aldose reductase inhibiting properties [�, 2].
The interest in studying these substances is also due to their good ability to coordinate ions of transitional metals and to participate in obtaining complexes [�, �] which is related to future investigations of their potential biological activity.
Pseudocrossidium revolutum (Pseudocrossidium moss) is frequently found in variety of habitats as mortar or limestone walls,
limestone outcrops and quarries and other stony grounds. It is a fairly common moss species in Europe and the World [�, �].
Moss species as common terrestrial habitats are extremely vulnerable when exposed to various toxicants [�0, ��]. However, the moss has a significant role in maintaining equilibrium of ecosystems.
This paper represents a novel ecotoxicological investigation of probable deleterious effects of cyclopentanespiro-�-hydantoin, cy-clohexanespiro-�-hydantoin, cyclo-pentanespiro-�-(2,�-dithiohydantoin) and �-aminocyclopentanecarboxylic acid towards some of the most
JOURNAL SCIENTIFIC AND APPLIED RESEARCH Vol. 3, 20�3
widespread moss species in the World Pseudocrossidium revolutum.
II. Materials and methods II.1. Synthetic compounds All chemicals used were
purchased from Merck and Sigma-Aldrich.
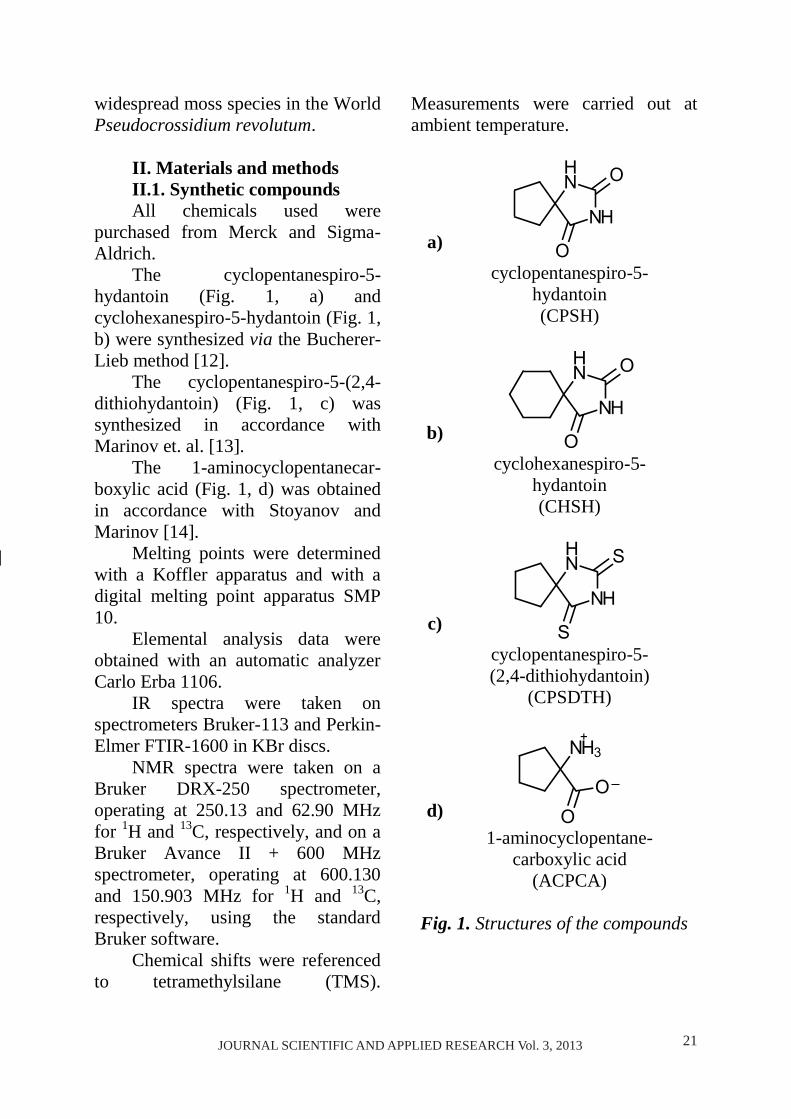
The cyclopentanespiro-�-hydantoin (Fig. �, a) and cyclohexanespiro-�-hydantoin (Fig. �, b) were synthesized via the Bucherer-Lieb method [�2].
The cyclopentanespiro-�-(2,�-dithiohydantoin) (Fig. �, c) was synthesized in accordance with Marinov et. al. [�3].
The �-aminocyclopentanecar-boxylic acid (Fig. �, d) was obtained in accordance with Stoyanov and Marinov [��].
Melting points were determined with a Koffler apparatus and with a digital melting point apparatus SMP �0.
Elemental analysis data were obtained with an automatic analyzer Carlo Erba ��0�.
IR spectra were taken on spectrometers Bruker-��3 and Perkin-Elmer FTIR-��00 in KBr discs.
NMR spectra were taken on a Bruker DRX-2�0 spectrometer, operating at 2�0.�3 and �2.�0 MHz for �H and �3C, respectively, and on a Bruker Avance II + �00 MHz spectrometer, operating at �00.�30 and ��0.�03 MHz for �H and �3C, respectively, using the standard Bruker software.
Chemical shifts were referenced to tetramethylsilane (TMS).
Measurements were carried out at ambient temperature.
a)
cyclopentanespiro-�-hydantoin (CPSH)
b)
cyclohexanespiro-�-hydantoin (CHSH)
c)
cyclopentanespiro-�- (2,�-dithiohydantoin)
(CPSDTH)
d) �-aminocyclopentane-
carboxylic acid (ACPCA)
Fig. 1. Structures of the compounds
2�JOURNAL SCIENTIFIC AND APPLIED RESEARCH Vol. 3, 20�3JOURNAL SCIENTIFIC AND APPLIED RESEARCH Vol. 3, 20�3
Original Contribution
Journal scientific and applied research, vol. 3, 20�3 Association Scientific and Applied Research
International Journal ISSN �3��-�2��
PHYTOTOXICOLOGICAL STUDY OF SOME SPIROHYDANTOINS AND THEIR DERIVATIVES TOWARDS PSEUDOCROSSIDIUM
REVOLUTUM
Donyo H. Ganchev,a Marin N. Marinov,a Stefan V. Krustev,a Milena R. Zlateva,a Nadezhda I. Atanasova a and Neyko M. Stoyanov b
a FACULTY OF PLANT PROTECTION AND AGROECOLOGY,
AGRICULTURAL UNIVERSITY – PLOVDIV b DEPARTMENT OF CHEMISTRY AND CHEMICAL TECHNOLOGY,
UNIVERSITY OF RUSE - BRANCH RAZGRAD
Abstract: This article presents a novel ecotoxicological investigation of probable deleterious effect of cyclopentanespiro-5-hydantoin, cyclohexanespiro-5-hydantoin, cyclopentanespiro-5-(2,4-dithiohydantoin) and 1-aminocyclopentanecarboxylic acid towards some of the most widespread moss species in the World – Pseudocrossidium revolutum.. Dose-response modeling was carried out by R language for Statistical Computing, drc package.
Key words: spirohydantoins, Pseudocrossidium revolutum , phytotoxicology, drc, R language
I. Introduction Hydantoins and their different
derivatives are compounds which possess antitumor [3], anticonvulsant, antiepileptic [�], antiarrhythmic [�] and aldose reductase inhibiting properties [�, 2].
The interest in studying these substances is also due to their good ability to coordinate ions of transitional metals and to participate in obtaining complexes [�, �] which is related to future investigations of their potential biological activity.
Pseudocrossidium revolutum (Pseudocrossidium moss) is frequently found in variety of habitats as mortar or limestone walls,
limestone outcrops and quarries and other stony grounds. It is a fairly common moss species in Europe and the World [�, �].
Moss species as common terrestrial habitats are extremely vulnerable when exposed to various toxicants [�0, ��]. However, the moss has a significant role in maintaining equilibrium of ecosystems.
This paper represents a novel ecotoxicological investigation of probable deleterious effects of cyclopentanespiro-�-hydantoin, cy-clohexanespiro-�-hydantoin, cyclo-pentanespiro-�-(2,�-dithiohydantoin) and �-aminocyclopentanecarboxylic acid towards some of the most
JOURNAL SCIENTIFIC AND APPLIED RESEARCH Vol. 3, 20�3
widespread moss species in the World Pseudocrossidium revolutum.
II. Materials and methods II.1. Synthetic compounds All chemicals used were
purchased from Merck and Sigma-Aldrich.
The cyclopentanespiro-�-hydantoin (Fig. �, a) and cyclohexanespiro-�-hydantoin (Fig. �, b) were synthesized via the Bucherer-Lieb method [�2].
The cyclopentanespiro-�-(2,�-dithiohydantoin) (Fig. �, c) was synthesized in accordance with Marinov et. al. [�3].
The �-aminocyclopentanecar-boxylic acid (Fig. �, d) was obtained in accordance with Stoyanov and Marinov [��].
Melting points were determined with a Koffler apparatus and with a digital melting point apparatus SMP �0.
Elemental analysis data were obtained with an automatic analyzer Carlo Erba ��0�.
IR spectra were taken on spectrometers Bruker-��3 and Perkin-Elmer FTIR-��00 in KBr discs.
NMR spectra were taken on a Bruker DRX-2�0 spectrometer, operating at 2�0.�3 and �2.�0 MHz for �H and �3C, respectively, and on a Bruker Avance II + �00 MHz spectrometer, operating at �00.�30 and ��0.�03 MHz for �H and �3C, respectively, using the standard Bruker software.
Chemical shifts were referenced to tetramethylsilane (TMS).
Measurements were carried out at ambient temperature.
a)
cyclopentanespiro-�-hydantoin (CPSH)
b)
cyclohexanespiro-�-hydantoin (CHSH)
c)
cyclopentanespiro-�- (2,�-dithiohydantoin)
(CPSDTH)
d) �-aminocyclopentane-
carboxylic acid (ACPCA)
Fig. 1. Structures of the compounds
22 JOURNAL SCIENTIFIC AND APPLIED RESEARCH Vol. 3, 20�3JOURNAL SCIENTIFIC AND APPLIED RESEARCH Vol. 3, 20�3
All products obtained were characterized by physicochemical parameters, IR and NMR spectral data. The results obtained from these analyses are identical to previously published in the literature [�, �3, ��].
II.2. Ecotoxicological tests Naturally occurring moss
colonies were taken from stony habitats in the town of Plovdiv, Bulgaria. The colonies were transferred in a standard �0 mm diameter Petri dishes with filter paper covered bottoms soaked in distilled water for � week, for acclimatization under laboratory conditions.
Ten different dilutions were prepared from each test compound. Filter paper disks were soaked in these solutions and were subsequently placed at the bottom of Petri dishes.
Saturated concentrations of the compounds in water were as follows:
CPSH – � %;
CHSH – 0.� %;
CPSDTH – 0.02� %;
ACPCA – 0.� %.
A 20 mm piece of moss colony
was placed in each Petri dish. The moss pieces were preliminarily weighed and soaked for �0 s in given test solution. Distilled water was used as a control variant.
After � days an observation of
visual phytotoxic manifestations was made in regard to whitening, chlorosis and necrosis. Weight of colonies was also measured.
Based on the weight we used the formula of Abbot [��] to calculate the percent inhibition. A dose-response modeling was conducted with R language for Statistical Computing – drc package [��, ��].
III. Results and discussion All tested compounds when in a
saturated concentration in water did not have any phytotoxicological adverse effect on tested plants.
However, when soragosilicone surfactant Silwet ®L-�� – ��.� % polyalkilene oxide modifed heptamethyltrisiloxane (Hellena Chemical Company) was added to each dilution in order to improve the wetting ability of the solutions at 0.2� % v/v concentration, all tested variants (including control variant) manifest extremely severe phytotoxicity including total necrosis of plants and a weight loss between ��-�0 %.
The control variant which was set without Silwet ®L-�� did not show any signs of phytotoxicity.
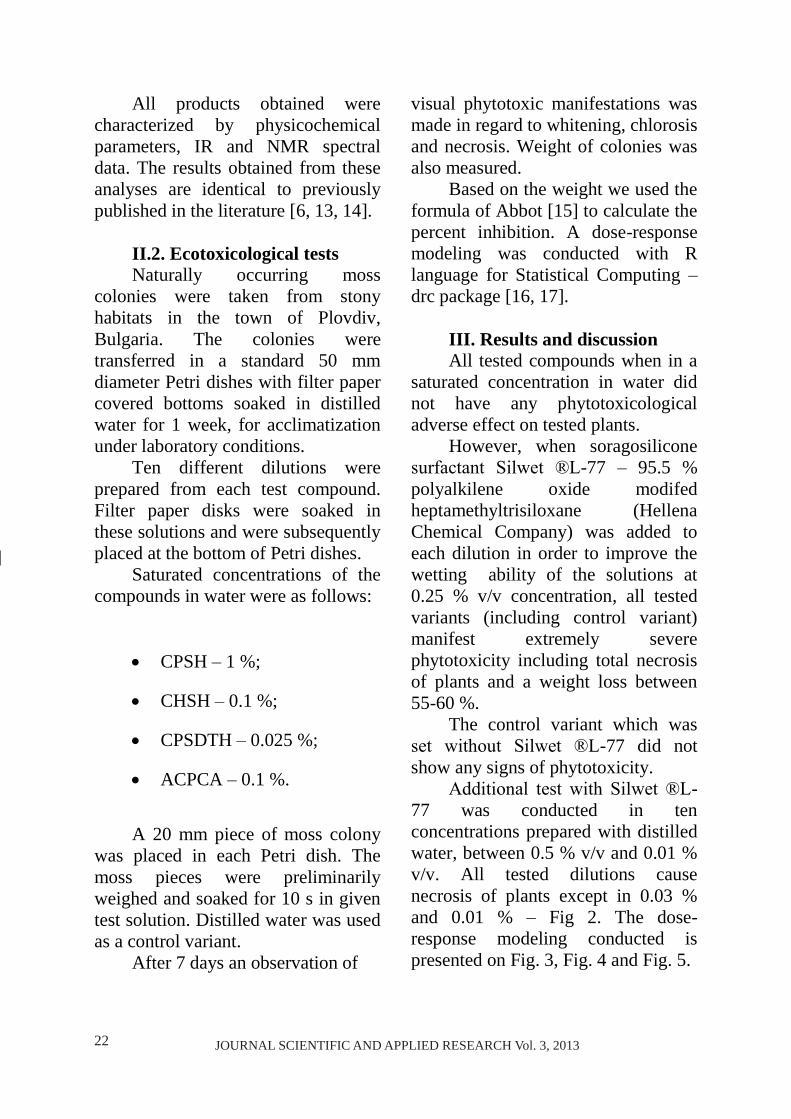
Additional test with Silwet ®L-�� was conducted in ten concentrations prepared with distilled water, between 0.� % v/v and 0.0� % v/v. All tested dilutions cause necrosis of plants except in 0.03 % and 0.0� % – Fig 2. The dose-response modeling conducted is presented on Fig. 3, Fig. � and Fig. �.
JOURNAL SCIENTIFIC AND APPLIED RESEARCH Vol. 3, 20�3
Fig. 2. Control variant, Silwet ®L-77 – 0.1 %, Silwet ®L-77 – 0.01 %
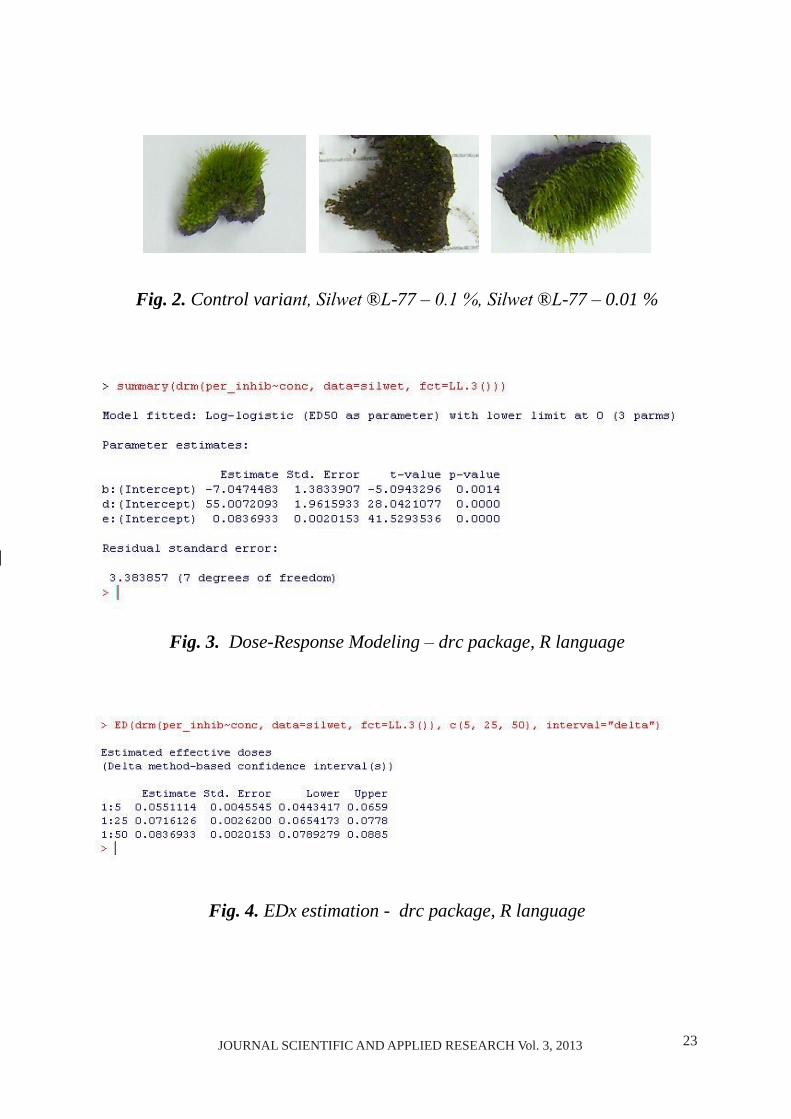
Fig. 3. Dose-Response Modeling – drc package, R language
Fig. 4. EDx estimation - drc package, R language
23JOURNAL SCIENTIFIC AND APPLIED RESEARCH Vol. 3, 20�3JOURNAL SCIENTIFIC AND APPLIED RESEARCH Vol. 3, 20�3
All products obtained were characterized by physicochemical parameters, IR and NMR spectral data. The results obtained from these analyses are identical to previously published in the literature [�, �3, ��].
II.2. Ecotoxicological tests Naturally occurring moss
colonies were taken from stony habitats in the town of Plovdiv, Bulgaria. The colonies were transferred in a standard �0 mm diameter Petri dishes with filter paper covered bottoms soaked in distilled water for � week, for acclimatization under laboratory conditions.
Ten different dilutions were prepared from each test compound. Filter paper disks were soaked in these solutions and were subsequently placed at the bottom of Petri dishes.
Saturated concentrations of the compounds in water were as follows:
CPSH – � %;
CHSH – 0.� %;
CPSDTH – 0.02� %;
ACPCA – 0.� %.
A 20 mm piece of moss colony
was placed in each Petri dish. The moss pieces were preliminarily weighed and soaked for �0 s in given test solution. Distilled water was used as a control variant.
After � days an observation of
visual phytotoxic manifestations was made in regard to whitening, chlorosis and necrosis. Weight of colonies was also measured.
Based on the weight we used the formula of Abbot [��] to calculate the percent inhibition. A dose-response modeling was conducted with R language for Statistical Computing – drc package [��, ��].
III. Results and discussion All tested compounds when in a
saturated concentration in water did not have any phytotoxicological adverse effect on tested plants.
However, when soragosilicone surfactant Silwet ®L-�� – ��.� % polyalkilene oxide modifed heptamethyltrisiloxane (Hellena Chemical Company) was added to each dilution in order to improve the wetting ability of the solutions at 0.2� % v/v concentration, all tested variants (including control variant) manifest extremely severe phytotoxicity including total necrosis of plants and a weight loss between ��-�0 %.
The control variant which was set without Silwet ®L-�� did not show any signs of phytotoxicity.
Additional test with Silwet ®L-�� was conducted in ten concentrations prepared with distilled water, between 0.� % v/v and 0.0� % v/v. All tested dilutions cause necrosis of plants except in 0.03 % and 0.0� % – Fig 2. The dose-response modeling conducted is presented on Fig. 3, Fig. � and Fig. �.
JOURNAL SCIENTIFIC AND APPLIED RESEARCH Vol. 3, 20�3
Fig. 2. Control variant, Silwet ®L-77 – 0.1 %, Silwet ®L-77 – 0.01 %
Fig. 3. Dose-Response Modeling – drc package, R language
Fig. 4. EDx estimation - drc package, R language
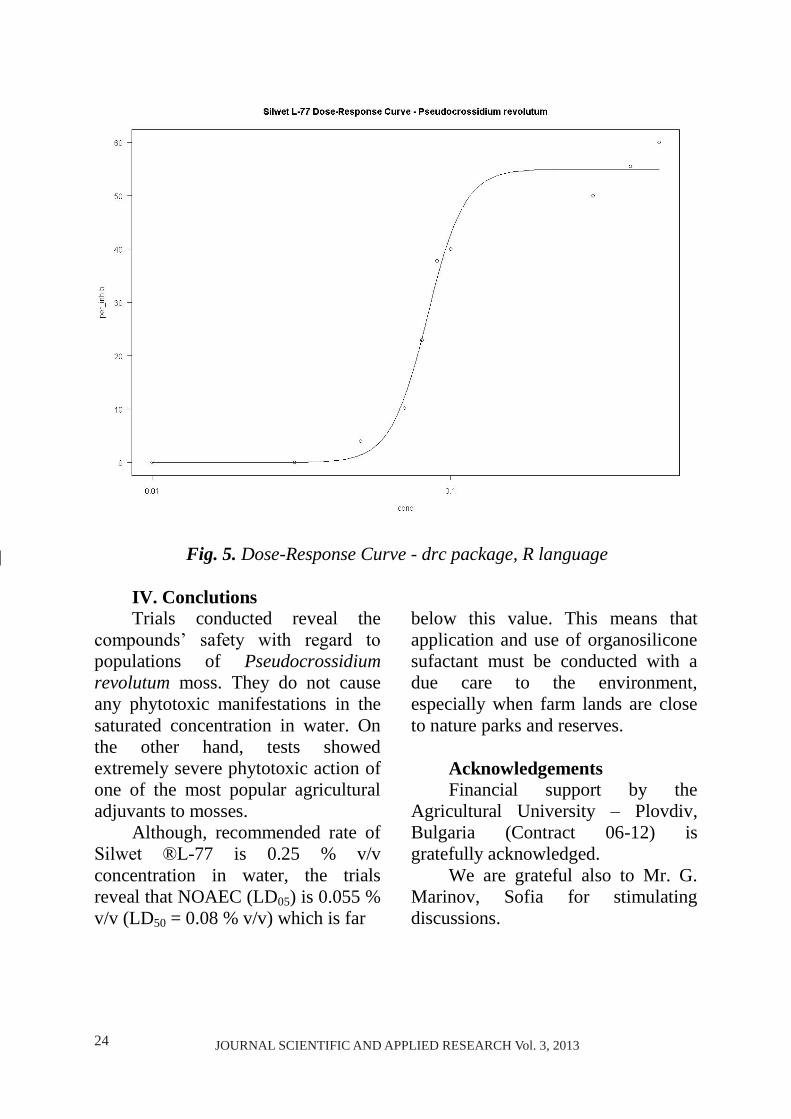
2� JOURNAL SCIENTIFIC AND APPLIED RESEARCH Vol. 3, 20�3JOURNAL SCIENTIFIC AND APPLIED RESEARCH Vol. 3, 20�3
Fig. 5. Dose-Response Curve - drc package, R language IV. Conclutions Trials conducted reveal the
compounds’ safety with regard to populations of Pseudocrossidium revolutum moss. Тhey do not cause any phytotoxic manifestations in the saturated concentration in water. On the other hand, tests showed extremely severe phytotoxic action of one of the most popular agricultural adjuvants to mosses.
Although, recommended rate of Silwet ®L-�� is 0.2� % v/v concentration in water, the trials reveal that NOAEC (LD0�) is 0.0�� % v/v (LD�0 = 0.0� % v/v) which is far
below this value. This means that application and use of organosilicone sufactant must be conducted with a due care to the environment, especially when farm lands are close to nature parks and reserves.
Acknowledgements Financial support by the
Agricultural University – Plovdiv, Bulgaria (Contract 0�-�2) is gratefully acknowledged.
We are grateful also to Mr. G. Marinov, Sofia for stimulating discussions.
JOURNAL SCIENTIFIC AND APPLIED RESEARCH Vol. 3, 20�3
References [�] Deen, D. F., T. Hoshino, M.
E. Williams, K. Nomura and P. M. Bartle, ����. Response of �L tumor cells in vitro to spirohydantoin mustard. Cancer Res., 3�, �33�-�3�0.
[2] Oldfield, W., C. H. Cashin, ����. The chemistry and pharmacology of a series of cycloalkanespiro-�'-hydantoins. J. Med. Chem., �, 23�-2��.
[3] Kiec-Kononowicz, K., K. Stadnicka, A. Mitka, E. Pekala, B. Filipek, J. Sapa and M. Zygmunt, 2003. Synthesis, structure and antiarrhythmic properties evaluation of new basic derivatives of �,�-diphenylhydantoin. Eur. J. Med. Chem., 3�, ���-���.
[�] Schnur, R. C., ����. U. S. Patent �������.
[�] Sarges, R., R. C. Schnur, J. L. Belletire and M. J. Peterson, ����. Spiro hydantoin aldose reductase inhibitors. J. Med. Chem., 3�, 230-2�3.
[�] Enchev, V., N. Stoyanov, V. Mateva, J. Popova, M. Kashchieva, B. Aleksiev, M. Mitewa, ����. Copper (II) complexes of spirohydantoins. Synthesis, quantum-chemical, and spectroscopic study. Struct. Chem., �0 (�), 3��-3��.
[�] Ahmedova, A., P. Marinova, G. Tyuliev, M. Mitewa, 200�. Copper complexes of two cycloalkanespiro-�-dithiohydanto-ins: Synthesis, oxidation states and characterization. Inorg. Chem. Commun., ��, ���-���.
[�] Ganeva, A., ����. Notes on the distribution of Mediterranean-Atlantic bryophytes in Bulgaria. Bocconea, �, ��3-���.
[9] Sabovljević M., 2006. Checklist of mosses of Croatia. Arch. Biol. Sci., Belgrade, �� (�), ��-�3.
[�0] Zechmeister H., A. Tribsch, D. Moser, T. Wrbka, 2002. Distribution of endangered bryophytes in Austrian agricultural landscapes. Biol. Cons. �03 (2), ��3–��2.
[��] Lepp, N. W., D. Salmon, ����. A field study of the ecotoxicology of copper to bryophytes. Environ. Pollut., �0� (2), ��3–���.
[�2] Bucherer, H. T., V. Lieb, 1934. Über die bildung substituierter hydantoine aus aldehyden und ketonen. Synthese von hydantoinen. J. Prakt. Chem., ���, �-�3.
[�3] Marinov, M., S. Minchev, N. Stoyanov, G. Ivanova, M. Spassova, V. Enchev, 200�. Synthesis, spectroscopic characterization and ab initio investigation of thioanalogues of spirohydantoins. Croat. Chem. Acta, ��, �-��.
[��] Stoyanov, N., M. Marinov, 20�2. Two methods for spirothiohydantoin synthesis. Acta Chim. Slov., �� (3), ��0-���.
[��] Abbot, S., ��2�. A method for computing the effectiveness of an insecticide. J. Econ. Enthomol., ��, 3��-2��.
[��] R Foundation for Statistical Computing, Vienna, Austria. ISBN 3-�000��-0�-0, URL http://www.R-project.org/).
[��] Ritz, C., J. C. Streibig, 200�. Bioassay analysis using R. J. Statist. Software, Vol �2, Issue �.
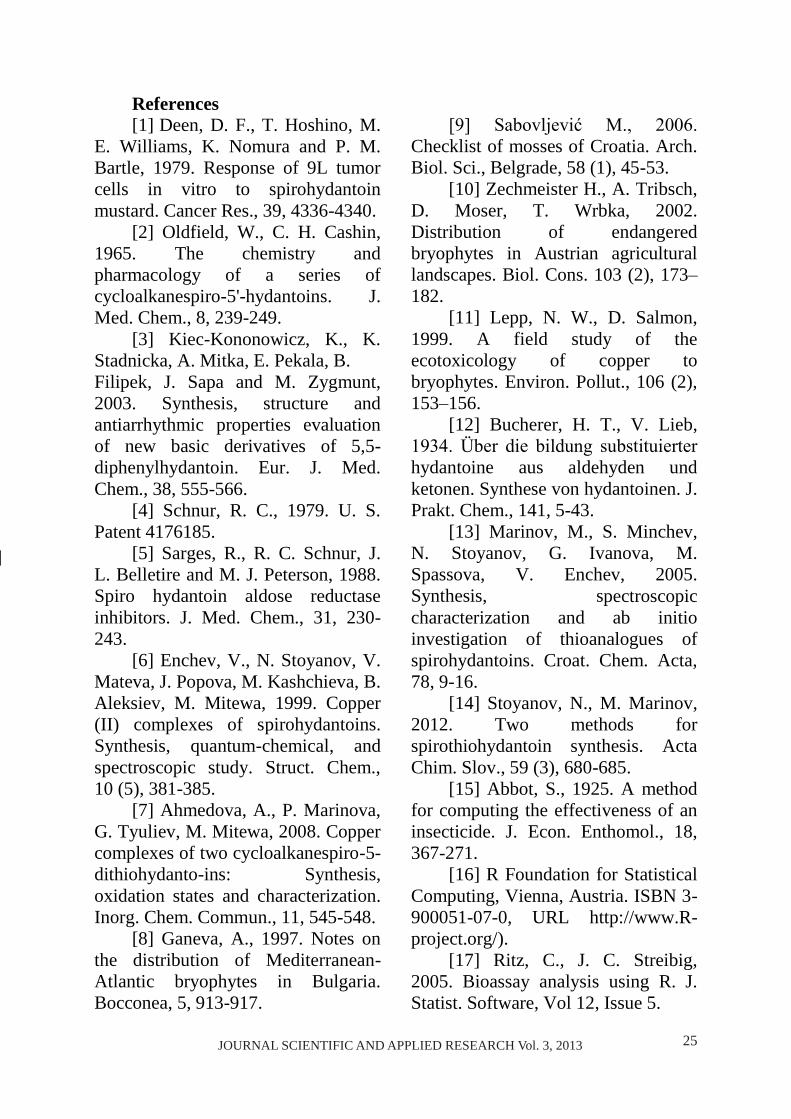
2�JOURNAL SCIENTIFIC AND APPLIED RESEARCH Vol. 3, 20�3JOURNAL SCIENTIFIC AND APPLIED RESEARCH Vol. 3, 20�3
Fig. 5. Dose-Response Curve - drc package, R language IV. Conclutions Trials conducted reveal the
compounds’ safety with regard to populations of Pseudocrossidium revolutum moss. Тhey do not cause any phytotoxic manifestations in the saturated concentration in water. On the other hand, tests showed extremely severe phytotoxic action of one of the most popular agricultural adjuvants to mosses.
Although, recommended rate of Silwet ®L-�� is 0.2� % v/v concentration in water, the trials reveal that NOAEC (LD0�) is 0.0�� % v/v (LD�0 = 0.0� % v/v) which is far
below this value. This means that application and use of organosilicone sufactant must be conducted with a due care to the environment, especially when farm lands are close to nature parks and reserves.
Acknowledgements Financial support by the
Agricultural University – Plovdiv, Bulgaria (Contract 0�-�2) is gratefully acknowledged.
We are grateful also to Mr. G. Marinov, Sofia for stimulating discussions.
JOURNAL SCIENTIFIC AND APPLIED RESEARCH Vol. 3, 20�3
References [�] Deen, D. F., T. Hoshino, M.
E. Williams, K. Nomura and P. M. Bartle, ����. Response of �L tumor cells in vitro to spirohydantoin mustard. Cancer Res., 3�, �33�-�3�0.
[2] Oldfield, W., C. H. Cashin, ����. The chemistry and pharmacology of a series of cycloalkanespiro-�'-hydantoins. J. Med. Chem., �, 23�-2��.
[3] Kiec-Kononowicz, K., K. Stadnicka, A. Mitka, E. Pekala, B. Filipek, J. Sapa and M. Zygmunt, 2003. Synthesis, structure and antiarrhythmic properties evaluation of new basic derivatives of �,�-diphenylhydantoin. Eur. J. Med. Chem., 3�, ���-���.
[�] Schnur, R. C., ����. U. S. Patent �������.
[�] Sarges, R., R. C. Schnur, J. L. Belletire and M. J. Peterson, ����. Spiro hydantoin aldose reductase inhibitors. J. Med. Chem., 3�, 230-2�3.
[�] Enchev, V., N. Stoyanov, V. Mateva, J. Popova, M. Kashchieva, B. Aleksiev, M. Mitewa, ����. Copper (II) complexes of spirohydantoins. Synthesis, quantum-chemical, and spectroscopic study. Struct. Chem., �0 (�), 3��-3��.
[�] Ahmedova, A., P. Marinova, G. Tyuliev, M. Mitewa, 200�. Copper complexes of two cycloalkanespiro-�-dithiohydanto-ins: Synthesis, oxidation states and characterization. Inorg. Chem. Commun., ��, ���-���.
[�] Ganeva, A., ����. Notes on the distribution of Mediterranean-Atlantic bryophytes in Bulgaria. Bocconea, �, ��3-���.
[9] Sabovljević M., 2006. Checklist of mosses of Croatia. Arch. Biol. Sci., Belgrade, �� (�), ��-�3.
[�0] Zechmeister H., A. Tribsch, D. Moser, T. Wrbka, 2002. Distribution of endangered bryophytes in Austrian agricultural landscapes. Biol. Cons. �03 (2), ��3–��2.
[��] Lepp, N. W., D. Salmon, ����. A field study of the ecotoxicology of copper to bryophytes. Environ. Pollut., �0� (2), ��3–���.
[�2] Bucherer, H. T., V. Lieb, 1934. Über die bildung substituierter hydantoine aus aldehyden und ketonen. Synthese von hydantoinen. J. Prakt. Chem., ���, �-�3.
[�3] Marinov, M., S. Minchev, N. Stoyanov, G. Ivanova, M. Spassova, V. Enchev, 200�. Synthesis, spectroscopic characterization and ab initio investigation of thioanalogues of spirohydantoins. Croat. Chem. Acta, ��, �-��.
[��] Stoyanov, N., M. Marinov, 20�2. Two methods for spirothiohydantoin synthesis. Acta Chim. Slov., �� (3), ��0-���.
[��] Abbot, S., ��2�. A method for computing the effectiveness of an insecticide. J. Econ. Enthomol., ��, 3��-2��.
[��] R Foundation for Statistical Computing, Vienna, Austria. ISBN 3-�000��-0�-0, URL http://www.R-project.org/).
[��] Ritz, C., J. C. Streibig, 200�. Bioassay analysis using R. J. Statist. Software, Vol �2, Issue �.
2� JOURNAL SCIENTIFIC AND APPLIED RESEARCH Vol. 3, 20�3JOURNAL SCIENTIFIC AND APPLIED RESEARCH Vol. 3, 20�3
Original Contribution
Journal scientific and applied research, vol. 3, 20�3 Association Scientific and Applied Research
International Journal ISSN �3��-�2��
ANALYTICAL APPARATUS AND PROCEDURE TO JUSTIFY THE ACTIONS IN THE MANAGEMENT OF ENVIRONMENTAL
SECURITY
Lubomir V. Vladimirov
University of Ruse, Agrarian and Industrial faculty, 8 Studentskastreet, Ruse 7017
[email protected] Abstract: An analytical apparatus and procedure to justify the protective actions and decisions in the
management of environmental security is proposed. It proves its efficiency and reliability. Ways for searching of optimal protective actions are justified. An areas of possible management actions are defined. For a selection of protective actions a criterion of effectiveness is introduced. There are rules for making decisions to protect the border environment offered.
Key words: environment, security, management, action. I. Introduction The environmental security is
the topic of this work, which is of national and international significance. Its solution requires a reasonable formulation of the objectives of the protective activities of planning, organizing, implementing, monitoring and regulation in the process of its managing.
Each stage of the management process requires taking decisions that have a specific character and value of responsibility, as they are directly related to the occurrence of injury among the objects in the environment of the population, air, water, soil, flora and fauna [�].
There is need of scientifically proven and tested models and
procedures for decision making. Through them, they can argue and establish the boundaries of environmentally danger phenomena, impacts and effects of the eligible areas of use of natural resources, investment projects, expertise and investigations, the design of systems and devices to protect the border environment management of environmental security.
The models and procedures are needed for the formation of rules, recommendations and instructions for behavior of the population management of complex environmental situations at the borders between countries, including other countries with no boundaries with the country of origin of the dangerous effects.
JOURNAL SCIENTIFIC AND APPLIED RESEARCH Vol. 3, 20�3
The purpose of this work is to propose an analytical apparatus and procedure to justify protective actions and decisions in the management of environmental security.
The problems to solve are: �. Identifying the areas of
possible management actions; 2. Choosing a way to search for
optimum performance on environmental security;
3. Selection of decisions on protective actions in the security of the environment.
II. Statement. In the management of
environmental security the searching of possible alternative actions for the protection of environmental impacts, impact assessment and selection of optimal management action plays a basic role. The selection of possible alternatives requires identification of areas of existence of multitudes of management actions D that contain
optimum actions o . This requires to
establish quasi-optimal alternative areas oi DD .
Formally, the selection of protective action is defined as the extrapolation of indefinite area of demand. In this case, one can explore a finite multitude D of possible areas of searching for the optimal protective action, that can be expressed as:
}D,...,D,D{D n21 It is assumed that the field
contains the optimal action, as DDD ioo . This
expression is a condition to select the optimum protective effect.
The ability to define the scope of protective measures iD , satisfying the condition of feasibility does not require proof. There are methods and tools for environmental protection which are verified and tested. Our studies [�,�] show that can be applied two ways:
�. Requirement for the searching of protective action initially to be made in a wider area D which gradually narrows until it comes to concrete protection matching the optimum.
2. The multitude D of the protective actions must gradually expand until it reaches the optimum
iD which is feasible and can be realized.
The disclosure of the optimum field of action oD in the multitude
iD can be defined in specific conditions and relationships that depend on the nature of the problem in environmental security. It is meant the finance, human resources, political support, regional policy, international trade and relations, and many other influencing factors.
Based on them it should be differentiated defensive line
io21 D},...,,{ built up, which is a prerequisite for finding the optimal actions. The practice leads to task for convergence of the process of seeking action in the multitude
oo D}{ of the action’s alternatives. The optimal field of
2�JOURNAL SCIENTIFIC AND APPLIED RESEARCH Vol. 3, 20�3JOURNAL SCIENTIFIC AND APPLIED RESEARCH Vol. 3, 20�3
Original Contribution
Journal scientific and applied research, vol. 3, 20�3 Association Scientific and Applied Research
International Journal ISSN �3��-�2��
ANALYTICAL APPARATUS AND PROCEDURE TO JUSTIFY THE ACTIONS IN THE MANAGEMENT OF ENVIRONMENTAL
SECURITY
Lubomir V. Vladimirov
University of Ruse, Agrarian and Industrial faculty, 8 Studentskastreet, Ruse 7017
[email protected] Abstract: An analytical apparatus and procedure to justify the protective actions and decisions in the
management of environmental security is proposed. It proves its efficiency and reliability. Ways for searching of optimal protective actions are justified. An areas of possible management actions are defined. For a selection of protective actions a criterion of effectiveness is introduced. There are rules for making decisions to protect the border environment offered.
Key words: environment, security, management, action. I. Introduction The environmental security is
the topic of this work, which is of national and international significance. Its solution requires a reasonable formulation of the objectives of the protective activities of planning, organizing, implementing, monitoring and regulation in the process of its managing.
Each stage of the management process requires taking decisions that have a specific character and value of responsibility, as they are directly related to the occurrence of injury among the objects in the environment of the population, air, water, soil, flora and fauna [�].
There is need of scientifically proven and tested models and
procedures for decision making. Through them, they can argue and establish the boundaries of environmentally danger phenomena, impacts and effects of the eligible areas of use of natural resources, investment projects, expertise and investigations, the design of systems and devices to protect the border environment management of environmental security.
The models and procedures are needed for the formation of rules, recommendations and instructions for behavior of the population management of complex environmental situations at the borders between countries, including other countries with no boundaries with the country of origin of the dangerous effects.
JOURNAL SCIENTIFIC AND APPLIED RESEARCH Vol. 3, 20�3
The purpose of this work is to propose an analytical apparatus and procedure to justify protective actions and decisions in the management of environmental security.
The problems to solve are: �. Identifying the areas of
possible management actions; 2. Choosing a way to search for
optimum performance on environmental security;
3. Selection of decisions on protective actions in the security of the environment.
II. Statement. In the management of
environmental security the searching of possible alternative actions for the protection of environmental impacts, impact assessment and selection of optimal management action plays a basic role. The selection of possible alternatives requires identification of areas of existence of multitudes of management actions D that contain
optimum actions o . This requires to
establish quasi-optimal alternative areas oi DD .
Formally, the selection of protective action is defined as the extrapolation of indefinite area of demand. In this case, one can explore a finite multitude D of possible areas of searching for the optimal protective action, that can be expressed as:
}D,...,D,D{D n21 It is assumed that the field
contains the optimal action, as DDD ioo . This
expression is a condition to select the optimum protective effect.
The ability to define the scope of protective measures iD , satisfying the condition of feasibility does not require proof. There are methods and tools for environmental protection which are verified and tested. Our studies [�,�] show that can be applied two ways:
�. Requirement for the searching of protective action initially to be made in a wider area D which gradually narrows until it comes to concrete protection matching the optimum.
2. The multitude D of the protective actions must gradually expand until it reaches the optimum
iD which is feasible and can be realized.
The disclosure of the optimum field of action oD in the multitude
iD can be defined in specific conditions and relationships that depend on the nature of the problem in environmental security. It is meant the finance, human resources, political support, regional policy, international trade and relations, and many other influencing factors.
Based on them it should be differentiated defensive line
io21 D},...,,{ built up, which is a prerequisite for finding the optimal actions. The practice leads to task for convergence of the process of seeking action in the multitude
oo D}{ of the action’s alternatives. The optimal field of
2� JOURNAL SCIENTIFIC AND APPLIED RESEARCH Vol. 3, 20�3JOURNAL SCIENTIFIC AND APPLIED RESEARCH Vol. 3, 20�3
actions oD To prove that it is possible to determine the optimal number of protective action in the field of possible actions must be met three conditions:
�. The criterion for selection must be chosen and must be formulatedthe limitations that define the ultimate goal.
The criterion for selection should reflect the protective management actions that are in the multitude iD . Protection aims must lead to reduce the effects of transboundary impacts. Therefore, selecting the criterion we use them as a starting point.
A criterion of "effectiveness" of the system E of impacts impactS , which causes harmful effects on the objects from the environment of border areas [�] is introduced. Thus meets the proven our studies [�] structure of the integral danger. On the other hand, the effectiveness should be determined by the effects of randomly occurring changes in the properties of the system of transboundary impacts impactS . It is necessary to use a representative probabilistic description.
Our experience [�,�] demonstrate that sufficient and reliable universal characteristic is the mathematical expectation sP of the occurrence of the current state of the system of cross-border environmental impacts impactS in random space sD . The space sD is not determined. It can be indiscrete or discrete in dependance on the conditions and circumstances of the operation of the
system impactS , respectively the situation which is subject to analysis and evaluation in environmental security. The claim is proved by the nature, properties and characteristics of logic in the subjective evaluation [�].
In this scenario, the effectiveness E can be represented by the function of the system of cross-border impacts impactS in state space
sD and the probabilistic characterization sP . It takes into account the statistical nature of the state q , fulfilling the condition
is :D iED , where D is the area of managing subjective actions .
Three main properties of the effectiveness E of the system of transboundary impacts are defining:
a) Effectiveness E has a numerical meaning E CE corresponding to each subspace in the sub-multitude )i(
sD in the state’s space sD ( s
)i(s DD )
b) The numerical importance CE is finite, positive real numbers, i.e it is found in range range: 0 < CE < .
c) The effectiveness is E an integrating value
iiEE as
i
)i(ss DD and )j(
s)i(
s DD at
ji . iE is a simple effectiveness, part of the effectiveness E of the system for impacts impactS . Due to the effects of its i th subsystem in the j th cycle of operation. In determining the
JOURNAL SCIENTIFIC AND APPLIED RESEARCH Vol. 3, 20�3
iE i th subsystem should be considered as a system that interacts with border impacts environment
impactENVI and other subsystems in
impactS . This will include sub-national border environmental danger events
NateventS and borders environmentally danger events TranseventS .
The number E reflects the effectiveness E quantitatively. We are labeling it with CE that represents symbolically the criterion of effectiveness. Formally, the criterion CE is considered as an image of effectiveness of the system of cross-border impacts impactS : CE : E ER, where ER is a numerical representation of the axis of effectiveness.
Consequently two multitudes ED and ED which are compact
linear spaces are defined. The model reflecting the nature of interactions between the system of impacts impactS and the environmental system
impactENVI is completed and takes the
form ssE P,D,D,D .
2. The level of restrictions CE on the criteria of effectiveness CE for selection of protective action iD must be set: CECE .
3. Information on the level of criteria oCE for selection of quasi-optimum, which sets out a possible alternative: oCECE . These three conditions are subjective in nature and reflect a
personal present to the managing entity, which analyzes, assesses environmental security and decide for protection.
The area iD is the search space of possible alternatives D . It corresponds to the inequality
CECE . In this area should be found an
alternative point of optimum protective action o which corresponds to equality
optimumCE)(CE o . Around the point o it is possible to fond points of possible alternatives D that fulfill the condition
}),(:{D o , ),( o is the distance between o
and in the field iD . The magnitude is the permissible difference between the values of the CE criterion of effectiveness between two alternatives
CECEmax)(fCE , where CE is the selection criterion of the
possible alternatives . The optimal approaches gradually get closer in the search process. It is found in the zone of possible alternatives. It is possible to start from anywhere in ii D . The search should take place through intermediate steps k .
The difference between k and 1k is the pitc . Expressed by the
criterion of effectiveness it will be )(CE .
The step size can be determined by the inequality ko0 or
2�JOURNAL SCIENTIFIC AND APPLIED RESEARCH Vol. 3, 20�3JOURNAL SCIENTIFIC AND APPLIED RESEARCH Vol. 3, 20�3
actions oD To prove that it is possible to determine the optimal number of protective action in the field of possible actions must be met three conditions:
�. The criterion for selection must be chosen and must be formulatedthe limitations that define the ultimate goal.
The criterion for selection should reflect the protective management actions that are in the multitude iD . Protection aims must lead to reduce the effects of transboundary impacts. Therefore, selecting the criterion we use them as a starting point.
A criterion of "effectiveness" of the system E of impacts impactS , which causes harmful effects on the objects from the environment of border areas [�] is introduced. Thus meets the proven our studies [�] structure of the integral danger. On the other hand, the effectiveness should be determined by the effects of randomly occurring changes in the properties of the system of transboundary impacts impactS . It is necessary to use a representative probabilistic description.
Our experience [�,�] demonstrate that sufficient and reliable universal characteristic is the mathematical expectation sP of the occurrence of the current state of the system of cross-border environmental impacts impactS in random space sD . The space sD is not determined. It can be indiscrete or discrete in dependance on the conditions and circumstances of the operation of the
system impactS , respectively the situation which is subject to analysis and evaluation in environmental security. The claim is proved by the nature, properties and characteristics of logic in the subjective evaluation [�].
In this scenario, the effectiveness E can be represented by the function of the system of cross-border impacts impactS in state space
sD and the probabilistic characterization sP . It takes into account the statistical nature of the state q , fulfilling the condition
is :D iED , where D is the area of managing subjective actions .
Three main properties of the effectiveness E of the system of transboundary impacts are defining:
a) Effectiveness E has a numerical meaning E CE corresponding to each subspace in the sub-multitude )i(
sD in the state’s space sD ( s
)i(s DD )
b) The numerical importance CE is finite, positive real numbers, i.e it is found in range range: 0 < CE < .
c) The effectiveness is E an integrating value
iiEE as
i
)i(ss DD and )j(
s)i(
s DD at
ji . iE is a simple effectiveness, part of the effectiveness E of the system for impacts impactS . Due to the effects of its i th subsystem in the j th cycle of operation. In determining the
JOURNAL SCIENTIFIC AND APPLIED RESEARCH Vol. 3, 20�3
iE i th subsystem should be considered as a system that interacts with border impacts environment
impactENVI and other subsystems in
impactS . This will include sub-national border environmental danger events
NateventS and borders environmentally danger events TranseventS .
The number E reflects the effectiveness E quantitatively. We are labeling it with CE that represents symbolically the criterion of effectiveness. Formally, the criterion CE is considered as an image of effectiveness of the system of cross-border impacts impactS : CE : E ER, where ER is a numerical representation of the axis of effectiveness.
Consequently two multitudes ED and ED which are compact
linear spaces are defined. The model reflecting the nature of interactions between the system of impacts impactS and the environmental system
impactENVI is completed and takes the
form ssE P,D,D,D .
2. The level of restrictions CE on the criteria of effectiveness CE for selection of protective action iD must be set: CECE .
3. Information on the level of criteria oCE for selection of quasi-optimum, which sets out a possible alternative: oCECE . These three conditions are subjective in nature and reflect a
personal present to the managing entity, which analyzes, assesses environmental security and decide for protection.
The area iD is the search space of possible alternatives D . It corresponds to the inequality
CECE . In this area should be found an
alternative point of optimum protective action o which corresponds to equality
optimumCE)(CE o . Around the point o it is possible to fond points of possible alternatives D that fulfill the condition
}),(:{D o , ),( o is the distance between o
and in the field iD . The magnitude is the permissible difference between the values of the CE criterion of effectiveness between two alternatives
CECEmax)(fCE , where CE is the selection criterion of the
possible alternatives . The optimal approaches gradually get closer in the search process. It is found in the zone of possible alternatives. It is possible to start from anywhere in ii D . The search should take place through intermediate steps k .
The difference between k and 1k is the pitc . Expressed by the
criterion of effectiveness it will be )(CE .
The step size can be determined by the inequality ko0 or
30 JOURNAL SCIENTIFIC AND APPLIED RESEARCH Vol. 3, 20�3JOURNAL SCIENTIFIC AND APPLIED RESEARCH Vol. 3, 20�3
by the criterion of effectiveness: )(CE)(CE)(CE0 k
With an intuitive search of the optimal protective effect there is a high degree of randomness [3]. Therefore there must to apply analytical and argumentative method of seeking protective action effectively.
It can be assumed that it is likely )(P k to the correct approach to the
optimal action )(P k , which is - greater than 0. This means that 0 for any protective effect that is not in the field D .
Generally it is always searched for little where appropriate steps must be taken to and inadequate steps are rejected [3]. In this way, however, should increase the difference
)(CE)(CE 1 . The inadequate steps of
searching not cause displacement of the point k . They increase the number of points and timing of demand.
Those productions determine the existence of area iD of possible protective actions in which the function )(f k of the probability density at an appropriate step in any search k is greater than zero.
Decisions in the management of environmental security we found is a selection of alternative protective action.
In this scenario, any solution will be a number R of solutions that do can be defined as expressions of a multitude of possible protective measures:
DR ,
ii DR ,
oo DR , }D,...,D,D{D i21 ,
}R,...,R,R{R i21 , DDD ioo ,
ojoR ,
where m,...,2,1j , R - many decisions defining the field of search for the subset of possible alternative protective actions oD , joR - a
solution corresponding to the optimal alternative protective action.
The evaluation of alternatives of protective management actions may indicate that it arises from a multitude of possible states of the system of environmental security:
kjn21s q/gg/}q,...,q,q{D , where iq is any i th state of the cross-border environmental security, which is seen as i th capable result of these possible alternative actions adopted,
)q(g k - function of the environment, to which is evaluatedthe environmental security.
At each possible outcome corresponds a local evaluation of effectiveness )q,(CECE ki and probability of occurrence kp that is associated with the function of the environment.
Local assessments are determined by the conditions of acceptance of decisions - deterministic terms, conditions or conditions of risk uncertainty.
Each management alternative protective effect may be associated
JOURNAL SCIENTIFIC AND APPLIED RESEARCH Vol. 3, 20�3
with a multiple of possible states of cross-border environmental security. Then the evaluation will be based on the criteria of effectiveness )(CE i . It can be a criterion for selecting a solution, firstly, and on the other hand to be admitted to a local criterion for evaluation.
The choice of an alternative solution from the multitude of possible protective actions should be made rationally and efficiently.
According to R. Luce and H. Raiffa [�], the rational decisions must be consistent, targeted and transitive.
Introducing these properties for solutions in the management of cross-border environmental security it is reached the following evidence:
�. Consistency. When the criterion of
effectiveness 'CE of an alternative solution ' is greater than the criterion ''CE of an alternative solution '' then it is not acceptable the decision '' to prefer after ' , or any short recording with the sign preferably will look like the inequality ''' .
2. Focus. When the alternative solution '
is greater than the alternative solution '' and ' ис consistent with the
purpose 'Z of environmental security and '' of the purpose ''Z then
''' ZZ or the goal is 'Z , it must be preferred against a target ''Z .
3. Transitivity. When the alternatives ,, ''' ''' are associated
ith the ratios ''' , ''''' , then '''' .
The accuracy and timeliness both determine the quality of decisions in the management of environmental security.
The credibility is a criterion for the confidence measure of certainty to the adopted decision, a measure of confidence that the actual outcome of environmental protection will correspond to the expected result. It should be noted that the accuracy depends on the quantity and quality of information upon which the decision shall be taken in the management of environmental security.
The solutions for the environmental security should be taken on time. Otherwise they contain outdated information and the undertaken decisions are not significant and reliable.
The usefulness of the solutions is a function of time t .
To assess the usefulness of the solutions in the management of environmental security we suggest the usage of the criterion of utility U
Kozeletskiy [3]: 1t
1)t(U 2 .
The experience shows that a comparison of decisions by a simple alternativeness - two by two is most - safe and accessible. The preferred solutions are ji . This method involves the minimum limitations in its usage. Moreover, the requirement for a transitive decisions drops.
We believe it is appropriate and the method of pure dominance, in which all indicators of a decision
3�JOURNAL SCIENTIFIC AND APPLIED RESEARCH Vol. 3, 20�3JOURNAL SCIENTIFIC AND APPLIED RESEARCH Vol. 3, 20�3
by the criterion of effectiveness: )(CE)(CE)(CE0 k
With an intuitive search of the optimal protective effect there is a high degree of randomness [3]. Therefore there must to apply analytical and argumentative method of seeking protective action effectively.
It can be assumed that it is likely )(P k to the correct approach to the
optimal action )(P k , which is - greater than 0. This means that 0 for any protective effect that is not in the field D .
Generally it is always searched for little where appropriate steps must be taken to and inadequate steps are rejected [3]. In this way, however, should increase the difference
)(CE)(CE 1 . The inadequate steps of
searching not cause displacement of the point k . They increase the number of points and timing of demand.
Those productions determine the existence of area iD of possible protective actions in which the function )(f k of the probability density at an appropriate step in any search k is greater than zero.
Decisions in the management of environmental security we found is a selection of alternative protective action.
In this scenario, any solution will be a number R of solutions that do can be defined as expressions of a multitude of possible protective measures:
DR ,
ii DR ,
oo DR , }D,...,D,D{D i21 ,
}R,...,R,R{R i21 , DDD ioo ,
ojoR ,
where m,...,2,1j , R - many decisions defining the field of search for the subset of possible alternative protective actions oD , joR - a
solution corresponding to the optimal alternative protective action.
The evaluation of alternatives of protective management actions may indicate that it arises from a multitude of possible states of the system of environmental security:
kjn21s q/gg/}q,...,q,q{D , where iq is any i th state of the cross-border environmental security, which is seen as i th capable result of these possible alternative actions adopted,
)q(g k - function of the environment, to which is evaluatedthe environmental security.
At each possible outcome corresponds a local evaluation of effectiveness )q,(CECE ki and probability of occurrence kp that is associated with the function of the environment.
Local assessments are determined by the conditions of acceptance of decisions - deterministic terms, conditions or conditions of risk uncertainty.
Each management alternative protective effect may be associated
JOURNAL SCIENTIFIC AND APPLIED RESEARCH Vol. 3, 20�3
with a multiple of possible states of cross-border environmental security. Then the evaluation will be based on the criteria of effectiveness )(CE i . It can be a criterion for selecting a solution, firstly, and on the other hand to be admitted to a local criterion for evaluation.
The choice of an alternative solution from the multitude of possible protective actions should be made rationally and efficiently.
According to R. Luce and H. Raiffa [�], the rational decisions must be consistent, targeted and transitive.
Introducing these properties for solutions in the management of cross-border environmental security it is reached the following evidence:
�. Consistency. When the criterion of
effectiveness 'CE of an alternative solution ' is greater than the criterion ''CE of an alternative solution '' then it is not acceptable the decision '' to prefer after ' , or any short recording with the sign preferably will look like the inequality ''' .
2. Focus. When the alternative solution '
is greater than the alternative solution '' and ' ис consistent with the
purpose 'Z of environmental security and '' of the purpose ''Z then
''' ZZ or the goal is 'Z , it must be preferred against a target ''Z .
3. Transitivity. When the alternatives ,, ''' ''' are associated
ith the ratios ''' , ''''' , then '''' .
The accuracy and timeliness both determine the quality of decisions in the management of environmental security.
The credibility is a criterion for the confidence measure of certainty to the adopted decision, a measure of confidence that the actual outcome of environmental protection will correspond to the expected result. It should be noted that the accuracy depends on the quantity and quality of information upon which the decision shall be taken in the management of environmental security.
The solutions for the environmental security should be taken on time. Otherwise they contain outdated information and the undertaken decisions are not significant and reliable.
The usefulness of the solutions is a function of time t .
To assess the usefulness of the solutions in the management of environmental security we suggest the usage of the criterion of utility U
Kozeletskiy [3]: 1t
1)t(U 2 .
The experience shows that a comparison of decisions by a simple alternativeness - two by two is most - safe and accessible. The preferred solutions are ji . This method involves the minimum limitations in its usage. Moreover, the requirement for a transitive decisions drops.
We believe it is appropriate and the method of pure dominance, in which all indicators of a decision
32 JOURNAL SCIENTIFIC AND APPLIED RESEARCH Vol. 3, 20�3JOURNAL SCIENTIFIC AND APPLIED RESEARCH Vol. 3, 20�3
must be greater than the performance of another solution.
In theoretical - multiple meaning the alternativeness ordinary method is to compare, two by two, the solutions from the set of given alternatives.
With a variety of alternatives D it must determine the relationship of preferences Pr .
At two alternative protective actions i and j , which belong to the many protective actions D :
D, ji , the preference is xDDPr , where
}D,|,{xDD jiji . Depending on the nature of the
compared results of protective actions there are four possible options:
I variant: jiji Pr, . The
protective action i is preferred to action j ,
II variant: ij
1ji Pr, .
The action j is preferred to action
i , III variant:
ji1
ji PrPr,
. The action i is equivalent to j , IV variant:
ji1
ji PrPr, . The action i is incomparable with
j . In determining the preferences of
ordinary pairs to the alternative solutions is applied a selection
criterion, which is a function of the compared alternatives:
)(E ii and )(E jj . In this case )(E i and )(E j
and the effects of management protective actions i and j . The exact preference for a solution is shown by the expression
)(E)(EP, jiji . And the approximate preference by:
)(E)(EP, jiji . The effects and corresponding
alternative protective actions )(E i and )(E j can be both quantitative and qualitative. They should be adopted subjective - personally, alone or in team of experts on the basis of perceived preference.
The preference’s property we believe is appropriate to be
determined by the ratio
)(E)(E
j
i or
the difference )(E)(E ji . Applying these two estimates
should not affect the preference because the solution taking principle is basic.
According to the awareness the assessments based on the effects
)(E),(E ji and effectiveness )(CE),(CE ji criteria should be
subject to the ratio)(CE)(CE)(E)(E jiji
The ratio is a consequence of the
above interpretations of the effectiveness )(E of the transition to the criterion of effectiveness
)(CE .
JOURNAL SCIENTIFIC AND APPLIED RESEARCH Vol. 3, 20�3
The awareness principle imposes restrictions on the nature of the assessments of the preferences of the decision.
It is appropriate the limits to be derived for the case of a link between the effect )(E and criterion of effectiveness )(CE . For example, by using a linear coefficientn . Then
l)(CE)(E ii and l)(CE)(E jj , where l is the
free term, reflecting the transition from one scale of evaluations of alternatives to protective actions.
On the ratio and the free member l are not imposed any restrictions. Therefore they can not acquire any values. They are chosen subjectively. Our experience [�] shows that they must be with meanings close to the real potential and close to the objective that not change the subjective perceptions and interpretations of them.
Alternative solution i may apply to n situations, and j in m situations of cross-border environmental security.
In the case of the basis of assessments by the criterion of effect
)(E i and effectiveness )(CE i respectively )(E j and )(CE j , the preference ji is accepted, then
)(E)(E jm
1rr
n
1kik
. The
expression is consider the compare of the estimates the un-averaged effects assessments.
In accordance with the principle of awareness at the the transition
between the evaluations E and the criteria CE it is led to the inequality
]l)(E[]l)(E[ jm
1rr
n
1kik
, which takes the following
transformations
ml)(Enl)(E jm
1rr
n
1kik
,
)(El)mn()(E jm
1rr
n
1kik
.
This inequality can be respected only in the special case where nm . Therefore, using the comparison of un-averaged estimated transformation of the transition from E to CE can not be thought sufficiently objective or principle of awareness can not be used. Using the averaged preference ratings of alternative protective actions ji is formed as
)(Em1)(E
n1
jm
1rr
n
1kik
.
For meaningful estimates of transition from E to CE it is necessary to fulfill the inequality
]l)(E[m1]l)(E[
n1
jm
1rr
n
1kik
which is reduced to
mml)(E
mnnl)(E
n jm
1rr
n
1kik
. It follows that
)(Em1)(E
n1
jm
1rri
n
1kk
.
The inequality of the strict preference obtained by the criterion for evaluation of effectiveness CE coincides with the inequality obtained for evaluation of the effect E , proves
33JOURNAL SCIENTIFIC AND APPLIED RESEARCH Vol. 3, 20�3JOURNAL SCIENTIFIC AND APPLIED RESEARCH Vol. 3, 20�3
must be greater than the performance of another solution.
In theoretical - multiple meaning the alternativeness ordinary method is to compare, two by two, the solutions from the set of given alternatives.
With a variety of alternatives D it must determine the relationship of preferences Pr .
At two alternative protective actions i and j , which belong to the many protective actions D :
D, ji , the preference is xDDPr , where
}D,|,{xDD jiji . Depending on the nature of the
compared results of protective actions there are four possible options:
I variant: jiji Pr, . The
protective action i is preferred to action j ,
II variant: ij
1ji Pr, .
The action j is preferred to action
i , III variant:
ji1
ji PrPr,
. The action i is equivalent to j , IV variant:
ji1
ji PrPr, . The action i is incomparable with
j . In determining the preferences of
ordinary pairs to the alternative solutions is applied a selection
criterion, which is a function of the compared alternatives:
)(E ii and )(E jj . In this case )(E i and )(E j
and the effects of management protective actions i and j . The exact preference for a solution is shown by the expression
)(E)(EP, jiji . And the approximate preference by:
)(E)(EP, jiji . The effects and corresponding
alternative protective actions )(E i and )(E j can be both quantitative and qualitative. They should be adopted subjective - personally, alone or in team of experts on the basis of perceived preference.
The preference’s property we believe is appropriate to be
determined by the ratio
)(E)(E
j
i or
the difference )(E)(E ji . Applying these two estimates
should not affect the preference because the solution taking principle is basic.
According to the awareness the assessments based on the effects
)(E),(E ji and effectiveness )(CE),(CE ji criteria should be
subject to the ratio)(CE)(CE)(E)(E jiji
The ratio is a consequence of the
above interpretations of the effectiveness )(E of the transition to the criterion of effectiveness
)(CE .
JOURNAL SCIENTIFIC AND APPLIED RESEARCH Vol. 3, 20�3
The awareness principle imposes restrictions on the nature of the assessments of the preferences of the decision.
It is appropriate the limits to be derived for the case of a link between the effect )(E and criterion of effectiveness )(CE . For example, by using a linear coefficientn . Then
l)(CE)(E ii and l)(CE)(E jj , where l is the
free term, reflecting the transition from one scale of evaluations of alternatives to protective actions.
On the ratio and the free member l are not imposed any restrictions. Therefore they can not acquire any values. They are chosen subjectively. Our experience [�] shows that they must be with meanings close to the real potential and close to the objective that not change the subjective perceptions and interpretations of them.
Alternative solution i may apply to n situations, and j in m situations of cross-border environmental security.
In the case of the basis of assessments by the criterion of effect
)(E i and effectiveness )(CE i respectively )(E j and )(CE j , the preference ji is accepted, then
)(E)(E jm
1rr
n
1kik
. The
expression is consider the compare of the estimates the un-averaged effects assessments.
In accordance with the principle of awareness at the the transition
between the evaluations E and the criteria CE it is led to the inequality
]l)(E[]l)(E[ jm
1rr
n
1kik
, which takes the following
transformations
ml)(Enl)(E jm
1rr
n
1kik
,
)(El)mn()(E jm
1rr
n
1kik
.
This inequality can be respected only in the special case where nm . Therefore, using the comparison of un-averaged estimated transformation of the transition from E to CE can not be thought sufficiently objective or principle of awareness can not be used. Using the averaged preference ratings of alternative protective actions ji is formed as
)(Em1)(E
n1
jm
1rr
n
1kik
.
For meaningful estimates of transition from E to CE it is necessary to fulfill the inequality
]l)(E[m1]l)(E[
n1
jm
1rr
n
1kik
which is reduced to
mml)(E
mnnl)(E
n jm
1rr
n
1kik
. It follows that
)(Em1)(E
n1
jm
1rri
n
1kk
.
The inequality of the strict preference obtained by the criterion for evaluation of effectiveness CE coincides with the inequality obtained for evaluation of the effect E , proves
3� JOURNAL SCIENTIFIC AND APPLIED RESEARCH Vol. 3, 20�3JOURNAL SCIENTIFIC AND APPLIED RESEARCH Vol. 3, 20�3
that the transformation of the average estimates respecting the principle of awareness. Therefore, the main limitation arising from the transformation of evaluations is that that they should be averaged.
ІІІ. Conclusion An analytical system and
procedure to justify the protective actions and decisions in the management of environmental security is proposed and approbated. It shows its effectiveness and credibility.
To achieve the objective of this study, some argue ways to search for optimal protective actions in the protection of environment are shown. The areas of possible management actions were defined.
The selection of protective action is done by the introduced criterion of effectiveness, which reflects the results of any impacts. The operating conditions of the system of effects are random and they are determined by a probabilistic description.
Solutions in the management of environmental security are considered as a selection of alternative protective action selected from at least two actions. There are characteristics that determine the usefulness of rationality and decision making.
A binary choice of two by two actions is made. Some rules were defined, which are the essential for management of environmental security.
References �. Ivin, A. Foundations of logic
evaluations. Moscow, Moskow State University, ���0.
2. Kozeletskiy, J. Psychological theory of decision. Moscow, Progress, ����.
3. Luce, R., H. Raiffa. Games and decisions. Moscow, Foreign-Books, ����.
�. Vladimirov, L. Riskmetrics in environmental security. Varna: Varna Free University. 200�.
�. Vladimirov, L. Theory of the cross-border environmental security. Varna: Varna Free University. 20�2.
JOURNAL SCIENTIFIC AND APPLIED RESEARCH Vol. 3, 20�3
Original Contribution
Journal scientific and applied research, vol. 3, 20�3 Association Scientific and Applied Research
International Journal ISSN �3��-�2��
MEASURING THE RISK OF ECOLOGICALLY DANGEROUS ECONOMIC ACTIVITIES
Lyubomir Vladimirov Mariana Todorova
University of Ruse University of Shumen
Abstract The present study reveals and defines a procedure for risk measurement that reflects precisely and
thoroughly the threats to the environment caused by economic activities. The paper explains the logics behind the risk measurement. It works out a measurement procedure and shows arguments for the operations, the measurement values and the measurement units. The way for defining the numerical values of the risk is also presented.
Key words: measurement, risk, environment, economic activity. INTRODUCTION The economic activities
according to the classification KID-200� cover practically all human activities and the activities of the society as a whole. They are related to generating phenomena dangerous to the environment both directly and indirectly. Each human activity brings a potential risk to the environment. This statement is based on the fact that even ecologically safe at first sight productions have sources generating ecologically hazardous factors.
The aim of this study is to give reasons for a risk-measuring procedure, which reveals precisely and thoroughly the threats to the environment caused by economic activities.
In order to achieve this aim the following tasks are solved: �) Eliciting the logics of risk measurement; 2) Developing a measurement procedure; 3) Determining the numerical values of the risk.
ARGUMENTS The risk is a criterion for the
threats to the environment generated by economic activities.
Defining ecological safety of economic activities requires measuring the risk of the impacts on the environment. Firstly, the risk helps us to determine the ecological criticalities and the ecological insecurity, and then the ecological safety [2]. Measuring the risk for the environment caused by economic activities is based on five principles:
3�JOURNAL SCIENTIFIC AND APPLIED RESEARCH Vol. 3, 20�3JOURNAL SCIENTIFIC AND APPLIED RESEARCH Vol. 3, 20�3
that the transformation of the average estimates respecting the principle of awareness. Therefore, the main limitation arising from the transformation of evaluations is that that they should be averaged.
ІІІ. Conclusion An analytical system and
procedure to justify the protective actions and decisions in the management of environmental security is proposed and approbated. It shows its effectiveness and credibility.
To achieve the objective of this study, some argue ways to search for optimal protective actions in the protection of environment are shown. The areas of possible management actions were defined.
The selection of protective action is done by the introduced criterion of effectiveness, which reflects the results of any impacts. The operating conditions of the system of effects are random and they are determined by a probabilistic description.
Solutions in the management of environmental security are considered as a selection of alternative protective action selected from at least two actions. There are characteristics that determine the usefulness of rationality and decision making.
A binary choice of two by two actions is made. Some rules were defined, which are the essential for management of environmental security.
References �. Ivin, A. Foundations of logic
evaluations. Moscow, Moskow State University, ���0.
2. Kozeletskiy, J. Psychological theory of decision. Moscow, Progress, ����.
3. Luce, R., H. Raiffa. Games and decisions. Moscow, Foreign-Books, ����.
�. Vladimirov, L. Riskmetrics in environmental security. Varna: Varna Free University. 200�.
�. Vladimirov, L. Theory of the cross-border environmental security. Varna: Varna Free University. 20�2.
JOURNAL SCIENTIFIC AND APPLIED RESEARCH Vol. 3, 20�3
Original Contribution
Journal scientific and applied research, vol. 3, 20�3 Association Scientific and Applied Research
International Journal ISSN �3��-�2��
MEASURING THE RISK OF ECOLOGICALLY DANGEROUS ECONOMIC ACTIVITIES
Lyubomir Vladimirov Mariana Todorova
University of Ruse University of Shumen
Abstract The present study reveals and defines a procedure for risk measurement that reflects precisely and
thoroughly the threats to the environment caused by economic activities. The paper explains the logics behind the risk measurement. It works out a measurement procedure and shows arguments for the operations, the measurement values and the measurement units. The way for defining the numerical values of the risk is also presented.
Key words: measurement, risk, environment, economic activity. INTRODUCTION The economic activities
according to the classification KID-200� cover practically all human activities and the activities of the society as a whole. They are related to generating phenomena dangerous to the environment both directly and indirectly. Each human activity brings a potential risk to the environment. This statement is based on the fact that even ecologically safe at first sight productions have sources generating ecologically hazardous factors.
The aim of this study is to give reasons for a risk-measuring procedure, which reveals precisely and thoroughly the threats to the environment caused by economic activities.
In order to achieve this aim the following tasks are solved: �) Eliciting the logics of risk measurement; 2) Developing a measurement procedure; 3) Determining the numerical values of the risk.
ARGUMENTS The risk is a criterion for the
threats to the environment generated by economic activities.
Defining ecological safety of economic activities requires measuring the risk of the impacts on the environment. Firstly, the risk helps us to determine the ecological criticalities and the ecological insecurity, and then the ecological safety [2]. Measuring the risk for the environment caused by economic activities is based on five principles:
3� JOURNAL SCIENTIFIC AND APPLIED RESEARCH Vol. 3, 20�3JOURNAL SCIENTIFIC AND APPLIED RESEARCH Vol. 3, 20�3
�. The Principle of Hierarchy. It consists of defining the risk as a value which is decomposed in a tree-like structure. It describes the risk by a combination of specific, lower components moving to general, higher components. 2. The Principle of Integrality. Measuring the risk as a whole is a process of defining the integral risk reflecting the risks of dangerous phenomena arising, as well as dangerous activities and dangerous effects. 3. The Principle of Zero Dimensionality. It can be observed in defining the components of the integral risk in zero dimensional values. On the one hand, the principle allows us to recognize the specific diversity of risk factors and, on the other hand, to receive compatible from dimensional point of view values of the risks present. �. The Principle of Equivalency. It is found in accepting that the components of the integral risk at a certain hierarchical level have an equal degree of significance. �. The Principle of Cause-effect Relationships. It is represented in determining the risk as a totality of conditions, circumstances and processes related via «cause-effect» relationships.
The risk of the economic activities to the environment corresponds to specific systems, which while functioning generate threats. That requires an initial description of the systems with all their composite parts and the interactions between them, on the one
hand, and with the environment, on the other hand. At this stage, the risk factor is determined for each element, as well as its level, the conditions for the emission distribution and the emissions themselves.
Methodologically, the description of the economic activities and their aspects of influence on the environment are presented in detail in [�,�]. We built polysituational models which represent potential situations of ecological threats.
Risk measurements are based on monosituational models of the risks which are generated in the systems [2]. The models of the monosituational risks are an objective taxonomic consequence of polysituational models. We define [�,2] six conditions for the rise of environmental threats and risks: �) Dimensional compatibility of the object of influence-the recipient and the risk factors in the area of their distribution; 2) Levels of risk factors and their deviation in relation to the marginal permitted values; 3) Time compatibility of the recipient and the risk factors; �) Exceeding the permitted time for the recipient’s stay in the area of the risk factors; �) Matching the time of activity and the time of exceeding the marginal values of the risk factors; �) Compatibility of the polysituational risk model and the appointed measurement aims and tasks, the structure and content of the elicited threats.
We consider the transformations and the characteristics of the risk as measurement values. They have to be presented thoroughly, the subject
JOURNAL SCIENTIFIC AND APPLIED RESEARCH Vol. 3, 20�3
evaluating them has to perceive them and they have to be standardized by ascribing specific numerical value to them. The measuring values have to be defined correctly. The measurement units need to be compatible and in accordance with the values.
The amount of the risk is a ratio of the measurement values to their standards which are different along the axis of the temporal risk TindR , of the indicator risk indR and of the componential risk kompR [2,�]. Therefore, it is required that we should define: �) the measured characteristics quantitatively and qualitatively, and their corresponding risk measurement values; 2) the measurement units; 3) the principles of measurement; �) the methods of measurement; �) the procedures of measurement.
The measurement along the axis indR is necessary because the risk
values indR represent the progress of the threat at a lower level. The measurement values along the axis
indR correspond to the three components of the threats. Consequently, three types of risks are considered – caused by dangerous phenomena FenindR , by dangerous activities ActindR and by dangerous effects EffindR [2]. Their measurement is carried out by finding out the values of the indicator risks. They determine the transfer of one element into another, from one state into
another. Thus, we define the causes and effects of risk transformations.
The vertical decomposition of the risk is hierarchical [2]. The measurement along the axis of the componential risk kompR is necessary because the measurement results allow us to define the relative shares of the factor values, firstly in the indicator risks and then in the componential risks. The amount of the risk kompR reflects the nature of the threat to the environment. It follows the logics and the indicators for the progress of the threats. The measurement values are in four levels. Although they relate to one and the same measurement value, the amounts of the risks along the axis
indR differ from those along the axis kompR . The difference is in their
nature. The risks along the axis indR represent the elementary transformations of causes into an effect, while those along the axis
kompR - represent the phase transformations.
The measurement along the axis TindR shows the dynamics of
alteration of factor values, indicator, componential and integral risks. It allows us to measure their values in different sections of time.
The amount along the axis of the temporal risk TindR is a value we use to define the area of criticalities and their centres. It appoints the temporal values of the risks. The values along the axis TindR are indiscreet, which is due to the nature of defining the factor of time when a risk arises. They
3�JOURNAL SCIENTIFIC AND APPLIED RESEARCH Vol. 3, 20�3JOURNAL SCIENTIFIC AND APPLIED RESEARCH Vol. 3, 20�3
�. The Principle of Hierarchy. It consists of defining the risk as a value which is decomposed in a tree-like structure. It describes the risk by a combination of specific, lower components moving to general, higher components. 2. The Principle of Integrality. Measuring the risk as a whole is a process of defining the integral risk reflecting the risks of dangerous phenomena arising, as well as dangerous activities and dangerous effects. 3. The Principle of Zero Dimensionality. It can be observed in defining the components of the integral risk in zero dimensional values. On the one hand, the principle allows us to recognize the specific diversity of risk factors and, on the other hand, to receive compatible from dimensional point of view values of the risks present. �. The Principle of Equivalency. It is found in accepting that the components of the integral risk at a certain hierarchical level have an equal degree of significance. �. The Principle of Cause-effect Relationships. It is represented in determining the risk as a totality of conditions, circumstances and processes related via «cause-effect» relationships.
The risk of the economic activities to the environment corresponds to specific systems, which while functioning generate threats. That requires an initial description of the systems with all their composite parts and the interactions between them, on the one
hand, and with the environment, on the other hand. At this stage, the risk factor is determined for each element, as well as its level, the conditions for the emission distribution and the emissions themselves.
Methodologically, the description of the economic activities and their aspects of influence on the environment are presented in detail in [�,�]. We built polysituational models which represent potential situations of ecological threats.
Risk measurements are based on monosituational models of the risks which are generated in the systems [2]. The models of the monosituational risks are an objective taxonomic consequence of polysituational models. We define [�,2] six conditions for the rise of environmental threats and risks: �) Dimensional compatibility of the object of influence-the recipient and the risk factors in the area of their distribution; 2) Levels of risk factors and their deviation in relation to the marginal permitted values; 3) Time compatibility of the recipient and the risk factors; �) Exceeding the permitted time for the recipient’s stay in the area of the risk factors; �) Matching the time of activity and the time of exceeding the marginal values of the risk factors; �) Compatibility of the polysituational risk model and the appointed measurement aims and tasks, the structure and content of the elicited threats.
We consider the transformations and the characteristics of the risk as measurement values. They have to be presented thoroughly, the subject
JOURNAL SCIENTIFIC AND APPLIED RESEARCH Vol. 3, 20�3
evaluating them has to perceive them and they have to be standardized by ascribing specific numerical value to them. The measuring values have to be defined correctly. The measurement units need to be compatible and in accordance with the values.
The amount of the risk is a ratio of the measurement values to their standards which are different along the axis of the temporal risk TindR , of the indicator risk indR and of the componential risk kompR [2,�]. Therefore, it is required that we should define: �) the measured characteristics quantitatively and qualitatively, and their corresponding risk measurement values; 2) the measurement units; 3) the principles of measurement; �) the methods of measurement; �) the procedures of measurement.
The measurement along the axis indR is necessary because the risk
values indR represent the progress of the threat at a lower level. The measurement values along the axis
indR correspond to the three components of the threats. Consequently, three types of risks are considered – caused by dangerous phenomena FenindR , by dangerous activities ActindR and by dangerous effects EffindR [2]. Their measurement is carried out by finding out the values of the indicator risks. They determine the transfer of one element into another, from one state into
another. Thus, we define the causes and effects of risk transformations.
The vertical decomposition of the risk is hierarchical [2]. The measurement along the axis of the componential risk kompR is necessary because the measurement results allow us to define the relative shares of the factor values, firstly in the indicator risks and then in the componential risks. The amount of the risk kompR reflects the nature of the threat to the environment. It follows the logics and the indicators for the progress of the threats. The measurement values are in four levels. Although they relate to one and the same measurement value, the amounts of the risks along the axis
indR differ from those along the axis kompR . The difference is in their
nature. The risks along the axis indR represent the elementary transformations of causes into an effect, while those along the axis
kompR - represent the phase transformations.
The measurement along the axis TindR shows the dynamics of
alteration of factor values, indicator, componential and integral risks. It allows us to measure their values in different sections of time.
The amount along the axis of the temporal risk TindR is a value we use to define the area of criticalities and their centres. It appoints the temporal values of the risks. The values along the axis TindR are indiscreet, which is due to the nature of defining the factor of time when a risk arises. They
3� JOURNAL SCIENTIFIC AND APPLIED RESEARCH Vol. 3, 20�3JOURNAL SCIENTIFIC AND APPLIED RESEARCH Vol. 3, 20�3
are probabilities for the appearance of temporal moments or temporal intervals with fixed values and they change from 0 to �.
For the environmentally dangerous phenomena the measurement value is the number
NEEN , OPEN , CAUSEN of the cases of a specific cause, operation, activity arising during the studied period of time Т. An additional measurement value is the duration NEET , OPET ,
CAUSET . They can be equal to the total time Т of measurement but they can also be a part of it.
The source of generating dangerous factors – the stressor is analogous in nature and it is a measurement value represented by
SOURSEN and SOURSET , respectively. Their significance is fully identical with the significance of the cause. The risk factor corresponds to the nature of the factor values. It can be of physical, chemical, biological, psycho-physiological and hybrid nature. Its name and description are of non-metrical character but when we introduce the number FACTORN of the cases when it arises and of their duration FACTORT it turns into a metrical random value. The risk factors and their levels are values that are measured in quantitative measureable units. Using the newly developed method for evaluation of the risk factors [2,�] we proceed to unified measurement values by introducing one-sided or two-sided limit of deviation.
Measurement values for the emission could be the number EMISSN
of emissions in a certain range of their probable values and the emission duration EMISST . The measurement values for the emission levels are the number EMLEVN of exceeded permitted values and the duration
EMLEVT of the exceeding. The same way we introduce the measurement values and their corresponding measurement units for: �) distribution medium - MIDDN and MIDDT ; 2) an area of compatibility of the object and the region of immission distribution -
IMLEVN and IMLEVT ; 3) immission -IMISSN and IMISST ; �) immission
levels - IMLEVN and IMLEVT ; �) time of polluting immissions - IMTIMEN and IMTIMET ; �) an object of impact - OBJECTN and OBJECTT ; �) contact places CONTN and CONTT ; �) a type of damage - TYPEN and TYPET ; �) an aspect of the damage ASPECTN and
ASPECTT ; �0) damage localization - LOCALN and LOCALT ; ��) a degree
of the damage - DEGREEN and DEGREET ; �2) compensation
RECOMN and COMPT ; �3) recovery - RECOVN and RECOVT .
The measurement values suggested correspond precisely to the main formulations for structuring and the conditions for defining the risk for the environment [2].
The measurement principles are determined by the type of phenomena on which the specific factor values of the risk are based. Because of that the principles of the State System for Ensuring Unity of Measurements
JOURNAL SCIENTIFIC AND APPLIED RESEARCH Vol. 3, 20�3
belong to a second group, an additional one to the principles of risk measurement.
Due to the nature of the measurement values three methods of measurement are applied: �) A direct method when the value is measured by reading a measuring device. It is used when measuring emissions, imissions, space, time and other natural or anthropogenic values. 2) An indirect method. It uses analytical dependencies between measurement values of metric, non-metric or combined type. 3) A combined method which is a totality of direct and indirect methods.
The measurement procedure consists of four stages: І-measuring the indicator risks along the axis indR ; ІІ-measuring the temporal risks along the axis TindR ; ІІІ-measuring the componential risks along the axis
kompR ; ІV-turning to united non-metrical values.
The transfer to non-metrical values is carried out as follows [�]:
�) N and T are analyzed as random values. The rule of distribution is determined by taking into account their character - discreet or indiscreet. We use in our experiments the software Risk 4.5, Razpredelenie 2.0, Entropia 1.0, Statistica 8.0, SPSS 15.0, Statgraphics Plus 7.0. For the discreet values we test the hypothesis of Poisson distribution, geometrical distribution, binomial distribution, hypergeometrical distribution, negative-binomial distribution, Bernoulli’s distribution. For the
indiscreet values we make a verification of the equal probability rule, the logarithmic-logistic distribution, gamma distribution, Pearson distribution, normal distribution, triangular distribution, beta distribution, Gumbel distribution, logarithmic-normal distribution, exponential distribution, Weibull distribution, Erlang distribution, logistic distribution, Wald distribution and Relay distribution.
2) We calculate the probability PzN for N values and the probability PzT for arising of Т in the ranges Nср and Тср where Nср and Тср are the mean values; -mean-square deviation of measurement values. The second range of significance is from minN to
maxN and from minT to maxT . This range is considerably wider, the probabilities PzN and PzT are bigger, consequently the values of the risk increase. We consider it more appropriate because it takes into account the whole scope of deviation of measurement values.
In virtue of the presented basic assumptions the measurement of the risk could be generally defined as a system of operations for collecting, processing, generalizing and managing the risk information, as well as saving it on disks. There are complex straight and reverse relations and cycles between the separate operations. Measuring the risk creates integral information medium necessary for analyzing and evaluating the risk for the environment.
3�JOURNAL SCIENTIFIC AND APPLIED RESEARCH Vol. 3, 20�3JOURNAL SCIENTIFIC AND APPLIED RESEARCH Vol. 3, 20�3
are probabilities for the appearance of temporal moments or temporal intervals with fixed values and they change from 0 to �.
For the environmentally dangerous phenomena the measurement value is the number
NEEN , OPEN , CAUSEN of the cases of a specific cause, operation, activity arising during the studied period of time Т. An additional measurement value is the duration NEET , OPET ,
CAUSET . They can be equal to the total time Т of measurement but they can also be a part of it.
The source of generating dangerous factors – the stressor is analogous in nature and it is a measurement value represented by
SOURSEN and SOURSET , respectively. Their significance is fully identical with the significance of the cause. The risk factor corresponds to the nature of the factor values. It can be of physical, chemical, biological, psycho-physiological and hybrid nature. Its name and description are of non-metrical character but when we introduce the number FACTORN of the cases when it arises and of their duration FACTORT it turns into a metrical random value. The risk factors and their levels are values that are measured in quantitative measureable units. Using the newly developed method for evaluation of the risk factors [2,�] we proceed to unified measurement values by introducing one-sided or two-sided limit of deviation.
Measurement values for the emission could be the number EMISSN
of emissions in a certain range of their probable values and the emission duration EMISST . The measurement values for the emission levels are the number EMLEVN of exceeded permitted values and the duration
EMLEVT of the exceeding. The same way we introduce the measurement values and their corresponding measurement units for: �) distribution medium - MIDDN and MIDDT ; 2) an area of compatibility of the object and the region of immission distribution -
IMLEVN and IMLEVT ; 3) immission -IMISSN and IMISST ; �) immission
levels - IMLEVN and IMLEVT ; �) time of polluting immissions - IMTIMEN and IMTIMET ; �) an object of impact - OBJECTN and OBJECTT ; �) contact places CONTN and CONTT ; �) a type of damage - TYPEN and TYPET ; �) an aspect of the damage ASPECTN and
ASPECTT ; �0) damage localization - LOCALN and LOCALT ; ��) a degree
of the damage - DEGREEN and DEGREET ; �2) compensation
RECOMN and COMPT ; �3) recovery - RECOVN and RECOVT .
The measurement values suggested correspond precisely to the main formulations for structuring and the conditions for defining the risk for the environment [2].
The measurement principles are determined by the type of phenomena on which the specific factor values of the risk are based. Because of that the principles of the State System for Ensuring Unity of Measurements
JOURNAL SCIENTIFIC AND APPLIED RESEARCH Vol. 3, 20�3
belong to a second group, an additional one to the principles of risk measurement.
Due to the nature of the measurement values three methods of measurement are applied: �) A direct method when the value is measured by reading a measuring device. It is used when measuring emissions, imissions, space, time and other natural or anthropogenic values. 2) An indirect method. It uses analytical dependencies between measurement values of metric, non-metric or combined type. 3) A combined method which is a totality of direct and indirect methods.
The measurement procedure consists of four stages: І-measuring the indicator risks along the axis indR ; ІІ-measuring the temporal risks along the axis TindR ; ІІІ-measuring the componential risks along the axis
kompR ; ІV-turning to united non-metrical values.
The transfer to non-metrical values is carried out as follows [�]:
�) N and T are analyzed as random values. The rule of distribution is determined by taking into account their character - discreet or indiscreet. We use in our experiments the software Risk 4.5, Razpredelenie 2.0, Entropia 1.0, Statistica 8.0, SPSS 15.0, Statgraphics Plus 7.0. For the discreet values we test the hypothesis of Poisson distribution, geometrical distribution, binomial distribution, hypergeometrical distribution, negative-binomial distribution, Bernoulli’s distribution. For the
indiscreet values we make a verification of the equal probability rule, the logarithmic-logistic distribution, gamma distribution, Pearson distribution, normal distribution, triangular distribution, beta distribution, Gumbel distribution, logarithmic-normal distribution, exponential distribution, Weibull distribution, Erlang distribution, logistic distribution, Wald distribution and Relay distribution.
2) We calculate the probability PzN for N values and the probability PzT for arising of Т in the ranges Nср and Тср where Nср and Тср are the mean values; -mean-square deviation of measurement values. The second range of significance is from minN to
maxN and from minT to maxT . This range is considerably wider, the probabilities PzN and PzT are bigger, consequently the values of the risk increase. We consider it more appropriate because it takes into account the whole scope of deviation of measurement values.
In virtue of the presented basic assumptions the measurement of the risk could be generally defined as a system of operations for collecting, processing, generalizing and managing the risk information, as well as saving it on disks. There are complex straight and reverse relations and cycles between the separate operations. Measuring the risk creates integral information medium necessary for analyzing and evaluating the risk for the environment.
�0 JOURNAL SCIENTIFIC AND APPLIED RESEARCH Vol. 3, 20�3JOURNAL SCIENTIFIC AND APPLIED RESEARCH Vol. 3, 20�3
At the beginning the risk measurement is formalized according to the ecologically dangerous object. To accomplish this goal we define the studied system of economic activity. We specify its aim, tasks and structure. We determine the general and specific functions by taking into consideration the interactions in the system. Then a descriptive model of the threats should be made. It is a natural-language formalization of the scenarios for emergence and development of the risk and it is a requirement for reliability of the risk models’ formulation. It directly influences the indefiniteness and vagueness of risk measurements.
The scenarios are modeled through polysituational models. It is suitable to collect the results in an information block. Taxonomic processing of the risk is carried out in order to find out the significant relationships between the elements of the polysituational models. These relationships are a sufficient condition for developing monosituational models.
The next stage consists of defining the factor values of the risk. Their nature and character determine the principle of their measurement -quantitative or categorical. The principle of measurement leads to the measurement methods - direct, indirect and combined. They form a database of knowledge about the measurement methods. The choice of devices for measuring the factor values is made on the basis of a comparative analysis of their basic meteorological characteristics. This
requires information full enough about variants of measurement devices. Defining metrical factor values is related to performing a series of activities for determining the value. It is made by the chosen measurement devices. On the basis of the above-mentioned idea it is converted into a united non-metrical value. The conversion is done in parallel with the processing of the measurement results, irrespective of the character of the measurement values.
We perform the measurement operations of indicator and temporal risks successively. The measurement along the axis indR in function of
TindR creates an area of points in their plane. The measurement along the axis kompR is represented by calculating the componential risks. The values along this axis form planes of points which inform us about the quantity of the risk. In risk measurement a vector method is suggested for defining and determining criticalities and safety analytically [2]. The influence of the elementary and phase conversions is considered, as well as the influence of the risks in cause-effect relationships. The method is based on four definitions: �) Criticalities are a combination of risks of dangerous phenomena, dangerous activities and dangerous effects arising in time; 2) The indicator criticality is a system of indicator risks arising in time, while the componential criticality arises from componential risks, respectively; 3) The differential criticality is a
JOURNAL SCIENTIFIC AND APPLIED RESEARCH Vol. 3, 20�3
totality of arising in temporal function risks for separate appearance of dangerous phenomena, of dangerous activities and of dangerous effects; �) The integral criticality is a combination of appearing together componential risks of dangerous phenomena, dangerous activities and dangerous effects. The criticalities can be presented in a diagram. Areas of points are formed for each value of the components
FenindR , ActindR ,
EffindR in the plane TindR – indR . Each one of these areas depicts the indicator differential criticalities
FenGsit , ActGsit , EffGsit . The size of the vectors to the centres FenCdc ,
ActCdc , EffCdc of the areas of points determines the differential criticalities. Each point of the mentioned areas has a corresponding point in the dimension of the componential differential risks. They form the planes FenGsat , ActGsat , EffGsat . Each plane is represented by the centres FenCic , ActCic , EffCic . The vectors are determinants of the componential differential criticalities.
The integral criticality IntegG is defined by the size of the set of componential risks FenGsat , ActGsat ,
EffGsat . The ecological insecurity is
equal to the criticalities. The sum of the ecological safety and the ecological insecurity is � as they are alternatives. This regularity determines the ecological safety.
CONCLUSIONS This study suggests and presents
a procedure for measuring the risk which reflects precisely and thoroughly the threats to the environment caused by economic activities.
The paper explains the logics behind the risk measurement.
It works out the order and content of the measurement procedure and shows arguments for the operations, the measurement values and the measurement units.
The article presents the way for defining the numerical values of the risk and through it we define the criticalities and the ecological safety.
REFERENCES �. Vladimirov, L. Risk Information
Environment (in Bulgarian), Varna Free University Year-book, XII, 200�: 233-2��.
2. Vladimirov, L. Risk-metrics in Ecological Safety (in Bulgarian), Varna Free University, 200�.
3. Vladimirov, L. Modeling Criticalities (in Bulgarian), Mechanics, Transport, Communications 3 (І), 200�: 16-21.
�. Vladimirov, L., V. Tomov. An Integral Model of Criticality (in Bulgarian), “TRANS & MOTAUTO 2007” International Scientific Conference Proceedings. Russe, 200�: ��-�3.
�. Vladimirov, L. Method of Assessment of Environmental Security of dangerous plants, Journal of Material Science and Technology �� (3), 200�: 2�0-2��.
��JOURNAL SCIENTIFIC AND APPLIED RESEARCH Vol. 3, 20�3JOURNAL SCIENTIFIC AND APPLIED RESEARCH Vol. 3, 20�3
At the beginning the risk measurement is formalized according to the ecologically dangerous object. To accomplish this goal we define the studied system of economic activity. We specify its aim, tasks and structure. We determine the general and specific functions by taking into consideration the interactions in the system. Then a descriptive model of the threats should be made. It is a natural-language formalization of the scenarios for emergence and development of the risk and it is a requirement for reliability of the risk models’ formulation. It directly influences the indefiniteness and vagueness of risk measurements.
The scenarios are modeled through polysituational models. It is suitable to collect the results in an information block. Taxonomic processing of the risk is carried out in order to find out the significant relationships between the elements of the polysituational models. These relationships are a sufficient condition for developing monosituational models.
The next stage consists of defining the factor values of the risk. Their nature and character determine the principle of their measurement -quantitative or categorical. The principle of measurement leads to the measurement methods - direct, indirect and combined. They form a database of knowledge about the measurement methods. The choice of devices for measuring the factor values is made on the basis of a comparative analysis of their basic meteorological characteristics. This
requires information full enough about variants of measurement devices. Defining metrical factor values is related to performing a series of activities for determining the value. It is made by the chosen measurement devices. On the basis of the above-mentioned idea it is converted into a united non-metrical value. The conversion is done in parallel with the processing of the measurement results, irrespective of the character of the measurement values.
We perform the measurement operations of indicator and temporal risks successively. The measurement along the axis indR in function of
TindR creates an area of points in their plane. The measurement along the axis kompR is represented by calculating the componential risks. The values along this axis form planes of points which inform us about the quantity of the risk. In risk measurement a vector method is suggested for defining and determining criticalities and safety analytically [2]. The influence of the elementary and phase conversions is considered, as well as the influence of the risks in cause-effect relationships. The method is based on four definitions: �) Criticalities are a combination of risks of dangerous phenomena, dangerous activities and dangerous effects arising in time; 2) The indicator criticality is a system of indicator risks arising in time, while the componential criticality arises from componential risks, respectively; 3) The differential criticality is a
JOURNAL SCIENTIFIC AND APPLIED RESEARCH Vol. 3, 20�3
totality of arising in temporal function risks for separate appearance of dangerous phenomena, of dangerous activities and of dangerous effects; �) The integral criticality is a combination of appearing together componential risks of dangerous phenomena, dangerous activities and dangerous effects. The criticalities can be presented in a diagram. Areas of points are formed for each value of the components
FenindR , ActindR ,
EffindR in the plane TindR – indR . Each one of these areas depicts the indicator differential criticalities
FenGsit , ActGsit , EffGsit . The size of the vectors to the centres FenCdc ,
ActCdc , EffCdc of the areas of points determines the differential criticalities. Each point of the mentioned areas has a corresponding point in the dimension of the componential differential risks. They form the planes FenGsat , ActGsat , EffGsat . Each plane is represented by the centres FenCic , ActCic , EffCic . The vectors are determinants of the componential differential criticalities.
The integral criticality IntegG is defined by the size of the set of componential risks FenGsat , ActGsat ,
EffGsat . The ecological insecurity is
equal to the criticalities. The sum of the ecological safety and the ecological insecurity is � as they are alternatives. This regularity determines the ecological safety.
CONCLUSIONS This study suggests and presents
a procedure for measuring the risk which reflects precisely and thoroughly the threats to the environment caused by economic activities.
The paper explains the logics behind the risk measurement.
It works out the order and content of the measurement procedure and shows arguments for the operations, the measurement values and the measurement units.
The article presents the way for defining the numerical values of the risk and through it we define the criticalities and the ecological safety.
REFERENCES �. Vladimirov, L. Risk Information
Environment (in Bulgarian), Varna Free University Year-book, XII, 200�: 233-2��.
2. Vladimirov, L. Risk-metrics in Ecological Safety (in Bulgarian), Varna Free University, 200�.
3. Vladimirov, L. Modeling Criticalities (in Bulgarian), Mechanics, Transport, Communications 3 (І), 200�: 16-21.
�. Vladimirov, L., V. Tomov. An Integral Model of Criticality (in Bulgarian), “TRANS & MOTAUTO 2007” International Scientific Conference Proceedings. Russe, 200�: ��-�3.
�. Vladimirov, L. Method of Assessment of Environmental Security of dangerous plants, Journal of Material Science and Technology �� (3), 200�: 2�0-2��.
�2 JOURNAL SCIENTIFIC AND APPLIED RESEARCH Vol. 3, 20�3JOURNAL SCIENTIFIC AND APPLIED RESEARCH Vol. 3, 20�3
Original Contribution
Journal scientific and applied research, vol. 3, 20�3 Association Scientific and Applied Research
International Journal ISSN �3��-�2��
ENVIRONMENT MANAGEMENT IN STUDENTS HIGHER
EDUCATION
Lyubomir V. Vladimirov, Nikolai Y. Kovachev, Plamen M. Manev, Vladimir T. Vladimirov
University of Ruse, Agrarian and Industrial faculty, 8 Studentska street, 7017 Ruse
Abstract: The purpose of the work is in taking appropriate training themes for the educational level of qualification "bachelor". The main research directions are: 1) Definition of the purpose and objectives of training, 2) Substantiation of the major themes in education, 3) Formulation of topics and methodology for conducting exercises to achieve the necessary practical training, 4) Development of technology training.
Keywords: environment, protection, management, student, education.
The higher education is a
complete permanently alternating system. This tendency will continue in future with the requirement to adapt to the system in the EU. The present paper aims to bring out a proper thematic consistence for specialist education with higher technical education on bachelor degree of sciences. To develop the topic the following problems must be solved: �) Definition of the aim and purposes of the education; 2) Grounding of the main training topics; 3) The training exercises to acquire necessary practical experience - subjects and methodologies formulation; �) Development of the educational technology.
Based on our experience in students teaching a syllabus was made
on the direction of Environmental protection and management. Its main purpose was to acquire knowledge and skills in synthesis and analyze application of technical, organizing and management solutions on environmental safety of the manufacture processes and equipment and environmental protection. The problems to solve are: �) Mastering of: a) main terms, definitions and categories in the environmental risk theory and safety; b) principles and methods in environmental risk of the technical and production systems analyses; c) risk sources, parameters, impacts, effects, standardization, measurement and assessment of risk factors, specifying the level of environmental safety regulated at Bulgarian and International acts; 2)
JOURNAL SCIENTIFIC AND APPLIED RESEARCH Vol. 3, 20�3
Improving the methodic for environmentally safety technical productive systems design; 3) Acquiring knowledge for: a) main principles, methods and instruments for environmental protection; b) environmentally adaptability of the industrial systems; c) main awkward for management solutions in environmental protection formulation; d) environmental legislations and rations. The subject has incoming links with Physics, Chemistry, Material-knowledge, Mechanics, Machine elements, Electrical engineering and etc. In order to achieve the aim and to solve the laid problems the syllabus envelops three divisions: I. Environmental risk; II. Environmental protection; III. Environmental management.
At the first division - Environmental risk – the main definitions and categories are introduced [3,�]. Based on the terms origin a linguistic-semantic analysis is made. The risk classifications on sources, causes, risk factors emissions and imissions, dispersion medium and other indications are shown. Especial attention is lighted on the methodic for environmental and other type of risk assessment [�,�,�]. Consecutively are examined the different stages – formulation of the environmental problems, risk analyses and assessment. The main information’s sources are introduced. The characteristics of danger phenomenons and effects in the environment are analyzed. Constituting the conceptual model of the environmental risk is an important
moment. The main requirements and stages are developed. The three stages of the assessment are visualized with examples for environmental risk for air, water, food and other types of pollution. The important position has the part of the methods and risk assessment criteria. The students are introduced with the methods for definition of the probability for danger phenomenons, events and impacts appearance – statistical, experts, imitation design.
At the stage of the environmental management conception, included at this part of the program, an acquaintance with the principles, comprehensions, approaches and their link with the sustainable development program. A parallel with the environmental risk management, which activities could be divided into preventive, correctional – reduction and compensative, is performed. Particular attention is turned to the conflict between economical interests and environmental solutions. The different modern principles and methods for solution taking are introduced.
The second syllabus partition is concerned to the environmental protection [�,2,3,�,�,�]. Consequently are introduced the environmental legislations and standards, air protection, water protection, wastes pollution protection.
The accent in environmental legislations and standards impacts the Environmental Protection Act. That’s why it is represented in details. The main arrangements at the Act are revealed. The main principles in
�3JOURNAL SCIENTIFIC AND APPLIED RESEARCH Vol. 3, 20�3JOURNAL SCIENTIFIC AND APPLIED RESEARCH Vol. 3, 20�3
Original Contribution
Journal scientific and applied research, vol. 3, 20�3 Association Scientific and Applied Research
International Journal ISSN �3��-�2��
ENVIRONMENT MANAGEMENT IN STUDENTS HIGHER
EDUCATION
Lyubomir V. Vladimirov, Nikolai Y. Kovachev, Plamen M. Manev, Vladimir T. Vladimirov
University of Ruse, Agrarian and Industrial faculty, 8 Studentska street, 7017 Ruse
Abstract: The purpose of the work is in taking appropriate training themes for the educational level of qualification "bachelor". The main research directions are: 1) Definition of the purpose and objectives of training, 2) Substantiation of the major themes in education, 3) Formulation of topics and methodology for conducting exercises to achieve the necessary practical training, 4) Development of technology training.
Keywords: environment, protection, management, student, education.
The higher education is a
complete permanently alternating system. This tendency will continue in future with the requirement to adapt to the system in the EU. The present paper aims to bring out a proper thematic consistence for specialist education with higher technical education on bachelor degree of sciences. To develop the topic the following problems must be solved: �) Definition of the aim and purposes of the education; 2) Grounding of the main training topics; 3) The training exercises to acquire necessary practical experience - subjects and methodologies formulation; �) Development of the educational technology.
Based on our experience in students teaching a syllabus was made
on the direction of Environmental protection and management. Its main purpose was to acquire knowledge and skills in synthesis and analyze application of technical, organizing and management solutions on environmental safety of the manufacture processes and equipment and environmental protection. The problems to solve are: �) Mastering of: a) main terms, definitions and categories in the environmental risk theory and safety; b) principles and methods in environmental risk of the technical and production systems analyses; c) risk sources, parameters, impacts, effects, standardization, measurement and assessment of risk factors, specifying the level of environmental safety regulated at Bulgarian and International acts; 2)
JOURNAL SCIENTIFIC AND APPLIED RESEARCH Vol. 3, 20�3
Improving the methodic for environmentally safety technical productive systems design; 3) Acquiring knowledge for: a) main principles, methods and instruments for environmental protection; b) environmentally adaptability of the industrial systems; c) main awkward for management solutions in environmental protection formulation; d) environmental legislations and rations. The subject has incoming links with Physics, Chemistry, Material-knowledge, Mechanics, Machine elements, Electrical engineering and etc. In order to achieve the aim and to solve the laid problems the syllabus envelops three divisions: I. Environmental risk; II. Environmental protection; III. Environmental management.
At the first division - Environmental risk – the main definitions and categories are introduced [3,�]. Based on the terms origin a linguistic-semantic analysis is made. The risk classifications on sources, causes, risk factors emissions and imissions, dispersion medium and other indications are shown. Especial attention is lighted on the methodic for environmental and other type of risk assessment [�,�,�]. Consecutively are examined the different stages – formulation of the environmental problems, risk analyses and assessment. The main information’s sources are introduced. The characteristics of danger phenomenons and effects in the environment are analyzed. Constituting the conceptual model of the environmental risk is an important
moment. The main requirements and stages are developed. The three stages of the assessment are visualized with examples for environmental risk for air, water, food and other types of pollution. The important position has the part of the methods and risk assessment criteria. The students are introduced with the methods for definition of the probability for danger phenomenons, events and impacts appearance – statistical, experts, imitation design.
At the stage of the environmental management conception, included at this part of the program, an acquaintance with the principles, comprehensions, approaches and their link with the sustainable development program. A parallel with the environmental risk management, which activities could be divided into preventive, correctional – reduction and compensative, is performed. Particular attention is turned to the conflict between economical interests and environmental solutions. The different modern principles and methods for solution taking are introduced.
The second syllabus partition is concerned to the environmental protection [�,2,3,�,�,�]. Consequently are introduced the environmental legislations and standards, air protection, water protection, wastes pollution protection.
The accent in environmental legislations and standards impacts the Environmental Protection Act. That’s why it is represented in details. The main arrangements at the Act are revealed. The main principles in
�� JOURNAL SCIENTIFIC AND APPLIED RESEARCH Vol. 3, 20�3JOURNAL SCIENTIFIC AND APPLIED RESEARCH Vol. 3, 20�3
environmental protection, sustainable development, human health risk reduction-advantages and disadvantages, society participation and transparency in solutions taking in the sphere of environmental protection, citizens notifications for the state of environment and etc. It is important to know the direction of the state politics and management in environmental protection. In that relation the rights and obligations of the main institution - Ministry of Environment and Waters, respectively its minister. In addition the rights and the obligations of the other ministries and municipalities. Protection and utilization of the environment’s components, including waste management, are undivided part the strategic management. Because of that it is appropriate to give knowledge to the students for the protection and usage rules of the water and water objects, soil, bowels of the earth, biodiversity and air. The three components are included: a) prevention or reducing waste generation and the extent of their danger; b) recycling the wastes, second usage and regeneration or other type of process with extraction of energy or by-products; c) safety storage of the wastes, unusable on this stage of development. The strategies and programs for the environment, as well as the assessment and impact upon environmental are introduced. Industrial pollution as an anthropogenic origin substances directly or indirectly entering to the air, water or the soils, generation of vibrations, radiation and noise
concerns the main professional direction of the students. It has harmful impact and damages the material values, limits or reduce the possibilities for useful environmental parameters consumption and all of it legal utilization. So, it is necessary to introduce in details, to analyze and to develop technical and management environmental solutions on their base. In parallel with the pollution it is provided to get the students acquainted with the national monitoring system and their subdivisions. I. National air monitoring net, precipitation, surface, underground and sea waters, the land and soil, noise pollution, non ionize radiation, warehouses and old pollutions with wastes, biological and radiological monitoring; II. Control and information system of the air emissions and wastewater status; III. Exploitation, communication and information provision and laboratory net service.
We consider it is necessary the students to be acquainted with the purposes of the national environmental monitoring system, especially monitoring taking of the national nets for environment components condition, data processing, analyses, visualization and data storage from the net or personal monitoring, information supporting for operation control, state prediction, environmental risk assessment and development of the strategies for environment components improvement and etc.
The education methods and resources for environmental
JOURNAL SCIENTIFIC AND APPLIED RESEARCH Vol. 3, 20�3
protection are developed on a specific range of pollutants, standardization and pollution protection. It is introduced particular pollutants investigation, lighting upon specific types of categories, depending on the student’s specialty.
Analyzing ambient air pollution we find it is appropriate to consider suspended particles, carbon monoxides, dioxides and trioxides of the sulphur and nitrogen, chlorine, hydrogen fluoride, chlorine fluoride and hydrochloric acid, nitric acid, sulphuric acid and etc [3,�].
The methods for ambient air cleaning are introduced in two directions – dust cleaning and dust – steam and vapor pollutants cleaning. This knowledge should be limited to the principle of action and determination of the effectiveness of the ambient air protection. Water pollution is explained as a process of entering into water bodies of pollutants, microorganisms or heat. Detailed analyzes the main source of pollution, anthropogenic activity, particularly manufacturing and mainly industrial activities. The main pollutants in wastewater to be presented to students may be: a) dissolved organic matter; b) suspended agents; c) mineral oils; e) inorganic salts; f) acids and bases; g) toxicological agents; h) heat water; i) coloring agents; j) bacteriological agents; k) radiactivity agents; l) blowing agents
Considering them the limits on pollution in the five groups of indicators are determined-common physicals and inorganic chemical
parameters, common indicators of organic pollutants, indicators of inorganic substances with industrial origin, indicators of organic compounds with industrial origin, biological indicators. In the protection of waters against pollution starting with sanitary protection zones for drinking water. The focus then is turned on four main methods, namely: mechanical, physicochemical, chemical, biochemical. From mechanical to be studied percolation, and filtering, and physic - chemical, flotation, adsorption treatment, ion exchange purification, extraction, reverse osmosis, ultra filtration and hypotheses. In class, based on the need for specific knowledge, it is appropriate to tackle some chemical methods such as neutralization, softening, desalination, etc. Similarly, students' attention can be emphasized on the aerobic and anaerobic treatment, and decontamination as the main methods for biological treatment of wastewater. Complex for the training appears the problem of soil contamination. The process of contamination is difficult to explain because it is necessary to know the basic phenomena, indicators and effects of soil. Based on this data to examine characteristics of degraded, contaminated or degraded soils. It is appropriate to contact the factors that lowering the soil fertility, desertification, acidification and dehumanization. It is separately studied the soil pollution. It is seen as a process of entering the soil from anthropogenic activity of substances and organisms adversely affecting
��JOURNAL SCIENTIFIC AND APPLIED RESEARCH Vol. 3, 20�3JOURNAL SCIENTIFIC AND APPLIED RESEARCH Vol. 3, 20�3
environmental protection, sustainable development, human health risk reduction-advantages and disadvantages, society participation and transparency in solutions taking in the sphere of environmental protection, citizens notifications for the state of environment and etc. It is important to know the direction of the state politics and management in environmental protection. In that relation the rights and obligations of the main institution - Ministry of Environment and Waters, respectively its minister. In addition the rights and the obligations of the other ministries and municipalities. Protection and utilization of the environment’s components, including waste management, are undivided part the strategic management. Because of that it is appropriate to give knowledge to the students for the protection and usage rules of the water and water objects, soil, bowels of the earth, biodiversity and air. The three components are included: a) prevention or reducing waste generation and the extent of their danger; b) recycling the wastes, second usage and regeneration or other type of process with extraction of energy or by-products; c) safety storage of the wastes, unusable on this stage of development. The strategies and programs for the environment, as well as the assessment and impact upon environmental are introduced. Industrial pollution as an anthropogenic origin substances directly or indirectly entering to the air, water or the soils, generation of vibrations, radiation and noise
concerns the main professional direction of the students. It has harmful impact and damages the material values, limits or reduce the possibilities for useful environmental parameters consumption and all of it legal utilization. So, it is necessary to introduce in details, to analyze and to develop technical and management environmental solutions on their base. In parallel with the pollution it is provided to get the students acquainted with the national monitoring system and their subdivisions. I. National air monitoring net, precipitation, surface, underground and sea waters, the land and soil, noise pollution, non ionize radiation, warehouses and old pollutions with wastes, biological and radiological monitoring; II. Control and information system of the air emissions and wastewater status; III. Exploitation, communication and information provision and laboratory net service.
We consider it is necessary the students to be acquainted with the purposes of the national environmental monitoring system, especially monitoring taking of the national nets for environment components condition, data processing, analyses, visualization and data storage from the net or personal monitoring, information supporting for operation control, state prediction, environmental risk assessment and development of the strategies for environment components improvement and etc.
The education methods and resources for environmental
JOURNAL SCIENTIFIC AND APPLIED RESEARCH Vol. 3, 20�3
protection are developed on a specific range of pollutants, standardization and pollution protection. It is introduced particular pollutants investigation, lighting upon specific types of categories, depending on the student’s specialty.
Analyzing ambient air pollution we find it is appropriate to consider suspended particles, carbon monoxides, dioxides and trioxides of the sulphur and nitrogen, chlorine, hydrogen fluoride, chlorine fluoride and hydrochloric acid, nitric acid, sulphuric acid and etc [3,�].
The methods for ambient air cleaning are introduced in two directions – dust cleaning and dust – steam and vapor pollutants cleaning. This knowledge should be limited to the principle of action and determination of the effectiveness of the ambient air protection. Water pollution is explained as a process of entering into water bodies of pollutants, microorganisms or heat. Detailed analyzes the main source of pollution, anthropogenic activity, particularly manufacturing and mainly industrial activities. The main pollutants in wastewater to be presented to students may be: a) dissolved organic matter; b) suspended agents; c) mineral oils; e) inorganic salts; f) acids and bases; g) toxicological agents; h) heat water; i) coloring agents; j) bacteriological agents; k) radiactivity agents; l) blowing agents
Considering them the limits on pollution in the five groups of indicators are determined-common physicals and inorganic chemical
parameters, common indicators of organic pollutants, indicators of inorganic substances with industrial origin, indicators of organic compounds with industrial origin, biological indicators. In the protection of waters against pollution starting with sanitary protection zones for drinking water. The focus then is turned on four main methods, namely: mechanical, physicochemical, chemical, biochemical. From mechanical to be studied percolation, and filtering, and physic - chemical, flotation, adsorption treatment, ion exchange purification, extraction, reverse osmosis, ultra filtration and hypotheses. In class, based on the need for specific knowledge, it is appropriate to tackle some chemical methods such as neutralization, softening, desalination, etc. Similarly, students' attention can be emphasized on the aerobic and anaerobic treatment, and decontamination as the main methods for biological treatment of wastewater. Complex for the training appears the problem of soil contamination. The process of contamination is difficult to explain because it is necessary to know the basic phenomena, indicators and effects of soil. Based on this data to examine characteristics of degraded, contaminated or degraded soils. It is appropriate to contact the factors that lowering the soil fertility, desertification, acidification and dehumanization. It is separately studied the soil pollution. It is seen as a process of entering the soil from anthropogenic activity of substances and organisms adversely affecting
�� JOURNAL SCIENTIFIC AND APPLIED RESEARCH Vol. 3, 20�3JOURNAL SCIENTIFIC AND APPLIED RESEARCH Vol. 3, 20�3
fertility, productivity and self-purification of soil, lowering technological, food hygiene and health value of cultivation and quality of other natural objects. It considers to a variety of sources, wastewater, fumes and aerosols (direct and via precipitation) wastes. Soil is exposed as a system of actions aimed on preventing the reduction of fertility, pollution and irrational use. Make a classification of protective actions. Preventive and corrective measures associated with the protection of air and water because they are among determining contaminant migration. Compensating actions are divided into ameliorative and cultivation. Since irrigation is focused on the mechanical (excavation of the contaminated layer, transport and burial in landfills, and deep tillage), chemical (dilution of pollutants and location of pollutants in the soil) and irrigation methods (sprinkler irrigation and soil).
The nature, classification and properties are the basic topic for waste conservation. The definitions and classifications are considered under the acts on waste management. The properties are presented in details as they are significant part the methods of treatment. Deals with the physical (dimensional weight, morphological composition, fractional composition, humidity), chemical (content of organic and mineral substances, total ammonia and nitrate nitrogen, phosphorus, calcium, carbon, sulfates, chlorides, pH, and many others), thermo (calorific , ash, nitrogen, sulfur, carbon, oxygen,
moisture, volatile matter, volume weight), biological, microbiological (total macrobiotic, total microbes) and hygiene (bacteriological, entomological and helminthological). An important classification to be emphasized is the level of danger, explosive, oxidizing, and high flammability, flammable, irritant, harmful, toxic, etc. [3,�].
We consider it is necessary to study the most important methods for protection against pollutions caused by waste, non-waste technologies and industries, landfills, composting, recycling, incineration and pyrolysis. With the methods of protection from pollution of air, water and soil, there must be a comparative analysis to identify the advantages and disadvantages of different methods for recording the properties of the waste.
Waste management is taught law related to waste [�]. Presented as a set of rights, responsibilities, decisions, actions and activities. Connect with the generation and waste treatment, based on the information and forms of control. Management should be seen as system activities aimed to prevent, reduce or limit the harmful impacts of waste on human health and the environment. Obligations of persons treating wastes and waste holders are distinguished and their duties are defined. It is envisaged that discussion and exposure to students of administrative arrangements for treatment and transportation of waste, information on the activities of waste management programs of waste and control.
JOURNAL SCIENTIFIC AND APPLIED RESEARCH Vol. 3, 20�3
The third section of the curriculum is called "Environmental Management System" It is studied on a corporate level [3,�,�]. For full utilization of the students are introduced with the theoretical foundations of management. Starting with the market economy transition to the new models. A comparison between different models of market economy based on ownership structure, size and degree of government regulation and the degree of commercialization. The new dynamics of economic growth through the release of old structures and ways of thinking is introduced. A detailed review of common methods and techniques of management is made. Firstly it is presented the methods for forecasting, extrapolation methods, comparative method, the expertise, methods of modeling. Techniques of management decisions are paying particular attention to the selection list of Alex Osborne [�,�].
The next stage is to introduce students with the cycle management, functions and structure. The management process is treated as a set of discrete time cycles that are characterized by repetitive patterns. It is explained as a kind of continuous and deliberate intervention in the development of processes and phenomena, so that changes can be in the interest of the subject of government to implement its previously settled goals. Management process in nature is analyzed as a temporary border controls. He explains the form of relatively distinct time period which includes a specific
order of procedures with a stability and repeatability, without denying the past. Students are introduced to the classification of the stages in the management according to R. Akoff, including a decision, implementation, evaluation and recommendation for amendment. The examples for management cycles of alternatives associated with the development of an object are presented. The phases of management - leadership, planning, organization, control, regulation are discussing. Each phase is realized through the implementation of numerous management functions. Each function consists of management activities Each activity is treated as a system of tasks and each task achieved through the implementation of the operations which are building blocks of the management system. The types of governance structures are introduced. Attention is drawn to the impact of human factors in management. Considering the economic aspects of the environment later in the curriculum is on investment management - nature and scope of capital investments, the conceptual apparatus and the types of investments, sources of funds for capital investments.
Environmental management at corporate level is a major part in this section. The nature, aims and objectives of management are associated with the life cycle of production. Thus it is highlighted the position and the role of the environment in all phases of this cycle. The requirements and criteria
��JOURNAL SCIENTIFIC AND APPLIED RESEARCH Vol. 3, 20�3JOURNAL SCIENTIFIC AND APPLIED RESEARCH Vol. 3, 20�3
fertility, productivity and self-purification of soil, lowering technological, food hygiene and health value of cultivation and quality of other natural objects. It considers to a variety of sources, wastewater, fumes and aerosols (direct and via precipitation) wastes. Soil is exposed as a system of actions aimed on preventing the reduction of fertility, pollution and irrational use. Make a classification of protective actions. Preventive and corrective measures associated with the protection of air and water because they are among determining contaminant migration. Compensating actions are divided into ameliorative and cultivation. Since irrigation is focused on the mechanical (excavation of the contaminated layer, transport and burial in landfills, and deep tillage), chemical (dilution of pollutants and location of pollutants in the soil) and irrigation methods (sprinkler irrigation and soil).
The nature, classification and properties are the basic topic for waste conservation. The definitions and classifications are considered under the acts on waste management. The properties are presented in details as they are significant part the methods of treatment. Deals with the physical (dimensional weight, morphological composition, fractional composition, humidity), chemical (content of organic and mineral substances, total ammonia and nitrate nitrogen, phosphorus, calcium, carbon, sulfates, chlorides, pH, and many others), thermo (calorific , ash, nitrogen, sulfur, carbon, oxygen,
moisture, volatile matter, volume weight), biological, microbiological (total macrobiotic, total microbes) and hygiene (bacteriological, entomological and helminthological). An important classification to be emphasized is the level of danger, explosive, oxidizing, and high flammability, flammable, irritant, harmful, toxic, etc. [3,�].
We consider it is necessary to study the most important methods for protection against pollutions caused by waste, non-waste technologies and industries, landfills, composting, recycling, incineration and pyrolysis. With the methods of protection from pollution of air, water and soil, there must be a comparative analysis to identify the advantages and disadvantages of different methods for recording the properties of the waste.
Waste management is taught law related to waste [�]. Presented as a set of rights, responsibilities, decisions, actions and activities. Connect with the generation and waste treatment, based on the information and forms of control. Management should be seen as system activities aimed to prevent, reduce or limit the harmful impacts of waste on human health and the environment. Obligations of persons treating wastes and waste holders are distinguished and their duties are defined. It is envisaged that discussion and exposure to students of administrative arrangements for treatment and transportation of waste, information on the activities of waste management programs of waste and control.
JOURNAL SCIENTIFIC AND APPLIED RESEARCH Vol. 3, 20�3
The third section of the curriculum is called "Environmental Management System" It is studied on a corporate level [3,�,�]. For full utilization of the students are introduced with the theoretical foundations of management. Starting with the market economy transition to the new models. A comparison between different models of market economy based on ownership structure, size and degree of government regulation and the degree of commercialization. The new dynamics of economic growth through the release of old structures and ways of thinking is introduced. A detailed review of common methods and techniques of management is made. Firstly it is presented the methods for forecasting, extrapolation methods, comparative method, the expertise, methods of modeling. Techniques of management decisions are paying particular attention to the selection list of Alex Osborne [�,�].
The next stage is to introduce students with the cycle management, functions and structure. The management process is treated as a set of discrete time cycles that are characterized by repetitive patterns. It is explained as a kind of continuous and deliberate intervention in the development of processes and phenomena, so that changes can be in the interest of the subject of government to implement its previously settled goals. Management process in nature is analyzed as a temporary border controls. He explains the form of relatively distinct time period which includes a specific
order of procedures with a stability and repeatability, without denying the past. Students are introduced to the classification of the stages in the management according to R. Akoff, including a decision, implementation, evaluation and recommendation for amendment. The examples for management cycles of alternatives associated with the development of an object are presented. The phases of management - leadership, planning, organization, control, regulation are discussing. Each phase is realized through the implementation of numerous management functions. Each function consists of management activities Each activity is treated as a system of tasks and each task achieved through the implementation of the operations which are building blocks of the management system. The types of governance structures are introduced. Attention is drawn to the impact of human factors in management. Considering the economic aspects of the environment later in the curriculum is on investment management - nature and scope of capital investments, the conceptual apparatus and the types of investments, sources of funds for capital investments.
Environmental management at corporate level is a major part in this section. The nature, aims and objectives of management are associated with the life cycle of production. Thus it is highlighted the position and the role of the environment in all phases of this cycle. The requirements and criteria
�� JOURNAL SCIENTIFIC AND APPLIED RESEARCH Vol. 3, 20�3JOURNAL SCIENTIFIC AND APPLIED RESEARCH Vol. 3, 20�3
are formulated to be met by projects in environmental management - environmental performance, fuel economy, maintenance of the affected groups, using innovative technologies, the possibility of transfer, the possibility of realization, handling and assessment; safety. In the teaching process further it is examined environmental policy as an instrument by which to declare the principles, objectives and intentions of the company in connection with environmental protection. Environmental policy is the basis for implementing and improving the management system. It is built on the goals and objectives of the company. The policy must be explicit to be understood by internal and external stakeholders to be reviewed and revised periodically to reflect changing requirements and performance.
The system for environmental management is a part of the system of corporate governance. The structure, the planning, responsibilities, practices, procedures, processes and resources for the formation of corporate environmental safety are introduced. The system presents environmental risks and opportunities for their management. Students are introduced to the five-stage system policy, planning, implementation and operation, checking and corrective action, management review. Separately each of the stages is considered. An important point is the audit which must be paid as a substantial part of the topic. Consequently are presented its
phases-introduction, preparation, conduct, report and record the audit. Set out the rights and obligations of the lead auditor and members of the audit team.
Environmental indicators are seen as indicators that provide useful and timely information about the company's environmental activities, and actions by which to influence it. Given are specific examples of indicators. The options for implementation are specified.
Another important point in examining the management system is to assess the effectiveness of environmental activities. Clarifying the use of indicators in operational, managerial and organizational field. Examples are given of different aspects of environmental action on it and the consequences for society. Eco-balances are presented as recorded information about the various raw materials, energy production and waste companies use and maintain for a period of time. This practice is taught in the form of a report on physical inputs, outputs and functional reserves of the company. The basic categories of ecological balance are presented. Connections of the balance of production processes with the company as a whole are made. The life cycle assessment, including systematization of the effects of production on the environment throughout its life cycle is the next important point on this topic. The aim is to identify and to quantify the environmental aspects of production. This is achieved based on a principle "from the cradle to the
JOURNAL SCIENTIFIC AND APPLIED RESEARCH Vol. 3, 20�3
grave" meaning envelope from the extraction of raw materials to disposal of production due to depletion of its consumer qualities. Identify the specific properties of these products that are most important for the environment. After assessing the lifecycle, manufacturers can focus their attention on those aspects that must be reduced and minimized. There are many reasons, and hence the purpose of assessing the life cycle can be divided into three areas: financial benefits, design, and marketing. The life cycle is directly related to the other instruments of environmental protection. The compilation of life cycle assessment is presented in three steps: defining the purpose and scope of the assessment, inventory, evaluation of data from the inventory. Range of the estimated life cycle dependents on the analysis determined primarily by the purposes, the available financial, human, technical, technological and other resources, the scope of the significant environmental impacts, accessibility and volume of required data. Inventory is the next stage. At this stage the students explaining how to collect data on the operation and damage to the environment that occur at different phases of the life cycle. Evaluation of the data inventory is the third last stage of life cycle assessment. The information collected should be grouped according to the type, nature and extent of action on the environment. Evaluation of the data inventory is the third last stage of life cycle assessment that is appropriate for students to know. The
information collected should be grouped according to the type, nature and extent of the impact on the environment. The report on the Environment is a kind of message information from the company for its activities in the environment. At first glance, a report is simple and routine work. Actually this is not true, as the report on the environment has a number of specific features that should be considered. Moreover, these requirements are included in the recommendations of the European Environment Agency. Therefore, students are acquainted with the detailed methodology for developing the report. Attention is drawn to define the goals to be placed with its development and promotion. Clarifies that these objectives are the basis for further work. Then it is introduced the manner to define the content of the report, taking into account the essential problems of the environment and the additional requirements of the audience for which it was intended. Same time are to include guidelines for identifying the information needed for the report. There are also a statement of the form, graphic illustrations, the structure and content of the report. Students are acquired with the appropriate skills to apply knowledge learned from lectures. Our experience shows that many suitable form are practical exercises. For technical specialty it is very suitable taking part into experimental exercises. They examine the extent of pollution in modeling systems or the effectiveness of various methods and devices for purification of waste gases
��JOURNAL SCIENTIFIC AND APPLIED RESEARCH Vol. 3, 20�3JOURNAL SCIENTIFIC AND APPLIED RESEARCH Vol. 3, 20�3
are formulated to be met by projects in environmental management - environmental performance, fuel economy, maintenance of the affected groups, using innovative technologies, the possibility of transfer, the possibility of realization, handling and assessment; safety. In the teaching process further it is examined environmental policy as an instrument by which to declare the principles, objectives and intentions of the company in connection with environmental protection. Environmental policy is the basis for implementing and improving the management system. It is built on the goals and objectives of the company. The policy must be explicit to be understood by internal and external stakeholders to be reviewed and revised periodically to reflect changing requirements and performance.
The system for environmental management is a part of the system of corporate governance. The structure, the planning, responsibilities, practices, procedures, processes and resources for the formation of corporate environmental safety are introduced. The system presents environmental risks and opportunities for their management. Students are introduced to the five-stage system policy, planning, implementation and operation, checking and corrective action, management review. Separately each of the stages is considered. An important point is the audit which must be paid as a substantial part of the topic. Consequently are presented its
phases-introduction, preparation, conduct, report and record the audit. Set out the rights and obligations of the lead auditor and members of the audit team.
Environmental indicators are seen as indicators that provide useful and timely information about the company's environmental activities, and actions by which to influence it. Given are specific examples of indicators. The options for implementation are specified.
Another important point in examining the management system is to assess the effectiveness of environmental activities. Clarifying the use of indicators in operational, managerial and organizational field. Examples are given of different aspects of environmental action on it and the consequences for society. Eco-balances are presented as recorded information about the various raw materials, energy production and waste companies use and maintain for a period of time. This practice is taught in the form of a report on physical inputs, outputs and functional reserves of the company. The basic categories of ecological balance are presented. Connections of the balance of production processes with the company as a whole are made. The life cycle assessment, including systematization of the effects of production on the environment throughout its life cycle is the next important point on this topic. The aim is to identify and to quantify the environmental aspects of production. This is achieved based on a principle "from the cradle to the
JOURNAL SCIENTIFIC AND APPLIED RESEARCH Vol. 3, 20�3
grave" meaning envelope from the extraction of raw materials to disposal of production due to depletion of its consumer qualities. Identify the specific properties of these products that are most important for the environment. After assessing the lifecycle, manufacturers can focus their attention on those aspects that must be reduced and minimized. There are many reasons, and hence the purpose of assessing the life cycle can be divided into three areas: financial benefits, design, and marketing. The life cycle is directly related to the other instruments of environmental protection. The compilation of life cycle assessment is presented in three steps: defining the purpose and scope of the assessment, inventory, evaluation of data from the inventory. Range of the estimated life cycle dependents on the analysis determined primarily by the purposes, the available financial, human, technical, technological and other resources, the scope of the significant environmental impacts, accessibility and volume of required data. Inventory is the next stage. At this stage the students explaining how to collect data on the operation and damage to the environment that occur at different phases of the life cycle. Evaluation of the data inventory is the third last stage of life cycle assessment. The information collected should be grouped according to the type, nature and extent of action on the environment. Evaluation of the data inventory is the third last stage of life cycle assessment that is appropriate for students to know. The
information collected should be grouped according to the type, nature and extent of the impact on the environment. The report on the Environment is a kind of message information from the company for its activities in the environment. At first glance, a report is simple and routine work. Actually this is not true, as the report on the environment has a number of specific features that should be considered. Moreover, these requirements are included in the recommendations of the European Environment Agency. Therefore, students are acquainted with the detailed methodology for developing the report. Attention is drawn to define the goals to be placed with its development and promotion. Clarifies that these objectives are the basis for further work. Then it is introduced the manner to define the content of the report, taking into account the essential problems of the environment and the additional requirements of the audience for which it was intended. Same time are to include guidelines for identifying the information needed for the report. There are also a statement of the form, graphic illustrations, the structure and content of the report. Students are acquired with the appropriate skills to apply knowledge learned from lectures. Our experience shows that many suitable form are practical exercises. For technical specialty it is very suitable taking part into experimental exercises. They examine the extent of pollution in modeling systems or the effectiveness of various methods and devices for purification of waste gases
�0 JOURNAL SCIENTIFIC AND APPLIED RESEARCH Vol. 3, 20�3JOURNAL SCIENTIFIC AND APPLIED RESEARCH Vol. 3, 20�3
and water. Creating diverse conditions and pollution. Thus the learning process can become research. May be included exercises to evaluate the usefulness of certain management decisions, such as analysis of the effectiveness of capital investments for construction of wastewater treatment facilities. Lectures are illustrated with videos, multimedia presentations, transparencies, reflecting a variety of devices for environment - primarily corporate presentations. Assessment is carried out on two tests for which they are given advance compendium of questions from lectures and exercises. It is adopted a system for objective assessment of knowledge, which is based on collecting points. For the presented approach application there are issued appropriate textbooks for classes. The concept for students training in technical education on the problems of environmental management is built on experience and in accordance with modern aspects and achievements. It is applied and its effectiveness is proven. It is repeatedly improved. There are three basic directions, which are included in the contents -environmental risk, environmental protection and environmental management. The horarium is small but sufficient for courses expanding.
the knowledge of future engineers The exercises are practical,
consistent with solving the problems inherent in everyday business practice. Some of them are held in establishments with typical situations of potential or apparent environmental contamination. Thus, learning is associated with the conditions and the business goals.
REFERENCES �. Kovachev, N., P. Manev, L.
Vladimirov. Noise and Vibration Protection. Ruse, Mediatech, 20�2.
2. Manev, P., L. Vladimirov. Water pollution and impact of the ecosystems. Ruse, Mediatech, 20�2.
3. Tomov, V., K. Papazov. Protection and management of environment. Ruse, University of Ruse, 200�.
�. Tomov, V., P. Hristov, A. Nenova. Environmental security, Varna, Varna free university, 20�0.
�. Vladimirov, L. Riskmetric in environmental security. Varna, Varna free university, 200�.
�. Vladimirov, L. Risk theory. Part I. Dangers and threats, risks and criticalities. Ruse, University of Ruse, 20��.
�. Vladimirov, L. Waste management. Part I. Determination, classification and norms. Ruse, Mediatech
JOURNAL SCIENTIFIC AND APPLIED RESEARCH Vol. 3, 20�3
Original Contribution
Journal scientific and applied research, vol. 3, 20�3 Association Scientific and Applied Research
International Journal ISSN �3��-�2��
APPLICATION OF SUMMARIZED FUNCTIONS FOR INFORMATION
SOURCE PROTECTION
Valerij I. Dzhurov
RUSE UNIVERSITY, BULGARIA, RUSE, STUDENTSKA � STR. Abstract: Probing signals are succession of impulses with defined frequency and amplitude. The succession itself could be “masked” using changing functions (from the main carrying) under specific laws. The sequence of impulses could be described by summarized functions of different type.
Key words: summarized functions, carrier frequency, pseudorandom sequence.
I. Introduction Summarized function of the
following type (�) �( ) , 0f x x
x
could not be locally integrable in the vicinity of the beginning of the coordinate system. Ignoring the area
containing the beginning of the coordinate system, locally integrable function can be received. Its graphic will consist of two equilateral hyperbolas with asymptotes corresponding axis Ox and Oy. (Fig. �)
Fig. �. Graphical interpretation of summarized function f(x) in Cartesian coordinate system xOy
��JOURNAL SCIENTIFIC AND APPLIED RESEARCH Vol. 3, 20�3JOURNAL SCIENTIFIC AND APPLIED RESEARCH Vol. 3, 20�3
and water. Creating diverse conditions and pollution. Thus the learning process can become research. May be included exercises to evaluate the usefulness of certain management decisions, such as analysis of the effectiveness of capital investments for construction of wastewater treatment facilities. Lectures are illustrated with videos, multimedia presentations, transparencies, reflecting a variety of devices for environment - primarily corporate presentations. Assessment is carried out on two tests for which they are given advance compendium of questions from lectures and exercises. It is adopted a system for objective assessment of knowledge, which is based on collecting points. For the presented approach application there are issued appropriate textbooks for classes. The concept for students training in technical education on the problems of environmental management is built on experience and in accordance with modern aspects and achievements. It is applied and its effectiveness is proven. It is repeatedly improved. There are three basic directions, which are included in the contents -environmental risk, environmental protection and environmental management. The horarium is small but sufficient for courses expanding.
the knowledge of future engineers The exercises are practical,
consistent with solving the problems inherent in everyday business practice. Some of them are held in establishments with typical situations of potential or apparent environmental contamination. Thus, learning is associated with the conditions and the business goals.
REFERENCES �. Kovachev, N., P. Manev, L.
Vladimirov. Noise and Vibration Protection. Ruse, Mediatech, 20�2.
2. Manev, P., L. Vladimirov. Water pollution and impact of the ecosystems. Ruse, Mediatech, 20�2.
3. Tomov, V., K. Papazov. Protection and management of environment. Ruse, University of Ruse, 200�.
�. Tomov, V., P. Hristov, A. Nenova. Environmental security, Varna, Varna free university, 20�0.
�. Vladimirov, L. Riskmetric in environmental security. Varna, Varna free university, 200�.
�. Vladimirov, L. Risk theory. Part I. Dangers and threats, risks and criticalities. Ruse, University of Ruse, 20��.
�. Vladimirov, L. Waste management. Part I. Determination, classification and norms. Ruse, Mediatech
JOURNAL SCIENTIFIC AND APPLIED RESEARCH Vol. 3, 20�3
Original Contribution
Journal scientific and applied research, vol. 3, 20�3 Association Scientific and Applied Research
International Journal ISSN �3��-�2��
APPLICATION OF SUMMARIZED FUNCTIONS FOR INFORMATION
SOURCE PROTECTION
Valerij I. Dzhurov
RUSE UNIVERSITY, BULGARIA, RUSE, STUDENTSKA � STR. Abstract: Probing signals are succession of impulses with defined frequency and amplitude. The succession itself could be “masked” using changing functions (from the main carrying) under specific laws. The sequence of impulses could be described by summarized functions of different type.
Key words: summarized functions, carrier frequency, pseudorandom sequence.
I. Introduction Summarized function of the
following type (�) �( ) , 0f x x
x
could not be locally integrable in the vicinity of the beginning of the coordinate system. Ignoring the area
containing the beginning of the coordinate system, locally integrable function can be received. Its graphic will consist of two equilateral hyperbolas with asymptotes corresponding axis Ox and Oy. (Fig. �)
Fig. �. Graphical interpretation of summarized function f(x) in Cartesian coordinate system xOy
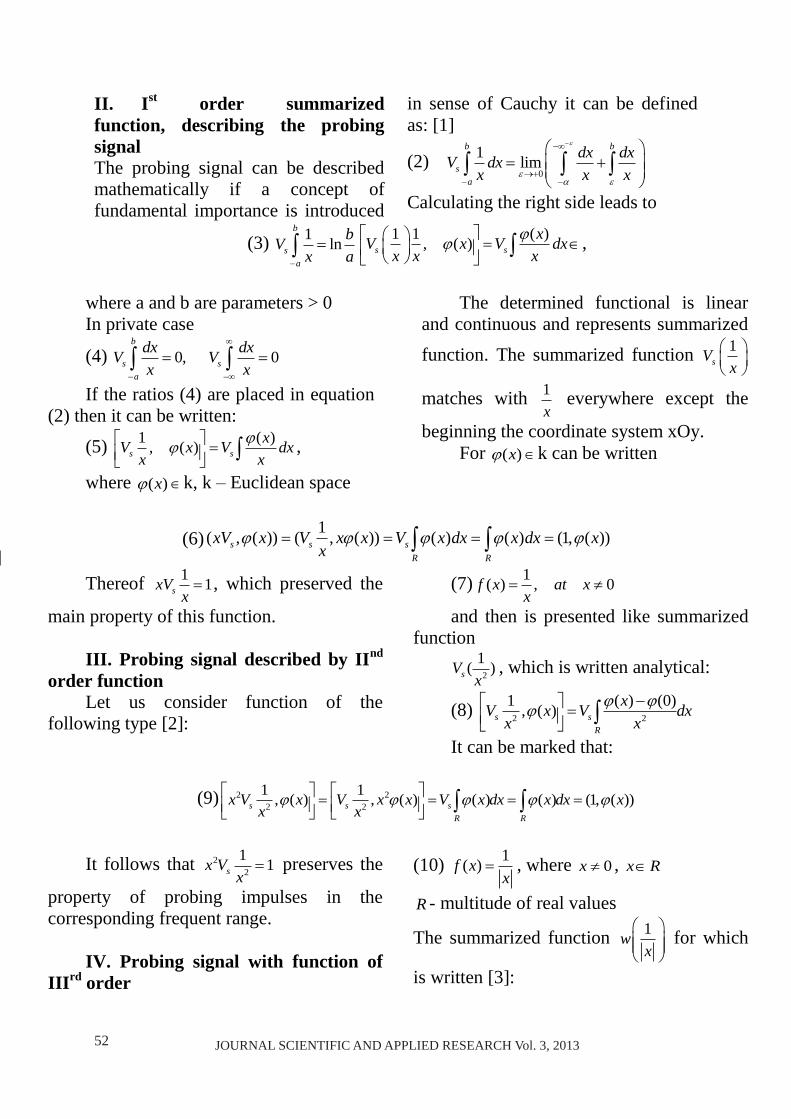
�2 JOURNAL SCIENTIFIC AND APPLIED RESEARCH Vol. 3, 20�3JOURNAL SCIENTIFIC AND APPLIED RESEARCH Vol. 3, 20�3
II. Ist order summarized function, describing the probing signal The probing signal can be described mathematically if a concept of fundamental importance is introduced
in sense of Cauchy it can be defined as: [�]
(2) 0
� limb b
sa
dx dxV dxx x x
Calculating the right side leads to
(3) � lnb
sa
bVx a
� � ( ), ( )s s
xV x V dxx x x
,
where a and b are parameters > 0 In private case
(�) 0, 0b
s sa
dx dxV Vx x
If the ratios (�) are placed in equation (2) then it can be written:
(�) � ( ), ( )s sxV x V dx
x x ,
where ( )x k, k – Euclidean space
The determined functional is linear and continuous and represents summarized function. The summarized function �
sVx
matches with �x
everywhere except the
beginning the coordinate system xOy. For ( )x k can be written
(�) �( , ( )) ( , ( )) ( ) ( ) (�, ( ))s s sR R
xV x V x x V x dx x dx xx
Thereof � �sxVx , which preserved the
main property of this function.
III. Probing signal described by IInd order function
Let us consider function of the following type [2]:
(�) �( ) , 0f x at xx
and then is presented like summarized function
2
�( )sVx
, which is written analytical:
(�) 2 2
� ( ) (0), ( )s sR
xV x V dxx x
It can be marked that:
(�) 2 22 2
� �, ( ) , ( ) ( ) ( ) (�, ( ))s s sR R
x V x V x x V x dx x dx xx x
It follows that 2
2
� �sx Vx
preserves the
property of probing impulses in the corresponding frequent range.
IV. Probing signal with function of
IIIrd order
(�0) �( )f xx
, where 0x , x R
R - multitude of real values
The summarized function �wx
for which
is written [3]:
JOURNAL SCIENTIFIC AND APPLIED RESEARCH Vol. 3, 20�3
(��)� �
� ( ) ( ) (0), ( )x x
x xw x dx dxx x x
If we consider that nx R , i.e. 2 2r x y is introduced, then for the
summarized function can be marked:
(�2) � �
� ( , ) (0,0) ( , ), ( , )r r
x y x yw x y dxdy dxdyr r r
Equation (�2) is summarized regular function of �
r, which is not locally
integrable in the vicinity of the beginning of the coordinate system. V. Summarized function of IVth type for probing signal describing. Let the summarized function has the following expression[�]:
2 2
�wx y
The function of IInd type can be put in summarized function 2
�fw
x
, which
is pseudofunction 2
�x
and could be
described with expression of the following type:
(�3) 2 2 20
� ( ) ( ) (0), ( ) lim 2fx xw x dx dx
x x x
For received pseudofunctions can be written summarized equation of the type [�]:
(��) 0
( ) ( ), ( ) lim (0) lnfx xw x dx
x x
(��) 0
( ) ( ), ( ) lim (0) lnfx xw x dx
x x
The shift ε around the beginning for
probing signal in xth range is determined experimentally [�]. When using probing frequent linear modulated signal in xth range we use the theory of inverse aperture synthesis for radiolocational image recreating of aircraft ε ≈ 10 MHz. [�] The
results at Gaussian dispersion of Gaussian noise corresponding а)- 0,�; b) -0,3, c) -0,�, d) -0,� are shown on Fig. 2 [�]. The root mean square error at the corresponding dispersion of Gaussian noise is shown in tabular (Table�) and graphical (Fig.3)
�3JOURNAL SCIENTIFIC AND APPLIED RESEARCH Vol. 3, 20�3JOURNAL SCIENTIFIC AND APPLIED RESEARCH Vol. 3, 20�3
II. Ist order summarized function, describing the probing signal The probing signal can be described mathematically if a concept of fundamental importance is introduced
in sense of Cauchy it can be defined as: [�]
(2) 0
� limb b
sa
dx dxV dxx x x
Calculating the right side leads to
(3) � lnb
sa
bVx a
� � ( ), ( )s s
xV x V dxx x x
,
where a and b are parameters > 0 In private case
(�) 0, 0b
s sa
dx dxV Vx x
If the ratios (�) are placed in equation (2) then it can be written:
(�) � ( ), ( )s sxV x V dx
x x ,
where ( )x k, k – Euclidean space
The determined functional is linear and continuous and represents summarized function. The summarized function �
sVx
matches with �x
everywhere except the
beginning the coordinate system xOy. For ( )x k can be written
(�) �( , ( )) ( , ( )) ( ) ( ) (�, ( ))s s sR R
xV x V x x V x dx x dx xx
Thereof � �sxVx , which preserved the
main property of this function.
III. Probing signal described by IInd order function
Let us consider function of the following type [2]:
(�) �( ) , 0f x at xx
and then is presented like summarized function
2
�( )sVx
, which is written analytical:
(�) 2 2
� ( ) (0), ( )s sR
xV x V dxx x
It can be marked that:
(�) 2 22 2
� �, ( ) , ( ) ( ) ( ) (�, ( ))s s sR R
x V x V x x V x dx x dx xx x
It follows that 2
2
� �sx Vx
preserves the
property of probing impulses in the corresponding frequent range.
IV. Probing signal with function of
IIIrd order
(�0) �( )f xx
, where 0x , x R
R - multitude of real values
The summarized function �wx
for which
is written [3]:
JOURNAL SCIENTIFIC AND APPLIED RESEARCH Vol. 3, 20�3
(��)� �
� ( ) ( ) (0), ( )x x
x xw x dx dxx x x
If we consider that nx R , i.e. 2 2r x y is introduced, then for the
summarized function can be marked:
(�2) � �
� ( , ) (0,0) ( , ), ( , )r r
x y x yw x y dxdy dxdyr r r
Equation (�2) is summarized regular function of �
r, which is not locally
integrable in the vicinity of the beginning of the coordinate system. V. Summarized function of IVth type for probing signal describing. Let the summarized function has the following expression[�]:
2 2
�wx y
The function of IInd type can be put in summarized function 2
�fw
x
, which
is pseudofunction 2
�x
and could be
described with expression of the following type:
(�3) 2 2 20
� ( ) ( ) (0), ( ) lim 2fx xw x dx dx
x x x
For received pseudofunctions can be written summarized equation of the type [�]:
(��) 0
( ) ( ), ( ) lim (0) lnfx xw x dx
x x
(��) 0
( ) ( ), ( ) lim (0) lnfx xw x dx
x x
The shift ε around the beginning for
probing signal in xth range is determined experimentally [�]. When using probing frequent linear modulated signal in xth range we use the theory of inverse aperture synthesis for radiolocational image recreating of aircraft ε ≈ 10 MHz. [�] The
results at Gaussian dispersion of Gaussian noise corresponding а)- 0,�; b) -0,3, c) -0,�, d) -0,� are shown on Fig. 2 [�]. The root mean square error at the corresponding dispersion of Gaussian noise is shown in tabular (Table�) and graphical (Fig.3)
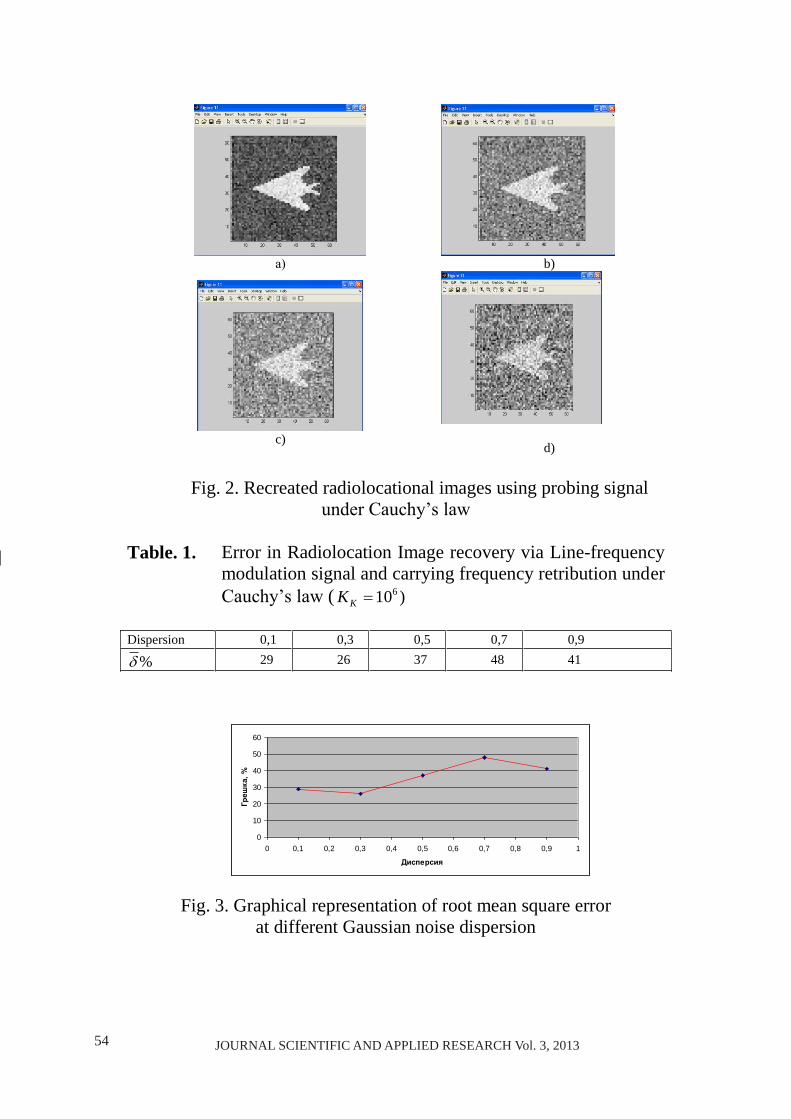
�� JOURNAL SCIENTIFIC AND APPLIED RESEARCH Vol. 3, 20�3JOURNAL SCIENTIFIC AND APPLIED RESEARCH Vol. 3, 20�3
0
10
20
30
40
50
60
0 0,1 0,2 0,3 0,4 0,5 0,6 0,7 0,8 0,9 1
Дисперсия
Греш
ка, %
Table. 1. Error in Radiolocation Image recovery via Line-frequency modulation signal and carrying frequency retribution under Cauchy’s law ( )�0�KK
Dispersion 0,� 0,3 0,� 0,� 0,�
% 2� 2� 3� �� ��
Fig. 3. Graphical representation of root mean square error at different Gaussian noise dispersion
а)
b)
c)
d)
Fig. 2. Recreated radiolocational images using probing signal under Cauchy’s law
JOURNAL SCIENTIFIC AND APPLIED RESEARCH Vol. 3, 20�3
Conclusions: �. Summarized functions of every type can well be applied for describing the type of synthesis for extracting information from air. 2. The mathematical model of the probing signal under Cauchy’s law is difficult for analysis.
3. Broadcasting of sequence of probing impulses under law, described using summarized function of IInd and IIIrd type could bring to divergence of the processes for their analyzing.
Reference [�] Schwariz L., Methods mathematique pour les scieuces physiques, Herman, paris ���� [2] Sneddou J., Fourier Transforms MeGraw-Hill, New Yorks-Toronto-London, ���� [3] Zemaman A., H., Distribution Theory and Transform Analysis, Mc Craw-Hill, New York-Saint Louse-San Francisco-Toronto-London-Sydney, ���� [�] Djurov V., I. Georgiev. Prilojenie svoistvata na statisticheskite zakoni na razpredelenie pri sintez na algoritmi za rekonstrukciia na izobrajenie na dinamichen obekt s niska efektivna otraziavashta
povyrhnost, Vtora iubileina mejdunarodna nauchna konferenciia, 20�� "�0 godini ot poleta na Iu. Gagarin", Shumen, ��-�� april 20��. [�] Kolmogorov A. N., S.V. Famin, Elementi teorii funkcii i funkcionalanogo analiza N.M. ���� [�] Lazaron V.A., S.I. Konashenko. Obobshtennaie funkcii v zadachah mehaniki, K. ���� [�] Lazarov, A. D. Izsledvane vyrhu teoriiata na obratniia aperturen sintez. Disertaciia za prisyjdane na nauchna stepen " Doktor na naukite" VVUAPVO "P.Volov", Shumen, ����.

��JOURNAL SCIENTIFIC AND APPLIED RESEARCH Vol. 3, 20�3JOURNAL SCIENTIFIC AND APPLIED RESEARCH Vol. 3, 20�3
0
10
20
30
40
50
60
0 0,1 0,2 0,3 0,4 0,5 0,6 0,7 0,8 0,9 1
Дисперсия
Греш
ка, %
Table. 1. Error in Radiolocation Image recovery via Line-frequency modulation signal and carrying frequency retribution under Cauchy’s law ( )�0�KK
Dispersion 0,� 0,3 0,� 0,� 0,�
% 2� 2� 3� �� ��
Fig. 3. Graphical representation of root mean square error at different Gaussian noise dispersion
а)
b)
c)
d)
Fig. 2. Recreated radiolocational images using probing signal under Cauchy’s law
JOURNAL SCIENTIFIC AND APPLIED RESEARCH Vol. 3, 20�3
Conclusions: �. Summarized functions of every type can well be applied for describing the type of synthesis for extracting information from air. 2. The mathematical model of the probing signal under Cauchy’s law is difficult for analysis.
3. Broadcasting of sequence of probing impulses under law, described using summarized function of IInd and IIIrd type could bring to divergence of the processes for their analyzing.
Reference [�] Schwariz L., Methods mathematique pour les scieuces physiques, Herman, paris ���� [2] Sneddou J., Fourier Transforms MeGraw-Hill, New Yorks-Toronto-London, ���� [3] Zemaman A., H., Distribution Theory and Transform Analysis, Mc Craw-Hill, New York-Saint Louse-San Francisco-Toronto-London-Sydney, ���� [�] Djurov V., I. Georgiev. Prilojenie svoistvata na statisticheskite zakoni na razpredelenie pri sintez na algoritmi za rekonstrukciia na izobrajenie na dinamichen obekt s niska efektivna otraziavashta
povyrhnost, Vtora iubileina mejdunarodna nauchna konferenciia, 20�� "�0 godini ot poleta na Iu. Gagarin", Shumen, ��-�� april 20��. [�] Kolmogorov A. N., S.V. Famin, Elementi teorii funkcii i funkcionalanogo analiza N.M. ���� [�] Lazaron V.A., S.I. Konashenko. Obobshtennaie funkcii v zadachah mehaniki, K. ���� [�] Lazarov, A. D. Izsledvane vyrhu teoriiata na obratniia aperturen sintez. Disertaciia za prisyjdane na nauchna stepen " Doktor na naukite" VVUAPVO "P.Volov", Shumen, ����.
�� JOURNAL SCIENTIFIC AND APPLIED RESEARCH Vol. 3, 20�3
JOURNAL SCIENTIFIC AND APPLIED RESEARCH Vol. 3, 20�3
Original Contribution
Journal scientific and applied research, vol. 3, 20�3 Association Scientific and Applied Research
International Journal ISSN �3��-�2��
SPECTROPHOTOMETER FOR RESEARCH OF THE ATMOSPHERIC OZONE - POSITIONING OF THE EXECUTIVE OPERATING PARTS
Dimitar Chervenkov, Plamen Chernokozhev.
Shumen University Episkop K. Preslavski, Shumen, Bulgaria
Abstract: The paper is about spectrophotometer for research ofthe atmospheric ozone and more
specifically about a method for positioning of executive operating parts withi electromechanical feedback. Of special interest is the high positioning precision, independently of the rotation direction when using a classic elemental basis, repair suitability and easy operation. A principle is implemented for the precise positioning of the executive operating organs with an electromechanical feed-back. Its work is highly reliable. The implementation is possible with simple parts and is electrically adaptable with a microprocessor system and the leading motor. Various applicable schemes can be created with different precision of work which depends on the preliminary relation in the mechanic transmission. Depending on the wearing out with time, the principle allows it to be read by the microprocessor system in order to keep the necessary precision. A system with such feed-back can work with one- and two-direction circular motion.
Key words: positioning method
Introduction: The development of the
satellite spectrophotometer necessitated the development of reliable and precise constructive decisions for the setting of a reading start or final decision of the executive element and its intermittent observation, feed-back between initial and an executive unit for the control of the positioning precision not only at the moment, but after a long exploitation, simplicity of execution, repletion and reliability of the results.
Its work is highly reliable. The implementation is possible with simple parts and is electrically adaptable with a microprocessor
system and the leading motor. Various applicable schemes can be created with different precision of work which depends on the preliminary relation in the mechanic transmission. Depending on the wearing out with time, the principle allows it to be read by the microprocessor system in order to keep the necessary precision. A system with such feed-back can work with one- and two-direction circular motion.
The principle relies on the use of construction relations between the initial and final parts and the gearing relation of the mechanic transmission between them. It is made by two disks with one frontal slot each,
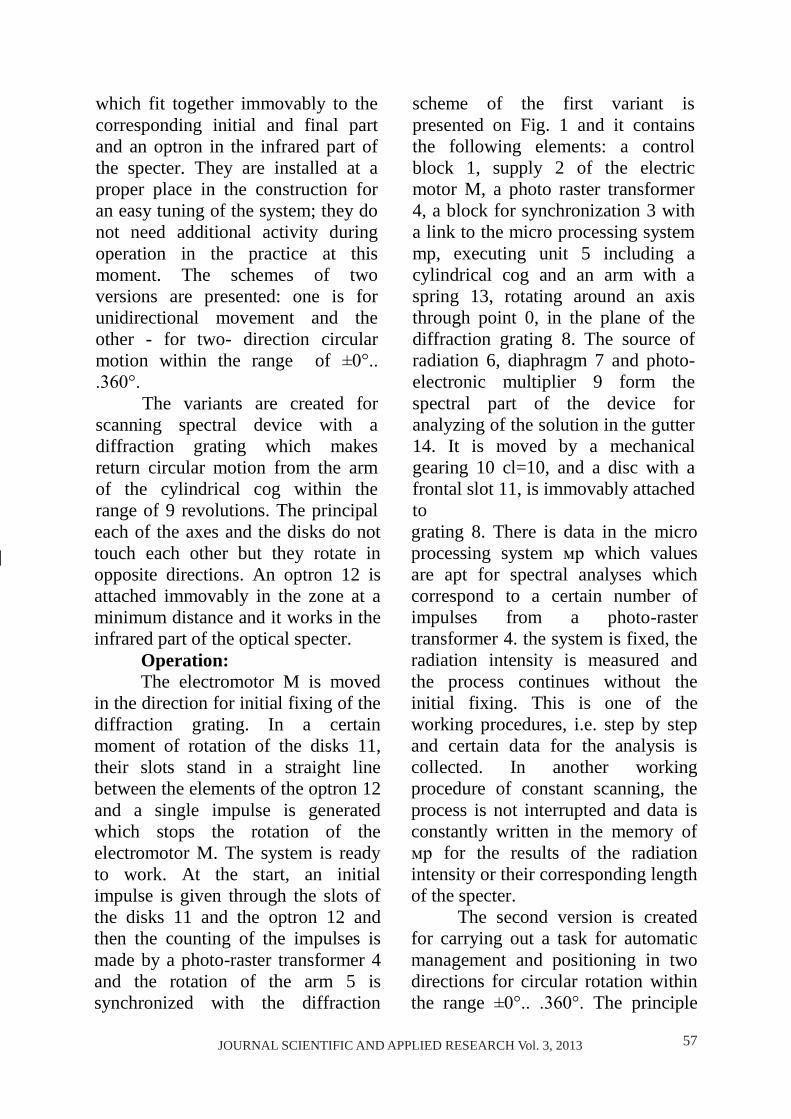
��JOURNAL SCIENTIFIC AND APPLIED RESEARCH Vol. 3, 20�3
JOURNAL SCIENTIFIC AND APPLIED RESEARCH Vol. 3, 20�3
which fit together immovably to the corresponding initial and final part and an optron in the infrared part of the specter. They are installed at a proper place in the construction for an easy tuning of the system; they do not need additional activity during operation in the practice at this moment. The schemes of two versions are presented: one is for unidirectional movement and the other - for two- direction circular motion within the range of ±0°.. .360°.
The variants are created for scanning spectral device with a diffraction grating which makes return circular motion from the arm of the cylindrical cog within the range of � revolutions. The principal
scheme of the first variant is presented on Fig. � and it contains the following elements: a control block �, supply 2 of the electric motor M, a photo raster transformer �, a block for synchronization 3 with a link to the micro processing system mp, executing unit � including a cylindrical cog and an arm with a spring �3, rotating around an axis through point 0, in the plane of the diffraction grating �. The source of radiation �, diaphragm � and photo-electronic multiplier � form the spectral part of the device for analyzing of the solution in the gutter ��. It is moved by a mechanical gearing �0 cl=�0, and a disc with a frontal slot ��, is immovably attached to
each of the axes and the disks do not touch each other but they rotate in opposite directions. An optron �2 is attached immovably in the zone at a minimum distance and it works in the infrared part of the optical specter.
Operation: The electromotor M is moved
in the direction for initial fixing of the diffraction grating. In a certain moment of rotation of the disks ��, their slots stand in a straight line between the elements of the optron �2 and a single impulse is generated which stops the rotation of the electromotor M. The system is ready to work. At the start, an initial impulse is given through the slots of the disks �� and the optron �2 and then the counting of the impulses is made by a photo-raster transformer � and the rotation of the arm � is synchronized with the diffraction
grating �. There is data in the micro processing system мр which values are apt for spectral analyses which correspond to a certain number of impulses from a photo-raster transformer �. the system is fixed, the radiation intensity is measured and the process continues without the initial fixing. This is one of the working procedures, i.e. step by step and certain data for the analysis is collected. In another working procedure of constant scanning, the process is not interrupted and data is constantly written in the memory of мр for the results of the radiation intensity or their corresponding length of the specter.
The second version is created for carrying out a task for automatic management and positioning in two directions for circular rotation within the range ±0°.. .360°. The principle
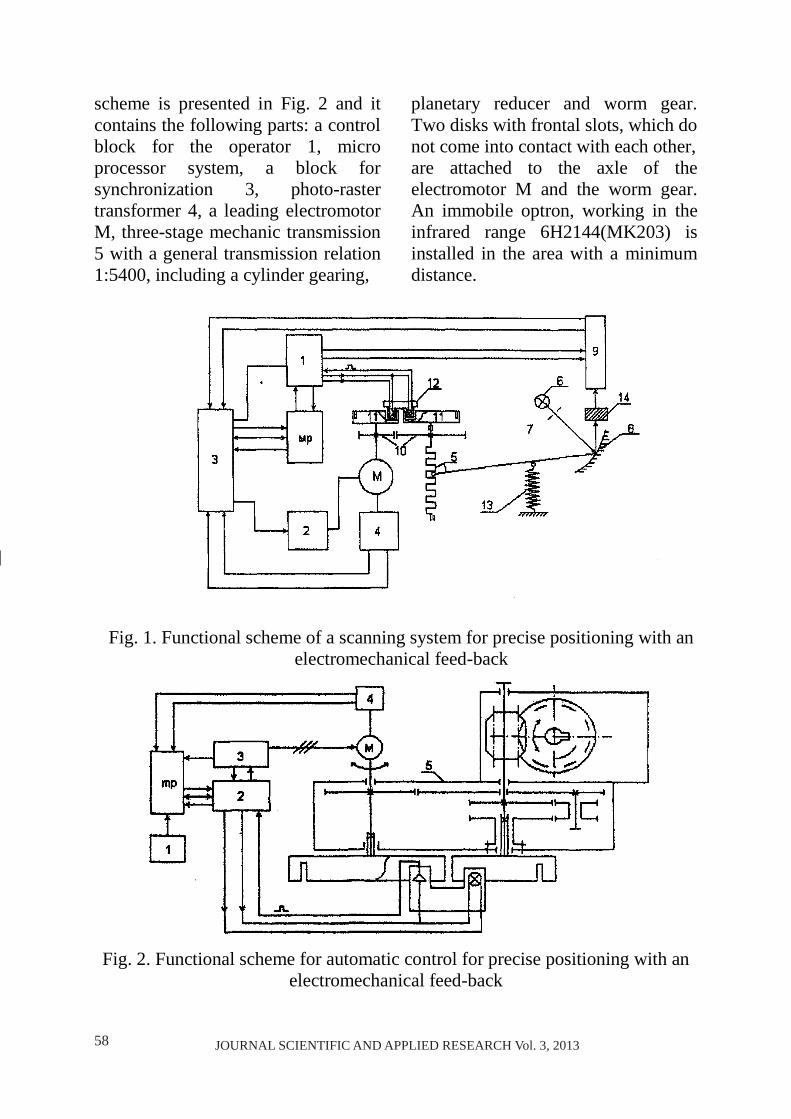
�� JOURNAL SCIENTIFIC AND APPLIED RESEARCH Vol. 3, 20�3
JOURNAL SCIENTIFIC AND APPLIED RESEARCH Vol. 3, 20�3
scheme is presented in Fig. 2 and it contains the following parts: a control block for the operator �, micro processor system, a block for synchronization 3, photo-raster transformer �, a leading electromotor M, three-stage mechanic transmission � with a general transmission relation �:��00, including a cylinder gearing,
planetary reducer and worm gear. Two disks with frontal slots, which do not come into contact with each other, are attached to the axle of the electromotor M and the worm gear. An immobile optron, working in the infrared range �H2���(MK203) is installed in the area with a minimum distance.
Fig. 2. Functional scheme for automatic control for precise positioning with an electromechanical feed-back
Fig. �. Functional scheme of a scanning system for precise positioning with an electromechanical feed-back
��JOURNAL SCIENTIFIC AND APPLIED RESEARCH Vol. 3, 20�3
JOURNAL SCIENTIFIC AND APPLIED RESEARCH Vol. 3, 20�3
The transmission relation between the two axles is selected in a way that when the worm gear makes one full revolution 360°, the two slots stand in one line between the disks' axes and a single impulse is
registered. It secures an initial nullification of the system according to certain criteria. The next task is positioning and it is made by the micro processor system on the basis of data from the raster transformer.
References: �. Mardirossian G., Stoyanov S., Analiz na syshtestvuvashti metodi i sredstva za izsledvane obshtoto sydyrjanie na atmosferen ozon i negovoto vertikalno razpredelenie. Godishnik na Tehnicheski universitet, Varna, 200�, s. ��0 - ���. 2. Stoianov S. Matematichen model na optichen trakt na optiko-elektronen ured. Sb. dokladi ot Iubileina nauchna sesiia "�00 godini ot poleta na bratia Rait", tom 2. NVU "V- Levski". Fakultet Aviacionen, Dolna Mitropoliia, 2003, s. 2�� - 2��. 3. Stoyanov S. Korekciia na spektralnata shirina na procepite na spektrofotometar pri precizni elektrichni izmervaniia. Sb. nauchni trudove, chast_II, NVU "V. Levski", fakultet "Artileriia, PVO i KIS", Shumen 2003, s. 2�0-2��. �. Stoyanov S. Metod za presmiatane na spektrofotometar s difrakcionna reshetka za izsledvane na atmosferniia ozon. Nauchna sesiia na NVU "V.
Levski", Fakultet Artileriia, PVO i KIS, Shumen, 200� (pod pechat). �. Stoyanov S. Optoelektronen spektrofotometar za izsledvane na atmosferniia ozon. Doktorska disertaciia. Sofiia, SNS po VIN pri VAK, 20�0, ��� s. �. Stoianov S. Optichni metodi za izsledvane na atmosferata Izdat. "Faber", Veliko Tyrnovo, 200�,23� s. �. Mardirossian G., S. Stoyanov i dr. Spektrofotometar za izlsedvane na atmosferata. Patent_BG �����V� ot 200� g. �. Filipova, M. Ekologiia i opazvane na okolnata sreda. Izd. kompleks pri NVU "Vasil Levski", Veliko Tyrnovo, 200�, 3�2 s. �. Mardirossian G., S. Stoyanov, A. Manev, Method for Research of the Ozone Content by Means of Absorption Ozonometer. SENS 200�. Fourth Scientific Confer, with International Participation SPACE, ECOLOGY, NANOTECHNOLOGY, SAFETY, Varna, 200�, p. 20�-20�.
�0 JOURNAL SCIENTIFIC AND APPLIED RESEARCH Vol. 3, 20�3JOURNAL SCIENTIFIC AND APPLIED RESEARCH Vol. 3, 20�3
Original Contribution
Journal scientific and applied research, vol. 3, 20�3 Association Scientific and Applied Research
International Journal ISSN �3��-�2��
PROJECT WORK AS AN EDUCATIONAL TECHNOLOGY AND ELEMENT OF ACMEOLOGY IN THE LEARNING STUDENTS
Neli St. Dimitrova
KONSTANTIN PRESLAVSKY UNIVERSITY SHUMEN; ��� INIVERSITETSKA STR.
���2 SHUMEN; E-MAIL: [email protected]
Abstract: The new tendency in society requirements contemporary approaches in education. This tendency is realize through introduce of draft approach in the process education in different educational level.
The purpose of this science paper is to reveal essence of draft approach as educational technology in the study’s university students.
The work of projects is criteria for development on the intellects a personality. Through the work of projects are form basic skills in the professional practice and many qualities of a personality that are element acmeology.
Through the work of projects in education is achieving high quality of education. Key words: Project approach, educational technology, teaching students, acmeology environment. INTRODUCTION Rapidly changing living
conditions require rapid changes in the organization of people in realizing their professional activity. Every educational establishment should prepare members of society to pursue their professional goals and be able to carry out actions to achieve them. Not accidentally various governmental and non-governmental organizations finance the activities of people through project work.
Based on the interpretation of the term "project" - an activity having a defined goal that must be achieved for a fixed term under certain conditions, it is seen that the trend of any society is to make these activities [�; �]. So
that every member of society is to cope with the tasks assigned by the project as an organizational model must have the necessary skills and qualities to implement them. This society puts priority of the education system for the application of modern approaches to learning and education of the younger generation.
One of these trends is the implementation of project approach in the learning process in different degrees.
Based on this trend, this study was designed, whose purpose is to reveal the essence of the project approach as an educational technology and akmeology element in the training of students.
JOURNAL SCIENTIFIC AND APPLIED RESEARCH Vol. 3, 20�3
To achieve the goal solve the following tasks:
To study and systematize theoretical formulation for administration of the project approach in the training of students.
To develop and approbation a system of projects on different subjects in the curriculum of students.
Identify criteria and indicators to assess the level of project work as akmeological environment.
To conduct educational research on the use of project approach as an educational technology.
The hypothesis of the study is that if the training of student teachers in technology training in various disciplines applied project approach, it will increase the success of students and their professional activity will be at a higher level.
The object of this study was student teachers in technology education.
The subject of the study is to work on projects such as educational technology to enhance professional activity students.
The term “technology” in the context of educational practice is regarded as a procedure of organization and implementation of the educational process. It is determined by what successive steps, cutting techniques to organize the practical realization of the process of education.
That determines the focus of this study for project work as an educational technology and
akmeology� element in the training of students.
RESEARCH PROBLEM The state of society is
determined by the level and quality of education. This defines one of the purposes of education, use of modern approaches to learning and education of the younger generation. Develop and introduce new technologies in education to improve the quality of education. Apply the so-called educational technology.
Educational technology content is determined by the educational activity. Very often in the pedagogical literature aligns with the methods of organization and administration, but the actual plan is different from them. It is assumed that the method is a set of techniques and consistent, and the technology is a set of techniques (operations) performed in sequence, allowing for the practical implementation of the method.
Each educational technology
incorporates [��]: purpose; scientific ideas on which they
are based; system of actions of the teacher
and the student in the learning process;
criteria for assessing the outcome;
restrictions on using it.
1 Akmeologiya teaching as a science is
characterized by continuous improvement of the professional activity of a teacher [1; 2; 3].
��JOURNAL SCIENTIFIC AND APPLIED RESEARCH Vol. 3, 20�3JOURNAL SCIENTIFIC AND APPLIED RESEARCH Vol. 3, 20�3
Original Contribution
Journal scientific and applied research, vol. 3, 20�3 Association Scientific and Applied Research
International Journal ISSN �3��-�2��
PROJECT WORK AS AN EDUCATIONAL TECHNOLOGY AND ELEMENT OF ACMEOLOGY IN THE LEARNING STUDENTS
Neli St. Dimitrova
KONSTANTIN PRESLAVSKY UNIVERSITY SHUMEN; ��� INIVERSITETSKA STR.
���2 SHUMEN; E-MAIL: [email protected]
Abstract: The new tendency in society requirements contemporary approaches in education. This tendency is realize through introduce of draft approach in the process education in different educational level.
The purpose of this science paper is to reveal essence of draft approach as educational technology in the study’s university students.
The work of projects is criteria for development on the intellects a personality. Through the work of projects are form basic skills in the professional practice and many qualities of a personality that are element acmeology.
Through the work of projects in education is achieving high quality of education. Key words: Project approach, educational technology, teaching students, acmeology environment. INTRODUCTION Rapidly changing living
conditions require rapid changes in the organization of people in realizing their professional activity. Every educational establishment should prepare members of society to pursue their professional goals and be able to carry out actions to achieve them. Not accidentally various governmental and non-governmental organizations finance the activities of people through project work.
Based on the interpretation of the term "project" - an activity having a defined goal that must be achieved for a fixed term under certain conditions, it is seen that the trend of any society is to make these activities [�; �]. So
that every member of society is to cope with the tasks assigned by the project as an organizational model must have the necessary skills and qualities to implement them. This society puts priority of the education system for the application of modern approaches to learning and education of the younger generation.
One of these trends is the implementation of project approach in the learning process in different degrees.
Based on this trend, this study was designed, whose purpose is to reveal the essence of the project approach as an educational technology and akmeology element in the training of students.
JOURNAL SCIENTIFIC AND APPLIED RESEARCH Vol. 3, 20�3
To achieve the goal solve the following tasks:
To study and systematize theoretical formulation for administration of the project approach in the training of students.
To develop and approbation a system of projects on different subjects in the curriculum of students.
Identify criteria and indicators to assess the level of project work as akmeological environment.
To conduct educational research on the use of project approach as an educational technology.
The hypothesis of the study is that if the training of student teachers in technology training in various disciplines applied project approach, it will increase the success of students and their professional activity will be at a higher level.
The object of this study was student teachers in technology education.
The subject of the study is to work on projects such as educational technology to enhance professional activity students.
The term “technology” in the context of educational practice is regarded as a procedure of organization and implementation of the educational process. It is determined by what successive steps, cutting techniques to organize the practical realization of the process of education.
That determines the focus of this study for project work as an educational technology and
akmeology� element in the training of students.
RESEARCH PROBLEM The state of society is
determined by the level and quality of education. This defines one of the purposes of education, use of modern approaches to learning and education of the younger generation. Develop and introduce new technologies in education to improve the quality of education. Apply the so-called educational technology.
Educational technology content is determined by the educational activity. Very often in the pedagogical literature aligns with the methods of organization and administration, but the actual plan is different from them. It is assumed that the method is a set of techniques and consistent, and the technology is a set of techniques (operations) performed in sequence, allowing for the practical implementation of the method.
Each educational technology
incorporates [��]: purpose; scientific ideas on which they
are based; system of actions of the teacher
and the student in the learning process;
criteria for assessing the outcome;
restrictions on using it.
1 Akmeologiya teaching as a science is
characterized by continuous improvement of the professional activity of a teacher [1; 2; 3].
�2 JOURNAL SCIENTIFIC AND APPLIED RESEARCH Vol. 3, 20�3JOURNAL SCIENTIFIC AND APPLIED RESEARCH Vol. 3, 20�3
In this context, this study aims to work on projects such as educational technology. The realization of this trend is through the implementation of project approach in the learning process of students.
Concept “project” is used to implement a business idea (concept), subject to the specific goal to be achieved under specified conditions [�; ��].
The implementation of the project approach in the training of students helps to create a work environment that motivates self-searching, processing and analyzing information. So their interest in a particular area and develop knowledge and skills related to their upcoming job.
According to R. Peycheva project-based learning is a form of organization of training associated with continuous learning activities, the integration of content with real life problems and future career [�0].
In teaching practice project approach is increasing use as an educational technology [�; �; �0; ��]. He was distinguished as one of the main activities in achieving quality education as a set or system of activities in which students acquire knowledge, skills and competencies in the planning and execution of specific tasks. According to the method of E. Polat project involves the use of a system of educational and cognitive processes and activities of students to solve certain problems due to cognitive activity and self-presentation of the results in the form
of educational product [�2, 2�]. Implementing the project
approach to learning allows students to:
• Interactivity in teaching and learning through the transfer of practical activities.
• Integrating a large number of activities around an idea or problem.
• Transfer of knowledge in real situations.
• Realization and protection of their own ideas.
Work on the project is a creative process or series of actions in which resources are converted into products or systems to solve problems related to human needs and desires.
Consequently Miller defines design as thinking process that is characterized as "insight," "intuition" or a "reason.
As a result of this activity is to create or modify in general the labor market new products (objects).
Development of projects considered as one type of thinking called "insight" instantly reflects the possibility of realizing the connection between problem and opportunity.
Seen as "intuition" is a form of subconscious thinking that leads to knowledge, often in the notable absence of rational affirmations. Intuition is related mental condition of insight that underlies our efforts to reform rational analysis.
The design is also a result of some cause which determines overall analytical capabilities resolve your problem. Thus it is characterized as an analytical process [�3].
JOURNAL SCIENTIFIC AND APPLIED RESEARCH Vol. 3, 20�3
METHODS To achieve the objective of this
study using the following methods: Theoretical method – study
and analysis of literature. Used to identify any developed theoretical problem in project work in the teaching process and to determine to
what theoretical basis will build educational technology project work as an educational technology and akmeology element in the training of student teacher technology training. The analysis of the literature provides the theoretical basis for solving the problem implicit in the purpose and hypothesis of the study.
Table 1 Criteria and relevant indicators to assess students' progress on
projects Criterion 1 Perform targeted work
that requires looking for information and planning in different stages Indicators Scale Able 0 Don’t able �
Criterion 2 Detection of problems and ways to solve them Indicators Scale Able 0 Don’t able �
Criterion 3 Communication and teamwork as well as assessing the contribution of others if you work on a project a few people
Indicators Scale Able 0 Don’t able �
Criterion 4 Allocation of tasks (roles) and their realization Indicators Scale Able 0 Don’t able �
Criterion 5 Creative thinking Indicators Scale Able 0 Don’t able �
Criterion 6 Organizational effectiveness Indicators Scale Able 0 Don’t able �
Criterion 7 Self-assessment and introspection Indicators Scale Able 0 Don’t able �
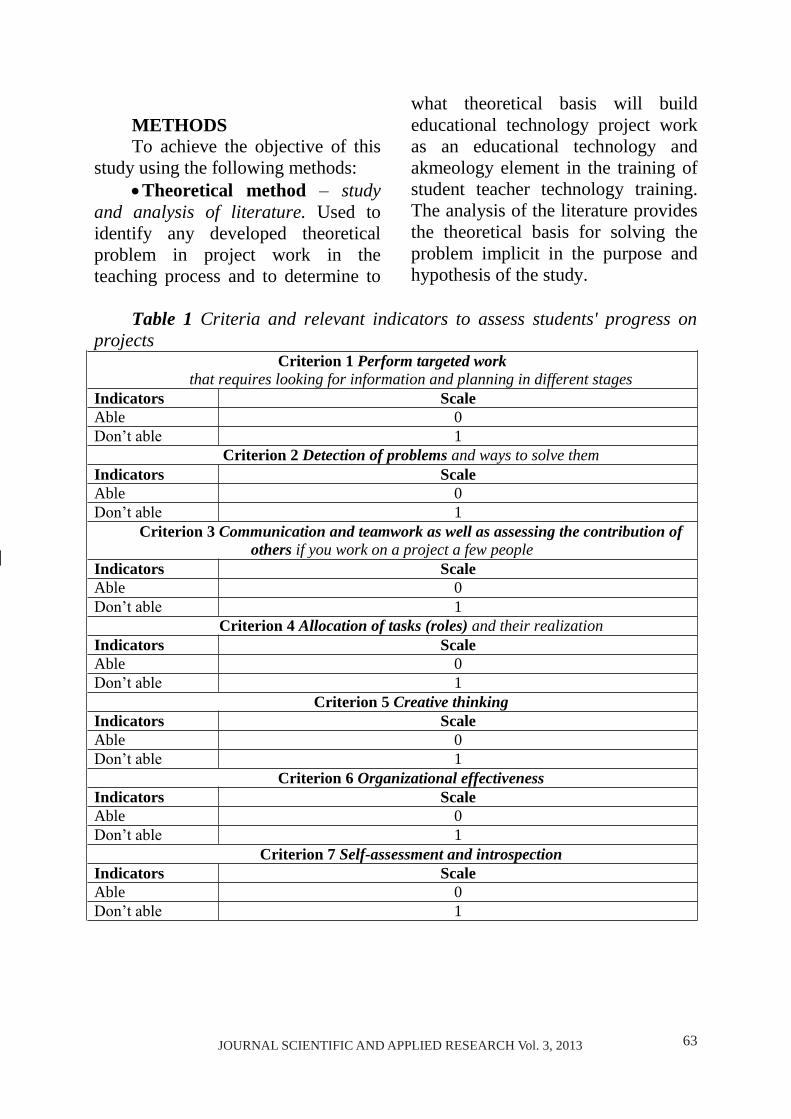
�3JOURNAL SCIENTIFIC AND APPLIED RESEARCH Vol. 3, 20�3JOURNAL SCIENTIFIC AND APPLIED RESEARCH Vol. 3, 20�3
In this context, this study aims to work on projects such as educational technology. The realization of this trend is through the implementation of project approach in the learning process of students.
Concept “project” is used to implement a business idea (concept), subject to the specific goal to be achieved under specified conditions [�; ��].
The implementation of the project approach in the training of students helps to create a work environment that motivates self-searching, processing and analyzing information. So their interest in a particular area and develop knowledge and skills related to their upcoming job.
According to R. Peycheva project-based learning is a form of organization of training associated with continuous learning activities, the integration of content with real life problems and future career [�0].
In teaching practice project approach is increasing use as an educational technology [�; �; �0; ��]. He was distinguished as one of the main activities in achieving quality education as a set or system of activities in which students acquire knowledge, skills and competencies in the planning and execution of specific tasks. According to the method of E. Polat project involves the use of a system of educational and cognitive processes and activities of students to solve certain problems due to cognitive activity and self-presentation of the results in the form
of educational product [�2, 2�]. Implementing the project
approach to learning allows students to:
• Interactivity in teaching and learning through the transfer of practical activities.
• Integrating a large number of activities around an idea or problem.
• Transfer of knowledge in real situations.
• Realization and protection of their own ideas.
Work on the project is a creative process or series of actions in which resources are converted into products or systems to solve problems related to human needs and desires.
Consequently Miller defines design as thinking process that is characterized as "insight," "intuition" or a "reason.
As a result of this activity is to create or modify in general the labor market new products (objects).
Development of projects considered as one type of thinking called "insight" instantly reflects the possibility of realizing the connection between problem and opportunity.
Seen as "intuition" is a form of subconscious thinking that leads to knowledge, often in the notable absence of rational affirmations. Intuition is related mental condition of insight that underlies our efforts to reform rational analysis.
The design is also a result of some cause which determines overall analytical capabilities resolve your problem. Thus it is characterized as an analytical process [�3].
JOURNAL SCIENTIFIC AND APPLIED RESEARCH Vol. 3, 20�3
METHODS To achieve the objective of this
study using the following methods: Theoretical method – study
and analysis of literature. Used to identify any developed theoretical problem in project work in the teaching process and to determine to
what theoretical basis will build educational technology project work as an educational technology and akmeology element in the training of student teacher technology training. The analysis of the literature provides the theoretical basis for solving the problem implicit in the purpose and hypothesis of the study.
Table 1 Criteria and relevant indicators to assess students' progress on
projects Criterion 1 Perform targeted work
that requires looking for information and planning in different stages Indicators Scale Able 0 Don’t able �
Criterion 2 Detection of problems and ways to solve them Indicators Scale Able 0 Don’t able �
Criterion 3 Communication and teamwork as well as assessing the contribution of others if you work on a project a few people
Indicators Scale Able 0 Don’t able �
Criterion 4 Allocation of tasks (roles) and their realization Indicators Scale Able 0 Don’t able �
Criterion 5 Creative thinking Indicators Scale Able 0 Don’t able �
Criterion 6 Organizational effectiveness Indicators Scale Able 0 Don’t able �
Criterion 7 Self-assessment and introspection Indicators Scale Able 0 Don’t able �

�� JOURNAL SCIENTIFIC AND APPLIED RESEARCH Vol. 3, 20�3JOURNAL SCIENTIFIC AND APPLIED RESEARCH Vol. 3, 20�3
Modeling method – used in the development of Lectures Pedagogy of technological training, Methodic of technology studies, Diagnosis of results in technology education that respectively in II year, III and IV year the education of university students with activities entered into for project work.
Sociological and pedagogical method – analysis of the work of students during classes and analysis of the assessment by the developer to identify their work.
Statistical methods – treatment results of checking students' projects, defined in Table �, these seven criteria and relevant indicators measurement range.
RESULTS AND DISCUSSION To achieve the objective and
prove the hypothesis was conducted examining teacher with students of Pedagogy of education to Engineering and technology. 22 students were
examined within three school years - in the second, third and fourth year of their training university. In the course of students in Pedagogy of technological training, taught in the second year, on the Methodology of Technology, taught in third grade and Diagnostics results in technological education, taught in the fourth year project approach is applied as an educational technology and element power of akmeology.
The results of pedagogical research on the use of the project approach in the training of students were statistically analyzed. To determine the level of achievement of students and their profession are using a system of projects. Each project is evaluated by criteria and indicators presented in Table �. The statistic data from the research fund are presented in Table 2, Table 3 and Table �.
Table 2 Results of the research in II year to training university Criterion
1
Criterion
2
Criterion
3
Criterion
4
Criterion
5
Criterion
6
Criterion
7
N Valid 22 22 22 22 22 22 22
Missing 0 0 0 0 0 0 0 Mean ,8636 ,6818 ,9545 ,6364 ,9545 ,9545 ,8182
Median 1,0000 1,0000 1,0000 1,0000 1,0000 1,0000 1,0000
Mode 1,00 1,00 1,00 1,00 1,00 1,00 1,00
Std. Deviation ,35125 ,47673 ,21320 ,49237 ,21320 ,21320 ,39477
Minimum ,00 ,00 ,00 ,00 ,00 ,00 ,00
Maximum 1,00 1,00 1,00 1,00 1,00 1,00 1,00
Sum 19,00 15,00 21,00 14,00 21,00 21,00 18,00
JOURNAL SCIENTIFIC AND APPLIED RESEARCH Vol. 3, 20�3
Table 3 Results of the research in III year to training university Criterion
1
Criterion
2
Criterion
3
Criterion
4
Criterion
5
Criterion
6
Criterion
7
N Valid 22 22 22 22 22 22 22
Missing 0 0 0 0 0 0 0 Mean 1,0000 ,8636 1,0000 ,7727 1,0000 1,0000 ,9545
Median 1,0000 1,0000 1,0000 1,0000 1,0000 1,0000 1,0000
Mode 1,00 1,00 1,00 1,00 1,00 1,00 1,00
Std. Deviation ,00000 ,35125 ,00000 ,42893 ,00000 ,00000 ,21320
Minimum 1,00 ,00 1,00 ,00 1,00 1,00 ,00
Maximum 1,00 1,00 1,00 1,00 1,00 1,00 1,00
Sum 22,00 19,00 22,00 17,00 22,00 22,00 21,00
Table 4 Results of the research in IV year to training university Criterion
1
Criterion
2
Criterion
3
Criterion
4
Criterion
5
Criterion
6
Criterion
7
N Valid 22 22 22 22 22 22 22
Missing 0 0 0 0 0 0 0 Mean 1,0000 1,0000 1,0000 1,0000 1,0000 1,0000 1,0000
Median 1,0000 1,0000 1,0000 1,0000 1,0000 1,0000 1,0000
Mode 1,00 1,00 1,00 1,00 1,00 1,00 1,00
Std. Deviation ,00000 ,00000 ,00000 ,00000 ,00000 ,00000 ,00000
Minimum 1,00 1,00 1,00 1,00 1,00 1,00 1,00
Maximum 1,00 1,00 1,00 1,00 1,00 1,00 1,00
Sum 22,00 22,00 22,00 22,00 22,00 22,00 22,00
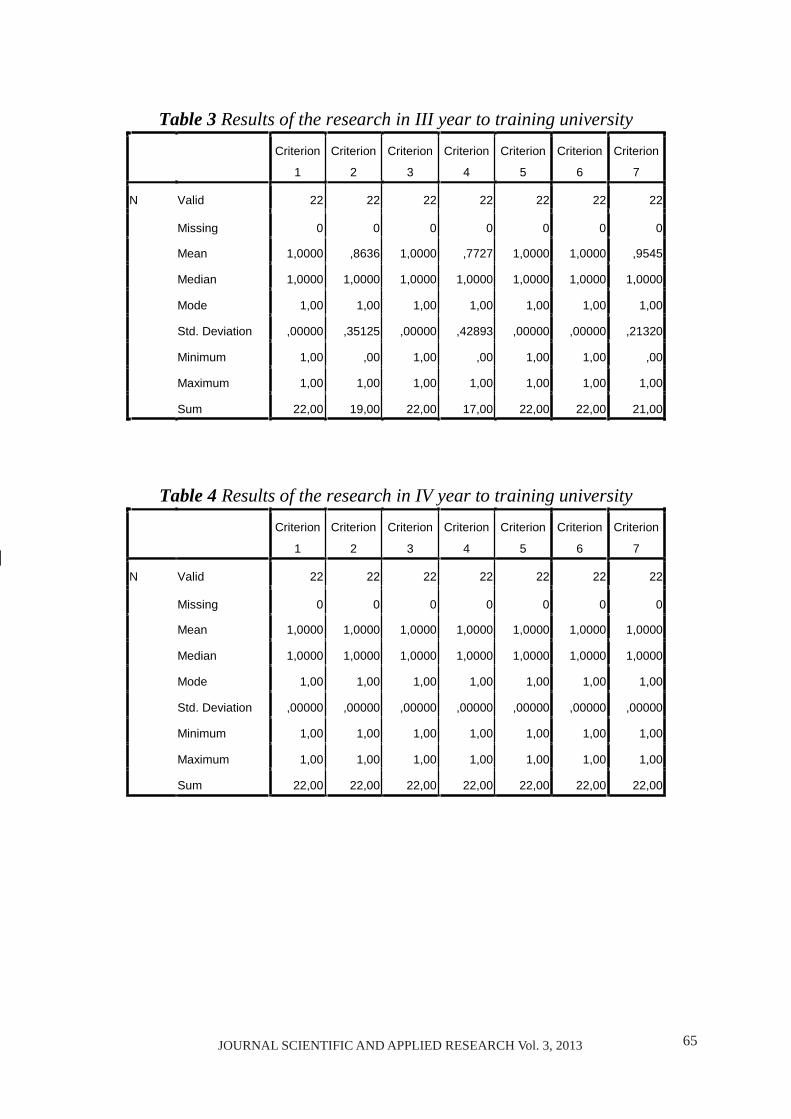
��JOURNAL SCIENTIFIC AND APPLIED RESEARCH Vol. 3, 20�3JOURNAL SCIENTIFIC AND APPLIED RESEARCH Vol. 3, 20�3
Modeling method – used in the development of Lectures Pedagogy of technological training, Methodic of technology studies, Diagnosis of results in technology education that respectively in II year, III and IV year the education of university students with activities entered into for project work.
Sociological and pedagogical method – analysis of the work of students during classes and analysis of the assessment by the developer to identify their work.
Statistical methods – treatment results of checking students' projects, defined in Table �, these seven criteria and relevant indicators measurement range.
RESULTS AND DISCUSSION To achieve the objective and
prove the hypothesis was conducted examining teacher with students of Pedagogy of education to Engineering and technology. 22 students were
examined within three school years - in the second, third and fourth year of their training university. In the course of students in Pedagogy of technological training, taught in the second year, on the Methodology of Technology, taught in third grade and Diagnostics results in technological education, taught in the fourth year project approach is applied as an educational technology and element power of akmeology.
The results of pedagogical research on the use of the project approach in the training of students were statistically analyzed. To determine the level of achievement of students and their profession are using a system of projects. Each project is evaluated by criteria and indicators presented in Table �. The statistic data from the research fund are presented in Table 2, Table 3 and Table �.
Table 2 Results of the research in II year to training university Criterion
1
Criterion
2
Criterion
3
Criterion
4
Criterion
5
Criterion
6
Criterion
7
N Valid 22 22 22 22 22 22 22
Missing 0 0 0 0 0 0 0 Mean ,8636 ,6818 ,9545 ,6364 ,9545 ,9545 ,8182
Median 1,0000 1,0000 1,0000 1,0000 1,0000 1,0000 1,0000
Mode 1,00 1,00 1,00 1,00 1,00 1,00 1,00
Std. Deviation ,35125 ,47673 ,21320 ,49237 ,21320 ,21320 ,39477
Minimum ,00 ,00 ,00 ,00 ,00 ,00 ,00
Maximum 1,00 1,00 1,00 1,00 1,00 1,00 1,00
Sum 19,00 15,00 21,00 14,00 21,00 21,00 18,00
JOURNAL SCIENTIFIC AND APPLIED RESEARCH Vol. 3, 20�3
Table 3 Results of the research in III year to training university Criterion
1
Criterion
2
Criterion
3
Criterion
4
Criterion
5
Criterion
6
Criterion
7
N Valid 22 22 22 22 22 22 22
Missing 0 0 0 0 0 0 0 Mean 1,0000 ,8636 1,0000 ,7727 1,0000 1,0000 ,9545
Median 1,0000 1,0000 1,0000 1,0000 1,0000 1,0000 1,0000
Mode 1,00 1,00 1,00 1,00 1,00 1,00 1,00
Std. Deviation ,00000 ,35125 ,00000 ,42893 ,00000 ,00000 ,21320
Minimum 1,00 ,00 1,00 ,00 1,00 1,00 ,00
Maximum 1,00 1,00 1,00 1,00 1,00 1,00 1,00
Sum 22,00 19,00 22,00 17,00 22,00 22,00 21,00
Table 4 Results of the research in IV year to training university Criterion
1
Criterion
2
Criterion
3
Criterion
4
Criterion
5
Criterion
6
Criterion
7
N Valid 22 22 22 22 22 22 22
Missing 0 0 0 0 0 0 0 Mean 1,0000 1,0000 1,0000 1,0000 1,0000 1,0000 1,0000
Median 1,0000 1,0000 1,0000 1,0000 1,0000 1,0000 1,0000
Mode 1,00 1,00 1,00 1,00 1,00 1,00 1,00
Std. Deviation ,00000 ,00000 ,00000 ,00000 ,00000 ,00000 ,00000
Minimum 1,00 1,00 1,00 1,00 1,00 1,00 1,00
Maximum 1,00 1,00 1,00 1,00 1,00 1,00 1,00
Sum 22,00 22,00 22,00 22,00 22,00 22,00 22,00
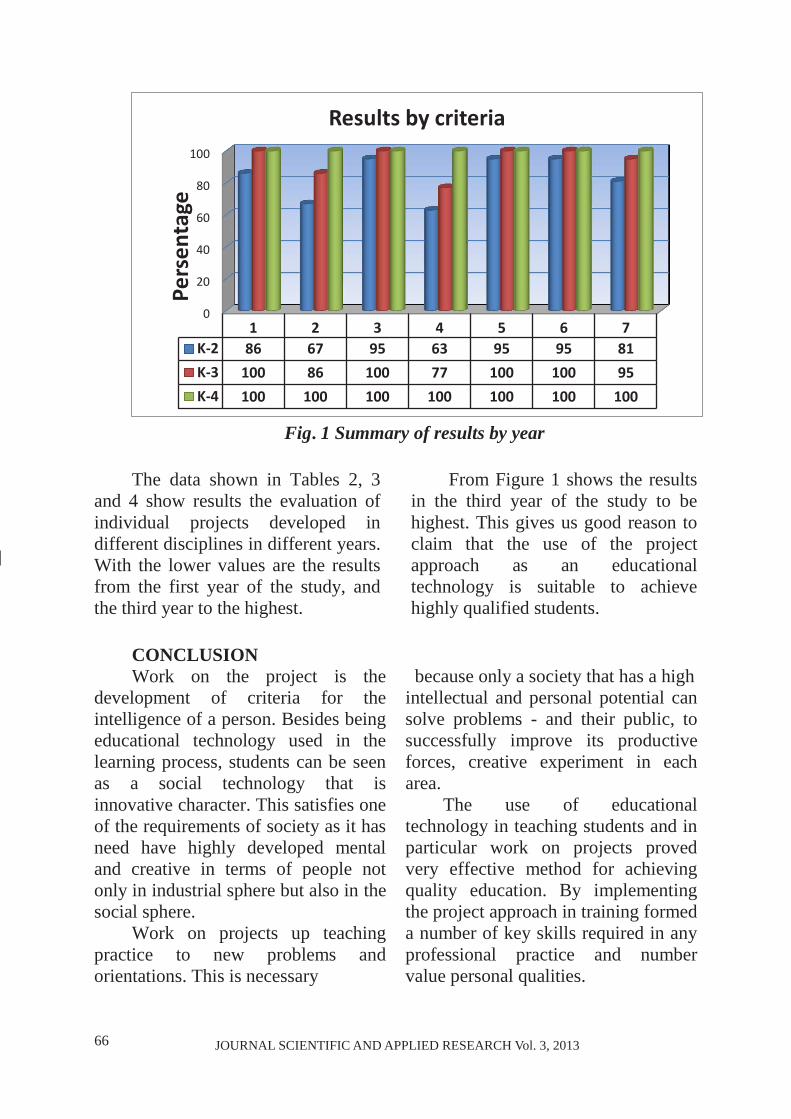
�� JOURNAL SCIENTIFIC AND APPLIED RESEARCH Vol. 3, 20�3JOURNAL SCIENTIFIC AND APPLIED RESEARCH Vol. 3, 20�3
Fig. 1 Summary of results by year
The data shown in Tables 2, 3
and � show results the evaluation of individual projects developed in different disciplines in different years. With the lower values are the results from the first year of the study, and the third year to the highest.
From Figure � shows the results in the third year of the study to be highest. This gives us good reason to claim that the use of the project approach as an educational technology is suitable to achieve highly qualified students.
CONCLUSION Work on the project is the
development of criteria for the intelligence of a person. Besides being educational technology used in the learning process, students can be seen as a social technology that is innovative character. This satisfies one of the requirements of society as it has need have highly developed mental and creative in terms of people not only in industrial sphere but also in the social sphere.
Work on projects up teaching practice to new problems and orientations. This is necessary
because only a society that has a high intellectual and personal potential can solve problems - and their public, to successfully improve its productive forces, creative experiment in each area.
The use of educational technology in teaching students and in particular work on projects proved very effective method for achieving quality education. By implementing the project approach in training formed a number of key skills required in any professional practice and number value personal qualities.
0
20
40
60
80
100
1 2 3 4 5 6 7K-2 86 67 95 63 95 95 81K-3 100 86 100 77 100 100 95K-4 100 100 100 100 100 100 100
Pers
enta
ge
Results by criteria
JOURNAL SCIENTIFIC AND APPLIED RESEARCH Vol. 3, 20�3
* This research was funded project RD-0�-2��/��.03.20�2 on "Educational technology in technology
education" to fund "Science Research" in Shumen University "Bishop Konstantin Preslavski"
REFERENCES:
�. Derkacha, A., Acmeological assessment of professional competence of public servants: Textbook. Moscow, 200�
2. Derkacha, A., Acmeology. Moscow, 200�
3. Derkach A., N. Kuzmina, Acmeology: achieving peaks professional skills. Moscow, ���3
�. Brown, P.L., S.K. Abell. Project Based Science. Science & Children ��, 200�, pp. �0–��
�. Colley, K.E. Project Based Science Instruction: A Primer. Science Teacher ��, 200�, pp. 23–2�
�. Miller, W. R., Тhe Definition of Design. http://www.tcdc.com
�. Nikolaeva, S., Social Work of project. Sofia. 200�
�. Nikolaeva, S. The history of the project method in education. –
Pedagogy, № 4/2004 �. Peycheva, R. Effectiveness of
project-based teaching strategies. - Strategies for educational and scientific policy �/200�, pp. 3�-��
�0. Peycheva, R. Design university course. Sofia, "St. Kliment Ohridski ", 2002
��. Petrov, P., M. Atanasova. Educational technologies and learning strategies. Sofia. Veda Slovena, 200�.
�2. Polat, E. S., New information and pedagogical technologies in system education. Academy, Moscow, 2002
�3. Simon, P., A Practical Guide for project work. Domestic and and Technology. Europe, 200�.
��. Hegedyush, D. Pedagogical project - a strategy for the development of creativity. - Primary Education, 2007, № 1, 38-�3.
��JOURNAL SCIENTIFIC AND APPLIED RESEARCH Vol. 3, 20�3JOURNAL SCIENTIFIC AND APPLIED RESEARCH Vol. 3, 20�3
Fig. 1 Summary of results by year
The data shown in Tables 2, 3
and � show results the evaluation of individual projects developed in different disciplines in different years. With the lower values are the results from the first year of the study, and the third year to the highest.
From Figure � shows the results in the third year of the study to be highest. This gives us good reason to claim that the use of the project approach as an educational technology is suitable to achieve highly qualified students.
CONCLUSION Work on the project is the
development of criteria for the intelligence of a person. Besides being educational technology used in the learning process, students can be seen as a social technology that is innovative character. This satisfies one of the requirements of society as it has need have highly developed mental and creative in terms of people not only in industrial sphere but also in the social sphere.
Work on projects up teaching practice to new problems and orientations. This is necessary
because only a society that has a high intellectual and personal potential can solve problems - and their public, to successfully improve its productive forces, creative experiment in each area.
The use of educational technology in teaching students and in particular work on projects proved very effective method for achieving quality education. By implementing the project approach in training formed a number of key skills required in any professional practice and number value personal qualities.
0
20
40
60
80
100
1 2 3 4 5 6 7K-2 86 67 95 63 95 95 81K-3 100 86 100 77 100 100 95K-4 100 100 100 100 100 100 100
Pers
enta
ge
Results by criteria
JOURNAL SCIENTIFIC AND APPLIED RESEARCH Vol. 3, 20�3
* This research was funded project RD-0�-2��/��.03.20�2 on "Educational technology in technology
education" to fund "Science Research" in Shumen University "Bishop Konstantin Preslavski"
REFERENCES:
�. Derkacha, A., Acmeological assessment of professional competence of public servants: Textbook. Moscow, 200�
2. Derkacha, A., Acmeology. Moscow, 200�
3. Derkach A., N. Kuzmina, Acmeology: achieving peaks professional skills. Moscow, ���3
�. Brown, P.L., S.K. Abell. Project Based Science. Science & Children ��, 200�, pp. �0–��
�. Colley, K.E. Project Based Science Instruction: A Primer. Science Teacher ��, 200�, pp. 23–2�
�. Miller, W. R., Тhe Definition of Design. http://www.tcdc.com
�. Nikolaeva, S., Social Work of project. Sofia. 200�
�. Nikolaeva, S. The history of the project method in education. –
Pedagogy, № 4/2004 �. Peycheva, R. Effectiveness of
project-based teaching strategies. - Strategies for educational and scientific policy �/200�, pp. 3�-��
�0. Peycheva, R. Design university course. Sofia, "St. Kliment Ohridski ", 2002
��. Petrov, P., M. Atanasova. Educational technologies and learning strategies. Sofia. Veda Slovena, 200�.
�2. Polat, E. S., New information and pedagogical technologies in system education. Academy, Moscow, 2002
�3. Simon, P., A Practical Guide for project work. Domestic and and Technology. Europe, 200�.
��. Hegedyush, D. Pedagogical project - a strategy for the development of creativity. - Primary Education, 2007, № 1, 38-�3.
�� JOURNAL SCIENTIFIC AND APPLIED RESEARCH Vol. 3, 20�3JOURNAL SCIENTIFIC AND APPLIED RESEARCH Vol. 3, 20�3
Original Contribution
Journal scientific and applied research, vol. 3, 20�3 Association Scientific and Applied Research
International Journal ISSN �3��-�2��
METHODS FOR DETERMINING THE AMOUNT OF MULTI-
ELECTRONIC SCINTILLATIONS ON THE SCREEN OF ELECTRO – OPTIC TRANSFORMER OF IMAGES
Zhivko Zhekov
KONSTANTIN PRESLAVSKY UNIVERSITY SHUMEN; ��� INIVERSITETSKA STR.
���2 SHUMEN;
ABSTRACT: One of the basic requirements when using electro – optical transformer (EOT) of images in space research is the low level of bright light flashes on the screen, called multi – electronic scintillations.
The experimental research of number and brightness of scintillations show that the distribution of the multi – electronic scintillations’ number across the screen’s diameter could be approximated by a normal law. The analysis of multi – electronic scintillations amplitude spectrum shows, that in the center of the EOT’s screen, the number of scintillations with greater amplitude is significantly greater in comparison with those at the end of the active surface of the screen.
KEY WORDS: electro – optical transformer , multi – electronic scintillations.
One of the basic requirements when using electro – optical transformer (EOT) of images in space research [�, 2, �, �, �] is the low level of bright light flashes on the screen, called multi – electronic scintillations. The existence of multi – electronic scintillations leads to significant expansion of the possibility for diminishing the utmost sensitivity of the EOT [�, �, �, and �0]. The definition of the amount of scintillations per definite time could be done with the help of the method for scintillations’ calculation while using photo – electronic multiplier [3]. If the number of scintillations’ distribution over the active surface of the screen is determined and experimentally are evaluated the
distribution parameters for a certain EOT, it is a matter of simpler methods required for the scintillation evaluation without the need for development of complex scanning devices. The current research is about evaluating the law of scintillations’ amount distribution over the active surface of the screen, evaluation of their amplitude spectrum and development of method for defining the amount of multi – electronic scintillations over the active surface of the EOT’s screen.
METHOD FOR DEFINING
THE DISTRIBUTION OF SCINTILLATIONS NUMBER OVER THE ACTIVE SURFACE OF THE EOT.
JOURNAL SCIENTIFIC AND APPLIED RESEARCH Vol. 3, 20�3
A certain device [3] is used in order to define the distribution of the scintillations number over the screen. The measurement of scintillations is made as in [3], from the surface o the EOT’s screen, with the help of mobile diaphragm, 2 mm in diameter, and optic system for transferring the image to the photo – electronic multiplier. The light source secures monochromatic adjustable infrared radiation, hitting the photo cathode of the EOT. The method for measurement is based on evaluation of average amplitude of scintillations, invoked by single electrons, hitting the EOT’s photo cathode, the amplitude distribution of scintillations and their integral number. The measurements are taken in dark, in light, on background �0-� cd/m2, in adjustable shine of EOT’s photo cathode by the light source. А
consecutive account is being taken after every diaphragm’s movement on every 2 mm from the center across the EOT’s screen radius toward the periphery. The received experimental data serves for setting up a dependency between scintillations’ amplitude spectrum and their integral number across the screen’s diameter. The measurements show that the distribution is asymmetric, which allows simplification of the method and evaluation of the scintillations’ distribution only in dependence with the screen’s radius.
MEASUREMENT – RESULTS AND ANALYSIS
Figure � shows experimental data for the distribution number of dark scintillations on the EOT’s screen with background brightness �0-
� cd/m2.
Figure �. Distribution of dark scintillations number across the EOT’s screen radius: 1 – when = 2,�; 2 – when = � and 3 – when
= �0.
Figure 2 shows the distribution of background scintillations across the
EOT’s screen radius with background brightness �0-� cd/m2.
�,0 0,�
Screen radius, mm 0 2 � � � �0 r
Scin
tilla
tions
am
ount
, Re
lativ
e un
its
3
2
�
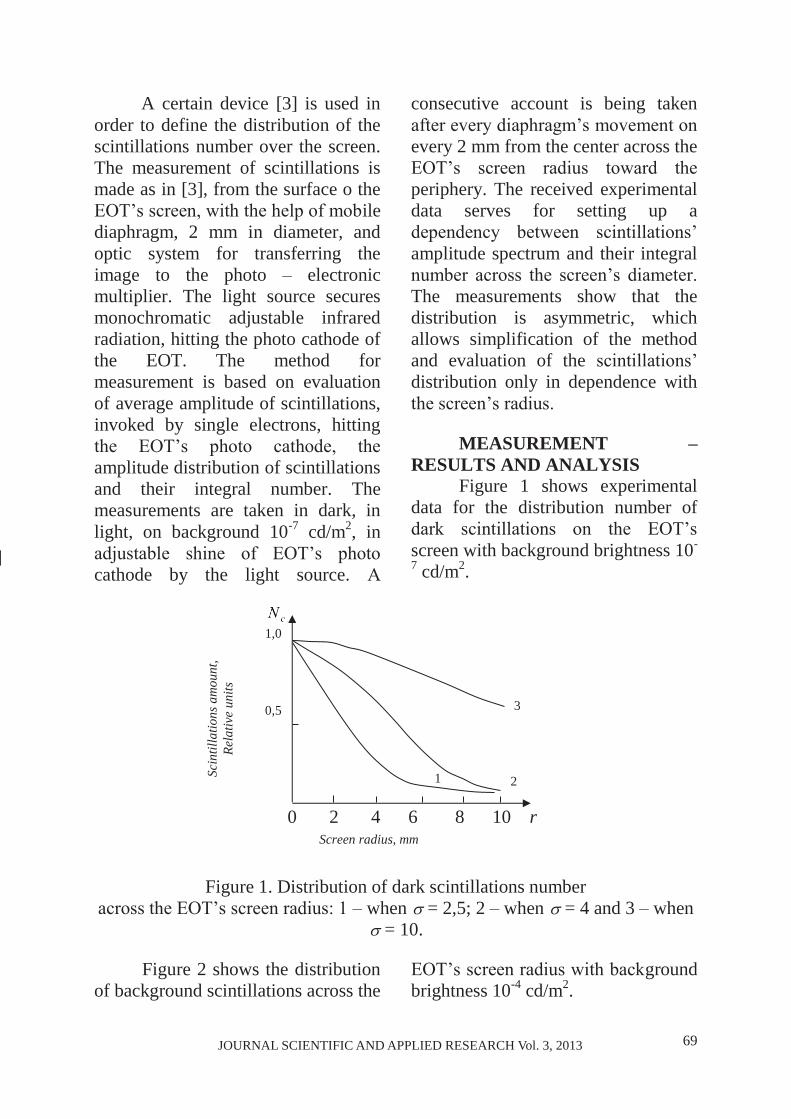
��JOURNAL SCIENTIFIC AND APPLIED RESEARCH Vol. 3, 20�3JOURNAL SCIENTIFIC AND APPLIED RESEARCH Vol. 3, 20�3
Original Contribution
Journal scientific and applied research, vol. 3, 20�3 Association Scientific and Applied Research
International Journal ISSN �3��-�2��
METHODS FOR DETERMINING THE AMOUNT OF MULTI-
ELECTRONIC SCINTILLATIONS ON THE SCREEN OF ELECTRO – OPTIC TRANSFORMER OF IMAGES
Zhivko Zhekov
KONSTANTIN PRESLAVSKY UNIVERSITY SHUMEN; ��� INIVERSITETSKA STR.
���2 SHUMEN;
ABSTRACT: One of the basic requirements when using electro – optical transformer (EOT) of images in space research is the low level of bright light flashes on the screen, called multi – electronic scintillations.
The experimental research of number and brightness of scintillations show that the distribution of the multi – electronic scintillations’ number across the screen’s diameter could be approximated by a normal law. The analysis of multi – electronic scintillations amplitude spectrum shows, that in the center of the EOT’s screen, the number of scintillations with greater amplitude is significantly greater in comparison with those at the end of the active surface of the screen.
KEY WORDS: electro – optical transformer , multi – electronic scintillations.
One of the basic requirements when using electro – optical transformer (EOT) of images in space research [�, 2, �, �, �] is the low level of bright light flashes on the screen, called multi – electronic scintillations. The existence of multi – electronic scintillations leads to significant expansion of the possibility for diminishing the utmost sensitivity of the EOT [�, �, �, and �0]. The definition of the amount of scintillations per definite time could be done with the help of the method for scintillations’ calculation while using photo – electronic multiplier [3]. If the number of scintillations’ distribution over the active surface of the screen is determined and experimentally are evaluated the
distribution parameters for a certain EOT, it is a matter of simpler methods required for the scintillation evaluation without the need for development of complex scanning devices. The current research is about evaluating the law of scintillations’ amount distribution over the active surface of the screen, evaluation of their amplitude spectrum and development of method for defining the amount of multi – electronic scintillations over the active surface of the EOT’s screen.
METHOD FOR DEFINING
THE DISTRIBUTION OF SCINTILLATIONS NUMBER OVER THE ACTIVE SURFACE OF THE EOT.
JOURNAL SCIENTIFIC AND APPLIED RESEARCH Vol. 3, 20�3
A certain device [3] is used in order to define the distribution of the scintillations number over the screen. The measurement of scintillations is made as in [3], from the surface o the EOT’s screen, with the help of mobile diaphragm, 2 mm in diameter, and optic system for transferring the image to the photo – electronic multiplier. The light source secures monochromatic adjustable infrared radiation, hitting the photo cathode of the EOT. The method for measurement is based on evaluation of average amplitude of scintillations, invoked by single electrons, hitting the EOT’s photo cathode, the amplitude distribution of scintillations and their integral number. The measurements are taken in dark, in light, on background �0-� cd/m2, in adjustable shine of EOT’s photo cathode by the light source. А
consecutive account is being taken after every diaphragm’s movement on every 2 mm from the center across the EOT’s screen radius toward the periphery. The received experimental data serves for setting up a dependency between scintillations’ amplitude spectrum and their integral number across the screen’s diameter. The measurements show that the distribution is asymmetric, which allows simplification of the method and evaluation of the scintillations’ distribution only in dependence with the screen’s radius.
MEASUREMENT – RESULTS AND ANALYSIS
Figure � shows experimental data for the distribution number of dark scintillations on the EOT’s screen with background brightness �0-
� cd/m2.
Figure �. Distribution of dark scintillations number across the EOT’s screen radius: 1 – when = 2,�; 2 – when = � and 3 – when
= �0.
Figure 2 shows the distribution of background scintillations across the
EOT’s screen radius with background brightness �0-� cd/m2.
�,0 0,�
Screen radius, mm 0 2 � � � �0 r
Scin
tilla
tions
am
ount
, Re
lativ
e un
its
3
2
�
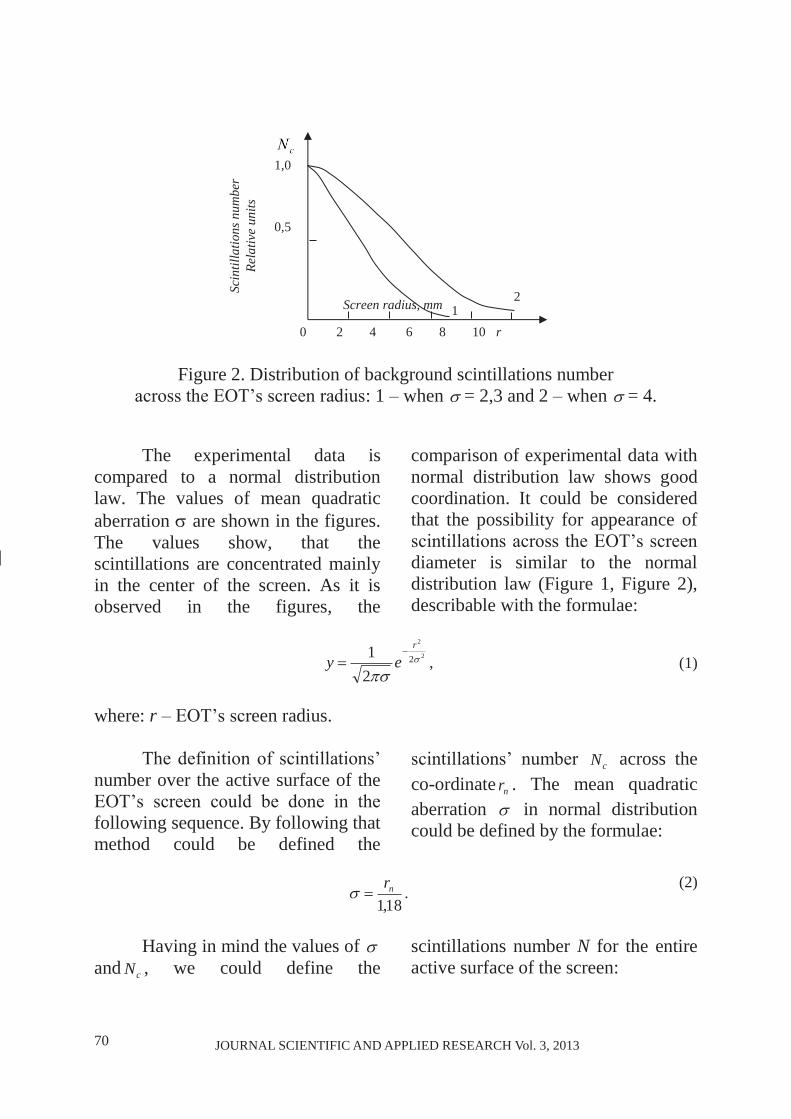
�0 JOURNAL SCIENTIFIC AND APPLIED RESEARCH Vol. 3, 20�3JOURNAL SCIENTIFIC AND APPLIED RESEARCH Vol. 3, 20�3
Figure 2. Distribution of background scintillations number across the EOT’s screen radius: � – when = 2,3 and 2 – when = �.
The experimental data is
compared to a normal distribution law. The values of mean quadratic aberration are shown in the figures. The values show, that the scintillations are concentrated mainly in the center of the screen. As it is observed in the figures, the
comparison of experimental data with normal distribution law shows good coordination. It could be considered that the possibility for appearance of scintillations across the EOT’s screen diameter is similar to the normal distribution law (Figure �, Figure 2), describable with the formulae:
2
2
2
2�
r
ey
, (�)
where: r – EOT’s screen radius.
The definition of scintillations’ number over the active surface of the EOT’s screen could be done in the following sequence. By following that method could be defined the
scintillations’ number cN across the co-ordinate nr . The mean quadratic aberration in normal distribution could be defined by the formulae:
��,�nr .
(2)
Having in mind the values of
and cN , we could define the scintillations number N for the entire active surface of the screen:
Screen radius, mm
0 2 � � � �0 r
�,0 0,�
Scin
tilla
tions
num
ber
Rela
tive
units
2 �
JOURNAL SCIENTIFIC AND APPLIED RESEARCH Vol. 3, 20�3
cc V
VNN , (3)
where: cV - the volume of a body, restricted by the surface in rotation of the
curve )(2 rfy across the analyzed surface of the screen S,
definable by 2.ySVc , where 2�
2 y ;
V - the volume of a body, restricted by the surface in rotation of the curve )(� rfy across the working surface of the screen:
2
�
2y
y
dyrSV , (�)
2
2
2� 2
�
kr
ey
;
kr - radius of the screen working surface.
The value of 2r could be defined by the equation (�):
22 2ln2�ln
yr .
(�)
By replacing equation (�) in equation (�), after integration we get:
���222�22 lnln)�)(ln(2 SyyyyyyyyV . (�)
Figure 3. Amplitude distribution of dark scintillations: � – measured in the center of EOT’s screen; 2 – measured at distance of 3 mm from the center of
the screen; 3 – measured at distance of 7 mm from the center of the EOT’ screen.
0 �0 �0 30 20 �0
�,0
0,�
Scin
tilla
tions
num
ber
Rela
tive
units
Screen scintillations amplitude, mV
� 2 3
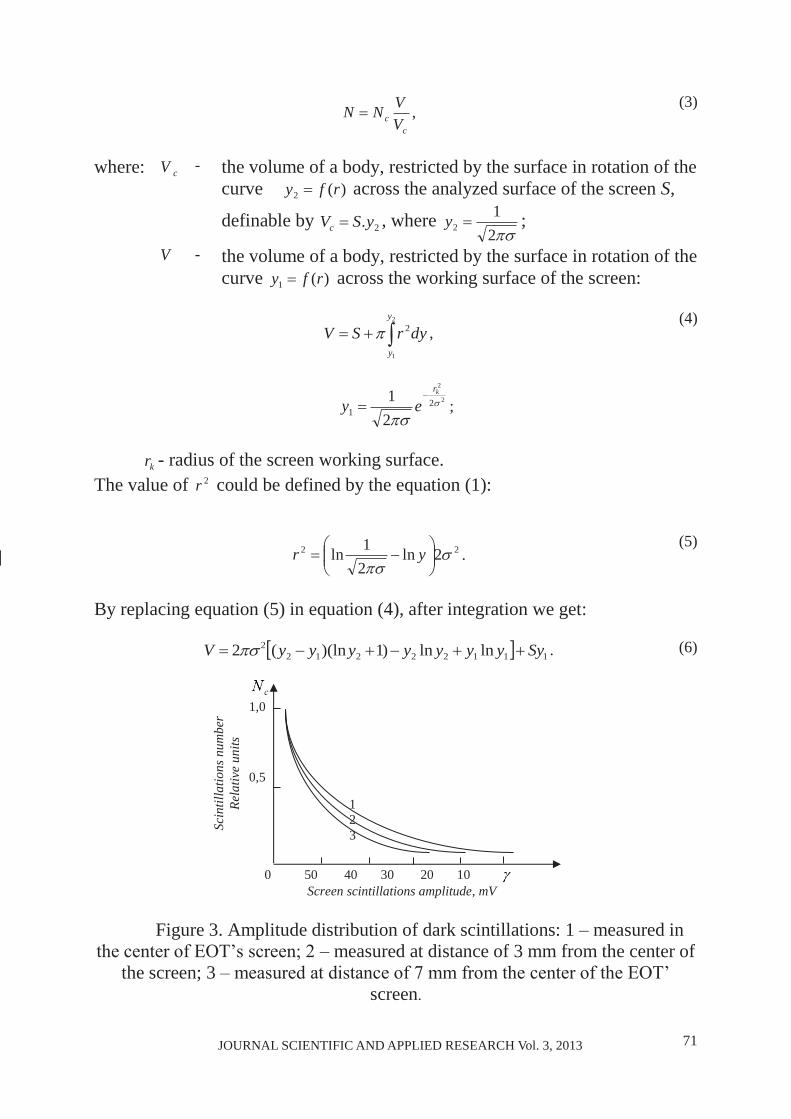
��JOURNAL SCIENTIFIC AND APPLIED RESEARCH Vol. 3, 20�3JOURNAL SCIENTIFIC AND APPLIED RESEARCH Vol. 3, 20�3
Figure 2. Distribution of background scintillations number across the EOT’s screen radius: � – when = 2,3 and 2 – when = �.
The experimental data is
compared to a normal distribution law. The values of mean quadratic aberration are shown in the figures. The values show, that the scintillations are concentrated mainly in the center of the screen. As it is observed in the figures, the
comparison of experimental data with normal distribution law shows good coordination. It could be considered that the possibility for appearance of scintillations across the EOT’s screen diameter is similar to the normal distribution law (Figure �, Figure 2), describable with the formulae:
2
2
2
2�
r
ey
, (�)
where: r – EOT’s screen radius.
The definition of scintillations’ number over the active surface of the EOT’s screen could be done in the following sequence. By following that method could be defined the
scintillations’ number cN across the co-ordinate nr . The mean quadratic aberration in normal distribution could be defined by the formulae:
��,�nr .
(2)
Having in mind the values of
and cN , we could define the scintillations number N for the entire active surface of the screen:
Screen radius, mm
0 2 � � � �0 r
�,0 0,�
Scin
tilla
tions
num
ber
Rela
tive
units
2 �
JOURNAL SCIENTIFIC AND APPLIED RESEARCH Vol. 3, 20�3
cc V
VNN , (3)
where: cV - the volume of a body, restricted by the surface in rotation of the
curve )(2 rfy across the analyzed surface of the screen S,
definable by 2.ySVc , where 2�
2 y ;
V - the volume of a body, restricted by the surface in rotation of the curve )(� rfy across the working surface of the screen:
2
�
2y
y
dyrSV , (�)
2
2
2� 2
�
kr
ey
;
kr - radius of the screen working surface.
The value of 2r could be defined by the equation (�):
22 2ln2�ln
yr .
(�)
By replacing equation (�) in equation (�), after integration we get:
���222�22 lnln)�)(ln(2 SyyyyyyyyV . (�)
Figure 3. Amplitude distribution of dark scintillations: � – measured in the center of EOT’s screen; 2 – measured at distance of 3 mm from the center of
the screen; 3 – measured at distance of 7 mm from the center of the EOT’ screen.
0 �0 �0 30 20 �0
�,0
0,�
Scin
tilla
tions
num
ber
Rela
tive
units
Screen scintillations amplitude, mV
� 2 3
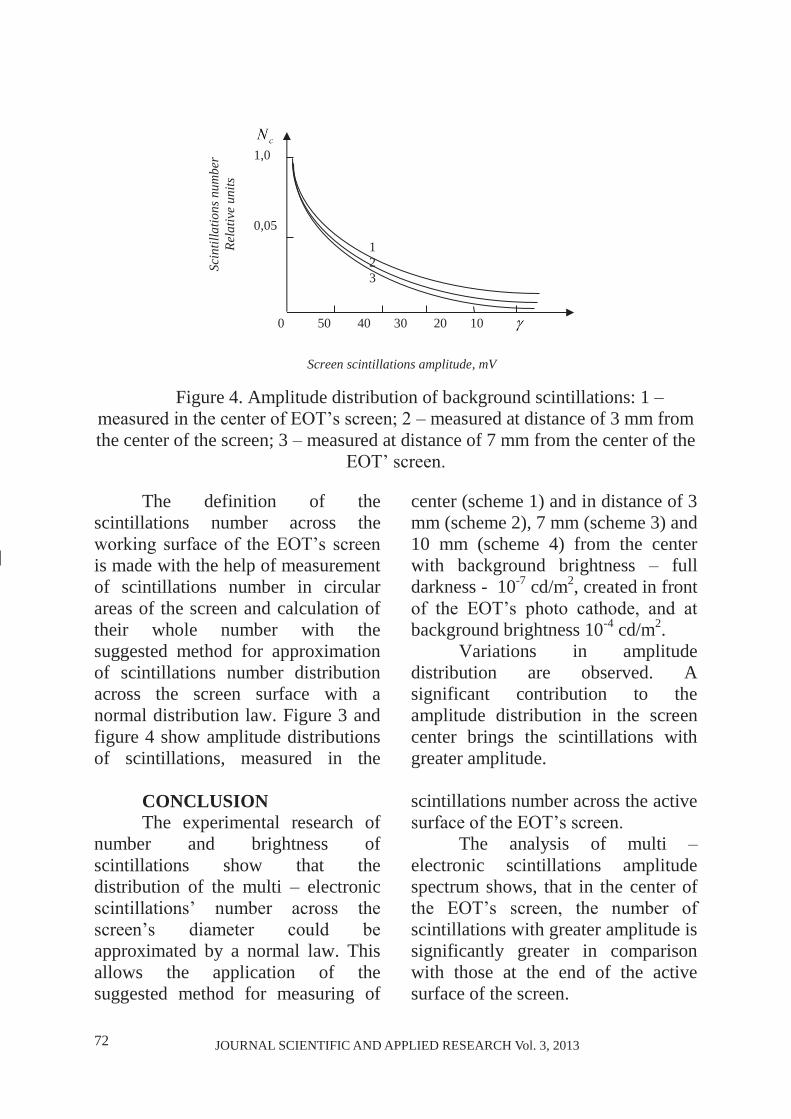
�2 JOURNAL SCIENTIFIC AND APPLIED RESEARCH Vol. 3, 20�3JOURNAL SCIENTIFIC AND APPLIED RESEARCH Vol. 3, 20�3
Figure �. Amplitude distribution of background scintillations: � – measured in the center of EOT’s screen; 2 – measured at distance of 3 mm from the center of the screen; 3 – measured at distance of � mm from the center of the
EOT’ screen. The definition of the
scintillations number across the working surface of the EOT’s screen is made with the help of measurement of scintillations number in circular areas of the screen and calculation of their whole number with the suggested method for approximation of scintillations number distribution across the screen surface with a normal distribution law. Figure 3 and figure � show amplitude distributions of scintillations, measured in the
center (scheme �) and in distance of 3 mm (scheme 2), � mm (scheme 3) and �0 mm (scheme �) from the center with background brightness – full darkness - �0-� cd/m2, created in front of the EOT’s photo cathode, and at background brightness �0-� cd/m2.
Variations in amplitude distribution are observed. A significant contribution to the amplitude distribution in the screen center brings the scintillations with greater amplitude.
CONCLUSION The experimental research of
number and brightness of scintillations show that the distribution of the multi – electronic scintillations’ number across the screen’s diameter could be approximated by a normal law. This allows the application of the suggested method for measuring of
scintillations number across the active surface of the EOT’s screen.
The analysis of multi – electronic scintillations amplitude spectrum shows, that in the center of the EOT’s screen, the number of scintillations with greater amplitude is significantly greater in comparison with those at the end of the active surface of the screen.
Screen scintillations amplitude, mV
0 �0 �0 30 20 �0
�,0
0,0�
Scin
tilla
tions
num
ber
Rela
tive
units
� 2 3
JOURNAL SCIENTIFIC AND APPLIED RESEARCH Vol. 3, 20�3
These multi – electronic scintillations could invoke the registration of non – existing signal, because of which along with the enumeration of multi – electronic
scintillations number across the active surface of the screen is necessary to be made measurement and accounting of the amplitude spectrum of scintillations across the EOT’s screen.
LITERATURE: [�.] Gecov P. S. Kosmos, ekologiia, sigurnost. Nov bylgarski universitet, Sofiia, 2002, 2�� s. [2.] Gecov P. S. Nauchno - tehnicheska programa na vtoriia bylgaro - ruski kosmicheski polet proekt "Shipka" - osnovni celi, zadachi i rezultati. Sbornik dokladi "�0 godini kosmicheski proekt "Shipka", Institut za kosmicheski izslevaniia - BAN, Sofiia, ����, str. �� - 22. [3.] Jekov J. S. Aparatura i metodika za obektivna ocenka na harakteristikite na elektronno - optichni preobrazuvateli. Vtora nacionalna konferenciia po optika i lazerna tehnika. "Optika ��", Varna, ���� g. [�.] Iliev I. C. Spektrometrichna sistema za slynchevi i atmosferni izsledvaniia. Sp. "Elektronika i elektrotehnika"_N3-�, 2000, str. �3 - ��. [�.] Mardirosian G. H. Aerokosmicheski metodi v ekologiiata i prouchvaneto na okolnata sreda. Chast_I. Akademichno izdatelstvo "Marin Drinov", Sofiia, 2003, str. 20�. [�.] Petrov P., Iordanov D., Lukarski Hr., Matrapov I., Fotev Sv. Spektrometrichna sistema za prilojeniiata v oblastta na monitoring
na zamyrsiavaneto na prirodnata sreda. Sbornik dokladi "30 godini organizirani kosmicheski izsledvaniia v Bylgaiia" IKI - BAN, Sofiia, 2000, str. ��0 - ���. [�.] Stoianov S. J., Mardirosian G. H. Analiz na syshtestvuvashti metodi i sredstva za izsledvane obshtoto sydyrjanie na atmosferen ozon i negovoto vertikalno razpredelenie. Godishnik na Tehnicheski Universitet, Varna,_ISSN �3��-���H, 200�, str. ��0 - ���. [�.]Hodgson R. M., Beurle R. L. Image intensifier noise and its effects on visual pattern detection. Photo – electronic image devices. Proc. of ��-th symposium ����. London, ����. p. ���. [�.]Pollehn H. K. Noise in second generation image intensifier tubes. Proceedings of the technical programe. Electro – optical systems design conference, New York, 002, p. 23�. [�0.]Sanders A. A. Modulation Transfer Function Measurements for Infrared Systems. The George Washington University, Washington DC, 2000. [��.]Tatian B. Method for obtaining the transfer function from the edge response function, JOSA, ��, ��� – ���, ����.
�3JOURNAL SCIENTIFIC AND APPLIED RESEARCH Vol. 3, 20�3JOURNAL SCIENTIFIC AND APPLIED RESEARCH Vol. 3, 20�3
Figure �. Amplitude distribution of background scintillations: � – measured in the center of EOT’s screen; 2 – measured at distance of 3 mm from the center of the screen; 3 – measured at distance of � mm from the center of the
EOT’ screen. The definition of the
scintillations number across the working surface of the EOT’s screen is made with the help of measurement of scintillations number in circular areas of the screen and calculation of their whole number with the suggested method for approximation of scintillations number distribution across the screen surface with a normal distribution law. Figure 3 and figure � show amplitude distributions of scintillations, measured in the
center (scheme �) and in distance of 3 mm (scheme 2), � mm (scheme 3) and �0 mm (scheme �) from the center with background brightness – full darkness - �0-� cd/m2, created in front of the EOT’s photo cathode, and at background brightness �0-� cd/m2.
Variations in amplitude distribution are observed. A significant contribution to the amplitude distribution in the screen center brings the scintillations with greater amplitude.
CONCLUSION The experimental research of
number and brightness of scintillations show that the distribution of the multi – electronic scintillations’ number across the screen’s diameter could be approximated by a normal law. This allows the application of the suggested method for measuring of
scintillations number across the active surface of the EOT’s screen.
The analysis of multi – electronic scintillations amplitude spectrum shows, that in the center of the EOT’s screen, the number of scintillations with greater amplitude is significantly greater in comparison with those at the end of the active surface of the screen.
Screen scintillations amplitude, mV
0 �0 �0 30 20 �0
�,0
0,0�
Scin
tilla
tions
num
ber
Rela
tive
units
� 2 3
JOURNAL SCIENTIFIC AND APPLIED RESEARCH Vol. 3, 20�3
These multi – electronic scintillations could invoke the registration of non – existing signal, because of which along with the enumeration of multi – electronic
scintillations number across the active surface of the screen is necessary to be made measurement and accounting of the amplitude spectrum of scintillations across the EOT’s screen.
LITERATURE: [�.] Gecov P. S. Kosmos, ekologiia, sigurnost. Nov bylgarski universitet, Sofiia, 2002, 2�� s. [2.] Gecov P. S. Nauchno - tehnicheska programa na vtoriia bylgaro - ruski kosmicheski polet proekt "Shipka" - osnovni celi, zadachi i rezultati. Sbornik dokladi "�0 godini kosmicheski proekt "Shipka", Institut za kosmicheski izslevaniia - BAN, Sofiia, ����, str. �� - 22. [3.] Jekov J. S. Aparatura i metodika za obektivna ocenka na harakteristikite na elektronno - optichni preobrazuvateli. Vtora nacionalna konferenciia po optika i lazerna tehnika. "Optika ��", Varna, ���� g. [�.] Iliev I. C. Spektrometrichna sistema za slynchevi i atmosferni izsledvaniia. Sp. "Elektronika i elektrotehnika"_N3-�, 2000, str. �3 - ��. [�.] Mardirosian G. H. Aerokosmicheski metodi v ekologiiata i prouchvaneto na okolnata sreda. Chast_I. Akademichno izdatelstvo "Marin Drinov", Sofiia, 2003, str. 20�. [�.] Petrov P., Iordanov D., Lukarski Hr., Matrapov I., Fotev Sv. Spektrometrichna sistema za prilojeniiata v oblastta na monitoring
na zamyrsiavaneto na prirodnata sreda. Sbornik dokladi "30 godini organizirani kosmicheski izsledvaniia v Bylgaiia" IKI - BAN, Sofiia, 2000, str. ��0 - ���. [�.] Stoianov S. J., Mardirosian G. H. Analiz na syshtestvuvashti metodi i sredstva za izsledvane obshtoto sydyrjanie na atmosferen ozon i negovoto vertikalno razpredelenie. Godishnik na Tehnicheski Universitet, Varna,_ISSN �3��-���H, 200�, str. ��0 - ���. [�.]Hodgson R. M., Beurle R. L. Image intensifier noise and its effects on visual pattern detection. Photo – electronic image devices. Proc. of ��-th symposium ����. London, ����. p. ���. [�.]Pollehn H. K. Noise in second generation image intensifier tubes. Proceedings of the technical programe. Electro – optical systems design conference, New York, 002, p. 23�. [�0.]Sanders A. A. Modulation Transfer Function Measurements for Infrared Systems. The George Washington University, Washington DC, 2000. [��.]Tatian B. Method for obtaining the transfer function from the edge response function, JOSA, ��, ��� – ���, ����.
�� JOURNAL SCIENTIFIC AND APPLIED RESEARCH Vol. 3, 20�3
JOURNAL SCIENTIFIC AND APPLIED RESEARCH Vol. 3, 20�3
Original Contribution
Journal scientific and applied research, vol. 3, 20�3 Association Scientific and Applied Research
International Journal ISSN �3��-�2��
STUDY AND ANALYSIS OF AN IMAGE BY AN OPTICAL-ELECTRONIC SYSTEM
Stiliyan Zh. Stoyanov
SPACE RESEARCH AND TECHNOLOGIES INSTITUTE – BULGARIAN ACADEMY OF
SCIENCES
Abstract: Some interrelations of two-dimensional image of optic electronic devices are developed in this paper. The informativity of the object image is investigated through the use of multi spectral optic system, limited by aberrations.
The transmitting function of the optic system and the structure of optic analyzer of the object image define the optic tract characteristics of optic and electronic device, as a channel for transmitting of information over dimensional and power producing attributes [�,2,3]. The non-ideality of the optical system, revealed in residual aberrations leads to image curve in comparison with the object In this the non - correlated microstructure of object and background brightness, becomes correlated when being transmitted through the optic When confining the investigated wave lengths, the diffraction of the dispersion circle , depending on the diameter of the object - glass D and the working length of the wave is defined by the interrelation
(�)
The strip of omission in the optic
system, when the focal distance / is equal to:
(2)
When reporting the lower value of the angular quantity of the dispersion circle sin and the equality of the relative aperture '2
'tg
fD
we have
(3)
Where ' - the half of the aperture angle of the object - glass.
According to Koteimkov’s theorem [�] for discretization of a certain number of points in a function limited by (he strip of omission )( and the criterion for discernability of adjacent elements over the diameter of the circle of Eri - over the diffraction image of light distribution amount of points basing the light distribution on a single surface unit of two dimensional image will be
JOURNAL SCIENTIFIC AND APPLIED RESEARCH Vol. 3, 20�3
(�) [ ]
Considering the value of (3) we have
(�) [ ]
Considering the range of the entire visual field of optical system 2 : (�) [ ]
If there are other criteria for discernability, the digit coefficient in formulae (�) and (�) could be different. For narrow - angular optic system
sin and then we have (�) [ ]
Formula (�) shows that the informativity of the optic image, created by a limited by diffraction, depends on the working length of the wave the aperture visual field. The informativity increases with the decrease of length of wave increase of the focal distance f , visual field and the aperture In fact, for a single - channeled and single - spectral system, the image is defined by the amount of light in a line of points, which could be defined in a line of points, which could be defined with the condition of a matrix, describing a vector, non - correlated with the amount between points ...,,,...,, 32�32� nnnaaa in the field of the image [�] (�)
k
k
nnnn
aaaa
N
bbbb
bbbb
E...,,
..........................
...,,
32�
32�
The number of the elements in the
matrix is equal to N For a system with top amount of light,
kaa bb ,...�
equal to 0 or �, the value of the elements in matrix (�) are:
bj = 0 when bj < b’ bj = 1 when bj ≥ b’, where bj - the amount of light of an unspecified jth element of the matrix b’ - light amount threshold level The average informativity (entropy) of the image )(EHN described in matrix (�), will be [�]: (�)
N
jjjN bPbPEH
�2 )(log)()( .
If we assume equally possible 0jb
and �jb , i.e. the probability �,0)( jbP , then �)(log2 jbP Then
the average informativity of the image is directly connected with the number of the points N. (�0) NEH N 2
�)( .
When we use a multi spectral optic system, the informativity of the object image increases with the increase of the quality of the investigated wavelengths ….. The dependence of the image informativity of the wavelengths leads to transformation of the matrix condition of the light amount NE , which stays dimensional, i.e. it consists of a several independent matrixes dependent on the amount I of the spectral scope.
).()...();( 2� iNNN EEE
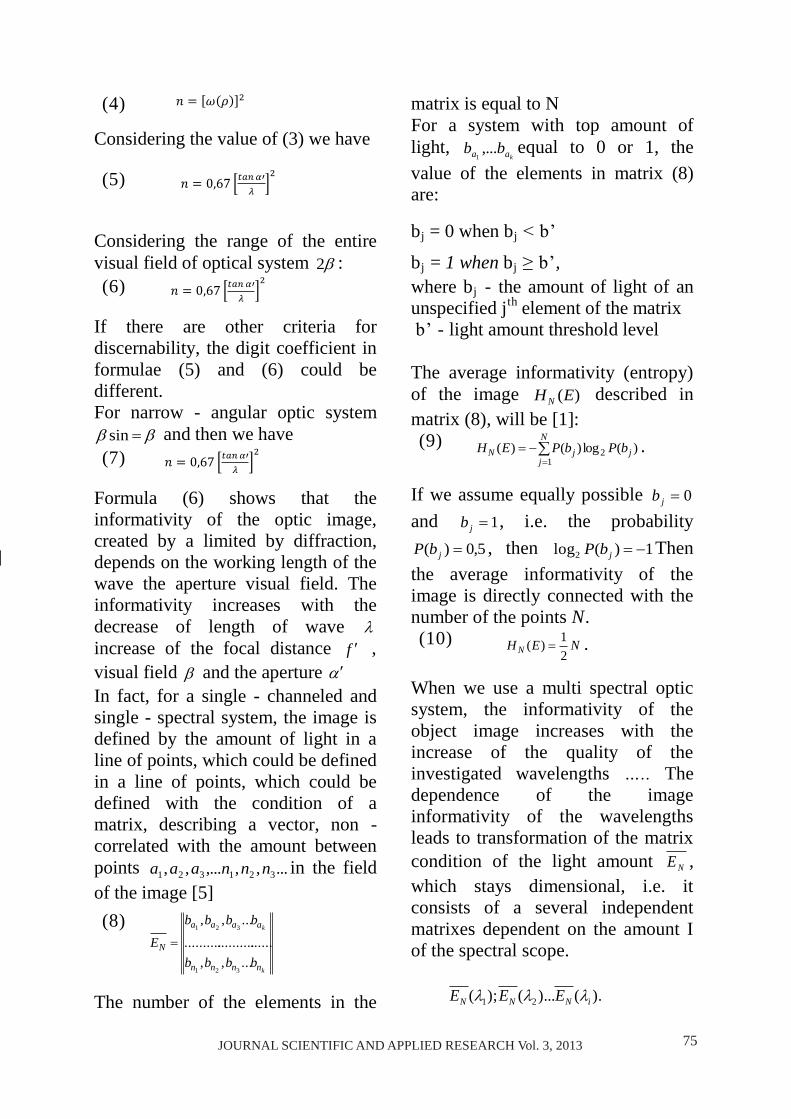
��JOURNAL SCIENTIFIC AND APPLIED RESEARCH Vol. 3, 20�3
JOURNAL SCIENTIFIC AND APPLIED RESEARCH Vol. 3, 20�3
Original Contribution
Journal scientific and applied research, vol. 3, 20�3 Association Scientific and Applied Research
International Journal ISSN �3��-�2��
STUDY AND ANALYSIS OF AN IMAGE BY AN OPTICAL-ELECTRONIC SYSTEM
Stiliyan Zh. Stoyanov
SPACE RESEARCH AND TECHNOLOGIES INSTITUTE – BULGARIAN ACADEMY OF
SCIENCES
Abstract: Some interrelations of two-dimensional image of optic electronic devices are developed in this paper. The informativity of the object image is investigated through the use of multi spectral optic system, limited by aberrations.
The transmitting function of the optic system and the structure of optic analyzer of the object image define the optic tract characteristics of optic and electronic device, as a channel for transmitting of information over dimensional and power producing attributes [�,2,3]. The non-ideality of the optical system, revealed in residual aberrations leads to image curve in comparison with the object In this the non - correlated microstructure of object and background brightness, becomes correlated when being transmitted through the optic When confining the investigated wave lengths, the diffraction of the dispersion circle , depending on the diameter of the object - glass D and the working length of the wave is defined by the interrelation
(�)
The strip of omission in the optic
system, when the focal distance / is equal to:
(2)
When reporting the lower value of the angular quantity of the dispersion circle sin and the equality of the relative aperture '2
'tg
fD
we have
(3)
Where ' - the half of the aperture angle of the object - glass.
According to Koteimkov’s theorem [�] for discretization of a certain number of points in a function limited by (he strip of omission )( and the criterion for discernability of adjacent elements over the diameter of the circle of Eri - over the diffraction image of light distribution amount of points basing the light distribution on a single surface unit of two dimensional image will be
JOURNAL SCIENTIFIC AND APPLIED RESEARCH Vol. 3, 20�3
(�) [ ]
Considering the value of (3) we have
(�) [ ]
Considering the range of the entire visual field of optical system 2 : (�) [ ]
If there are other criteria for discernability, the digit coefficient in formulae (�) and (�) could be different. For narrow - angular optic system
sin and then we have (�) [ ]
Formula (�) shows that the informativity of the optic image, created by a limited by diffraction, depends on the working length of the wave the aperture visual field. The informativity increases with the decrease of length of wave increase of the focal distance f , visual field and the aperture In fact, for a single - channeled and single - spectral system, the image is defined by the amount of light in a line of points, which could be defined in a line of points, which could be defined with the condition of a matrix, describing a vector, non - correlated with the amount between points ...,,,...,, 32�32� nnnaaa in the field of the image [�] (�)
k
k
nnnn
aaaa
N
bbbb
bbbb
E...,,
..........................
...,,
32�
32�
The number of the elements in the
matrix is equal to N For a system with top amount of light,
kaa bb ,...�
equal to 0 or �, the value of the elements in matrix (�) are:
bj = 0 when bj < b’ bj = 1 when bj ≥ b’, where bj - the amount of light of an unspecified jth element of the matrix b’ - light amount threshold level The average informativity (entropy) of the image )(EHN described in matrix (�), will be [�]: (�)
N
jjjN bPbPEH
�2 )(log)()( .
If we assume equally possible 0jb
and �jb , i.e. the probability �,0)( jbP , then �)(log2 jbP Then
the average informativity of the image is directly connected with the number of the points N. (�0) NEH N 2
�)( .
When we use a multi spectral optic system, the informativity of the object image increases with the increase of the quality of the investigated wavelengths ….. The dependence of the image informativity of the wavelengths leads to transformation of the matrix condition of the light amount NE , which stays dimensional, i.e. it consists of a several independent matrixes dependent on the amount I of the spectral scope.
).()...();( 2� iNNN EEE
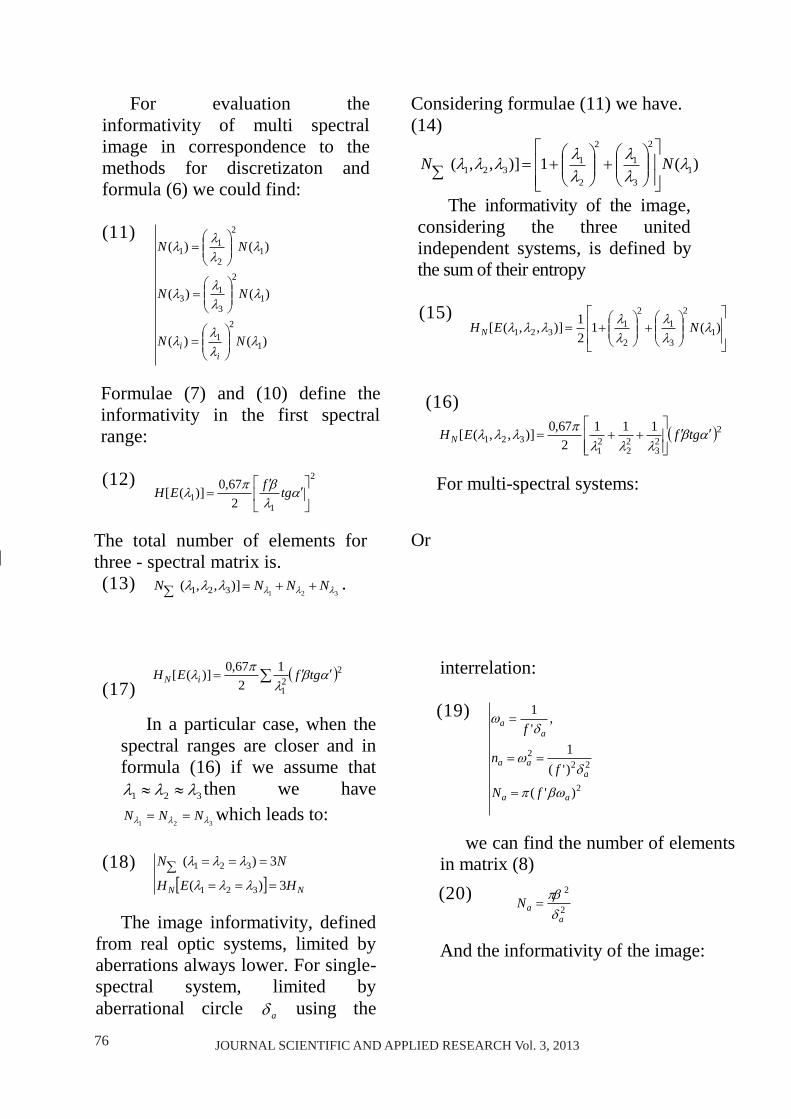
�� JOURNAL SCIENTIFIC AND APPLIED RESEARCH Vol. 3, 20�3
JOURNAL SCIENTIFIC AND APPLIED RESEARCH Vol. 3, 20�3
For evaluation the informativity of multi spectral image in correspondence to the methods for discretizaton and formula (�) we could find:
(��)
)()(
)()(
)()(
�
2�
�
2
3
�3
�
2
2
��
NN
NN
NN
ii
Formulae (�) and (�0) define the informativity in the first spectral range: (�2) 2
�� 2
��,0)]([
tgfEH
The total number of elements for three - spectral matrix is. (�3)
32�)],,( 32� NNNN .
Considering formulae (��) we have. (��)
)(�)],,( �
2
3
�
2
2
�32�
NN
The informativity of the image, considering the three united independent systems, is defined by the sum of their entropy
(��)
)(�
2�)],,([ �
2
3
�2
2
�32�
NEH N
Or
(��)
22�
�2��,0)]([
tgfEH iN
In a particular case, when the spectral ranges are closer and in formula (��) if we assume that
32� then we have
32� NNN which leads to:
(��) NN HEH
NN
3)(
3)(
32�
32�
The image informativity, defined from real optic systems, limited by aberrations always lower. For single-spectral system, limited by aberrational circle a using the
interrelation:
(��)
2
222
)'(
)'(�
,'�
aa
aaa
aa
fN
fn
f
we can find the number of elements in matrix (�) (20) 2
2
aaN
And the informativity of the image:
(��)
223
22
2�
32����
2��,0)],,([
tgfEHN
For multi-spectral systems:
JOURNAL SCIENTIFIC AND APPLIED RESEARCH Vol. 3, 20�3
(2�) 2
2
2
2)]([
aaN EH
For a three - spectral system, limited by aberrations ,,,
32� (22)
23
22
2�
���),,( 232�
aN
(23)
23
22
2�
���2
)],,([2
32�
ENa
In general, for multi-spectral systems we have: (2�)
2�
�)('
'
2
iaN
(2�)
2
'
'
2
2�
�)]([
ia EN
In conclusion we could state that � The image informativity, created by a real optic system, limited by aberrations depends mainly on the power producing parameters of the signals in each channel 2 For the investigated type of optic and electronic devices, the information limit is defined by the strip of the investigated optic signal from the object, by the dimensional - frequency characteristic of optic system, by its geometric characteristics (visual field, aperture, focal distance of the object - glass), the power producing characteristics of the signal (fluctuation of the image light amount, caused by photon noises).
Reference: �. Mauley B.W., Holmshaw B.T. Photo - Electronics Image Devices, ���� vol. 2�, p ��� 2. Stoyanov S. Aplied Optics Publ. Faber, 200�, 23� p. 3. Stoyanov S. Design of Optical Instruments, Publ. Association �. Scientific and Applied Research, 20�0, 3�� p. �. Tagirov M. P. Izmeritelniye informacionnie sistemii, M. Energiya, ���� �. Uelenz R.W., “Analit Chem", ����, vol ��, N2 p. 2��
�. Mauley B.W., Holmshaw B.T. Photo - Electronics Image Devices, ���� vol. 2�, p ��� �. Stoyanov S. Aplied Optics Publ. Faber, 200�, 23� p. �. Stoyanov S. Design of Optical Instruments, Publ. Association �0. Scientific and Applied Research, 20�0, 3�� p. ��. Tagirov M. P. Izmeritelniye informacionnie sistemii, M. Energiya, ���� �2. Uelenz R.W., “Analit Chem", ����, vol ��, N2 p. 2��
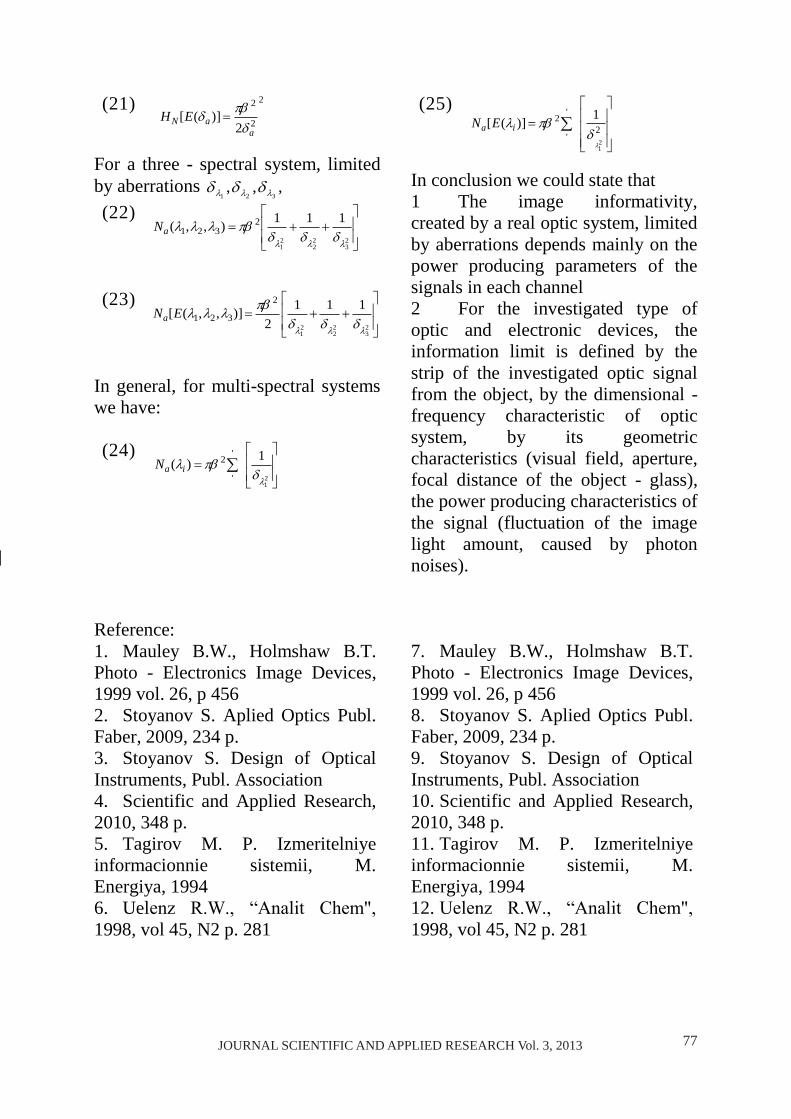
��JOURNAL SCIENTIFIC AND APPLIED RESEARCH Vol. 3, 20�3
JOURNAL SCIENTIFIC AND APPLIED RESEARCH Vol. 3, 20�3
For evaluation the informativity of multi spectral image in correspondence to the methods for discretizaton and formula (�) we could find:
(��)
)()(
)()(
)()(
�
2�
�
2
3
�3
�
2
2
��
NN
NN
NN
ii
Formulae (�) and (�0) define the informativity in the first spectral range: (�2) 2
�� 2
��,0)]([
tgfEH
The total number of elements for three - spectral matrix is. (�3)
32�)],,( 32� NNNN .
Considering formulae (��) we have. (��)
)(�)],,( �
2
3
�
2
2
�32�
NN
The informativity of the image, considering the three united independent systems, is defined by the sum of their entropy
(��)
)(�
2�)],,([ �
2
3
�2
2
�32�
NEH N
Or
(��)
22�
�2��,0)]([
tgfEH iN
In a particular case, when the spectral ranges are closer and in formula (��) if we assume that
32� then we have
32� NNN which leads to:
(��) NN HEH
NN
3)(
3)(
32�
32�
The image informativity, defined from real optic systems, limited by aberrations always lower. For single-spectral system, limited by aberrational circle a using the
interrelation:
(��)
2
222
)'(
)'(�
,'�
aa
aaa
aa
fN
fn
f
we can find the number of elements in matrix (�) (20) 2
2
aaN
And the informativity of the image:
(��)
223
22
2�
32����
2��,0)],,([
tgfEHN
For multi-spectral systems:
JOURNAL SCIENTIFIC AND APPLIED RESEARCH Vol. 3, 20�3
(2�) 2
2
2
2)]([
aaN EH
For a three - spectral system, limited by aberrations ,,,
32� (22)
23
22
2�
���),,( 232�
aN
(23)
23
22
2�
���2
)],,([2
32�
ENa
In general, for multi-spectral systems we have: (2�)
2�
�)('
'
2
iaN
(2�)
2
'
'
2
2�
�)]([
ia EN
In conclusion we could state that � The image informativity, created by a real optic system, limited by aberrations depends mainly on the power producing parameters of the signals in each channel 2 For the investigated type of optic and electronic devices, the information limit is defined by the strip of the investigated optic signal from the object, by the dimensional - frequency characteristic of optic system, by its geometric characteristics (visual field, aperture, focal distance of the object - glass), the power producing characteristics of the signal (fluctuation of the image light amount, caused by photon noises).
Reference: �. Mauley B.W., Holmshaw B.T. Photo - Electronics Image Devices, ���� vol. 2�, p ��� 2. Stoyanov S. Aplied Optics Publ. Faber, 200�, 23� p. 3. Stoyanov S. Design of Optical Instruments, Publ. Association �. Scientific and Applied Research, 20�0, 3�� p. �. Tagirov M. P. Izmeritelniye informacionnie sistemii, M. Energiya, ���� �. Uelenz R.W., “Analit Chem", ����, vol ��, N2 p. 2��
�. Mauley B.W., Holmshaw B.T. Photo - Electronics Image Devices, ���� vol. 2�, p ��� �. Stoyanov S. Aplied Optics Publ. Faber, 200�, 23� p. �. Stoyanov S. Design of Optical Instruments, Publ. Association �0. Scientific and Applied Research, 20�0, 3�� p. ��. Tagirov M. P. Izmeritelniye informacionnie sistemii, M. Energiya, ���� �2. Uelenz R.W., “Analit Chem", ����, vol ��, N2 p. 2��
�� JOURNAL SCIENTIFIC AND APPLIED RESEARCH Vol. 3, 20�3JOURNAL SCIENTIFIC AND APPLIED RESEARCH Vol. 3, 20�3
Original Contribution
Journal scientific and applied research, vol. 3, 20�3 Association Scientific and Applied Research
International Journal ISSN �3��-�2��
THE COMPLEXES OF Co2+ IN Bi12SiO20 AND Co3+ IN Bi12TiO20
Petya Petkova, Petko Vasilev and Genoveva Nedelcheva
Shumen University “Konstantin Preslavsky”, 115 Universitetska street, 9712 Shumen, e-mail: [email protected]
ABSTRACT: We have investigated the absorption of the Co doped Bi12MO20 (M = Si, Ti) in the spectral
region 12 092–18 149 cm-1. The observed absorption band is due to the Co-impurity in the visible spectral region. This absorption band does not contain information about the exact energy position of the Co levels. Therefore, we have calculated the second derivative of absorption. It is established that Co2+ ions are surrounded by distorted tetrahedral coordination in Bi12SiO20 (BSO). The energy level structure of the Co2+ ion in BSO and this of Co3+ ion in Bi12TiO20 are also presented. We have calculated the crystal field parameter Dq and the Racah parameters B and C for Co2+ ion.
KEY WORDS: absorption spectrum, 3d transition metals, Jahn-Teller effect, spin-orbit interaction
INTRODUCTION Sillenite-type Bi�2SiO20 (BSO)
pure and doped single crystals are widely used in optical devices, spatial-time light modulators and as holographic media [�,2]. BSO are cubic crystals, I23 space group symmetry, built up of Si-O� tetrahedrons and deformed Bi-On polyhedrons [3], defined by some authors as Bi-On (n = �) - octahedrons [�] or as Bi-O-pseudo-octahedrons [�]. The chemical bonds Bi-O and Si-O in BSO are covalent [3]. After reported literature data most of doping ions in BSO are placed at metal position in Si-O�-tetrahedron [�]. For Ru, Cu and Mn - ions there are data for occupation of both metal positions in tetrahedron (replacing Si) and in pseudooctahedron (replacing
Bi) [�,�,�]. Many studies on the optical absorption coefficient of doped with Al, P, Cr, Mn, Fe, Co, Ni, Cu, Se and Ru sillenites in the VIS spectral region have been reported so far and the effect of doping were discussed mainly in respect to possible oxidation states of doping ions, position of allowed electron transitions in the �.� – 2.2 eV region and the dependence of corresponding absorption coefficient on dopant concentration [�,�,�-��].
Nevertheless, until now there are no systematic complex investigations on doping effects on impurity levels in the band gap (�.�–2.2 eV). We attempt to present the effect of doping as well as to specify some of main parameters of the crystal field and the spin-orbit
JOURNAL SCIENTIFIC AND APPLIED RESEARCH Vol. 3, 20�3
interaction in the substructures of the sillenites.
MATERIALS AND SAMPLES
PREPARATION We investigated doped BSO and
BTO crystals with Co. All the crystals were grown from stoichiometric melts Bi2O3:SiO2 = �:� using the Czochralski method under conditions described in detail elsewhere [��,��]. High purity Bi2O3, SiO2 and Co3O� were used for synthesis and doping. The concentration of doping was determined by flame (Zeeman 3030) and electrical-thermal atomic (Varian 2�0) absorption spectrometry as well as by inductively coupled plasma atomic emission spectrometry (Jobin Yvon, ULTIMA 2).
EXPERIMENTAL RESULTS AND DISCUSSION
We measured absorption spectra of Bi�2SiO20:Co and Bi�2TiO20:Co in the spectral region �.�-2.2� eV (Fig. �a, Fig. 2a). It is seen that the cobalt number of the electron transitions in
structure is complicated and its shape does not give information about the Co2+ and Co3+ ion. Therefore, the calculation of the first derivative of the absorption coefficient gives information about the number of the electron transitions in the investigated Co complexes (Fig. �b, Fig. 2b). The exact energetic position of the electron transitions in the Co ion is determined by calculation of the second derivative of the absorption coefficient (Fig. �c, Fig. 2c).
In this section we describe our crystal-field model for the Co2+ center in Bi�2SiO20. This model includes a full treatment of the C3v crystal field which acts upon the Co2+ ion. The Co2+ impurity in BSO has the d� configuration, which we treat as a three-hole configuration. The crystal-field potential consists of the field of Td symmetry. This means that the tetrahedral coordination about the Co2+ ion has four oxygen ions. The tetrahedral crystal field splits the one-hole d states so that the
1.4 1.5 1.6 1.7 1.8 1.9 2.0 2.1 2.2
6
7
8
9
10Bi12SiO20:Co
[c
m-1]
E [eV]1.5 1.6 1.7 1.8 1.9 2.0 2.1 2.2
0
4
8
12
16
20
24
2.06 eV
1.92 eV
1.75 eVBi12SiO20:Co
d/d
E
E [eV]1.5 1.6 1.7 1.8 1.9 2.0 2.1 2.2
-400
-300
-200
-100
0
100
200
300 Bi12SiO20:Co
2.1 eV
1.94 eV
1.78 eV
d2 /d
E2
E [eV]
Figure � a) Absorption spectrum of Bi�2SiO20:Co2+ in the spectral region �.�-2.2 eV; b) first derivative of absorption coefficient; c) second derivative of absorption coefficient.
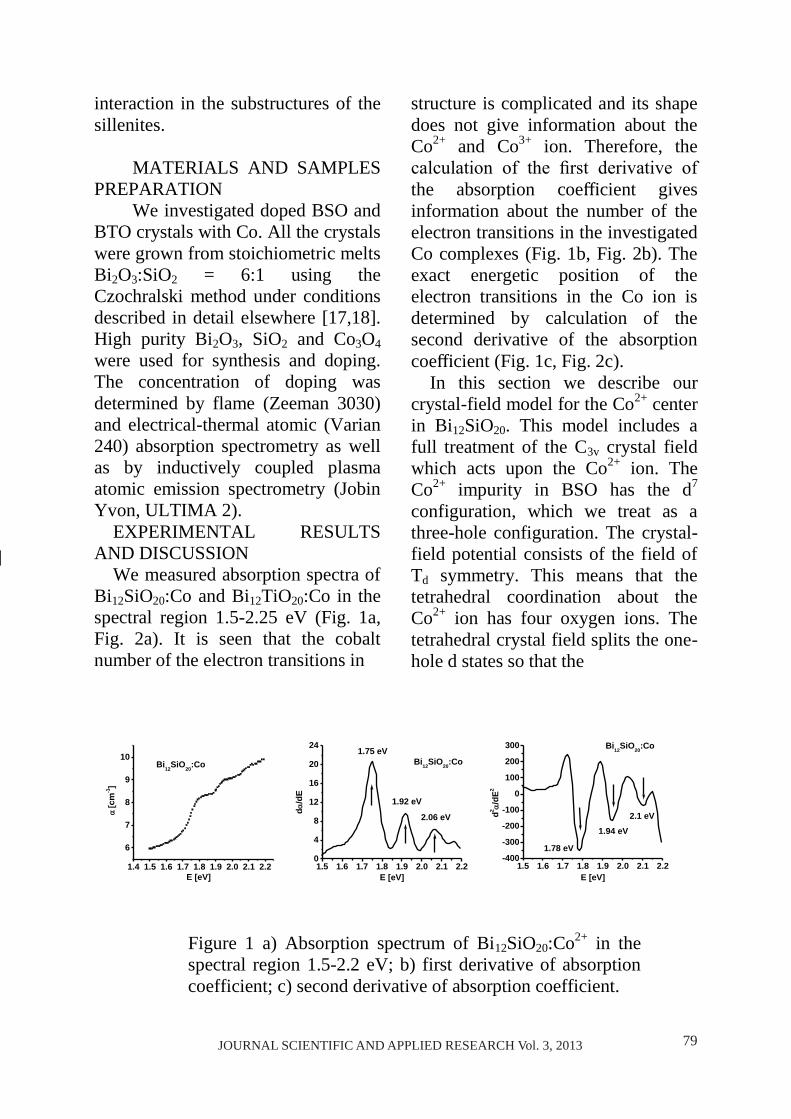
��JOURNAL SCIENTIFIC AND APPLIED RESEARCH Vol. 3, 20�3JOURNAL SCIENTIFIC AND APPLIED RESEARCH Vol. 3, 20�3
Original Contribution
Journal scientific and applied research, vol. 3, 20�3 Association Scientific and Applied Research
International Journal ISSN �3��-�2��
THE COMPLEXES OF Co2+ IN Bi12SiO20 AND Co3+ IN Bi12TiO20
Petya Petkova, Petko Vasilev and Genoveva Nedelcheva
Shumen University “Konstantin Preslavsky”, 115 Universitetska street, 9712 Shumen, e-mail: [email protected]
ABSTRACT: We have investigated the absorption of the Co doped Bi12MO20 (M = Si, Ti) in the spectral
region 12 092–18 149 cm-1. The observed absorption band is due to the Co-impurity in the visible spectral region. This absorption band does not contain information about the exact energy position of the Co levels. Therefore, we have calculated the second derivative of absorption. It is established that Co2+ ions are surrounded by distorted tetrahedral coordination in Bi12SiO20 (BSO). The energy level structure of the Co2+ ion in BSO and this of Co3+ ion in Bi12TiO20 are also presented. We have calculated the crystal field parameter Dq and the Racah parameters B and C for Co2+ ion.
KEY WORDS: absorption spectrum, 3d transition metals, Jahn-Teller effect, spin-orbit interaction
INTRODUCTION Sillenite-type Bi�2SiO20 (BSO)
pure and doped single crystals are widely used in optical devices, spatial-time light modulators and as holographic media [�,2]. BSO are cubic crystals, I23 space group symmetry, built up of Si-O� tetrahedrons and deformed Bi-On polyhedrons [3], defined by some authors as Bi-On (n = �) - octahedrons [�] or as Bi-O-pseudo-octahedrons [�]. The chemical bonds Bi-O and Si-O in BSO are covalent [3]. After reported literature data most of doping ions in BSO are placed at metal position in Si-O�-tetrahedron [�]. For Ru, Cu and Mn - ions there are data for occupation of both metal positions in tetrahedron (replacing Si) and in pseudooctahedron (replacing
Bi) [�,�,�]. Many studies on the optical absorption coefficient of doped with Al, P, Cr, Mn, Fe, Co, Ni, Cu, Se and Ru sillenites in the VIS spectral region have been reported so far and the effect of doping were discussed mainly in respect to possible oxidation states of doping ions, position of allowed electron transitions in the �.� – 2.2 eV region and the dependence of corresponding absorption coefficient on dopant concentration [�,�,�-��].
Nevertheless, until now there are no systematic complex investigations on doping effects on impurity levels in the band gap (�.�–2.2 eV). We attempt to present the effect of doping as well as to specify some of main parameters of the crystal field and the spin-orbit
JOURNAL SCIENTIFIC AND APPLIED RESEARCH Vol. 3, 20�3
interaction in the substructures of the sillenites.
MATERIALS AND SAMPLES
PREPARATION We investigated doped BSO and
BTO crystals with Co. All the crystals were grown from stoichiometric melts Bi2O3:SiO2 = �:� using the Czochralski method under conditions described in detail elsewhere [��,��]. High purity Bi2O3, SiO2 and Co3O� were used for synthesis and doping. The concentration of doping was determined by flame (Zeeman 3030) and electrical-thermal atomic (Varian 2�0) absorption spectrometry as well as by inductively coupled plasma atomic emission spectrometry (Jobin Yvon, ULTIMA 2).
EXPERIMENTAL RESULTS AND DISCUSSION
We measured absorption spectra of Bi�2SiO20:Co and Bi�2TiO20:Co in the spectral region �.�-2.2� eV (Fig. �a, Fig. 2a). It is seen that the cobalt number of the electron transitions in
structure is complicated and its shape does not give information about the Co2+ and Co3+ ion. Therefore, the calculation of the first derivative of the absorption coefficient gives information about the number of the electron transitions in the investigated Co complexes (Fig. �b, Fig. 2b). The exact energetic position of the electron transitions in the Co ion is determined by calculation of the second derivative of the absorption coefficient (Fig. �c, Fig. 2c).
In this section we describe our crystal-field model for the Co2+ center in Bi�2SiO20. This model includes a full treatment of the C3v crystal field which acts upon the Co2+ ion. The Co2+ impurity in BSO has the d� configuration, which we treat as a three-hole configuration. The crystal-field potential consists of the field of Td symmetry. This means that the tetrahedral coordination about the Co2+ ion has four oxygen ions. The tetrahedral crystal field splits the one-hole d states so that the
1.4 1.5 1.6 1.7 1.8 1.9 2.0 2.1 2.2
6
7
8
9
10Bi12SiO20:Co
[c
m-1]
E [eV]1.5 1.6 1.7 1.8 1.9 2.0 2.1 2.2
0
4
8
12
16
20
24
2.06 eV
1.92 eV
1.75 eVBi12SiO20:Co
d/d
E
E [eV]1.5 1.6 1.7 1.8 1.9 2.0 2.1 2.2
-400
-300
-200
-100
0
100
200
300 Bi12SiO20:Co
2.1 eV
1.94 eV
1.78 eV
d2 /d
E2
E [eV]
Figure � a) Absorption spectrum of Bi�2SiO20:Co2+ in the spectral region �.�-2.2 eV; b) first derivative of absorption coefficient; c) second derivative of absorption coefficient.
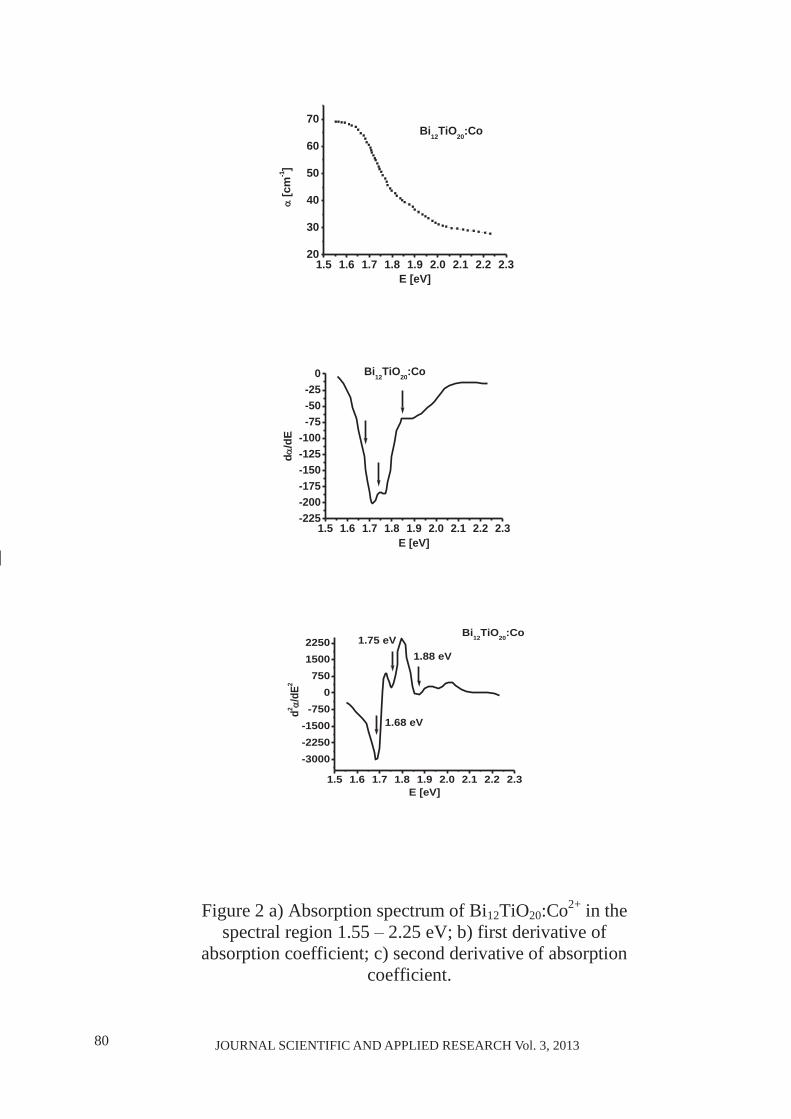
�0 JOURNAL SCIENTIFIC AND APPLIED RESEARCH Vol. 3, 20�3JOURNAL SCIENTIFIC AND APPLIED RESEARCH Vol. 3, 20�3
1.5 1.6 1.7 1.8 1.9 2.0 2.1 2.2 2.320
30
40
50
60
70Bi12TiO20:Co
[c
m-1]
E [eV]
1.5 1.6 1.7 1.8 1.9 2.0 2.1 2.2 2.3-225-200-175-150-125-100-75-50-25
0 Bi12TiO20:Co
d/d
E
E [eV]
1.5 1.6 1.7 1.8 1.9 2.0 2.1 2.2 2.3
-3000-2250-1500-750
0750
15002250
1.68 eV
1.75 eV1.88 eV
Bi12TiO20:Co
d2 /d
E2
E [eV]
Figure 2 a) Absorption spectrum of Bi�2TiO20:Co2+ in the spectral region �.�� – 2.2� eV; b) first derivative of
absorption coefficient; c) second derivative of absorption coefficient.
JOURNAL SCIENTIFIC AND APPLIED RESEARCH Vol. 3, 20�3
Figure 3 Energetic diagram of Co2+ ion in C3v symmetry.
Figure � Energetic diagram of Co3+ ion in Oh symmetry.
t2-symmetry holes are lower in energy than the e-symmetry holes by an amount �0Dq. The partial removal of the fivefold degeneracy of the d states splits the �F term into three
manifolds: �A2, �T2 and �T�(�F). The �P term spans the manifold �T�(�P). These splittings are shown in Fig. 3. The Jahn-Teller effect manifests as distortion of the tetrahedron and the
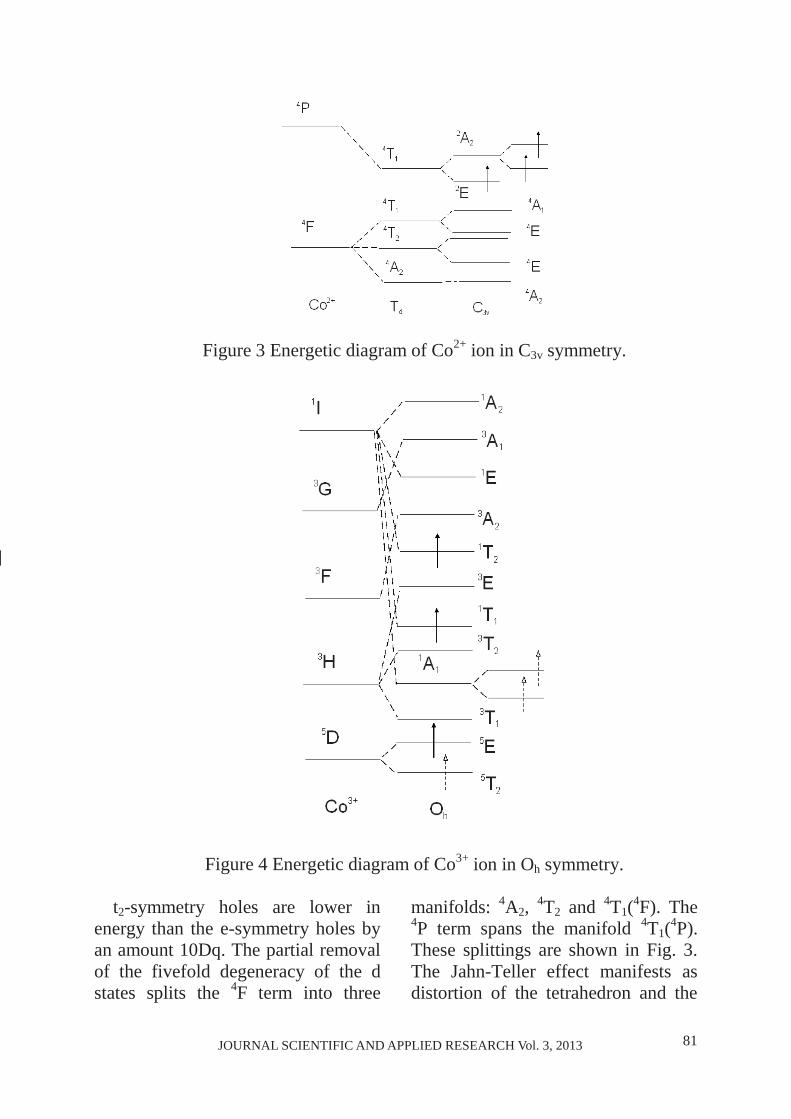
��JOURNAL SCIENTIFIC AND APPLIED RESEARCH Vol. 3, 20�3JOURNAL SCIENTIFIC AND APPLIED RESEARCH Vol. 3, 20�3
1.5 1.6 1.7 1.8 1.9 2.0 2.1 2.2 2.320
30
40
50
60
70Bi12TiO20:Co
[c
m-1]
E [eV]
1.5 1.6 1.7 1.8 1.9 2.0 2.1 2.2 2.3-225-200-175-150-125-100-75-50-25
0 Bi12TiO20:Co
d/d
E
E [eV]
1.5 1.6 1.7 1.8 1.9 2.0 2.1 2.2 2.3
-3000-2250-1500-750
0750
15002250
1.68 eV
1.75 eV1.88 eV
Bi12TiO20:Co
d2 /d
E2
E [eV]
Figure 2 a) Absorption spectrum of Bi�2TiO20:Co2+ in the spectral region �.�� – 2.2� eV; b) first derivative of
absorption coefficient; c) second derivative of absorption coefficient.
JOURNAL SCIENTIFIC AND APPLIED RESEARCH Vol. 3, 20�3
Figure 3 Energetic diagram of Co2+ ion in C3v symmetry.
Figure � Energetic diagram of Co3+ ion in Oh symmetry.
t2-symmetry holes are lower in energy than the e-symmetry holes by an amount �0Dq. The partial removal of the fivefold degeneracy of the d states splits the �F term into three
manifolds: �A2, �T2 and �T�(�F). The �P term spans the manifold �T�(�P). These splittings are shown in Fig. 3. The Jahn-Teller effect manifests as distortion of the tetrahedron and the
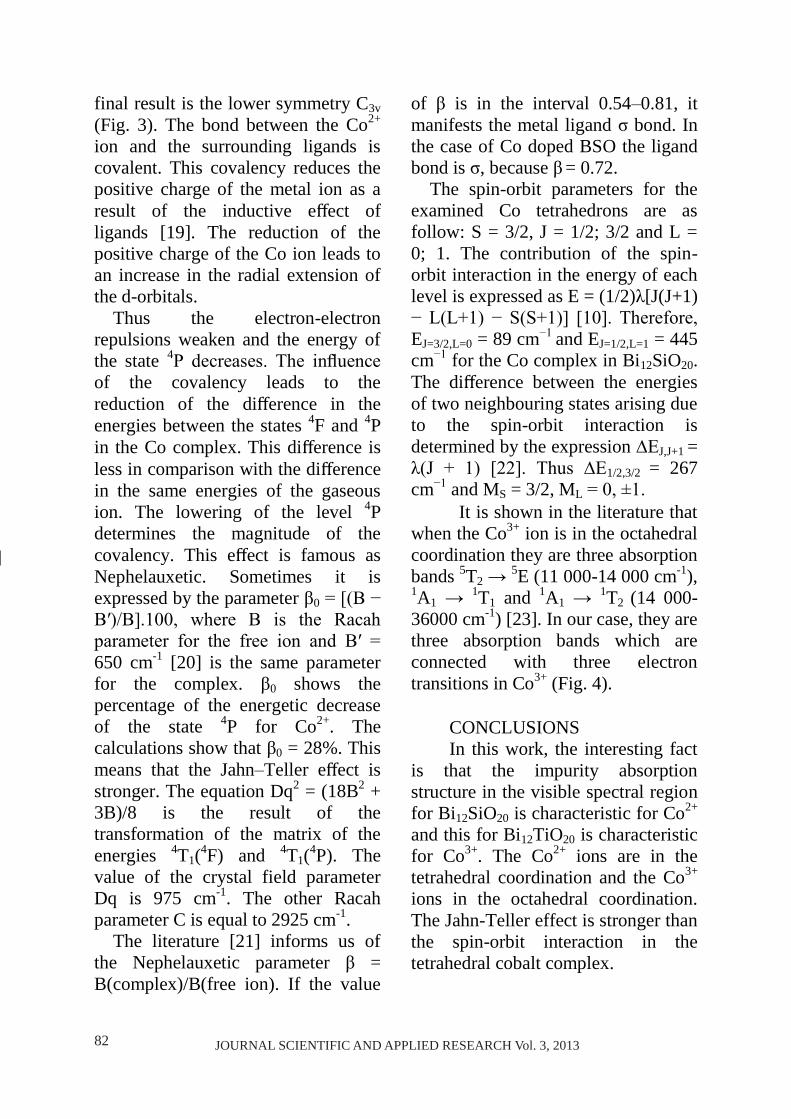
�2 JOURNAL SCIENTIFIC AND APPLIED RESEARCH Vol. 3, 20�3JOURNAL SCIENTIFIC AND APPLIED RESEARCH Vol. 3, 20�3
final result is the lower symmetry C3v (Fig. 3). The bond between the Co2+ ion and the surrounding ligands is covalent. This covalency reduces the positive charge of the metal ion as a result of the inductive effect of ligands [��]. The reduction of the positive charge of the Co ion leads to an increase in the radial extension of the d-orbitals.
Thus the electron-electron repulsions weaken and the energy of the state �P decreases. The influence of the covalency leads to the reduction of the difference in the energies between the states �F and �P in the Co complex. This difference is less in comparison with the difference in the same energies of the gaseous ion. The lowering of the level �P determines the magnitude of the covalency. This effect is famous as Nephelauxetic. Sometimes it is expressed by the parameter β0 = [(B − B′)/B].100, where B is the Racah parameter for the free ion and B′ = ��0 cm-� [20] is the same parameter for the complex. β0 shows the percentage of the energetic decrease of the state �P for Co2+. The calculations show that β0 = 2�%. This means that the Jahn–Teller effect is stronger. The equation Dq2 = (��B2 + 3B)/� is the result of the transformation of the matrix of the energies �T�(�F) and �T�(�P). The value of the crystal field parameter Dq is ��� cm-�. The other Racah parameter C is equal to 2�2� cm-�.
The literature [2�] informs us of the Nephelauxetic parameter β = B(complex)/B(free ion). If the value
of β is in the interval 0.��–0.��, it manifests the metal ligand σ bond. In the case of Co doped BSO the ligand bond is σ, because β = 0.�2.
The spin-orbit parameters for the examined Co tetrahedrons are as follow: S = 3/2, J = �/2; 3/2 and L = 0; �. The contribution of the spin-orbit interaction in the energy of each level is expressed as E = (�/2)λ[J(J+�) − L(L+1) − S(S+1)] [10]. Therefore, EJ=3/2,L=0 = �� cm−1 and EJ=�/2,L=� = ��� cm−1 for the Co complex in Bi�2SiO20. The difference between the energies of two neighbouring states arising due to the spin-orbit interaction is determined by the expression ∆EJ,J+� = λ(J + 1) [22]. Thus ∆E�/2,3/2 = 2�� cm−1 and MS = 3/2, ML = 0, ±1.
It is shown in the literature that when the Co3+ ion is in the octahedral coordination they are three absorption bands �T2 → �E (�� 000-�� 000 cm-�), �A� → �T� and �A� → �T2 (�� 000-3�000 cm-�) [23]. In our case, they are three absorption bands which are connected with three electron transitions in Co3+ (Fig. �).
CONCLUSIONS In this work, the interesting fact
is that the impurity absorption structure in the visible spectral region for Bi�2SiO20 is characteristic for Co2+ and this for Bi�2TiO20 is characteristic for Co3+. The Co2+ ions are in the tetrahedral coordination and the Co3+ ions in the octahedral coordination. The Jahn-Teller effect is stronger than the spin-orbit interaction in the tetrahedral cobalt complex.
JOURNAL SCIENTIFIC AND APPLIED RESEARCH Vol. 3, 20�3
ACKNOWLEDGMENTS Partial financial support by
project of Shumen University (20�3) is gratefully acknowledged.
REFERENCES [�] Gunter P and Huignard J
200� Photorefractive materials and their applications. Part �, New York, Springer Science+Buisness Media
[2] Gunter P and Huignard J 200� Photorefractive materials and their applications. Part 2 and 3, New York, Springer Science+Buisness Media
[3] Mihailova B, Gospodinov M and Konstantinov L ���� J. Phys. Chem. Solids �0 ��2�
[�] Marinova V, Veleva M and Petrova D 200� JAP �� 2���
[�] Ramaz F, Rakitina L, Gospodinov M and Briat B 200� Opt. Mat. 2� ����
[�] Kargin Y, Burkov V, Maryin A and Egorysheva A 200� Alphabet, Moscow ��0 (in Russian)
[�] Marquet H, Tapiero M, Merle J, Zielinger J and Launay J ���� Opt. Mater. �� �3
[�] Nechitailov A, Krasinkova M, Mokrushina E, Petrov A, Kartenko N and Prokofiev V 2000
JNORG 3� �20 [�] Egorisheva A, Burkov V,
Kargin Y, Vasiliev A, Volkov V and Skorikov V 200� JNORG 3� ���
[�0] Egorisheva A 200� JNORG �0 �0�
[��] Marinova V, Lin S, Hsieh M, Liu R and Hsu K 200� Photorefractive Matt, Effects, and Devices PR’09 P�-3�
[�2] Egorisheva A, Volkov V, Coya C and Zaldo C ���� Phys. Stat. Sol. B 20� 2�3
[�3] Potera P and Pircuch A 200� Physica B 3�� 3�2
[��] Kovacs L, Capelli R and Gospodinov M 200� Vib. Spec. �� ��
[��] Zmija J and Malchowski M 200� Arh. Mat. Sci. Eng. 33 �0�
[��] Ahmad I, Marinova V and Goovaerts E 200� Photorefractive Matt, Effects, and Devices PR’09 P�-3�
[��] Gospodinov M and Doshkova D ���� Cryst. Res. Technol. 2� �03
[��] Petrova D, Gospodinov M and Sveshtarov P ���� Mat. Res. Bull. 30 �20�
[��] Drago R ���� Physical Methods in Chemistry, University of Illinois, Urbana
[20] Egorisheva A Burkov V Kargin Yu Volkov V ���� Neorg. Mater. 3� �0��-�0�3
[2�] Chandra S, Gupta L 200� Spectrochimica Acta Part A �2 ��2�–��30
[22] Ballhausen C J ���� Introduction to Ligand Field Theory, New York, Mc Graw – Hill Book Company, Inc.
[23] Burkov V Egorisheva A Kargin Yu 2003 Zhurnal Neorg. Himii �� �20-�3�
�3JOURNAL SCIENTIFIC AND APPLIED RESEARCH Vol. 3, 20�3JOURNAL SCIENTIFIC AND APPLIED RESEARCH Vol. 3, 20�3
final result is the lower symmetry C3v (Fig. 3). The bond between the Co2+ ion and the surrounding ligands is covalent. This covalency reduces the positive charge of the metal ion as a result of the inductive effect of ligands [��]. The reduction of the positive charge of the Co ion leads to an increase in the radial extension of the d-orbitals.
Thus the electron-electron repulsions weaken and the energy of the state �P decreases. The influence of the covalency leads to the reduction of the difference in the energies between the states �F and �P in the Co complex. This difference is less in comparison with the difference in the same energies of the gaseous ion. The lowering of the level �P determines the magnitude of the covalency. This effect is famous as Nephelauxetic. Sometimes it is expressed by the parameter β0 = [(B − B′)/B].100, where B is the Racah parameter for the free ion and B′ = ��0 cm-� [20] is the same parameter for the complex. β0 shows the percentage of the energetic decrease of the state �P for Co2+. The calculations show that β0 = 2�%. This means that the Jahn–Teller effect is stronger. The equation Dq2 = (��B2 + 3B)/� is the result of the transformation of the matrix of the energies �T�(�F) and �T�(�P). The value of the crystal field parameter Dq is ��� cm-�. The other Racah parameter C is equal to 2�2� cm-�.
The literature [2�] informs us of the Nephelauxetic parameter β = B(complex)/B(free ion). If the value
of β is in the interval 0.��–0.��, it manifests the metal ligand σ bond. In the case of Co doped BSO the ligand bond is σ, because β = 0.�2.
The spin-orbit parameters for the examined Co tetrahedrons are as follow: S = 3/2, J = �/2; 3/2 and L = 0; �. The contribution of the spin-orbit interaction in the energy of each level is expressed as E = (�/2)λ[J(J+�) − L(L+1) − S(S+1)] [10]. Therefore, EJ=3/2,L=0 = �� cm−1 and EJ=�/2,L=� = ��� cm−1 for the Co complex in Bi�2SiO20. The difference between the energies of two neighbouring states arising due to the spin-orbit interaction is determined by the expression ∆EJ,J+� = λ(J + 1) [22]. Thus ∆E�/2,3/2 = 2�� cm−1 and MS = 3/2, ML = 0, ±1.
It is shown in the literature that when the Co3+ ion is in the octahedral coordination they are three absorption bands �T2 → �E (�� 000-�� 000 cm-�), �A� → �T� and �A� → �T2 (�� 000-3�000 cm-�) [23]. In our case, they are three absorption bands which are connected with three electron transitions in Co3+ (Fig. �).
CONCLUSIONS In this work, the interesting fact
is that the impurity absorption structure in the visible spectral region for Bi�2SiO20 is characteristic for Co2+ and this for Bi�2TiO20 is characteristic for Co3+. The Co2+ ions are in the tetrahedral coordination and the Co3+ ions in the octahedral coordination. The Jahn-Teller effect is stronger than the spin-orbit interaction in the tetrahedral cobalt complex.
JOURNAL SCIENTIFIC AND APPLIED RESEARCH Vol. 3, 20�3
ACKNOWLEDGMENTS Partial financial support by
project of Shumen University (20�3) is gratefully acknowledged.
REFERENCES [�] Gunter P and Huignard J
200� Photorefractive materials and their applications. Part �, New York, Springer Science+Buisness Media
[2] Gunter P and Huignard J 200� Photorefractive materials and their applications. Part 2 and 3, New York, Springer Science+Buisness Media
[3] Mihailova B, Gospodinov M and Konstantinov L ���� J. Phys. Chem. Solids �0 ��2�
[�] Marinova V, Veleva M and Petrova D 200� JAP �� 2���
[�] Ramaz F, Rakitina L, Gospodinov M and Briat B 200� Opt. Mat. 2� ����
[�] Kargin Y, Burkov V, Maryin A and Egorysheva A 200� Alphabet, Moscow ��0 (in Russian)
[�] Marquet H, Tapiero M, Merle J, Zielinger J and Launay J ���� Opt. Mater. �� �3
[�] Nechitailov A, Krasinkova M, Mokrushina E, Petrov A, Kartenko N and Prokofiev V 2000
JNORG 3� �20 [�] Egorisheva A, Burkov V,
Kargin Y, Vasiliev A, Volkov V and Skorikov V 200� JNORG 3� ���
[�0] Egorisheva A 200� JNORG �0 �0�
[��] Marinova V, Lin S, Hsieh M, Liu R and Hsu K 200� Photorefractive Matt, Effects, and Devices PR’09 P�-3�
[�2] Egorisheva A, Volkov V, Coya C and Zaldo C ���� Phys. Stat. Sol. B 20� 2�3
[�3] Potera P and Pircuch A 200� Physica B 3�� 3�2
[��] Kovacs L, Capelli R and Gospodinov M 200� Vib. Spec. �� ��
[��] Zmija J and Malchowski M 200� Arh. Mat. Sci. Eng. 33 �0�
[��] Ahmad I, Marinova V and Goovaerts E 200� Photorefractive Matt, Effects, and Devices PR’09 P�-3�
[��] Gospodinov M and Doshkova D ���� Cryst. Res. Technol. 2� �03
[��] Petrova D, Gospodinov M and Sveshtarov P ���� Mat. Res. Bull. 30 �20�
[��] Drago R ���� Physical Methods in Chemistry, University of Illinois, Urbana
[20] Egorisheva A Burkov V Kargin Yu Volkov V ���� Neorg. Mater. 3� �0��-�0�3
[2�] Chandra S, Gupta L 200� Spectrochimica Acta Part A �2 ��2�–��30
[22] Ballhausen C J ���� Introduction to Ligand Field Theory, New York, Mc Graw – Hill Book Company, Inc.
[23] Burkov V Egorisheva A Kargin Yu 2003 Zhurnal Neorg. Himii �� �20-�3�
�� JOURNAL SCIENTIFIC AND APPLIED RESEARCH Vol. 3, 20�3JOURNAL SCIENTIFIC AND APPLIED RESEARCH Vol. 3, 20�3
Original Contribution
Journal scientific and applied research, vol. 3, 20�3 Association Scientific and Applied Research
International Journal ISSN �3��-�2��
TETRAHEDRAL AND OCTAHEDRAL COMPLEXES OF MN2+ IN THE AQUEOUS SOLUTIONS OF MNCL2.4H2O
Petya Petkova, Vesselin Nedkov, Jordanka Tacheva, Petko Vasilev, Dian Hristov, Genoveva
Nedelcheva, Ivaylo Dimitrov, Atanas Ivanov and Ibrahim Ahmed
Shumen University “Konstantin Preslavsky”, 115 Universitetska street, 9712 Shumen, e-mail: [email protected]
ABSTRACT
In this work, the absorption spectra of the aqueous solutions of MnCl2.4H2O are investigated. The concentration of these solutions is in the interval 30-38 %. The experiment is conducted at the room temperature in the spectral region 350 – 650 nm. The asymmetric vibration values and the strength of the oscillator are calculated for all investigated aqueous solutions.
KEY WORDS: tetrahedral complexes, Racah’s parameters, exchange integrals, Jahn-Teller effect, spin-orbit interaction
INTRODUCTION The aim of this work is
connected with the determination of the optical parameters of the complex ions where Mn2+ cation is in the center. We are investigated the aqueous solution of MnCl2.4H2O with different concentrations. Our experiment will be usefull for the clarification of the growth conditions of the crystals MgSO3.6H2O from aqueous solution [1, 2]. These materials have application in the nonlinear optics.
EXPERIMENT, RESULTS
AND DISCUSSION The solutions are investigated
with spectrophotometer “BOECO”, model S-2�, in the cuvette with
thickness b = 1 cm. The absorbance А is calculated by the formula A(λ) = ln(I0/I) = a(λ)сb, where I0 is the intensity of the incident light, I is the intensity of the passed light, b is the thickness of the cuvette, a(λ) is the absorption, which characterizes the interaction of the substance with the radiation (i.e. а(λ) determines the probability of the transition) and с is the concentration of the solutions. The first derivative of the absorbance to the energy of the photons is calculated in the spectral region �00-�00 nm. The derivative [dА/dλ] determines only the number of the electron transitions in the cation Mn2+ and it not informs us about the exact value of the energy of these transitions. This is the reason for the calculation of the
JOURNAL SCIENTIFIC AND APPLIED RESEARCH Vol. 3, 20�3
second derivative of the absorbance [d2А/dλ2].
It is known that the complex ions [Mn(H2O)�]2+ and [MnCl�]2- are
in the aqueous solution of MnCl2.�H2O [3]. The other authors made investigations of the aqueous solutions with very small concentration of the salt. Thus it appears the influence of one or the other complex. This fact was very interesting for us and we decided to check what is happen in the same solutions with big concentration? We established the simultaneous expression of both complexes in the visible region.
The absorption spectra of the complex ions [Mn(H2O)�]2+ and [MnCl�]2- are shown on fig. �A. The first derivative of the absorbance to wave length (fig. �B) and second derivative of А(λ) (fig. 1C) are presented in the spectral region �00-�00 nm for the aqueous solutions with concentration respectively 30%, 3�% and 3�%. It is shown (fig. �C) that the solutions with the concentration 30%, 3�% and 3�% combine one electron transition in the octahedral complex of Mn2+ and two electron transitions in the tetrahedral complex of the cation Mn2+.
400 450 5000.060.080.100.120.140.16
MnCl42- MnCl4
2-
[Mn(H2O)6]2+
[c
m-1]
[nm] 400 450 5000.080.100.120.140.160.180.200.22
MnCl42-
MnCl42-
[Mn(H2O)6]2+
[c
m-1]
[nm]400 450 500
0.080.120.160.200.24
MnCl42-
MnCl42-
[Mn(H2O)6]2+
[c
m-1]
[nm]
�A
390 420 450 480-0.006-0.004-0.0020.0000.0020.0040.006
MnCl42-
MnCl42-
[Mn(H2O)6]2+
d/d
[nm]390 420 450 480
-0.008-0.0040.0000.0040.008
MnCl42-
MnCl42-
[Mn(H2O)6]2+
d/d
[nm]390 420 450 480
-0.012-0.008-0.0040.0000.0040.0080.012
MnCl42-
MnCl42-
[Mn(H2O)6]2+
d/d
[nm]
�B
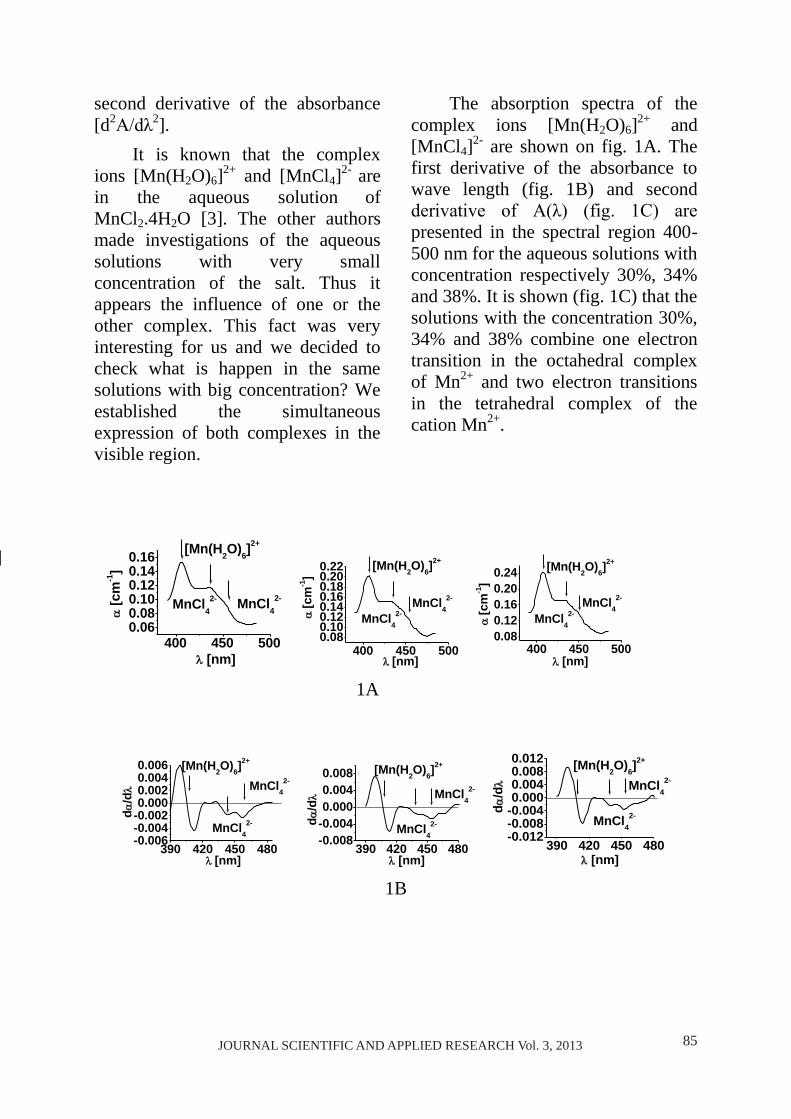
��JOURNAL SCIENTIFIC AND APPLIED RESEARCH Vol. 3, 20�3JOURNAL SCIENTIFIC AND APPLIED RESEARCH Vol. 3, 20�3
Original Contribution
Journal scientific and applied research, vol. 3, 20�3 Association Scientific and Applied Research
International Journal ISSN �3��-�2��
TETRAHEDRAL AND OCTAHEDRAL COMPLEXES OF MN2+ IN THE AQUEOUS SOLUTIONS OF MNCL2.4H2O
Petya Petkova, Vesselin Nedkov, Jordanka Tacheva, Petko Vasilev, Dian Hristov, Genoveva
Nedelcheva, Ivaylo Dimitrov, Atanas Ivanov and Ibrahim Ahmed
Shumen University “Konstantin Preslavsky”, 115 Universitetska street, 9712 Shumen, e-mail: [email protected]
ABSTRACT
In this work, the absorption spectra of the aqueous solutions of MnCl2.4H2O are investigated. The concentration of these solutions is in the interval 30-38 %. The experiment is conducted at the room temperature in the spectral region 350 – 650 nm. The asymmetric vibration values and the strength of the oscillator are calculated for all investigated aqueous solutions.
KEY WORDS: tetrahedral complexes, Racah’s parameters, exchange integrals, Jahn-Teller effect, spin-orbit interaction
INTRODUCTION The aim of this work is
connected with the determination of the optical parameters of the complex ions where Mn2+ cation is in the center. We are investigated the aqueous solution of MnCl2.4H2O with different concentrations. Our experiment will be usefull for the clarification of the growth conditions of the crystals MgSO3.6H2O from aqueous solution [1, 2]. These materials have application in the nonlinear optics.
EXPERIMENT, RESULTS
AND DISCUSSION The solutions are investigated
with spectrophotometer “BOECO”, model S-2�, in the cuvette with
thickness b = 1 cm. The absorbance А is calculated by the formula A(λ) = ln(I0/I) = a(λ)сb, where I0 is the intensity of the incident light, I is the intensity of the passed light, b is the thickness of the cuvette, a(λ) is the absorption, which characterizes the interaction of the substance with the radiation (i.e. а(λ) determines the probability of the transition) and с is the concentration of the solutions. The first derivative of the absorbance to the energy of the photons is calculated in the spectral region �00-�00 nm. The derivative [dА/dλ] determines only the number of the electron transitions in the cation Mn2+ and it not informs us about the exact value of the energy of these transitions. This is the reason for the calculation of the
JOURNAL SCIENTIFIC AND APPLIED RESEARCH Vol. 3, 20�3
second derivative of the absorbance [d2А/dλ2].
It is known that the complex ions [Mn(H2O)�]2+ and [MnCl�]2- are
in the aqueous solution of MnCl2.�H2O [3]. The other authors made investigations of the aqueous solutions with very small concentration of the salt. Thus it appears the influence of one or the other complex. This fact was very interesting for us and we decided to check what is happen in the same solutions with big concentration? We established the simultaneous expression of both complexes in the visible region.
The absorption spectra of the complex ions [Mn(H2O)�]2+ and [MnCl�]2- are shown on fig. �A. The first derivative of the absorbance to wave length (fig. �B) and second derivative of А(λ) (fig. 1C) are presented in the spectral region �00-�00 nm for the aqueous solutions with concentration respectively 30%, 3�% and 3�%. It is shown (fig. �C) that the solutions with the concentration 30%, 3�% and 3�% combine one electron transition in the octahedral complex of Mn2+ and two electron transitions in the tetrahedral complex of the cation Mn2+.
400 450 5000.060.080.100.120.140.16
MnCl42- MnCl4
2-
[Mn(H2O)6]2+
[c
m-1]
[nm] 400 450 5000.080.100.120.140.160.180.200.22
MnCl42-
MnCl42-
[Mn(H2O)6]2+
[c
m-1]
[nm]400 450 500
0.080.120.160.200.24
MnCl42-
MnCl42-
[Mn(H2O)6]2+
[c
m-1]
[nm]
�A
390 420 450 480-0.006-0.004-0.0020.0000.0020.0040.006
MnCl42-
MnCl42-
[Mn(H2O)6]2+
d/d
[nm]390 420 450 480
-0.008-0.0040.0000.0040.008
MnCl42-
MnCl42-
[Mn(H2O)6]2+
d/d
[nm]390 420 450 480
-0.012-0.008-0.0040.0000.0040.0080.012
MnCl42-
MnCl42-
[Mn(H2O)6]2+
d/d
[nm]
�B
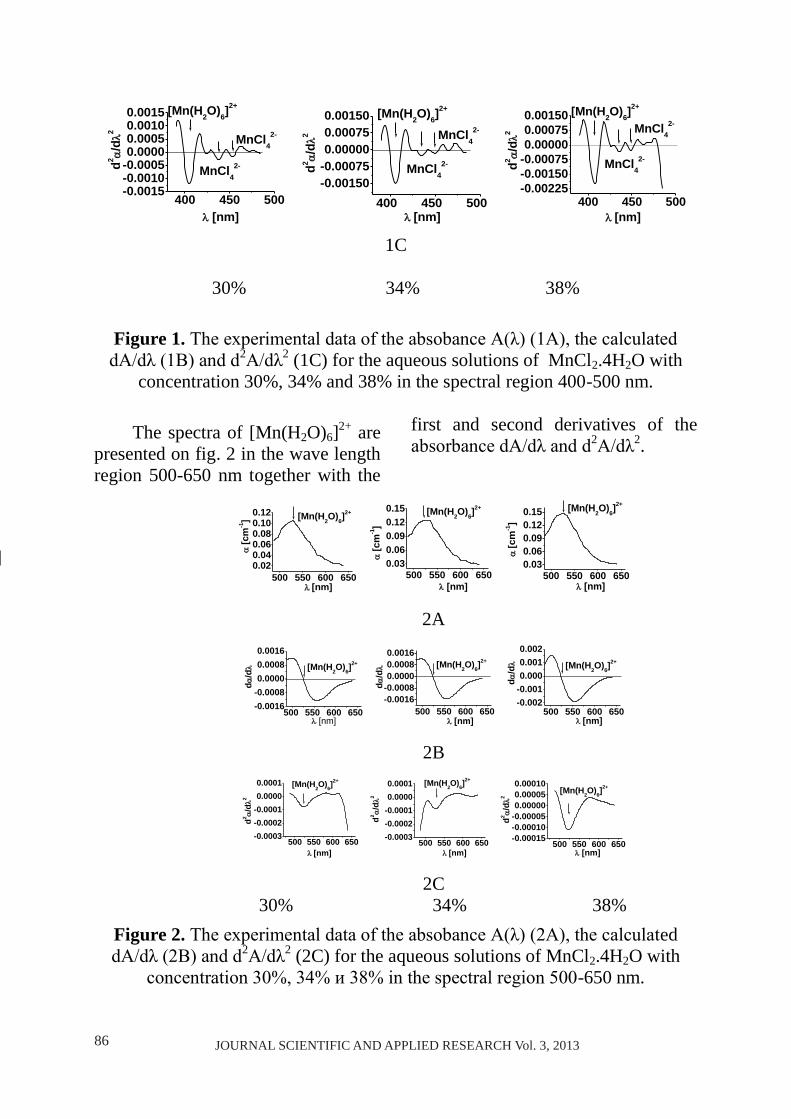
�� JOURNAL SCIENTIFIC AND APPLIED RESEARCH Vol. 3, 20�3JOURNAL SCIENTIFIC AND APPLIED RESEARCH Vol. 3, 20�3
400 450 500-0.0015-0.0010-0.00050.00000.00050.00100.0015
MnCl42-
MnCl42-
[Mn(H2O)6]2+
d2 /d
2
[nm]400 450 500
-0.00150-0.000750.000000.000750.00150
MnCl42-
MnCl42-
[Mn(H2O)6]2+
d2 /d
2
[nm]400 450 500
-0.00225-0.00150-0.000750.000000.000750.00150
MnCl42-
MnCl42-
[Mn(H2O)6]2+
d2 /d
2
[nm]
�C
30% 3�% 3�%
Figure 1. The experimental data of the absobance A(λ) (1A), the calculated dA/dλ (1B) and d2A/dλ2 (�C) for the aqueous solutions of MnCl2.�H2O with
concentration 30%, 3�% and 3�% in the spectral region �00-�00 nm.
The spectra of [Mn(H2O)�]2+ are presented on fig. 2 in the wave length region �00-��0 nm together with the
first and second derivatives of the absorbance dA/dλ and d2A/dλ2.
500 550 600 6500.020.040.060.080.100.12 [Mn(H2O)6]
2+
[c
m-1]
[nm]500 550 600 650
0.030.060.090.120.15 [Mn(H2O)6]
2+
[c
m-1]
[nm]500 550 600 650
0.030.060.090.120.15 [Mn(H2O)6]
2+
[cm
-1]
[nm] 2A
500 550 600 650-0.0016-0.00080.00000.00080.0016
[Mn(H2O)6]2+
d/d
[nm]500 550 600 650
-0.0016-0.00080.00000.00080.0016
[Mn(H2O)6]2+
d/d
[nm]500 550 600 650
-0.002-0.0010.0000.0010.002
[Mn(H2O)6]2+
d/d
[nm]
2B
500 550 600 650-0.0003-0.0002-0.00010.00000.0001 [Mn(H2O)6]
2+
d2 /d
2
[nm]500 550 600 650
-0.0003-0.0002-0.00010.00000.0001 [Mn(H2O)6]
2+
d2 /d
2
[nm]500 550 600 650
-0.00015-0.00010-0.000050.000000.000050.00010
[Mn(H2O)6]2+
d2 /d
2
[nm] 2C
30% 3�% 3�% Figure 2. The experimental data of the absobance A(λ) (2A), the calculated dA/dλ (2B) and d2A/dλ2 (2C) for the aqueous solutions of MnCl2.�H2O with
concentration 30%, 34% и 38% in the spectral region 500-��0 nm.
JOURNAL SCIENTIFIC AND APPLIED RESEARCH Vol. 3, 20�3
It is shown, that the electron transition is one in the octahedral complex of Mn2+ in the same part of the visible spectral region.
The strength of the three-dimensional harmonic oscillator determines from the ratio of the real intensity and the intensity of the radiation of the electron. f = � for such “ideal electron”. The transitions of the oscillator classify by the strength f and this connects the theory with the experiment. f = � for the allowed transition; for single symmetric band (table �):
∫
, where ε() not depends on the concentration of the solutions [�]. The
next equation √
explains the connection between the oscillator strength fi and the transition moment of the impurity band Qi, where νi is the frequency of the band centre.
f0 = f/[� + exp(-θ/T)], where θ is the frequency of the total asymmetric vibration (table 3).
In our case, it is registered asymmetric vibration due to the available deformation of the aqueous solution. The deformation is consequence of the simultaneous manifestation of the Jahn-Teller effect and the spin-orbit interaction. The frequency of the vibration ω of the complexes is connected with by the equality ω=/�.�� [cm-�] (ω = 2c/, c = 3.�0� m/s).
Table 1. The strength of the oscillator f� (�00-�00 nm) and f2 (�00-�00 nm) for the aqueous solution of MnCl2.�H2O with concentration 30%, 3�% and 3�% at temperature T = 300K; The strength of the oscillator f0�
� (�00-�00 nm) and f02
2 (�00-�00 nm) for aqueous solutions of MnCl2.�H2O with concentration 30%, 3�% and 3�% at temperature T = 0K.
solution f�.�0-� f2.�0-� f0��.�0-� f0�
2.�0-� f02�.�0-� f02
2.�0-�
30% �.��� �.��� 0.��� �.0�� 0.�3� �.0�2 3�% �.3�0 �.2�� 0.��� �.2�� 0.�22 �.��� 3�% �.3�� �.2�0 0.��� �.2�� 0.�2� �.��2
Table 2. The transition moment of Mn2+ structures in the spectral regions �00-�00 nm and �00-��0 nm.
solution f�.�0-� f2.�0-� Q�.�0-�0 Q2.�0-�0
30% �.��� �.��� 2.2��� 2.���� 3�% �.3�0 �.2�� 2.3��� 2.�2�� 3�% �.3�� �.2�0 2.3��2 2.����
��JOURNAL SCIENTIFIC AND APPLIED RESEARCH Vol. 3, 20�3JOURNAL SCIENTIFIC AND APPLIED RESEARCH Vol. 3, 20�3
400 450 500-0.0015-0.0010-0.00050.00000.00050.00100.0015
MnCl42-
MnCl42-
[Mn(H2O)6]2+
d2 /d
2
[nm]400 450 500
-0.00150-0.000750.000000.000750.00150
MnCl42-
MnCl42-
[Mn(H2O)6]2+
d2 /d
2
[nm]400 450 500
-0.00225-0.00150-0.000750.000000.000750.00150
MnCl42-
MnCl42-
[Mn(H2O)6]2+
d2 /d
2
[nm]
�C
30% 3�% 3�%
Figure 1. The experimental data of the absobance A(λ) (1A), the calculated dA/dλ (1B) and d2A/dλ2 (�C) for the aqueous solutions of MnCl2.�H2O with
concentration 30%, 3�% and 3�% in the spectral region �00-�00 nm.
The spectra of [Mn(H2O)�]2+ are presented on fig. 2 in the wave length region �00-��0 nm together with the
first and second derivatives of the absorbance dA/dλ and d2A/dλ2.
500 550 600 6500.020.040.060.080.100.12 [Mn(H2O)6]
2+
[c
m-1]
[nm]500 550 600 650
0.030.060.090.120.15 [Mn(H2O)6]
2+
[c
m-1]
[nm]500 550 600 650
0.030.060.090.120.15 [Mn(H2O)6]
2+
[c
m-1]
[nm] 2A
500 550 600 650-0.0016-0.00080.00000.00080.0016
[Mn(H2O)6]2+
d/d
[nm]500 550 600 650
-0.0016-0.00080.00000.00080.0016
[Mn(H2O)6]2+
d/d
[nm]500 550 600 650
-0.002-0.0010.0000.0010.002
[Mn(H2O)6]2+
d/d
[nm]
2B
500 550 600 650-0.0003-0.0002-0.00010.00000.0001 [Mn(H2O)6]
2+
d2 /d
2
[nm]500 550 600 650
-0.0003-0.0002-0.00010.00000.0001 [Mn(H2O)6]
2+
d2 /d
2
[nm]500 550 600 650
-0.00015-0.00010-0.000050.000000.000050.00010
[Mn(H2O)6]2+
d2 /d
2
[nm] 2C
30% 3�% 3�% Figure 2. The experimental data of the absobance A(λ) (2A), the calculated dA/dλ (2B) and d2A/dλ2 (2C) for the aqueous solutions of MnCl2.�H2O with
concentration 30%, 34% и 38% in the spectral region 500-��0 nm.
JOURNAL SCIENTIFIC AND APPLIED RESEARCH Vol. 3, 20�3
It is shown, that the electron transition is one in the octahedral complex of Mn2+ in the same part of the visible spectral region.
The strength of the three-dimensional harmonic oscillator determines from the ratio of the real intensity and the intensity of the radiation of the electron. f = � for such “ideal electron”. The transitions of the oscillator classify by the strength f and this connects the theory with the experiment. f = � for the allowed transition; for single symmetric band (table �):
∫
, where ε() not depends on the concentration of the solutions [�]. The
next equation √
explains the connection between the oscillator strength fi and the transition moment of the impurity band Qi, where νi is the frequency of the band centre.
f0 = f/[� + exp(-θ/T)], where θ is the frequency of the total asymmetric vibration (table 3).
In our case, it is registered asymmetric vibration due to the available deformation of the aqueous solution. The deformation is consequence of the simultaneous manifestation of the Jahn-Teller effect and the spin-orbit interaction. The frequency of the vibration ω of the complexes is connected with by the equality ω=/�.�� [cm-�] (ω = 2c/, c = 3.�0� m/s).
Table 1. The strength of the oscillator f� (�00-�00 nm) and f2 (�00-�00 nm) for the aqueous solution of MnCl2.�H2O with concentration 30%, 3�% and 3�% at temperature T = 300K; The strength of the oscillator f0�
� (�00-�00 nm) and f02
2 (�00-�00 nm) for aqueous solutions of MnCl2.�H2O with concentration 30%, 3�% and 3�% at temperature T = 0K.
solution f�.�0-� f2.�0-� f0��.�0-� f0�
2.�0-� f02�.�0-� f02
2.�0-�
30% �.��� �.��� 0.��� �.0�� 0.�3� �.0�2 3�% �.3�0 �.2�� 0.��� �.2�� 0.�22 �.��� 3�% �.3�� �.2�0 0.��� �.2�� 0.�2� �.��2
Table 2. The transition moment of Mn2+ structures in the spectral regions �00-�00 nm and �00-��0 nm.
solution f�.�0-� f2.�0-� Q�.�0-�0 Q2.�0-�0
30% �.��� �.��� 2.2��� 2.���� 3�% �.3�0 �.2�� 2.3��� 2.�2�� 3�% �.3�� �.2�0 2.3��2 2.����
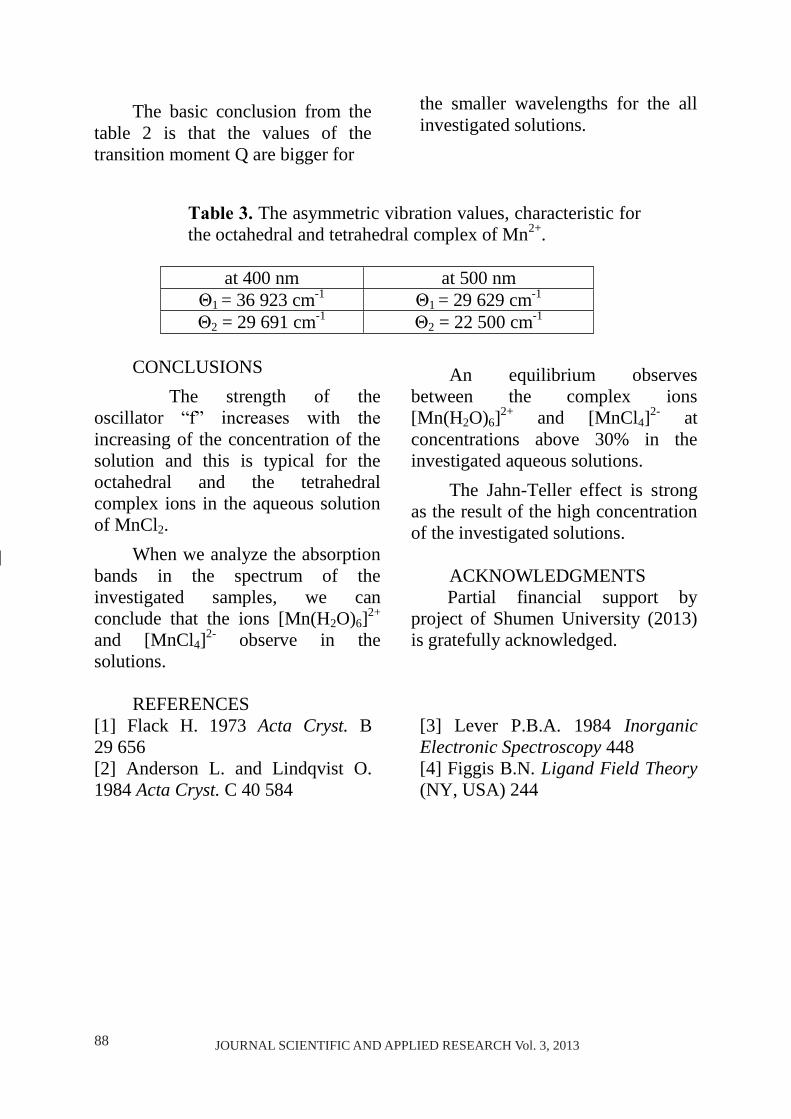
�� JOURNAL SCIENTIFIC AND APPLIED RESEARCH Vol. 3, 20�3JOURNAL SCIENTIFIC AND APPLIED RESEARCH Vol. 3, 20�3
The basic conclusion from the table 2 is that the values of the transition moment Q are bigger for
the smaller wavelengths for the all investigated solutions.
Тable 3. The asymmetric vibration values, characteristic for the octahedral and tetrahedral complex of Mn2+.
at �00 nm at �00 nm
Θ� = 3� �23 cm-� Θ� = 2� �2� cm-� Θ2 = 2� ��� cm-� Θ2 = 22 �00 cm-�
CONCLUSIONS The strength of the
oscillator “f” increases with the increasing of the concentration of the solution and this is typical for the octahedral and the tetrahedral complex ions in the aqueous solution of MnCl2.
When we analyze the absorption bands in the spectrum of the investigated samples, we can conclude that the ions [Mn(H2O)�]2+ and [MnCl�]2- observe in the solutions.
An equilibrium observes between the complex ions [Mn(H2O)�]2+ and [MnCl�]2- at concentrations above 30% in the investigated aqueous solutions.
The Jahn-Teller effect is strong as the result of the high concentration of the investigated solutions.
ACKNOWLEDGMENTS Partial financial support by
project of Shumen University (20�3) is gratefully acknowledged.
REFERENCES
[�] Flack H. ���3 Acta Cryst. B 2� ��� [2] Anderson L. and Lindqvist O. ���� Acta Cryst. C �0 ���
[3] Lever P.B.A. ���� Inorganic Electronic Spectroscopy ��� [�] Figgis B.N. Ligand Field Theory (NY, USA) 2��
JOURNAL SCIENTIFIC AND APPLIED RESEARCH Vol. 3, 20�3
Original Contribution
Journal scientific and applied research, vol. 3, 20�3 Association Scientific and Applied Research
International Journal ISSN �3��-�2��
SURVEY AND ANALYSIS OF INTERCULTURAL
COMMUNICATION IN BULGARIA AND ABROAD
Gergana A. Andreeva�, Andrey I. Andreev2
� NATIONAL MILITARY UNIVERSITY – SHUMEN gerian�@abv.bg 2 SHUMEN’S UNIVERSITY [email protected]
ABSTRACT: The membership of Bulgaria in NATO and the European Union brings new challenges and
tasks to the Bulgarian Armed forces in the complex and dynamic security environment. The participation of military forces from the Bulgarian Army in international joint operations and missions led by NATO, the EU and the UN, transforms English language fluency into an important aspect of improving our operational interoperability with allies and partners. Teaching English is a priority for the modernization and transformation of the Bulgarian Army.
The system of education in English does not exist in isolation and is influenced by a number of factors that affect the force as a whole. It is a process that spans a long period of time and does not give quick results. This feature poses one of the challenges facing the system of English language training for the introduction of new effective forms of communication. In this respect, it is topical to explore and analyze opportunities for the introduction of Intercultural Communication in language learning groups within the Bulgarian Ministry of Defense.
KEY WORDS: Intercultural Communication, Monochronic, Polychronic, Military Culture. Survey and analysis of
Intercultural Communication Intercultural Communication is a
relatively new trend in the field of the humanities. It combines the positive qualities of human culture and the rich possibilities of communication in the past and today.
Intercultural Communication does not loose its relevance but is becoming more attractive for representatives of different scientific fields. Philosophers, sociologists, linguists, psychologists, cultural anthropologists and many other specialists are interested in its application. Many scientists try to explain the mechanism in terms of
their object orientation and give instructions to increase the efficiency and effectiveness of the communicative process. Others use multidisciplinary approaches in order to find solutions to the problems that occur during the study of this complex phenomenon. [�],[�],[�],[�0].
Definitions of the term “Intercultural Communication”
In English the basic concept is "Intercultural Communication" and it is often used as a synonym for "cross-cultural communication". In Bulgarian it is translated as интеркултурна, междукултурна комуникация. In English and
��JOURNAL SCIENTIFIC AND APPLIED RESEARCH Vol. 3, 20�3JOURNAL SCIENTIFIC AND APPLIED RESEARCH Vol. 3, 20�3
The basic conclusion from the table 2 is that the values of the transition moment Q are bigger for
the smaller wavelengths for the all investigated solutions.
Тable 3. The asymmetric vibration values, characteristic for the octahedral and tetrahedral complex of Mn2+.
at �00 nm at �00 nm
Θ� = 3� �23 cm-� Θ� = 2� �2� cm-� Θ2 = 2� ��� cm-� Θ2 = 22 �00 cm-�
CONCLUSIONS The strength of the
oscillator “f” increases with the increasing of the concentration of the solution and this is typical for the octahedral and the tetrahedral complex ions in the aqueous solution of MnCl2.
When we analyze the absorption bands in the spectrum of the investigated samples, we can conclude that the ions [Mn(H2O)�]2+ and [MnCl�]2- observe in the solutions.
An equilibrium observes between the complex ions [Mn(H2O)�]2+ and [MnCl�]2- at concentrations above 30% in the investigated aqueous solutions.
The Jahn-Teller effect is strong as the result of the high concentration of the investigated solutions.
ACKNOWLEDGMENTS Partial financial support by
project of Shumen University (20�3) is gratefully acknowledged.
REFERENCES
[�] Flack H. ���3 Acta Cryst. B 2� ��� [2] Anderson L. and Lindqvist O. ���� Acta Cryst. C �0 ���
[3] Lever P.B.A. ���� Inorganic Electronic Spectroscopy ��� [�] Figgis B.N. Ligand Field Theory (NY, USA) 2��
JOURNAL SCIENTIFIC AND APPLIED RESEARCH Vol. 3, 20�3
Original Contribution
Journal scientific and applied research, vol. 3, 20�3 Association Scientific and Applied Research
International Journal ISSN �3��-�2��
SURVEY AND ANALYSIS OF INTERCULTURAL
COMMUNICATION IN BULGARIA AND ABROAD
Gergana A. Andreeva�, Andrey I. Andreev2
� NATIONAL MILITARY UNIVERSITY – SHUMEN gerian�@abv.bg 2 SHUMEN’S UNIVERSITY [email protected]
ABSTRACT: The membership of Bulgaria in NATO and the European Union brings new challenges and
tasks to the Bulgarian Armed forces in the complex and dynamic security environment. The participation of military forces from the Bulgarian Army in international joint operations and missions led by NATO, the EU and the UN, transforms English language fluency into an important aspect of improving our operational interoperability with allies and partners. Teaching English is a priority for the modernization and transformation of the Bulgarian Army.
The system of education in English does not exist in isolation and is influenced by a number of factors that affect the force as a whole. It is a process that spans a long period of time and does not give quick results. This feature poses one of the challenges facing the system of English language training for the introduction of new effective forms of communication. In this respect, it is topical to explore and analyze opportunities for the introduction of Intercultural Communication in language learning groups within the Bulgarian Ministry of Defense.
KEY WORDS: Intercultural Communication, Monochronic, Polychronic, Military Culture. Survey and analysis of
Intercultural Communication Intercultural Communication is a
relatively new trend in the field of the humanities. It combines the positive qualities of human culture and the rich possibilities of communication in the past and today.
Intercultural Communication does not loose its relevance but is becoming more attractive for representatives of different scientific fields. Philosophers, sociologists, linguists, psychologists, cultural anthropologists and many other specialists are interested in its application. Many scientists try to explain the mechanism in terms of
their object orientation and give instructions to increase the efficiency and effectiveness of the communicative process. Others use multidisciplinary approaches in order to find solutions to the problems that occur during the study of this complex phenomenon. [�],[�],[�],[�0].
Definitions of the term “Intercultural Communication”
In English the basic concept is "Intercultural Communication" and it is often used as a synonym for "cross-cultural communication". In Bulgarian it is translated as интеркултурна, междукултурна комуникация. In English and
�0 JOURNAL SCIENTIFIC AND APPLIED RESEARCH Vol. 3, 20�3JOURNAL SCIENTIFIC AND APPLIED RESEARCH Vol. 3, 20�3
American scientific production, some authors distinguish between "Intercultural Communication" and "cross-cultural communication". According to William B. Gydukunst the term "Intercultural Communication” generally includes face-to-face communication of people belonging to different national cultures, but the term is often used in relation to various aspects of the research in the field of culture and communication. Second, he accepts that "cross-cultural communication" is a part of "Intercultural Communication". The term "cross-cultural communication" is a subsidiary and has less generalizing ability than the concept of "Intercultural Communication." "Understanding the cross-cultural communication is a prerequisite for understanding Intercultural Communication." (Gydukunst vii)[�]. According to this author "cross-cultural communication" is more interested in how different communication occurs in different cultures and examines the impact of culture on communication.
Defining Culture Culture is all around us and
between us. Culture is a set of "tools" that have shaped us in a way as to be a part of society. In the last few decades, many definitions of culture have been developed: Parsons explains culture as “patterned systems of symbols that direct the orientation of action”; According to Kluckhohn.
Culture consists of patterned ways of thinking, feeling and reacting, acquired and transmitted
mainly by symbols, consisting the distinctive achievements of human groups, including their embodiments and artifacts; the essential core of culture consists of traditional (i.e. historically derived and selected) ideas and especially their attached values.(Hofstede, 200�, 2�) [�];
Hofstede defines culture as the “collective programming of the mind which distinguishes the members of one human group from another” [7]; Michael Minkov sees culture as “shared” according to him.
Culture is a group-level construct. Individuals are usually studied in terms of what is called “personality,” not individual culture. The term “culture” applies to groups, such as tribes, ethnicities, nations, or national subsocieties. Once the group is defined, it is possible to measure to what extent a particular cultural element – value, norm, or other – is shared by group’s members. (Minkov) [��]
One general definition that manages to cover everything is given by D. Brown an anthropologist from the University of Santa Barbara, California: "Culture - patterns of doing and thinking that are passed on between generations through learning." (Brown) [2]. Edward Hall defines culture as: "The medium evolved by the human species, the one which characterizes the human species" (in Bennet) [�]. He says: "Culture hides much more than it reveals, strangely enough, what it hides, it hides most effectively from its own participants." (Bennet) [�].
JOURNAL SCIENTIFIC AND APPLIED RESEARCH Vol. 3, 20�3
Patrick L. Schmidt compares culture to an iceberg (see fig. �.�.).
Fig. �.�
Fig. �.� Culture as an Iceberg; Institute of Community Cohesion; cohesioninstitute.org.uk; Web; �0.
Feb. 20�3. In his book In search of
Intercultural Communication, he explains his hypothesis that the greater part of the iceberg is underwater and above the surface, the superficial things like food, rituals, clothing, newspapers, mannerisms and gestures, monuments and sights are seen. Underneath remain the most and more important phenomena such as philosophy, history, religion, patriotism of the nation; the communicative style, decision making and problem solving styles, the importance of friendship, the role of social status, the principles of breeding and upbringing of children, attitudes to sex and intimate relationships, hygiene and cleanliness, time management and maintenance of public spaces. According to him, culture has two faces - tangible and intangible. Material objects are the artifacts - the visible objects and elements of everyday life like the tie, the pen, the book, the business building, etc. Non-material is found in
the contents of books and songs, in the theories and the ideas that they have; the stories that are read to us as children, our overall spiritual values and attitudes to people, to the world and life. And if the visible could be changed relatively quickly, the invisible is sustainable for decades, even centuries.
Edward T. Hall (���� - 200�) was an American anthropologist, who introduced the first theoretical model of differentiation of cultures.[�] He first realized that the individual traits of culture should be seen as parts of a larger system. Today Edward T. Hall is recognized as the patriarch of intercultural studies. His most significant books are The Silent Language, The Hidden Dimension and Beyond Culture. According to Hall "Culture is a system for creating, sending, storing, and processing of information".
By looking at how people from different cultures communicate, Hall divides them according to two criteria:
- In terms of communication - High and Low context.
- In terms of time – Polychronic and monochromic.
High and low context communication is the difference between direct and indirect communication. High context is implicit, coded; there are many uncertainties and unspoken things. The main feature of this style is the achievement / preservation of the harmony in the relationships. This style is very common among East Asian cultures, where the direct
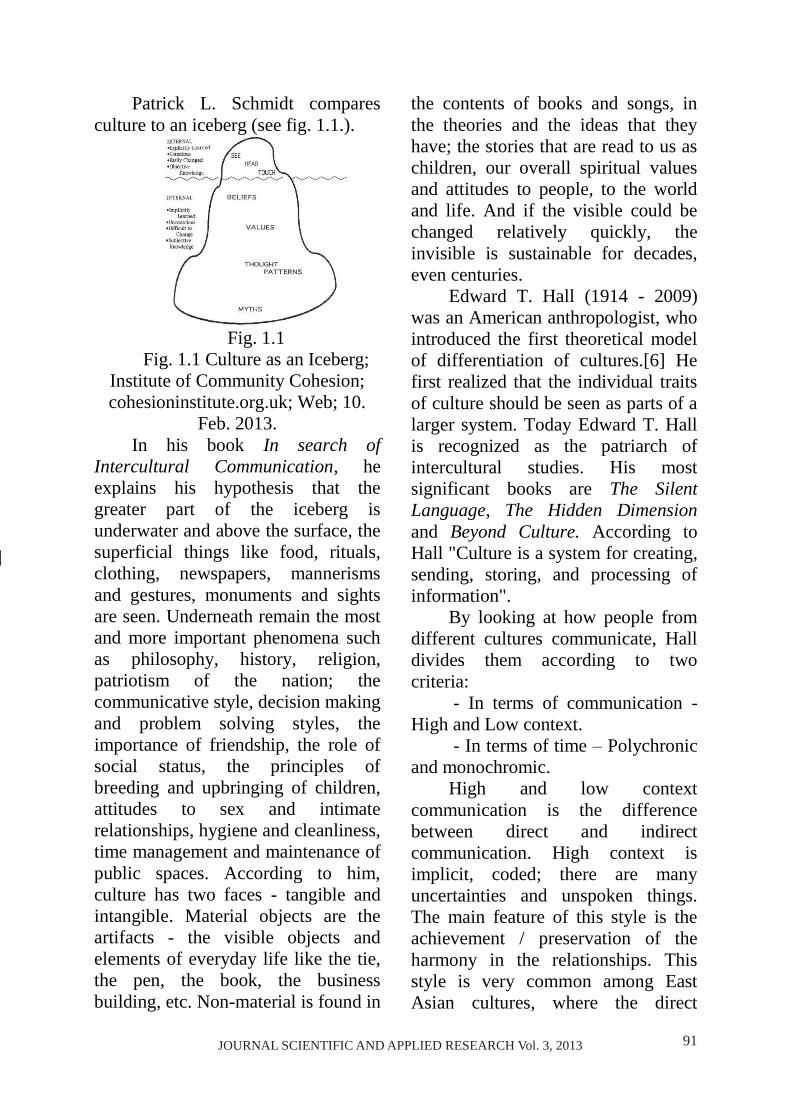
��JOURNAL SCIENTIFIC AND APPLIED RESEARCH Vol. 3, 20�3JOURNAL SCIENTIFIC AND APPLIED RESEARCH Vol. 3, 20�3
American scientific production, some authors distinguish between "Intercultural Communication" and "cross-cultural communication". According to William B. Gydukunst the term "Intercultural Communication” generally includes face-to-face communication of people belonging to different national cultures, but the term is often used in relation to various aspects of the research in the field of culture and communication. Second, he accepts that "cross-cultural communication" is a part of "Intercultural Communication". The term "cross-cultural communication" is a subsidiary and has less generalizing ability than the concept of "Intercultural Communication." "Understanding the cross-cultural communication is a prerequisite for understanding Intercultural Communication." (Gydukunst vii)[�]. According to this author "cross-cultural communication" is more interested in how different communication occurs in different cultures and examines the impact of culture on communication.
Defining Culture Culture is all around us and
between us. Culture is a set of "tools" that have shaped us in a way as to be a part of society. In the last few decades, many definitions of culture have been developed: Parsons explains culture as “patterned systems of symbols that direct the orientation of action”; According to Kluckhohn.
Culture consists of patterned ways of thinking, feeling and reacting, acquired and transmitted
mainly by symbols, consisting the distinctive achievements of human groups, including their embodiments and artifacts; the essential core of culture consists of traditional (i.e. historically derived and selected) ideas and especially their attached values.(Hofstede, 200�, 2�) [�];
Hofstede defines culture as the “collective programming of the mind which distinguishes the members of one human group from another” [7]; Michael Minkov sees culture as “shared” according to him.
Culture is a group-level construct. Individuals are usually studied in terms of what is called “personality,” not individual culture. The term “culture” applies to groups, such as tribes, ethnicities, nations, or national subsocieties. Once the group is defined, it is possible to measure to what extent a particular cultural element – value, norm, or other – is shared by group’s members. (Minkov) [��]
One general definition that manages to cover everything is given by D. Brown an anthropologist from the University of Santa Barbara, California: "Culture - patterns of doing and thinking that are passed on between generations through learning." (Brown) [2]. Edward Hall defines culture as: "The medium evolved by the human species, the one which characterizes the human species" (in Bennet) [�]. He says: "Culture hides much more than it reveals, strangely enough, what it hides, it hides most effectively from its own participants." (Bennet) [�].
JOURNAL SCIENTIFIC AND APPLIED RESEARCH Vol. 3, 20�3
Patrick L. Schmidt compares culture to an iceberg (see fig. �.�.).
Fig. �.�
Fig. �.� Culture as an Iceberg; Institute of Community Cohesion; cohesioninstitute.org.uk; Web; �0.
Feb. 20�3. In his book In search of
Intercultural Communication, he explains his hypothesis that the greater part of the iceberg is underwater and above the surface, the superficial things like food, rituals, clothing, newspapers, mannerisms and gestures, monuments and sights are seen. Underneath remain the most and more important phenomena such as philosophy, history, religion, patriotism of the nation; the communicative style, decision making and problem solving styles, the importance of friendship, the role of social status, the principles of breeding and upbringing of children, attitudes to sex and intimate relationships, hygiene and cleanliness, time management and maintenance of public spaces. According to him, culture has two faces - tangible and intangible. Material objects are the artifacts - the visible objects and elements of everyday life like the tie, the pen, the book, the business building, etc. Non-material is found in
the contents of books and songs, in the theories and the ideas that they have; the stories that are read to us as children, our overall spiritual values and attitudes to people, to the world and life. And if the visible could be changed relatively quickly, the invisible is sustainable for decades, even centuries.
Edward T. Hall (���� - 200�) was an American anthropologist, who introduced the first theoretical model of differentiation of cultures.[�] He first realized that the individual traits of culture should be seen as parts of a larger system. Today Edward T. Hall is recognized as the patriarch of intercultural studies. His most significant books are The Silent Language, The Hidden Dimension and Beyond Culture. According to Hall "Culture is a system for creating, sending, storing, and processing of information".
By looking at how people from different cultures communicate, Hall divides them according to two criteria:
- In terms of communication - High and Low context.
- In terms of time – Polychronic and monochromic.
High and low context communication is the difference between direct and indirect communication. High context is implicit, coded; there are many uncertainties and unspoken things. The main feature of this style is the achievement / preservation of the harmony in the relationships. This style is very common among East Asian cultures, where the direct
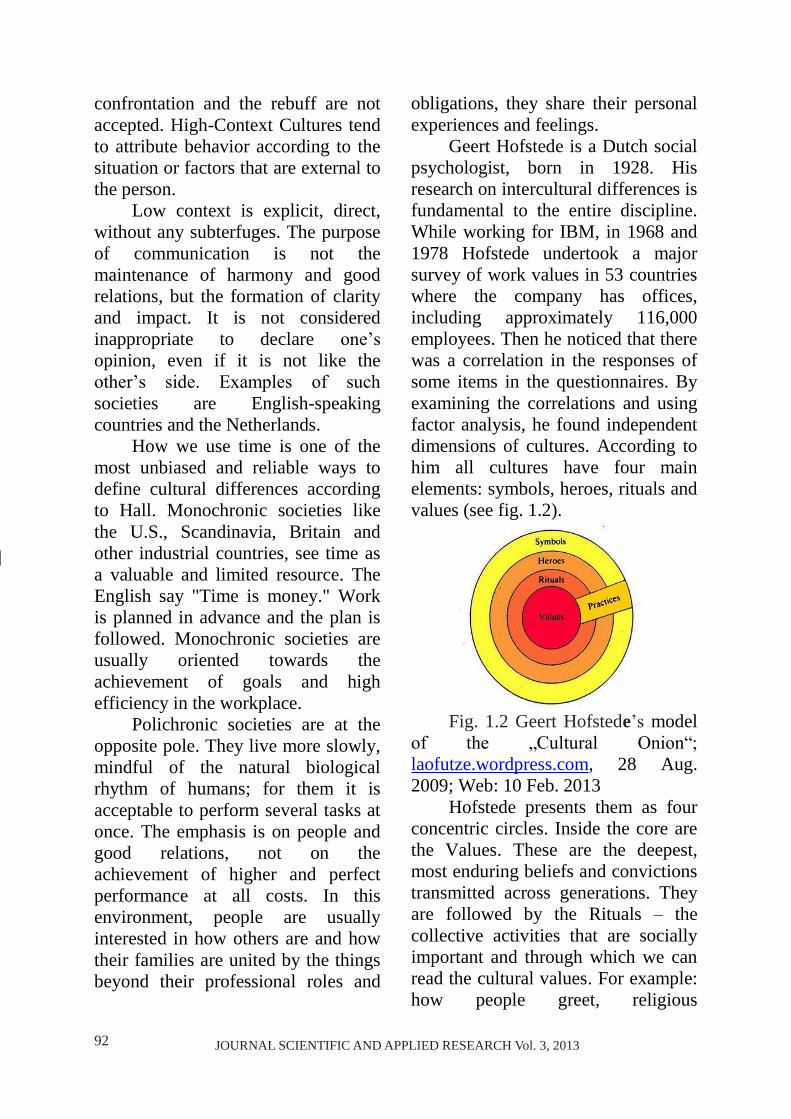
�2 JOURNAL SCIENTIFIC AND APPLIED RESEARCH Vol. 3, 20�3JOURNAL SCIENTIFIC AND APPLIED RESEARCH Vol. 3, 20�3
confrontation and the rebuff are not accepted. High-Context Cultures tend to attribute behavior according to the situation or factors that are external to the person.
Low context is explicit, direct, without any subterfuges. The purpose of communication is not the maintenance of harmony and good relations, but the formation of clarity and impact. It is not considered inappropriate to declare one’s opinion, even if it is not like the other’s side. Examples of such societies are English-speaking countries and the Netherlands.
How we use time is one of the most unbiased and reliable ways to define cultural differences according to Hall. Monochronic societies like the U.S., Scandinavia, Britain and other industrial countries, see time as a valuable and limited resource. The English say "Time is money." Work is planned in advance and the plan is followed. Monochronic societies are usually oriented towards the achievement of goals and high efficiency in the workplace.
Polichronic societies are at the opposite pole. They live more slowly, mindful of the natural biological rhythm of humans; for them it is acceptable to perform several tasks at once. The emphasis is on people and good relations, not on the achievement of higher and perfect performance at all costs. In this environment, people are usually interested in how others are and how their families are united by the things beyond their professional roles and
obligations, they share their personal experiences and feelings.
Geert Hofstede is a Dutch social psychologist, born in ��2�. His research on intercultural differences is fundamental to the entire discipline. While working for IBM, in ���� and ���� Hofstede undertook a major survey of work values in �3 countries where the company has offices, including approximately ���,000 employees. Then he noticed that there was a correlation in the responses of some items in the questionnaires. By examining the correlations and using factor analysis, he found independent dimensions of cultures. According to him all cultures have four main elements: symbols, heroes, rituals and values (see fig. �.2).
Fig. �.2 Geert Hofstede’s model
of the „Cultural Onion“; laofutze.wordpress.com, 2� Aug. 200�; Web: �0 Feb. 20�3
Hofstede presents them as four concentric circles. Inside the core are the Values. These are the deepest, most enduring beliefs and convictions transmitted across generations. They are followed by the Rituals – the collective activities that are socially important and through which we can read the cultural values. For example: how people greet, religious
JOURNAL SCIENTIFIC AND APPLIED RESEARCH Vol. 3, 20�3
ceremonies, etc. Third are the Heroes, these alive or dead people who possess the characteristics that are considered particularly valuable in a culture, and their behavior serves as role models to the members of that culture. The last circle are the External symbols – words, gestures, images and objects through which members of a society, a culture medium, can be understood. Symbols are the last element because they are the easiest to change.
In his remarkable research Hofstede found that different cultures have different values, rituals, heroes and symbols and that the transition from one culture to another can cause culture shock.
Hofstede’s Cultural Dimen-sions
Hofstede's theory is constantly evolving, but it finally took shape in ���0, when he first introduced the four dimensions of culture. Today the dimensions of culture in Hofstede's theory are six:
Individualism - Collectivism describes whether one’s identity is defined by personal choices and achievements or by the character of the collective group to which an individual is more or less permanently attached.
Power Distance- the degree of inequality among people that the populace of a country considers normal
Uncertainty Avoidance is the degree to which people in a country prefer structured over unstructured situations. Structured situations are
those in which there are clear rules as to how one should behave.
Masculinity - Femininity is the degree to which values like assertiveness, performance, success, and competition (associated with the role of men) prevail over values like the quality of life, maintaining warm personal relationships, service, care for the weak, and solidarity (which associated with the role of women).
Long - Short Term Orientation is based on the values stressed in the teachings of Confucius. Long-term orientation focuses on the degree to which a culture embraces, or does not embrace, future-oriented values, such as perseverance and thrift.
Indulgence – Restraint. Indulgence stands for a society that allows free gratification of basic and natural human drives and enjoying. Restraint stands for a society that suppresses gratification of needs and regulates it by strict social norms. Hofstede understands culture as "collective programming of the mind." (Culture’s consequences). This means that personality is largely formed in childhood under the influence of the family, the surrounding neighborhood the school. During this period the child "absorbs" the specific elements of culture. Hofstede’s cultural dimensions can be used to explain differences in communication across cultures; they exist at both levels - cultural and individual.
Military culture As this survey analyzes
Intercultural Communication in language learning in military
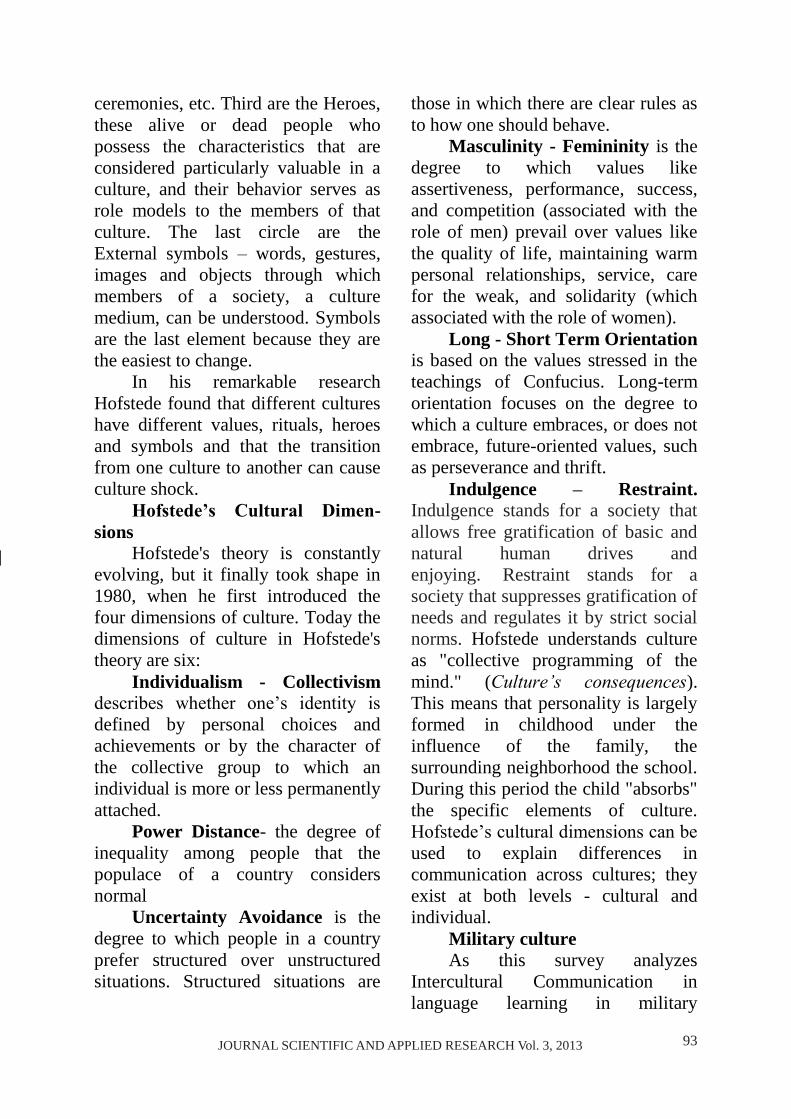
�3JOURNAL SCIENTIFIC AND APPLIED RESEARCH Vol. 3, 20�3JOURNAL SCIENTIFIC AND APPLIED RESEARCH Vol. 3, 20�3
confrontation and the rebuff are not accepted. High-Context Cultures tend to attribute behavior according to the situation or factors that are external to the person.
Low context is explicit, direct, without any subterfuges. The purpose of communication is not the maintenance of harmony and good relations, but the formation of clarity and impact. It is not considered inappropriate to declare one’s opinion, even if it is not like the other’s side. Examples of such societies are English-speaking countries and the Netherlands.
How we use time is one of the most unbiased and reliable ways to define cultural differences according to Hall. Monochronic societies like the U.S., Scandinavia, Britain and other industrial countries, see time as a valuable and limited resource. The English say "Time is money." Work is planned in advance and the plan is followed. Monochronic societies are usually oriented towards the achievement of goals and high efficiency in the workplace.
Polichronic societies are at the opposite pole. They live more slowly, mindful of the natural biological rhythm of humans; for them it is acceptable to perform several tasks at once. The emphasis is on people and good relations, not on the achievement of higher and perfect performance at all costs. In this environment, people are usually interested in how others are and how their families are united by the things beyond their professional roles and
obligations, they share their personal experiences and feelings.
Geert Hofstede is a Dutch social psychologist, born in ��2�. His research on intercultural differences is fundamental to the entire discipline. While working for IBM, in ���� and ���� Hofstede undertook a major survey of work values in �3 countries where the company has offices, including approximately ���,000 employees. Then he noticed that there was a correlation in the responses of some items in the questionnaires. By examining the correlations and using factor analysis, he found independent dimensions of cultures. According to him all cultures have four main elements: symbols, heroes, rituals and values (see fig. �.2).
Fig. �.2 Geert Hofstede’s model
of the „Cultural Onion“; laofutze.wordpress.com, 2� Aug. 200�; Web: �0 Feb. 20�3
Hofstede presents them as four concentric circles. Inside the core are the Values. These are the deepest, most enduring beliefs and convictions transmitted across generations. They are followed by the Rituals – the collective activities that are socially important and through which we can read the cultural values. For example: how people greet, religious
JOURNAL SCIENTIFIC AND APPLIED RESEARCH Vol. 3, 20�3
ceremonies, etc. Third are the Heroes, these alive or dead people who possess the characteristics that are considered particularly valuable in a culture, and their behavior serves as role models to the members of that culture. The last circle are the External symbols – words, gestures, images and objects through which members of a society, a culture medium, can be understood. Symbols are the last element because they are the easiest to change.
In his remarkable research Hofstede found that different cultures have different values, rituals, heroes and symbols and that the transition from one culture to another can cause culture shock.
Hofstede’s Cultural Dimen-sions
Hofstede's theory is constantly evolving, but it finally took shape in ���0, when he first introduced the four dimensions of culture. Today the dimensions of culture in Hofstede's theory are six:
Individualism - Collectivism describes whether one’s identity is defined by personal choices and achievements or by the character of the collective group to which an individual is more or less permanently attached.
Power Distance- the degree of inequality among people that the populace of a country considers normal
Uncertainty Avoidance is the degree to which people in a country prefer structured over unstructured situations. Structured situations are
those in which there are clear rules as to how one should behave.
Masculinity - Femininity is the degree to which values like assertiveness, performance, success, and competition (associated with the role of men) prevail over values like the quality of life, maintaining warm personal relationships, service, care for the weak, and solidarity (which associated with the role of women).
Long - Short Term Orientation is based on the values stressed in the teachings of Confucius. Long-term orientation focuses on the degree to which a culture embraces, or does not embrace, future-oriented values, such as perseverance and thrift.
Indulgence – Restraint. Indulgence stands for a society that allows free gratification of basic and natural human drives and enjoying. Restraint stands for a society that suppresses gratification of needs and regulates it by strict social norms. Hofstede understands culture as "collective programming of the mind." (Culture’s consequences). This means that personality is largely formed in childhood under the influence of the family, the surrounding neighborhood the school. During this period the child "absorbs" the specific elements of culture. Hofstede’s cultural dimensions can be used to explain differences in communication across cultures; they exist at both levels - cultural and individual.
Military culture As this survey analyzes
Intercultural Communication in language learning in military
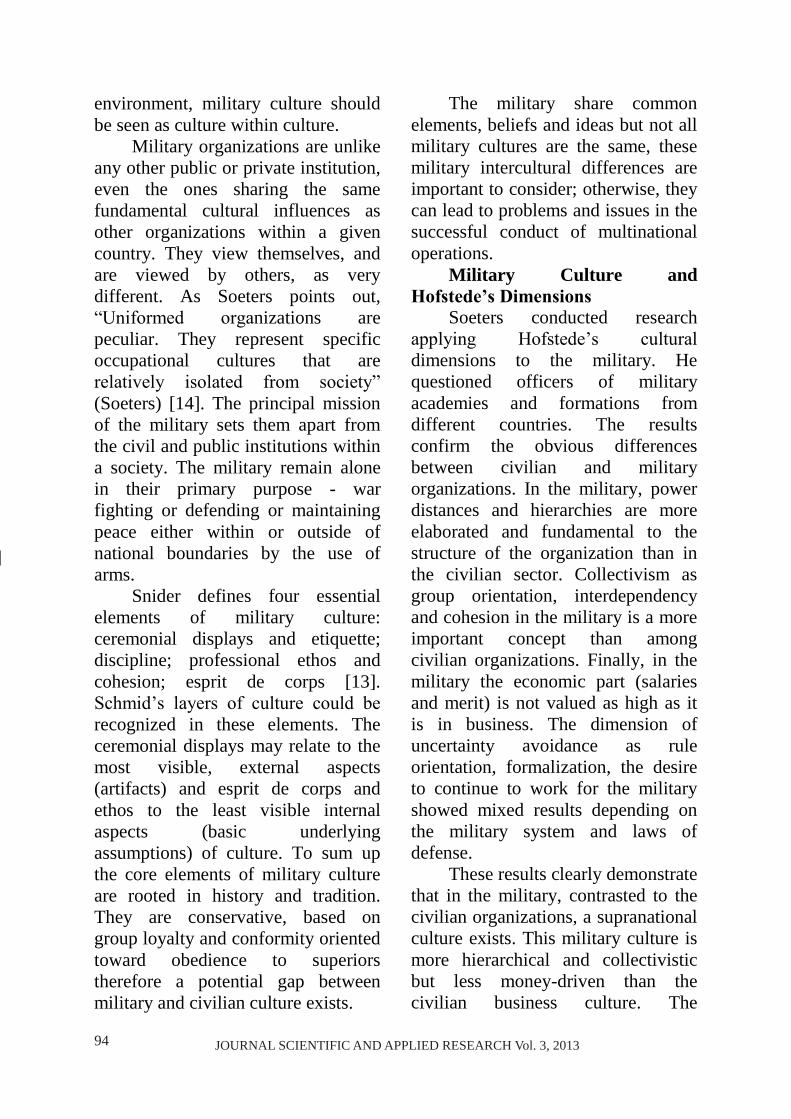
�� JOURNAL SCIENTIFIC AND APPLIED RESEARCH Vol. 3, 20�3JOURNAL SCIENTIFIC AND APPLIED RESEARCH Vol. 3, 20�3
environment, military culture should be seen as culture within culture.
Military organizations are unlike any other public or private institution, even the ones sharing the same fundamental cultural influences as other organizations within a given country. They view themselves, and are viewed by others, as very different. As Soeters points out, “Uniformed organizations are peculiar. They represent specific occupational cultures that are relatively isolated from society” (Soeters) [��]. The principal mission of the military sets them apart from the civil and public institutions within a society. The military remain alone in their primary purpose - war fighting or defending or maintaining peace either within or outside of national boundaries by the use of arms.
Snider defines four essential elements of military culture: ceremonial displays and etiquette; discipline; professional ethos and cohesion; esprit de corps [�3]. Schmid’s layers of culture could be recognized in these elements. The ceremonial displays may relate to the most visible, external aspects (artifacts) and esprit de corps and ethos to the least visible internal aspects (basic underlying assumptions) of culture. To sum up the core elements of military culture are rooted in history and tradition. They are conservative, based on group loyalty and conformity oriented toward obedience to superiors therefore a potential gap between military and civilian culture exists.
The military share common elements, beliefs and ideas but not all military cultures are the same, these military intercultural differences are important to consider; otherwise, they can lead to problems and issues in the successful conduct of multinational operations.
Military Culture and Hofstede’s Dimensions
Soeters conducted research applying Hofstede’s cultural dimensions to the military. He questioned officers of military academies and formations from different countries. The results confirm the obvious differences between civilian and military organizations. In the military, power distances and hierarchies are more elaborated and fundamental to the structure of the organization than in the civilian sector. Collectivism as group orientation, interdependency and cohesion in the military is a more important concept than among civilian organizations. Finally, in the military the economic part (salaries and merit) is not valued as high as it is in business. The dimension of uncertainty avoidance as rule orientation, formalization, the desire to continue to work for the military showed mixed results depending on the military system and laws of defense.
These results clearly demonstrate that in the military, contrasted to the civilian organizations, a supranational culture exists. This military culture is more hierarchical and collectivistic but less money-driven than the civilian business culture. The
JOURNAL SCIENTIFIC AND APPLIED RESEARCH Vol. 3, 20�3
consequence of this is that military personnel of different origins and cultures can function and communicate with each other without many problems using the official language of multinational operation which is English.
Communication Bulgarian military forces are
increasingly required to operate in multinational environment. This may be in multinational North Atlantic Treaty Organization (NATO) teams, where soldiers from different nations work together for common goals, or in non-traditional missions such as peacekeeping and disaster relief, where soldiers work closely with local population. In such force major situations, people from different cultures are put into close contact. Relationships could be torn if miscommunication is considered. Having been socialized in different cultures, soldiers in multinational teams bring in interactions diverse ways of communicating and understanding communication. Different cultures have different values, communication styles, norms, and behavior, all of these can lead to problems in communication.
Communication is critical and one of the most pressing difficulties affecting team efficiency and effectiveness. Since the use of multinational teams and group interactions is increasing and likely to continue in the future, it is important for the Bulgarian army to understand how and why miscommunication arises and ways that it can be avoided.
Communication problems in Multinational environment
Cultural diversity in multinational groups can be seen as strength. Research suggests that multinational teams can operate more successfully than homogeneous teams. On the one hand team’s cultural diversity can improve creativity and decision making by displaying various perspectives, world views, and experiences as well as the second-language acquisition may improve problem-solving abilities. On the other hand teams made up of military from different cultures can be superior to homogeneous teams but they can also experience hardship if the cultural peculiarities are ignored. Indeed, due to cultural factors, communication problems can be the main barrier to multinational military team performance and effectiveness.
Lack of Language Fluency One of the most common cases
of miscommunication in multinational settings is due to the lack of fluency in the operational language. Communication could be hard for non-native speakers when the speech is fast or too soft, when the speaker uses many acronyms or when using dialect or slang. Speaking in English or American regional accent can make communication difficult. Research shows that listeners from intercultural groups could recall only �0% of the information that was sent, as compared to ��% in intracultural situations. This means that language ability alone does not ensure effective Intercultural Communication. This finding has implications for
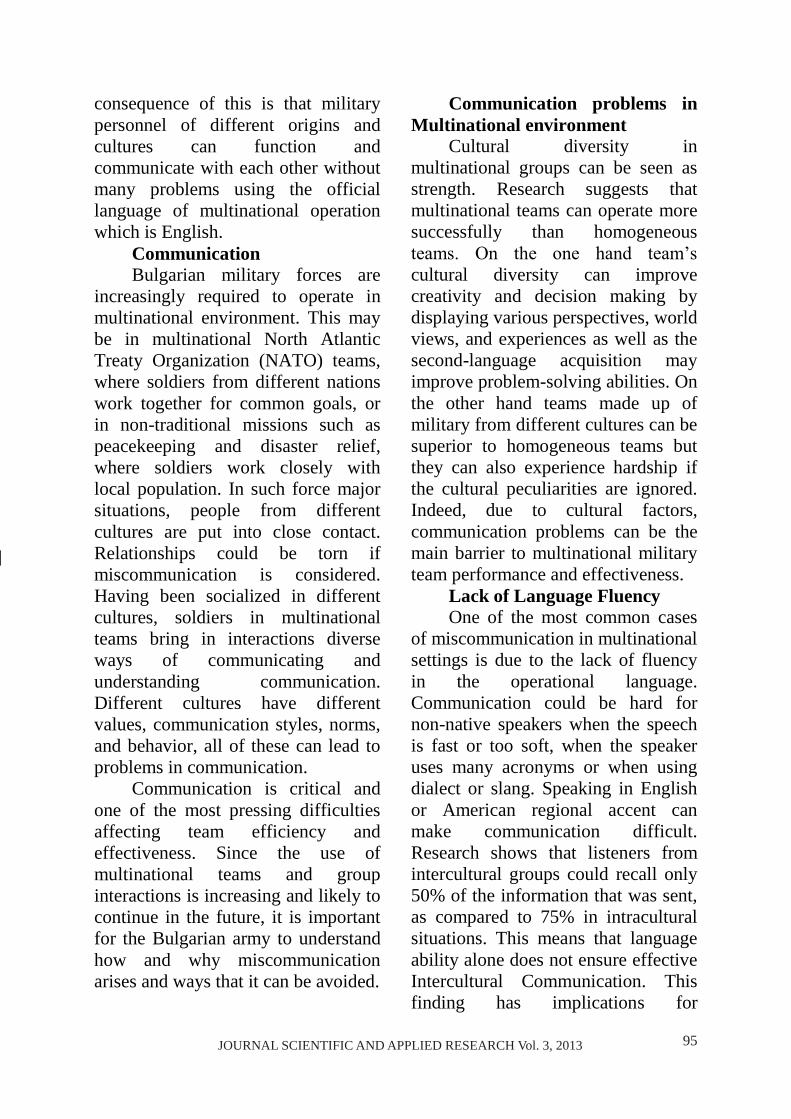
��JOURNAL SCIENTIFIC AND APPLIED RESEARCH Vol. 3, 20�3JOURNAL SCIENTIFIC AND APPLIED RESEARCH Vol. 3, 20�3
environment, military culture should be seen as culture within culture.
Military organizations are unlike any other public or private institution, even the ones sharing the same fundamental cultural influences as other organizations within a given country. They view themselves, and are viewed by others, as very different. As Soeters points out, “Uniformed organizations are peculiar. They represent specific occupational cultures that are relatively isolated from society” (Soeters) [��]. The principal mission of the military sets them apart from the civil and public institutions within a society. The military remain alone in their primary purpose - war fighting or defending or maintaining peace either within or outside of national boundaries by the use of arms.
Snider defines four essential elements of military culture: ceremonial displays and etiquette; discipline; professional ethos and cohesion; esprit de corps [�3]. Schmid’s layers of culture could be recognized in these elements. The ceremonial displays may relate to the most visible, external aspects (artifacts) and esprit de corps and ethos to the least visible internal aspects (basic underlying assumptions) of culture. To sum up the core elements of military culture are rooted in history and tradition. They are conservative, based on group loyalty and conformity oriented toward obedience to superiors therefore a potential gap between military and civilian culture exists.
The military share common elements, beliefs and ideas but not all military cultures are the same, these military intercultural differences are important to consider; otherwise, they can lead to problems and issues in the successful conduct of multinational operations.
Military Culture and Hofstede’s Dimensions
Soeters conducted research applying Hofstede’s cultural dimensions to the military. He questioned officers of military academies and formations from different countries. The results confirm the obvious differences between civilian and military organizations. In the military, power distances and hierarchies are more elaborated and fundamental to the structure of the organization than in the civilian sector. Collectivism as group orientation, interdependency and cohesion in the military is a more important concept than among civilian organizations. Finally, in the military the economic part (salaries and merit) is not valued as high as it is in business. The dimension of uncertainty avoidance as rule orientation, formalization, the desire to continue to work for the military showed mixed results depending on the military system and laws of defense.
These results clearly demonstrate that in the military, contrasted to the civilian organizations, a supranational culture exists. This military culture is more hierarchical and collectivistic but less money-driven than the civilian business culture. The
JOURNAL SCIENTIFIC AND APPLIED RESEARCH Vol. 3, 20�3
consequence of this is that military personnel of different origins and cultures can function and communicate with each other without many problems using the official language of multinational operation which is English.
Communication Bulgarian military forces are
increasingly required to operate in multinational environment. This may be in multinational North Atlantic Treaty Organization (NATO) teams, where soldiers from different nations work together for common goals, or in non-traditional missions such as peacekeeping and disaster relief, where soldiers work closely with local population. In such force major situations, people from different cultures are put into close contact. Relationships could be torn if miscommunication is considered. Having been socialized in different cultures, soldiers in multinational teams bring in interactions diverse ways of communicating and understanding communication. Different cultures have different values, communication styles, norms, and behavior, all of these can lead to problems in communication.
Communication is critical and one of the most pressing difficulties affecting team efficiency and effectiveness. Since the use of multinational teams and group interactions is increasing and likely to continue in the future, it is important for the Bulgarian army to understand how and why miscommunication arises and ways that it can be avoided.
Communication problems in Multinational environment
Cultural diversity in multinational groups can be seen as strength. Research suggests that multinational teams can operate more successfully than homogeneous teams. On the one hand team’s cultural diversity can improve creativity and decision making by displaying various perspectives, world views, and experiences as well as the second-language acquisition may improve problem-solving abilities. On the other hand teams made up of military from different cultures can be superior to homogeneous teams but they can also experience hardship if the cultural peculiarities are ignored. Indeed, due to cultural factors, communication problems can be the main barrier to multinational military team performance and effectiveness.
Lack of Language Fluency One of the most common cases
of miscommunication in multinational settings is due to the lack of fluency in the operational language. Communication could be hard for non-native speakers when the speech is fast or too soft, when the speaker uses many acronyms or when using dialect or slang. Speaking in English or American regional accent can make communication difficult. Research shows that listeners from intercultural groups could recall only �0% of the information that was sent, as compared to ��% in intracultural situations. This means that language ability alone does not ensure effective Intercultural Communication. This finding has implications for
�� JOURNAL SCIENTIFIC AND APPLIED RESEARCH Vol. 3, 20�3JOURNAL SCIENTIFIC AND APPLIED RESEARCH Vol. 3, 20�3
Intercultural Communication training to be introduced in the existing curriculum: language training per se is not enough. Participants in multicultural operations need to be aware that even if they are fluent in the language, miscommunication is highly probable. To communicate successfully, one needs to understand not only the language but cultural differences in communication, as well.
Features of the military environment and the need for Intercultural Communication
Foreign language training and especially the learning of English, as an operational language- has become increasingly important within the armed forces after the Cold War. Due to the increasing number of peace-support operations, the enlargement and partnership activities language training became NATO’s main objective in both Allied and Partner countries where it is a national responsibility.
Language training has been particularly acute in Bulgaria as well as in all former Warsaw Pact countries where US Defense Language Institute and Peacekeeping English Project of the British Council have been working for improving English language skills of the Army since ���0s.
“Linguistic interoperability is as important for ensuring effective participation in both NATO missions and wider Alliance activities as any other form of interoperability” (Crossey) [3].
While the language skills of deployed forces in peace-support operations are generally sufficient for the tasks they face, many officers and enlisted men have reported experiencing difficulties in contributing sufficient linguistic expertise to operate to maximum efficiency. The situation appears most serious in those peace-keeping operations that are staffed by a large proportion of senior officers who have struggled to get to grips with English. The situation is usually much worse in the lower ranks where some non-commissioned officers may have had no formal English training. Another difficulty frequently encountered by non-native speakers of English is the strong regional accents of many of the native speakers with whom they work. They have greater problems understanding the English of native speakers than of non-native speakers, complaining that native speakers are never trained to modify their speech when talking with their non-native peers. In other words, native speakers rarely recognize that the common working language in peace-support operations is international English, as opposed to their own version of the language. Another example of this gap between classroom and target language use is the tendency to teach a rather academic form of English.
Intercultural Communication is used as a base for effective communication in many spheres of life. Many scientists analyze, explain and find solutions to the communication problems. The need
JOURNAL SCIENTIFIC AND APPLIED RESEARCH Vol. 3, 20�3
for effective Intercultural Communication is particularly acute in peace-support operations where linguistic misunderstandings may lead to making mistakes, which in turn, might in a worst-case scenario, result in casualties.
Intercultural Communication education is new to the Bulgarian Army structures but some research made show that such training will increase the efficiency and effectiveness of communication in multinational team operations.
Bibliography �. Bennet, Milton J, ed. Basic
Concepts of Intercultural Communication. Selected Readings. Yarmouth, Maine: Intercultural Press, Inc., ����. Print.
2. Brown, D. Human Universals. New York: McGraw Hill, ����. Print.
3. Crossey, Mark “Improving Linguistic Interoperability” NATO Review n.p., 200�. Web. � Jan. 20�3
�. Febbraro, Angela R., and Brian McKee, and Sharon L. Riedel, ed. “Multinational Military Operations and Intercultural Factors” cso.nato.int NATO Science and Technology Organisation n.p, November 200�. Web. �� Dec. 20�2
�. Gudykunst, William B, ed. Cross-cultural and intercultural communication. Thousand Oaks, California: SAGE Publications inc., 2003. Print.
�. Hall, Edward T., and Mildred Reed Hall Understanding Cultural Differences. Yarmouth,
Maine: Intercultural Press, Inc., ���0. Print.
�. Hofstede, G. Culture’s consequences. International differences in work-related values. Newbury Park, CA: SAGE Publications inc. ���0. Print
---. Culture’s consequences (2nd ed). Thousand Oaks: Sage Publications inc. 200�. Print
---. Cultures and organizations: Software of the mind. New York: McGraw-Hill ����.Print.
�. Ivanov, Ivan P. Intercultural Education. Aksios, ����
�. Marin, Noemi “Teaching Romanian From a Communication Education Perspective,” Romanian Studies Association of America Newsletter, ��.2, December 2000,�-�.
�0. McFarland, Maxie “Military Cultural Education” Military Review n.p March –April 200�. Web. �2 Dec. 20�2
��. Minkov, M. Cultural Differences in a Globalizing World. Wagon Lane, Bingley: Emerald Group Publishing Ltd. 20��. Print
�2. Schmidt, Patrick L. In Search of Intercultural Understanding. Vienna, Austria: Meridian World Press, 200�. Print.
�3. Snider, D.M. “An uninformed debate on military culture.” Orbis, 43 (����), ��-2�. Web �� Feb. 20�3.
��. Soeters, J. L. and Ricardo Recht “Convergence or divergence in the multinational classroom? Experiences from the military.” International Journal of Intercultural Relations 2� (200�) : �23-��0. Web �� Feb. 20�3.
��JOURNAL SCIENTIFIC AND APPLIED RESEARCH Vol. 3, 20�3JOURNAL SCIENTIFIC AND APPLIED RESEARCH Vol. 3, 20�3
Intercultural Communication training to be introduced in the existing curriculum: language training per se is not enough. Participants in multicultural operations need to be aware that even if they are fluent in the language, miscommunication is highly probable. To communicate successfully, one needs to understand not only the language but cultural differences in communication, as well.
Features of the military environment and the need for Intercultural Communication
Foreign language training and especially the learning of English, as an operational language- has become increasingly important within the armed forces after the Cold War. Due to the increasing number of peace-support operations, the enlargement and partnership activities language training became NATO’s main objective in both Allied and Partner countries where it is a national responsibility.
Language training has been particularly acute in Bulgaria as well as in all former Warsaw Pact countries where US Defense Language Institute and Peacekeeping English Project of the British Council have been working for improving English language skills of the Army since ���0s.
“Linguistic interoperability is as important for ensuring effective participation in both NATO missions and wider Alliance activities as any other form of interoperability” (Crossey) [3].
While the language skills of deployed forces in peace-support operations are generally sufficient for the tasks they face, many officers and enlisted men have reported experiencing difficulties in contributing sufficient linguistic expertise to operate to maximum efficiency. The situation appears most serious in those peace-keeping operations that are staffed by a large proportion of senior officers who have struggled to get to grips with English. The situation is usually much worse in the lower ranks where some non-commissioned officers may have had no formal English training. Another difficulty frequently encountered by non-native speakers of English is the strong regional accents of many of the native speakers with whom they work. They have greater problems understanding the English of native speakers than of non-native speakers, complaining that native speakers are never trained to modify their speech when talking with their non-native peers. In other words, native speakers rarely recognize that the common working language in peace-support operations is international English, as opposed to their own version of the language. Another example of this gap between classroom and target language use is the tendency to teach a rather academic form of English.
Intercultural Communication is used as a base for effective communication in many spheres of life. Many scientists analyze, explain and find solutions to the communication problems. The need
JOURNAL SCIENTIFIC AND APPLIED RESEARCH Vol. 3, 20�3
for effective Intercultural Communication is particularly acute in peace-support operations where linguistic misunderstandings may lead to making mistakes, which in turn, might in a worst-case scenario, result in casualties.
Intercultural Communication education is new to the Bulgarian Army structures but some research made show that such training will increase the efficiency and effectiveness of communication in multinational team operations.
Bibliography �. Bennet, Milton J, ed. Basic
Concepts of Intercultural Communication. Selected Readings. Yarmouth, Maine: Intercultural Press, Inc., ����. Print.
2. Brown, D. Human Universals. New York: McGraw Hill, ����. Print.
3. Crossey, Mark “Improving Linguistic Interoperability” NATO Review n.p., 200�. Web. � Jan. 20�3
�. Febbraro, Angela R., and Brian McKee, and Sharon L. Riedel, ed. “Multinational Military Operations and Intercultural Factors” cso.nato.int NATO Science and Technology Organisation n.p, November 200�. Web. �� Dec. 20�2
�. Gudykunst, William B, ed. Cross-cultural and intercultural communication. Thousand Oaks, California: SAGE Publications inc., 2003. Print.
�. Hall, Edward T., and Mildred Reed Hall Understanding Cultural Differences. Yarmouth,
Maine: Intercultural Press, Inc., ���0. Print.
�. Hofstede, G. Culture’s consequences. International differences in work-related values. Newbury Park, CA: SAGE Publications inc. ���0. Print
---. Culture’s consequences (2nd ed). Thousand Oaks: Sage Publications inc. 200�. Print
---. Cultures and organizations: Software of the mind. New York: McGraw-Hill ����.Print.
�. Ivanov, Ivan P. Intercultural Education. Aksios, ����
�. Marin, Noemi “Teaching Romanian From a Communication Education Perspective,” Romanian Studies Association of America Newsletter, ��.2, December 2000,�-�.
�0. McFarland, Maxie “Military Cultural Education” Military Review n.p March –April 200�. Web. �2 Dec. 20�2
��. Minkov, M. Cultural Differences in a Globalizing World. Wagon Lane, Bingley: Emerald Group Publishing Ltd. 20��. Print
�2. Schmidt, Patrick L. In Search of Intercultural Understanding. Vienna, Austria: Meridian World Press, 200�. Print.
�3. Snider, D.M. “An uninformed debate on military culture.” Orbis, 43 (����), ��-2�. Web �� Feb. 20�3.
��. Soeters, J. L. and Ricardo Recht “Convergence or divergence in the multinational classroom? Experiences from the military.” International Journal of Intercultural Relations 2� (200�) : �23-��0. Web �� Feb. 20�3.
�� JOURNAL SCIENTIFIC AND APPLIED RESEARCH Vol. 3, 20�3JOURNAL SCIENTIFIC AND APPLIED RESEARCH Vol. 3, 20�3
Original Contribution
Journal scientific and applied research, vol. 3, 20�3 Association Scientific and Applied Research
International Journal ISSN �3��-�2��
RESEARCH OF MATHEMATICAL MODEL FOR OPERATIONS TO DETERMINE RISKS FOR PROTECTIONS OF CRITICAL
INFRASTRUCTURE
Lyubomir I. Pashov
MUNICIPAL COUNCIL OF SHUMEN
ABSTRACT: This work is a research of the mathematical model for operations to determine the risk to critical infrastructure protection. We introduce the concept of determined uncontrollable factors, providing an opportunity to differentiate some variables, which cannot be influenced by the operating party in any way. The random factors are considered known for their distribution function. Particular attention is paid to the mathematical models which are classified as dynamic or static, depending on their specific characteristic.
KEY WORDS: mathematical model; operations to determine the risk, critical
infrastructure protection Operation is any set of actions
aimed to achieve certain goal. The existence of a goal in an operation implies the existence of active participants striving to achieve that goal. The participants in an operation are frequently referred to as the operating party [�].
Operating party is any set of individuals striving to achieve the goal in an operation. When researching a certain operation, we see that apart from the operating party, there are other individuals involved, whose goals differentiate from the goal of the operation [2].
To be able to study the operations that determine the risk, we shall use a mathematical model as a basic tool. This model includes the so
called active resources (denoted as “a”) which are essentially the resources needed to carry out the operation. Any action aimed to reach the goal is a way of using the resource, and any way of using the active resources is called a strategy. The strategies are denoted with “X” where “X” can be a vector, number or function. Strategies are factors used to achieve the defined goal. These factors are controllable in general. However, in line with the controllable factors, there are also uncontrollable factors which could influence the operation progress. We shall denote those uncontrollable factors with “Y”, i.e. they form the environment in which the operation is carried out [�].
JOURNAL SCIENTIFIC AND APPLIED RESEARCH Vol. 3, 20�3
The description of each operation will end with the awareness of the operating party for the operation progress. Furthermore, the exchange of information between the separate components of the operating party is also of paramount importance for the decisions, actions and outcomes from the actions undertaken by those separate components. On the other hand, the uncontrollable factors can be divided into three groups as far as the availability of information for them is concerned: determined, random and undetermined.
The determined uncontrollable factors are composed of predetermined variables. The random uncontrollable factors can be determined by use of the distribution laws, while the undetermined uncontrollable factors are composed of undetermined or random variables for which we know only some sets of values or the class of possible distribution laws for these random variables.
The usefulness of the term “determined uncontrollable factors” comes from the fact that the operating party can determine variables which cannot be influenced by the party in any way. The random and undetermined uncontrollable factors cannot be influenced by the operating party either as the latter cannot determine their values which further complicates the operating party tasks. The random factors are known for their distributive function. When an operation is examined, much less is known about the undetermined uncontrollable factors but they still
remain a part of the investigation process. The operating party may receive additional information during or immediately before the start of an operation, which information fully eliminates the undetermined factor. The operation progress can be described by a set of time-dependent phase changes, E�(t); E2(t)... Ek(t). The conformity between the operation progress and the achievement of the goal as stipulated in the model is called efficiency and is denoted by “W”. Efficiency is a function of the phase changes, the strategies and the uncontrollable factors which can also be time-dependent. In the mathematical model, the goal of the operation is expressed by the extremes (maximum or minimum) of the efficiency.
When researching the model, we need to cover all important issues of an operation, including all significant factors that could influence the operation progress.
In the specialized literature there are different classifications of the mathematical modeling, but in general the existing models are divided into dynamic and static.
The dynamic models study the phenomena as a function of time. In other words, they try to describe the phenomena as realistically as possible. In most of the cases, however, it is perfectly enough to take into account the static model. In this case, the strategy and action are uncontrollable factors and are considered as a single act, the phase coordinates are not taken into account, while the efficiency is not
��JOURNAL SCIENTIFIC AND APPLIED RESEARCH Vol. 3, 20�3JOURNAL SCIENTIFIC AND APPLIED RESEARCH Vol. 3, 20�3
Original Contribution
Journal scientific and applied research, vol. 3, 20�3 Association Scientific and Applied Research
International Journal ISSN �3��-�2��
RESEARCH OF MATHEMATICAL MODEL FOR OPERATIONS TO DETERMINE RISKS FOR PROTECTIONS OF CRITICAL
INFRASTRUCTURE
Lyubomir I. Pashov
MUNICIPAL COUNCIL OF SHUMEN
ABSTRACT: This work is a research of the mathematical model for operations to determine the risk to critical infrastructure protection. We introduce the concept of determined uncontrollable factors, providing an opportunity to differentiate some variables, which cannot be influenced by the operating party in any way. The random factors are considered known for their distribution function. Particular attention is paid to the mathematical models which are classified as dynamic or static, depending on their specific characteristic.
KEY WORDS: mathematical model; operations to determine the risk, critical
infrastructure protection Operation is any set of actions
aimed to achieve certain goal. The existence of a goal in an operation implies the existence of active participants striving to achieve that goal. The participants in an operation are frequently referred to as the operating party [�].
Operating party is any set of individuals striving to achieve the goal in an operation. When researching a certain operation, we see that apart from the operating party, there are other individuals involved, whose goals differentiate from the goal of the operation [2].
To be able to study the operations that determine the risk, we shall use a mathematical model as a basic tool. This model includes the so
called active resources (denoted as “a”) which are essentially the resources needed to carry out the operation. Any action aimed to reach the goal is a way of using the resource, and any way of using the active resources is called a strategy. The strategies are denoted with “X” where “X” can be a vector, number or function. Strategies are factors used to achieve the defined goal. These factors are controllable in general. However, in line with the controllable factors, there are also uncontrollable factors which could influence the operation progress. We shall denote those uncontrollable factors with “Y”, i.e. they form the environment in which the operation is carried out [�].
JOURNAL SCIENTIFIC AND APPLIED RESEARCH Vol. 3, 20�3
The description of each operation will end with the awareness of the operating party for the operation progress. Furthermore, the exchange of information between the separate components of the operating party is also of paramount importance for the decisions, actions and outcomes from the actions undertaken by those separate components. On the other hand, the uncontrollable factors can be divided into three groups as far as the availability of information for them is concerned: determined, random and undetermined.
The determined uncontrollable factors are composed of predetermined variables. The random uncontrollable factors can be determined by use of the distribution laws, while the undetermined uncontrollable factors are composed of undetermined or random variables for which we know only some sets of values or the class of possible distribution laws for these random variables.
The usefulness of the term “determined uncontrollable factors” comes from the fact that the operating party can determine variables which cannot be influenced by the party in any way. The random and undetermined uncontrollable factors cannot be influenced by the operating party either as the latter cannot determine their values which further complicates the operating party tasks. The random factors are known for their distributive function. When an operation is examined, much less is known about the undetermined uncontrollable factors but they still
remain a part of the investigation process. The operating party may receive additional information during or immediately before the start of an operation, which information fully eliminates the undetermined factor. The operation progress can be described by a set of time-dependent phase changes, E�(t); E2(t)... Ek(t). The conformity between the operation progress and the achievement of the goal as stipulated in the model is called efficiency and is denoted by “W”. Efficiency is a function of the phase changes, the strategies and the uncontrollable factors which can also be time-dependent. In the mathematical model, the goal of the operation is expressed by the extremes (maximum or minimum) of the efficiency.
When researching the model, we need to cover all important issues of an operation, including all significant factors that could influence the operation progress.
In the specialized literature there are different classifications of the mathematical modeling, but in general the existing models are divided into dynamic and static.
The dynamic models study the phenomena as a function of time. In other words, they try to describe the phenomena as realistically as possible. In most of the cases, however, it is perfectly enough to take into account the static model. In this case, the strategy and action are uncontrollable factors and are considered as a single act, the phase coordinates are not taken into account, while the efficiency is not
�00 JOURNAL SCIENTIFIC AND APPLIED RESEARCH Vol. 3, 20�3JOURNAL SCIENTIFIC AND APPLIED RESEARCH Vol. 3, 20�3
considered only as a function of strategy and uncontrollable factors.
W=F(x,y) The research of an operation starts by building up of its static model. Sometimes it is not possible to clearly describe the efficiency as a function of strategy and uncontrollable factors.
In the general case, the strategy (X) in the static model is a function of the random and undetermined uncontrollable factors (Y). The model does not include any other unknown parameters. In many cases, the X(Y) dependency is denoted as X . The set of values in X is denoted as X and depends on the active means. In general, the strategy represents the set of possible uncontrollable factors Y in the set X. The set of the strategy X defined by the active means and the awareness of the operating party is called space of strategy and is denoted by X (mathematical expectation). Logically, it is possible to assume that
all strategies which do not depend on information about the uncontrollable factors also belong to X . The set of such constant strategies coincides with the set of the possible X values therefore it is also denoted as X. Consecutively, if the operating party excludes the additional information, the set of strategies will coincide with the X set. The X set is the poorest set of strategies possible.
So, in the static model, the efficiency criterion W is a function of X and Y:
W=F( X ,y) X = X .y.Y The static form of the operation
model W is used for calculating specific results and making certain conclusions.
Finally, it should be noted that the working hypothesis of this research has been proven by use of a mathematical model of the operations for risks assessment of critical infrastructure protection.
References:
[�] Botev B., Research of the Operations in Logistics. Lecture Course for the University of National and World Economy, Sofia, 20�2. [2] Tagarev, T., Pavlov, N. First National Scientific and Practical
Conference on the Emergency Management and Civil Protection Center for National Security and Defense Research – Bulgarian Academy of Science, Sofia, 200�.
JOURNAL SCIENTIFIC AND APPLIED RESEARCH Vol. 3, 20�3
Original Contribution
Journal scientific and applied research, vol. 3, 20�3 Association Scientific and Applied Research
International Journal ISSN �3��-�2��
RESEARCH OF THE CRITERIA FOR EFFICIENCY AND OPTIMALITY OF THE CRITICAL INFRASTRUCTURE PROTECTION
MANAGEMENT
Lyubomir I. Pashov
MUNICIPAL COUNCIL OF SHUMEN
ABSTRACT: In this work, the risk categories are investigated by use of efficiency criteria. For that purpose, the maximum value of each efficiency criterion is determined on grounds of the available determined uncontrollable factors. Particular attention is paid to the transition from quantitative criteria to qualitative criteria. The results from the research on the risks for the individual processes in infrastructure are represented graphically.
KEY WORDS: efficiency criteria, optimality, management, protection, critical infrastructure
The definition of efficiency
criteria in the process of operations research involves comparison of different risk categories and selection of the one that is most likely to occur. The risk categories are compared with each other by use of an efficiency criterion which has been introduced for the purpose. The model we use aims to establish the maximum value of the efficiency criterion. However, the efficiency criterion can be used when there are determined uncontrollable factors only. If there are random or undetermined uncontrollable factors, it will not be possible to compare the risk categories by use only of the efficiency criterion. To be able to compare the risk categories, they have to be expressed as values. All values defined over a set of risk categories
can be summarized as an efficiency estimate [�].
If we presume that there are only determined uncontrollable factors, then the efficiency criterion W will be a function only of X, since the determined uncontrollable factor Y0 is known to us. Indeed, W = F (X, Y0), so we can denote this function as f0_ (X). The f0_ (X) function can be used to estimate the risk category. When comparing two different risk categories, X� and X2, better will be the one which has a lesser value of the f0_ (X) function. Thus, we shall be able to determine the best or optimal risk category X0 for which f0_(X0) ≥ f0_(X),ХХ. If presume that the risk category depends on undetermined uncontrollable factors, then for each fixed category X* the efficiency criterion W = (X*,Y) will be a
�0�JOURNAL SCIENTIFIC AND APPLIED RESEARCH Vol. 3, 20�3JOURNAL SCIENTIFIC AND APPLIED RESEARCH Vol. 3, 20�3
considered only as a function of strategy and uncontrollable factors.
W=F(x,y) The research of an operation starts by building up of its static model. Sometimes it is not possible to clearly describe the efficiency as a function of strategy and uncontrollable factors.
In the general case, the strategy (X) in the static model is a function of the random and undetermined uncontrollable factors (Y). The model does not include any other unknown parameters. In many cases, the X(Y) dependency is denoted as X . The set of values in X is denoted as X and depends on the active means. In general, the strategy represents the set of possible uncontrollable factors Y in the set X. The set of the strategy X defined by the active means and the awareness of the operating party is called space of strategy and is denoted by X (mathematical expectation). Logically, it is possible to assume that
all strategies which do not depend on information about the uncontrollable factors also belong to X . The set of such constant strategies coincides with the set of the possible X values therefore it is also denoted as X. Consecutively, if the operating party excludes the additional information, the set of strategies will coincide with the X set. The X set is the poorest set of strategies possible.
So, in the static model, the efficiency criterion W is a function of X and Y:
W=F( X ,y) X = X .y.Y The static form of the operation
model W is used for calculating specific results and making certain conclusions.
Finally, it should be noted that the working hypothesis of this research has been proven by use of a mathematical model of the operations for risks assessment of critical infrastructure protection.
References:
[�] Botev B., Research of the Operations in Logistics. Lecture Course for the University of National and World Economy, Sofia, 20�2. [2] Tagarev, T., Pavlov, N. First National Scientific and Practical
Conference on the Emergency Management and Civil Protection Center for National Security and Defense Research – Bulgarian Academy of Science, Sofia, 200�.
JOURNAL SCIENTIFIC AND APPLIED RESEARCH Vol. 3, 20�3
Original Contribution
Journal scientific and applied research, vol. 3, 20�3 Association Scientific and Applied Research
International Journal ISSN �3��-�2��
RESEARCH OF THE CRITERIA FOR EFFICIENCY AND OPTIMALITY OF THE CRITICAL INFRASTRUCTURE PROTECTION
MANAGEMENT
Lyubomir I. Pashov
MUNICIPAL COUNCIL OF SHUMEN
ABSTRACT: In this work, the risk categories are investigated by use of efficiency criteria. For that purpose, the maximum value of each efficiency criterion is determined on grounds of the available determined uncontrollable factors. Particular attention is paid to the transition from quantitative criteria to qualitative criteria. The results from the research on the risks for the individual processes in infrastructure are represented graphically.
KEY WORDS: efficiency criteria, optimality, management, protection, critical infrastructure
The definition of efficiency
criteria in the process of operations research involves comparison of different risk categories and selection of the one that is most likely to occur. The risk categories are compared with each other by use of an efficiency criterion which has been introduced for the purpose. The model we use aims to establish the maximum value of the efficiency criterion. However, the efficiency criterion can be used when there are determined uncontrollable factors only. If there are random or undetermined uncontrollable factors, it will not be possible to compare the risk categories by use only of the efficiency criterion. To be able to compare the risk categories, they have to be expressed as values. All values defined over a set of risk categories
can be summarized as an efficiency estimate [�].
If we presume that there are only determined uncontrollable factors, then the efficiency criterion W will be a function only of X, since the determined uncontrollable factor Y0 is known to us. Indeed, W = F (X, Y0), so we can denote this function as f0_ (X). The f0_ (X) function can be used to estimate the risk category. When comparing two different risk categories, X� and X2, better will be the one which has a lesser value of the f0_ (X) function. Thus, we shall be able to determine the best or optimal risk category X0 for which f0_(X0) ≥ f0_(X),ХХ. If presume that the risk category depends on undetermined uncontrollable factors, then for each fixed category X* the efficiency criterion W = (X*,Y) will be a
�02 JOURNAL SCIENTIFIC AND APPLIED RESEARCH Vol. 3, 20�3JOURNAL SCIENTIFIC AND APPLIED RESEARCH Vol. 3, 20�3
function of the factor Y, and not a fixed number, so the efficiency cannot be estimated. Thus, each category will no longer correspond to a single value only, and the comparison of the risk categories by use of an efficiency criterion will bring uncertain results.
There are operations in which two different risk categories coexist and where X2 and F(X2,Y) > F(X�,Y) for each undetermined and uncontrollable factor.
In such case risk category X� is definitely worse than risk category X2. Such situations occur occasionally. In fact, efficiency estimate can be achieved in different ways. Efficiency estimate is calculated by the operating party. The efficiency together with the optimality is a part of the problem formulation when performing a research of the risk categories. We have to point out, that although interconnected the efficiency estimate and optimality of a risk category are not absolute values. Therefore, when we say that a rick category is optimal, we have to necessarily specify in what sense we understand optimality.
Selection of one or another efficiency estimate would depend on the involved uncontrollable factors. When an undetermined uncontrollable factor is a random variable and the distribution function for the factor is known, then the efficiency estimate shall be the mathematical expectation of the efficiency criterion resulting from the following expression:
□F(X,Y)G(dY) The function f0(X) =
□F(X,Y)G(dY) is an estimate in the
sense of an mean value of the risk category. The use of such estimate does not prevent the risk from achieving worse results in the progress of operation than the estimated mean value. Only numerous repetitions of an operation can give us grounds to conclude that the value of a certain risk category corresponds to the estimated mean value.
It is possible to research risk categories which are functions of random uncontrollable factors. To be able to estimate the efficiency In such cases, we can use the mathematical expectation f( X )=□F( X (Y),Y)G(dY). where the mean value of the probable distribution G(Y), X is the function of the random uncontrollable factor Y.
The estimate (mean) value will correspond to the optimal (mean) value:
f( X 0) ≥ f( X ), x X where X 0 is the optimal (mean) value in a set. Therefore, when the risk categories X are constant, then X0 is the optimal, i.e. mean value in the set of risk categories X, if
f(x0)≥ f(x),xХ In this case the random uncontrollable factor has two values. By use of the mathematical expectation definition of the estimate, i.e. the mean value of X� and X2 we get:
f(X�)=0,�.�0+0,�=�0=�0 f(X2)=0,0�+0,�.��0=��
Our goal is to minimize the risk category, so the X� risk category is better than X2. Due to the fact that there is no other risk category apart from X� and X2, we come to the conclusion that X� is more optimal, i.e. less risky.
JOURNAL SCIENTIFIC AND APPLIED RESEARCH Vol. 3, 20�3
When there are undetermined uncontrollable factors, we know only the set Y of the possible values of Y, so for the risk category X the criterion will have values within the [A,B] interval, where
A = minF(x,y) and B = maxF(x,y)
y = Y y = Y It is reasonable to accept A as an
efficiency estimate of X, i.e. Fr(X) = F(x,y)
y Y Such estimate is called
guaranteed efficiency estimate. With reference to this estimate, we shall introduce the term optimal risk category, i.e. X0, where:
Fr(X0) ≥ fr(X), x Х or min F(x0,y) ≥ min(x,y), x Х
y Y y Y By analogy, we shall introduce
the term guaranteed efficiency estimate and optimality in the sense of a guaranteed efficiency estimate of the risk categories x (y) of the uncontrollable factors:
fr(x) = minF(x (y),y) fr(x 0) ≥ fr(x ), x X
x X , y Y The value Fr(x) = maxmin
f(x,y) is called maximum guaranteed result over the set of x. By analogy, we introduce the function Fr(x).
Despite the challenges of the undisturbed factors, we have considered so far some general types of operations with a single efficiency criterion. In the more complex operations, the efficiency could not be characterized by a single efficiency criterion. For the cases when more than one efficiency criterion exists,
we shall introduce the term multi-criterion research of the risk categories. While defining (estimating) the risk categories, it is possible to have criteria for which we shall seek the maximum value, and others for which we shall seek the minimum value.
We shall introduce a single efficiency criterion W, which summarizes the remaining criteria W�, W2,… Wn and which we shall call convolution of criteria. The general expression of the convolution will be:
W0 = f (W�, W2, .... Wn), where f is an arbitrary function.
When we select efficiency criteria, we are subjective in our research. Therefore, by the introduction of the f function through which convolution of the various criteria is performed, we have a great variety which is generalized by W0.
We shall consider the most common way of convolution of the efficiency criteria – that of summarizing the criteria with coefficients. The general criterion W0 will be:
W0 =
n
i �λiWi,
where λi is weighed coefficient with the following condition: λi≥0, i=T,u
u
u
i �λi = 1
Transition from quantitative
criteria to qualitative criteria In this case for each criteria there
is a limit W0i, i= n,�
Then
W0={otherwise
niifWi0
,�,Wi,� 0
�03JOURNAL SCIENTIFIC AND APPLIED RESEARCH Vol. 3, 20�3JOURNAL SCIENTIFIC AND APPLIED RESEARCH Vol. 3, 20�3
function of the factor Y, and not a fixed number, so the efficiency cannot be estimated. Thus, each category will no longer correspond to a single value only, and the comparison of the risk categories by use of an efficiency criterion will bring uncertain results.
There are operations in which two different risk categories coexist and where X2 and F(X2,Y) > F(X�,Y) for each undetermined and uncontrollable factor.
In such case risk category X� is definitely worse than risk category X2. Such situations occur occasionally. In fact, efficiency estimate can be achieved in different ways. Efficiency estimate is calculated by the operating party. The efficiency together with the optimality is a part of the problem formulation when performing a research of the risk categories. We have to point out, that although interconnected the efficiency estimate and optimality of a risk category are not absolute values. Therefore, when we say that a rick category is optimal, we have to necessarily specify in what sense we understand optimality.
Selection of one or another efficiency estimate would depend on the involved uncontrollable factors. When an undetermined uncontrollable factor is a random variable and the distribution function for the factor is known, then the efficiency estimate shall be the mathematical expectation of the efficiency criterion resulting from the following expression:
□F(X,Y)G(dY) The function f0(X) =
□F(X,Y)G(dY) is an estimate in the
sense of an mean value of the risk category. The use of such estimate does not prevent the risk from achieving worse results in the progress of operation than the estimated mean value. Only numerous repetitions of an operation can give us grounds to conclude that the value of a certain risk category corresponds to the estimated mean value.
It is possible to research risk categories which are functions of random uncontrollable factors. To be able to estimate the efficiency In such cases, we can use the mathematical expectation f( X )=□F( X (Y),Y)G(dY). where the mean value of the probable distribution G(Y), X is the function of the random uncontrollable factor Y.
The estimate (mean) value will correspond to the optimal (mean) value:
f( X 0) ≥ f( X ), x X where X 0 is the optimal (mean) value in a set. Therefore, when the risk categories X are constant, then X0 is the optimal, i.e. mean value in the set of risk categories X, if
f(x0)≥ f(x),xХ In this case the random uncontrollable factor has two values. By use of the mathematical expectation definition of the estimate, i.e. the mean value of X� and X2 we get:
f(X�)=0,�.�0+0,�=�0=�0 f(X2)=0,0�+0,�.��0=��
Our goal is to minimize the risk category, so the X� risk category is better than X2. Due to the fact that there is no other risk category apart from X� and X2, we come to the conclusion that X� is more optimal, i.e. less risky.
JOURNAL SCIENTIFIC AND APPLIED RESEARCH Vol. 3, 20�3
When there are undetermined uncontrollable factors, we know only the set Y of the possible values of Y, so for the risk category X the criterion will have values within the [A,B] interval, where
A = minF(x,y) and B = maxF(x,y)
y = Y y = Y It is reasonable to accept A as an
efficiency estimate of X, i.e. Fr(X) = F(x,y)
y Y Such estimate is called
guaranteed efficiency estimate. With reference to this estimate, we shall introduce the term optimal risk category, i.e. X0, where:
Fr(X0) ≥ fr(X), x Х or min F(x0,y) ≥ min(x,y), x Х
y Y y Y By analogy, we shall introduce
the term guaranteed efficiency estimate and optimality in the sense of a guaranteed efficiency estimate of the risk categories x (y) of the uncontrollable factors:
fr(x) = minF(x (y),y) fr(x 0) ≥ fr(x ), x X
x X , y Y The value Fr(x) = maxmin
f(x,y) is called maximum guaranteed result over the set of x. By analogy, we introduce the function Fr(x).
Despite the challenges of the undisturbed factors, we have considered so far some general types of operations with a single efficiency criterion. In the more complex operations, the efficiency could not be characterized by a single efficiency criterion. For the cases when more than one efficiency criterion exists,
we shall introduce the term multi-criterion research of the risk categories. While defining (estimating) the risk categories, it is possible to have criteria for which we shall seek the maximum value, and others for which we shall seek the minimum value.
We shall introduce a single efficiency criterion W, which summarizes the remaining criteria W�, W2,… Wn and which we shall call convolution of criteria. The general expression of the convolution will be:
W0 = f (W�, W2, .... Wn), where f is an arbitrary function.
When we select efficiency criteria, we are subjective in our research. Therefore, by the introduction of the f function through which convolution of the various criteria is performed, we have a great variety which is generalized by W0.
We shall consider the most common way of convolution of the efficiency criteria – that of summarizing the criteria with coefficients. The general criterion W0 will be:
W0 =
n
i �λiWi,
where λi is weighed coefficient with the following condition: λi≥0, i=T,u
u
u
i �λi = 1
Transition from quantitative
criteria to qualitative criteria In this case for each criteria there
is a limit W0i, i= n,�
Then
W0={otherwise
niifWi0
,�,Wi,� 0
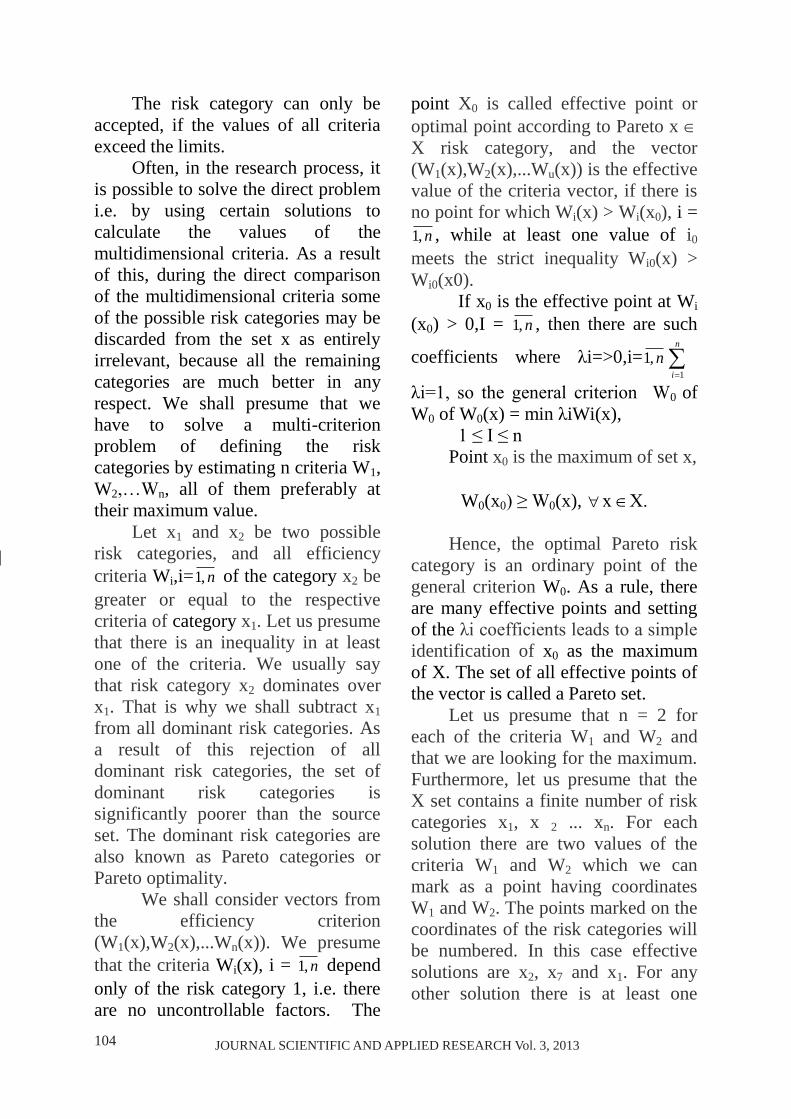
�0� JOURNAL SCIENTIFIC AND APPLIED RESEARCH Vol. 3, 20�3JOURNAL SCIENTIFIC AND APPLIED RESEARCH Vol. 3, 20�3
The risk category can only be accepted, if the values of all criteria exceed the limits.
Often, in the research process, it is possible to solve the direct problem i.e. by using certain solutions to calculate the values of the multidimensional criteria. As a result of this, during the direct comparison of the multidimensional criteria some of the possible risk categories may be discarded from the set x as entirely irrelevant, because all the remaining categories are much better in any respect. We shall presume that we have to solve a multi-criterion problem of defining the risk categories by estimating n criteria W�, W2,…Wn, all of them preferably at their maximum value.
Let x� and x2 be two possible risk categories, and all efficiency criteria Wi,i= n,� of the category x2 be greater or equal to the respective criteria of category x�. Let us presume that there is an inequality in at least one of the criteria. We usually say that risk category x2 dominates over x�. That is why we shall subtract x� from all dominant risk categories. As a result of this rejection of all dominant risk categories, the set of dominant risk categories is significantly poorer than the source set. The dominant risk categories are also known as Pareto categories or Pareto optimality.
We shall consider vectors from the efficiency criterion (W�(x),W2(x),...Wn(x)). We presume that the criteria Wi(x), i = n,� depend only of the risk category �, i.e. there are no uncontrollable factors. The
point X0 is called effective point or optimal point according to Pareto x X risk category, and the vector (W�(x),W2(x),...Wu(x)) is the effective value of the criteria vector, if there is no point for which Wi(x) > Wi(x0), i =
n,� , while at least one value of i0 meets the strict inequality Wi0(x) > Wi0(x0).
If x0 is the effective point at Wi (x0) > 0,I = n,� , then there are such
coefficients where λi=>0,i= n,�
n
i �
λi=1, so the general criterion W0 of W0 of W0(x) = min λiWi(x),
1 ≤ I ≤ n Point x0 is the maximum of set x,
W0(x0) ≥ W0(x), х Х.
Hence, the optimal Pareto risk category is an ordinary point of the general criterion W0. As a rule, there are many effective points and setting of the λi coefficients leads to a simple identification of x0 as the maximum of X. The set of all effective points of the vector is called a Pareto set.
Let us presume that n = 2 for each of the criteria W� and W2 and that we are looking for the maximum. Furthermore, let us presume that the X set contains a finite number of risk categories x�, x 2 ... xn. For each solution there are two values of the criteria W� and W2 which we can mark as a point having coordinates W� and W2. The points marked on the coordinates of the risk categories will be numbered. In this case effective solutions are x2, x� and x�. For any other solution there is at least one
JOURNAL SCIENTIFIC AND APPLIED RESEARCH Vol. 3, 20�3
dominant point for which either W�, or W2, or both are greater. The figure demonstrates that risk category x� is the best one under the W2 criterion, while x� is the best one under the W� criterion. When decision is to be taken, we shall choose of either x� or x� depending on which of the W� and W2 criteria is more adequate.
Thus, by rejecting of the risk categories dominated by the set x, we can select only the effective points.
The selection of an operation to minimize the risk category is manual operation. Only a man can compromise when selecting an operation in order to minimize the risk in view of the available effectiveness criteria.
Sometimes it is possible a decision-making procedure to be repeated on multiple occasions, which on the other hand provides an opportunity to develope some formal rules and reduce the risk categories without participation of the man when solving multi-criterion problems investigating the risk categories at various conditions. Based upon the collected statistics, we can find the coefficients λ1, λ2, ... λn of the general criterion W0 =
n
k �λkWk. A
coefficient depends on the conditions and the possible solutions. Therefore,
by use of the general efficiency criterion we can take decisions without human intervention.
In practice, we use a different approach to reduce a multi-criterion problem into a single-criterion one. We select one of the parameters W�, i = n,2 as a major one and have to find its maximum, while the remaining parameters should meet the condition W > Wi, i = n,2 . The selection of the minimums (lower limits) is in a way arbitrary.
We shall consider one more method for finding a compromise solution, namely the method of successive concessions. We presume, that the efficiency parameters Wi, i =
n,� are lined down in a decreasing importance order. Initially, we seek a solution which reaches its maximum at W�= W2
*, after which a concession from the maximum value of the parameter W� is made by Δ W� to find the maximum of the parameter W2 at the condition that W� > W�-Δ
* W�. Again, we make a concession from the parameter W2 by Δ W2 to find the maximum of the parameter W3. By this way of finding compromise solutions, we can see at what concession of one of the parameters we can find the maximum of the next parameter.
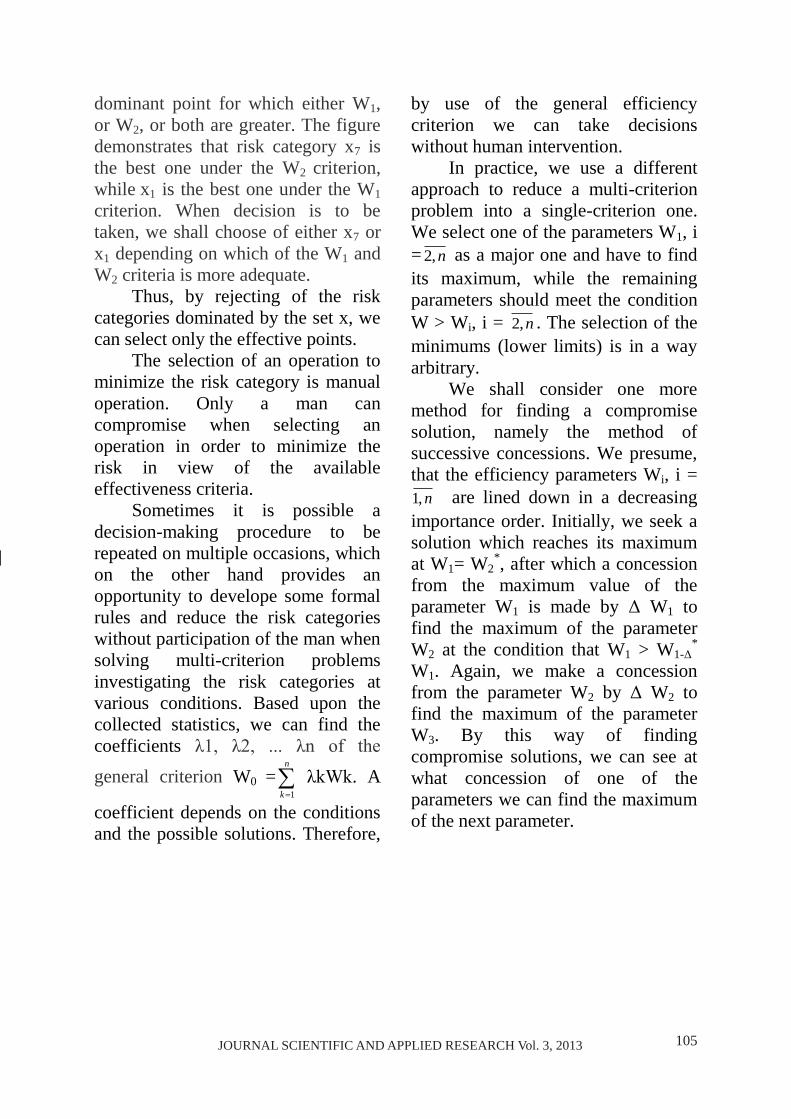
�0�JOURNAL SCIENTIFIC AND APPLIED RESEARCH Vol. 3, 20�3JOURNAL SCIENTIFIC AND APPLIED RESEARCH Vol. 3, 20�3
The risk category can only be accepted, if the values of all criteria exceed the limits.
Often, in the research process, it is possible to solve the direct problem i.e. by using certain solutions to calculate the values of the multidimensional criteria. As a result of this, during the direct comparison of the multidimensional criteria some of the possible risk categories may be discarded from the set x as entirely irrelevant, because all the remaining categories are much better in any respect. We shall presume that we have to solve a multi-criterion problem of defining the risk categories by estimating n criteria W�, W2,…Wn, all of them preferably at their maximum value.
Let x� and x2 be two possible risk categories, and all efficiency criteria Wi,i= n,� of the category x2 be greater or equal to the respective criteria of category x�. Let us presume that there is an inequality in at least one of the criteria. We usually say that risk category x2 dominates over x�. That is why we shall subtract x� from all dominant risk categories. As a result of this rejection of all dominant risk categories, the set of dominant risk categories is significantly poorer than the source set. The dominant risk categories are also known as Pareto categories or Pareto optimality.
We shall consider vectors from the efficiency criterion (W�(x),W2(x),...Wn(x)). We presume that the criteria Wi(x), i = n,� depend only of the risk category �, i.e. there are no uncontrollable factors. The
point X0 is called effective point or optimal point according to Pareto x X risk category, and the vector (W�(x),W2(x),...Wu(x)) is the effective value of the criteria vector, if there is no point for which Wi(x) > Wi(x0), i =
n,� , while at least one value of i0 meets the strict inequality Wi0(x) > Wi0(x0).
If x0 is the effective point at Wi (x0) > 0,I = n,� , then there are such
coefficients where λi=>0,i= n,�
n
i �
λi=1, so the general criterion W0 of W0 of W0(x) = min λiWi(x),
1 ≤ I ≤ n Point x0 is the maximum of set x,
W0(x0) ≥ W0(x), х Х.
Hence, the optimal Pareto risk category is an ordinary point of the general criterion W0. As a rule, there are many effective points and setting of the λi coefficients leads to a simple identification of x0 as the maximum of X. The set of all effective points of the vector is called a Pareto set.
Let us presume that n = 2 for each of the criteria W� and W2 and that we are looking for the maximum. Furthermore, let us presume that the X set contains a finite number of risk categories x�, x 2 ... xn. For each solution there are two values of the criteria W� and W2 which we can mark as a point having coordinates W� and W2. The points marked on the coordinates of the risk categories will be numbered. In this case effective solutions are x2, x� and x�. For any other solution there is at least one
JOURNAL SCIENTIFIC AND APPLIED RESEARCH Vol. 3, 20�3
dominant point for which either W�, or W2, or both are greater. The figure demonstrates that risk category x� is the best one under the W2 criterion, while x� is the best one under the W� criterion. When decision is to be taken, we shall choose of either x� or x� depending on which of the W� and W2 criteria is more adequate.
Thus, by rejecting of the risk categories dominated by the set x, we can select only the effective points.
The selection of an operation to minimize the risk category is manual operation. Only a man can compromise when selecting an operation in order to minimize the risk in view of the available effectiveness criteria.
Sometimes it is possible a decision-making procedure to be repeated on multiple occasions, which on the other hand provides an opportunity to develope some formal rules and reduce the risk categories without participation of the man when solving multi-criterion problems investigating the risk categories at various conditions. Based upon the collected statistics, we can find the coefficients λ1, λ2, ... λn of the general criterion W0 =
n
k �λkWk. A
coefficient depends on the conditions and the possible solutions. Therefore,
by use of the general efficiency criterion we can take decisions without human intervention.
In practice, we use a different approach to reduce a multi-criterion problem into a single-criterion one. We select one of the parameters W�, i = n,2 as a major one and have to find its maximum, while the remaining parameters should meet the condition W > Wi, i = n,2 . The selection of the minimums (lower limits) is in a way arbitrary.
We shall consider one more method for finding a compromise solution, namely the method of successive concessions. We presume, that the efficiency parameters Wi, i =
n,� are lined down in a decreasing importance order. Initially, we seek a solution which reaches its maximum at W�= W2
*, after which a concession from the maximum value of the parameter W� is made by Δ W� to find the maximum of the parameter W2 at the condition that W� > W�-Δ
* W�. Again, we make a concession from the parameter W2 by Δ W2 to find the maximum of the parameter W3. By this way of finding compromise solutions, we can see at what concession of one of the parameters we can find the maximum of the next parameter.
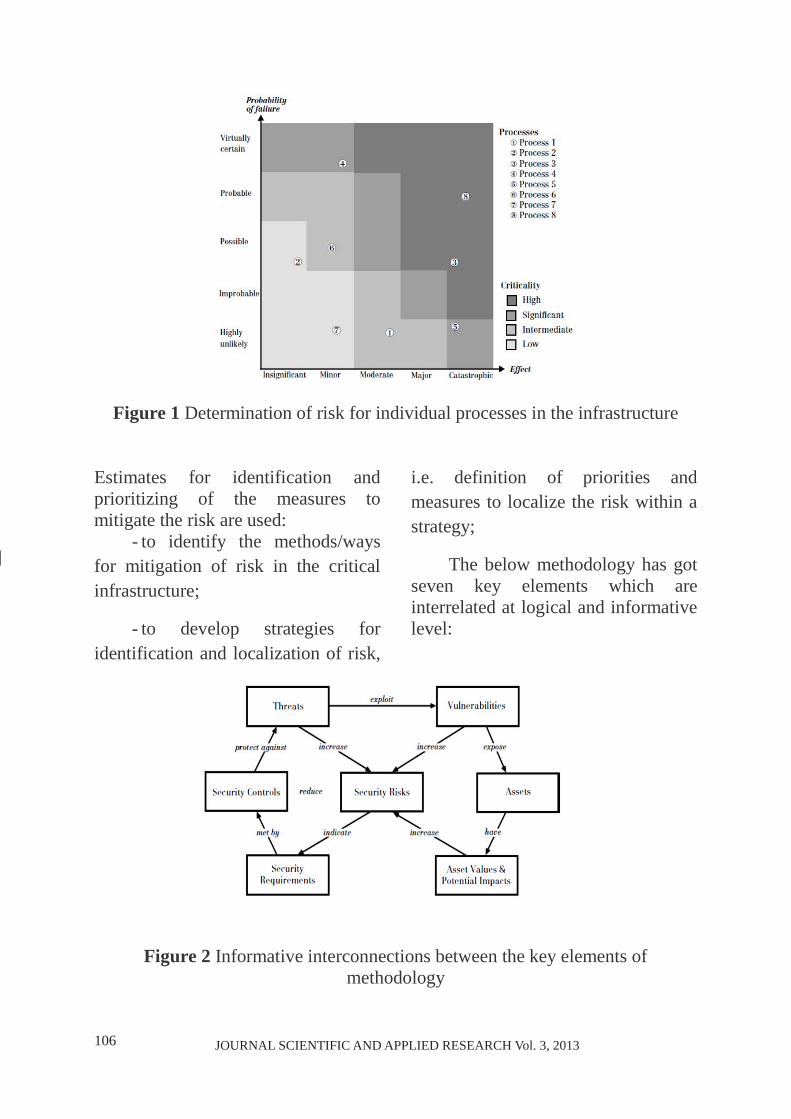
�0� JOURNAL SCIENTIFIC AND APPLIED RESEARCH Vol. 3, 20�3JOURNAL SCIENTIFIC AND APPLIED RESEARCH Vol. 3, 20�3
Figure 1 Determination of risk for individual processes in the infrastructure
Estimates for identification and prioritizing of the measures to mitigate the risk are used:
- to identify the methods/ways for mitigation of risk in the critical infrastructure;
- to develop strategies for identification and localization of risk,
i.e. definition of priorities and measures to localize the risk within a strategy;
The below methodology has got seven key elements which are interrelated at logical and informative level:
Figure 2 Informative interconnections between the key elements of methodology
JOURNAL SCIENTIFIC AND APPLIED RESEARCH Vol. 3, 20�3
The analytical activities concerning the planning of critical infrastructure protection are
performed cyclically within the limits of a single process
Figure 3 The Critical Infrastructure Protection Process
Finally, we would like to note, that in view of the growth of terrorism worldwide, the critical infrastructure that deserves special attention in terms of security is that of the energy sector because its vulnerability to
terrorist attacks. The critical infrastructure marking is very important [3], taking into account the increased number of breakdown cases, the adverse weather conditions and natural disasters.
References: [�] Botev B., Research of the Operations in Logistics. Lecture Course for the University of National and World Economy, Sofia, 20�2. [2] Tagarev, T., Pavlov, N., First National Scientific and Practical Conference on the Emergency Management and Civil Protection
Center for National Security and Defense Research – Bulgarian Academy of Science, Sofia, 200�. [3] Muller-Krenner, S., Zabanova, Y., Security in the Energy Sector – Redrawing the World, http://worldenergy.ru/doc_20_2�_2��.htmi, 20�2.
�0�JOURNAL SCIENTIFIC AND APPLIED RESEARCH Vol. 3, 20�3JOURNAL SCIENTIFIC AND APPLIED RESEARCH Vol. 3, 20�3
Figure 1 Determination of risk for individual processes in the infrastructure
Estimates for identification and prioritizing of the measures to mitigate the risk are used:
- to identify the methods/ways for mitigation of risk in the critical infrastructure;
- to develop strategies for identification and localization of risk,
i.e. definition of priorities and measures to localize the risk within a strategy;
The below methodology has got seven key elements which are interrelated at logical and informative level:
Figure 2 Informative interconnections between the key elements of methodology
JOURNAL SCIENTIFIC AND APPLIED RESEARCH Vol. 3, 20�3
The analytical activities concerning the planning of critical infrastructure protection are
performed cyclically within the limits of a single process
Figure 3 The Critical Infrastructure Protection Process
Finally, we would like to note, that in view of the growth of terrorism worldwide, the critical infrastructure that deserves special attention in terms of security is that of the energy sector because its vulnerability to
terrorist attacks. The critical infrastructure marking is very important [3], taking into account the increased number of breakdown cases, the adverse weather conditions and natural disasters.
References: [�] Botev B., Research of the Operations in Logistics. Lecture Course for the University of National and World Economy, Sofia, 20�2. [2] Tagarev, T., Pavlov, N., First National Scientific and Practical Conference on the Emergency Management and Civil Protection
Center for National Security and Defense Research – Bulgarian Academy of Science, Sofia, 200�. [3] Muller-Krenner, S., Zabanova, Y., Security in the Energy Sector – Redrawing the World, http://worldenergy.ru/doc_20_2�_2��.htmi, 20�2.
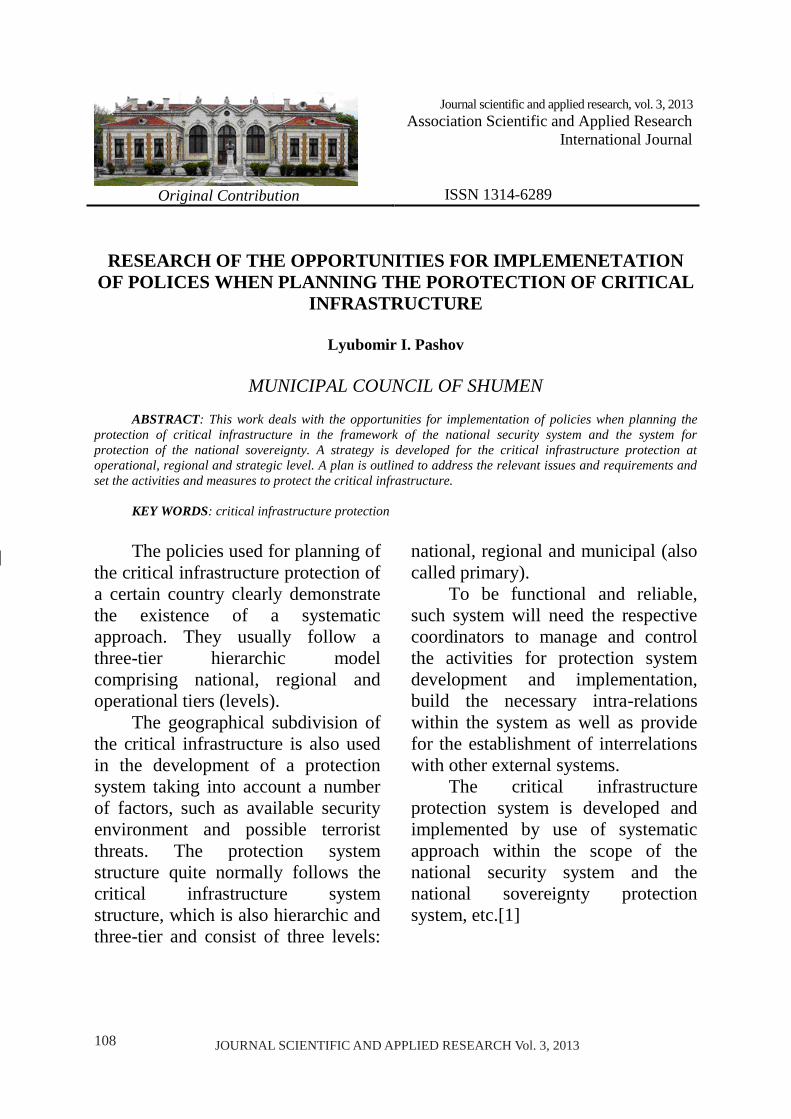
�0� JOURNAL SCIENTIFIC AND APPLIED RESEARCH Vol. 3, 20�3JOURNAL SCIENTIFIC AND APPLIED RESEARCH Vol. 3, 20�3
Original Contribution
Journal scientific and applied research, vol. 3, 20�3 Association Scientific and Applied Research
International Journal ISSN �3��-�2��
RESEARCH OF THE OPPORTUNITIES FOR IMPLEMENETATION
OF POLICES WHEN PLANNING THE POROTECTION OF CRITICAL INFRASTRUCTURE
Lyubomir I. Pashov
MUNICIPAL COUNCIL OF SHUMEN
ABSTRACT: This work deals with the opportunities for implementation of policies when planning the
protection of critical infrastructure in the framework of the national security system and the system for protection of the national sovereignty. A strategy is developed for the critical infrastructure protection at operational, regional and strategic level. A plan is outlined to address the relevant issues and requirements and set the activities and measures to protect the critical infrastructure.
KEY WORDS: critical infrastructure protection
The policies used for planning of the critical infrastructure protection of a certain country clearly demonstrate the existence of a systematic approach. They usually follow a three-tier hierarchic model comprising national, regional and operational tiers (levels).
The geographical subdivision of the critical infrastructure is also used in the development of a protection system taking into account a number of factors, such as available security environment and possible terrorist threats. The protection system structure quite normally follows the critical infrastructure system structure, which is also hierarchic and three-tier and consist of three levels:
national, regional and municipal (also called primary).
To be functional and reliable, such system will need the respective coordinators to manage and control the activities for protection system development and implementation, build the necessary intra-relations within the system as well as provide for the establishment of interrelations with other external systems.
The critical infrastructure protection system is developed and implemented by use of systematic approach within the scope of the national security system and the national sovereignty protection system, etc.[�]
JOURNAL SCIENTIFIC AND APPLIED RESEARCH Vol. 3, 20�3
Figure 1 An Example for development of a critical infrastructure model for the Shumen Region
The system behavior will depend
on the interactions among the separate components within the system structure. The feedback provides for the system stability and is carried out through the risk management at all three tiers: operational, regional and strategic. The system itself is established “from the bottom upwards”.
The system functioning depends greatly on the information exchange
and processing. The used structure suggests that the information is communicated “from the bottom upwards”. This facilitates the instructions giving process which takes place “from top downwards” and is based upon identification of all existing components at operational level, security risks assessment and planning. This ensures coordination of the risk management activities at all levels.
To be able to describe the system, we have to identify its levels:
�. Operational level. The system operation is performed at separate sectors which are further divided into their primary units. This allows performance of objective risk assessment and localization of the values of each risk category thus making them easily manageable in terms of planning and control. The accurate assessment at that level
ensures preparation and undertaking of the correct measures to protect each component of the critical infrastructure.
The interactions at operational level are organized by the head of the respective administration or institution which operates the respective critical infrastructure component. It includes coordination of the available resources in terms of object, place, time and protection measures.
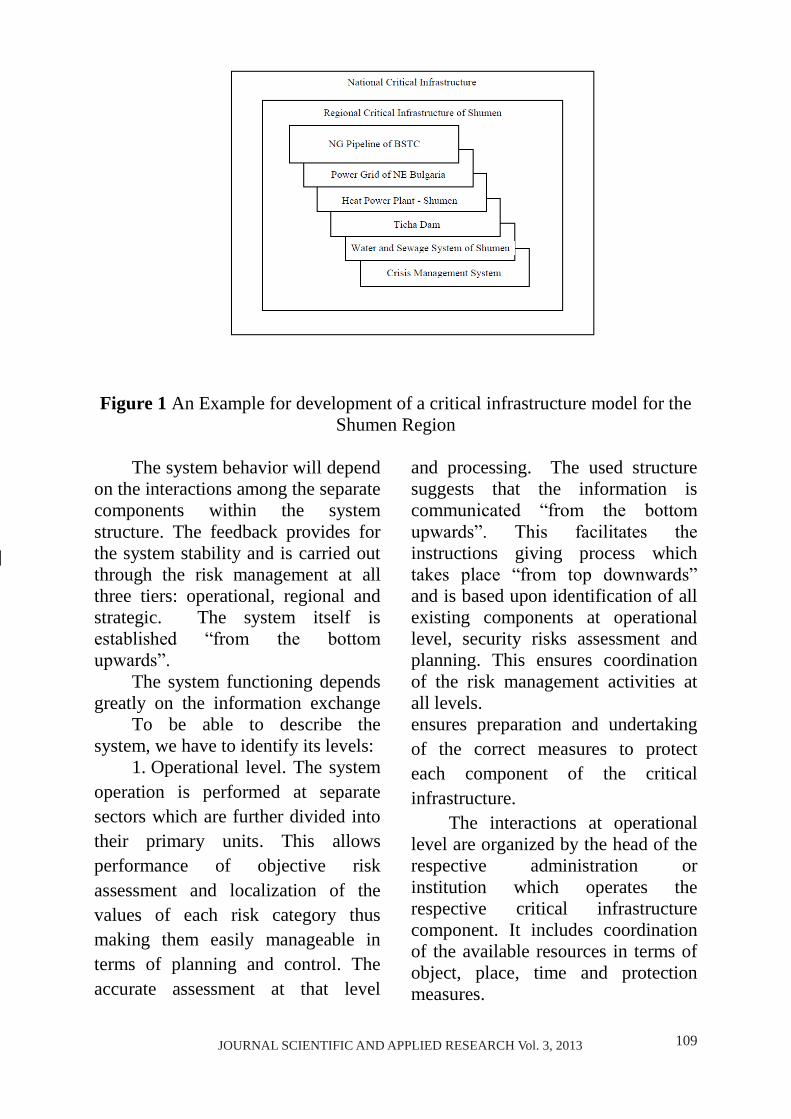
�0�JOURNAL SCIENTIFIC AND APPLIED RESEARCH Vol. 3, 20�3JOURNAL SCIENTIFIC AND APPLIED RESEARCH Vol. 3, 20�3
Original Contribution
Journal scientific and applied research, vol. 3, 20�3 Association Scientific and Applied Research
International Journal ISSN �3��-�2��
RESEARCH OF THE OPPORTUNITIES FOR IMPLEMENETATION
OF POLICES WHEN PLANNING THE POROTECTION OF CRITICAL INFRASTRUCTURE
Lyubomir I. Pashov
MUNICIPAL COUNCIL OF SHUMEN
ABSTRACT: This work deals with the opportunities for implementation of policies when planning the
protection of critical infrastructure in the framework of the national security system and the system for protection of the national sovereignty. A strategy is developed for the critical infrastructure protection at operational, regional and strategic level. A plan is outlined to address the relevant issues and requirements and set the activities and measures to protect the critical infrastructure.
KEY WORDS: critical infrastructure protection
The policies used for planning of the critical infrastructure protection of a certain country clearly demonstrate the existence of a systematic approach. They usually follow a three-tier hierarchic model comprising national, regional and operational tiers (levels).
The geographical subdivision of the critical infrastructure is also used in the development of a protection system taking into account a number of factors, such as available security environment and possible terrorist threats. The protection system structure quite normally follows the critical infrastructure system structure, which is also hierarchic and three-tier and consist of three levels:
national, regional and municipal (also called primary).
To be functional and reliable, such system will need the respective coordinators to manage and control the activities for protection system development and implementation, build the necessary intra-relations within the system as well as provide for the establishment of interrelations with other external systems.
The critical infrastructure protection system is developed and implemented by use of systematic approach within the scope of the national security system and the national sovereignty protection system, etc.[�]
JOURNAL SCIENTIFIC AND APPLIED RESEARCH Vol. 3, 20�3
Figure 1 An Example for development of a critical infrastructure model for the Shumen Region
The system behavior will depend
on the interactions among the separate components within the system structure. The feedback provides for the system stability and is carried out through the risk management at all three tiers: operational, regional and strategic. The system itself is established “from the bottom upwards”.
The system functioning depends greatly on the information exchange
and processing. The used structure suggests that the information is communicated “from the bottom upwards”. This facilitates the instructions giving process which takes place “from top downwards” and is based upon identification of all existing components at operational level, security risks assessment and planning. This ensures coordination of the risk management activities at all levels.
To be able to describe the system, we have to identify its levels:
�. Operational level. The system operation is performed at separate sectors which are further divided into their primary units. This allows performance of objective risk assessment and localization of the values of each risk category thus making them easily manageable in terms of planning and control. The accurate assessment at that level
ensures preparation and undertaking of the correct measures to protect each component of the critical infrastructure.
The interactions at operational level are organized by the head of the respective administration or institution which operates the respective critical infrastructure component. It includes coordination of the available resources in terms of object, place, time and protection measures.
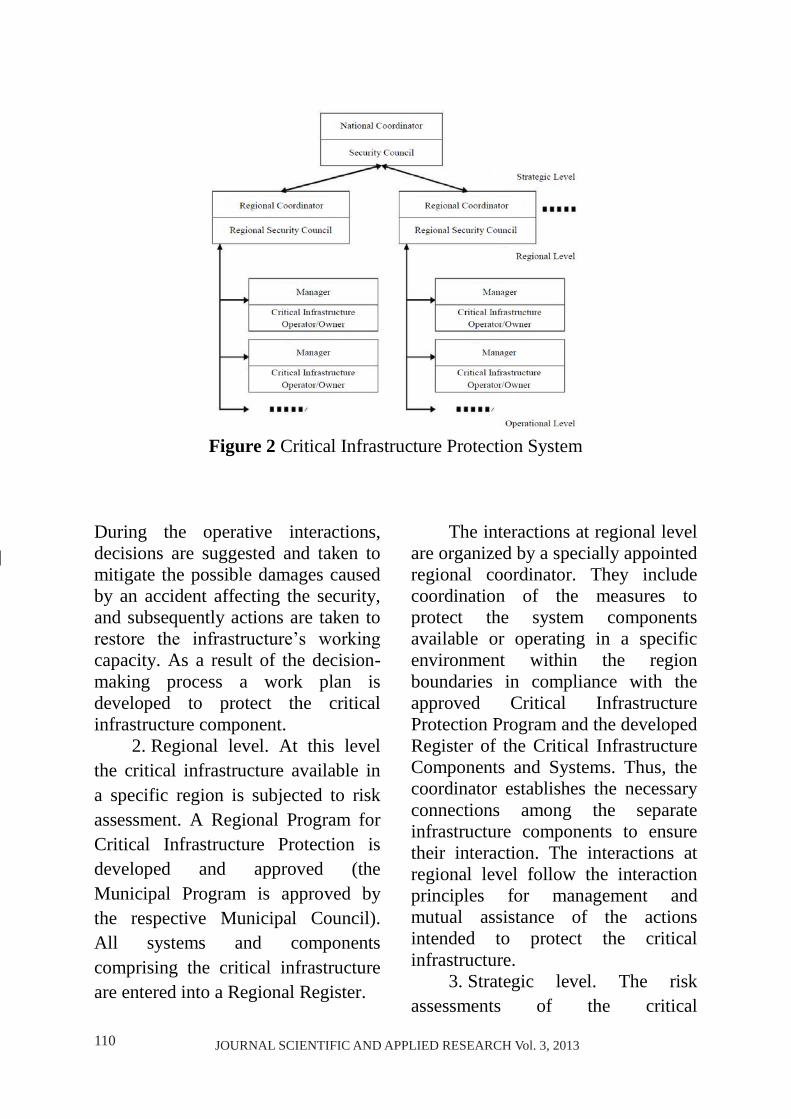
��0 JOURNAL SCIENTIFIC AND APPLIED RESEARCH Vol. 3, 20�3JOURNAL SCIENTIFIC AND APPLIED RESEARCH Vol. 3, 20�3
Figure 2 Critical Infrastructure Protection System
During the operative interactions, decisions are suggested and taken to mitigate the possible damages caused by an accident affecting the security, and subsequently actions are taken to restore the infrastructure’s working capacity. As a result of the decision-making process a work plan is developed to protect the critical infrastructure component.
2. Regional level. At this level the critical infrastructure available in a specific region is subjected to risk assessment. A Regional Program for Critical Infrastructure Protection is developed and approved (the Municipal Program is approved by the respective Municipal Council). All systems and components comprising the critical infrastructure are entered into a Regional Register.
The interactions at regional level are organized by a specially appointed regional coordinator. They include coordination of the measures to protect the system components available or operating in a specific environment within the region boundaries in compliance with the approved Critical Infrastructure Protection Program and the developed Register of the Critical Infrastructure Components and Systems. Thus, the coordinator establishes the necessary connections among the separate infrastructure components to ensure their interaction. The interactions at regional level follow the interaction principles for management and mutual assistance of the actions intended to protect the critical infrastructure.
3. Strategic level. The risk assessments of the critical
JOURNAL SCIENTIFIC AND APPLIED RESEARCH Vol. 3, 20�3
infrastructure nationwide are summarized at the highest national (strategic) level. A National Program and Annual National Plans for protection of the critical infrastructure are developed on grounds of the data available in the critical infrastructure registers. At this level, the critical infrastructure protection system is composed in its entirety.
The interactions at national level are organized by a national coordinator. They include harmonization of the internal efforts to protect the critical infrastructure and coordination of the aid provided by other national security systems to ensure the critical infrastructure protection. At this level the protective measures and actions to be taken by the ministries and organizations involved in the provision of the national security are agreed. At strategic (national) level, the separate regional critical infrastructure systems establish connections with each other and with the national critical infrastructure system. Connections are built also between the national critical infrastructure system and the other systems ensuring the national security. Where necessary plans are developed to implement new approaches for protection of the critical infrastructure components subjected to an increased risk.
The system established in the above way provides feedback among all levels and ensures its reliability in general. Substantially, the feedback in all three levels of the critical
infrastructure protection system is carried out periodically through risk assessments which cover certain periods of time. The risk assessment results are used for adjustment of the system to make it compliant with the existing environment and the selected strategy.
The system is directed towards protection of specific components against certain threats to achieve acceptable levels of the risks for these elements. Establishment of horizontal and vertical interconnections aims to maintain and coordinate the preventive actions and avoid omissions or repetition of functions or responsibilities.
The policies connected with the planning of critical infrastructure protection represent a recurring process which assesses the actions and measures to be taken with reference to the assets, or against the treats, vulnerabilities or the various categories of risk. The planning aims to define the actions for prevention of vulnerabilities and mitigation of risks.
The planning process results in development of a plan for protection of the critical infrastructure components at regional and national level. The plans should take into account and provide instructions, protective measures and actions to cope with the expected threats. Any such instructions shall be based upon the analysis of the former experience and further expanded, modified and integrated in such a way to adequately address and mitigate the modern threats. The instructions and measures shall be introduced via rules
���JOURNAL SCIENTIFIC AND APPLIED RESEARCH Vol. 3, 20�3JOURNAL SCIENTIFIC AND APPLIED RESEARCH Vol. 3, 20�3
Figure 2 Critical Infrastructure Protection System
During the operative interactions, decisions are suggested and taken to mitigate the possible damages caused by an accident affecting the security, and subsequently actions are taken to restore the infrastructure’s working capacity. As a result of the decision-making process a work plan is developed to protect the critical infrastructure component.
2. Regional level. At this level the critical infrastructure available in a specific region is subjected to risk assessment. A Regional Program for Critical Infrastructure Protection is developed and approved (the Municipal Program is approved by the respective Municipal Council). All systems and components comprising the critical infrastructure are entered into a Regional Register.
The interactions at regional level are organized by a specially appointed regional coordinator. They include coordination of the measures to protect the system components available or operating in a specific environment within the region boundaries in compliance with the approved Critical Infrastructure Protection Program and the developed Register of the Critical Infrastructure Components and Systems. Thus, the coordinator establishes the necessary connections among the separate infrastructure components to ensure their interaction. The interactions at regional level follow the interaction principles for management and mutual assistance of the actions intended to protect the critical infrastructure.
3. Strategic level. The risk assessments of the critical
JOURNAL SCIENTIFIC AND APPLIED RESEARCH Vol. 3, 20�3
infrastructure nationwide are summarized at the highest national (strategic) level. A National Program and Annual National Plans for protection of the critical infrastructure are developed on grounds of the data available in the critical infrastructure registers. At this level, the critical infrastructure protection system is composed in its entirety.
The interactions at national level are organized by a national coordinator. They include harmonization of the internal efforts to protect the critical infrastructure and coordination of the aid provided by other national security systems to ensure the critical infrastructure protection. At this level the protective measures and actions to be taken by the ministries and organizations involved in the provision of the national security are agreed. At strategic (national) level, the separate regional critical infrastructure systems establish connections with each other and with the national critical infrastructure system. Connections are built also between the national critical infrastructure system and the other systems ensuring the national security. Where necessary plans are developed to implement new approaches for protection of the critical infrastructure components subjected to an increased risk.
The system established in the above way provides feedback among all levels and ensures its reliability in general. Substantially, the feedback in all three levels of the critical
infrastructure protection system is carried out periodically through risk assessments which cover certain periods of time. The risk assessment results are used for adjustment of the system to make it compliant with the existing environment and the selected strategy.
The system is directed towards protection of specific components against certain threats to achieve acceptable levels of the risks for these elements. Establishment of horizontal and vertical interconnections aims to maintain and coordinate the preventive actions and avoid omissions or repetition of functions or responsibilities.
The policies connected with the planning of critical infrastructure protection represent a recurring process which assesses the actions and measures to be taken with reference to the assets, or against the treats, vulnerabilities or the various categories of risk. The planning aims to define the actions for prevention of vulnerabilities and mitigation of risks.
The planning process results in development of a plan for protection of the critical infrastructure components at regional and national level. The plans should take into account and provide instructions, protective measures and actions to cope with the expected threats. Any such instructions shall be based upon the analysis of the former experience and further expanded, modified and integrated in such a way to adequately address and mitigate the modern threats. The instructions and measures shall be introduced via rules
��2 JOURNAL SCIENTIFIC AND APPLIED RESEARCH Vol. 3, 20�3JOURNAL SCIENTIFIC AND APPLIED RESEARCH Vol. 3, 20�3
of behavior and procedures for coordination the critical infrastructure protection.
Planning and coordination of the critical infrastructure protection shall be done simultaneously at all three system levels to achieve improved efficiency of the decision-taking process based upon the correct identification of the risks concerning a specific critical infrastructure component.
Based upon the risk assessment results and the devised risk management activities, an Action Plan is developed (Critical Infrastructure Protection Plan, National Program and Annual Action Plans for Protection of the Critical Infrastructure).
An action plan contents will depend on the level concerned. To harmonize the plans at all levels, they have to address the following general matters and requirements to be able to facilitate the adequate management and control of the activities connected with the critical infrastructure protection:
�. Getting acquainted with the situation: Threat analysis and expected
occurrence; Type and location of the critical
infrastructure components which are taken from the Critical Infrastructure Register.
Objects and organizations located in close vicinity to the components of the critical infrastructure.
2. Organization of the critical infrastructure protection depending on the level of management: Development of a protection
concept depending on the decision making level;
Definition of the measures and resources depending on the critical infrastructure level;
Dislocation of the measures and resources, definition of the scope of responsibilities, development of action plans for the different protection levels. 3. Provision of the means and
resources necessary to maintain the critical infrastructure working capacity and ensure the workability of the protective measures.
�. Management. It includes the order of notification and reporting of the situation; the decision taking according to the action plan; the procedures to be followed and the security measures to be applied and consecutively, the actions to be taken.
By application of the critical infrastructure protection plan the specific conditions concerning the critical infrastructure are addressed.
For that purpose, the following measures and activities can be taken depending on the level of protection of the critical infrastructure:
�. Definition of the security zones. The plan may foresee various measures, procedures or actions for the different zones. These will depend
JOURNAL SCIENTIFIC AND APPLIED RESEARCH Vol. 3, 20�3
on the risk assessment, zones location and the interrelations between them.
2. Coordination of the measures introduced in zones with various specifications in terms of vulnerability and security.
3. Definition of the organizational structure at different levels which must ensure the critical infrastructure protection.
As a result of the analysis of the above basic parameters, it is recommendable the protection plan for the single components of the critical infrastructure to define the interactions between the separate structures and their scope of responsibility in compliance with the legislative requirements for the specific institution. The plan should specify the interaction mechanisms between the separate authorities involved in the access control, including building of data links between the information and security systems of these authorities to provide complete check-up prior to granting of access. The critical infrastructure protection plan should be accompanied by an action plan to be
activated in case of accidents The action plan should contain different scenarios based upon the results from the risk assessment analysis and should stipulate the actions to be taken by the various resources in case of an accident. It should also define the recovery measures which will be needed to restore the critical infrastructure component’s normal operation.
In conclusion we should note that the policies for critical infrastructure protection planning should be compliant with the requirements of the complex systems theory and the management theory. The correct application of the policies must provide for the establishment of an effective protection system through optimal use of the protective means and mechanisms of the government, the critical infrastructure owners and operators organized in a complex system at one hand and the application of the Crisis Management Act requirements on the other, which regulate the horizontal and vertical interactions of the governmental authorities (with their central and local structures).
References: [�] Mednikarov D., Dimitrov N., Second Scientific and Practical Conference on the Emergency Management and Civil Protection –
Approaches in Planning of the Maritime Critical Infrastructure, Sofia, Bulgarian Academy of Science, 200�.
��3JOURNAL SCIENTIFIC AND APPLIED RESEARCH Vol. 3, 20�3JOURNAL SCIENTIFIC AND APPLIED RESEARCH Vol. 3, 20�3
of behavior and procedures for coordination the critical infrastructure protection.
Planning and coordination of the critical infrastructure protection shall be done simultaneously at all three system levels to achieve improved efficiency of the decision-taking process based upon the correct identification of the risks concerning a specific critical infrastructure component.
Based upon the risk assessment results and the devised risk management activities, an Action Plan is developed (Critical Infrastructure Protection Plan, National Program and Annual Action Plans for Protection of the Critical Infrastructure).
An action plan contents will depend on the level concerned. To harmonize the plans at all levels, they have to address the following general matters and requirements to be able to facilitate the adequate management and control of the activities connected with the critical infrastructure protection:
�. Getting acquainted with the situation: Threat analysis and expected
occurrence; Type and location of the critical
infrastructure components which are taken from the Critical Infrastructure Register.
Objects and organizations located in close vicinity to the components of the critical infrastructure.
2. Organization of the critical infrastructure protection depending on the level of management: Development of a protection
concept depending on the decision making level;
Definition of the measures and resources depending on the critical infrastructure level;
Dislocation of the measures and resources, definition of the scope of responsibilities, development of action plans for the different protection levels. 3. Provision of the means and
resources necessary to maintain the critical infrastructure working capacity and ensure the workability of the protective measures.
�. Management. It includes the order of notification and reporting of the situation; the decision taking according to the action plan; the procedures to be followed and the security measures to be applied and consecutively, the actions to be taken.
By application of the critical infrastructure protection plan the specific conditions concerning the critical infrastructure are addressed.
For that purpose, the following measures and activities can be taken depending on the level of protection of the critical infrastructure:
�. Definition of the security zones. The plan may foresee various measures, procedures or actions for the different zones. These will depend
JOURNAL SCIENTIFIC AND APPLIED RESEARCH Vol. 3, 20�3
on the risk assessment, zones location and the interrelations between them.
2. Coordination of the measures introduced in zones with various specifications in terms of vulnerability and security.
3. Definition of the organizational structure at different levels which must ensure the critical infrastructure protection.
As a result of the analysis of the above basic parameters, it is recommendable the protection plan for the single components of the critical infrastructure to define the interactions between the separate structures and their scope of responsibility in compliance with the legislative requirements for the specific institution. The plan should specify the interaction mechanisms between the separate authorities involved in the access control, including building of data links between the information and security systems of these authorities to provide complete check-up prior to granting of access. The critical infrastructure protection plan should be accompanied by an action plan to be
activated in case of accidents The action plan should contain different scenarios based upon the results from the risk assessment analysis and should stipulate the actions to be taken by the various resources in case of an accident. It should also define the recovery measures which will be needed to restore the critical infrastructure component’s normal operation.
In conclusion we should note that the policies for critical infrastructure protection planning should be compliant with the requirements of the complex systems theory and the management theory. The correct application of the policies must provide for the establishment of an effective protection system through optimal use of the protective means and mechanisms of the government, the critical infrastructure owners and operators organized in a complex system at one hand and the application of the Crisis Management Act requirements on the other, which regulate the horizontal and vertical interactions of the governmental authorities (with their central and local structures).
References: [�] Mednikarov D., Dimitrov N., Second Scientific and Practical Conference on the Emergency Management and Civil Protection –
Approaches in Planning of the Maritime Critical Infrastructure, Sofia, Bulgarian Academy of Science, 200�.
��� JOURNAL SCIENTIFIC AND APPLIED RESEARCH Vol. 3, 20�3JOURNAL SCIENTIFIC AND APPLIED RESEARCH Vol. 3, 20�3
Original Contribution
Journal scientific and applied research, vol. 3, 20�3 Association Scientific and Applied Research
International Journal ISSN �3��-�2��
A TAXONOMY OF THE CYBER ATTACKS
Petar K. Boyanov
DEPARTMENT OF COMMUNICATION AND COMPUTER TECHNIQUES, FACULTY OF TECHNICAL SCIENCES, KONSTANTIN PRESLAVSKY UNIVERSITY OF SHUMEN
E-MAIL: [email protected]
ABSTRACT: In this paper is made a sophisticated taxonomy of the malicious cyber attacks. The cyber attacks are summarized into several mainly types with additional subtypes for everyone attack. Thanks to the achieved comparative results in this paper many users can find and analyze different flaws and vulnerabilities in their computer and network systems and thereby they could detect and prevent future malicious cyber attacks. KEY WORDS: Cyber attacks, Vulnerabilities, Unauthorized access, Computer and network security, Taxonomy.
1. Introduction Most of the accomplished cyber
crimes are based on the flaws and vulnerabilities in computer and network systems. Thereby the smart knowledge of the cyber criminals find a way to implement and exploit dangerous malicious computer and network attacks, which cause irreparable damages to the important and confidential computer and network resources [�] - [30].
Previous technical papers presented different methodologies and taxonomies in order to explain and describe the different cyber attack types and the purpose of this paper was to analyze and summarize the different cyber attack classifications in order to achieve comparative results, which could cause an useful influence for the network
administrators, software programmers and users in the process of detecting and preventing future cyber attacks [�] - [30].
This paper is structured as follows. First, in section 2, the relative analyzes and performances of the malicious cyber attack taxonomies are compared. After that, in section 3, a sophisticated cyber attack taxonomy is composed. The advantages and limitations of the achieved final cyber attack classification as well as the upcoming future work are concluded in section �.
2. A relative analysis and performances of the malicious cyber attack taxonomies
Retaining computer and network security against cyber attacks is a serious problem, that constantly
JOURNAL SCIENTIFIC AND APPLIED RESEARCH Vol. 3, 20�3
causes huge damages such as stealing login credentials of the users, unauthorized electronic money drawing from the credit cards, malicious intrusions into the computer systems in order to interception the user conversation or to delete critical important electronic documents and resources, etc. [�], [�], [�], [�], [�], [�0], [��], [�2], [��], [2�]. Hence, the main aim in this paper is to summarize and classify the highly varied computer and network attacks.
First, this study will analyze and compare the related studies to the cyber attacks. After this, a sophisticated classification of the most dangerous and malicious computer and network attacks will be made.
In [�] Hansman explained the relationship between network and computer attacks and in addition to him research he separated the cyber attacks into four dimensions such as type of the attack, target of the attack, mischievous vulnerabilities techniques and types of payload attacks. Ye at el. [30] made a framework for attack classification with placing the emphasis on the risk evaluation and assessment. Friedman and Hoffman [�] both gave a taxonomy of security vulnerabilities and threats to mobile computing. Igure and Williams [��] also gave a classification of the cyber attacks and made a comprehensive analysis of the flaws and vulnerabilities in the computer systems. Their mainly aim was to describe the types of attacks, future goals, measurement of the classification and descriptions.
In [��] Meyers, Powers, and Faissol analyzed and investigated the types of cyber adversaries and malicious attacks. Their taxonomy was different oriented and was separated into three groups such as class of the attack, subtypes of the attack and additional information for the given attack. Another type of cyber attack classification was given in [2�], that described the type of the attack, influence on the operating system device, specific defense techniques and applied damages. Stiawan [2�] summarized a lot of different types of attack and additional depicted varied viruses according to cisco systems.
There are also other previous studies, that presented and suggested detailed types of different cyber attacks, including viruses, malwares, keyloggers, rootkits, spywares, worms, trojans, denial of service (DoS), distributed denial of service (DDoS) intrusion detection system attacks, networks exploits, web applications attacks, wireless attacks, social engineering, buffer overflow and sniffers [�], [2], [3], [�], [�3], [��], [��], [��], [20], [2�], [22], [23], [2�], [2�].
3. A sophisticated cyber attack
taxonomy After analyzing and comparing
the achieved results of all papers of investigations, in this study was systematized a sophisticated classification of varied malicious cyber attacks. This classification is consisted of [�] - [30]:
���JOURNAL SCIENTIFIC AND APPLIED RESEARCH Vol. 3, 20�3JOURNAL SCIENTIFIC AND APPLIED RESEARCH Vol. 3, 20�3
Original Contribution
Journal scientific and applied research, vol. 3, 20�3 Association Scientific and Applied Research
International Journal ISSN �3��-�2��
A TAXONOMY OF THE CYBER ATTACKS
Petar K. Boyanov
DEPARTMENT OF COMMUNICATION AND COMPUTER TECHNIQUES, FACULTY OF TECHNICAL SCIENCES, KONSTANTIN PRESLAVSKY UNIVERSITY OF SHUMEN
E-MAIL: [email protected]
ABSTRACT: In this paper is made a sophisticated taxonomy of the malicious cyber attacks. The cyber attacks are summarized into several mainly types with additional subtypes for everyone attack. Thanks to the achieved comparative results in this paper many users can find and analyze different flaws and vulnerabilities in their computer and network systems and thereby they could detect and prevent future malicious cyber attacks. KEY WORDS: Cyber attacks, Vulnerabilities, Unauthorized access, Computer and network security, Taxonomy.
1. Introduction Most of the accomplished cyber
crimes are based on the flaws and vulnerabilities in computer and network systems. Thereby the smart knowledge of the cyber criminals find a way to implement and exploit dangerous malicious computer and network attacks, which cause irreparable damages to the important and confidential computer and network resources [�] - [30].
Previous technical papers presented different methodologies and taxonomies in order to explain and describe the different cyber attack types and the purpose of this paper was to analyze and summarize the different cyber attack classifications in order to achieve comparative results, which could cause an useful influence for the network
administrators, software programmers and users in the process of detecting and preventing future cyber attacks [�] - [30].
This paper is structured as follows. First, in section 2, the relative analyzes and performances of the malicious cyber attack taxonomies are compared. After that, in section 3, a sophisticated cyber attack taxonomy is composed. The advantages and limitations of the achieved final cyber attack classification as well as the upcoming future work are concluded in section �.
2. A relative analysis and performances of the malicious cyber attack taxonomies
Retaining computer and network security against cyber attacks is a serious problem, that constantly
JOURNAL SCIENTIFIC AND APPLIED RESEARCH Vol. 3, 20�3
causes huge damages such as stealing login credentials of the users, unauthorized electronic money drawing from the credit cards, malicious intrusions into the computer systems in order to interception the user conversation or to delete critical important electronic documents and resources, etc. [�], [�], [�], [�], [�], [�0], [��], [�2], [��], [2�]. Hence, the main aim in this paper is to summarize and classify the highly varied computer and network attacks.
First, this study will analyze and compare the related studies to the cyber attacks. After this, a sophisticated classification of the most dangerous and malicious computer and network attacks will be made.
In [�] Hansman explained the relationship between network and computer attacks and in addition to him research he separated the cyber attacks into four dimensions such as type of the attack, target of the attack, mischievous vulnerabilities techniques and types of payload attacks. Ye at el. [30] made a framework for attack classification with placing the emphasis on the risk evaluation and assessment. Friedman and Hoffman [�] both gave a taxonomy of security vulnerabilities and threats to mobile computing. Igure and Williams [��] also gave a classification of the cyber attacks and made a comprehensive analysis of the flaws and vulnerabilities in the computer systems. Their mainly aim was to describe the types of attacks, future goals, measurement of the classification and descriptions.
In [��] Meyers, Powers, and Faissol analyzed and investigated the types of cyber adversaries and malicious attacks. Their taxonomy was different oriented and was separated into three groups such as class of the attack, subtypes of the attack and additional information for the given attack. Another type of cyber attack classification was given in [2�], that described the type of the attack, influence on the operating system device, specific defense techniques and applied damages. Stiawan [2�] summarized a lot of different types of attack and additional depicted varied viruses according to cisco systems.
There are also other previous studies, that presented and suggested detailed types of different cyber attacks, including viruses, malwares, keyloggers, rootkits, spywares, worms, trojans, denial of service (DoS), distributed denial of service (DDoS) intrusion detection system attacks, networks exploits, web applications attacks, wireless attacks, social engineering, buffer overflow and sniffers [�], [2], [3], [�], [�3], [��], [��], [��], [20], [2�], [22], [23], [2�], [2�].
3. A sophisticated cyber attack
taxonomy After analyzing and comparing
the achieved results of all papers of investigations, in this study was systematized a sophisticated classification of varied malicious cyber attacks. This classification is consisted of [�] - [30]:
��� JOURNAL SCIENTIFIC AND APPLIED RESEARCH Vol. 3, 20�3JOURNAL SCIENTIFIC AND APPLIED RESEARCH Vol. 3, 20�3
Information Footprinting and Reconnaissance attacks [�], [30]; Information Scanning attacks; Enumeration attacks [2�], [30]; Information System attacks; Trojan and Backdoor attacks; Virus attacks; Worm attacks; Sniffer attacks; Social Engineering attacks; Denial of Service attacks; Session Hijacking attacks; Webserver vulnerabilities attacks; Web-based applications attacks; Wireless network attacks [20],
[2�]; Intrusion Detection System (IDS),
Firewalls and Honeypots attacks; Buffer overflow attacks; Physical attacks. The Footprinting and
Reconnaissance attacks The Footprinting and
Reconnaissance attack [�], [30] is characterized as gathering and collecting a lot of information about the selected victim. This attack thoroughly includes a set of blended mechanisms for assessment the version and the modification of the used operating system, version of the used webserver, the range of IP addresses in the selected network, etc. This attack includes the following attacking subtypes [�], [30]: Internet footprinting and
reconnaissance attacks; Website footprinting and
reconnaissance attacks;
DNS footprinting and reconnaissance attacks; Google footprinting and
reconnaissance attacks and etc. The Information Scanning
attacks The Information Scanning attack
scans only determinate targets in order to obtain information about the used IP addresses, the opened TCP or UDP ports, the version and platform of the used operating systems and the started services and processes in the target host. This attack includes the following attacking subtypes [�], [�], [�] - [��], [2�], [2�]: TCP handshake scanning attack, Stealth scan attack, Xmas scanning attack, FIN scanning attack, Null scanning attack, Idle scanning attack, UDP scanning attacks, etc..
Enumeration attacks Enumeration attacks pull up
varied information about the computer names, users, passwords, shared host and network resources. The criminals use this attack only in Local Area Networks (LANs) environments [��], [2�], [30]. The Enumeration attack uses different attacking subtypes:
Lightweight Directory Access Protocol (LDAP) attacks;
Network Basic Input/Output System (NetBios) attacks;
Simple Mail Transfer Protocol (SMTP) attacks;
Simple Network Management Protocol (SNMP) attacks;
JOURNAL SCIENTIFIC AND APPLIED RESEARCH Vol. 3, 20�3
Network Time Protocol (NTP) attacks;
Domain Name System (DNS) attacks, etc [��], [2�], [30].
Information system attacks Information system attacks are
set of several blended malicious attack techniques. These attacks cause huge damages to the selected device targets. Information system attacks consist of:
Password attacks such as Dictionary attacks, Brute force attacks, Hybrid attacks, Syllable attacks, Default password attacks, Manual guessing password attacks, atc [�], [�], [��], [�2], [2�], [��].
Keylogger attacks are divided into two groups - Hardware keystroke attacks and Software keystroke attacks [�], [�], [�], [�], [�0]. [��].
Spyware attacks are a lot of types of spyware attacks such as Multimedia spyware attacks (audio and video), Desktop attacks, GPS attacks, Print attacks, Fax attacks, USB attacks, Print Screen Capturing attacks and Cell phone attacks [�], [�], [��], [23], [2�].
Rootkit attacks as separated into several levels Rootkits attacks like Kernel, Hardware and Application level Rootkit attacks, etc [�] - [30].
Trojans and Backdoors attacks Trojans and Backdoors attacks
are the most malicious and maleficent attacking programs, that can cause
incorrigible damages to all electronic devices. Actually trojans are programs, that contain a maleficent code wrapped into an executable file with extensions ending at .exe, bat, com and also with a hidden file extension [�], [�] - [30]. There are lots of Trojan attacking subtypes [��], [2�] - [30]:
Credit Card attacks; E-banking attacks; Hypertext Transfer Protocol
(Http); Hypertext Transfer Protocol
Secure (Https) attacks; Botnet attacks; Internet Control Message
Protocol (ICMP) attacks; Mobile Computing attacks; Remote login and access
attacks, etc [�], [3], [�], [�], [�],[��], [2�].
Virus attacks The virus is a self-replicating
program that copies and replicates the own code into other executable files. The attacking subtypes of viruses are [��] - [30]: system and boot record, polymorphic, cluster, file, macro, shell, metamorphic, sparse infector, file, intrusive, extension, tunneling, encryption viruses, etc. [�].
Worm attacks The worm [3], [�], [�], [�] is a
self-replicating program that copies and replicates over public and private computer networks. The types of worms are - Mass-mailing worms and Network-aware worms.
���JOURNAL SCIENTIFIC AND APPLIED RESEARCH Vol. 3, 20�3JOURNAL SCIENTIFIC AND APPLIED RESEARCH Vol. 3, 20�3
Information Footprinting and Reconnaissance attacks [�], [30]; Information Scanning attacks; Enumeration attacks [2�], [30]; Information System attacks; Trojan and Backdoor attacks; Virus attacks; Worm attacks; Sniffer attacks; Social Engineering attacks; Denial of Service attacks; Session Hijacking attacks; Webserver vulnerabilities attacks; Web-based applications attacks; Wireless network attacks [20],
[2�]; Intrusion Detection System (IDS),
Firewalls and Honeypots attacks; Buffer overflow attacks; Physical attacks. The Footprinting and
Reconnaissance attacks The Footprinting and
Reconnaissance attack [�], [30] is characterized as gathering and collecting a lot of information about the selected victim. This attack thoroughly includes a set of blended mechanisms for assessment the version and the modification of the used operating system, version of the used webserver, the range of IP addresses in the selected network, etc. This attack includes the following attacking subtypes [�], [30]: Internet footprinting and
reconnaissance attacks; Website footprinting and
reconnaissance attacks;
DNS footprinting and reconnaissance attacks; Google footprinting and
reconnaissance attacks and etc. The Information Scanning
attacks The Information Scanning attack
scans only determinate targets in order to obtain information about the used IP addresses, the opened TCP or UDP ports, the version and platform of the used operating systems and the started services and processes in the target host. This attack includes the following attacking subtypes [�], [�], [�] - [��], [2�], [2�]: TCP handshake scanning attack, Stealth scan attack, Xmas scanning attack, FIN scanning attack, Null scanning attack, Idle scanning attack, UDP scanning attacks, etc..
Enumeration attacks Enumeration attacks pull up
varied information about the computer names, users, passwords, shared host and network resources. The criminals use this attack only in Local Area Networks (LANs) environments [��], [2�], [30]. The Enumeration attack uses different attacking subtypes:
Lightweight Directory Access Protocol (LDAP) attacks;
Network Basic Input/Output System (NetBios) attacks;
Simple Mail Transfer Protocol (SMTP) attacks;
Simple Network Management Protocol (SNMP) attacks;
JOURNAL SCIENTIFIC AND APPLIED RESEARCH Vol. 3, 20�3
Network Time Protocol (NTP) attacks;
Domain Name System (DNS) attacks, etc [��], [2�], [30].
Information system attacks Information system attacks are
set of several blended malicious attack techniques. These attacks cause huge damages to the selected device targets. Information system attacks consist of:
Password attacks such as Dictionary attacks, Brute force attacks, Hybrid attacks, Syllable attacks, Default password attacks, Manual guessing password attacks, atc [�], [�], [��], [�2], [2�], [��].
Keylogger attacks are divided into two groups - Hardware keystroke attacks and Software keystroke attacks [�], [�], [�], [�], [�0]. [��].
Spyware attacks are a lot of types of spyware attacks such as Multimedia spyware attacks (audio and video), Desktop attacks, GPS attacks, Print attacks, Fax attacks, USB attacks, Print Screen Capturing attacks and Cell phone attacks [�], [�], [��], [23], [2�].
Rootkit attacks as separated into several levels Rootkits attacks like Kernel, Hardware and Application level Rootkit attacks, etc [�] - [30].
Trojans and Backdoors attacks Trojans and Backdoors attacks
are the most malicious and maleficent attacking programs, that can cause
incorrigible damages to all electronic devices. Actually trojans are programs, that contain a maleficent code wrapped into an executable file with extensions ending at .exe, bat, com and also with a hidden file extension [�], [�] - [30]. There are lots of Trojan attacking subtypes [��], [2�] - [30]:
Credit Card attacks; E-banking attacks; Hypertext Transfer Protocol
(Http); Hypertext Transfer Protocol
Secure (Https) attacks; Botnet attacks; Internet Control Message
Protocol (ICMP) attacks; Mobile Computing attacks; Remote login and access
attacks, etc [�], [3], [�], [�], [�],[��], [2�].
Virus attacks The virus is a self-replicating
program that copies and replicates the own code into other executable files. The attacking subtypes of viruses are [��] - [30]: system and boot record, polymorphic, cluster, file, macro, shell, metamorphic, sparse infector, file, intrusive, extension, tunneling, encryption viruses, etc. [�].
Worm attacks The worm [3], [�], [�], [�] is a
self-replicating program that copies and replicates over public and private computer networks. The types of worms are - Mass-mailing worms and Network-aware worms.
��� JOURNAL SCIENTIFIC AND APPLIED RESEARCH Vol. 3, 20�3JOURNAL SCIENTIFIC AND APPLIED RESEARCH Vol. 3, 20�3
The most dangerous worms are [�] - [30]:
W32/Bangle.GE; W32/Netsky; W32/ Mydoom.B; W32/hllp.zori.c@M; W32/Feebs.gen@MM; W32/Detnat; W32/Virut; W32/MyWife, etc
[�], [�], [��], [��], [2�], [30]. Sniffer attacks The sniffer is a new technique,
that can eavesdrops the user information. In practice sniffer is an executable program or specific network device that intercepts and obtain some confidential information. The subtypes of sniffer attacks are [�], [�], [��] - [30]:
Mac flooding attacks; Mac address spoofing and
replicating attacks; Address Resolution Protocol
(ARP) poisoning attacks; ARP spoofing attacks; Internet Protocol (IP) spoofing
attacks; Domain Name System (DNS)
Spoofing attacks; DNS Cache Poisoning attacks; Fraudulent Dynamic Host
Configuration Protocol (DHCP) attacks;
DHCP starvation attacks, etc. [2�].
Social Engineering attacks Social Engineering [�] is the
most malicious and dangerous technique to break into computer and
network systems regardless of installed Firewalls, Intrusion Detection Systems, Intrusion Prevent Systems, Virtual Local Area Networks, Virtual Private Networks, etc. [�], [��] - [2�]. This attack is accomplished only by people, who have varied reasons to exposure top secret and confidential corporate information. There are two subtypes of this attack - human-based attack and cyber-based attack [��], [��].
Denial of Service attacks This attack is based on the
restricting and limiting the possibility the authorized and legitimate users to explore and use their computer and network resources [2�]. There are mainly two types of denial of service attacks. The first attack type is Denial of Service (DoS) and it is consists of several subtypes such as [�], [�], [�], [��] - [30]:
Bandwidth attacks; SYN Flooding attacks; ICMP Flooding attacks; Peer-to-Peer attacks and Botnet
attacks; Ping of death attacks; Teardrop attacks; Smurf attacks, etc.
The second attack type is Distributed Denial of Service (DDoS) and it is consists of the following attack subtypes [�], [�], [�], [��] - [30]:
TCP flooding attacks [�], [�], [��];
UDP flooding attacks [2�], [30];
ICMP flooding attacks; Amplification attacks;
JOURNAL SCIENTIFIC AND APPLIED RESEARCH Vol. 3, 20�3
Protocol oriented exploit attacks;
Smurf attacks [��], [30]; Fraggle attacks, etc [2�], [2�].
Session Hijacking attacks Cyber criminals use Session
Hijacking attack to steal the legitimate user ID session in order to intercept and snoop the transfer of information between several hosts [�]. This attack uses the following attacking subtypes [�], [��] - [30]:
Man-in-the-browser attack; Session fixation attack; Sequence number prediction; IP spoofing attacks; Reset (RST) packet attacks; UDP spoofing attack; Blind attacks, etc.
Webserver vulnerabilities
attacks Webserver attacks are consisted
of the following attack subtypes [��] - [30]:
Web cache poisoning attack; Http response splitting attack; Directory Traversal attacks; Http response hijacking attacks; SSH brute-force attacks; Man-in-the-Middle attacks; Webserver password cracking
attacks; Set of web application attacks,
etc. Web-based applications
attacks
These attacks are thoroughly network-based attacks pointed against web application destruction. The subtypes of this attack are [�], [�], [�], [�3] - [30]:
Cross Site Scripting (XSS) attacks;
SQL Injection attacks; Cookie Poisoning attacks; Misconfiguration attacks; Platform exploits attacks; Parameter tampering attacks; Injection flaw attacks; Command injection attacks; LDAP Injection attacks; Hidden File Manipulation
attacks; Cross-Site Request Forgery
(CSRF) attacks; Denial of Service (DoS)
attacks; Buffer overflow attacks; Web services attacks; XML Poisoning attacks, etc.
Wireless network attacks These attacks include the
following attacking subtypes [�], [��], [2�], [22]:
Media Access Control (MAC) Address Spoofing attacks;
Rogue Access Point attacks; WEP Injection attacks; Data Frame Injection attacks; Cracking WEP key attacks; Eavesdropping attacks [2�],
[22]; Masquerading attacks [��],
[��]; Beacon Flooding attacks; ARP Cache Poisoning attacks;
���JOURNAL SCIENTIFIC AND APPLIED RESEARCH Vol. 3, 20�3JOURNAL SCIENTIFIC AND APPLIED RESEARCH Vol. 3, 20�3
The most dangerous worms are [�] - [30]:
W32/Bangle.GE; W32/Netsky; W32/ Mydoom.B; W32/hllp.zori.c@M; W32/Feebs.gen@MM; W32/Detnat; W32/Virut; W32/MyWife, etc
[�], [�], [��], [��], [2�], [30]. Sniffer attacks The sniffer is a new technique,
that can eavesdrops the user information. In practice sniffer is an executable program or specific network device that intercepts and obtain some confidential information. The subtypes of sniffer attacks are [�], [�], [��] - [30]:
Mac flooding attacks; Mac address spoofing and
replicating attacks; Address Resolution Protocol
(ARP) poisoning attacks; ARP spoofing attacks; Internet Protocol (IP) spoofing
attacks; Domain Name System (DNS)
Spoofing attacks; DNS Cache Poisoning attacks; Fraudulent Dynamic Host
Configuration Protocol (DHCP) attacks;
DHCP starvation attacks, etc. [2�].
Social Engineering attacks Social Engineering [�] is the
most malicious and dangerous technique to break into computer and
network systems regardless of installed Firewalls, Intrusion Detection Systems, Intrusion Prevent Systems, Virtual Local Area Networks, Virtual Private Networks, etc. [�], [��] - [2�]. This attack is accomplished only by people, who have varied reasons to exposure top secret and confidential corporate information. There are two subtypes of this attack - human-based attack and cyber-based attack [��], [��].
Denial of Service attacks This attack is based on the
restricting and limiting the possibility the authorized and legitimate users to explore and use their computer and network resources [2�]. There are mainly two types of denial of service attacks. The first attack type is Denial of Service (DoS) and it is consists of several subtypes such as [�], [�], [�], [��] - [30]:
Bandwidth attacks; SYN Flooding attacks; ICMP Flooding attacks; Peer-to-Peer attacks and Botnet
attacks; Ping of death attacks; Teardrop attacks; Smurf attacks, etc.
The second attack type is Distributed Denial of Service (DDoS) and it is consists of the following attack subtypes [�], [�], [�], [��] - [30]:
TCP flooding attacks [�], [�], [��];
UDP flooding attacks [2�], [30];
ICMP flooding attacks; Amplification attacks;
JOURNAL SCIENTIFIC AND APPLIED RESEARCH Vol. 3, 20�3
Protocol oriented exploit attacks;
Smurf attacks [��], [30]; Fraggle attacks, etc [2�], [2�].
Session Hijacking attacks Cyber criminals use Session
Hijacking attack to steal the legitimate user ID session in order to intercept and snoop the transfer of information between several hosts [�]. This attack uses the following attacking subtypes [�], [��] - [30]:
Man-in-the-browser attack; Session fixation attack; Sequence number prediction; IP spoofing attacks; Reset (RST) packet attacks; UDP spoofing attack; Blind attacks, etc.
Webserver vulnerabilities
attacks Webserver attacks are consisted
of the following attack subtypes [��] - [30]:
Web cache poisoning attack; Http response splitting attack; Directory Traversal attacks; Http response hijacking attacks; SSH brute-force attacks; Man-in-the-Middle attacks; Webserver password cracking
attacks; Set of web application attacks,
etc. Web-based applications
attacks
These attacks are thoroughly network-based attacks pointed against web application destruction. The subtypes of this attack are [�], [�], [�], [�3] - [30]:
Cross Site Scripting (XSS) attacks;
SQL Injection attacks; Cookie Poisoning attacks; Misconfiguration attacks; Platform exploits attacks; Parameter tampering attacks; Injection flaw attacks; Command injection attacks; LDAP Injection attacks; Hidden File Manipulation
attacks; Cross-Site Request Forgery
(CSRF) attacks; Denial of Service (DoS)
attacks; Buffer overflow attacks; Web services attacks; XML Poisoning attacks, etc.
Wireless network attacks These attacks include the
following attacking subtypes [�], [��], [2�], [22]:
Media Access Control (MAC) Address Spoofing attacks;
Rogue Access Point attacks; WEP Injection attacks; Data Frame Injection attacks; Cracking WEP key attacks; Eavesdropping attacks [2�],
[22]; Masquerading attacks [��],
[��]; Beacon Flooding attacks; ARP Cache Poisoning attacks;
�20 JOURNAL SCIENTIFIC AND APPLIED RESEARCH Vol. 3, 20�3JOURNAL SCIENTIFIC AND APPLIED RESEARCH Vol. 3, 20�3
Routing attacks; VPN Login cracking attacks
[30] ; Shared Key Guessing attacks,
etc. Intrusion Detection System
(IDS), Firewalls and Honeypots attacks
Intrusion Detection systems, Firewalls and Honeypots [2], [�] are software programs or hardware devices, that aimed to detect, analyze, stop and prevent malicious attacks from cyber criminals (hackers and crackers). The attacking subtypes include [�] - [30]: IDS insertion attacks, Denial of Service attacks (DoS) attacks, False-Positive Generating attacks, Session Splicing attacks, IDS Fragmentation attacks, Polymorphic shellcode attack, IP Address spoofing, Additional Evading Firewall attack techniques, etc. [2], [�], [�], [��], [��] - [30].
Buffer overflow attacks a full control to determined
process of the computer system in order to block and destroy the significant executing processes in the system [�] - [30]. There are only two attacking subtypes - Stack-based buffer overflow attacks and Heap-based buffer overflow attacks [�], [��], [��], [2�], [30].
Physical attacks These attacks are mainly aimed
to damage and crash the physical devices and elements of a computer system and network. The subtypes of this attack are: Physical shearing of power supply cable or network cable, Putting explosives to subvert the whole computing system, High energy radio frequency (HERF) attacks, Low energy radio frequency (LERF) attacks, Electro-magnetic pulse (EMP) attacks, Van Eck Attacks, etc. [�] - [30]. The sophisticated taxonomy of cyber attacks is shown in table �.
JOURNAL SCIENTIFIC AND APPLIED RESEARCH Vol. 3, 20�3
Table 1. A sophisticated taxonomy of cyber attacks.
Attack type Attack subtype Information Footprinting and Reconnaissance attacks
Internet footprinting and reconnaissance attacks, Website footprinting and reconnaissance attacks, DNS footprinting and reconnaissance attacks, Google footprinting and reconnaissance attacks.
Information Scanning attacks
TCP handshake scanning attack, Stealth scan attack, Xmas scanning attack, FIN scanning attack, Null scanning attack, Idle scanning attack, UDP scanning attack.
Enumeration attacks Lightweight Directory Access Protocol (LDAP) attack, Network Basic Input/Output System (NetBios) attack, Simple Mail Transfer Protocol (SMTP) attack, Simple Network Management Protocol (SNMP) attack, Network Time Protocol (NTP) attack, Domain Name System (DNS) attack.
Information System attacks
Password attacks - Dictionary attacks, Brute force attacks, Hybrid attacks, Syllable attacks, Default password attacks, Manual guessing password attacks Keylogger attacks - Hardware keystroke attacks and Software keystroke attacks Spyware attacks - Multimedia spyware attacks (audio and video), Desktop attacks, GPS attacks, Print attacks, Fax attacks, USB attacks, Print Screen Capturing attacks and Cell phone attacks. Rootkit attacks - Kernel, Hardware and Application level Rootkit attacks.
Trojan and Backdoor attacks
Credit Card attacks, E-banking attacks, Hypertext Transfer Protocol (Http) and Hypertext Transfer Protocol Secure (Https) attacks, Botnet attacks, Internet Control Message Protocol (ICMP) attacks, Mobile Computing attacks, Remote login, access attacks.
Virus attacks System and boot record, polymorphic, cluster, file, macro, shell, metamorphic, sparse infector, file, intrusive, extension, tunneling and encryption viruses.
Worm attacks Mass-mailing worms and Network-aware worms. The most dangerous worms are W32/Bangle.GE, W32/Netsky, W32/ Mydoom.B, w32/hllp.zori.c@M, W32/Feebs.gen@MM, W32/Detnat, W32/Virut, W32/MyWife.
Sniffer attacks Mac flooding attacks, Mac address spoofing and replicating attacks, Address Resolution Protocol (ARP) poisoning attacks, ARP spoofing attacks, Internet Protocol (IP) spoofing attacks, Domain Name System (DNS) Spoofing attacks, DNS Cache Poisoning attacks, Fraudulent Dynamic Host Configuration Protocol (DHCP) attacks, DHCP starvation attacks.
Social Engineering attacks
Human-based attacks and cyber-based attacks
Denial of Service attacks
Denial of Service (DoS) attacks - Bandwidth attacks, SYN Flooding attacks, ICMP Flooding attacks, Peer-to-Peer attacks, Botnet attacks, Ping of death attacks, Teardrop attacks, Smurf attacks. Distributed Denial of Service (DDoS) attacks - TCP flooding attacks, UDP flooding attacks, ICMP flooding attacks, Amplification attacks, Protocol oriented exploit attacks, Smurf attacks and Fraggle attacks.
Session Hijacking attacks
Man-in-the-browser attack, Session fixation attack, Sequence number prediction, IP spoofing attacks, Reset (RST) packet attacks, UDP spoofing attack and Blind attacks.
Webserver vulnerabilities attacks
Web cache poisoning attack, Http response splitting attack, Directory Traversal attacks, Http response hijacking attacks, SSH brutefore attacks, Man-in-the-Middle attacks, Webserver password cracking attacks and set of web application attacks
Web-based applications attacks
Cross Site Scripting (XSS) attacks, SQL Injection attacks, Cookie Poisoning attacks, Misconfiguration attacks, Platform exploits attacks, Parameter tampering attacks, Injection flaw attacks, Command injection attacks, LDAP Injection attacks, Hidden File Manipulation attacks, Cross-Site Request Forgery (CSRF) attacks, DoS attacks, Buffer overflow attacks, Web services attacks, XML Poisoning attacks
Wireless network attacks;
Media Access Control (MAC) Address Spoofing attacks, Rogue Access Point attacks, WEP Injection attacks, Data Frame Injection attacks, Cracking WEP key attacks, Eavesdropping attacks, Masquerading attacks, Beacon Flooding attacks, ARP Cache Poisoning attacks, Routing attacks, VPN Login cracking attacks, Shared Key Guessing attacks.
Intrusion Detection System (IDS), Firewalls and Honeypots attacks
IDS insertion attacks, Denial of Service attacks (DoS) attacks, False-Positive Generating attacks, Session Splicing attacks, IDS Fragmentation attacks, Polymorphic shellcode attack, IP Address spoofing, Additional Evading Firewall attack techniques.
Buffer overflow attacks
Stack-based buffer overflow attacks and Heap-based buffer overflow attacks.
Physical attacks Physical shearing of power supply cable or network cable, Putting explosives to subvert the whole computing system, High energy radio frequency (HERF) attacks, Low energy radio frequency (LERF) attacks, Electro-magnetic pulse (EMP) attacks, Van Eck Attacks.
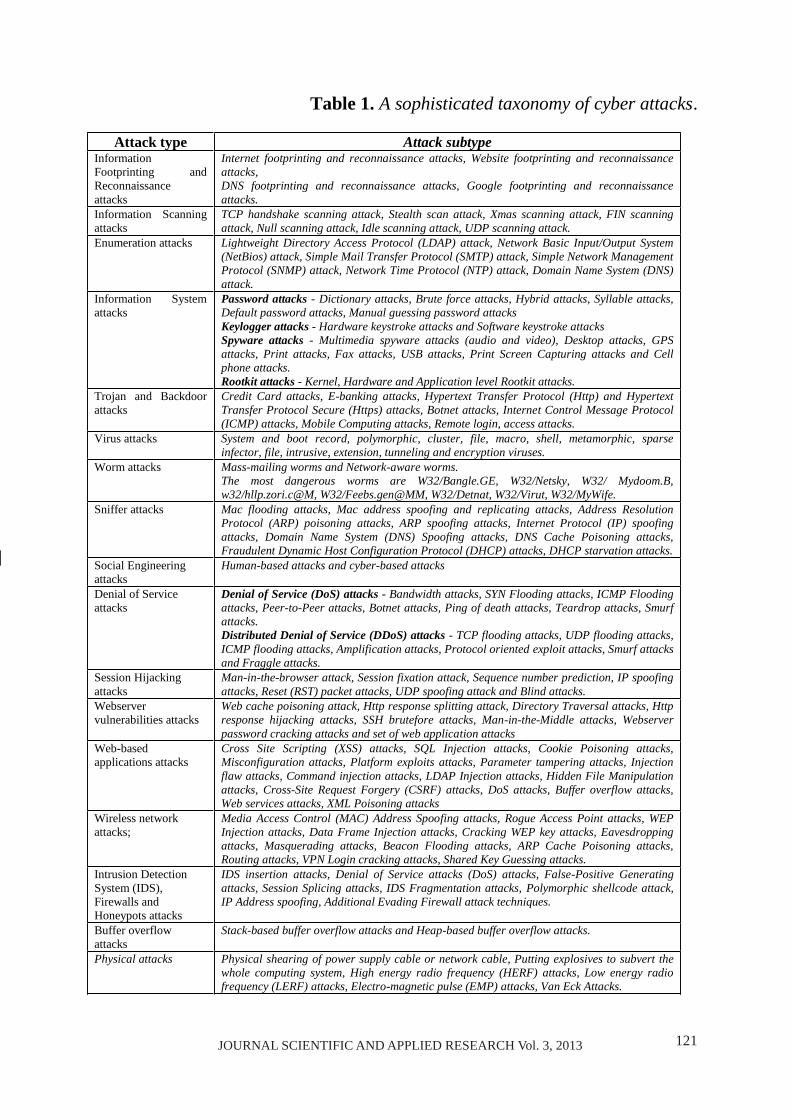
�2�JOURNAL SCIENTIFIC AND APPLIED RESEARCH Vol. 3, 20�3JOURNAL SCIENTIFIC AND APPLIED RESEARCH Vol. 3, 20�3
Routing attacks; VPN Login cracking attacks
[30] ; Shared Key Guessing attacks,
etc. Intrusion Detection System
(IDS), Firewalls and Honeypots attacks
Intrusion Detection systems, Firewalls and Honeypots [2], [�] are software programs or hardware devices, that aimed to detect, analyze, stop and prevent malicious attacks from cyber criminals (hackers and crackers). The attacking subtypes include [�] - [30]: IDS insertion attacks, Denial of Service attacks (DoS) attacks, False-Positive Generating attacks, Session Splicing attacks, IDS Fragmentation attacks, Polymorphic shellcode attack, IP Address spoofing, Additional Evading Firewall attack techniques, etc. [2], [�], [�], [��], [��] - [30].
Buffer overflow attacks a full control to determined
process of the computer system in order to block and destroy the significant executing processes in the system [�] - [30]. There are only two attacking subtypes - Stack-based buffer overflow attacks and Heap-based buffer overflow attacks [�], [��], [��], [2�], [30].
Physical attacks These attacks are mainly aimed
to damage and crash the physical devices and elements of a computer system and network. The subtypes of this attack are: Physical shearing of power supply cable or network cable, Putting explosives to subvert the whole computing system, High energy radio frequency (HERF) attacks, Low energy radio frequency (LERF) attacks, Electro-magnetic pulse (EMP) attacks, Van Eck Attacks, etc. [�] - [30]. The sophisticated taxonomy of cyber attacks is shown in table �.
JOURNAL SCIENTIFIC AND APPLIED RESEARCH Vol. 3, 20�3
Table 1. A sophisticated taxonomy of cyber attacks.
Attack type Attack subtype Information Footprinting and Reconnaissance attacks
Internet footprinting and reconnaissance attacks, Website footprinting and reconnaissance attacks, DNS footprinting and reconnaissance attacks, Google footprinting and reconnaissance attacks.
Information Scanning attacks
TCP handshake scanning attack, Stealth scan attack, Xmas scanning attack, FIN scanning attack, Null scanning attack, Idle scanning attack, UDP scanning attack.
Enumeration attacks Lightweight Directory Access Protocol (LDAP) attack, Network Basic Input/Output System (NetBios) attack, Simple Mail Transfer Protocol (SMTP) attack, Simple Network Management Protocol (SNMP) attack, Network Time Protocol (NTP) attack, Domain Name System (DNS) attack.
Information System attacks
Password attacks - Dictionary attacks, Brute force attacks, Hybrid attacks, Syllable attacks, Default password attacks, Manual guessing password attacks Keylogger attacks - Hardware keystroke attacks and Software keystroke attacks Spyware attacks - Multimedia spyware attacks (audio and video), Desktop attacks, GPS attacks, Print attacks, Fax attacks, USB attacks, Print Screen Capturing attacks and Cell phone attacks. Rootkit attacks - Kernel, Hardware and Application level Rootkit attacks.
Trojan and Backdoor attacks
Credit Card attacks, E-banking attacks, Hypertext Transfer Protocol (Http) and Hypertext Transfer Protocol Secure (Https) attacks, Botnet attacks, Internet Control Message Protocol (ICMP) attacks, Mobile Computing attacks, Remote login, access attacks.
Virus attacks System and boot record, polymorphic, cluster, file, macro, shell, metamorphic, sparse infector, file, intrusive, extension, tunneling and encryption viruses.
Worm attacks Mass-mailing worms and Network-aware worms. The most dangerous worms are W32/Bangle.GE, W32/Netsky, W32/ Mydoom.B, w32/hllp.zori.c@M, W32/Feebs.gen@MM, W32/Detnat, W32/Virut, W32/MyWife.
Sniffer attacks Mac flooding attacks, Mac address spoofing and replicating attacks, Address Resolution Protocol (ARP) poisoning attacks, ARP spoofing attacks, Internet Protocol (IP) spoofing attacks, Domain Name System (DNS) Spoofing attacks, DNS Cache Poisoning attacks, Fraudulent Dynamic Host Configuration Protocol (DHCP) attacks, DHCP starvation attacks.
Social Engineering attacks
Human-based attacks and cyber-based attacks
Denial of Service attacks
Denial of Service (DoS) attacks - Bandwidth attacks, SYN Flooding attacks, ICMP Flooding attacks, Peer-to-Peer attacks, Botnet attacks, Ping of death attacks, Teardrop attacks, Smurf attacks. Distributed Denial of Service (DDoS) attacks - TCP flooding attacks, UDP flooding attacks, ICMP flooding attacks, Amplification attacks, Protocol oriented exploit attacks, Smurf attacks and Fraggle attacks.
Session Hijacking attacks
Man-in-the-browser attack, Session fixation attack, Sequence number prediction, IP spoofing attacks, Reset (RST) packet attacks, UDP spoofing attack and Blind attacks.
Webserver vulnerabilities attacks
Web cache poisoning attack, Http response splitting attack, Directory Traversal attacks, Http response hijacking attacks, SSH brutefore attacks, Man-in-the-Middle attacks, Webserver password cracking attacks and set of web application attacks
Web-based applications attacks
Cross Site Scripting (XSS) attacks, SQL Injection attacks, Cookie Poisoning attacks, Misconfiguration attacks, Platform exploits attacks, Parameter tampering attacks, Injection flaw attacks, Command injection attacks, LDAP Injection attacks, Hidden File Manipulation attacks, Cross-Site Request Forgery (CSRF) attacks, DoS attacks, Buffer overflow attacks, Web services attacks, XML Poisoning attacks
Wireless network attacks;
Media Access Control (MAC) Address Spoofing attacks, Rogue Access Point attacks, WEP Injection attacks, Data Frame Injection attacks, Cracking WEP key attacks, Eavesdropping attacks, Masquerading attacks, Beacon Flooding attacks, ARP Cache Poisoning attacks, Routing attacks, VPN Login cracking attacks, Shared Key Guessing attacks.
Intrusion Detection System (IDS), Firewalls and Honeypots attacks
IDS insertion attacks, Denial of Service attacks (DoS) attacks, False-Positive Generating attacks, Session Splicing attacks, IDS Fragmentation attacks, Polymorphic shellcode attack, IP Address spoofing, Additional Evading Firewall attack techniques.
Buffer overflow attacks
Stack-based buffer overflow attacks and Heap-based buffer overflow attacks.
Physical attacks Physical shearing of power supply cable or network cable, Putting explosives to subvert the whole computing system, High energy radio frequency (HERF) attacks, Low energy radio frequency (LERF) attacks, Electro-magnetic pulse (EMP) attacks, Van Eck Attacks.
�22 JOURNAL SCIENTIFIC AND APPLIED RESEARCH Vol. 3, 20�3JOURNAL SCIENTIFIC AND APPLIED RESEARCH Vol. 3, 20�3
3. Conclusion and future work In this paper a sophisticated
classification of varied malicious cyber attacks is achieved and summarized. Thanks to this classification of cyber attacks, many IT experts, software programmers, Web developers and users can understand and find the crucial flaws and vulnerabilities in their information and computing systems and thereby they can prevent future unauthorized penetration using
difference defense techniques and methods.
However, there is no explanation for applied and developed countermeasures and penetration tests against the cyber attacks in this paper. Some practical issues like analyzing and building countermeasures against the varied malicious cyber attacks in computer and network systems need to be done in my further researches and investigations.
References:
[�] Avizienis, Algirdas,. Laprie J-C., Randell Brian., and Landwehr Carl., "Basic concepts and taxonomy of dependable and secure computing." Dependable and Secure Computing, IEEE Transactions on �, no. � (200�): ��-33. [2] Bråthen A., "Correlating IDS alerts with system logs by means of a network-centric SIEM solution." (20��). [3] Collins M., Gates C., and Kataria G., "A model for opportunistic network exploits: The case of P2P worms." In Workshop on the Economics of Information Security (WEIS), University of Cambridge, UK. 200�. [�] De Vries J. A., Warnier M. E., and Hoogstraaten H., "Towards a roadmap for development of intelligent data analysis based cyber attack detection systems." (20�2). [�] Friedman J., and Hoffman D. V., "Protecting data on mobile devices: A taxonomy of security threats to mobile computing and review of applicable defenses."
Information, Knowledge, Systems Management �, no. � (200�): ���-��0. [�] Hajian S., And Hendessi Faramarz B M., "A Taxonomy for network vulnerabilities." International Journal Of Information And Communication Technology (Ijict) (20�0). [�] Hansman S., and Hunt R., "A taxonomy of network and computer attack methodologies." Retrieved March 22 (2003): 200�. [�] Hansman S., and Hunt R., "A taxonomy of network and computer attacks." Computers & Security 2�, no. � (200�): 3�-�3. [�] Howard J. D., An analysis of security incidents on the Internet ����-����. CARNEGIE-MELLON UNIV PITTSBURGH PA, ����. [�0] Howard J. D., and Longstaff T. A., "A common language for computer security incidents." Sandia Report: SAND��-����, Sandia National Laboratories, http://www. cert. org/research/taxonomy_������. pdf (����).
JOURNAL SCIENTIFIC AND APPLIED RESEARCH Vol. 3, 20�3
[��] Igure V., and Williams R., "Taxonomies of attacks and vulnerabilities in computer systems." Communications Surveys & Tutorials, IEEE �0, no. � (200�): �-��. [�2] Климовский А. А., "Таксономия кибератак и ее применение к задаче формирования сценариев их проведения." Труды Института системного анализа Российской академии наук 27 (200�): ��-�0�. [�3] Kjaerland M., "A taxonomy and comparison of computer security incidents from the commercial and government sectors." Computers & Security 2�.� (200�): �22-�3�. [��] Lipson H. F., "Tracking and tracing cyber-attacks: Technical challenges and global policy issues." (2002). [��] Lough D. L., (200�). A taxonomy of computer attacks with applications to wireless networks (Doctoral dissertation). [��] Myers C., Powers S., and Faissol D., "Taxonomies of cyber adversaries and attacks: a survey of incidents and approaches." Lawrence Livermore National Laboratory (April 200�) � (200�). [��] Meyers C., Powers S., and Faissol D., Probabilistic Characterization of Adversary Behavior in Cyber Security. No. LLNL-TR-���023. Lawrence Livermore National Laboratory (LLNL), Livermore, CA, 200�. [��] Mishra B. K., and Saini H., "Cyber Attack Classification using Game Theoretic Weighted Metrics Approach." (200�).
[��] Monahan-Pendergast, MaryTheresa. "Attack Evolution: Identifying Attack Evolution Characteristics to Predict Future Attacks." PhD diss., 200�. [20] Nasr K., El Kalam A. A., and Fraboul., "Generating Representative Attack Test Cases for Evaluating and Testing Wireless Intrusion Detection Systems." International Journal of Network Security & Its Applications (IJNSA) �, no. 3 (20�2): �-��. [2�] Nunes S. R., "Web attack risk awareness with lessons learned from high interaction honeypots." PhD diss., CARNEGIE MELLON UNIVERSITY, 200�. [22] Rutkowska J., "Introducing stealth malware taxonomy." COSEINC Advanced Malware Labs (200�). [23] Saber M., Bouchentouf T., Benazzi A., and Azizi M., "Amelioration of attack classifications for evaluating and testing intrusion detection system." Journal of Computer Science �, no. � (20�0): ���-�22. [2�] Sharma A., Kalbarczyk Z., Iyer R., and Barlow J., "Analysis of credential stealing attacks in an open networked environment." In Proc. of the Fourth International Conference on Network and System Security. Washington, DC, USA: IEEE Computer Society, pp. ���-���. 20�0. [2�] Simmons C., Shiva S., Dasgupta D., and Wu Q., "AVOIDIT: A cyber attack taxonomy." University of Memphis, Technical Report CS-0�-003 (200�). [2�] Singh P. K., Vatsa A. K., Sharma R., & Tyagi P., “Taxonomy
�23JOURNAL SCIENTIFIC AND APPLIED RESEARCH Vol. 3, 20�3JOURNAL SCIENTIFIC AND APPLIED RESEARCH Vol. 3, 20�3
3. Conclusion and future work In this paper a sophisticated
classification of varied malicious cyber attacks is achieved and summarized. Thanks to this classification of cyber attacks, many IT experts, software programmers, Web developers and users can understand and find the crucial flaws and vulnerabilities in their information and computing systems and thereby they can prevent future unauthorized penetration using
difference defense techniques and methods.
However, there is no explanation for applied and developed countermeasures and penetration tests against the cyber attacks in this paper. Some practical issues like analyzing and building countermeasures against the varied malicious cyber attacks in computer and network systems need to be done in my further researches and investigations.
References:
[�] Avizienis, Algirdas,. Laprie J-C., Randell Brian., and Landwehr Carl., "Basic concepts and taxonomy of dependable and secure computing." Dependable and Secure Computing, IEEE Transactions on �, no. � (200�): ��-33. [2] Bråthen A., "Correlating IDS alerts with system logs by means of a network-centric SIEM solution." (20��). [3] Collins M., Gates C., and Kataria G., "A model for opportunistic network exploits: The case of P2P worms." In Workshop on the Economics of Information Security (WEIS), University of Cambridge, UK. 200�. [�] De Vries J. A., Warnier M. E., and Hoogstraaten H., "Towards a roadmap for development of intelligent data analysis based cyber attack detection systems." (20�2). [�] Friedman J., and Hoffman D. V., "Protecting data on mobile devices: A taxonomy of security threats to mobile computing and review of applicable defenses."
Information, Knowledge, Systems Management �, no. � (200�): ���-��0. [�] Hajian S., And Hendessi Faramarz B M., "A Taxonomy for network vulnerabilities." International Journal Of Information And Communication Technology (Ijict) (20�0). [�] Hansman S., and Hunt R., "A taxonomy of network and computer attack methodologies." Retrieved March 22 (2003): 200�. [�] Hansman S., and Hunt R., "A taxonomy of network and computer attacks." Computers & Security 2�, no. � (200�): 3�-�3. [�] Howard J. D., An analysis of security incidents on the Internet ����-����. CARNEGIE-MELLON UNIV PITTSBURGH PA, ����. [�0] Howard J. D., and Longstaff T. A., "A common language for computer security incidents." Sandia Report: SAND��-����, Sandia National Laboratories, http://www. cert. org/research/taxonomy_������. pdf (����).
JOURNAL SCIENTIFIC AND APPLIED RESEARCH Vol. 3, 20�3
[��] Igure V., and Williams R., "Taxonomies of attacks and vulnerabilities in computer systems." Communications Surveys & Tutorials, IEEE �0, no. � (200�): �-��. [�2] Климовский А. А., "Таксономия кибератак и ее применение к задаче формирования сценариев их проведения." Труды Института системного анализа Российской академии наук 27 (200�): ��-�0�. [�3] Kjaerland M., "A taxonomy and comparison of computer security incidents from the commercial and government sectors." Computers & Security 2�.� (200�): �22-�3�. [��] Lipson H. F., "Tracking and tracing cyber-attacks: Technical challenges and global policy issues." (2002). [��] Lough D. L., (200�). A taxonomy of computer attacks with applications to wireless networks (Doctoral dissertation). [��] Myers C., Powers S., and Faissol D., "Taxonomies of cyber adversaries and attacks: a survey of incidents and approaches." Lawrence Livermore National Laboratory (April 200�) � (200�). [��] Meyers C., Powers S., and Faissol D., Probabilistic Characterization of Adversary Behavior in Cyber Security. No. LLNL-TR-���023. Lawrence Livermore National Laboratory (LLNL), Livermore, CA, 200�. [��] Mishra B. K., and Saini H., "Cyber Attack Classification using Game Theoretic Weighted Metrics Approach." (200�).
[��] Monahan-Pendergast, MaryTheresa. "Attack Evolution: Identifying Attack Evolution Characteristics to Predict Future Attacks." PhD diss., 200�. [20] Nasr K., El Kalam A. A., and Fraboul., "Generating Representative Attack Test Cases for Evaluating and Testing Wireless Intrusion Detection Systems." International Journal of Network Security & Its Applications (IJNSA) �, no. 3 (20�2): �-��. [2�] Nunes S. R., "Web attack risk awareness with lessons learned from high interaction honeypots." PhD diss., CARNEGIE MELLON UNIVERSITY, 200�. [22] Rutkowska J., "Introducing stealth malware taxonomy." COSEINC Advanced Malware Labs (200�). [23] Saber M., Bouchentouf T., Benazzi A., and Azizi M., "Amelioration of attack classifications for evaluating and testing intrusion detection system." Journal of Computer Science �, no. � (20�0): ���-�22. [2�] Sharma A., Kalbarczyk Z., Iyer R., and Barlow J., "Analysis of credential stealing attacks in an open networked environment." In Proc. of the Fourth International Conference on Network and System Security. Washington, DC, USA: IEEE Computer Society, pp. ���-���. 20�0. [2�] Simmons C., Shiva S., Dasgupta D., and Wu Q., "AVOIDIT: A cyber attack taxonomy." University of Memphis, Technical Report CS-0�-003 (200�). [2�] Singh P. K., Vatsa A. K., Sharma R., & Tyagi P., “Taxonomy

�2� JOURNAL SCIENTIFIC AND APPLIED RESEARCH Vol. 3, 20�3JOURNAL SCIENTIFIC AND APPLIED RESEARCH Vol. 3, 20�3
based intrusion attacks and Detection management scheme in peer-to-peer network”, International Journal of Network Security & Its Applications (IJNSA), Vol.�, No.�, September 20�2 [2�] Specht S M., and R. B. Lee., "Distributed denial of service: Taxonomies of attacks, tools, and countermeasures." In Proceedings of the ��th International Conference on Parallel and Distributed Computing Systems, pp. ��3-��0. 200�.
[2�] Stiawan D., "Network Security Violation: a review." [2�] Ye N., Newman C., and Farley T., "A system-fault-risk framework for cyber attack classification." Information, Knowledge, Systems Management �, no. 2 (200�): �3�-���. [30] Van Heerden R. P., Irwin B., and Burke I. D., "Classifying network attack scenarios using an Ontology." Academic Conferences Limited, 20�2
JOURNAL SCIENTIFIC AND APPLIED RESEARCH Vol. 3, 20�3
Original Contribution
Journal scientific and applied research, vol. 3, 20�3 Association Scientific and Applied Research
International Journal ISSN �3��-�2��
PAPER STYLING Paper text should be styled for printing. No additional redaction is planned. All papers shall be printed on a laser printer on standard sheets of paper format А� on one
side only. Fields on each page should be: left - 2� mm, right - 2� mm, top - 2� mm, bottom - 2� mm. No frame on sheet.
Paper volume shall not exceed � pages Text shall be styled in the following way
TITLE - Font: Times New Roman; Size: ��; Font style: Bold; Effects: All Caps; Paragraph Alignment: Centered. AUTHOR NAMES shall be printed over � empty line under the title in its complete form – complete name, initial for the surname and complete family name; Font: Times New Roman, Size: ��, Font style: Bold, Paragraph Alignment: Left, indent � cm on the left of the conditional frame, limiting the main text. MAILING ADDRESSES printed over one more empty line (no abbreviations), Font: Times New Roman, Size: �2; Font style: Italic; Effects: All Caps, Paragraph Alignment: Justified, outstanding � cm on the left of the limiting the main text frame. Military and scientific degrees shall not be pointed. TITLE AND NAMES OF AUTHORS IN ENGLISH shall be placed as follows: title over 2 empty lines under the mailing addresses; names over � empty line underneath it – their styling should correspond to their Bulgarian equivalents. ANNOTATION AND KEYWORDS IN ENGLISH are styled as follows: annotation (ABSTRACT) in volume up to �0 lines over � empty line - Font: Times New Roman, Size: �0, Font style: Italic, Paragraph Alignment: Justified; the keywords are next over � empty line (descriptors - KEY WORDS) - Font: Times New Roman, Size: �0, Font style: Italic; Paragraph Alignment: Justified, both elements outstand � cm left of the frame limiting the main text. MAIN TEXT - Font: Times New Roman, Size: ��; Paragraph First line: � cm, Line spacing: Single, Alignment: Justified.
Drawings shall be precise and evenly placed on pages. Numbers of formulas are printed on their left in brackets ( ).
Literature, stated at the end of the paper shall be printed according to the bibliographic description standard, and citations within the text are marked with a number in square brackets [ ].
Page numbers are printed with a pencil in the lower left corner. On the back of the last page are pointed the full names of the authors, their scientific titles,
degrees and the organization they work for – contact telephone for the author or e-mail. All materials for publishing shall be handed over to the supervisors of the according
section after they have been read.
�2�JOURNAL SCIENTIFIC AND APPLIED RESEARCH Vol. 3, 20�3JOURNAL SCIENTIFIC AND APPLIED RESEARCH Vol. 3, 20�3
based intrusion attacks and Detection management scheme in peer-to-peer network”, International Journal of Network Security & Its Applications (IJNSA), Vol.�, No.�, September 20�2 [2�] Specht S M., and R. B. Lee., "Distributed denial of service: Taxonomies of attacks, tools, and countermeasures." In Proceedings of the ��th International Conference on Parallel and Distributed Computing Systems, pp. ��3-��0. 200�.
[2�] Stiawan D., "Network Security Violation: a review." [2�] Ye N., Newman C., and Farley T., "A system-fault-risk framework for cyber attack classification." Information, Knowledge, Systems Management �, no. 2 (200�): �3�-���. [30] Van Heerden R. P., Irwin B., and Burke I. D., "Classifying network attack scenarios using an Ontology." Academic Conferences Limited, 20�2
JOURNAL SCIENTIFIC AND APPLIED RESEARCH Vol. 3, 20�3
Original Contribution
Journal scientific and applied research, vol. 3, 20�3 Association Scientific and Applied Research
International Journal ISSN �3��-�2��
PAPER STYLING Paper text should be styled for printing. No additional redaction is planned. All papers shall be printed on a laser printer on standard sheets of paper format А� on one
side only. Fields on each page should be: left - 2� mm, right - 2� mm, top - 2� mm, bottom - 2� mm. No frame on sheet.
Paper volume shall not exceed � pages Text shall be styled in the following way
TITLE - Font: Times New Roman; Size: ��; Font style: Bold; Effects: All Caps; Paragraph Alignment: Centered. AUTHOR NAMES shall be printed over � empty line under the title in its complete form – complete name, initial for the surname and complete family name; Font: Times New Roman, Size: ��, Font style: Bold, Paragraph Alignment: Left, indent � cm on the left of the conditional frame, limiting the main text. MAILING ADDRESSES printed over one more empty line (no abbreviations), Font: Times New Roman, Size: �2; Font style: Italic; Effects: All Caps, Paragraph Alignment: Justified, outstanding � cm on the left of the limiting the main text frame. Military and scientific degrees shall not be pointed. TITLE AND NAMES OF AUTHORS IN ENGLISH shall be placed as follows: title over 2 empty lines under the mailing addresses; names over � empty line underneath it – their styling should correspond to their Bulgarian equivalents. ANNOTATION AND KEYWORDS IN ENGLISH are styled as follows: annotation (ABSTRACT) in volume up to �0 lines over � empty line - Font: Times New Roman, Size: �0, Font style: Italic, Paragraph Alignment: Justified; the keywords are next over � empty line (descriptors - KEY WORDS) - Font: Times New Roman, Size: �0, Font style: Italic; Paragraph Alignment: Justified, both elements outstand � cm left of the frame limiting the main text. MAIN TEXT - Font: Times New Roman, Size: ��; Paragraph First line: � cm, Line spacing: Single, Alignment: Justified.
Drawings shall be precise and evenly placed on pages. Numbers of formulas are printed on their left in brackets ( ).
Literature, stated at the end of the paper shall be printed according to the bibliographic description standard, and citations within the text are marked with a number in square brackets [ ].
Page numbers are printed with a pencil in the lower left corner. On the back of the last page are pointed the full names of the authors, their scientific titles,
degrees and the organization they work for – contact telephone for the author or e-mail. All materials for publishing shall be handed over to the supervisors of the according
section after they have been read.

�2� JOURNAL SCIENTIFIC AND APPLIED RESEARCH Vol. 3, 20�3