volume 2.10 • november 2012 india: unlocking the ... kkr insights: global macro trends india:...
TRANSCRIPT

VoluMe 2.10 • noVeMber 2012
India: Unlocking the Demographic Dividend
insiGHtsglobal Macro trends

2 KKR InsIghts: global Macro trends
India: Unlocking the Demographic DividendA recent trip to India quickly reminded me that the country is bursting with macro-economic potential. Powerful demographics, rising GDP per capita, and a robust services industry all suggest a potentially strong growth and investment profile ahead. On the other hand, inflation, lack of infrastructure investment, high deficits and government dysfunction all have tainted India’s standing and its performance, particularly relative to its potential. In our view, India will not achieve its full potential until it does at least three things better: 1) invest more in infrastructure; 2) tackle its inflation problem and related inefficiencies; and 3) cut subsidies to help balance its fiscal situation and restore proper consumption signals in the consumer market. Unfortunately, there is no quick fix, and given the election in May 2014, there is a high probability that 2013 will be used by politicians to win favor with their constituents. Sentiment surrounding India tends to vacillate between euphoria and despair. Five years ago, India could do no wrong; today, it can do no right. At this low point in sentiment, we think there is a cyclical opportunity to surprise on the upside. Longer-term, we believe a key to success in India centers on investing prudently alongside macro themes that have enough momentum to overcome the inevitable challenges in an emerging market of this size and complexity.
KKR Global MacRo & asset allocation teaM
HenRy H. McVey
Head of Global Macro & Asset Allocation
+1 (212) [email protected]
DaViD R. Mcnellis
+1 (212) [email protected]
FRances b. liM
+1 (212) [email protected]
Rebecca J. RaMsey
+1 (212) [email protected]
Main oFFice
Kohlberg Kravis roberts & co. l.P.9 West 57th streetsuite 4200new York, new York 10019+ 1 (212) 750-8300
coMPany locations
Usa new York, san Francisco, Washington, d.c., Menlo Park, houston eURoPe london, Paris asia hong Kong, beijing, singapore, dubai, tokyo, Mumbai, seoul aUstRalia sydney
© 2012 Kohlberg Kravis roberts & co. l.P. all rights reserved.
“ India is the cradle of the human race, the birthplace of human speech, the mother of history, the grandmother of legend,
and the great grandmother of tradition. Our most valuable and most instructive
materials in the history of man are treasured up in India only.
”MaRK twain
aMerIcan author (1835–1910)

3KKR InsIghts: global Macro trends
recently, on a return trip from asia, I was able to join my col-leagues from KKr India in Mumbai to learn a little more about what Mark twain called the “cradle of the human race.” this was not my first trip, but I have not been in a while, so it was nice to get back and re-immerse myself in one of today’s most complex emerging economic growth stories.
on the one hand, the trip quickly reminded me that India is bursting with macro-economic potential. Powerful demographics, rising gdP per capita, and a robust services industry all suggest a potentially strong growth and investment profile ahead. on the other hand, it is also clear that the country has made things about as difficult as it could for itself in recent years. In particular, inflation, lack of infrastructure investment, high deficits and government dysfunction all have tainted India’s standing and its performance, particularly relative to its potential.
so, where do we go from here in India? our thoughts are as fol-lows:
1. We left India with the impression that the economy, its cur-rency, and its public market valuation are all likely to see more gains, as the public sector will likely embrace enough change to further lift risk assets in the near term. In particular, we think that the introduction of a new minister of finance and the an-nouncement of recent reform initiatives on foreign investment are important new positives that need to be considered. that’s the good news.
2. the bad news is that this country is not expected to achieve its full potential on a sustained basis until it does at least three things better. First, it should invest more in infrastructure – and in particular, additional funds need to come from the govern-ment sector, which is hampered by its limited tax revenues. second, it should tackle its inflation problem, including food costs (which account for a full 50% of cPI)1 and related inef-ficiencies. third and finally, it should cut subsidies to help bal-ance its fiscal situation and restore proper consumption signals in the consumer market. unfortunately, there is no quick fix to any of these three issues, and given that there is an election in May 2014, there is a high probability that 2h13 will be used by politicians to win favor with their constituents.
3. the country’s demographic dividend – over half of the country’s 1.3 billion people are under the age of 302 – is its most compel-ling macro feature in our view, and there appear to be several attractive ways to play it, including healthcare, agriculture, fi-nancial services, and housing. Importantly, India’s rising middle class is “aspirational,” so brand matters more than in many other countries we routinely visit.
4. on the other hand, we think that the traditional banking sector in India, particularly state-affiliated players, is likely to lag. there were excessive capital outlays related to the distribution sector in the power business, and current provisioning trends are not
1 Exhibit 41
2 total population is estimated at 1258 million and the percent of India’s population below the age of 30 for the year 2012 is 57% as of september 26, 2012. source: united nations World Population Prospects.
representative of the loss ratios we think are inevitable from over-extension of credit in this area.
5. overall, India is a microcosm of two mega-trends that we see occurring throughout almost all the emerging markets that we visit. First, similar to china, turkey, and brazil, India is still deal-ing with a consumption “hangover” from the excessive govern-ment stimulus that was used to fight off economic slowdown during the great recession, and to date, most governments have done little to return policy to normal. second, as central banks in the developed markets use heavy Quantitative easing (Qe) to try to reflate their economies, we think they are increasingly putting themselves at odds with emerging market leaders like India, brazil, turkey, and china, which are constantly battling inflation – and as a result, worry that Qe tied to employment in the West could drive unintended inflation in their home markets.
as anyone who has followed Indian investments for some time knows, sentiment surrounding India tends to vacillate between eu-phoria and despair. Five years ago, India could do no wrong; today, it can do no right. at this low point in sentiment, we actually think there is a cyclical opportunity in India, including both public stocks and government bonds, to surprise on the upside. In addition, we think that the currency, which has been pummeled in recent months, is likely to shift from a liability to an asset, which could materially help the total return equation on India investments.
on the private side, the situation is clearly more complex. the government now understands the need for more and better foreign investment, but success in India will require patience and, probably more importantly, a flexible approach that extends across debt and equity, both public and private markets, and majority and minor-ity stakes. It will also require the expertise to not only buy but also build businesses, given that valuations in India are traditionally ex-pensive relative to other emerging growth countries. think about it this way: While the country’s risk-free rate is north of eight percent, many of the quality franchises in India trade north of 20 times earn-ings, already implying either an extremely low cost of capital and/or an extremely high rate of growth (Exhibit 1).
Interestingly, of all the private initiatives we saw during our visit, we believe that the initiative by private equity and other financial intermediaries to develop mezzanine credit instruments, often with some equity upside, is among the more compelling long-term opportunities. true, this market is nascent and a global investor should be willing to take local currency risks, but we left Mumbai with the strong impression that India’s large and growing num-ber of entrepreneurs and businessmen would help to expand this market quickly because they want to tap into a more sophisticated capital markets system that allows them greater choice beyond just traditional equity or bank loan products. and at the smaller end of the market, Indian entrepreneurs just do not have the same access to bank products that their larger peers enjoy. If we are right in our macro view, then investments in the mezzanine credit market may start to appeal to not only local investors but also to global inves-tors, particularly those who want to earn a meaningful recurring coupon and enjoy some equity upside without a lot of the volatility and misconfigurations often associated with traditional emerging Market (eM) public equity indexes.
1
2
3
4
5

4 KKR InsIghts: global Macro trends
exHibit 1
Indian Credit Markets May Provide Opportunity in a Low Return World
8.2% 9.7% 10.5%
12.5% 14.0%
16.5% 18.5%
20.0%
Government Securities 5
Year
AAA Corporate Bonds
AA Corporate Bonds
Infrastructure Corporate Loans
Promoter Financing
Operating Company
Financing / High Yield
Structured Equity Real Estate Mezzanine / Structured
Lending
Yields Across the Credit Spectrum in India
source: based on KKr’s internal analysis, data as at august 28, 2012. note: the above reflects the current market views, opinions and expectations of KKr based on its historic experience. historic market trends are not reliable indicators of actual future market behavior or future performance of any particular investment.
In terms of the overall global macro environment, we still think port-folios should be pro-risk taking, but we acknowledge that our view to own ‘spicy’ credit is now feeling a little long in the tooth after Qe3’s implementation. by comparison, we still see significant up-side in products that can take advantage of the illiquidity premium caused by Wall street downsizing. In addition, we see real assets that can provide yield, growth, and inflation hedging as compelling.
Overview
there are many reasons to go to India — vibrant people, sophis-ticated cuisine, beautiful temples and mosques, and unique art. however, infrastructure is clearly not one of them. It is not that I did not know this. I do. rather, it is that each visit reminds me how much more efficient and productive this country of 1.3 billion people could be if getting from one destination to another was not such a time-consuming adventure. In Mumbai, it starts with long lines at the airports, extends to huge traffic jams, and includes even simple things such as lack of drainage or fire hydrants in many parts of town. In rural areas, insufficient roads and storage prevent basic goods and services like fresh food and clean water from reach-ing homes in a timely fashion. this headwind is significant as food costs, which are nearly 50% of the total inflation basket in India, remain extremely volatile (Exhibit 41).
geographic size is actually not the primary source of the infrastruc-ture deficit; in fact, India is only about 33% the size of the united states and 32% the size of china by land area3. rather, the govern-ment just does not spend enough on fixed investment, infrastruc-ture in particular. We believe this is a direct result of its lack of tax revenue prowess.
3 as of september 20, 2011. source: World bank World development Indicators.
exHibit 2
Among the Asian Tigers, India Stands Tall
China
India
Euro Area
U.S.
Indonesia
Brazil
Pakistan
Japan
Philippines
Vietnam
Australia
Korea
Bangladesh
-10
0
10
20
30
40
50
0 200 400 600 800 1,000 1,200 1,400
2010
-203
0 Po
pula
tion
Gro
wth
(%)
2012 Population (millions)
This is why Asia matters
data as at May 11, 2011. source: united nations World Population Prospects, haver. size of bubble indicates 2012 population.
“ India is bursting with macro-economic potential, thanks to powerful demographics, rising GDP per capita, and a robust
services industry. “
5KKR InsIghts: global Macro trends
exHibit 3
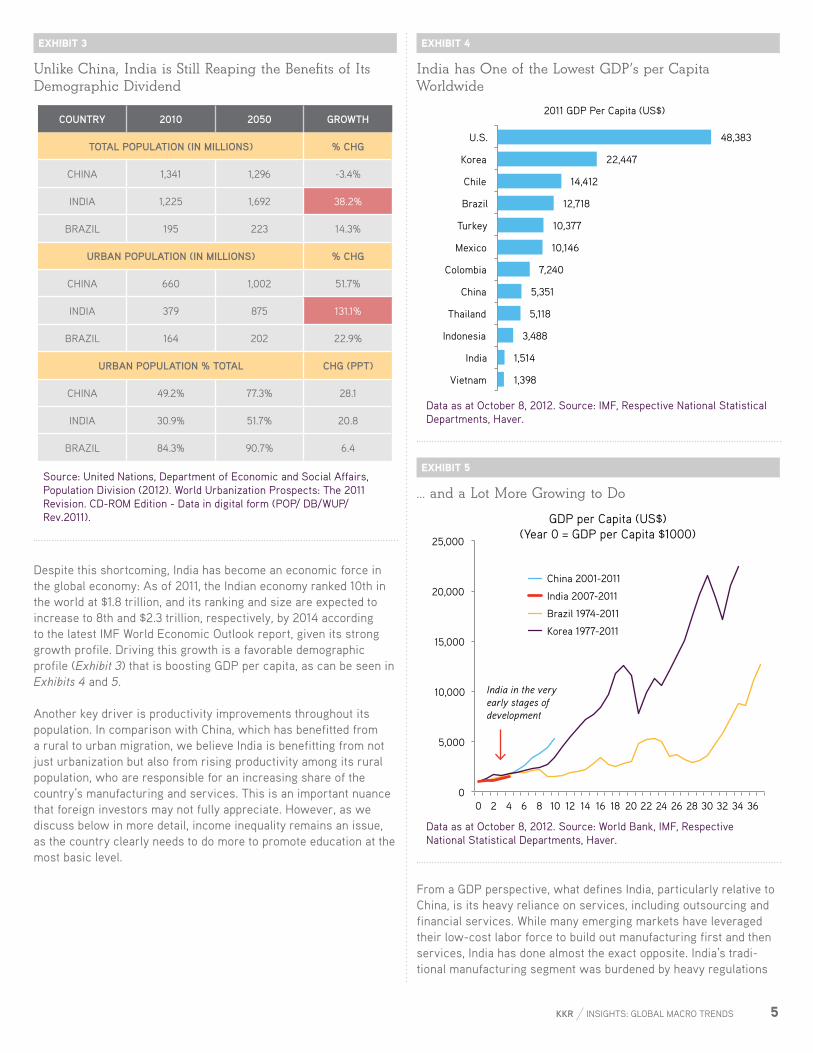
Unlike China, India is Still Reaping the Benefits of Its Demographic Dividend
CountRy 2010 2050 GRowth
total PoPulation (in millions) % ChG
chIna 1,341 1,296 -3.4%
IndIa 1,225 1,692 38.2%
brazIl 195 223 14.3%
uRban PoPulation (in millions) % ChG
chIna 660 1,002 51.7%
IndIa 379 875 131.1%
brazIl 164 202 22.9%
uRban PoPulation % total ChG (PPt)
chIna 49.2% 77.3% 28.1
IndIa 30.9% 51.7% 20.8
brazIl 84.3% 90.7% 6.4
source: united nations, department of economic and social affairs, Population division (2012). World urbanization Prospects: the 2011 revision. cd-roM edition - data in digital form (PoP/ db/WuP/rev.2011).
despite this shortcoming, India has become an economic force in the global economy: as of 2011, the Indian economy ranked 10th in the world at $1.8 trillion, and its ranking and size are expected to increase to 8th and $2.3 trillion, respectively, by 2014 according to the latest IMF World economic outlook report, given its strong growth profile. driving this growth is a favorable demographic profile (Exhibit 3) that is boosting gdP per capita, as can be seen in Exhibits 4 and 5.
another key driver is productivity improvements throughout its population. In comparison with china, which has benefitted from a rural to urban migration, we believe India is benefitting from not just urbanization but also from rising productivity among its rural population, who are responsible for an increasing share of the country’s manufacturing and services. this is an important nuance that foreign investors may not fully appreciate. however, as we discuss below in more detail, income inequality remains an issue, as the country clearly needs to do more to promote education at the most basic level.
exHibit 4
India has One of the Lowest GDP’s per Capita Worldwide
1,398
1,514
3,488
5,118
5,351
7,240
10,146
10,377
12,718
14,412
22,447
48,383
Vietnam
India
Indonesia
Thailand
China
Colombia
Mexico
Turkey
Brazil
Chile
Korea
U.S.
2011 GDP Per Capita (US$)
data as at october 8, 2012. source: IMF, respective national statistical departments, haver.
exHibit 5
… and a Lot More Growing to Do
0
5,000
10,000
15,000
20,000
25,000
0 2 4 6 8 10 12 14 16 18 20 22 24 26 28 30 32 34 36
GDP per Capita (US$)(Year 0 = GDP per Capita $1000)
China 2001-2011
India 2007-2011
Brazil 1974-2011
Korea 1977-2011
India in the veryearly stages ofdevelopment
data as at october 8, 2012. source: World bank, IMF, respective national statistical departments, haver.
From a gdP perspective, what defines India, particularly relative to china, is its heavy reliance on services, including outsourcing and financial services. While many emerging markets have leveraged their low-cost labor force to build out manufacturing first and then services, India has done almost the exact opposite. India’s tradi-tional manufacturing segment was burdened by heavy regulations

6 KKR InsIghts: global Macro trends
and a lack of reform, whereas the services sector was allowed to grow quickly and efficiently without cumbersome government intervention/oversight. though this is a subtle point, we think it is an important one.
as one can see in Exhibit 6, India’s services exports as a percent-age of total exports are now larger than those of even the united states. the country is also much more balanced across private consumption, government, private investment, and net exports than many of its large emerging market peers. one can see this in Exhibit 7.
exHibit 6
India’s Unique Feature Is Its Service Based Exports Composition
9 13
29 31
91 87
71 69
China Brazil U.S. India
Breakdown of Exports (% of Total Exports)
Services Goods
Larger thanthe U.S.
data as at december 31, 2011. source: International Monetary Fund, haver.
exHibit 7
Economic Profile Somewhere Between the Extremes of China and Brazil
35
13
49
3
58
20
29
-7
60
21 20
-1
71
14
24
-9
Private Consumption
Government Private Investment Net Exports
GDP by Expenditure Category (%)
China
India
Brazil
Turkey
data as at december 31, 2011. source: India central statistical organization, Instituto brasileiro de geografia e estatística, china national bureau of statistics, turkish statistical Institute, haver.
What also separates India from many of its peers, though, is that it consistently runs large deficits, both fiscal and current account. In our view, these policies are not only inefficient but they also affect investor perception about the potency of the country’s currency and the security of its government debt. exacerbating these issues is that, as Exhibit 8 details, India’s public finances have not recovered sufficiently after the deterioration triggered by the great recession. coupled with government corruption charges and the challenges to foreign investment, we believe this has been a drag on India’s gdP growth, which – at around 5.5% – is performing as poorly as it can, given its positive structural labor force growth and productivity improvements (Exhibit 10).
exHibit 8
India’s Public Finances Have a Structural Problem
-7 -7 -7 -10 -10 -9 -10 -10 -10
-8 -7 -5 -5 -8 -10
-8 -7
-15
-10
-5
0
5
10
15
20
25
30
35
1995 1997 1999 2001 2003 2005 2007 2009 2011
India: Public Finances (%)
Deficit % GDP Revenues % GDP Expenditure % GDP
Persistentpublic
overspending
source: Ministry of Finance, department of economic affairs, economic division, “Indian Public Finance statistics 2011-2012”, http://finmin.nic.in/reports/IPFstat201112.pdf
“ Lack of infrastructure
investment, high deficits, and government dysfunction all have tainted India’s standing and its
performance. “

7KKR InsIghts: global Macro trends
exHibit 9
India’s Government Revenues are Low Relative to Other Countries
Government revenuesare too low for thislevel of expenditure
India
Spain
Turkey Brazil
China
Norway
U.S. Japan
Germany
Singapore
Saudi Arabia
Revenue = Expenses Line
Indonesia
Vietnam
10
15
20
25
30
35
40
45
50
55
60
10 20 30 40 50 60
Gov
ernm
ent E
xpen
ditu
re %
GD
P
Government Revenue % GDP
data as at october 8, 2012. source: IMF Weo estimates for 2012.
looking ahead, our base view is that Indian gdP does in fact re-cover in 2013 and beyond. While 9-10% gdP is probably no longer a potential outcome, our research shows that 6.0-6.5% is achiev-able on a more sustainable basis. given that we anticipate global growth may average just 3.5-4.0% or so over the next 3-5 years, we think India’s trajectory still looks quite compelling, particularly its consumption-related stories. Key to our thinking is that positive demographics and productivity trends are the secular long-term drivers that should keep Indian gdP growth among the highest in the world. We also believe that the country can reduce its fiscal deficit closer to 6% in the next few years, though we still anticipate inflation running in the high-single-digit range, well above the cen-tral bank’s unofficial target of 5%4.
From an investment perspective, India remains somewhat of a macro-economic oxymoron, filled with huge strengths and weak-nesses that overlap at times to create both huge opportunities and risks. as discussed below, we believe the key to success in India centers on investing prudently alongside macro themes that have enough momentum to overcome the inevitable challenges in an emerging market with the size and complexity of India.
4 global source Partners Monthly report by ajay shah, India: Uphill Battles dated november 28, 2012.
exHibit 10
Growth has Slipped Signifi cantly
2.0 2.0 2.2 2.1 2.1 2.1 1.7 2.0 1.9 1.9
6.4 6.4 7.0 7.1 7.7
1.8
6.6 7.6
5.0 3.5
8.4 8.4 9.3 9.3
9.8
3.9
8.2
9.6
6.9
5.4
0
2
4
6
8
10
12
2003 2004 2005 2006 2007 2008 2009 2010 2011 1H12
India: Real GDP Growth Y/y
Productivity Labor Force Growth Y/y
Growthhas
slipped
data as at 2Q12. source: united nations World Population Prospects, International labor organization, central statistical organization, India, haver.
exHibit 11
India Credit Ratings Refl ect Macro Concerns About Defi cits
s&P’s issueR Debt RatinG
bbb- 25-aPr-12 outlooK negatIVe
bbb- 25-Feb-11 no change
bbb- 30-Jan-07 uPgrade
bb+ 2-Feb-05 doWngrade
bb 22-oct-98 doWngrade
bb+ 7-dec-92 InItIal ratIng
mooDy’s issueR Debt RatinG
baa3 22-Jan-04 uPgrade
ba1 3-Feb-03 uPgrade
ba2 14-noV-02 no change
ba2 28-Jul-99 InItIal ratIng
fitCh issueR Debt RatinG
bbb- 18-Jun-12 outlooK negatIVe
bbb- 1-aug-06 uPgrade
bb+ 21-Jan-04 uPgrade
bb 21-noV-01 doWngrade
bb+ 8-Mar-00 InItIal ratIng
the above are long term foreign currency debt ratings data as at november 28. 2012. source: bloomberg.

8 KKR InsIghts: global Macro trends
Details
In the following section we drill down on some of the key macro trends in India we think are worthy of investor attention.
Demographics are the Country’s Crown Jewel. I have been doing macro long enough to acknowledge that I am considered some-what of a “wonk,” or at least that is what my friends call me when it comes to demographics. I am fine with this nerdy label as I feel strongly that demographic trends drive both economic growth pat-terns and investment flows. India’s positive demographics are also an important reason to look past some of the issues that surround its massive government inefficiency.
simply stated, India – like brazil, turkey, and Indonesia – is among the global elite in that 50% or more of its population is below the age of 30 (see footnote 2). In fact, the median age of the country is 25.7 years (Exhibit 12), which is about 10 years younger than china (34.9) and the united states (37.0). as a result, as Exhibit 13 shows, growth in India’s working age population from 2010 to 2030 is sup-posed to be positive 31%. this compares to negative 1.1% for china during the same period. such strong growth bodes well for gdP per capita, which in our view, could grow as much as 8% per year over the next 4-5 years (Exhibit 14).
exHibit 12
Median Age in India is About 10 Years Less Than the US and China
1980, 20.1
2012 25.7
2050 37.2
2090, 45.1
35.2
48.7
37.0
40.0
15
20
25
30
35
40
45
50
55
1960 1980 2000 2020 2040 2060 2080
India : Median Age
India
China
U.S.
Years
About 10 years younger than China and U.S.
data as at May 10, 2011. source: united nations World Population Prospects, haver.
exHibit 13
Growth in the Working Age Population Between 2010 and 2030 is Expected to Be 31% Versus -1.1% for China
790
1034
1143
971
960
790
400
500
600
700
800
900
1000
1100
1200
1970 1990 2010 2030 2050 2070
India: Working Age Population
India
China
Millions
Shrinking China labor force -1.1%
Growing labor force in India
+31.0%
data as at september 26, 2012. source: united nations World Population Prospects, haver.
exHibit 14
GDP Per Capita Tripled Over the Past Decade; We Think There is More Ahead
279
478
1,514
2,201
0
500
1000
1500
2000
1980 1984 1988 1992 1996 2000 2004 2008 2012 2016
India: GDP Per Capita
US$ Per Person
CAGR 2001-2011
11.3% CAGR
1980-2001 2.6%
CAGR 8% per IMF
estimates
data as at october 8, 2012. 2016 estimate per IMF. source: IMFWeo oct 2012.
like its latin american peer brazil, India is also experiencing a dramatic shift in the composition of its population. as one can see in Exhibit 15, the poorest part of the population is expected to shrink to “just” 22% of the overall population by 2025 versus 80% in 1995. during this same period, we expect the middle income and upper middle income segments to grow meaningfully. all told, by 2015, In-dia’s middle class should be north of 250 million, and it could reach
9KKR InsIghts: global Macro trends
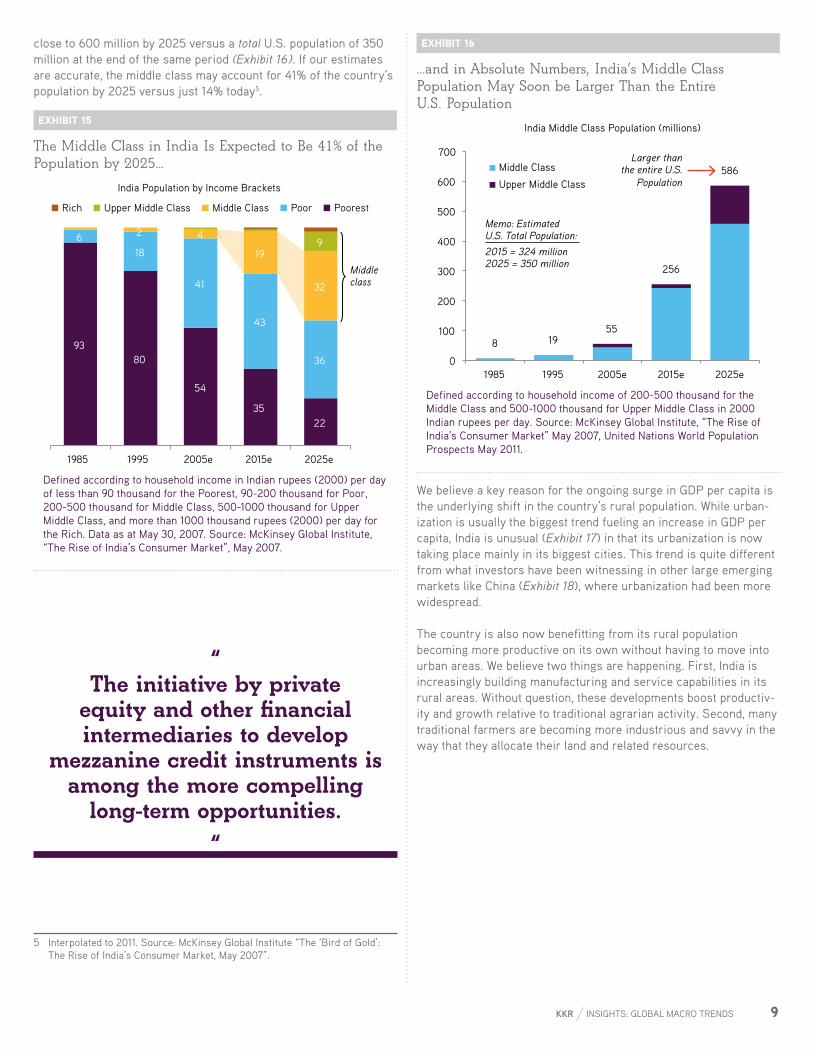
close to 600 million by 2025 versus a total u.s. population of 350 million at the end of the same period (Exhibit 16). If our estimates are accurate, the middle class may account for 41% of the country’s population by 2025 versus just 14% today5.
exHibit 15
The Middle Class in India Is Expected to Be 41% of the Population by 2025…
93 80
54
35 22
6 18
41
43
36
2 4
19
32
9
1985 1995 2005e 2015e 2025e
India Population by Income Brackets
Rich Upper Middle Class Middle Class Poor Poorest
Middle class
defined according to household income in Indian rupees (2000) per day of less than 90 thousand for the Poorest, 90-200 thousand for Poor, 200-500 thousand for Middle class, 500-1000 thousand for upper Middle class, and more than 1000 thousand rupees (2000) per day for the rich. data as at May 30, 2007. source: McKinsey global Institute, “the rise of India’s consumer Market”, May 2007.
5 Interpolated to 2011. source: McKinsey global Institute “the ‘bird of gold’: the rise of India’s consumer Market, May 2007”.
exHibit 16
…and in Absolute Numbers, India’s Middle Class Population May Soon be Larger Than the Entire U.S. Population
8 19 55
256
586
0
100
200
300
400
500
600
700
1985 1995 2005e 2015e 2025e
India Middle Class Population (millions)
Middle Class
Upper Middle Class
Memo: Estimated U.S. Total Population: 2015 = 324 million 2025 = 350 million
Larger thanthe entire U.S.
Population
defined according to household income of 200-500 thousand for the Middle class and 500-1000 thousand for upper Middle class in 2000 Indian rupees per day. source: McKinsey global Institute, “the rise of India’s consumer Market” May 2007, united nations World Population Prospects May 2011.
We believe a key reason for the ongoing surge in gdP per capita is the underlying shift in the country’s rural population. While urban-ization is usually the biggest trend fueling an increase in gdP per capita, India is unusual (Exhibit 17) in that its urbanization is now taking place mainly in its biggest cities. this trend is quite different from what investors have been witnessing in other large emerging markets like china (Exhibit 18), where urbanization had been more widespread.
the country is also now benefitting from its rural population becoming more productive on its own without having to move into urban areas. We believe two things are happening. First, India is increasingly building manufacturing and service capabilities in its rural areas. Without question, these developments boost productiv-ity and growth relative to traditional agrarian activity. second, many traditional farmers are becoming more industrious and savvy in the way that they allocate their land and related resources.
“ The initiative by private
equity and other financial intermediaries to develop
mezzanine credit instruments is among the more compelling
long-term opportunities. “

10 KKR InsIghts: global Macro trends
exHibit 17
Up Until 1988, India was Actually Ahead of China in the Traditional Urbanization Process
1988, 25 2010, 31
2010, 49
15
20
25
30
35
40
45
50
1960 1965 1970 1975 1980 1985 1990 1995 2000 2005 2010
Urban Population % of Total
India China
data as at september 20, 2012. source: the 2012 revision of the World Population Prospects, haver.
exHibit 18
India’s Urbanization Has Been Concentrated Towards the Largest Cities
10.4 15.5 14.7
5.3 8.4 14.4
6.7 6.0 8.1
6.0 4.8
7.6 10.4
10.2 14.7
14.7 16.6
17.5 19.8
24.5 23.0
1980 1990 2000 2010 1980 1990 2000 2010
Percentage of Urban Population by Size of City
10 million or more 5 to 10 million 1 to 5 million
Urban growth in China concentrated in middle
tier cities
Urban growth in India concentrated in the
biggest cities
India China
source: united nations, department of economic and social affairs, Population division (2012). World urbanization Prospects: the 2011 revision. cd-roM edition - data in digital form (PoP/ db/WuP/rev.2011).
given these tailwinds, we think India is in a strong position to enjoy further substantial gains in productivity and gdP per capita because the country’s transformation is still in its early days (Ex-hibit 19). according to studies done by nomura securities and the Federal reserve bank of India, a full 57% of the population is still in agricultural related positions today versus just 30% in services and 13% in industry. but from a gdP contribution perspective, agricul-ture only accounts for 17% of the country’s economy versus a much more robust 56% for services and 27% for industry (Exhibit 20). as this 57% of the population transitions towards more manufactur-
ing and services jobs, we believe it should drive significant gdP growth for the foreseeable future. also, as the government imple-ments more productive and more efficient pay-for-work programs in rural areas, we believe it too will boost gdP per capita.
exHibit 19
India is Enjoying a Sustainable Productivity Boom
3.0 2.9
2.4
2.2
2.3
2.4
2.5
2.6
2.7
2.8
2.9
3.0
3.1
3.2
0
10,000
20,000
30,000
40,000
50,000
60,000
70,000
80,000
2000
2001
2002
2003
2004
2005
2006
2007
2008
2009
2010
2011
India Real GDP Per Capita (Rs 2004)
Urban GDP per Capita Rural GDP per Capita Urban / Rural GDP per Capita
CAGR 2011 vs 2002:Urban 5.1%;Rural 7.4%
data as at april 19, 2012. source: credit suisse “the great Indian equalization”, Ministry of statistics & Program Implementation.
exHibit 20
India Is More Service Based While China Is More Manufacturing Based
10
47 43
17
27
56
5
28
67
Agriculture& Livestock
Manufacturing & Mining & Construction
Services
GDP by Industry (%)
China India Brazil
India is more service based China is more
manufacturing based
data as at december 31, 2011. source: India central statistical organization, Instituto brasileiro de geografia e estatística, china national bureau of statistics, haver.
a rising middle class means certain sectors, including housing, education, healthcare, retailing and financial services, should prosper.
during our travel around the emerging markets the last 17 years, our research has shown that there is a multiplier effect on con-
11KKR InsIghts: global Macro trends
sumption as gdP per capita reaches $1,000 and above: demand for branded consumables typically soars, healthcare preferences change, and home ownership becomes a priority (Exhibit 23). this pattern is significant for India, which is now just crossing the $1,000 threshold, and it seemed clear from our visit with executives across a variety of industries that they are seeing a transforma-tional change in consumer behavior.
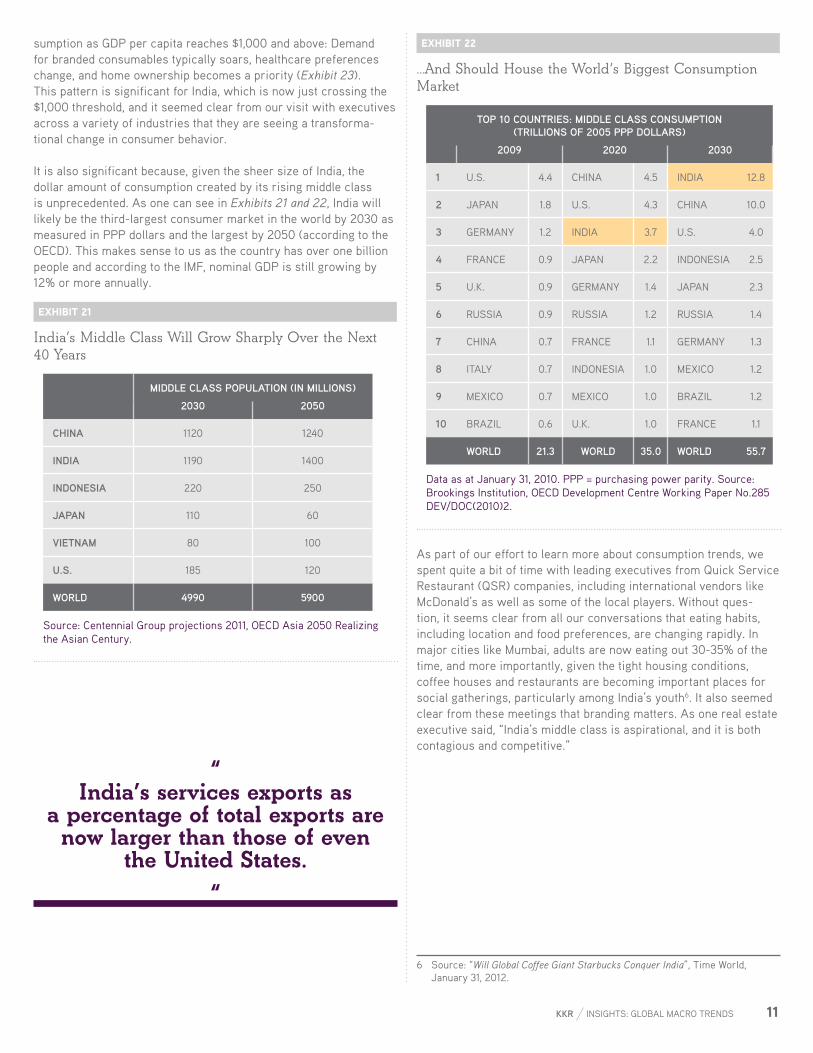
It is also significant because, given the sheer size of India, the dollar amount of consumption created by its rising middle class is unprecedented. as one can see in Exhibits 21 and 22, India will likely be the third-largest consumer market in the world by 2030 as measured in PPP dollars and the largest by 2050 (according to the oecd). this makes sense to us as the country has over one billion people and according to the IMF, nominal gdP is still growing by 12% or more annually.
exHibit 21
India’s Middle Class Will Grow Sharply Over the Next 40 Years
miDDle Class PoPulation (in millions)
2030 2050
China 1120 1240
inDia 1190 1400
inDonesia 220 250
JaPan 110 60
Vietnam 80 100
u.s. 185 120
woRlD 4990 5900
source: centennial group projections 2011, oecd asia 2050 realizing the asian century.
exHibit 22
…And Should House the World’s Biggest Consumption Market
toP 10 CountRies: miDDle Class ConsumPtion (tRillions of 2005 PPP DollaRs)
2009 2020 2030
1 u.s. 4.4 chIna 4.5 IndIa 12.8
2 JaPan 1.8 u.s. 4.3 chIna 10.0
3 gerManY 1.2 IndIa 3.7 u.s. 4.0
4 France 0.9 JaPan 2.2 IndonesIa 2.5
5 u.K. 0.9 gerManY 1.4 JaPan 2.3
6 russIa 0.9 russIa 1.2 russIa 1.4
7 chIna 0.7 France 1.1 gerManY 1.3
8 ItalY 0.7 IndonesIa 1.0 MexIco 1.2
9 MexIco 0.7 MexIco 1.0 brazIl 1.2
10 brazIl 0.6 u.K. 1.0 France 1.1
woRlD 21.3 woRlD 35.0 woRlD 55.7
data as at January 31, 2010. PPP = purchasing power parity. source: brookings Institution, oecd development centre Working Paper no.285 deV/doc(2010)2.
as part of our effort to learn more about consumption trends, we spent quite a bit of time with leading executives from Quick service restaurant (Qsr) companies, including international vendors like Mcdonald’s as well as some of the local players. Without ques-tion, it seems clear from all our conversations that eating habits, including location and food preferences, are changing rapidly. In major cities like Mumbai, adults are now eating out 30-35% of the time, and more importantly, given the tight housing conditions, coffee houses and restaurants are becoming important places for social gatherings, particularly among India’s youth6. It also seemed clear from these meetings that branding matters. as one real estate executive said, “India’s middle class is aspirational, and it is both contagious and competitive.”
6 source: “Will Global Coffee Giant Starbucks Conquer India”, time World, January 31, 2012.
“ India’s services exports as
a percentage of total exports are now larger than those of even
the United States. “

12 KKR InsIghts: global Macro trends
exHibit 23
As the Income Brackets Evolve, So Too Will Consumption Patterns
0%
10%
20%
30%
40%
50%
60%
70%
80%
90%
100%
1995 2005e 2015e 2025e
Share of Average Annual Household Consumption
Health Care
Education, Recreation
Communication
Transportation
Personal Pdcts & Svcs
Household Pdcts
Housing, Utilities
Apparel
Food, Bev & Tobacco
data as at May 2007. source: McKinsey global Institute, “the rise of India’s consumer Market”.
healthcare is another sector that we think holds a lot of potential for private investors on a long-term basis. at the moment, the government is trying to improve upon its status as one of the lowest public allocators to healthcare services. today, the healthcare in-dustry is a $66b industry, of which 29% is public and 71% is private spending7. however, the industry is expected to reach us$280b by 2020, implying an annualized growth rate of 15.5%8.
driving this strong growth are initiatives to attack both inefficien-cies and deficiencies. according to the World bank, there are just 9 hospital beds and 7 doctors per 10,000 people. as Exhibit 24 highlights, that is well below the figures for china and brazil. If there is good news, it is that some of the shortfall in public spend-ing is being offset by more efficient private spending, particularly by the growing middle and upper income segments. as noted above, private spending on healthcare is already twice the level of public spending (Exhibit 25). however, as the chart also shows, overall aggregate spending on healthcare in India is just too low, and as the middle income consumer continues to flourish, we expect to see major growth in basic services like clinics, wellness facilities, and private hospitals, similar to what we see in other emerging markets like brazil.
7 source: World health organization, global health expenditure database, data for year 2010 retrieved on october 5, 2012.
8 source: India brand equity Foundation (IbeF) “healthcare, november 2012” www.ibef.org, KPMg “emerging trends in healthcare” dated February 17, 2011.
exHibit 24
HealthCare Facilities and Services are Lacking
9 16
24 30 33
42
103
137
7 20 18
24 27 14
20 21
Indi
a
Mex
ico
Bra
zil
U.S
.
U.K
.
Chi
na
Kore
a
Japa
n
Hospital Beds (per 10,000 People)
Physicians (per 10,000 People)
Just 9 beds and 7 physicians per
10,000 people
hospital beds as of 2009, India latest as of 2005. Physicians as of 2010. source: World bank, haver.
“ India—like Brazil, Turkey, and
Indonesia—is among the global elite in that 50% or more of its
population is below the age of 30. “

13KKR InsIghts: global Macro trends
exHibit 25
India’s HealthCare Spending is Among the Lowest in Emerging Markets
1.2 1.4 2.3 3.5 4.4 3.1 4.0 6.9
4.1 8.2 8.3
1.1 2.8 2.3
1.9 1.6 3.3 2.9 1.6
4.9
1.6
9.1
2.4 4.2 4.6
5.4 6.1 6.4 6.9 8.5 9.0 9.8
17.4
Indo
nesi
a
Indi
a
Chi
na
Rus
sia
Turk
ey
Mex
ico
Kore
a
Japa
n
Bra
zil
U.K
.
U.S
.
Public & Private Expenditure on Health Care % GDP
Public Private
2/3 private1/3 public
2009 or latest available year. source: oecd Factbook 2011: economic, environmental and social statistics - Isbn 978-92-64-11150-9 - © oecd 2011.
education is another area that deserves both private and public sector attention if India is to fulfill its potential as an economic powerhouse, in our view. though India’s primary resource is its outsized and youthful population, the current level of skill, educa-tion, and training is low relative to many other countries. our belief is that India should mimic its peers in latin america and spend much more heavily on basic education rather than on university level programs. Without question, we believe this type of initiative has been key to greater income equality we now see first-hand in countries like brazil.
on the public side, we estimate that total spending on education is just 3% of gdP versus 5.4% in the united states and 5.7% in brazil (Exhibit 27). given such inadequate spending by the government, productivity is being hampered as more than one-third of adults in India remain illiterate (Exhibit 26). Importantly, thus far the private sector is not making up the difference, with the private education market currently estimated at just 2% of gdP or roughly us$39 billion.
looking ahead, estimates are for the private education market to grow to at least us$64 billion over the next five years (10.2% cagr9). Probably more important, though, is that many of the private initiatives being introduced tend to be more focused on vocational training and technical education, not the elementary or primary edu-cation10 that we think is so desperately needed by the country.
9 source: KKr gMaa estimates based on education and consumption data from the Indian national sample survey organization consumer expenditure survey, which puts private education expenditure at roughly 2% of gdP, and IMF Weo oct 2012 nominal gdP estimates.
10 the right of children to Free and compulsory education act or right to education act was passed on 4 august 2009 and put into force on 1 april 2010, giving every child, aged six to fourteen, the right to education. under this act, schools must allocate a minimum of 25% of seats for free and compulsory elementary education. source: government of India, Ministry of
exHibit 26
One-Third of the Indian Population is Illiterate
5 6
7 7 8 6
26 31
17
28
16
22
33
15
17
19
21
23
25
27
29
31
33
35
0
5
10
15
20
25
30
Philippines China Mexico Vietnam Indonesia Brazil India
Adult Illiteracy Rate (Left) Primary Level Pupil-Teacher Ratio (Right)
%Students per
Teacher
Extremely high illiteracy andhigh pupil-to-teacher ratio
literacy as at 2010 or latest available, Pupil-to-teacher ratio as at 2010. source: World bank, uIs unesco, haver.
exHibit 27
Public Spending on Education is Just 3% of GDP
2.7 3.1 3.3 3.5
5.3 5.3 5.4 5.7
Philippines India China Indonesia Mexico Vietnam U.S. Brazil
Public Spending on Education % GDP
Government spending on
education is just 3% of GDP
data as at december 31, 2009, Vietnam as of 2008, India as of 2006. source: World bank, haver.
Within financial services, there is also significant opportunity for investors. In particular, there is a reason that certain leading non-banking financial services companies have consistently delivered solid returns to shareholders: they have succeeded by focusing on one of the biggest opportunities in India—credit extension, includ-ing mortgages, to a rising middle class. as of the latest census data (2011), listed total households were just 276 million, which pales in comparison to the population of 1.24 billion people (see footnote 2). I am no math major, but this equates to roughly 4.5 persons per house versus 2.7 persons in the u.s., 3.0 in china, and 3.3 in brazil
human resource development http://mhrd.gov.in/policy_initiatives, right to education, http://www.rteindia.com/

14 KKR InsIghts: global Macro trends
(Exhibit 28). We believe as this gap narrows, it should be construc-tive for all housing-related activities. Moreover, our research shows that only 153 million or 55% of homes are made of concrete (Exhibit 30), which is the preferred building material for India’s climate conditions. as individuals continue their steady migration towards bigger and better homes, there is a significant opportunity for finan-cial services companies to provide access to mortgage and other lending products (Exhibit 29).
exHibit 28
India Needs a Lot More Homes
2.7 3.0
3.3
4.5
U.S. China Brazil India
Persons per Household
data as at september 22, 2012. source: report of the technical group on urban housing shortage (tg-12) (2012-17) dated september 22, 2012, china national bureau of statistics average persons per household in 2011, and brazil 2010 Population census summary www.censo2010.ibge.gov.br
exHibit 29
Mortgage Penetration is Low
8
17 20
36
47
77 85
India Thailand China Korea Germany U.S. U.K.
Mortgages % GDP
data as at december 31, 2010. source: hdFc estimates for India, european Mortgage Federation.
to date, most housing activity in India has been in urban areas, which is consistent with what we see in other emerging markets. between 2001 and 2011, India’s urban housing stock grew at 4.3%, outpacing urban population growth of 2.6% by 170bp (Exhibit 31). despite the rapid growth in urban housing throughout India, the ratio of people to homes is 4.8 to 1 in cities, which is just slightly
above the ratio for rural areas at 4.411.
We also take comfort that leverage levels and consumer profiles appear reasonable in India. using (housing development Finance corporation (hdFc) as a proxy for the market, we learned that the average home price was around 2.1 million rupees (around $40,000), with an after-interest cost of around 10.25% gross and 6.4% net after certain deductions as percent of income12. Moreover, hdFc’s loan to value ratios are around 65%, and most customers are 33-36 years old, typically older and more settled than first-time buyers in other emerging markets we visit.
exHibit 30
Only 55% of Houses in India are Made of Concrete
India: Housing Stock per 2011 Census (in millions)
55%
22%
11%
7%
0
50
100
150
200
250
300
India: 2011 Housing Stock
Any Other
Unserviceable
Serviceable
Temporary(primarily of mud and soil)
Semi-Permanent(soil & concrete)
Permanent(primarily of concrete)
data as at september 22, 2012. source: report of the technical group on urban housing shortage (tg-12) (2012-17).
11 source: report of the technical group on urban housing shortage (tg-12) (2012-17) dated sep 22, 2012.
12 source: hdFc estimates for the year 2012. hdFc Investor Presentation dated september 2012 available at http://www.hdfc.com/pdf/hdFc_oct12_26.pdf
“ By 2015, India’s middle class will be north of 250 million,
and it could reach close to 600 million by 2025 versus a total U.S. population of 350 million
at that time. “

15KKR InsIghts: global Macro trends
exHibit 31
India’s Urban Housing Stock is Growing at a Rapid Clip
13.3 18.5
28.0
39.3
51.0
77.5
0
10
20
30
40
50
60
70
80
90
1961 1971 1981 1991 2001 2011
India: Urban Housing Stock* (in millions)
Permanent (Concrete) Non-Permanent (Mud/Soil)
CAGR 3.4%
CAGR 4.2%
CAGR 3.4%
CAGR 2.6%
CAGR 4.3%
data as at september 22, 2012. source: report of the technical group on urban housing shortage (tg-12) (2012-17) dated september 22, 2012.
as we mentioned earlier, another area within financial services where we are long-term positive is the growing mezzanine and na-scent high-yield market. local and developed market investors who want exposure to India and its currency can buy high-quality credit with yields that often dwarf what is available in the u.s. and europe after Quantitative easing III (Qe3) and outright Monetary transac-tions (oMt). also, we believe the duration of these investments leaves investors less susceptible to the exit costs of volatile stock market indices. at the same time, there is an increasing supply of credit instruments from small but fast-growing Indian companies that either 1) want access to capital outside bank loans or the sale of equity or 2) just can’t get access to capital. these instruments are an innovative way to access financing at reasonable terms, ex-pand the investor base, and create a more efficient capital structure (Exhibit 32 and 33).
exHibit 32
INR Bond Issuance Volumes Moderated In 2011 on Account of a High Interest Rate Environment
12
22 26
36 35
42
35
2005 2006 2007 2008 2009 2010 2011
INR Bond Issuance Volume (US$B)
source: citigroup report 2011: a Year of contrasting halves, January 2012.
exHibit 33
Non-Traditional Lenders Are Now Taking Market Share From Traditional Financial Intermediaries
46%
14%
32%
3%
5%
Issuance
PSU Banks / Financial Institutions
Private Sector Corporates
Private Sector Non-Bank Financial Companies (NBFCs)
Private Sector Banks / Financial Institutions
PSU Corporates
source: citigroup report 2011: a Year of contrasting halves, January 2012.
on the wholesale side of the financial services industry, we have much greater reservations. It appears that many banks lent far too much to power distribution companies and now are paying the price. the blackout in July 2012 marked the largest power outage in the world to date, affecting more than 600 million people or 9% of the world’s population. It also highlighted the severity of India’s infrastructure problems and the shortage of capital. the power companies ran out of money because they were forced to sell power at prices materially below their costs of production,13 which is leading to higher loan losses (Exhibit 34).
not surprisingly, bank loans to the power sector are now being
13 source: reserve bank of India Financial stability reports dated december 2011 and June 2012 chap III.

16 KKR InsIghts: global Macro trends
called into question, and as a result, liquidity has dried up. this situation is significant as existing loans to the power sector are 8% of total credit in India (Exhibit 35). In the latest turn of events, a restructuring was announced in september under which 50% of short-term loans to the sector will be taken over by state govern-ments and converted to bonds, while the other half will be restruc-tured by banks. In our view, the bigger picture issue is that the power sector’s misfortunes are among a series of missteps (includ-ing telecom and airlines) that are hampering India’s effort to fix the infrastructure issues that are holding back economic growth.
exHibit 34
Non-Performing Asset Ratios Driven by Restructured Loans
0
1
2
3
4
5
6
7
8
2008 2009 2010 2011
India: Problem Bank Loans as a % of Total
Non-performing Restructured
data as at March 31, 2012. source: reserve bank of India.
exHibit 35
The Risks of Bad Loans Are Spreading Beyond Power Towards the Infrastructure Sector
Telecom 2%
Roads 3%
Metals 6%
Textiles 4%
Infrastructure 14%
Power 8%
Services 23%
Housing 9%
Personal Loans
9%
Other 22%
India: Total Bank Credit Rs 45 Trillion
data as at august 31, 2012. source: clsa asia-Pacific Markets, rbI.
Caveat Emptor
as I think about the Indian economy, I am reminded of a famous quote by William a. Foster that “Quality is never an accident; it is al-ways the result of high intention, sincere effort, intelligent direction, and skillful execution; it represents the wise choice of many alter-natives.” We would argue that the Indian government has not made “the wise choice of many alternatives” when it comes to macro-economic policy of late. In particular, the government has spent too much time and money encouraging consumption, and it now runs a central government fiscal deficit of 8.7%. this is not ‘new’ news, as India’s fiscal deficit exceeded 7% in 12 of the last 15 years14.
In our view, India needs to tackle at least four major problems in order to structurally “turn the corner.” First, the country needs to invest more on infrastructure at the expense of consumption. In particular, government spending in this area has actually fallen to 25% of total capital spending in 2010 from 51% in 1980 (Exhibit 36). the absence of government investment in key areas like infrastruc-ture and public transportation has led to huge economic inefficien-cies that are wreaking havoc in areas like agriculture and exports.
exHibit 36
Reliance on Private Investment has Grown
20
22
15 14
17
20 34
26
4942
5142
30 25
55
29 43
35 40 47 36
0
20
40
60
80
100
1950 1960 1970 1980 1990 2000 2010
India: Gross Capital Formation Breakdown
Public Corporate Household Valuables
75%private
data as at december 31, 2010. source: India central statistical organization, haver.
14 reserve bank of India as at 2Q12.
17KKR InsIghts: global Macro trends
exHibit 37
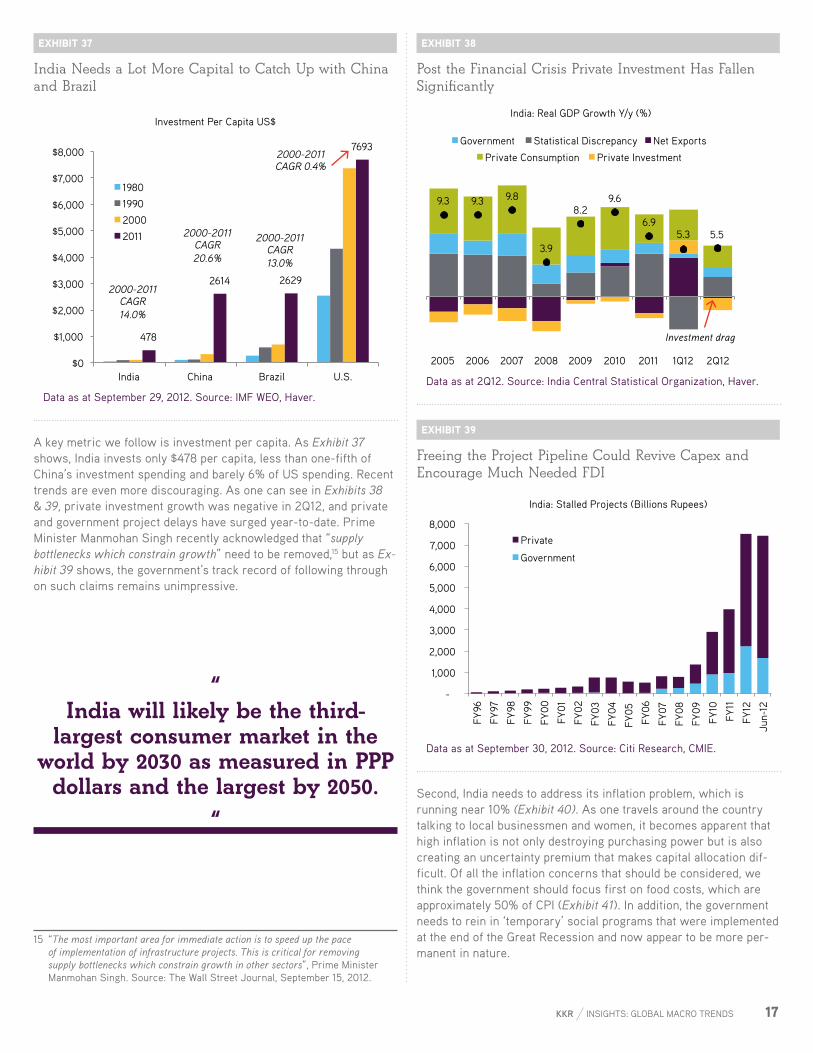
India Needs a Lot More Capital to Catch Up with China and Brazil
Investment Per Capita US$
478
2614 2629
7693
$0
$1,000
$2,000
$3,000
$4,000
$5,000
$6,000
$7,000
$8,000
India China Brazil U.S.
1980
1990
2000
2011 2000-2011 CAGR 20.6%
2000-2011 CAGR 0.4%
2000-2011 CAGR 13.0%
2000-2011 CAGR 14.0%
data as at september 29, 2012. source: IMF Weo, haver.
a key metric we follow is investment per capita. as Exhibit 37shows, India invests only $478 per capita, less than one-fifth of china’s investment spending and barely 6% of us spending. recent trends are even more discouraging. as one can see in Exhibits 38& 39, private investment growth was negative in 2Q12, and private and government project delays have surged year-to-date. Prime Minister Manmohan singh recently acknowledged that “supply bottlenecks which constrain growth” need to be removed,15 but as Ex-hibit 39 shows, the government’s track record of following through on such claims remains unimpressive.
15 “The most important area for immediate action is to speed up the pace of implementation of infrastructure projects. This is critical for removing supply bottlenecks which constrain growth in other sectors”, Prime Minister Manmohan singh. source: the Wall street Journal, september 15, 2012.
exHibit 38
Post the Financial Crisis Private Investment Has Fallen Signifi cantly
9.3 9.3 9.8
3.9
8.2 9.6
6.9 5.3 5.5
2005 2006 2007 2008 2009 2010 2011 1Q12 2Q12
India: Real GDP Growth Y/y (%)
Private Consumption Private Investment
Government Net Exports Statistical Discrepancy
Investment drag
data as at 2Q12. source: India central statistical organization, haver.
exHibit 39
Freeing the Project Pipeline Could Revive Capex and Encourage Much Needed FDI
-
1,000
2,000
3,000
4,000
5,000
6,000
7,000
8,000
FY96
FY97
FY98
FY99
FY00
FY01
FY02
FY03
FY04
FY05
FY06
FY07
FY08
FY09
FY10
FY11
FY12
Jun-
12
India: Stalled Projects (Billions Rupees)
Private
Government
data as at september 30, 2012. source: citi research, cMIe.
second, India needs to address its inflation problem, which is running near 10% (Exhibit 40). as one travels around the country talking to local businessmen and women, it becomes apparent that high inflation is not only destroying purchasing power but is also creating an uncertainty premium that makes capital allocation dif-ficult. of all the inflation concerns that should be considered, we think the government should focus first on food costs, which are approximately 50% of cPI (Exhibit 41). In addition, the government needs to rein in ‘temporary’ social programs that were implemented at the end of the great recession and now appear to be more per-manent in nature.
“India will likely be the third-
largest consumer market in the world by 2030 as measured in PPP
dollars and the largest by 2050.“

18 KKR InsIghts: global Macro trends
exHibit 40
Inflation Has Declined But Still Remains Uncomfortably High, Keeping Policy Rates High
10.9%
7.8%
16.7%
9.7%
-2%
0%
2%
4%
6%
8%
10%
12%
14%
16%
18%
2005 2006 2007 2008 2009 2010 2011 2012
India: Inflation vs. Policy Rate
India WPI y/y India CPI Y/y Repo Rate
data as at september 30, 2012. source: Ministry of commerce and Industry, Ministry of statistics& Programme Implementation, reserve bank of India, haver.
exHibit 41
Inflation Is Very Sensitive to Food Prices
61% 41%
15%
9%
24% 50%
Wholesale Price Index (WPI) Consumer Price Index (CPI)
India: Inflation Weights (%)
Other Fuel and Power Food, Beverages, & Tobacco
data as at april 18, 2012. source: reserve bank of India, Ministry of statistics& Programme Implementation, haver.
third, the government needs to raise taxes and cut expenses, in-cluding subsidies. In particular, after granting subsidies during the great recession to stoke growth, the government failed to roll these incentives back in 2010. as a result, subsidies as a percentage of gdP jumped to 2.4% this year from 1.4% in 2007 and 2008, which has had a clear impact on the country’s deficits and inflation rate16.
We acknowledge that India has been successful running large defi-cits for decades. but that was then. today, as the world becomes more interconnected, imbalances matter even more, and we view the recent threat of a ratings downgrade as an early warning that
16 citigroup, budget documents as at april 30, 2012.
greater discipline is required by both politicians and central bank-ers. beyond the potential ratings downgrade, the currency recently suffered a 20%+ fall before recovering. that type of performance is extremely damaging to the foreign investors who cover domestic shortfalls in funding with their capital. as Exhibit 44 shows, this trend has not been lost on the investment community, as India is increasingly covering its deficits through ‘hot’ money flows instead of longer-term foreign direct investment (FdI).
exHibit 42
India Runs a Trade Deficit…
2004, -1.8
2Q12, -8.9-10
-8
-6
-4
-2
0
2
1950 1960 1970 1980 1990 2000 2010
India: Net Exports % Real GDP
Net exports are innegative territory primarilydue to oil imports
data as at 2Q2012. source: India central statistical organization, haver.
exHibit 43
…Primarily Due to the Thirst for Oil
1Q12, -6.4
-7
-6
-5
-4
-3
-2
-1
0
1
2
-120
-100
-80
-60
-40
-20
0
20
2006 2007 2008 2009 2010 2011 2012
Oil Trade Balance LTM (Left Axis)
Oil Trade Balance % GDP (Right Axis) $B %
Trailing 4-Quarters
data as at 2Q2012. source: India central statistical organization, haver.

19KKR InsIghts: global Macro trends
exHibit 44
Unlike the Recent Past, Funding is No Longer Coming Through Direct Investment
India: Financial Account $m
-20,000
0
20,000
40,000
60,000
80,000
100,000
120,000
2001
2002
2003
2004
2005
2006
2007
2008
2009
2010
2011
1H12
Direct Investment (Net) Portfolio Investment (Net) Loans (Net) Other
FDI
Less FDI,more portfolio
flows
data as at 2Q2012. source: India central statistical organization, haver.
Fourth, the government needs to make India an easier place to do business. critics clamor that India is a “democracy that has run amok.” We think that is an overstatement, but the country needs to push a more pro-business agenda and build a more predictable en-vironment. see below for details, but according to the World bank’s “doing business 2012” report, India ranks 132 out of 183 countries in terms of ease of doing business (Exhibit 45). If there is good news, it is that tax-paying, regulated businesses do not face quite the same headwinds in India that they face in some other high-profile emerg-ing markets, including china, Mexico, and brazil. as a result, the drag from the shadow economy is much smaller (Exhibit 46).
exHibit 45
The Regulatory Environment Makes Doing Business in India Difficult
u.s
.
mex
iCo
Ch
ina
Rus
sia
bR
azi
l
inD
ia
ease oF doIng busIness
4 53 91 120 126 132
ease In startIng a busIness (1=easY)
13 75 151 111 120 166
daYs to start a busIness
6 9 38 30 119 29
tIMe to PrePare taxes (hours)
187 347 398 290 2600 254
ease In gettIng credIt (1=easY)
4 40 67 98 98 40
ProtectIng InVestors ranK (1=strong)
5 46 97 111 79 46
ease In gettIng electrIcItY (1=easY)
17 142 115 183 51 98
ease oF enForcIng contracts (1=easY)
7 81 16 13 118 182
Years to resolVe InsolVencY
1.5 1.8 1.7 2 4 7
corruPtIon (0=More corruPt)
7.1 3 3.6 2.4 3.8 3.1
data as at december 31, 2011. source: the World bank, “doing business 2012” Isbn: 978-0-8213-8833-4, transparency International’s corruption Perceptions Index where 10-less corrupt 0-More corrupt.
exHibit 46
Despite a Low GDP Per Capita, India’s Shadow Economy is Relatively Small
21
38
48
12
29 29
37 41
1.5 2.3
5 5
10 10
13 13
0
2
4
6
8
10
12
14
Indi
a
Phi
lippi
nes
Thai
land
Chi
na
Mex
ico
Turk
ey
Bra
zil
Rus
sia
0
10
20
30
40
50
60
Shadow Economy % GDP (Left Axis) GDP per Capita $'000 (Right Axis)
Relativelysmall
shadoweconomy
shadow economy for year 2007 from the World bank development research group: Poverty and Inequality team & europe and central asia region human development economics unit July 2010. gdP per capita for the year 2011 as per IMF Weo oct 2012.
“ We expect India’s trading multiple
to vacillate between 12-14x over the next few years as the country works through some of its macro-
economic headwinds. “
20 KKR InsIghts: global Macro trends
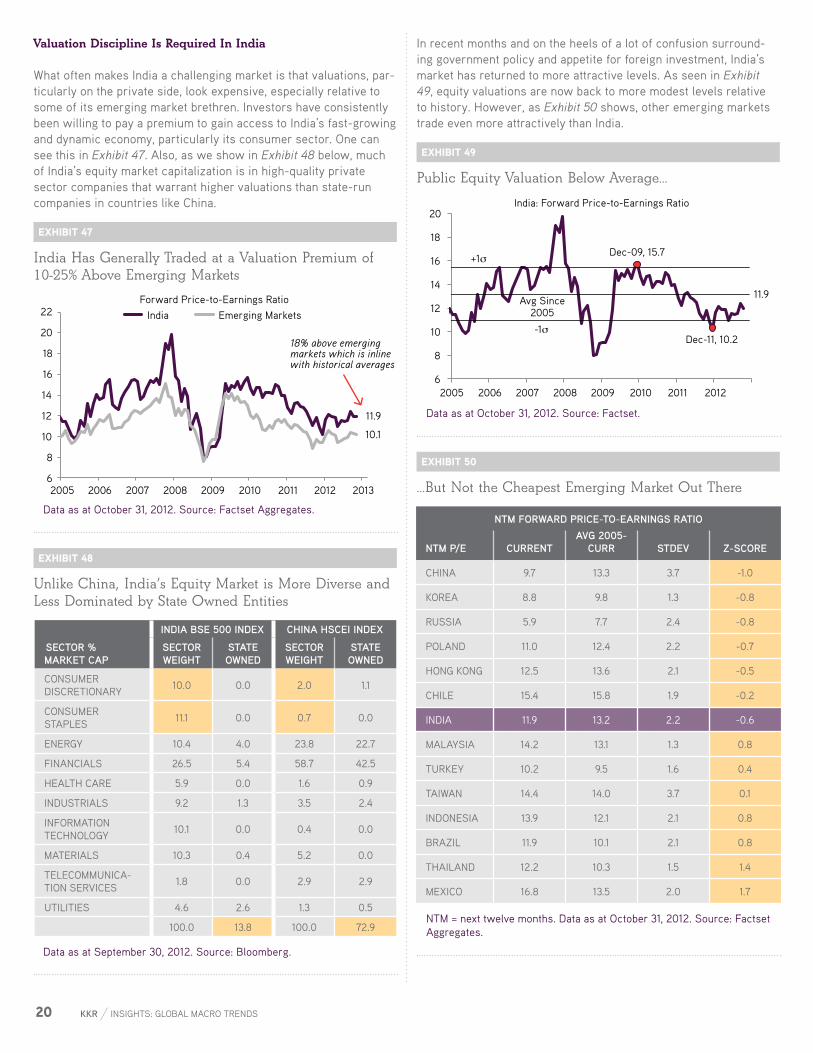
Valuation Discipline Is Required In India
What often makes India a challenging market is that valuations, par-ticularly on the private side, look expensive, especially relative to some of its emerging market brethren. Investors have consistently been willing to pay a premium to gain access to India’s fast-growing and dynamic economy, particularly its consumer sector. one can see this in Exhibit 47. also, as we show in Exhibit 48 below, much of India’s equity market capitalization is in high-quality private sector companies that warrant higher valuations than state-run companies in countries like china.
exHibit 47
India Has Generally Traded at a Valuation Premium of 10-25% Above Emerging Markets
18% above emergingmarkets which is inlinewith historical averages
11.9
10.1
6
8
10
12
14
16
18
20
22
2005 2006 2007 2008 2009 2010 2011 2012 2013
Forward Price-to-Earnings RatioIndia Emerging Markets
data as at october 31, 2012. source: Factset aggregates.
exHibit 48
Unlike China, India’s Equity Market is More Diverse and Less Dominated by State Owned Entities
seCtoR % maRKet CaP
inDia bse 500 inDex China hsCei inDex
seCtoR weiGht
state owneD
seCtoR weiGht
state owneD
consuMer dIscretIonarY
10.0 0.0 2.0 1.1
consuMer staPles
11.1 0.0 0.7 0.0
energY 10.4 4.0 23.8 22.7
FInancIals 26.5 5.4 58.7 42.5
health care 5.9 0.0 1.6 0.9
IndustrIals 9.2 1.3 3.5 2.4
InForMatIon technologY
10.1 0.0 0.4 0.0
MaterIals 10.3 0.4 5.2 0.0
telecoMMunIca-tIon serVIces
1.8 0.0 2.9 2.9
utIlItIes 4.6 2.6 1.3 0.5
100.0 13.8 100.0 72.9
data as at september 30, 2012. source: bloomberg.
In recent months and on the heels of a lot of confusion surround-ing government policy and appetite for foreign investment, India’s market has returned to more attractive levels. as seen in Exhibit 49, equity valuations are now back to more modest levels relative to history. however, as Exhibit 50 shows, other emerging markets trade even more attractively than India.
exHibit 49
Public Equity Valuation Below Average…
Dec-09, 15.7
Dec-11, 10.2
11.9 Avg Since
2005
+1
-1
6
8
10
12
14
16
18
20
2005 2006 2007 2008 2009 2010 2011 2012
India: Forward Price-to-Earnings Ratio
data as at october 31, 2012. source: Factset.
exHibit 50
…But Not the Cheapest Emerging Market Out There
ntm foRwaRD PRiCe-to-eaRninGs Ratio
ntm P/e CuRRentaVG 2005-
CuRR stDeV z-sCoRe
chIna 9.7 13.3 3.7 -1.0
Korea 8.8 9.8 1.3 -0.8
russIa 5.9 7.7 2.4 -0.8
Poland 11.0 12.4 2.2 -0.7
hong Kong 12.5 13.6 2.1 -0.5
chIle 15.4 15.8 1.9 -0.2
IndIa 11.9 13.2 2.2 -0.6
MalaYsIa 14.2 13.1 1.3 0.8
turKeY 10.2 9.5 1.6 0.4
taIWan 14.4 14.0 3.7 0.1
IndonesIa 13.9 12.1 2.1 0.8
brazIl 11.9 10.1 2.1 0.8
thaIland 12.2 10.3 1.5 1.4
MexIco 16.8 13.5 2.0 1.7
ntM = next twelve months. data as at october 31, 2012. source: Factset aggregates.

21KKR InsIghts: global Macro trends
as we look ahead, our base view is that equity investors need to be somewhat tactical when it comes to India. near-term, we think that the recent sell-off has made shares of many Indian companies much more attractive. that said, because Indian equities embed such strong long-term growth characteristics, an investor has to have greater confidence than we do in government reform to be-lieve that the multiple has bottomed and is headed up on a consis-tent basis. rather, our research shows that, while we have likely reached a bottom, we still expect India’s trading multiple to vacillate somewhere between 12-14x over the next few years as the country works through some of its macro-economic headwinds.
exHibit 51
Weak Equity Market Performance, High Inflation, and High Real GDP Have Brought Market Cap as % GDP Roughly Inline with Other Emerging Markets
68 80
72
96
43 46 50 55
Russia China Brazil India
Market Capitalization of Listed Companies % Gross Domestic Product
2010 2011
data as at July 10, 2012. source: World bank, haver.
exHibit 52
India has the Largest Number of Domestically Listed Companies
CountRynumbeR of listeD Do-
mestiC ComPanies%
woRlD
1 IndIa 5,112 10.3
2 u.s. 4,171 8.4
3 JaPan 3,961 8.0
4 canada 3,932 7.9
5 sPaIn 3,241 6.5
6 chIna 2,342 4.7
7 u.K. 2,001 4.0
8 australIa 1,922 3.9
9 Korea 1,792 3.6
10 hong Kong 1,472 3.0
other 19,607 39.6
49,553 100.0
data as at april 18, 2012. source: World development Indicators, standard & Poor’s, global stock Markets Factbook and supplemental s&P data. listed domestic companies are the domestically incorporated companies listed on the country’s stock exchanges at the end of the year. this indicator does not include investment companies, mutual funds, or other collective investment vehicles.
Importantly, our base view is that the current reform momentum could get sidelined next year in the run-up to the 2014 elections as government officials cater to their political base in the form of increased benefits and social welfare. If we are right, then we think the bounce we are predicting in the near term will start to moderate. thereafter, it will not be until sometime in 2014 that the government can initiate the sustained reforms that we think are required for long-term growth and multiple expansion.
Summary
there is little question that India is a nation full of macro potential. In particular, India aligns well with our preferences for positive demographic trends and a rising middle-class consumer. Moreover, given that gdP growth is directly linked to labor force growth and productivity, India will likely grow materially faster than the rest of the world for at least the next decade. this tailwind, we believe, is not up for debate.
What is in question, however, is whether India’s public and private sectors can turn this robust growth and expanding gdP per capita into strong investment returns for investors. India needs better infrastructure, lower inflation, and fewer government handouts, including subsidies. While reining in these excesses may slow growth in the near term, it would place the country on a much more stable footing for the long term. In addition, the country needs to do more on the education front to both improve overall income levels and ensure that they do not become too concentrated at the high end. Finally, the country needs to reduce the bureaucracy that is the source of its reputation as a “democracy run amok.”
looking ahead, we think that investors will continue to enjoy some solid reform initiatives over the next 3-6 months before the politi-cians again focus on pleasing their constituents ahead of the 2014 elections. If our view is accurate, then we think that any weakness in 2013 could create opportunity for long-term investors to consider deploying capital in the sectors we view as attractive for the long term: consumer, healthcare, logistics, real estate, retailing, educa-tion and financial services. In addition, we see the development of a more extensive credit market, including the burgeoning mezzanine market, as a significant opportunity.
“ To turn its robust growth and
expanding GDP per capital into strong investment returns for investors, India needs better infrastructure, lower inflation,
and fewer government handouts, including subsidies.
“

22 KKR InsIghts: global Macro trends
exHibit 53
India: Positive Demographics, High Growth; But Twin Deficits, High Public Debt, High Interest Rates, High Inflation, and Not Easy to Do Business (Ranked by Working Age Population Growth, 2030 vs. 2010)
gdP coMPosItIon
goVern-Ment
FInancesbalance oF PaYMents groWth & coMPetItIVeness leVerage
con-suMPtIon
InVe
stM
ent
% g
dP
net
ex
Po
rts
% g
dP
sh
ad
oW
eco
no
MY
% g
dP
Pr
IMa
rY s
ur
Plu
s/
(deF
IcIt
) 201
3e
su
rP
lus
/(d
eFIc
It) %
gd
P 2
013e
cu
rr
acc
t% g
dP
201
3e
exP
ort
s %
gd
P
net
ex
Po
rts
% g
dP
rea
l g
dP
201
3e
Po
Pu
latI
on
MIl
lIo
ns
Med
Ian
ag
e 20
12
Wo
rKI
ng
ag
e P
oP
203
0 Vs
201
0 %
ch
g
2011
gd
P P
er c
aP
Ita
us
$
InFl
atIo
n 2
012e
eas
e o
F d
oIn
g b
us
Ines
s
debt % gdP
cou
ntr
Ies
Pr
IVat
e
go
Ver
nM
ent
go
Ver
nM
ent
exte
rn
al
Pr
IVat
e c
red
It
nIgerIa 53 14 16 17 53 NA 2.8% 3.1% 49.3 17.4 6.7% 167 18.5 71% 1,654 11.0 131 17% 3% 22%
PhIlIP-PInes
74 10 22 -5 38 1.4% -1.2% 2.6% 31.0 -5.0 4.8% 96 22.6 43% 2,462 4.6 138 42% 36% 32%
MalaYsIa 47 13 24 16 30 -2.8% -4.3% 6.9% 91.6 15.9 4.7% 29 26.6 33% 10,578 2.0 12 53% 33% 116%
IndIa 58 20 29 -7 21 -4.8% -9.1% -3.3% 24.5 -6.6 6.0% 1,258 25.7 31% 1,592 13.0 132 67% 18% 51%
MexIco 65 11 25 -1 29 0.5% -2.1% -1.1% 31.7 -1.4 3.5% 116 27.3 24% 10,123 4.0 48 44% 19% 26%
turKeY 71 14 24 -9 29 1.1% -1.9% -7.1% 23.7 -8.9 3.5% 75 29.0 21% 10,457 6.5 71 39% 40% 50%
IndonesIa 56 9 34 1 18 -0.7% -2.0% -2.4% 26.9 1.4 6.3% 245 28.5 20% 3,660 5.0 128 24% 25% 32%
argentIna 59 16 23 2 23 -0.5% -2.5% -0.1% 22.6 2.4 3.1% 41 30.8 17% 11,573 9.9 124 45% 35% 17%
VIetnaM 65 7 33 -4 14 -2.1% -3.4% -0.9% 77.7 -4.3 5.9% 90 29.1 15% 1,523 4.5 99 50% 34% 112%
brazIl 60 21 20 -1 37 3.2% -1.6% -2.8% 11.9 -0.7 4.0% 198 29.9 14% 12,340 5.0 130 65% 16% 61%
south aFrIca
59 22 20 0 25 -1.9% -4.7% -5.8% 28.9 -0.2 3.0% 51 25.3 12% 7,636 5.3 39 39% 12% 135%
thaIland 55 13 27 5 48 -3.2% -3.8% 0.1% 77.8 4.6 6.0% 70 35.0 1% 5,848 4.7 18 42% 22% 132%
sIngaPore 35 10 22 33 12 3.6% 5.1% 20.7% 224.1 33.0 2.9% 5 38.6 -1% 49,936 3.8 1 108% NA 113%
chIna 35 13 49 3 12 -0.4% -1.0% 2.5% 28.9 2.6 8.2% 1,354 35.2 -1% 6,094 2.8 91 26% 9% 127%
Korea 53 15 30 2 26 1.8% 2.7% 1.7% 56.3 2.0 3.6% 49 39.0 -10% 23,021 2.2 8 34% 35% 100%
Poland 61 18 22 -1 26 -0.3% -3.1% -3.8% 45.2 -1.2 2.1% 38 38.6 -13% 12,302 3.2 55 56% 68% 55%
russIa 49 18 25 9 41 0.9% 0.2% 3.8% 30.4 8.6 3.8% 143 38.2 -14% 13,765 6.7 112 12% 26% 47%
MedIan 58 14 24 1 26 -0.4% -2.0% -0.1% 31.0 1.4 4.0% 90 29.1 15% 10,123 4.7 91 42% 26% 55%
+1 sd 67 19 34 14 40 2.0% 1.5% 7.1% 101.7 13.9 6.3% — 36.6 37% 22,387 8.6 129 67% 42% 115%
-1 sd 46 10 18 -7 16 -2.6% -5.0% -5.4% 2.2 -6.8 2.9% — 24.4 -6% -674 2.5 29 23% 12% 29%
gdP composition per respective government statistical agencies for the year 2011 or latest available. shadow economy as per World bank development research group Poverty and Inequality team & europe and central asia region human development economics unit as of 2007. 2013 estimates for government finances, current account % gdP, real gdP, gdP per capita, and Inflation as per IMF Weo oct 8, 2012. Population growth as per united nations World Population Prospects september 26, 2012 update. ease of doing business Index (1=Most business-Friendly regulations) for the year 2011 per “doing business 2012”. external debt-to-gdP as of 2010 per World bank. Private credit % gdP as of 2011 per World bank.

23KKR InsIghts: global Macro trends
Important Information
the views expressed in this publication are the per-sonal views of henry McVey of Kohlberg Kravis roberts & co. l.P. (together with its affiliates, “KKr”) and do not necessarily reflect the views of KKr itself. this document is not research and should not be treated as research. this document does not represent valuation judgments with respect to any financial instrument, issuer, security or sector that may be described or referenced herein and does not represent a formal or official view of KKr. It is being provided merely to provide a framework to assist in the implementation of an investor’s own analysis and an investor’s own views on the topic discussed herein.
the views expressed reflect the current views of Mr. McVey as of the date hereof and neither Mr. McVey nor KKr undertakes to advise you of any changes in the views expressed herein. In addition, the views expressed do not necessarily reflect the opinions of any investment professional at KKr, and may not be reflected in the strategies and products that KKr of-fers. KKr and its affiliates may have positions (long or short) or engage in securities transactions that are not consistent with the information and views expressed in this document.
this publication has been prepared solely for infor-mational purposes. the information contained herein is only as current as of the date indicated, and may be superseded by subsequent market events or for other reasons. charts and graphs provided herein are for
illustrative purposes only. the information in this docu-ment has been developed internally and/or obtained from sources believed to be reliable; however, neither KKr nor Mr. McVey guarantees the accuracy, adequacy or completeness of such information. nothing contained herein constitutes investment, legal, tax or other advice nor is it to be relied on in making an investment or other decision.
there can be no assurance that an investment strategy will be successful. historic market trends are not reliable indicators of actual future market behavior or future performance of any particular investment which may differ materially, and should not be relied upon as such. target allocations contained herein are subject to change. there is no assurance that the target allocations will be achieved, and actual allocations may be significantly different than that shown here. this publication should not be viewed as a current or past recommendation or a solicitation of an offer to buy or sell any securities or to adopt any investment strategy.
the information in this publication may contain projec-tions or other forward-looking statements regard-ing future events, targets, forecasts or expectations regarding the strategies described herein, and is only current as of the date indicated. there is no assurance that such events or targets will be achieved, and may be significantly different from that shown here. the information in this document, including statements concerning financial market trends, is based on current market conditions, which will fluctuate and may be
superseded by subsequent market events or for other reasons. Performance of all cited indices is calculated on a total return basis with dividends reinvested. the indices do not include any expenses, fees or charges and are unmanaged and should not be considered investments.
the investment strategy and themes discussed herein may be unsuitable for investors depending on their specific investment objectives and financial situation. Please note that changes in the rate of exchange of a currency may affect the value, price or income of an investment adversely.
neither KKr nor Mr. McVey assumes any duty to, nor undertakes to update forward looking statements. no representation or warranty, express or implied, is made or given by or on behalf of KKr, Mr. McVey or any other person as to the accuracy and completeness or fairness of the information contained in this publication and no responsibility or liability is accepted for any such information. by accepting this document, the recipient acknowledges its understanding and acceptance of the foregoing statement.
the MscI sourced information in this document is the exclusive property of MscI Inc. (MscI). MscI makes no express or implied warranties or representations and shall have no liability whatsoever with respect to any MscI data contained herein. the MscI data may not be further redistributed or used as a basis for other indi-ces or any securities or financial products. this report is not approved, reviewed or produced by MscI.

www.kkr.com