volume 2 - gfdrr
TRANSCRIPT

ASEAN: Advancing Disaster Risk Financing and Insurance in ASEAN Member States: Framework and Options for Implementation
April 2012
Volume 2: Technical Appendices
This volume complements the main report, which is published as a separate document. It compiles technical background notes and papers drafted for the preparation of the main report. The team has made every attempt to verify the contents presented, but the information should be interpreted with due consideration to its limitations resulting from the fact that indirect sources have been used where primary sources were not available and that the collective knowledge in this area is limited.

1
Table of Contents
Appendix 1. Disaster Risk Exposure Profiles of ASEAN Member States .................................... 2
Appendix 2. Disaster Risk Management Profiles of ASEAN Member States ........................... 23
Appendix 3. Fiscal Risk Management of Natural Disasters by ASEAN Governments .............. 36
Appendix 4. Property Catastrophe Risk Insurance Markets……………………………………………….. 79
Appendix 5. Agricultural Insurance in ASEAN Member States……………………………………..…… 107
Appendix 6. Disaster Microinsurance in ASEAN Member States………………………………….…. 191
Appendix 7. Disaster Micoinsurance……………………………………………………………………………….. 205
Appendix 8. Parametric Insurance- Basic Concepts…………………………………………………………. 238
Appendix 9 . Comparison of Ex-Ante Disaster Risk Financing and Transfer Instruments 248
2
Appendix 1. Disaster Risk Exposure Profiles of ASEAN Member States
The ASEAN region is exposed to almost all types of natural hazards. These include periodic typhoons, tropical cyclones, flood, drought, earthquakes, tsunami, volcanic eruption, landslides, forest-fires, haze and pandemics, facing agricultural and resources risks as well as risks associated with rapid urbanization, migration and socio-economic changes. The region has a history of devastating disasters, including the December 26 2004 Indian Ocean tsunami, the 2008 Cyclone Nargis, the 2009 Luzon earthquake in the Philippines, the 2009 typhoons Ondoy and Pepeng.
The ASEAN region is geographically diverse, covering a land area of 4.5 million square kilometers or 3.3% of the world area, and a coastline of 173,252 km, the third longest in the world. The region sits between several tectonic plates which cause earthquakes, volcanic eruptions and tsunamis. Located between The Pacific and the Indian Ocean, it is susceptible to seasonal typhoons and tsunamis in some areas. Most parts of the region have hot and humid tropical climates, with the exception of mountainous areas.
The ASEAN region faces a multitude of inter-related forces and risks. These are related to food security and agricultural risk, natural catastrophes, resource needs (food, water, energy), population growth, unprecedented urbanization and population migration, rapid economic advancement, wealth and income disparities, exposure to pandemics, climate change and geopolitical instability. Despite rapid economic growth, the region has challenges related to poverty, urbanization, and environmental degradation, which can increase risk exposure and vulnerability of the population of the region. The ASEAN area has a population of over 593.05 million (2009). The majority of the population lives in riverine plains, low lying coastal plains and deltas, putting them at high risk of periodic flooding. According to the ADB (2009) and the SEA-START RC (2007) climate-sensitive sectors could be severely impacted by climate change trends, such sea-level rise, increasing temperatures and extreme weather.
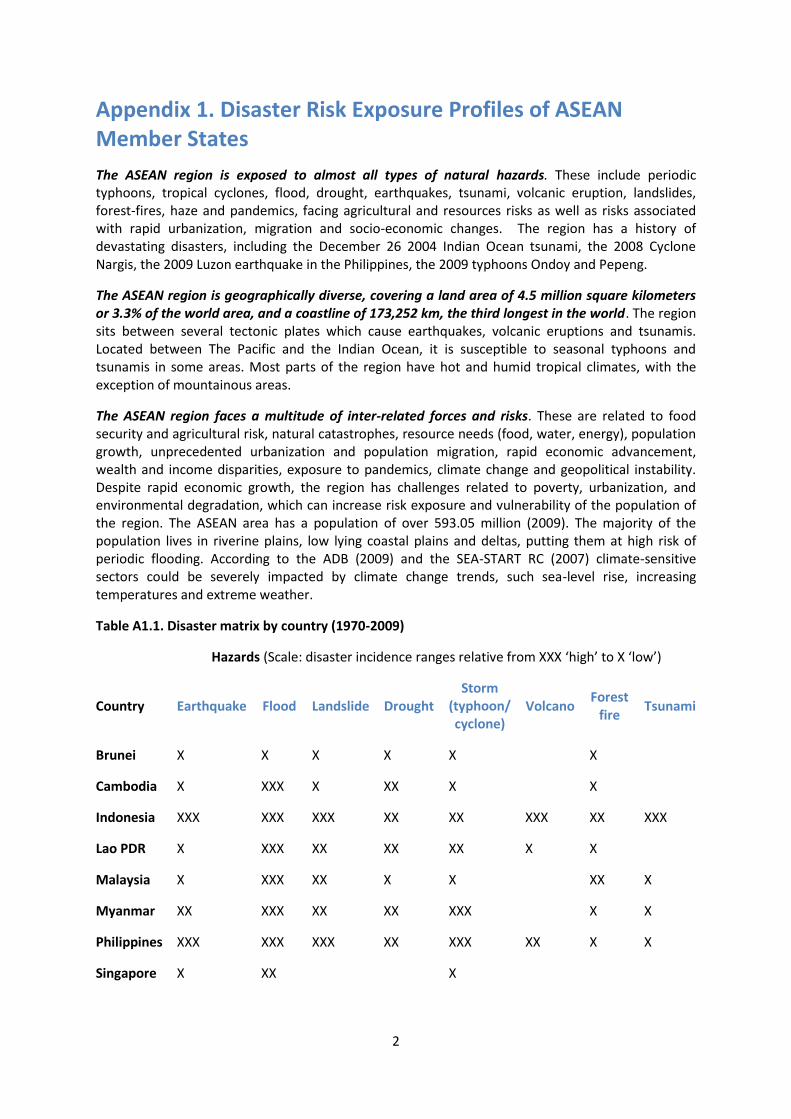
Table A1.1. Disaster matrix by country (1970-2009)
Hazards (Scale: disaster incidence ranges relative from XXX ‘high’ to X ‘low’)
Country Earthquake Flood Landslide Drought Storm
(typhoon/ cyclone)
Volcano Forest
fire Tsunami
Brunei X X X X X X
Cambodia X XXX X XX X X
Indonesia XXX XXX XXX XX XX XXX XX XXX
Lao PDR X XXX XX XX XX X X
Malaysia X XXX XX X X XX X
Myanmar XX XXX XX XX XXX X X
Philippines XXX XXX XXX XX XXX XX X X
Singapore X XX X

3
Thailand X XXX XX XX XX X X
Viet Nam X XXX XX XX XXX X X
ASEAN XX XXX XX XX XXX XX XX XX
Source: DRMI, 2010:59
Typhoons are the most prevalent hazard in the region, causing floods and landslides. Cyclone Nargis killed over 133,000 people, affected over 2.4 million and caused an estimated economic loss of over $4 billion. In 2009, total damage and losses from tropical Storm Ondoy and Typhoon Pepeng reached US$4.38 billion, or about 2.7 percent of the Philippine’s gross domestic product. Indonesia, Philippines and Myanmar face high earthquake hazards. Except for Singapore, flood mortality risk is high in all ASEAN Member States. Brunei has the highest percentage of population at landslide risk, followed by Philippines and Indonesia (DRMI 2010). Both Indonesia and the Philippines are at high risk from volcanic eruptions. In terms of area susceptible to cyclones, Philippines has the largest area, followed by Viet Nam and Myanmar. Multi-hazard mortality risk is higher for Philippines, Viet Nam, Myanmar and Indonesia.
Cyclonic storms cause most casualties followed by earthquakes, tsunamis, floods, epidemics, landslides, droughts, volcanic eruptions and forest fires. Over the last 40 years (1970-2009), cyclones/storms caused over 184,000 deaths, earthquakes 114,000 and tsunamis 83,600 (DRMI 2010). With high density of people and assets, urban areas are especially vulnerable to the adverse impacts of disasters, especially cities Manila, Jakarta, Bangkok, Ha Noi, and Singapore. Manila faces highest risk of earthquake, followed by Jakarta and Bangkok. Manila is also at the highest risk from flood, followed by Jakarta, Bangkok and Ha Noi. Cyclonic risk is highest for Manila, followed by Ha Noi and Jakarta. In terms of overall risks, Manila tops the list with Jakarta, Bangkok, Ha Noi, Singapore, Kuala Lumpur, Naypyidaw, Phnom Penh, Vientiane and Bandar Seri Begawan following (DRMI 2010). According to DRMI (2010), for ASEAN, average annual losses are as follows: forest fires ($ 512 mil), storms ($ 339 mil), floods ($ 312 mil), earthquakes ($ 244 mil), droughts ($ 46 mil), volcanoes ($32 mil), and landslides ($ 4 million).
Most vulnerable areas include the Mekong River Delta region of Viet Nam, all regions of the Philippines, almost all regions of Cambodia, North and East Lao PDR, the Bangkok region of Thailand and the west and south of Sumatra, and western and eastern Java in Indonesia (Yusuf and Francisco, 2009). In terms of social vulnerability (SV), Myanmar has the highest SV ranking, followed by Indonesia, Philippines, Thailand, Viet Nam, Lao PDR, Cambodia and Malaysia (DRMI 2010). In terms of economic vulnerability (EV), Myanmar has the highest ranking, followed in descending order by Laos, Indonesia, Cambodia, Viet Nam, Philippines, Thailand and Malaysia.

4
Table A1.2 Climate Hazards Hotspots and Dominant Hazards
Climate Hazards Hotspots Dominant Hazards
Northwestern Viet Nam Droughts
Eastern coastal areas of Viet Nam Cyclones, droughts
Mekong region of Viet Nam Sea-level rise
Bangkok and its surroundings area in Thailand Sea-level rise, floods
Southern regions of Thailand Drought, floods
The Philippines Cyclones, landslides, floods, droughts
Sabah state of Malaysia Droughts
Western and eastern area of java Island, Indonesia Droughts, floods, landslides, sea level-rise
Source: Yusuf and Francisco, 2009
Box A1.1. Measuring Disaster Risk
Disaster Risk is a function of hazard (storms, floods, droughts, earthquakes, etc), exposure (people’s location and assets) and vulnerability (susceptibility to damage and loss). Disaster Risk is normally expressed as the probability of loss of life or destroyed or damaged assets in a given period of time.

5
Brunei Darussalam
Risk Exposure Profile: Brunei’s flood-prone or hilly areas are at risk of landslides. Typhoons, earthquakes, and severe flooding are less frequent.
Geography and Climate: Brunei’s climate is tropical and humid. Bandar Seri Begawan's climate divides into two seasons – a hot dry season and a warm and wet season. A flat coastal plain spreads across most of the country; in the east there are mountains. Brunei has 161 kilometers (100 mi) of coastline next to the South China Sea.
Disaster Risk: There is a need to establish systematic data management, including historical data.
Disaster Hazards and Exposure: Floods and landslides are the most prevalent hazards. A national level multi-hazard risk assessment by single agency to cover all hazards and risks posed by them to the population has not been done.
Resources:
CIA Factbook (July 2011) Brunei - https://www.cia.gov/library/publications/the-world-factbook/geos/bx.html
Asean Inter Parliamentary Assembly (2011) Third AIPA Caucas Report http://www.aipasecretariat.org/wp-content/uploads/2011/07/5.third_.caucus.report.pdf.
Cambodia
Risk Exposure Profile: Flood and drought are the main physical hazards in Cambodia, linked its key sectors: agriculture and fisheries. About 80 percent of the Cambodia’s territory lies within the Mekong River, flowing directly from the north to the Mekong Delta of Viet Nam in the south. The Mekong River has large fluctuations of water levels between the dry and wet seasons, causing a cycle of droughts and floods almost every year, damaging agricultural production and livelihoods and constraining Cambodian socio-economic development. It is estimated that floods kill about 100 people annually and cause agricultural losses of 100 to 170 million USD each year. The main types of floods are spills from the Mekong River aggravated by local rainfall, flooding from tributaries, flash floods, and heavy rains from typhoon in some areas. Related natural hazards are epidemics.
Geography and Climate: Located in mainland Southeast Asia, Cambodia spreads across an area of 181,040 square kilometers, bordering with Laos, Thailand, and Viet Nam and with a coastal region on the Gulf of Thailand. The country’s coastline measures 435 km. Cambodia’s climate divides into two periods: the monsoon-driven rainy season (May-October) which accounts for 80 to 90 percent of the country’s annual precipitation, and the dry season (November–April) with cooler temperatures, especially from November to January. Cambodia’s climate is affected by the summer monsoon, el Niño Southern Oscillation, la Niña, and south-westerly winds.
Source: CIA Factbook
Source: CIA Factbook

6
Disaster Risk: Cambodia is prone to flood and drought with 14 % of Cambodia’s Gross Domestic Product (GDP) and 12.2 % of its inhabitants are subject to potential losses from floods (Relief Web 2011).
Table A1.3. Major Disasters in Cambodia for the Table A1.4. Overview: Natural Disasters period 1982 to 2011 by number of people affected from 1980-2010
Disaster Date Nu Total Affected
Damage
(000 US$)
Drought June 1994 5,000,000 100,000
Flood 11/07/2000 3,448,053 160,000
Flood 15/08/2001 1,669,182 15,000
Flood 18/08/2002 1,470,000 100
Flood 30/09/1996 1,300,000 1500
Flood 22/08/1991 900,000 150,000
Drought January 2002 650,000 38,000
No of events: 31
No of people killed: 1,967
Average killed per year: 63
No of people affected: 16,679,643
Average affected per year: 538,053
Economic Damage
(US$ X 1,000)
536,110
Economic Damage per year
(US$ X 1,000)
17,294
Source (left): “EM-DAT: The OFDA/CRED International Disaster Database; www.em-dat.net; Data retrieved 10 August 2011.
Source (right): Relief Web – Disaster Statistics Cambodia http://www.preventionweb.net/, Data accessed 10 August 2011.
Disaster Hazards: Cambodia’s average annual disaster profile: 45% floods, 9% storm, 16% drought and 29% epidemic (WB 2011). Recurrent floods are caused by the southwest monsoon rains along the Mekong River, its tributaries, and the Tonle Sap Lake. Droughts occur especially in the Svay Rieng provinces, which are one of the most drought-prone provinces in the country. Sea Level Rise could pose a significant threat to marine coastal areas, already suffering from storm surges, high tides, beach erosion and seawater intrusion. Low-lying areas, including settlements, beach resorts; seaports, coastal fisheries, and mangrove forests could all be affected.
Disaster Exposure: In terms of location, floods affect primarily the provinces of Kandal, Kampong Cham, Kratie, Prey Veng, Stung Treng, Svay Rieng, and Takeo. Flash floods in tributaries around the Tonle Sap Lake affect others. In economic terms, the severe floods that occurred from 2000 to 2002 resulted in 438 casualties and caused damages amounting to US $205 million. Floods and droughts are recognized by the government as one of the main drivers of poverty. For example, floods accounted for 70% of rice production losses between 1998 and 2002, while drought accounted for 20% (GFDRR 2011).
Disaster Vulnerability: Cambodia’s vulnerability is linked to its socio-economic characteristics as a post-conflict, low income country with some 80 percent of the population living in rural areas. Weak adaptive capacity poor infrastructure and limited institutions exacerbate the country’s vulnerability to climate variability and change. With increasing population in the Mekong floodplain, due to rural-urban migration, and urbanization of cities such as Phnom Penh and Siem Rea, urban vulnerabilities are accumulating in the context of lacking building codes, enforcement, and proper drainage in urban centers. Rural areas, accommodating 4/5 of the the population and 90% of the poor, livelihoods linked to agriculture, fisheries and forestry are subject to increasingly more frequent floods and drought. ‘Deforestation and subsequent soil erosion; inadequate irrigation systems and

7
water conservation measures to protect against drought; have all contributed to increase rural people’s vulnerability to natural disasters’ (GFDRR 2011).
Figure A1.1. Vulnerability Index
Vulnerability
Index Risk
Absolute Risk
Relative Mortality Risk Index
Multiple
Cyclone
Flood
Landslide
Earthquake
Source: Relief Web – Disaster Statistics Cambodia http://www.preventionweb.net/, Data accessed 10 August 2011.
Legend
Vulnerability Index: Estimated number of people killed per year (per mio. exposed)
Risk Absolute: Average killed per year
Risk Relative: Killed per million per year
Mortality Risk Index: Average of both
Resources World Bank (2011), Cambodia Climate Dashboard, http://sdwebx.worldbank.org/climateportal/home.cfm?page=country_profile&CCode=KHM EM-DAT : The OFDA/CRED International Disaster Database; www.em-dat.net-Université, Belgium. Relief Web – Disaster Statistics Cambodia http://www.preventionweb.net/ GFDRR (2011) DRM Country Programs for Priority Countries.
http://www.gfdrr.org/gfdrr/sites/gfdrr.org/files/publication/DRM_CountryPrograms_2011.pdf.

8
Indonesia
Risk Exposure Profile: Indonesia is one of the most disaster prone countries in the world. Situated in active disaster hotspots, it is prone to earthquakes, tsunami, volcanic eruptions, floods, landslides, droughts and forest fires. In the last 30 years, there were at least 289 disasters per year claiming on average more than 8,000 lives. The cost of replacing or restoring public infrastructure and private households damaged by disasters, most of which are uninsured, placed an enormous burden on public expenditure. The government spent reconstruction budget of more than US$7 billion for Aceh and Nias and US$2 billion for Yogyakarta, on top of annual budget allocation of between $300-400 million to cover lower impact but high frequency events.
Geography and Climate: Indonesia is the world’s largest archipelagic state with more than 17,500 islands and over 81,000km of coastline. Situated in the earthquake belt and pacific ring-of-fire Indonesia is highly vulnerable to earthquakes and volcanic eruptions. Climate periods divide into: the wet season (November-April), and the dry season (May-October). Indonesia’s climate is subject to: monsoons; El Niño; Australian continental air and Asia and Pacific Ocean air masses further affect its climate, as well as changes in the timing of seasons and increasingly unpredictable rainfall patterns.
Disaster Risk: Indonesia ranks 12th among countries at relatively high mortality risks from multiple hazards with about 40 percent population or 90 million living in areas at risk (WB 2005). Indonesia’s average annual disaster profile points at floods, storm, drought and landslides as the most recurrent hazards (WB 2011).
Table A1.5. Selected Natural Disasters in Indonesia – Figures for 1982 to 2011
Table A1.6. Countries at relatively high mortality risk, based on population
No of Events
Killed Total Affected
Damage (000 US$)
Flood (flash flood, storm surge, costal, unspecified)
118 4,670 6,928,078
6,932,866.00
Earthquake, tsunami 74 179,062 8,415,747
11,343,726
Landslide 39 1,623 383,957 120,745 Volcanic eruption 34 495 707,358 344,190 Forest fire 9 300 3,034,47
8 9,329,000
Drought 6 1,266 1,083,000
89,000
Storm (tropical cyclone, unspecified)
4 6 13,838 9,329,000
1. Taiwan, China 2. El Salvador 3. Costa Rica 4. Dominica 5. Philippines 6. Antigua and Barbuda 7. Guatemala 9. Dominican Rep. 10. Jamaica 11. Nicaragua 12. INDONESIA
Source (Left): EM-DAT : The OFDA/CRED International Disaster Database; www.em-dat.net; Data retrieved 11 August 2011.
Source (Right): World Bank (2005), Natural Disaster Hotspots, A Global Risk Analysis, table 1.2.
Source: CIA Factbook

9
Disaster Hazards: Geographic: Sumatera, Java, Bali, Nusa Tenggara, Maluku, Sulawesi and Papua are areas most vulnerable to earthquakes. Sumatera alone has suffered from over 15 large earthquakes in the past 100 years. Indonesia has 129 active volcanoes, 70 of them classified as dangerous. Between 2001 and 2007 alone, 26 volcanic eruptions were recorded mostly in Java. The islands of Java and Sumatra are also prone to landslides due to topographic and unstable soil conditions. Hydro-meterological: High rainfall regime in the west and dry zone in some eastern provinces are are subject to recurring floods and droughts. Floods often hit major population centers such as Jakarta, Medan, and Bandung. Climate: Deforestation and prolonged drought intensify the occurrence of forest fires. Sea-level rise threatens 42 million Indonesian who live less than 10m above sea level (WB 2011).
Disaster Exposure: Indonesia’s geological setting and the complexity of its human settlements has led to increased disaster occurrence with a tendency for significant human impacts in terms of loss of life and economic consequences. As the disasters damage public infrastructure and people’s homes, mostly uninsured, they created an enormous burden on public expenditure to restore those facilities. The 2007 flood that hit Jakarta created total damage and losses amounting to more than $900 million; ‘the annual flood in the Bengawan Solo watershed in 2007 cost the government more than $200 million or equal to the total emergency allocation for all disasters for the entire year of 2008’ (GFDRR 2011:155). The Asian Development Bank estimates that by 2100, the impacts of climate change will cost between 2.5 to 7 percent of GDP with poorest being hit the worst, partly due to increased exposure due to poorly enforced zoning and poorly maintained infrastructures (WB 2011).
Disaster Vulnerabilities: Population increase and urbanization increase the vulnerability of the population in case of large-scale disasters, especially in coastal areas.
Figure A1.2. Vulnerability Index
Vulnerability
Index Risk
Absolute Risk
Relative Mortality Risk Index
Multiple
Cyclone
Flood
Landslide
Earthquake
Source: Relief Web – Disaster Statistics Indonesia http://www.preventionweb.net/, Data accessed 11 August 2011.
Legend
Vulnerability Index: Estimated number of people killed per year (per mio. exposed)
Risk Absolute: Average killed per year
Risk Relative: Killed per million per year
Mortality Risk Index: Average of both
References
World Bank (2011) Indonesia Climate Dashboard, http://sdwebx.worldbank.org/climateportal/ World Bank (2005) World Bank (2005), Natural Disaster Hotspots, A Global Risk Analysis EM-DAT: The OFDA/CRED International Disaster Database; www.em-dat.net, Belgium. Relief Web – Disaster Statistics Indonesia http://www.preventionweb.net/ GFDRR (2011) DRM Country Programs for Priority Countries.

10
Lao PDR
Risk Exposure Profile: Floods, droughts, and typhoons are the dominant hazards. Natural disasters in Lao PDR impact all development sectors, with agriculture, transport, and housing suffering most. Almost 30 floods have been recorded in the country over the last 40 years. The country is also susceptible to landslides and, in the northern parts, to earthquakes. It is estimated that typhoons cause an economic average annual loss of US$17.6 million, followed by floods (US$8.3 million) and droughts (US$4.7 million). Recent natural disaster—typhoon Ketsana—resulted to an estimated damage and loss worth US$58 Million, and a 0.4% loss of GDP.
Geography and Climate: There are two distinct seasons: a dry season (mid-October-April) and a rainy season (May - mid-October). El Niño and La Niña as well as tropical Monsoons impact the country’s climate.
Disaster Risk: Laos’ average annual disaster profile: 50% floods, 22% epidemics, 13% storm, and 13% drought (WB 2011).
Table A1.7. Major Disasters in Laos for the period Table A1.8. Major Disasters in Laos for the 1982 to 2011 by total number of people affected period 1982 to 2011 by damages (000 USD)
Disaster Date Affected
Storm 1/8/1995 1,000,000
Drought December 1988 730,000
Flood August 2001 453,000
Flood September 2000 450,000
Flood 15/08/1996 420,000
Flood September 1995 391,400
Flood September 1991 332,000
Disaster Date Damage
Storm July 1993 302,151
Storm 1/10/2009 100,000
Flood August 1992 21,828
Storm 10/7/1992 3,650
Drought July 1991 1,000
Flood September 2000 1,000
Storm 1991 150
Source: EM-DAT: The OFDA/CRED International Disaster Database; www.em-dat.net, Data retrieved 17 August 2011.
Disaster Hazards: The major natural disasters in Lao PDR are floods and droughts. Most flooding occurs during May to September when Monsoon rains accumulate in the upper Mekong river basin. In addition to river basin flooding, flashfloods in the northern mountainous region are also common. It is estimated that the south and central regions, where about two thirds of the country’s population live, face on an average of 1.5 serious floods or droughts every year. Lao PDR is also susceptible to landslides, pest infestations and fire due to slash and burn agriculture (GFDRR 2011).
Disaster Exposure: From 1970 to 2010, 33 natural hazard events have been registered affecting almost 9 million people and causing economic damages for over US $400 million. Droughts: one of the most severe was in 1977 affecting almost three and half million of people. Floods: in 1992 a heavy flood caused economic damages for over US $21 million. Epidemics: disease outbreaks such as smallpox, malaria, diarrhea, dysentery, dengue fever and cholera have been registered. Storms:
Source: CIA Factbook
11
These storms as well as the impacts from southwest Monsoons have affected over 1 and half million of people and caused damages for over US $400 thousand (WB 2011).
Disaster Vulnerability: Due to the high degree of poverty in the rural areas, even low intensity disasters have a big impact on rural households. Coping mechanisms include taking high interest loans, sending children to work or reducing expenditures in education, health and food. Since agriculture is dependent on rainfall, even a modest drought increases the food insecurity. On the other side of the spectrum, major urban centers such as Vientiane Capital are expanding rapidly. As newer infrastructures are built with inadequate land use planning and loosely enforced building codes, new vulnerabilities are fast accumulating (GFDRR 2011).
Climate Change: Lao PDR has a low capacity to adapt to climate change because of its poor socio-economic development. Climate change is likely to decrease food security as production patterns change due to shifts in rainfall, evaporation, run-off water, and soil moisture. It is estimated that around 188,000 households in Lao PDR are at risk of food insecurity caused by drought (WB 2011).
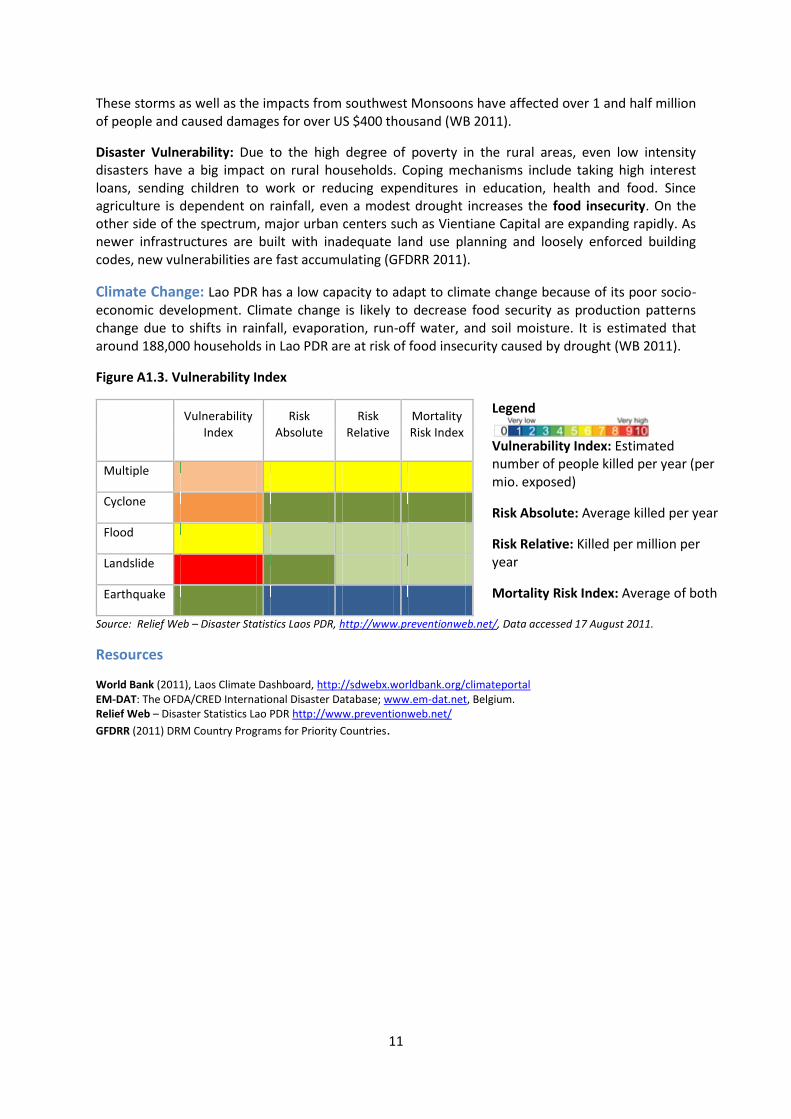
Figure A1.3. Vulnerability Index
Vulnerability
Index Risk
Absolute Risk
Relative Mortality Risk Index
Multiple
Cyclone
Flood
Landslide
Earthquake
Legend
Vulnerability Index: Estimated number of people killed per year (per mio. exposed)
Risk Absolute: Average killed per year
Risk Relative: Killed per million per year
Mortality Risk Index: Average of both
Source: Relief Web – Disaster Statistics Laos PDR, http://www.preventionweb.net/, Data accessed 17 August 2011.
Resources
World Bank (2011), Laos Climate Dashboard, http://sdwebx.worldbank.org/climateportal EM-DAT: The OFDA/CRED International Disaster Database; www.em-dat.net, Belgium. Relief Web – Disaster Statistics Lao PDR http://www.preventionweb.net/
GFDRR (2011) DRM Country Programs for Priority Countries.

12
Malaysia
Risk Exposure Profile: While Malaysia is generally spared severe natural disasters such as earthquake, volcanic eruption and typhoon, it faces floods, landslides and severe haze. In the past years, it has experienced several extreme weather and climatic events, ranging from thunder-storms to monsoonal floods. The 2010 flood in Kedah and Perlis was among the worst in its history. The total economic loss and the financial burden on the government were heavy (AIPA Brief Note 2011).
Geography and Climate: Malaysia is located just outside the “Pacific Rim of Fire” stretching over two parts: Peninsular Malaysia to the west and East Malaysia to the east. Malaysia's climate is hot and humid throughout the year. The climate on the peninsula is affected by wind from the mainland, while East Malaysia has more maritime weather. Malaysia is exposed to the El Nino effect and two monsoon winds seasons: the Southwest Monsoon (late May – September), and the Northeast Monsoon (November to March) which brings in more rainfall. Local climates are affected by the presence of mountain ranges from highlands, lowlands, and coastal regions. Climate change is likely to have a significant effect on Malaysia, increasing sea levels and rainfall, increasing flooding risks and leading to large droughts.
Disaster Risk: Malaysia faces disaster risks from floods and landslides. Below is an overview of the most significant disaster events in terms of total number of affected and damages caused.
Table A1.9. Major Disasters in Malaysia for the period 1982 to 2011 by total number of people affected
Disaster Date Affected
Flood 11/1/2007 137,533
Flood 19/12/2006 100,000
Flood 12/11/1988 60,000
Storm 6/11/2004 40,000
Flood 23/11/2005 30,000
Flood 7/12/2007 29,000
Flood 28/11/1986 25,000
Disaster Date Damages
Flood 11/1/2007 605,000
Earthquake 26/12/2004 500,000
Flood 7/12/2007 363,000
Wildfire 21/08/1997 300,000
Storm 26/12/1996 52,000
Flood 19/12/2006 22,000
Flood 28/11/1986 11,500
Source: “EM-DAT : The OFDA/CRED International Disaster Database; www.em-dat.net, Data retrieved 17August 2011.
Disaster Hazards: Flood is the most significant natural hazard in Malaysia. Other than flooding, the country also experienced some man-made disasters – landslides mostly- causing considerable damage to properties and loss of lives. Monsoonal floods are an annual occurrence varying in terms of severity, place and time of occurrences. Bordering with countries that sits on active tectonic
Table A1.10. Major Disasters in Malaysia for the period 1982 to 2011 by damages (000 USD)
Source: CIA Factbook

13
plates like Indonesia and the Philippines, increases the chances for Malaysia to be inflicted with earthquake related disasters (AIPA Brief Note 2011).
Disaster Exposure: Yearly, an estimated 29,800 sq kilometers are flooded, affecting 4.82 million people and causing physical damages amounting up to RM915 million (AIPA Brief Note 2011).
Disaster Vulnerability: Rapid development, unplanned urbanization, climate change and environmental degradation have caused worse and more frequent occurrence of flash floods especially in urban areas (AIPA Brief Note 2011).
Figure A1.4. Vulnerability Index
Vulnerability
Index Risk
Absolute Risk
Relative Mortality Risk Index
Multiple
Cyclone
Flood
Landslide
Earthquake
Legend
Vulnerability Index: Estimated number of people killed per year (per mio. exposed)
Risk Absolute: Average killed per year
Risk Relative: Killed per million per year
Mortality Risk Index: Average of both
Source: Relief Web – Disaster Statistics Laos PDR, http://www.preventionweb.net/, Data accessed 17 August 2011.
References
EM-DAT: The OFDA/CRED International Disaster Database; www.em-dat.net, Belgium. Relief Web – Disaster Statistics http://www.preventionweb.net/ ASEAN Inter Parliamentary Assembly (2011) Third AIPA Caucus Report ASEAN Inter Parliamentary Assembly (2011) Third AIPA Caucus Report. Brief Note on the Role of the National Security Council, Prime Minister’s Department as National Management Organization (NDMO). http://www.aipasecretariat.org/wp-content/uploads/2011/07/1.Malaysia-Disaster-Response-Management.pdf.

14
Myanmar
Risk Exposure Profile: Myanmar is exposed a number of hazards, especially epidemics, floods, drought, and earthquakes, with extreme mortality risk from earthquakes. Its population is highly vulnerability to multiple hazards: in the last 30 years alone, Myanmar suffered from 27 disaster events (seismic activity, epidemic, flood, landslides and storms) killing 162,643 people; affecting more than 4,596,724 and causing over 5,913,743,000 USD damages (EM-DAT).
Geography and Climate: Myanmar’s climate is largely tropical with three seasons: the monsoon/rainy season (May-October), cool season (November –February), and hot season (March-April). Rainfall during the monsoon season totals more than 500 cm in upper Myanmar and over 250 cm in lower Myanmar and Yangon while Central Myanmar and Mandalay receive about 76 cm each.
Disaster Risk: Almost the entire country is affected by natural hazards, with varying intensity depending on the hazard. Drought is the most persistent hazard throughout the country; cyclones impact three distinct regions of the country; earthquakes and floods significantly affect similar areas when weighted by mortality, however, floods generally cause more economic damaged. Landslides also present a significant risk for regions on the western border (Center of Hazard and Risk Research).
Figure A1.5. Multi-Hazard Disaster Risk Hotspots with all Hazards combined and weighted by Mortality (left) and Proportion of GDP Impacted (right)
Source: Center of Hazard and Risk Research.
Source: CIA Factbook
15
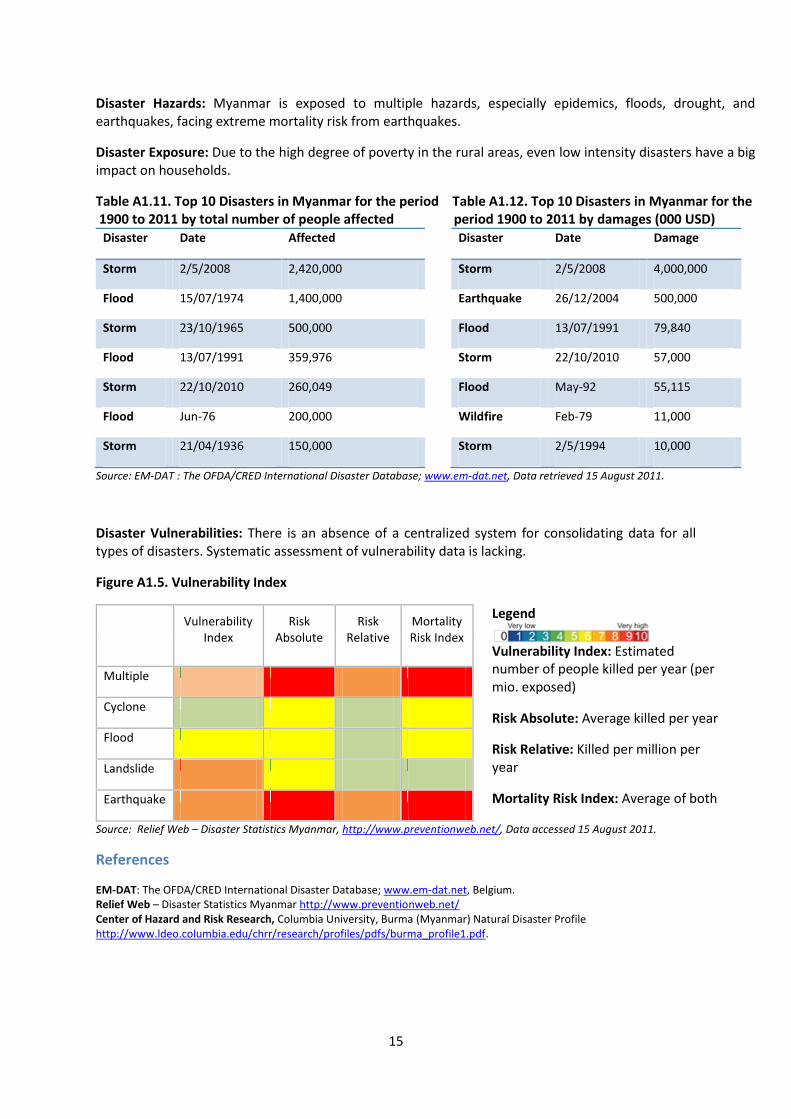
Disaster Hazards: Myanmar is exposed to multiple hazards, especially epidemics, floods, drought, and earthquakes, facing extreme mortality risk from earthquakes.
Disaster Exposure: Due to the high degree of poverty in the rural areas, even low intensity disasters have a big impact on households.
Table A1.11. Top 10 Disasters in Myanmar for the period Table A1.12. Top 10 Disasters in Myanmar for the 1900 to 2011 by total number of people affected period 1900 to 2011 by damages (000 USD)
Disaster Date Affected
Storm 2/5/2008 2,420,000
Flood 15/07/1974 1,400,000
Storm 23/10/1965 500,000
Flood 13/07/1991 359,976
Storm 22/10/2010 260,049
Flood Jun-76 200,000
Storm 21/04/1936 150,000
Disaster Date Damage
Storm 2/5/2008 4,000,000
Earthquake 26/12/2004 500,000
Flood 13/07/1991 79,840
Storm 22/10/2010 57,000
Flood May-92 55,115
Wildfire Feb-79 11,000
Storm 2/5/1994 10,000
Source: EM-DAT : The OFDA/CRED International Disaster Database; www.em-dat.net, Data retrieved 15 August 2011.
Disaster Vulnerabilities: There is an absence of a centralized system for consolidating data for all types of disasters. Systematic assessment of vulnerability data is lacking.
Figure A1.5. Vulnerability Index
Vulnerability
Index Risk
Absolute Risk
Relative Mortality Risk Index
Multiple
Cyclone
Flood
Landslide
Earthquake
Legend
Vulnerability Index: Estimated number of people killed per year (per mio. exposed)
Risk Absolute: Average killed per year
Risk Relative: Killed per million per year
Mortality Risk Index: Average of both
Source: Relief Web – Disaster Statistics Myanmar, http://www.preventionweb.net/, Data accessed 15 August 2011.
References
EM-DAT: The OFDA/CRED International Disaster Database; www.em-dat.net, Belgium. Relief Web – Disaster Statistics Myanmar http://www.preventionweb.net/ Center of Hazard and Risk Research, Columbia University, Burma (Myanmar) Natural Disaster Profile http://www.ldeo.columbia.edu/chrr/research/profiles/pdfs/burma_profile1.pdf.

16
Philippines
Risk Exposure Profile: The Philippines is among the top global disaster hotspots with commonly occurring floods, droughts, typhoons, landslides and mudslides, earthquakes and volcanoes. It ranks 8th among countries most exposed to multiple hazards, and 13th among those at high economic risk to natural disasters, with at least 85% of GDP in areas at risk. Over the past two decades, damages incurred have reached PHP19.7 billion, or about US$500 million (in real 2005 value), which is equivalent to 0.5% of GDP. Damage to the agricultural sector alone averaged PHP12.4 billion per annum. Following the 2009 Tropical Storm Ondoy and Typhoon Pepeng, it is reported that 9.3 million were severely affected by these events. There is also a potential for enormous losses from low frequency, high impact hazards such as earthquakes, which are a real threat to many major urban areas, including Metro Manila.
Geography and Climate: The Philippines is an archipelago comprised of 7,107 islands (1,000 of which are inhabitable), with a total area of 299,404 sq km. It has a humid climate and a steep topography. Rainfall is brought by the southwest monsoons (June-August) and northeast monsoon and tropical cyclones bring (November–February). Its climate is affected by El Niño and Low pressure over Pacific or South China Sea.
Disaster Risk: Philippines’ average annual disaster profile includes storms, floods, landslide, and volcano eruptions as the riskiest hazards (WB 2011). Typhoons are the most frequent and the most damaging.
Table A1.13. Top disasters in the Philippines for the period 1982 to 2011 by total number of people affected
Disaster Date Affected
Storm 12/11/1990 6,159,569
Storm 24/09/2009 4,901,763
Storm 21/06/2008 4,785,460
Storm 29/09/2009 4,478,491
Storm 21/10/1998 3,902,424
Storm 27/09/2006 3,842,406
Storm 21/10/1988 3,250,208
Events Killed Affected Damage (000 US$)
Drought 6 8 5,547,442 64,453
Earthquake 12 2540 1,979,265 380,025
Epidemics 10 1105 137,988
Flood 94 1961 13,915,707 1,025,451
Landslide 211 25525 91,513,896 33,281
Storm 185 23096 91,197,264 5,529,644
Volcano 15 719 1,584,398 216,282
Table A1.14. Summarizing table for select disasters in the Philippines for the period 1982 to 2011
Table A1.14. Summarizing table for select disasters in the Philippines for the period 1982 to 2011
Events Killed Affected Damage (000 US$)
Drought 6 8 5,547,442 64,453
Earthquake 12 2540 1,979,265 380,025
Epidemics 10 1105 137,988
Flood 94 1961 13,915,707
1,025,451
Landslide 211 25525
91,513,896
33,281
Storm 185 23096
91,197,264
5,529,644
Volcano 15 719 1,584,398 216,282
Source: EM-DAT: The OFDA/CRED International Disaster Database; www.em-dat.net, Data retrieved 17 August 2011. Flood (flash, general, storm surge, coastal flood, unspecified; Landslide (dry, wet, avalanche, subsidence); Storm (unspecified, local, tropical).
Disaster Hazards: Typhoons season in the Philippines occurs between June and December. Over 20 typhoons affect the country annually, with 8 or 9 making landfall. These come from the southeast, are generally the strongest, and affect Samar, Leyte, eastern Quezon province, and the Batan islands, with the island of Luzon at a significantly higher risk than the southern areas. Flooding often results from heavy or prolonged rainfall associated with typhoons and tropical depressions. Prolonged heavy rainfall can destabilize soils along mountain-slopes, resulting in landslides and mudslides that cause severe damage to nearby villages.
Source: CIA Factbook

17
Disaster Exposure: At least 60 percent of the land area of the country is exposed to multiple hazards. Major droughts are associated with El Niño years. Droughts in 1997-98 caused widespread crop failures, water shortages, and forest fires in various parts of Philippines, and also dried out 20 % of the country’s fishponds. This led to a 6.6 % drop in agricultural production and a 9.5 % drop in construction and construction-related manufacturing (WB 2011). Earthquakes: The Philippine Institute of Volcanology and Seismology has recorded 12 destructive earthquakes in the last 40 years; the most damaging were the 1976 Mindanao Earthquake, killing approximately 6,000 and causing about US $400 million in damage, and the 1990 Central Luzon Earthquake, killing over 1,000 people and causing damages of about US $400 million. Volcanoes: Out of 220 volcanoes in the archipelago, 22 are classified as active. Tropical cyclones: From June to December, an average of 20 typhoons hits the country accompanied by strong winds, intense rainfall and flooding. Flooding: is usually triggered by typhoons, tropical depression and continuing heavy rains, or man- made causes such as dam failures, blockage of water ways by garbage and improper design of street drainage (GFDRR 2011).
Disaster Vulnerability: 74 percent of its population is vulnerable to hazards with the poor being the most vulnerable to damage caused by natural disasters. Urbanization, environmental degradation and climate change are major determinants of the population’s vulnerability to hazards. Rural: With almost one-third of the country’s employment is based on agriculture, disasters have contributed to the increasing incidence of poverty. Urban: those living in calamity-prone areas such as riverbanks and estuaries are vulnerable to natural and man-made disasters (GFDRR 2011). Climate change: the country is particularly vulnerable to sea level rise and storm surge because about 60 % of its municipalities and 10 of its largest cities are located along the coast. Rapid urbanization is likely to increase this figure in the next decades (WB 2011).
Figure A1.6. Vulnerability Index
Vulnerability
Index Risk
Absolute Risk
Relative Mortality Risk Index
Multiple
Cyclone
Flood
Landslide
Earthquake
Legend
Vulnerability Index: Estimated number of people killed per year (per mio. exposed)
Risk Absolute: Average killed per year
Risk Relative: Killed per million per year
Mortality Risk Index: Average of both
Source: Relief Web – Disaster Statistics Philippines, http://www.preventionweb.net/, Data accessed 17 August 2011.
References
World Bank (2011) Philippines Climate Dashboard, http://sdwebx.worldbank.org/climateportal/ EM-DAT: The OFDA/CRED International Disaster Database; www.em-dat.net, Belgium. Relief Web (2011) Disaster Statistics Philippines http://www.preventionweb.net/ GFDRR (2011) DRM Country Programs for Priority Countries. ASEAN Inter Parliamentary Assembly (2011) Third AIPA Caucus Report.

18
Singapore
Risk Exposure Profile: Singapore is relatively free from natural hazards due to its geographical location; however it is not spared from urban hazards, man-made disasters and epidemics. The city state prepares for civil emergencies which could involve for instance large-scale loss of lives or damage to property, or a major incident with potential to escalate in scale (AIPA Report 2011).
Geography and Climate: Singapore is an island country made up of 63 islands. Singapore has a tropical rainforest climate with uniform temperature and pressure, high humidity, and abundant rainfall. The wetter monsoon season stretches from November to January.
Disaster Risk: There is limited disaster risk, apart from epidemics. A potential disaster that could affect Singapore is the destructive impact of tsunami. In addition, Singapore faces some challenges with respect to the impacts of climate change (Progress Report 2009).
Disaster Hazards: In the period of 1982-2011, there were 3 cases of epidemics killing 48 and affecting 2,984 people (EM-DAT).
Table A1.15. Major Disasters in Singapore for the period 1982 to 2011 by total number of people killed and affected.
Disaster Date Killed Affected
Epidemic 25/02/2003 33 205 Epidemic Sep 2000 2 2022 Epidemic Mar 1999 1 11
Source: EM-DAT: The OFDA/CRED International Disaster Database; www.em-dat.net, Data retrieved 17 August 2011.
Disaster Exposure and Vulnerabilities: Singapore is a highly urbanized city state, with potential for cascading disaster situations. Singapore has an unusually low level of urban poverty (WB 2009:2). Singapore is vulnerable to transboundary air pollution, having experienced intense transboundary haze that severely affected air quality in 1994 and 1997 (WB 2009:4).
References
World Bank (2009) Climate Resilient Cities – City Profiles – Singapore, www.worldbank.org/eap/climatecities.
EM-DAT: The OFDA/CRED International Disaster Database; www.em-dat.net, Belgium.
ASEAN Inter Parliamentary Assembly (2011) Third AIPA Caucus Report, http://www.aipasecretariat.org/wp-content/uploads/2011/07/5.third_.caucus.report.pdf.
Singapore (2009) National progress report on the implementation of the Hyogo Framework for Action (2007-2009),
http://www.preventionweb.net/files/8476_Singapore[1].pdf.
Source: CIA Factbook
19
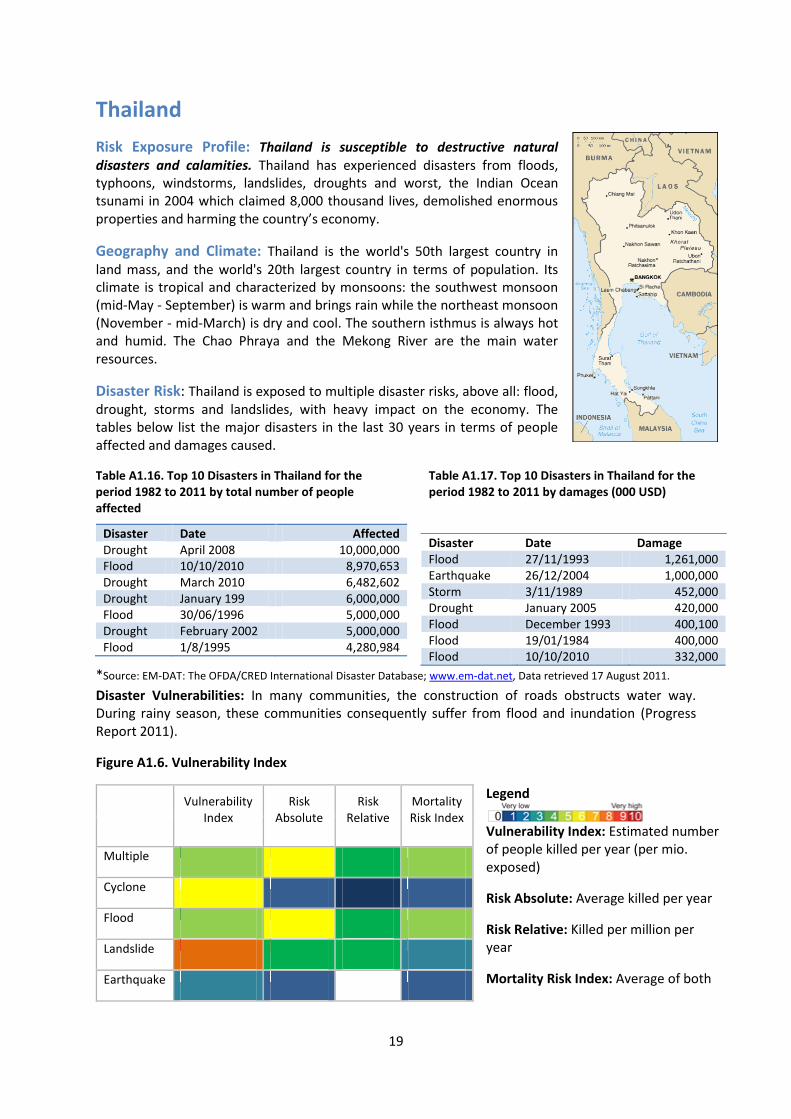
Thailand
Risk Exposure Profile: Thailand is susceptible to destructive natural disasters and calamities. Thailand has experienced disasters from floods, typhoons, windstorms, landslides, droughts and worst, the Indian Ocean tsunami in 2004 which claimed 8,000 thousand lives, demolished enormous properties and harming the country’s economy.
Geography and Climate: Thailand is the world's 50th largest country in land mass, and the world's 20th largest country in terms of population. Its climate is tropical and characterized by monsoons: the southwest monsoon (mid-May - September) is warm and brings rain while the northeast monsoon (November - mid-March) is dry and cool. The southern isthmus is always hot and humid. The Chao Phraya and the Mekong River are the main water resources.
Disaster Risk: Thailand is exposed to multiple disaster risks, above all: flood, drought, storms and landslides, with heavy impact on the economy. The tables below list the major disasters in the last 30 years in terms of people affected and damages caused.
Table A1.16. Top 10 Disasters in Thailand for the period 1982 to 2011 by total number of people affected
Disaster Date Affected Drought April 2008 10,000,000 Flood 10/10/2010 8,970,653 Drought March 2010 6,482,602 Drought January 199 6,000,000 Flood 30/06/1996 5,000,000 Drought February 2002 5,000,000 Flood 1/8/1995 4,280,984
Disaster Date Damage Flood 27/11/1993 1,261,000 Earthquake 26/12/2004 1,000,000 Storm 3/11/1989 452,000 Drought January 2005 420,000 Flood December 1993 400,100 Flood 19/01/1984 400,000 Flood 10/10/2010 332,000
Table A1.17. Top 10 Disasters in Thailand for the period 1982 to 2011 by damages (000 USD)
*Source: EM-DAT: The OFDA/CRED International Disaster Database; www.em-dat.net, Data retrieved 17 August 2011.
Disaster Vulnerabilities: In many communities, the construction of roads obstructs water way. During rainy season, these communities consequently suffer from flood and inundation (Progress Report 2011).
Figure A1.6. Vulnerability Index
Vulnerability
Index Risk
Absolute Risk
Relative Mortality Risk Index
Multiple
Cyclone
Flood
Landslide
Earthquake
Legend
Vulnerability Index: Estimated number of people killed per year (per mio. exposed)
Risk Absolute: Average killed per year
Risk Relative: Killed per million per year
Mortality Risk Index: Average of both

20
Source: Relief Web – Disaster Statistics Thailand, http://www.preventionweb.net/, Data accessed 17 August 2011.
References
EM-DAT: The OFDA/CRED International Disaster Database; www.em-dat.net-Université, Belgium.
Relief Web – Disaster Statistics Indonesia http://www.preventionweb.net/
ASEAN Inter Parliamentary Assembly (2011) Third AIPA Caucus Report, http://www.aipasecretariat.org/wp-content/uploads/2011/07/5.third_.caucus.report.pdf.
Thailand (2011) National progress report on the implementation of the Hyogo Framework for Action (2009-2011)
http://www.preventionweb.net/files/18764_tha_NationalHFAprogress_2009-11.pdf.
21
Viet Nam
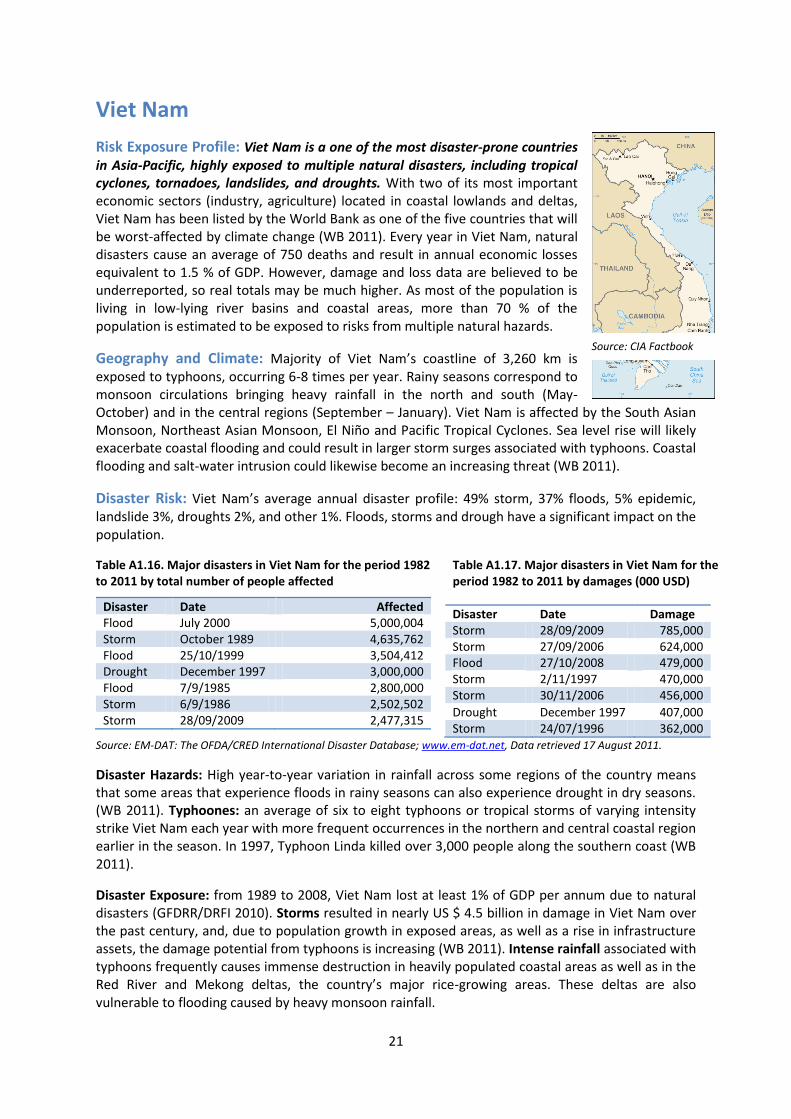
Risk Exposure Profile: Viet Nam is a one of the most disaster-prone countries in Asia-Pacific, highly exposed to multiple natural disasters, including tropical cyclones, tornadoes, landslides, and droughts. With two of its most important economic sectors (industry, agriculture) located in coastal lowlands and deltas, Viet Nam has been listed by the World Bank as one of the five countries that will be worst-affected by climate change (WB 2011). Every year in Viet Nam, natural disasters cause an average of 750 deaths and result in annual economic losses equivalent to 1.5 % of GDP. However, damage and loss data are believed to be underreported, so real totals may be much higher. As most of the population is living in low-lying river basins and coastal areas, more than 70 % of the population is estimated to be exposed to risks from multiple natural hazards.
Geography and Climate: Majority of Viet Nam’s coastline of 3,260 km is exposed to typhoons, occurring 6-8 times per year. Rainy seasons correspond to monsoon circulations bringing heavy rainfall in the north and south (May-October) and in the central regions (September – January). Viet Nam is affected by the South Asian Monsoon, Northeast Asian Monsoon, El Niño and Pacific Tropical Cyclones. Sea level rise will likely exacerbate coastal flooding and could result in larger storm surges associated with typhoons. Coastal flooding and salt-water intrusion could likewise become an increasing threat (WB 2011).
Disaster Risk: Viet Nam’s average annual disaster profile: 49% storm, 37% floods, 5% epidemic, landslide 3%, droughts 2%, and other 1%. Floods, storms and drough have a significant impact on the population.
Table A1.16. Major disasters in Viet Nam for the period 1982 to 2011 by total number of people affected
Disaster Date Affected Flood July 2000 5,000,004 Storm October 1989 4,635,762 Flood 25/10/1999 3,504,412 Drought December 1997 3,000,000 Flood 7/9/1985 2,800,000 Storm 6/9/1986 2,502,502 Storm 28/09/2009 2,477,315
Disaster Date Damage Storm 28/09/2009 785,000 Storm 27/09/2006 624,000 Flood 27/10/2008 479,000 Storm 2/11/1997 470,000 Storm 30/11/2006 456,000
Drought December 1997 407,000 Storm 24/07/1996 362,000
Table A1.17. Major disasters in Viet Nam for the period 1982 to 2011 by damages (000 USD)
Source: EM-DAT: The OFDA/CRED International Disaster Database; www.em-dat.net, Data retrieved 17 August 2011.
Disaster Hazards: High year-to-year variation in rainfall across some regions of the country means that some areas that experience floods in rainy seasons can also experience drought in dry seasons. (WB 2011). Typhoones: an average of six to eight typhoons or tropical storms of varying intensity strike Viet Nam each year with more frequent occurrences in the northern and central coastal region earlier in the season. In 1997, Typhoon Linda killed over 3,000 people along the southern coast (WB 2011).
Disaster Exposure: from 1989 to 2008, Viet Nam lost at least 1% of GDP per annum due to natural disasters (GFDRR/DRFI 2010). Storms resulted in nearly US $ 4.5 billion in damage in Viet Nam over the past century, and, due to population growth in exposed areas, as well as a rise in infrastructure assets, the damage potential from typhoons is increasing (WB 2011). Intense rainfall associated with typhoons frequently causes immense destruction in heavily populated coastal areas as well as in the Red River and Mekong deltas, the country’s major rice-growing areas. These deltas are also vulnerable to flooding caused by heavy monsoon rainfall.
Source: CIA Factbook

22
Disaster Vulnerability: An estimated 59% of its total land area and 71% of its population are vulnerable to cyclones and floods (GFDRR/DRFI 2011). An estimated 80–90 percent of the population is affected by typhoons according to the Ministry of Agriculture’s Central Committee for Flood and Storm Control (GFDRR 2011). The encroachment of economic activity and development into marginally suitable areas such as floodplains, costal swamps, drainage channels or other natural buffers only adds to the vulnerability of the population (GFDRR 2011). Drought: An estimated 1-1.3 million people are estimated to be drought-affected in 9 provinces of the Mekong region of Viet Nam, representing 13-17% of the total population (WB 2011).
Figure A1.7. Vulnerability Index
Vulnerability
Index Risk
Absolute Risk
Relative Mortality Risk Index
Multiple
Cyclone
Flood
Landslide
Earthquake
Legend
Vulnerability Index: Estimated number of people killed per year (per mio. exposed)
Risk Absolute: Average killed per year
Risk Relative: Killed per million per year
Mortality Risk Index: Average of both
Source: Relief Web – Disaster Statistics Viet Nam, http://www.preventionweb.net/, Data accessed 17 August 2011.
References
World Bank (2011) Climate Portal Viet Nam Dashboard, http://sdwebx.worldbank.org/climateportal/
GFDRR (2011) DRM Country Programs for Priority Countries
EM-DAT: The OFDA/CRED International Disaster Database; www.em-dat.net, Belgium.
Relief Web – Disaster Statistics Viet Nam http://www.preventionweb.net/
GFDRR/DRFI (2011) Fiscal Impact of Natural Disasters in Viet Nam.
GFDRR/DRFI (2010) Weathering the Storm: Options for Disaster Risk Financing in Viet Nam.
23
Appendix 2. Disaster Risk Management Profiles of ASEAN Member States
Brunei Darussalam
Risk Management Profile: Disaster Risk Management activities have been strengthening since 2008 and there is an effort to shift from traditional disaster response to mitigation and preparedness. DRM efforts gained momentum since Brunei’s participation in the 3rd Asian Ministerial Conference on Disaster Risk Reduction (AMCDRR) held in Kuala Lumpur in 2008. In 2009, the Government stated its commitment to DRR at the 2nd Session of the Global Platform for DRR, confirming this in the 3rd Session of the Global Platform for DRR in May 2011 (Progress Report 2011). The Disaster Management Order from 2006 established the National Disaster Management Centre (NDMC) with the goal of enhancing capacity in response and preparedness; building disaster resilience in the context of community-based disaster risk management (CBDRM); and active participation regional and international level though ASEAN and UN. Currently, NDMC is drafting the Strategic National Action Plan for Disaster Risk Reduction (SNAP) to outline programs, projects and activities to reduce disaster risks and also capacity building. SNAP is expected to be launched early 2012 (AIPA 2011).
International cooperation: At the regional level, NDMC is the focal point for ASEAN’s sectoral body ASEAN Committee on Disaster Management (ADCM). Meanwhile, for international cooperation in disaster management, NDMC is actively cooperating with the United Nations bodies such as United Nations International Strategy for Disaster Reduction (UNISDR) and United Nations Office for the Coordination of Humanitarian Affairs (UNOCHA). The NDMC is also engaged with other regional centers such as the Asian Disaster Reduction Centre; the Asia Disaster Preparedness Centre; the Pacific Tsunami Warning Center; and Pacific Disaster Centre. With the cooperation of the United States Forestry Department, the Incident Command System (ICS) as a systematic tool used for the command, control, and coordination of emergency response, has been adopted in Brunei Darussalam (AIPA 2011).
HFA Priority #1: There is no national multi-sectoral platform in place.
HFA Priority #2: Hazard and risk assessment exercise have been carried out by various agencies such as the Town and Country Planning and the Public Works Department as part of their core business in upgrading the country's infrastructure. However, national level multi-hazard risk assessment by a single agency to cover all hazards and risks posed by them to the population has not been done.
HFA Priority #3: There is need to establish a systematic data management, including historical data. DRR has yet to be incorporated in school curricula. A Community Based Disaster Risk Reduction program was launched in March 2010.
HFA Priority #4: There is need to strengthen linkages with the environment, town and country planning, and relevant departments. Building Codes have been revised while new guidelines were established for earthwork in development work.
HFA Priority #5: Village level coordination during disaster response has strengthened through district level Community Based Disaster Risk Management and also Incident Command System.
Opportunities
Mainstreaming DRM: Efforts should focus on integrating DRR into development policies, planning and programming at all levels with emphasis on disaster prevention, mitigation, preparedness and

24
vulnerability reduction. Throughout these activities, key stakeholders and grass root leaders need to be involved, especially in the development of hazard assessments and contingency plans (AIPA 2011).
References
Brunei Darussalam - National progress report on the implementation of the Hyogo Framework for Action (2009-2011) http://www.preventionweb.net/files/18630_brn_NationalHFAprogress_2009-11.pdf
Asean Inter Parliamentary Assembly (2011) Third AIPA Caucus Report, http://www.aipasecretariat.org/wp-content/uploads/2011/07/5.third_.caucus.report.pdf.
Cambodia
Risk Management Profile: While efforts have been made to improve the management of natural disasters and reduce the country’s vulnerability (GFDRR 2011), a number of challenges remain. Currently, most of Cambodia’s national strategies, policies, planning and budgetary processes do not consider climate change (WB 2011). Financial and institutional support tends to be ad hoc and project-related, although efforts have been made towards a more programmatic approach which includes disaster risk prevention rather than just disaster response (WB 2011). Strategy: The Strategic National Action Plan for Disaster Risk Reduction in Cambodia 2008-2013 (SNAP-DRR) was launched in March 2009. Prepared by the National Committee for Disaster Management and Ministry of Planning, this strategy has been formulated to serve as a road map for development of institutions, mechanisms and capacities of disaster management committees at all levels. First level priorities set out by the SNAP-DRR are strengthening sub national and community DRM capacities and mainstreaming DRR into policies and programs of relevant government ministries. With continuous efforts by local, national, regional and international organizations, DRM is trickling down from national to the local level (GFDRR 2011). A range of actors is involved in DRM, most notably the National Committee for Disaster Management, Ministry of Interior; Ministry of Agriculture, Forestry and Fisheries; Ministry of Health; Ministry of Public Works and Transport; Department of Hydrology and River Works (Ministry of Water Resources and Meteorology); Ministry of Education, Youth and Sports; Cambodia National Mekong River Commission; Mekong River Commission; Climate Change Office (Ministry of Environment).
HFA Priority # 1: The Strategic National Action Plan for Disaster Risk Reduction in Cambodia 2008-2013 was approved in 2009. It identifies six key DRR components and outlines DRR priorities in four levels.
HFA Priority # 2: Cambodia has limited scientific information on its risks. Some progress in risk assessment and monitoring and early warning systems can be found in the works of the Mekong River Commission which is developing flood and drought vulnerability indices for Lower Mekong basin.
HFA Priority # 3: The Ministry of Education Youth and Sports has piloted mainstreaming of disaster risk reduction measures into education sector. The work includes mainly developing and integrating DRR into school curriculum. NCDM has formulated a national disaster risk communication strategy.
HFA Priority # 4: While a number of small scale flood and drought mitigation projects are implemented, comprehensive norms and standards have not been established to integrate DRR measures into post disaster recovery and reconstruction frameworks.
25
HFA Priority # 5: There is a national working group on disaster coordination, response and recovery chaired by NCDM; however coordination for emergency response remains weak.
Opportunities
Mainstreaming and Coordinating DRM: The shift from traditional disaster response to a multi-sectoral holistic approach to DRR and climate change adaptation is still in its early stages. There is a need to develop sector specific risk reduction strategies and priority program investments. The most urgent investments are linked to the hydro-meteorological sector in flood protection and mitigation of storm damages. Close coordination is required between the involved institutions. Government efforts should be supported by strong partnerships with key development actors and stakeholders, including regional Banks, bilateral donors, the UN system, INGOS and civil society members.
Reliable hydromet services: A large segment of the population lives in the floodplains of the Mekong and Tonle Sap. In the absence of a flood forecasting and early warning system, multi-sectoral flood impacts have been increasing over the years. Capacities need to be strengthened to develop a fully operational flood and drought forecasting centre in cooperation with MRC.
References
World Bank (2011), Cambodia Climate Dashboard, http://sdwebx.worldbank.org/climateportal
GFDRR (2011) DRM Country Programs for Priority Countries.
Asean Inter Parliamentary Assembly (2011) Third AIPA Caucas Report http://www.aipasecretariat.org/wp-content/uploads/2011/07/5.third_.caucus.report.pdf
Indonesia
Risk Management Profile: Indonesia has well-formulated national action plans both for disaster risk reduction and for climate change mitigation and adaptation. After the 2004 Indian Ocean Tsunami, Indonesia enacted a new Law on Disaster Management (Law 24/2007) that outlines the principles, responsibilities, organization and implementation of the national DRM system, including the role of international organizations. The Law has been further elaborated by the issuance of three key Government Regulations, one Presidential Regulation and numerous implementing guidelines. Implementation of these plans, however, remains a challenge both in influencing sectoral programs to incorporate disaster and climate resilience, and in shifting public spending from ex-post to ex-ante. The Law on Disaster Management created the National Disaster Management Agency (BNPB) as a dedicated agency to deal with disasters whereas previously there was only an ad-hoc inter-ministerial council. BNPB is empowered with a strong mandate to coordinate line ministries on the entire cycle of disaster management from pre, during, and post disaster stages (WB 2011:157).
HFA Priority #1: Indonesia was among the first few countries in Asia to formulate a National Action Plan for Disaster Risk Reduction (NAP-DRR). As the first three-year NAP-DRR is nearly concluded, there is a need to develop a new action plan.
HFA Priority #2: Several Ministries are updating and disseminating hazard and risk analyses for their respective sectors. The National Agency for Disaster Management is preparing guidelines for local governments to conduct local disaster risk assessments. Since 2004, there are systematic efforts to develop an early warning system for tsunamis. Several volcano monitoring systems and their associated hazard maps have been installed and updated by the Volcanological Survey of Indonesia (VSI) for active volcanoes in Sumatra, Java and Sulawesi.

26
HFA Priority #3: Management and exchange of DRM information have intensified, in particular following the 2004 Indian Ocean Tsunami. Since then, the Data and Information on Indonesian Disaster (DiBi) by BNPB provides online searchable data on past disasters. Training and education on DRM have been focused on increasing preparedness especially for earthquakes, floods and landslides, tsunamis and volcanic eruptions. A number of awareness products have been produced to disseminate practical information to the general public.
HFA Priority #4: Key government ministries such as Public Works, Forestry, Environment, and Marine Affairs actively advocate the importance of forest rehabilitation and the proper establishment and management of greenbelt areas buffering the hazard risk zones from the population. Efforts have been made to address food security, hospital preparedness, and piloting of safe school buildings. The Ministry of Marine Affairs has also piloted a micro-insurance for coastal communities as part of micro–credit scheme. The Ministry of Public Works continues to promote the incorporation of disaster risk in the spatial plans, and local zoning regulations, as well as improving building standards and codes.
HFA Priority #5: Indonesia has witnessed a rapid growth of voluntary organizations specializing in DRM. While the growth trend remains positive, the focus is still limited to emergency response and less on risk reduction.
Opportunities
Mainstreaming and Implementation DRM: Introducing standard DRM features, such as disaster and climate proofing into future investments in infrastructure, urban development, rural and water, education, health, is crucial for a comprehensive DRM approach. Currently, only six out 33 provinces have established provincial disaster management agencies. Detailed implementation still requires both more specific consensus and new innovation for rehabilitating the current pattern of development and human settlement to build physically and socially safer and more resilient communities.
Capacity building for local government and communities in DRR requires major development investment. To fully transform the reactive mindset into one that reduces risk and prevents catastrophic impacts, systematic investment is required to build the capacity of local actors including governments, civil society and community organizations and the private sector.
References
World Bank (2011) Cambodia Climate Dashboard, http://sdwebx.worldbank.org/climateportal
GFDRR (2011) DRM Country Programs for Priority Countries.
GFDRR/DRFI (2010) Review of GFDRR-funded DRFI Projects.
Lao PDR
Risk Management Profile: Lao PDR has made significant gains in the area of Disaster Risk Management in the recent years but overall efforts need scaling up. National institutions at various levels are making efforts to expand their roles from disaster response managers to proactive DRR planners. A Ministry of Labor and Social Welfare decree (1139/MLSW) of April 2003 defined the Strategic Plan on Disaster Management (SPDM) which lays out goals until 2020 (GFDRR 2011). HFA Focal Point is the National Disaster Management Office (NDMO).
27
HFA Priority #1: National Disaster Management Committee (NDMC), an inter-ministerial committee, is the apex body with responsibilities for developing policies and coordinating DRM activities in the country. NDMC was established through a prime ministerial Decree No. 158/PM in August 1999. National Disaster Management Office (NDMO) is the secretariat of NDMC and is located in the Ministry of Labor and Social Welfare (MLSW). Roles and responsibilities of the NDMO and each member of NDMC have been defined by the internal MLSW decree No. 097/MLSW of June 2000.
HFA Priority #2: Limited risk mapping in selected communes and districts have been funded under donor projects, but no comprehensive or composite country-wide hazard or risk mapping exists. The Department of Meteorology and Hydrology is the main agency that produces the early warning information and disseminates to disaster management organizations, mainly to NDMO, which sends this information to the local DRM organizations to take appropriate actions and disseminate early warnings to communities at risk. When disaster occurs, information from the local level to the national level is slow. The capacity and the resources available with the local Disaster Management Committees for data collection and dissemination is extremely weak. Flood Vulnerability Assessment and Mapping Project (FVAMP) of the Mekong River Commission (MRC) is working to provide flood vulnerability indices to better manage flood and drought indices.
HFA Priority #3: Comprehensive disaster information management system is still lacking. There is no national action plan for disaster resilient school systems, and there are no specific DRR public awareness and education programs in place.
HFA Priority #4: The National Action Plan for Adaptation (NAPA) for Climate Change has been approved by the government. The NAPA has identified 45 priority project proposals to implement adaptation activities in four main sectors: agriculture, forestry, water and water resources, and public health.
HFA Priority #5: There is a lack of financial and human resources in the National Disaster Management Office. No contingency plan for natural disaster events is prepared by the NDMC.
Opportunities
Mainstreaming and Implementing DRM: The government is preparing a draft legal document and an institutional review for refining and strengthening the current framework for DRM. There is a need to strengthen the Disaster Management Committee (NDMC) at national, provincial and district levels; and to support the Sector Ministries, provinces and districts with establishment of tools and instruments to integrate DRM into planning, implementation and monitoring. Implementation of the strategic plan on DRR is weak. Based on the overarching goals of the Strategy for the Strategic Plan for Disaster Management (SPDM), an implementation plan is being drafted in a government-lead, multi-stakeholder process. This necessary first step to operationalize the SDMP focuses on provincial level preparedness.
Capacity Building: Public awareness about disaster causes and impacts, and mechanisms for mitigating and adapting to climate change is still low. There is a need to mobilize global knowledge and adjust it to local circumstances through pilot works and to enhance early warning and community preparedness.
References
World Bank (2011) Laos Climate Dashboard, http://sdwebx.worldbank.org/climateportal
GFDRR (2011) DRM Country Programs for Priority Countries.
Lao PDR (2011) National progress report on the implementation of the Hyogo Framework for Action (2009-2011) http://www.preventionweb.net/files/18358_lao_NationalHFAprogress_2009-11.pdf
28
Malaysia
Risk Management Profile: Malaysia has an advanced Disaster Risk Management framework and policies in place, including a range of structural measures to decrease risk and strengthen mitigation and preparedness. The National Security Council (NSC) is the principal policy-making and coordinating body for disaster management in Malaysia, coordinating and planning activities related to preparedness, prevention, response/relief operations and recovery/rehabilitation of disaster management. Malaysia invests heavily in infrastructure with a number of Flood Mitigation Projects, the most innovative of which is the Stormwater Management and Road Tunnel (SMART) constructed in the Kuala Lumpur city center. The SMART system diverts flood water via a holding pond, a bypass tunnel, and a storage reservoir, preventing spillover into the city during heavy downpours (AIPA Caucus Report 2011). HFA Focal Point is the National Security Council.
International Cooperation: At the regional level, Malaysia supports ASEAN Agreement in Disaster Management and Emergency Response (AADMER), and Malaysia also supports the establishment of the ASEAN Coordinating Centre for Humanitarian Assistance on Disaster Management (AHA Centre) in Jakarta (AIPA Caucus Report 2011). Malaysia actively participates in regional platforms including the Asian Disaster Reduction Centre (ADRC); Asian Disaster Preparedness Center (ADPC) as well as Typhoon Committee (TC). As the focal point for disaster management, the National Security Council also works closely with international organizations such as United Nations Office for the Coordination of Humanitarian Affairs (UNOCHA), and its subsidiary bodies, the United Nations Disaster Assessment and Coordination (UNDAC), International Search and rescue Advisory Group (INSARAG) and the Asia Pacific Economic Cooperation (APEC) Task Force on Emergency Preparedness (AIPA Brief Note 2011).
HFA Priority #1: The National Security Council is guided by NSC Directive No. 20, or The Policy and Mechanism for National Disaster and Relief Management, which prescribes an integrated emergency management system through the Disaster Management and Relief Committee (DMRC) present at the federal, state, and district levels. This directive is supported by other standard operating procedures, which outline the roles and responsibilities of various agencies for specific disasters, and by other related acts, namely: (a) the Land Conservation Act; (b) Environmental Protection Act; (c) Town and Country Planning Act; (c) Irrigation and Drainage Act; and (d) Uniform Building by Law (AIPA Caucus Report 2011).
HFA Priority #2: Malaysia is implementing various early warning and response systems to ensure preparedness in confronting disasters. It has an Emergency Response System which implements an efficient “999” emergency hotline. It also warns the public via a Fixed-Line Disaster Alert System (FLAS) and through the Government Integrated Radio Network (GIRN) (AIPA Caucus Report 2011). A National Tsunami Early Warning System has b e en developed by the Meteorological Department after 26 December 2004 to provide early warning on tsunami threat that may affect the country.
HFA Priority #3: The establishment of a cooperative in the form of Amanah Ikhtiar Malaysia (The Endeavor Trust of Malaysia) in 1987 has improved the resilience of communities previously vulnerable to disasters. Currently, the trust fund provides service to more than 180,000 families in Malaysia. Provided services include micro-financing, compulsory savings and welfare funds for the poor and marginalized. The NSC organized Community-Based Disaster Management (CBDRM) programs in collaboration with other agencies such as the Malaysian Meteorological Department (MMD), the Department of Town and Country Planning Peninsular Malaysia, the Ministry of Health and the Department of Irrigation and Drainage throughout the country. The program is aligned with the slogan: “Community Resilience through Disaster Awareness”. Malaysia has declared 26 December as disaster awareness day since 2005 (AIPA Brief Note 2011).

29
HFA Priority #4: Since 1972, the Government spent billions under the “Five Year Malaysian Plan” for Flood Mitigation Projects to reduce such risks. From 2001 to 2005 (5 years) a total of RM1.790 billion was spent for structural flood mitigation measures. Under the Ninth Malaysia Plan (2006-2010) the allocation for structural flood control works has tremendously increased to RM5.81 billion (AIPA Brief Note 2011).
HFA Priority #5: Local authorities implement the Urban Stormwater Management Manual (MSMA) and Land Use Planning Appraisal for Risk Areas (LUPAr) in the feasibility assessment and execution of physical developments. Public Works Department developed the National Slope Master Plan, which enables slope management and disaster risk reduction in incidents of landslides.
References
ASEAN Inter Parliamentary Assembly (2011) Third AIPA Caucus Report http://www.aipasecretariat.org/wp-content/uploads/2011/07/5.third_.caucus.report.pdf .
ASEAN Inter Parliamentary Assembly (2011) Third AIPA Caucus Report. Brief Note on the Role of the National Security Council, Prime Minister’s Department as National Management Organization (NDMO).
http://www.aipasecretariat.org/wp-content/uploads/2011/07/1.Malaysia-Disaster-Response-Management.pdf
Malaysia (2011) National progress report on the implementation of the Hyogo Framework for Action (2009-2011), http://www.preventionweb.net/files/19795_mys_NationalHFAprogress_2009-11.pdf
Myanmar
Risk Management Profile: Disaster Risk Management is in its early stages: a comprehensive DRM Law in Myanmar is lacking, and capacities at all levels are limited. The Myanmar Plan of Action on Disaster Risk Reduction is the country’s main road map for DRR in the country. At the national level, capacities are being improved as well as roles and responsibilities are being allocated to the specific government department to over DRR in the country (Progress report 2011). At the sub-national as well as community levels, institutions and capacities are also being strengthened to be able to monitor and respond to disasters. HFA Focal point: Ministry of Social Welfare, Relief and Resettlement (MSWRR).
International Engagement: The ongoing work on national level multi-hazard risk assessments should be encouraged and supported with technical and financial assistance. After Cyclone Nargis, Ministry of Education and Ministry of Health are in the process of integrating DRR in school and health sectors with the support from UN agencies and I/NGOs. UN agencies, MRCS, INGOs, and local NGOs have been implementing community level disaster risk management (Progress report 2011).
HFA Priority #1: National Disaster Preparedness Central Committee (NDPCC) chaired by the Prime Minister, prepared the Standing Order on Natural Disaster Management which sets out the roles and responsibilities of each ministry, department and Disaster Preparedness Committees. Lacking overarching DRM law remains the key challenge. While a special fund for relief exists, a policy directive for allocation of funds for specifically for DRR is still missing (Progress report 2011).
HFA Priority #2: A hazard profile of Myanmar has been developed by the government departments in cooperation with ADPC and agencies such as the Myanmar Engineering Society (MES) and the Myanmar Geosciences Society (MGS), in collaboration with the Myanmar Earthquake Committee. The dissemination of early warning is unable to reach remotest sections of community. A systematic, standardized and comprehensive risk assessment based on hazard and vulnerability information is lacking as there is inadequate resources to undertake these (Progress report 2011).
30
HFA Priority #3: Efforts have been made to inform public about daily weather condition regularly and early warnings for emergency through various channels of radio, cable television and newspaper. There is no formal country-wide public awareness strategy but there are numerous initiatives done at the ministerial and humanitarian agency level which contributes to public awareness (Progress report 2011).
HFA Priority #4: Myanmar Government has set up the National Commission for Environmental Affairs (NCEA) which aims is to ensure sustainable use of environmental resources and to promote environmentally sound practices in industry and in other economic activities. Although the National Environmental Policy and the “Myanmar Agenda 21” have been developed, they are not widely adopted in various sectors. While the Agenda recommends the establishment of a national framework for Environmental Impact Assessment (EIA), this has not been done. There is no comprehensive policy to reduce the vulnerability of economic activities. There is a need establish a national framework for assessing disaster impact and educate stakeholders on its application (Progress report 2011).
HFA Priority #5: DRR policies are not yet in place in many sectors and there are limited human resources dedicated to DRM. A comprehensive National Standing Order (SO) for all government ministries serves as a preparedness plan and a contingency plan. There is an absence of post disaster review structure, centralized trainings and Common/ Standard Post Disaster Needs Assessment. Only limited geographical area is covered on social development programs to reduce the risk as these mainly focus on the Nargis affected areas (Progress report 2011).
Opportunities
Institutions: There is no overarching DRM law and there is no clarity on how to integrate DRR into each ministry. The consolidation into a country Disaster Management Law / Policy is necessary. Individual ministries should adopt DRR and CCA components into their strategic planning.
Risk Assessment: A systematic, standardized and comprehensive risk assessment based on hazard and vulnerability information is lacking, and there are inadequate resources to undertake them. Hazard assessments need to be expanded and replicated in all hazard prone areas. There is limited data availability and poor quality for hazard risk catalogues, vulnerability and loss functions. There is no comprehensive policy to reduce the vulnerability of economic activities.
Early warning and preparedness: Dissemination framework for early warning should be restructured to include all key stakeholders. Early warning information needs to be understandable for the communities. Warning signals are not standardized. There is no countrywide strategy to raise awareness and preparedness to build a culture of safety and resilience at all levels, and to coordinate strategies and actions among various actors.
References:
Myanmar (2011) National progress report on the implementation of the Hyogo Framework for Action (2009-2011) – interim, http://www.preventionweb.net/files/16315_mmr_NationalHFAprogress_2009-11.pdf
Relief Web (2011) Myanmar: http://www.preventionweb.net/english/policies/?cid=118.

31
Philippines
Risk Management Profile: In view of its high exposure to natural hazards, the Government is taking a proactive approach to Disaster Risk Management as opposed to focusing mainly on post-disaster response by approving the Disaster Risk Reduction and Management (DRRM) Act in May 2010. To complement the DRRM Act, the Philippine Government has also formalized its Strategic National Action Plan for Disaster Risk Reduction (SNAP), which translates the country’s commitments to the Hyogo Framework for Action, in line with global good practice. President Aquino confirmed disaster risk reduction as a priority in his State of the Nation Address and in the medium-term development plan being formulated for 2011 – 2016. HFA Focal Point is the National Disaster Risk Reduction and Management Council (NDRRMC).
HFA Priority #1: The NDCC has been working towards strengthening decentralization of DRR in different sectoral agencies and Local Government Units. A more timely and responsive national DRM framework, along with the SNAP, are being prepared through a consultative process to improve DRM at the national and local levels. The SNAP and the National Framework for DRM will be the basis for creating a national platform for DRR. There is a general recognition that DRM related policies in the country are outdated and need to be revisited in the context of emerging challenges, such as climate change (GFDRR 2011).
HFA Priority #2: The NDCC is undertaking a multi-hazard mapping and assessment project in partnership with key government agencies. The project “Hazards Mapping and Assessment for Effective Community-Based Disaster Risk Management Project” (or READY) is being prepared to cover 27 provinces mostly located along the eastern part of the Philippines. This is funded by a US $1.9 million grant from the AusAID with technical assistance from UN DP. The project has helped established hazard maps and community-based early warning systems. Under the project, the use of hazard and risk assessment software called Rapid Earthquake Damage Assessment System (REDAS) has been introduced, which includes dynamic evaluation of earthquake hazards and information of at risk elements. The government is strengthening its early warning systems for all major hazards but LGUs still vary in their capacity for early warning systems (GFDRR 2011).
HFA Priority #3: There is no countrywide public awareness program on DRR. At present, education in DRR is still limited in scope (GFDRR 2011).
HFA Priority #4: Some laws and policies for DRR on land use planning are present but enforcement has been an issue. Economic and productive sectoral policies and plans to reduce the vulnerability of economic activities exist, but need to be strengthened (GFDRR 2011).
HFA Priority #5: Disaster preparedness and contingency plans are in place at all administrative levels and regular training drills and rehearsals are held to test and develop response programs (GFDRR 2011).
Opportunities
Implementing DRM: Enforcement of current legislation is required in order to mitigate the potential negative effects of climate change on already vulnerable areas. Actions at the national level, especially those related to disaster prevention, mitigation, and preparedness, have been fragmented and largely depended on the initiatives of the sectoral agencies. The role of the National Disaster Risk Reduction and Management Council needs to build its capacity to better coordinate ex-ante activities. At the local level, LGUs serve as the frontliners, but technical, financial, and operational capacities vary. There is an urgency to support actions especially among the vulnerable Local Government Units.

32
Risk Assessment: Improved capacity for agricultural and coastal zone impact modeling is needed. Collaboration between extension works and hydrometeorological research institutions, making climate data and information accessible to farmers, is particularly needed.
References
World Bank (2011) Philippines Climate Dashboard, http://sdwebx.worldbank.org/climateportal
GFDRR (2011) DRM Country Programs for Priority Countries.
GFDRR/DRFI (2010) Review of GFDRR-funded DRFI Projects.
Singapore
Risk Management Profile: Singapore faces low risks from natural hazards due to its geographical location; however it is not spared from urban hazards, man-made disasters and epidemics. National disaster monitoring and preparedness plans are in place. The main legislation supporting emergency preparedness and disaster management activities in Singapore are the Civil Defense Act, Fire Safety Act and Civil Defense Act. In addition, there are various laws enacted that empower respective government ministries and their agencies to prevent and manage crises (AIPA Report 2011). Singapore's OPS Civil Emergency Plan is a national contingency plan for managing large scale civil and natural disasters. This plan spells out the roles and functions of each agency whose distinct expertise is required to support the operations (Progress Report 2009). HFA Focal Point is the Meteorological Services Division (MSD).
HFA Priority #1: To handle civil emergencies, Singapore established the Incident Management System (Homefront Crisis Management System), with the role of Incident Manager (IM) for Civil Emergencies assigned to Singapore Civil Defense Force (SCDF) in 1997. The IM undertakes pre-emergency planning and coordinates responses during civil emergencies. Along Civil Defense Act, Fire Safety Act and Civil Defense Act, there are various laws enacted that empower respective government ministries and their agencies to prevent and manage crises such as the Building and Construction Authority Act, Building Control Act, Environment Protection and Management Act, Environment Public Health Act, Hazardous Waste (Control of Export, Import and Transit) Act, Infectious Diseases Act, National Environment Agency Act and Radiation Protection Act (AIPA Report 2011).
HFA Priority #2: Singapore has developed a national tsunami response plan which is a multi-government agency effort comprising an early warning system, tsunami mitigation and emergency response plans, and public education. The National Environment Agency (NEA) provides weather surveillance and multi-hazard warning services on a 24/7 basis to the public, industry and relevant agencies in Singapore. Singapore has also developed the tsunami early warning system in 2008 which is able to receive data in real-time from more than 20 seismic stations in the region (Progress Report 2009).
HFA Priority #3: SCDF has invested heavily in training programs and facilities. Specialist and command-related courses arm the staff with the necessary skills to perform their duties. SCDF has introduced a multitude of programs to equip the population with knowledge and skills to deal with emergencies (Progress Report 2009).
HFA Priority #4: The Building and Construction Authority of Singapore has strict building codes and also conducts regular checks on buildings to ensure their compliance (Progress Report 2009).
HFA Priority #5: The SCDF has developed a comprehensive set of emergency preparedness plan which includes the Community Emergency Preparedness Program, conducted community exercises,
33
developed the civil emergency handbook to members of public (Progress Report 2009). However, the high cost and logistic preparedness involved may not be warranted due to Singapore's low risk of natural disasters.
References
ASEAN Inter Parliamentary Assembly (2011) Third AIPA Caucus Report, http://www.aipasecretariat.org/wp-content/uploads/2011/07/5.third_.caucus.report.pdf.
Singapore (2009) National progress report on the implementation of the Hyogo Framework for Action (2007-2009) http://www.preventionweb.net/files/8476_Singapore[1].pdf
Thailand
Risk Management Profile: The Indian Ocean tsunami in 2004, which claimed 8,000 thousand lives, demolished enormous properties and harming the country’s economy, has changed Thailand’s perspective towards Disaster Risk Management. Since 2004, a number of reforms and mechanisms have been implemented to shift from the traditional or structural approach to disaster response, relief assistance and recovery, to a holistic DRM approach of risk reduction through preparedness and prevention and community involvement at all levels. Key piece of legislation is the Disaster Prevention and Mitigation Act of 2007 (DPM Act). Thailand’s governmental agency handling the country’s disaster management is the Department of Disaster Prevention and Mitigation (DDPM) under the Ministry of Interior. DDPM is at the same time the HFA Focal Point.
HFA Priority #1: The Disaster Prevention and Mitigation Act of 2007 (DPM Act) was institutionalized to provide the National Master Plan for Disaster Prevention and Mitigation for the years 2010 - 2014 consisting of three parts, namely: disaster prevention and mitigation principle; standard operating procedure in dealing with 24 different types of disasters; and national security issues. DRR is being incorporated in the strategy of managing natural resources and environment towards sustainability under the 11th National Economic and Social Development Plan 2012-2016. The structure and frameworks in the plan has not yet been effectively implemented (Progress Report 2011).
HFA Priority #2: Risk assessments at national and local level are carried out by experienced national agencies, namely Department of Mineral Resources (DMR) for geo-hazards; Royal Irrigation Department (RID) and Department of Water Resource (DWR) for water related hazards; Thai Meteorological Department (TMD) for weather and earthquake monitoring; National Disaster Warning System (NDWC) for Tsunami monitoring and warning. However, the hazard mappings for disaster are not available for all the regions, and there is no standard mapping for risk prone areas (Progress Report 2011).
HFA Priority #3: Most of people living in risk areas are not yet well aware of the risk, and at time do not follow the warning or instruction from the authorities. School curricula, education material and trainings are not promoted widely (Progress Report 2011).
HFA Priority #4: DRR concept is not adopted and administered in some productive sectors. Agricultural production sector has taken DRR into account, but other sectors do not have the systematic approach/procedures for DRR in business operation (Progress Report 2011).
HFA Priority #5: Disaster Prevention and Mitigation Academy is also established to be the national disaster management training centre. The government and local administration staffs including civil defense volunteers will be trained to develop their capacity in various courses such as community based risk management, fire fighting, search and rescue, incident command system.

34
Opportunities
Disaster Compensation: According to Ministry of Finance Regulation, victim compensation budget at the national level has already allocated 50 million baht for each kind of disaster, during last flood in October 2010 the cabinet approved to extend the recovery budget up to 100 million baht in some severe flood affected provinces. Losses of family member or infrastructure, livestock, fishery and household damages are also received the compensation budget. However, there are some concerns about the compensation systems, with complaints about delayed compensation (Progress Report 2011).
Mainstreaming and Coordinating DRM: The structure and frameworks in the plan has not yet been effectively implemented. The DPM Act 2007 does not enforce local authorities at sub-district, and village levels to create its own DPM action plan. Insufficient resources inhibit the implementation of the DRM framework (Progress Report 2011).
Awareness: The most challenging gap remains people’s disaster awareness. The lack of safety culture has resulted in limited knowledge and capacities, and unorganized disaster management. Most of the Community Based DRM projects or other initiatives do not have a comprehensive monitoring and evaluation system to ensure the transfer of training and improved competencies of the local people and local authorities to properly handle with risks and disasters. Communities need to be engaged in the process of drawing disaster management plans (Progress Report 2011).
References
ASEAN Inter Parliamentary Assembly (2011) Third AIPA Caucus Report, http://www.aipasecretariat.org/wp-content/uploads/2011/07/5.third_.caucus.report.pdf.
Thailand (2011) National progress report on the implementation of the Hyogo Framework for Action (2009-2011), http://www.preventionweb.net/files/18764_tha_NationalHFAprogress_2009-11.pdf
Viet Nam
Risk Management Profile: Strengthening Disaster Risk Management is a priority for the Government. In November 2007, the Government approved a National Strategy for Disaster Prevention, Response, and Mitigation to 2020 which lays out the country’s primary DRM objectives, with an emphasis on managing hydro-meteorological risks. Viet Nam’s national disaster risk management agency, the Committee for Flood and Storm Control (CCFSC), is chaired by the Minister of MARD. HFA Focal Point is the Ministry of Agriculture and Rural Development (MARD).
HFA Priority #1: Viet Nam does not have a comprehensive DRM law. The National Strategy for Natural Disaster Prevention, Response and Mitigation to 2020 is the key document underpinning all DRR policy and strategy. DRM is integrated into Viet Nam’s Poverty Reduction Strategy and Country Development Plans, although implementation remains uneven (GFDRR 2011).
HFA Priority #2: While limited national hazard mapping exists with a primary focus on water related events, there is little if any comprehensive risk mapping. Where hazard data exists, there is often insufficient exposure data. In particular regions, there is a high level of awareness about Viet Nam’s exposure to natural hazards at both the national, provincial and commune level when related to annual river based flooding rather than floods associated with tropical cyclones. Communities living along the low lying Mekong Delta areas have experienced floods for generations, and the government has developed a program of “living with floods.” MONRE is the state agency charged with hazard monitoring through its Department of Hydro-meteorology and Climate Change.
35
Insufficient coverage and distribution of the observation centers, and outdated equipment is cited by the national hydro- meteorology centers as an impediment to accurate forecasting (GFDRR 2011).
HFA Priority #3: Scaling up its Community-based Disaster Risk Management program is a priority for Viet Nam in the next decade (GFDRR 2011).
HFA Priority #4: Mangrove forests, which have traditionally provided a barrier against flooding and seawater intrusion, have steadily been decreasing in acreage as Viet Nam’s population expands. However, the government has been making efforts in mangrove reforestation and passed appropriate legislation to reforest vulnerable areas and encourage the sustainable use and management of ecosystems. Viet Nam’s building codes enforcement varies among provinces (GFDRR 2011).
HFA Priority #5: Viet Nam has a central, provincial, district and commune level emergency response plans for storms and floods which are reviewed and updated annually (GFDRR 2011).
Opportunities
Institutions and Coordination: Legislation related to natural disasters is prolific—in spite of the lack of an explicit DRM law—but enforcement is erratic. Improved coordination is needed for emergency relief, damage recovery, and rehabilitation of hazard-struck areas. Construction planning needs to include better safety measures, particularly in industrial zones, tourist zones, the urban areas of coastal regions, and upland areas. Stringent regulations are needed to discourage construction in zones that are at-risk of inundation, flash floods, storms, sea surges, and landslides. There is lack of synchronized planning and coordination among ministries and sectors, and insufficient attention is given to the integration of natural hazard and climate risk issues within local and sectoral socio-economic development programs.
Awareness and Preparedness: Forecasts and warning systems need to be improved for hazards such as flash floods and landslides. Efforts in community awareness raising and training on risk from climate hazards need to be systematic, and relevant modules should be included in school curricula.
References
World Bank (2011) Climate Portal Viet Nam Dashboard, http://sdwebx.worldbank.org/climateportal/
GFDRR (2011) DRM Country Programs for Priority Countries.
GFDRR/DRFI (2011) Fiscal Impact of Natural Disasters in Viet Nam.
GFDRR/DRFI (2010) Weathering the Storm: Options for Disaster Risk Financing in Viet Nam.

36
Appendix 3. Fiscal Risk Management of Natural Disasters by ASEAN Governments
This appendix assesses contingent liabilities and reviews existing disaster risk financing and insurance arrangements for post-disaster response in the ten ASEAN member states. Governments only assume financial responsibility for part of the total economic losses incurred as a consequence of a natural disaster. The annex therefore begins by defining these responsibilities and explores related costs in fulfilling them. The annex then presents a desk-based review of the performance and adequacy of disaster risk financing and insurance arrangements, including the extent of reliance on non-formalized instruments in the form of post-disaster budget reallocations, longer-term capital investment realignments and fiscal deficit financing. It reviews disaster financing tracking systems and available evidence on the scale of funding gaps in several ASEAN Member States. It ends by exploring some possible options for strengthening disaster risk financing arrangements.
Introduction
Disasters potentially increase public spending requirements whilst simultaneously reducing revenue. Their immediate and longer-term fiscal consequences depend on the nature and extent of disaster risk financing instruments at a government’s disposal.
Levels of public expenditure on risk reduction should be sufficient relative to the level and nature of risks faced, the expected net economic and social returns to individual risk reduction investments and the reasonable responsibilities and obligations of government (most critically, to avert loss of life) (Benson, 2009a).
Conventional best practice advocates a layered approach to the development of financing tools and mechanisms to manage the residual risk (Figure A4.1). Risks associated with high-frequency, lower-cost events occurring on a near-annual, recurrent basis should be met via regular annual budgeting of contingency resources to cover minimum expected public relief and reconstruction spending in ‘good’ years of low loss. These risks are, in effect, retained. Governments can secure further funding via the post-disaster reallocation of budgetary resources and the realignment of national investment priorities, again, in effect, retaining risk. They can also introduce temporary, post-disaster tax increases.
The next level of risk, associated with medium-frequency, medium-cost events should be financed via a widening of the budget deficit in the form of either increased borrowing or a monetary expansion. Related funding instruments can include development partner contingency credit arrangements and post-disaster reconstruction loans.
Remaining layers of residual risk associated with lower-frequency, higher-cost event should be transferred to third parties via a mixture of reinsurance tools, catastrophe bonds and, for the most extreme events, reliance on international assistance.

37
Figure A3.1. Catastrophe risk layering
Source: Cummins and Mahul, 2008
In parallel, governments can support the creation of enabling environments and, possibly, public-private partnerships to encourage the development of private agricultural, livestock, home-owner and other individual policy-holder insurance mechanisms, thereby reducing public contingent liability. The private sector and individual households should also be encouraged to reduce their vulnerability to natural hazards via a combination of regulatory and legislative requirements (e.g., pertaining to land use and building codes), financial incentives and awareness-building campaigns.
There is an additional time dimension relating to the decomposition of post-disaster response into the various phases of relief, early recovery and reconstruction and the related suitability of various financing mechanisms to each of these phases. Some initial, but limited, resources are urgently needed for emergency relief purposes, to address immediate humanitarian needs. Additional, perhaps more substantial, resources are required for early recovery. Finally, much larger but less urgent funding is needed for reconstruction (World Bank, 2010a) (Figure A4.2).
Figure A3.2. Post-disaster Phases and Financing Needs
Source: Ghesquiere and Mahul, 2007
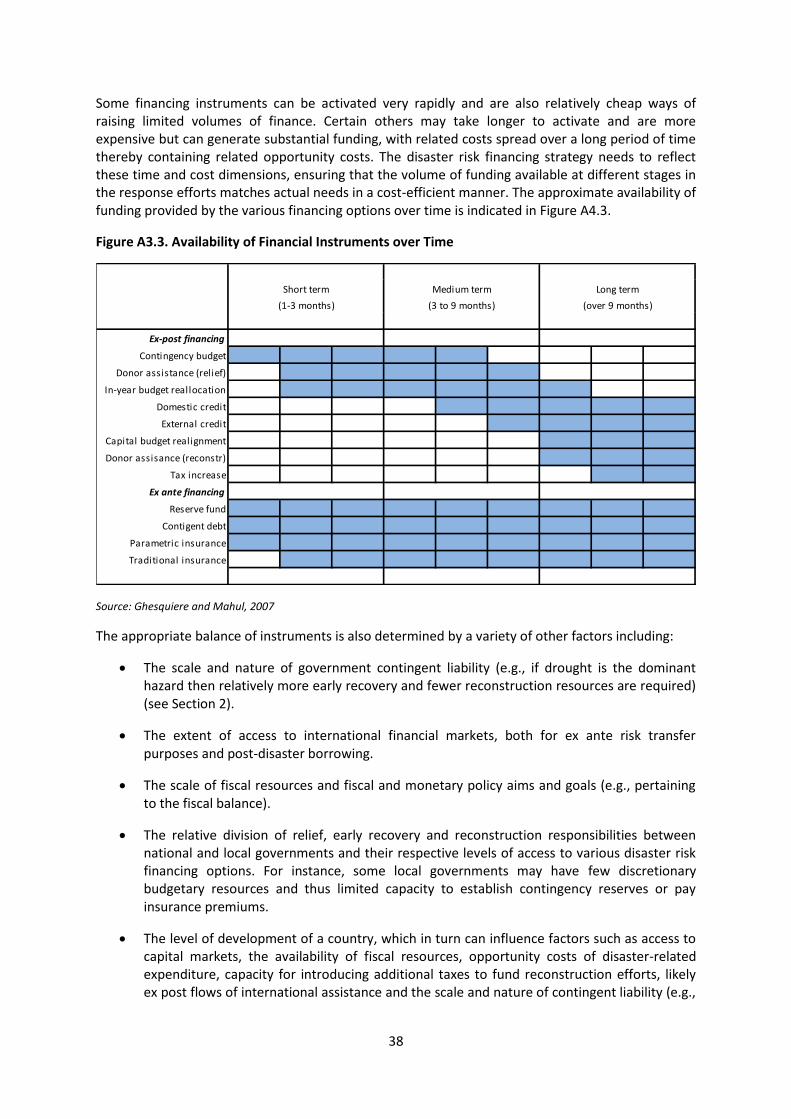
38
Some financing instruments can be activated very rapidly and are also relatively cheap ways of raising limited volumes of finance. Certain others may take longer to activate and are more expensive but can generate substantial funding, with related costs spread over a long period of time thereby containing related opportunity costs. The disaster risk financing strategy needs to reflect these time and cost dimensions, ensuring that the volume of funding available at different stages in the response efforts matches actual needs in a cost-efficient manner. The approximate availability of funding provided by the various financing options over time is indicated in Figure A4.3.
Figure A3.3. Availability of Financial Instruments over Time
Source: Ghesquiere and Mahul, 2007
The appropriate balance of instruments is also determined by a variety of other factors including:
The scale and nature of government contingent liability (e.g., if drought is the dominant hazard then relatively more early recovery and fewer reconstruction resources are required) (see Section 2).
The extent of access to international financial markets, both for ex ante risk transfer purposes and post-disaster borrowing.
The scale of fiscal resources and fiscal and monetary policy aims and goals (e.g., pertaining to the fiscal balance).
The relative division of relief, early recovery and reconstruction responsibilities between national and local governments and their respective levels of access to various disaster risk financing options. For instance, some local governments may have few discretionary budgetary resources and thus limited capacity to establish contingency reserves or pay insurance premiums.
The level of development of a country, which in turn can influence factors such as access to capital markets, the availability of fiscal resources, opportunity costs of disaster-related expenditure, capacity for introducing additional taxes to fund reconstruction efforts, likely ex post flows of international assistance and the scale and nature of contingent liability (e.g.,
Ex-post financing
Contingency budget
Donor assistance (relief)
In-year budget reallocation
Domestic credit
External credit
Capital budget realignment
Donor assisance (reconstr)
Tax increase
Ex ante financing
Reserve fund
Contigent debt
Parametric insurance
Traditional insurance
Short term Medium term Long term
(1-3 months) (3 to 9 months) (over 9 months)

39
via lower physical exposure in lower income countries, although partly counteracted by likely lower insurance penetration).
Broadly speaking, in large developed countries, many governments effectively self insure their public assets and wider contingent liability because they have easy access to capital markets (World Bank, 2011a). In contrast, sovereign risk transfer tools are required in small, low-income and highly exposed countries that have overstretched tax bases and highly correlated infrastructure risks (Linnerooth-Bayer and Mechler, 2009). Certain middle-income countries with limited fiscal resources or access to capital may also require sovereign risk transfer mechanisms (World Bank, 2011a). Sovereign risk transfer tools are particularly justified for countries where potential disaster-related losses are large relative to their national economies or where the cost of mobilizing post-disaster funding is high (Cummins and Mahul, 2008).
If adequate and timely funding arrangements are not in place, the adverse socio-economic impact of a disaster can be significantly exacerbated, both at the macro and household level. Recent theoretical econometric modeling by Hallegatte et al (2007) suggests that the economic impacts of disasters, as defined in terms of gross domestic product (GDP) losses, are much higher in such countries where public (and private) reconstruction resources are limited and thus where reconstruction is spread over a number of years. Meanwhile at the household level, if public assistance is insufficient or even simply delayed, poorer disaster-affected families may be forced to resort to various coping mechanism such as informal high-interest borrowing, reductions in consumption, deferred payment of rent, sale of household and productive assets (sometimes at highly reduced prices) and withdrawal of children from school, all of which can have adverse long-term socio-economic consequences. Opportunities presented by disasters to upgrade infrastructure and technology and to strengthen resilience to future hazard events are also best exploited by ensuring that there will be sufficient funding available for reconstruction. Conversely, excess front-loading of reconstruction funds can increase inflation (Fengler et al, 2008).
Defining contingent liability
Governments only assume financial responsibility for part of the total disaster response efforts. Some contingent liabilities are clear cut, others a matter of policy choice (Figure A4.4). Governments have an obvious duty as a provider of public goods to repair public infrastructure such as roads, bridges, ports, schools and health facilities in the aftermath of a disaster. They have a moral and social imperative to provide rescue services and short-term humanitarian relief. Further government actions are driven by a combination of equity and economic growth concerns. These lead governments into the roles of ‘insurer of last resort’ and stimulator of economic recovery. As insurer of last resort, governments may provide support to the poor and near-poor in re-building homes and livelihoods and also, where private insurance penetration is low, to support higher income groups along similar lines.
In order to establish the precise scale of contingent liability, governments and stakeholders need to define their exact public and individual roles and responsibilities, including precise levels of support, under different disaster scenarios (World Bank, 2010a).
Contingent liability relating to the loss of public assets and infrastructure is easily calculated in countries where comprehensive disaster risk assessments of public property have been conducted, although with slight complications where the private sector is heavily involved in basic services provision. For instance, the damage, loss and needs assessment undertaken following the September 2009 Western Sumatra flood noted that the Indonesian Government might not be able to provide assistance to institutions that provided social services but were privately managed, such as mosques, community groups and health and education facilities (which provide much of the schooling in the region) (Indonesia BNPB et al, 2009). The extent of commitment to build-back-

40
better principles and the precise nature of specific actions required to strengthen resilience (e.g., re-siting of public assets) will also affect the cost of public infrastructure reconstruction.
Figure A3.4. Forms of contingent liability
Source: Benson (2009a)
Contingent liability relating to personal losses can be directly estimated in Viet Nam and Lao PDR, where statutory levels of personal compensation in the event of a disaster have been set, relating to loss of human life or injury and loss of homes and productive assets. In both cases, this compensation is fixed at very low levels, providing a safety net for the poor but also ensuring that related costs are not prohibitive.
Estimation of contingent liability for personal losses is more difficult elsewhere. Other ASEAN Member States also have some form of standing order or legislation on the roles and responsibilities of individual government departments and local government in disaster preparedness and response which typically include responsibilities to affected households. However, these responsibilities are relatively generally worded, simply establishing the principle that support will be provided rather than detailing specific financial obligations.
In practice, provision of emergency relief and compensation for loss of life and injury is common. Reflecting limited penetration of private catastrophe insurance in many ASEAN Member States for either property or crops (see Section 3.2.2), many governments also provide some grant or loan support for the replacement of housing, particularly of the poor, and seeds, fertilizer and other assistance for affected farmers and fisher folk. Support is sometimes provided to stimulate the recovery of small businesses too, in the form of assistance in accessing new loans for rehabilitation purposes, in restructuring existing loans and, more occasionally, in alleviating tax burdens (see Section 3.1.4). For instance, the Central Bank of Malaysia established a Special Relief Guarantee Fund for the recovery of businesses affected by disasters in 2006. Under the Fund arrangement, commercial banks provided financing with 2.5% interest while the Central Bank covered an additional 2.45% of interest and an 80% guarantee of the financing (Malaysia National Security
Contingent
liability
Provider of public goods
- Repair and reconstruction of public infrastructure
Moral and social duty
- Search and rescue services - Humanitarian relief
Stimulation of economic growth
- Economic assistance to
affected businesses
Public imperative Policy choice
Equity concerns - ‘Insurer of last resort’ (lives,
homes, livelihoods)

41
Council, 2011). In the aftermath of major disaster events in ASEAN states, support for private sector recovery may extend even further.
However, in the absence of mandated forms and levels of specific financial obligations on post-disaster support, the amount of assistance provided by a particular government in response to different events can fluctuate widely. In Thailand, for instance, substantially higher payments were made to families who lost their principal breadwinner as a consequence of the 2004 Indian Ocean tsunami than to those who lost breadwinners in recent flood events. Similarly, homeowners received more support following the 2006 Central Java earthquake than the 2009 West Java and West Sumatra earthquakes in Indonesia (World Bank, 2011a). Levels of support can vary even in Viet Nam where provinces sometimes provide much higher levels of disaster compensation – in some cases perhaps 5 to 6 times more – than legally mandated (Benson, 2009b). Ad hoc compensation may also be provided for additional private losses to those specified in Viet Namese law.
Levels of compensation may be influenced by a range of factors including:
The scale of the event, with larger events often resulting in additional forms of compensation to offset potential exponentially larger indirect and secondary economic consequences. For example, the Thai Cabinet approved a budget of US$ 93.7 million to revive tourism in areas affected by the 2004 tsunami. The program included tax relief, soft loans and subsidized fares and room rates and the establishment of duty free shops to stimulate demand. An extra US$ 19.5 million was also added to the tourism marketing and promotion budget, with a post-disaster strategy focusing on new markets and new products (UN, 2006).
The level of national and international media coverage, in turn in part correlated with the scale of the event.
The availability of funding relative to the scale and nature of response needs, itself in part influenced by prevailing macroeconomic conditions as well as disaster risk financing arrangements.
Political opportunism to garner support. For instance, in the case of the United States of America, there has been a long-term trend of increasingly generous federal disaster assistance (Cummins et al, 2007), a trend that may also be occurring in some ASEAN Member States. In a US context, Moss (1999: 334)1 explains this trend as follows:
‘ Disaster spending has become a political sacred cow. … Again and again in the aftermath of disasters, representatives from the affected states have insisted that their constituents deserve no less than what other victims received and that the particular nature of their disaster might justify even more. Federal catastrophe coverage has thus been subject to a ratcheting-up process …’
The lack of clarity on forms and levels of post-disaster government support makes it extremely difficult to estimate public contingent liability from an ex ante perspective, based on expected government behavior. Moreover, it can make it difficult to manage the general public’s expectations concerning post-disaster support and to provide equitable, cost-efficient disaster response packages. A clear delineation of public and private roles and responsibilities is essential in encouraging private commercial and domestic uptake of risk transfer products and investment in risk reduction.
1 Moss, David A. 1999. ‘Courting Disaster? The Transformation of Federal Disaster Policy since 1803.’
The Financing of Catastrophe Risk. Froot, K.A. (ed.). Chicago and London: University of Chicago Press. 1999. Cited in Cummins et al (2007).

42
ASEAN governments should therefore consider developing clear, binding commitments concerning their relief, early recovery and reconstruction roles and responsibilities under different disaster scenarios. Levels, as well as forms, of public support should to be specified. These commitments may well differ between countries, reflecting factors such as the nature of disaster risks faced, economic structure and levels of prosperity. In developing their commitments, governments should link each area and form of support back to possible ex ante risk reduction alternatives and compare relative costs and benefits. Nationwide, cross-political agreement is required to honor, but not exceed, these commitments. This agreement should help overcome political reluctance to invest in disaster risk financing strategies that could potentially result in payoffs under another government’s watch.
Issues of moral hazard also need to be considered in setting forms and levels of compensation. The promise of government support reduces economic incentives for private action and, thus, ultimately increases levels of contingent liability. Government programs of support therefore need to be designed to minimize crowding out of individual risk reduction and risk transfer initiatives (OECD, 2010). For instance, extraordinary taxes could be imposed on uninsured property (Borensztein et al, 2008).
Evidence on contingent liability
Ex post estimates of damage and of public sector shares in recovery and reconstruction spending requirements for recent disasters in the ASEAN region may provide the basis for an alternative approach to the estimation of contingent liability. Observed ratios of damage to public sector recovery and reconstruction spending requirements can be applied to the average expected loss (AEL) and probable maximum loss (PML) data presented in Chapter 2 and Annex 3 to generate public contingency liability estimates.
Some recent estimates of damage and public spending requirements can be readily obtained from recent damage, loss and needs assessments undertaken in the aftermath of major disasters in the ASEAN region (Table A4.1). It should be noted that emergency relief needs are typically not included in these estimates and thus that total disaster response needs are higher than the figures indicated.
Table A3.1. Recent damage, loss and needs assessment findings for ASEAN Member States
Year
Disaster event
Damage and losses
Estimated recovery and reconstruction requirements
Total
(US$ million)
Damage (US$
million)
Losses (US$
million)
Public sector share
in total (%)
Total (US $
million)
Public sector share
(%)
Public sector
require-ment as
% of GDP
Cambodia 2009 Typhoon
Ketsana 132 58 74 191
Indonesia 2004 Aceh and West
Sumatra tsunami
4,452 2,920 1,531 34 NA ($4.6bn) 1.8
2006 Aceh floods 210 198 12 30 NA NA NA 2009 West Sumatra
floods 2,300 2,070 230 12 2,436.5 31 NA
Lao PDR
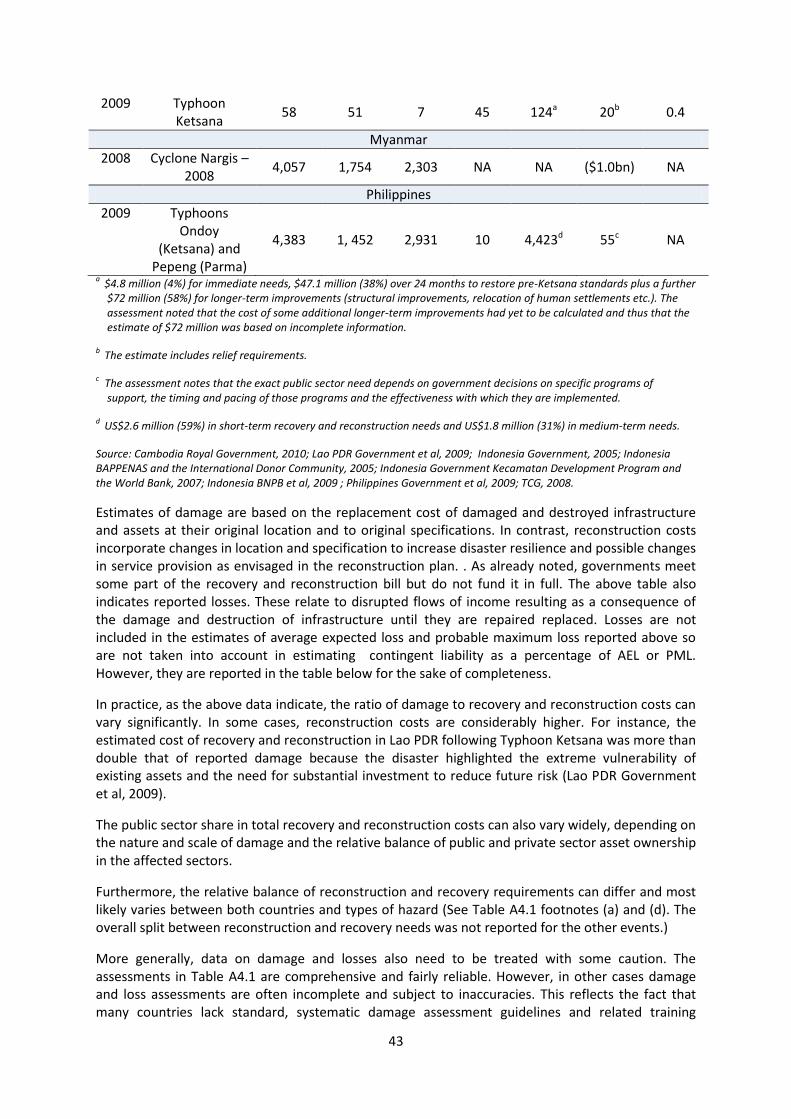
43
2009 Typhoon Ketsana
58 51 7 45 124a 20b 0.4
Myanmar
2008 Cyclone Nargis – 2008
4,057 1,754 2,303 NA NA ($1.0bn) NA
Philippines
2009 Typhoons Ondoy
(Ketsana) and Pepeng (Parma)
4,383 1, 452 2,931 10 4,423d 55c NA
a $4.8 million (4%) for immediate needs, $47.1 million (38%) over 24 months to restore pre-Ketsana standards plus a further
$72 million (58%) for longer-term improvements (structural improvements, relocation of human settlements etc.). The assessment noted that the cost of some additional longer-term improvements had yet to be calculated and thus that the estimate of $72 million was based on incomplete information.
b The estimate includes relief requirements.
c The assessment notes that the exact public sector need depends on government decisions on specific programs of
support, the timing and pacing of those programs and the effectiveness with which they are implemented.
d US$2.6 million (59%) in short-term recovery and reconstruction needs and US$1.8 million (31%) in medium-term needs.
Source: Cambodia Royal Government, 2010; Lao PDR Government et al, 2009; Indonesia Government, 2005; Indonesia BAPPENAS and the International Donor Community, 2005; Indonesia Government Kecamatan Development Program and the World Bank, 2007; Indonesia BNPB et al, 2009 ; Philippines Government et al, 2009; TCG, 2008.
Estimates of damage are based on the replacement cost of damaged and destroyed infrastructure and assets at their original location and to original specifications. In contrast, reconstruction costs incorporate changes in location and specification to increase disaster resilience and possible changes in service provision as envisaged in the reconstruction plan. . As already noted, governments meet some part of the recovery and reconstruction bill but do not fund it in full. The above table also indicates reported losses. These relate to disrupted flows of income resulting as a consequence of the damage and destruction of infrastructure until they are repaired replaced. Losses are not included in the estimates of average expected loss and probable maximum loss reported above so are not taken into account in estimating contingent liability as a percentage of AEL or PML. However, they are reported in the table below for the sake of completeness.
In practice, as the above data indicate, the ratio of damage to recovery and reconstruction costs can vary significantly. In some cases, reconstruction costs are considerably higher. For instance, the estimated cost of recovery and reconstruction in Lao PDR following Typhoon Ketsana was more than double that of reported damage because the disaster highlighted the extreme vulnerability of existing assets and the need for substantial investment to reduce future risk (Lao PDR Government et al, 2009).
The public sector share in total recovery and reconstruction costs can also vary widely, depending on the nature and scale of damage and the relative balance of public and private sector asset ownership in the affected sectors.
Furthermore, the relative balance of reconstruction and recovery requirements can differ and most likely varies between both countries and types of hazard (See Table A4.1 footnotes (a) and (d). The overall split between reconstruction and recovery needs was not reported for the other events.)
More generally, data on damage and losses also need to be treated with some caution. The assessments in Table A4.1 are comprehensive and fairly reliable. However, in other cases damage and loss assessments are often incomplete and subject to inaccuracies. This reflects the fact that many countries lack standard, systematic damage assessment guidelines and related training
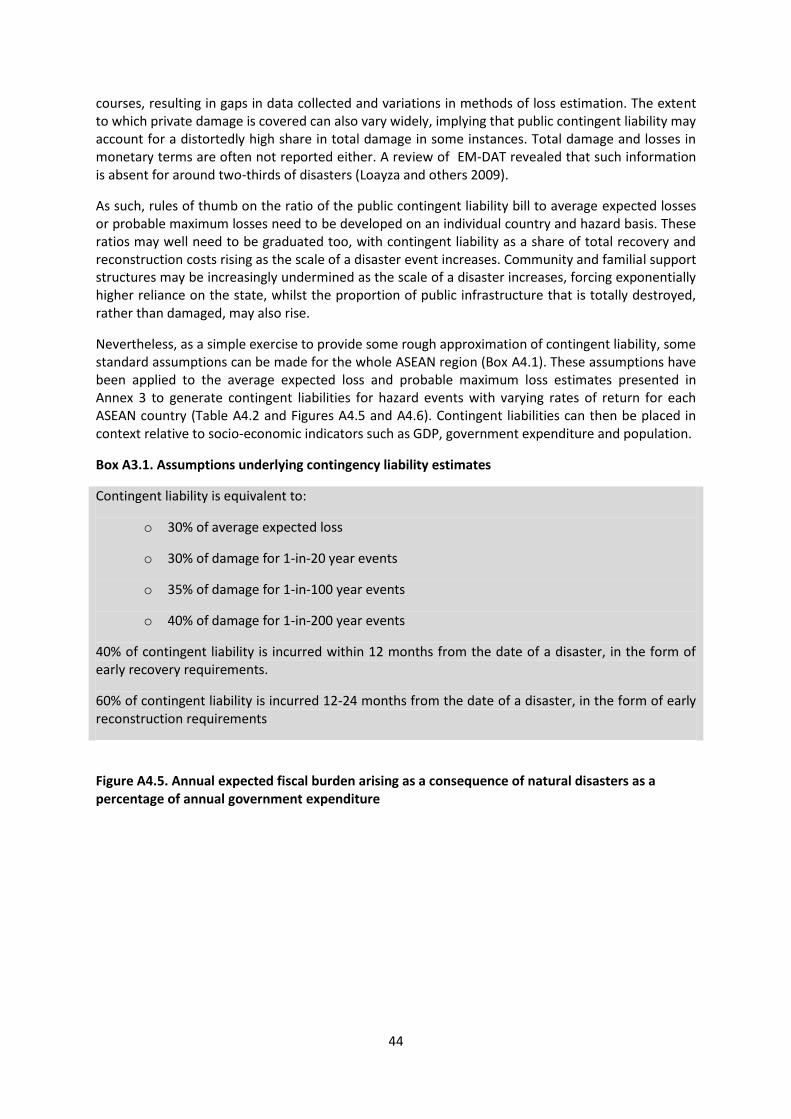
44
courses, resulting in gaps in data collected and variations in methods of loss estimation. The extent to which private damage is covered can also vary widely, implying that public contingent liability may account for a distortedly high share in total damage in some instances. Total damage and losses in monetary terms are often not reported either. A review of EM-DAT revealed that such information is absent for around two-thirds of disasters (Loayza and others 2009).
As such, rules of thumb on the ratio of the public contingent liability bill to average expected losses or probable maximum losses need to be developed on an individual country and hazard basis. These ratios may well need to be graduated too, with contingent liability as a share of total recovery and reconstruction costs rising as the scale of a disaster event increases. Community and familial support structures may be increasingly undermined as the scale of a disaster increases, forcing exponentially higher reliance on the state, whilst the proportion of public infrastructure that is totally destroyed, rather than damaged, may also rise.
Nevertheless, as a simple exercise to provide some rough approximation of contingent liability, some standard assumptions can be made for the whole ASEAN region (Box A4.1). These assumptions have been applied to the average expected loss and probable maximum loss estimates presented in Annex 3 to generate contingent liabilities for hazard events with varying rates of return for each ASEAN country (Table A4.2 and Figures A4.5 and A4.6). Contingent liabilities can then be placed in context relative to socio-economic indicators such as GDP, government expenditure and population.
Box A3.1. Assumptions underlying contingency liability estimates
Contingent liability is equivalent to:
o 30% of average expected loss
o 30% of damage for 1-in-20 year events
o 35% of damage for 1-in-100 year events
o 40% of damage for 1-in-200 year events
40% of contingent liability is incurred within 12 months from the date of a disaster, in the form of early recovery requirements.
60% of contingent liability is incurred 12-24 months from the date of a disaster, in the form of early reconstruction requirements
Figure A4.5. Annual expected fiscal burden arising as a consequence of natural disasters as a percentage of annual government expenditure
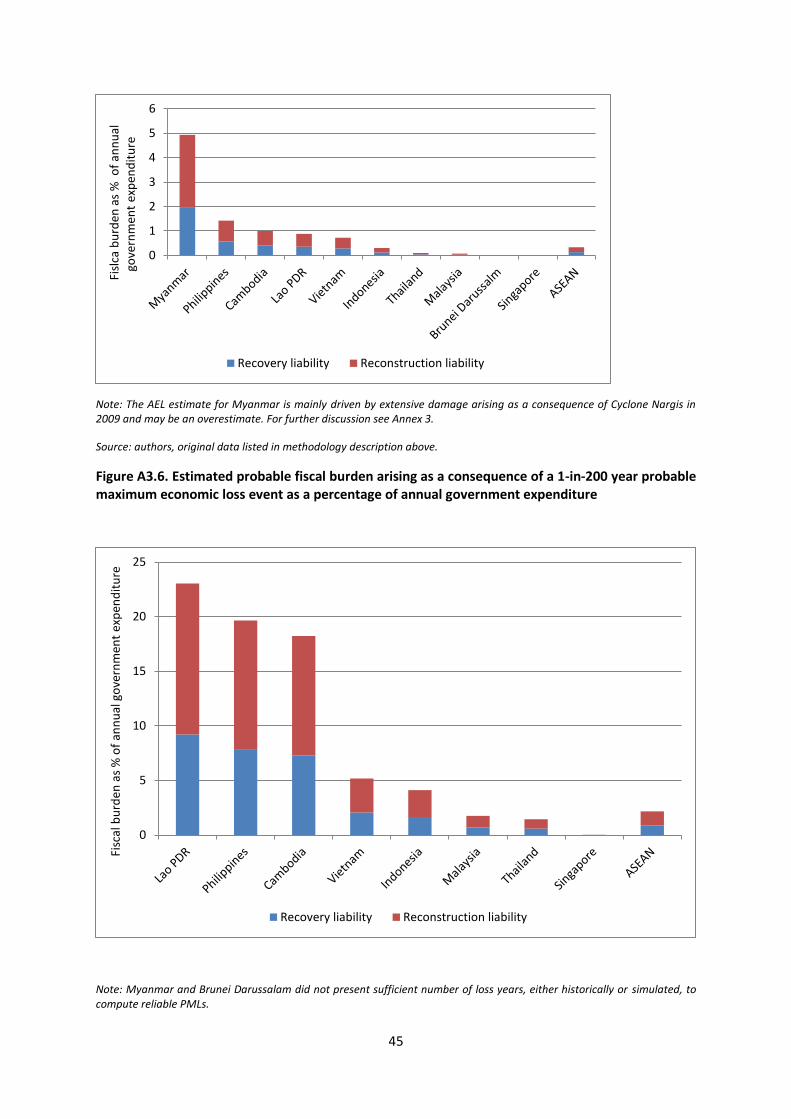
45
Note: The AEL estimate for Myanmar is mainly driven by extensive damage arising as a consequence of Cyclone Nargis in 2009 and may be an overestimate. For further discussion see Annex 3.
Source: authors, original data listed in methodology description above.
Figure A3.6. Estimated probable fiscal burden arising as a consequence of a 1-in-200 year probable maximum economic loss event as a percentage of annual government expenditure
Note: Myanmar and Brunei Darussalam did not present sufficient number of loss years, either historically or simulated, to compute reliable PMLs.
0
1
2
3
4
5
6 F
islc
a b
urd
en a
s %
of
ann
ual
go
vern
men
t ex
pen
dit
ure
Recovery liability Reconstruction liability
0
5
10
15
20
25
Fisc
al b
urd
en a
s %
of
ann
ual
go
vern
men
t ex
pen
dit
ure
Recovery liability Reconstruction liability

46
Source: authors, original data listed in methodology description above
The results indicate that the average annual burden of disasters is equivalent to 0.5% or more of total public expenditure in Myanmar, the Philippines, Cambodia, Lao PDR and Viet Nam. According to the above assumptions, this spending would be split across two years, with early recovery costs relating to a particular disaster event accounting for 0.2% or more of annual expenditure in year one and reconstruction for 0.3% or more of annual expenditure in year two in these five countries. These countries should have comprehensive financing strategies in place to avoid substantial regular diversion of public resources from development to disaster response purposes.
The particularly high levels of contingent public liability relative to annual government expenditure for 1-in-100 and 1-in-200 year events in Cambodia and Lao PDR and 1-in-200 year events in the Philippines are also noteworthy, emphasizing the importance of instruments to manage low-frequency, high cost events in these countries.

47
Table A3.2. Public contingency liability estimations
Brunei Cambodia Indonesia Lao PDR Malaysia Myanmar Philippines Singapore Thailand Vietnam ASEAN
Contingent liability (US$M) 0.1 22.3 391.0 15.7 52.4 110.5 480.9 0.7 76.7 235.9 1386.2
As % of GDP 0.0 0.2 0.1 0.2 0.0 0.2 0.2 0.0 0.0 0.2 0.1
As % of government expenditure
Total contingent liability 0.0 1.0 0.3 0.9 0.1 4.9 1.4 0.0 0.1 0.7 0.3
Recovery liability (up to 12 months) 0.0 0.4 0.1 0.4 0.0 2.0 0.6 0.0 0.0 0.3 0.1
Reconstruction liability (12-24 months) 0.0 0.6 0.2 0.5 0.0 3.0 0.9 0.0 0.1 0.4 0.2
Per capita contingent liability (US$) 0.0 1.6 1.7 2.5 1.9 1.8 5.1 0.1 1.1 2.7 2.3
Contingent liability (US$M) N/A 0.0 0.0 0.0 0.0 N/A 0.0 0.0 0.0 0.0 0.0
As % of GDP N/A 0.0 0.0 0.0 0.0 N/A 0.0 0.0 0.0 0.0 0.0
As % of government expenditure
Total contingent liability N/A 0.0 0.0 0.0 0.0 N/A 0.0 0.0 0.0 0.0 0.0
Recovery liability (up to 12 months) N/A 0.0 0.0 0.0 0.0 N/A 0.0 0.0 0.0 0.0 0.0
Reconstruction liability (12-24 months) N/A 0.0 0.0 0.0 0.0 N/A 0.0 0.0 0.0 0.0 0.0
Per capita contingent liability N/A 0.0 0.0 0.0 0.0 N/A 0.0 0.0 0.0 0.0 0.0
Average expected losses (assuming contingent liability is equivalent to 30% of AEL)
I-in-20 year event (assuming contingency liability is equivalent to 30% of PML)
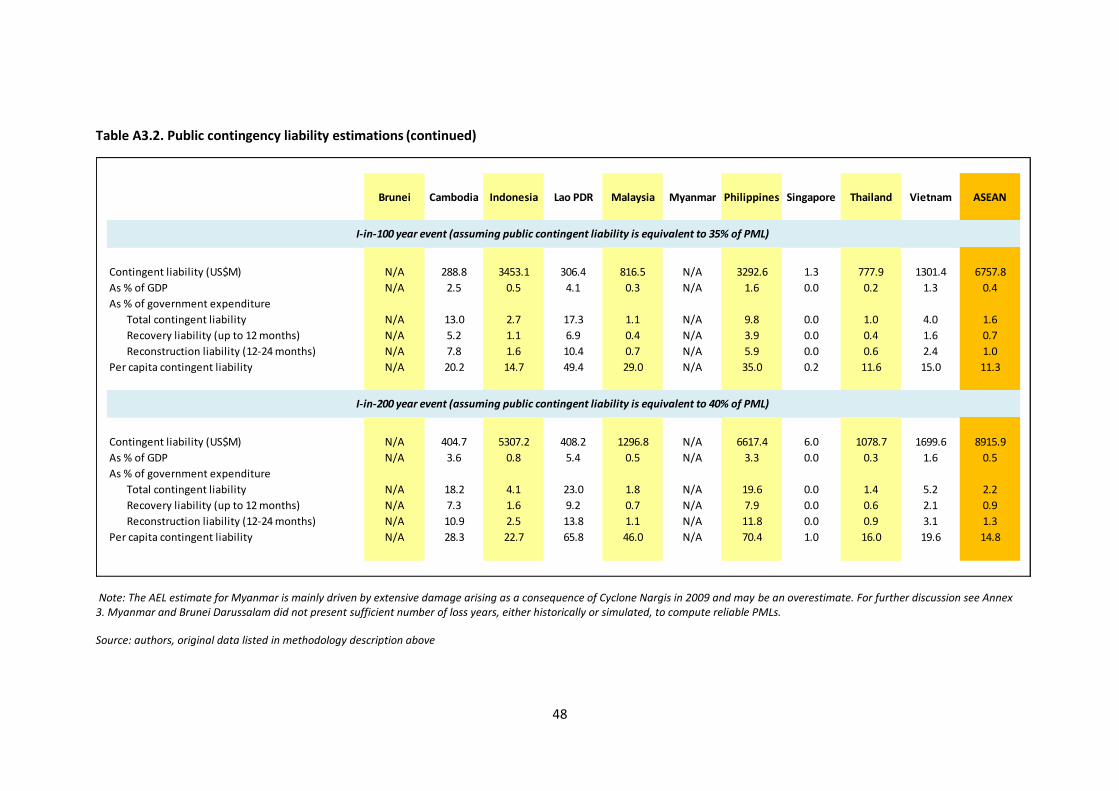
48
Table A3.2. Public contingency liability estimations (continued)
Note: The AEL estimate for Myanmar is mainly driven by extensive damage arising as a consequence of Cyclone Nargis in 2009 and may be an overestimate. For further discussion see Annex 3. Myanmar and Brunei Darussalam did not present sufficient number of loss years, either historically or simulated, to compute reliable PMLs.
Source: authors, original data listed in methodology description above
Brunei Cambodia Indonesia Lao PDR Malaysia Myanmar Philippines Singapore Thailand Vietnam ASEAN
Contingent liability (US$M) N/A 288.8 3453.1 306.4 816.5 N/A 3292.6 1.3 777.9 1301.4 6757.8
As % of GDP N/A 2.5 0.5 4.1 0.3 N/A 1.6 0.0 0.2 1.3 0.4
As % of government expenditure
Total contingent liability N/A 13.0 2.7 17.3 1.1 N/A 9.8 0.0 1.0 4.0 1.6
Recovery liability (up to 12 months) N/A 5.2 1.1 6.9 0.4 N/A 3.9 0.0 0.4 1.6 0.7
Reconstruction liability (12-24 months) N/A 7.8 1.6 10.4 0.7 N/A 5.9 0.0 0.6 2.4 1.0
Per capita contingent liability N/A 20.2 14.7 49.4 29.0 N/A 35.0 0.2 11.6 15.0 11.3
Contingent liability (US$M) N/A 404.7 5307.2 408.2 1296.8 N/A 6617.4 6.0 1078.7 1699.6 8915.9
As % of GDP N/A 3.6 0.8 5.4 0.5 N/A 3.3 0.0 0.3 1.6 0.5
As % of government expenditure
Total contingent liability N/A 18.2 4.1 23.0 1.8 N/A 19.6 0.0 1.4 5.2 2.2
Recovery liability (up to 12 months) N/A 7.3 1.6 9.2 0.7 N/A 7.9 0.0 0.6 2.1 0.9
Reconstruction liability (12-24 months) N/A 10.9 2.5 13.8 1.1 N/A 11.8 0.0 0.9 3.1 1.3
Per capita contingent liability N/A 28.3 22.7 65.8 46.0 N/A 70.4 1.0 16.0 19.6 14.8
I-in-100 year event (assuming public contingent liability is equivalent to 35% of PML)
I-in-200 year event (assuming public contingent liability is equivalent to 40% of PML)

49
Current disaster risk management practice in ASEAN Member States
Annual budgeting for disaster relief and early recovery
Most ASEAN governments make some regular national budgetary provision for potential disaster relief and early recovery purposes (Table A4.3). National disaster management offices (NDMOs) typically have overall responsibility for humanitarian relief and often have a related budget to support them in that role. Local governments can typically request support from this central budget once they have exhausted local resources. In some countries, line agencies can also access this funding. Certain line agencies may hold additional emergency financing of their own. Most countries in the region stockpile some forms of emergency relief as well.
In some ASEAN states, there is a second more general budget line for a wider range of unforeseen circumstances that can be drawn upon once the disaster response budget line is exhausted. In certain others, including Viet Nam, post-disaster relief and early recovery spending requirements are simply covered under this more general budget allocation and there is no disaster-specific line of funding.
Singapore is a notable exception. The Government of Singapore makes no annual budgetary allocations for disaster response because the risk of a disaster is low. In the event that one does occur, the Government of Singapore’s Operations Civil Emergency Plan is activated. This plan gives the Singapore Civil Defence Force the authority to direct all response forces under a unified command structure and for all required resources to be pooled (Singapore MSD, 2009). This practice parallels that in certain other high-income, low-disaster-risk countries which, similarly, do not maintain any disaster contingency reserves. Instead, they have budgetary mechanisms or funding lines that can be activated in the event of a disaster and adequate financial capacity to ensure that these lines are sufficiently resourced (Benson, 2011).
The scale of budgetary provision varies considerably between other ASEAN Member States in absolute terms and relative both to average expected need and total government expenditure. Annual allocations are apparently near sufficient to cover statutory personal compensation and early recovery costs in, for instance, Viet Nam (World Bank, 2010a) and Indonesia. In Indonesia, a recent World Bank study estimated that an annual budget allocation of US$500 million (0.5% of annual government budget expenditure) would be sufficient to cover the recovery costs of recurrent natural disasters for events with a return period up to 3.6 years. As of 2011, the Government of Indonesia had already increased its annual budget allocation for relief and recovery purposes (in the form of the Rehabilitation and Reconstruction Fund) to around US$450 million (IDR 4 trillion) (World Bank, 2011a). Thailand is also considering an increase in its more general emergency budget line under its 2012 budget, in this case in response to a perceived increase in the incidence of climatological hazards.
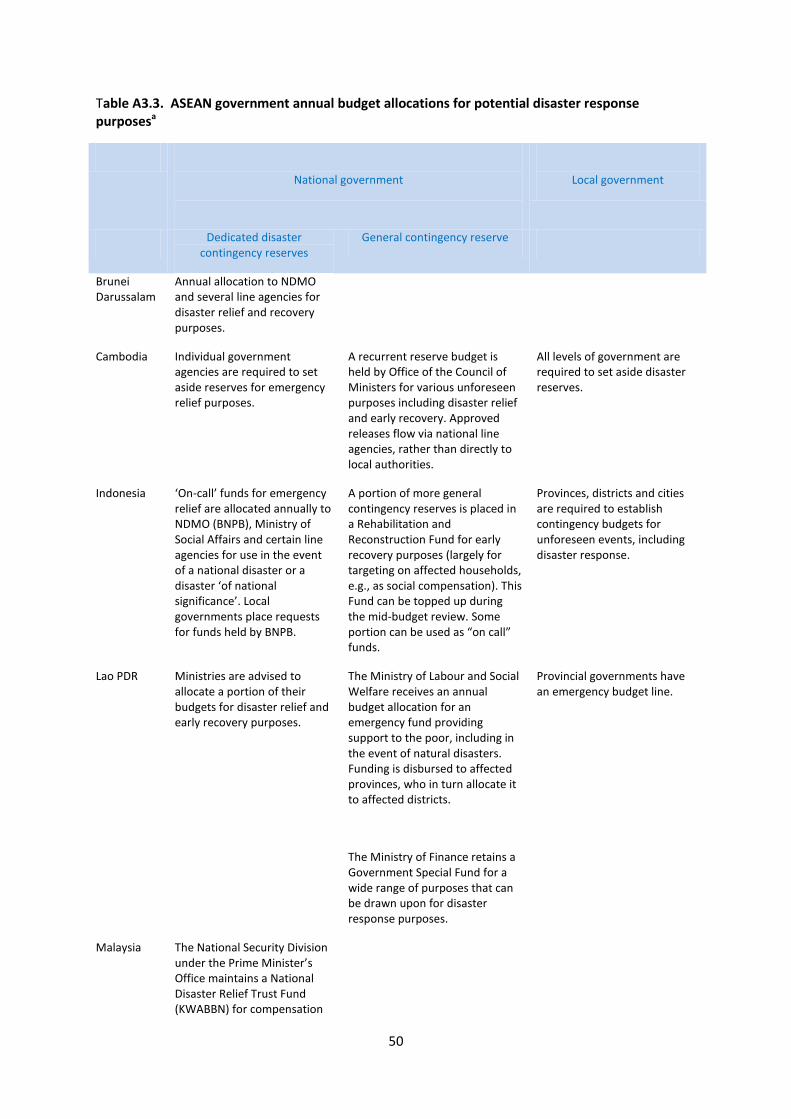
50
Table A3.3. ASEAN government annual budget allocations for potential disaster response purposesa
National government
Local government
Dedicated disaster contingency reserves
General contingency reserve
Brunei Darussalam
Annual allocation to NDMO and several line agencies for disaster relief and recovery purposes.
Cambodia Individual government agencies are required to set aside reserves for emergency relief purposes.
A recurrent reserve budget is held by Office of the Council of Ministers for various unforeseen purposes including disaster relief and early recovery. Approved releases flow via national line agencies, rather than directly to local authorities.
All levels of government are required to set aside disaster reserves.
Indonesia ‘On-call’ funds for emergency relief are allocated annually to NDMO (BNPB), Ministry of Social Affairs and certain line agencies for use in the event of a national disaster or a disaster ‘of national significance’. Local governments place requests for funds held by BNPB.
A portion of more general contingency reserves is placed in a Rehabilitation and Reconstruction Fund for early recovery purposes (largely for targeting on affected households, e.g., as social compensation). This Fund can be topped up during the mid-budget review. Some portion can be used as “on call” funds.
Provinces, districts and cities are required to establish contingency budgets for unforeseen events, including disaster response.
Lao PDR Ministries are advised to allocate a portion of their budgets for disaster relief and early recovery purposes.
The Ministry of Labour and Social Welfare receives an annual budget allocation for an emergency fund providing support to the poor, including in the event of natural disasters. Funding is disbursed to affected provinces, who in turn allocate it to affected districts.
The Ministry of Finance retains a Government Special Fund for a wide range of purposes that can be drawn upon for disaster response purposes.
Provincial governments have an emergency budget line.
Malaysia The National Security Division under the Prime Minister’s Office maintains a National Disaster Relief Trust Fund (KWABBN) for compensation

51
of affected households in the event of a disaster. The corporate sector, NGOs and individuals also make substantial contributions into this fund.
The Ministry of Education maintains a Poor Student’s Funds, providing monetary assistance and school aids to poor students in the event of disasters.
Myanmar The Ministry of Finance maintains a Special Fund that can be drawn upon for disaster rehabilitation purposes.
Philippines Annual allocations to the National Disaster Risk Reduction and Management Fund for risk reduction, preparedness, relief, recovery and reconstruction purposes relating to natural and technological hazards, epidemics, conflict and acts of terrorism occurring during the budget year or in the preceding 24 months. 30% of the Fund is automatically allocated as Quick Response Funds (QRF) or stand-by funds for relief and recovery purposes. The Fund is managed by the NDMO.
Local governments are required to set aside not less than 5% of estimated revenue from regular sources into a Local Disaster Risk Reduction and Management Fund (LMDRRMF) for disaster preparedness and response. 30% should be allocated as QRFs for relief and recovery purposes. Local authorities can transfer their LMDRRMFs to support the work of other local authorities in the event of a disaster. Unexpended funds accrue at the end of the budget year into a special trust fund for disaster risk management purposes within the following 5 years.
Singapore
Thailand The Government maintains a Victim Compensation Budget, which is disbursed via provincial government authorities.
The Government Central Fund (a discretionary fund for specific purposes) under the control of the Ministry of Funding includes an emergency reserve fund for a range of purposes, including disaster relief and early recovery.
Individual provinces maintain reserve funds that can be used for disaster relief and early recovery purposes.
Viet Nam 2-5% of the annual national budget is set aside as contingency funds for various purposes including disaster relief and early recovery. The Financial Reserves Fund can also be drawn on if
2-5% of annual provincial, district and commune budgets should be set aside as contingency funds for various purposes including disaster relief and early recovery.
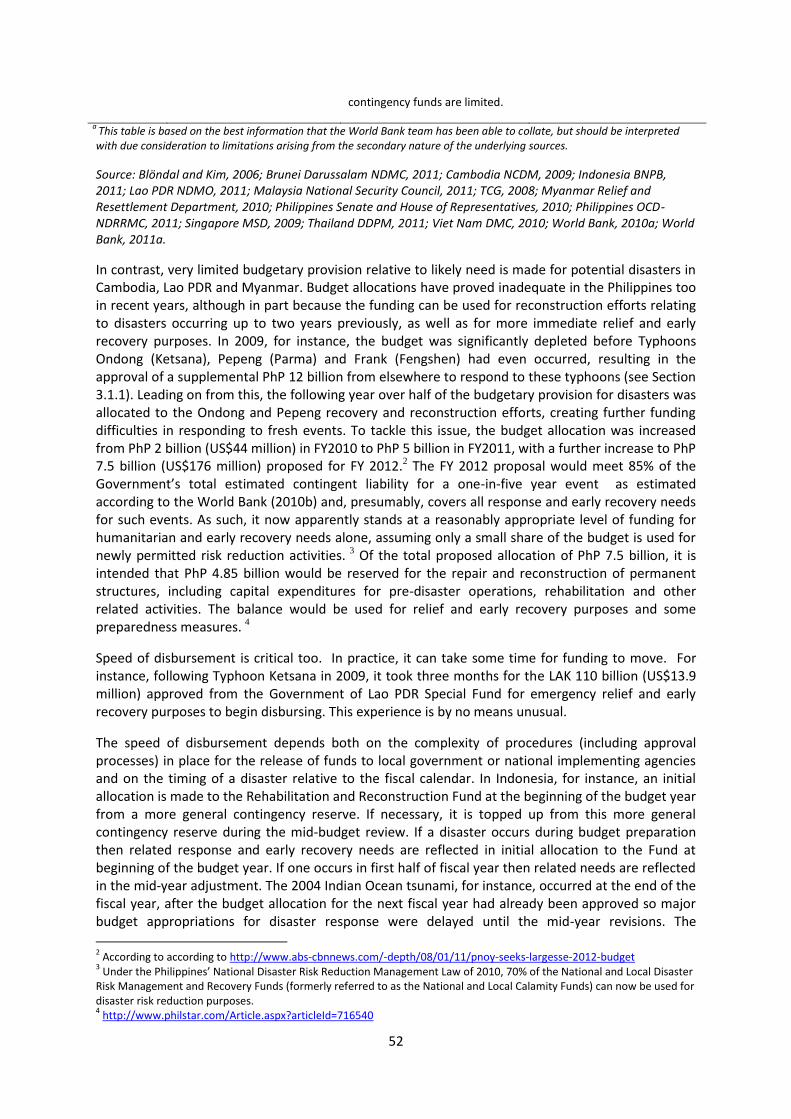
52
contingency funds are limited.
a
This table is based on the best information that the World Bank team has been able to collate, but should be interpreted with due consideration to limitations arising from the secondary nature of the underlying sources.
Source: Blöndal and Kim, 2006; Brunei Darussalam NDMC, 2011; Cambodia NCDM, 2009; Indonesia BNPB, 2011; Lao PDR NDMO, 2011; Malaysia National Security Council, 2011; TCG, 2008; Myanmar Relief and Resettlement Department, 2010; Philippines Senate and House of Representatives, 2010; Philippines OCD- NDRRMC, 2011; Singapore MSD, 2009; Thailand DDPM, 2011; Viet Nam DMC, 2010; World Bank, 2010a; World Bank, 2011a.
In contrast, very limited budgetary provision relative to likely need is made for potential disasters in Cambodia, Lao PDR and Myanmar. Budget allocations have proved inadequate in the Philippines too in recent years, although in part because the funding can be used for reconstruction efforts relating to disasters occurring up to two years previously, as well as for more immediate relief and early recovery purposes. In 2009, for instance, the budget was significantly depleted before Typhoons Ondong (Ketsana), Pepeng (Parma) and Frank (Fengshen) had even occurred, resulting in the approval of a supplemental PhP 12 billion from elsewhere to respond to these typhoons (see Section 3.1.1). Leading on from this, the following year over half of the budgetary provision for disasters was allocated to the Ondong and Pepeng recovery and reconstruction efforts, creating further funding difficulties in responding to fresh events. To tackle this issue, the budget allocation was increased from PhP 2 billion (US$44 million) in FY2010 to PhP 5 billion in FY2011, with a further increase to PhP 7.5 billion (US$176 million) proposed for FY 2012.2 The FY 2012 proposal would meet 85% of the Government’s total estimated contingent liability for a one-in-five year event as estimated according to the World Bank (2010b) and, presumably, covers all response and early recovery needs for such events. As such, it now apparently stands at a reasonably appropriate level of funding for humanitarian and early recovery needs alone, assuming only a small share of the budget is used for newly permitted risk reduction activities. 3 Of the total proposed allocation of PhP 7.5 billion, it is intended that PhP 4.85 billion would be reserved for the repair and reconstruction of permanent structures, including capital expenditures for pre-disaster operations, rehabilitation and other related activities. The balance would be used for relief and early recovery purposes and some preparedness measures. 4
Speed of disbursement is critical too. In practice, it can take some time for funding to move. For instance, following Typhoon Ketsana in 2009, it took three months for the LAK 110 billion (US$13.9 million) approved from the Government of Lao PDR Special Fund for emergency relief and early recovery purposes to begin disbursing. This experience is by no means unusual.
The speed of disbursement depends both on the complexity of procedures (including approval processes) in place for the release of funds to local government or national implementing agencies and on the timing of a disaster relative to the fiscal calendar. In Indonesia, for instance, an initial allocation is made to the Rehabilitation and Reconstruction Fund at the beginning of the budget year from a more general contingency reserve. If necessary, it is topped up from this more general contingency reserve during the mid-budget review. If a disaster occurs during budget preparation then related response and early recovery needs are reflected in initial allocation to the Fund at beginning of the budget year. If one occurs in first half of fiscal year then related needs are reflected in the mid-year adjustment. The 2004 Indian Ocean tsunami, for instance, occurred at the end of the fiscal year, after the budget allocation for the next fiscal year had already been approved so major budget appropriations for disaster response were delayed until the mid-year revisions. The
2 According to according to http://www.abs-cbnnews.com/-depth/08/01/11/pnoy-seeks-largesse-2012-budget
3 Under the Philippines’ National Disaster Risk Reduction Management Law of 2010, 70% of the National and Local Disaster
Risk Management and Recovery Funds (formerly referred to as the National and Local Calamity Funds) can now be used for disaster risk reduction purposes. 4 http://www.philstar.com/Article.aspx?articleId=716540

53
Indonesian Ministry of Social Affairs, which disburses livelihood grants and housing compensation to the households affected by a disaster out of its on-call resources, can also request an additional allocation in the mid-year budget revision if its funds are insufficient (World Bank, 2011a).
Disaster response budgets elsewhere may be topped up from a range of sources. In Viet Nam, surplus revenue (defined as the difference between planned and actual revenue) can be used to supplement the budget and provide additional relief and early recovery funding, although in practice central surplus reserves have been very limited in recent years, in large part because crude oil prices have been much lower than forecast (World Bank, 2010a). Meanwhile, the Government of the Philippines authorized the use of PhP 12 billion (US$266 million) from the PhP 76 billion Unprogrammed Fund for relief operations, rehabilitation and reconstruction works and the provision of support to affected households following Ondoy (Ketsana) and Pepeng (Parma) in 2009. The Unprogrammed Fund can only be released when total revenue collections for the entire year exceed the original revenue targets.
Local governments across the ASEAN region are also commonly required by law to make an annual budgetary provision for disaster response purposes and to fulfill certain related responsibilities. They are expected to utilize these resources and any other available funds before requesting post-disaster support from national government.5 Data on the extent of these resources are extremely difficult to obtain without embarking on a detailed, sub-national data collection exercise. However, it is widely observed that only richer local authorities are often able to fulfill these requirements. Moreover, the funding available at a local level is often only sufficient to deal with relatively localized events as, for instance, is the case in Lao PDR. On the flip side, if a disaster does not occur over the course of the fiscal year then local governments are left with unspent resources, potentially at some considerable opportunity cost. In the Philippines, for instance, it was estimated some years back that, nationally, perhaps as much as 50% of local government budgetary provision for potential disasters went unutilized each year (World Bank and NDCC, 2005).
The collective pooling of local government contingency funding would allow local governments in a particular country to have immediate access to much larger funding reserves, thereby improving their response capacity without having to build up resources over time. Moreover, they would provide a very low cost source of funding by avoiding ‘the financial (and political) cost of holding these resources’ individually and by allowing local governments, via the pool, to access the international reinsurance and capital markets (World Bank, 2011a:38). By pooling reserves in a more diversified, common pool, the size of the reserves required to sustain a potential catastrophic event would be lower than the sum of reserves required if they were held separately by individual local governments because disaster risk is not perfectly correlated across local governments. Meanwhile, access to international reinsurance and capital markets would significantly reduce the cost of securing additional capacity to manage the potential variability in financial outflows In the case of Indonesia, for instance, the World Bank has estimated that pooling disaster risks would reduce the cost of reserves by 50% or more (ibid).
The establishment of such arrangements have been proposed by the World Bank in both Indonesia (World Bank, 2011a) and the Philippines (World Bank and NDCC, 2005) and is being actively explored in the latter both by the Department of the Interior and Local Government (DILG) and League of Cities. DILG is exploring the pooling of reserves at the provincial level (Philippines OCD- NDRRMC, 2011). According to a recent World Bank report, local disaster contingency reserves in the
5 In Indonesia, for instance, the district government is required to establish a recovery plan in the aftermath of a disaster.
This plan is expected to be financed out of its own budget (contingency resources and budget reallocations). If the recovery budget exceeds 20% of the total district budget, the district government can ask the Provincial Government for budget support or request support directly from the Central Government. If additional financing is still needed, the Provincial Government requests Central Government support from the Rehabilitation and Reconstruction Fund which is approved during the semiannual budget revision deliberations (see above) (World Bank, 2011a).

54
Philippines total PhP 14.3 billion (US$317 million) per annum, far outstripping the national disaster contingency reserve (World Bank-GFDRR, 2010).
Finally, any remaining resources under both disaster-specific and more general national and local government budget lines for unforeseen circumstances typically revert to the budget surplus at the end of the fiscal year in most ASEAN states. This practice in part reflects concerns in some countries that disaster contingency reserves may have been used for non-disaster related purposes on occasion, a risk associated with any line of unallocated funding. Strict accountability mechanisms are necessary to reduce such risks. Contingency reserves can also encourage lax fiscal discipline. In Cambodia, for instance, the allocation for precautionary expenses (including possible disaster response) has been used in the past to finance additional needs from ministries that could have been foreseen as well as for their intended purposes.
The Philippines provides a notable exception. Following a recent change in legislation, unutilized local government disaster response budget allocations now accrue into a special trust fund at the end of the budget year. This fund is solely for use in supporting disaster risk reduction and management activities within the next five years. Thereafter, any remaining funding reverts back to the general fund for expenditure on other social services (Philippines Senate and House of Representatives, 2010).
In-year budget reallocations
Some element of short-term funding for emergency relief and early recovery is often secured via post-disaster budgetary reallocations or, in some cases, via more general mid-year adjustments in the annual budget. Reallocations typically occur within the investment or recurrent budgets, rather than between them, and often within the same line agency. Similarly, local governments are often authorized to reallocate local discretionary resources, although the level of funding involved varies between countries. More occasionally, funds are reallocated between major budget headings. In response to the 2010 floods in Thailand, for instance, the Government of Thailand approved the diversion of 4 billion baht (US$126 million) from its Strong Thailand budget for response purposes, in addition to the 20 billion baht central budget already approved for the same purpose.6 7
Many governments draw on regular line agency recurrent funding, particularly maintenance budgets, on a routine basis to finance relatively small-scale disaster-related repairs and minor damage from more severe events. For instance, a number of Cambodian line agencies use part of their maintenance budgets in this way on a near-annual basis. This practice conforms to Government of Cambodia policy, which states that agencies should use available resources through budget realignment before requesting funding from the Emergency Relief Fund.
Line ministries may also reallocate capital expenditure within the fiscal year in which a disaster occurs, as, for instance, has been observed in Indonesia (World Bank, 2011a) and the Philippines. The Philippine Department of Agriculture (DA) has regularly transferred funding from initiatives such as its rice, corn and high-value crops programs to support post-disaster recovery of the agricultural sector (Benson, 2008). Based on an analysis of these transfers over the previous five years, in 2008 the DA requested – but did not secure – the creation of a disaster standby fund to the tune of PhP 500 million (US$11.3 million) to reduce further reallocations from its development activities (ibid). The realignment of existing investment plans may have particularly significant adverse repercussions in countries with rapidly expanding populations.
6 http://reliefweb.int/node/373541
7 The Strong Thailand program is off-budget and focuses on infrastructure projects and investment in agriculture,
education and health.

55
There may be substantial reallocations in kind as well, relating to the redeployment of government staff, vehicles, equipment and supplies in support of the humanitarian relief and early recovery efforts. For instance, in Myanmar, the Ministry of Education delivered textbooks and educational materials to schools in areas of the country affected by Cyclone Nargis (TCG, 2008). Recurrent spending appropriations for salaries and wages are rarely, if ever, explicitly drawn upon but government employee earnings are sometimes docked to make compulsory donations to disaster funds.
However, although reallocations are very common, very little is known about their scale and there has been no systematic effort to record all reallocations in the aftermath of a disaster in any ASEAN state or in most other countries in the world. Admittedly, this is not a simple task as related approval procedures often rest internally, within a particular agency, and transfers may not be reported to higher authorities. Data on local government reallocations are particularly difficult to obtain. Nevertheless, it is important to have a sense of the scale of funding involved. Some real-time studies on the scale and nature of reallocations could be extremely helpful in shedding better light on this source of funding and related opportunity costs.
Associated opportunity costs depend on the scale of reallocations, the original intended purpose of the funding and the extent to which the original allocation was sufficient to satisfy its purpose. Governments sometimes have funding available at relatively low opportunity cost due to delays in the implementation of new projects and programs envisaged in the annual budget. In certain other circumstances, opportunity costs may be extremely high. For instance, maintenance budgets are already considerably underfunded in many countries. In consequence, planned maintenance may be delayed, causing some economic cost to society (e.g., via prolonged travel times along poor roads), resulting in much higher subsequent repair costs and rendering the unrepaired infrastructure more vulnerable to future hazard events.
Meanwhile the net benefit of reallocated funds may be undermined in situations where their release is delayed. In the aftermath of the September 2009 Western Sumatra flood in Indonesia, for instance, it was reported that procedures for budget reallocations may have prevented local governments from restructuring their programs in a timely manner (Indonesia BNPB et al, 2009). Reallocation approval procedures should be designed to avoid such delays to the extent possible, whilst still maintaining high fiduciary standards.
Longer-term realignment of investment budgets
Reconstruction efforts typically fall under the responsibility of planning and investment ministries, relevant line agencies and their local government counterparts. They are built into longer-term capital investment plans and budgets over several years succeeding a disaster. These budgets provide the main source of post-disaster reconstruction in most ASEAN states, except in the case of catastrophic events when substantial international assistance may be received (see below).
Reconstruction initiatives are often included under relevant sector and local government plans and budgets but not necessarily labeled as such. Thus, again, it is extremely difficult to ascertain total related spending without intimate knowledge of these budgets. For instance, reconstruction of damaged roads may simply fall within the budget allocation for new roads. There are a few notable exceptions. In the Philippines, for example, special rehabilitation funds were created in the aftermath of the 1990 Baguio earthquake and the 1991 eruption of Mount Pinatubo (Benson, 1997), but such examples are less common.
Nevertheless, available evidence suggests that, as the principal source of financing for reconstruction in most countries, such funding is insufficient. This may have implications for the pace of reconstruction efforts. A marginal delay may be beneficial, allowing time for the re-design

56
and upgrading of infrastructure, including strengthening of resilience against future hazard events. In practice, however, lags may sometimes be far longer than optimal, exacerbating the adverse socio-economic consequences of a disaster. The Government of Viet Nam, for instance, faced an estimated contingent liability bill totaling US$791 million for the period 2006 to 2008 (World Bank, 2010a) (see below). Most of this was expected to be met from the capital budget in future years yet was equivalent to between 3.5 and 6.8% of total planned central and local government capital expenditure in each of the years in which the contingent liability was incurred, placing a huge additional burden on these budgets. In consequence, some destroyed infrastructure is not replaced for two or three years after a disaster in Viet Nam. Further lags in reconstruction may occur when a disaster occurs towards the beginning of a fiscal year, perhaps resulting in a lapse of a year or more before significant funding can be reallocated for reconstruction.
Limited reconstruction funding can undermine efforts to build back better as well as delaying recovery. Again in Viet Nam, for instance, it is reported that reconstruction funding is typically spread widely to reconstruct more buildings and infrastructure, rather than concentrated on fewer, more expensive but also more resilient structures (Viet Nam DMC, 2010).
Associated opportunity costs may also be high, particularly where large volumes of reconstruction resources are required, overall public resources are limited and the government is faced with a rapidly expanding population. There is often no significant adjustment in either the overall funding envelope or allocations for more severely-affected sectors and local governments in the aftermath of a disaster (see below). Instead, reconstruction needs have to compete head on with prior national and local development goals. In consequence, there may be a substantial realignment in investment plans post disaster if the reconstruction efforts are well funded.
Taxation
Fiscal instruments can be used to generate extra government revenue in the aftermath of a disaster and, conversely, via tax breaks and holidays, to ease pressure on affected communities and businesses and stimulate economic recovery. Tax breaks imply some dip in revenue in the short term but, by encouraging recovery, may imply a net increase in government revenue over the longer term. Meanwhile, post-disaster tax increases can take a number of months to approve and even longer for the resulting revenue to be collected, particularly where tax administration capabilities have been disrupted by a disaster. Thus, they are best suited to financing the tail end of early recovery efforts and reconstruction. In some situations, the optimal strategy may be to apply a combination of both tax cuts and increases, using fiscal instruments to redistribute some of the economic burden of a disaster to non-affected areas. Fiscal instruments can also be used to encourage ex ante risk reduction efforts, for instance by offering tax incentives for retrofitting. However, there has been little formal analysis of the appropriate fiscal response to particular disaster situations.
In practice, post-disaster tax increases are politically unpopular. As such, there have been relatively few such increases anywhere in the world and possibly none at all in the ASEAN region. However, where they have been applied, they have sometimes raised substantial resources (Box A3.2).

57
Box A3.2. International experience - financing disaster response through taxation
In the aftermath of severe floods and heavy rainfall in 2010, causing total damage of up to $5.2 billion, the Colombian Government issued a Presidential Decree reducing the threshold of the wealth tax from 3 billion to 1 billion peso. This measure was expected to generate an additional 3.3 trillion peso (US$1.6 billion) in tax receipts for recovery purposes.8 Earlier temporary disaster-related tax increases were imposed by the Colombian Government in the wake of the 1985 Armero volcanic eruption and the 1999 Eje Catetero earthquake.
Following the January 2011 Queensland floods, the Australian Government introduced a flood levy for 2011-2012 on middle and higher income taxpayers to help finance the reconstruction efforts. The levy was set at 0.5% on that part of an individual’s income between $50,001 and $100,000 and at 1% on the portion over $100,000. The ensuing revenue was expected to meet just under a third of the total Aus$5.6 billion (US$5.1 billion) public reconstruction bill.9
Reconstruction costs incurred as a consequence of the 2010 earthquake in Chile are being met in part through temporary tax increases, including on taxes on corporations, tobacco and real estate.10 The largest mining companies (together accounting for 94% of annual national production) also agreed to a voluntary 4 to 9% increase in royalties paid on mineral extraction through 2014. This should generate over US$1 billion in government revenue according to projections. The payments are voluntary because a 2005 royalty law bars changes before 2017.11
The post-disaster application of tax cuts to stimulate economic recovery has been somewhat more common, including in the ASEAN region. In Thailand, for instance, the government offered tax relief to businesses, together with soft loans, to support the recovery process in the aftermath of the 2004 tsunami. Following the 2010 floods, affected firms were permitted to delay VAT, stamp duty and tax payments for several months and were granted an import duty exemption on machinery until December 2011 (World Bank, 2011b). In Lao PDR, agricultural land affected by disasters is exempt from annual land tax (IMF, 2007). In the aftermath of the 2006 Yogyakarta earthquake in Indonesia, sub-national governments reduced property taxes by 50% for lightly damaged properties and by 75% for moderately damaged properties. The Yogyakarta municipal government reduced taxes for tourism-related businesses by 25% (Indonesia BNPB et al, 2009).
The fiscal response to a disaster needs to reflect the existing consequences of the event on government revenue as well. A disaster can cause an automatic drop in earnings from the affected area by disrupting normal economic activity and triggering considerable private sector writing off of losses against profits (Hofman and Brukoff, 2006). Inflows of government revenue can also be delayed by practical difficulties in the administration and collection of taxes. The consequences – and appropriateness of, say, reducing tax revenue further by introducing tax breaks to aid recovery – depend on the affected area’s contribution to national and local revenues. For instance, in the Philippines public revenues were expected to decline as a consequence of the 2009 typhoons Ondoy (Ketsana) and Pepeng (Parma), both in the short and medium term. The short-term fall was expected to reflect a sharp surge in tax credit refund on inventory losses, in turn reflecting the fact that many traders had stocked up on goods in anticipation of end-of-year sales and had thus lost
8 http://colombiareports.com/colombia-news/news/13537-colombia-to-hike-taxes-16-bln-to-finance-flood-recovery.html
9 http://www.pm.gov.au/blog/questions-about-flood-levy-answered
10 http://www.taxand.com/news/newsletters/Devastating_Earthquake_Leads_to_Changes_in_Tax_Measures
11 http://finance.yahoo.com/news/Mining-giants-agree-to-pay-apf-2365065413.html?x=0
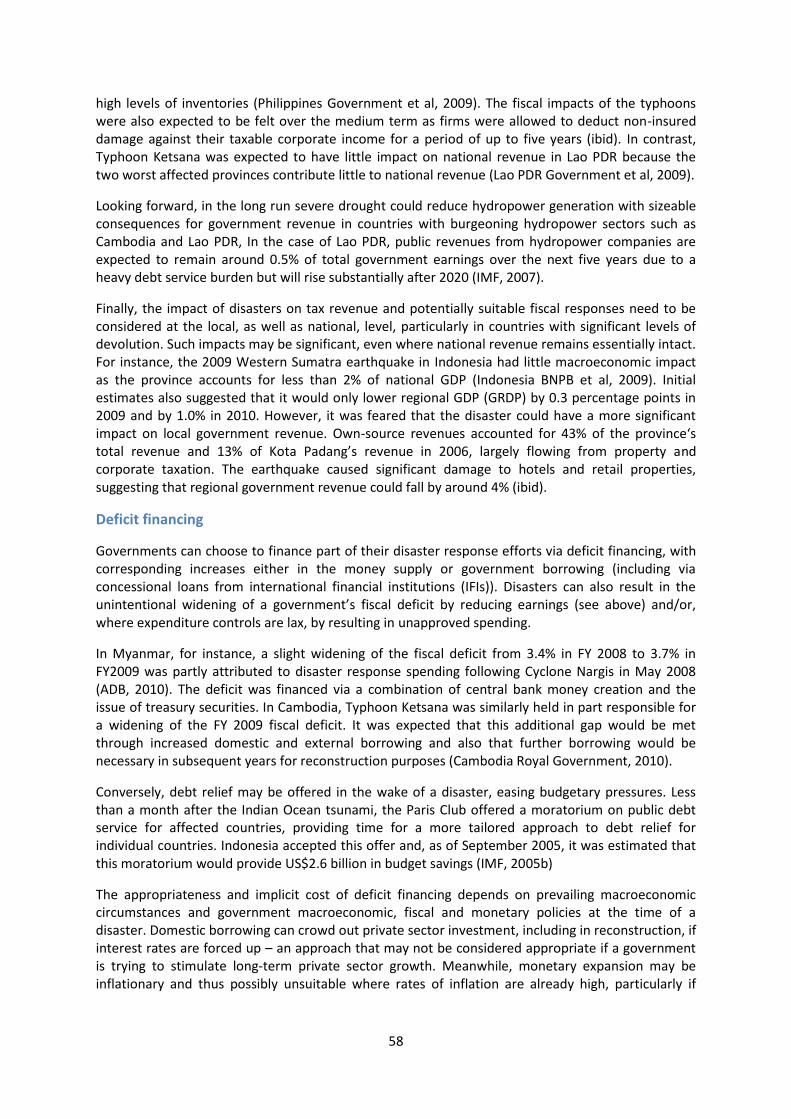
58
high levels of inventories (Philippines Government et al, 2009). The fiscal impacts of the typhoons were also expected to be felt over the medium term as firms were allowed to deduct non-insured damage against their taxable corporate income for a period of up to five years (ibid). In contrast, Typhoon Ketsana was expected to have little impact on national revenue in Lao PDR because the two worst affected provinces contribute little to national revenue (Lao PDR Government et al, 2009).
Looking forward, in the long run severe drought could reduce hydropower generation with sizeable consequences for government revenue in countries with burgeoning hydropower sectors such as Cambodia and Lao PDR, In the case of Lao PDR, public revenues from hydropower companies are expected to remain around 0.5% of total government earnings over the next five years due to a heavy debt service burden but will rise substantially after 2020 (IMF, 2007).
Finally, the impact of disasters on tax revenue and potentially suitable fiscal responses need to be considered at the local, as well as national, level, particularly in countries with significant levels of devolution. Such impacts may be significant, even where national revenue remains essentially intact. For instance, the 2009 Western Sumatra earthquake in Indonesia had little macroeconomic impact as the province accounts for less than 2% of national GDP (Indonesia BNPB et al, 2009). Initial estimates also suggested that it would only lower regional GDP (GRDP) by 0.3 percentage points in 2009 and by 1.0% in 2010. However, it was feared that the disaster could have a more significant impact on local government revenue. Own-source revenues accounted for 43% of the province‘s total revenue and 13% of Kota Padang’s revenue in 2006, largely flowing from property and corporate taxation. The earthquake caused significant damage to hotels and retail properties, suggesting that regional government revenue could fall by around 4% (ibid).
Deficit financing
Governments can choose to finance part of their disaster response efforts via deficit financing, with corresponding increases either in the money supply or government borrowing (including via concessional loans from international financial institutions (IFIs)). Disasters can also result in the unintentional widening of a government’s fiscal deficit by reducing earnings (see above) and/or, where expenditure controls are lax, by resulting in unapproved spending.
In Myanmar, for instance, a slight widening of the fiscal deficit from 3.4% in FY 2008 to 3.7% in FY2009 was partly attributed to disaster response spending following Cyclone Nargis in May 2008 (ADB, 2010). The deficit was financed via a combination of central bank money creation and the issue of treasury securities. In Cambodia, Typhoon Ketsana was similarly held in part responsible for a widening of the FY 2009 fiscal deficit. It was expected that this additional gap would be met through increased domestic and external borrowing and also that further borrowing would be necessary in subsequent years for reconstruction purposes (Cambodia Royal Government, 2010).
Conversely, debt relief may be offered in the wake of a disaster, easing budgetary pressures. Less than a month after the Indian Ocean tsunami, the Paris Club offered a moratorium on public debt service for affected countries, providing time for a more tailored approach to debt relief for individual countries. Indonesia accepted this offer and, as of September 2005, it was estimated that this moratorium would provide US$2.6 billion in budget savings (IMF, 2005b)
The appropriateness and implicit cost of deficit financing depends on prevailing macroeconomic circumstances and government macroeconomic, fiscal and monetary policies at the time of a disaster. Domestic borrowing can crowd out private sector investment, including in reconstruction, if interest rates are forced up – an approach that may not be considered appropriate if a government is trying to stimulate long-term private sector growth. Meanwhile, monetary expansion may be inflationary and thus possibly unsuitable where rates of inflation are already high, particularly if
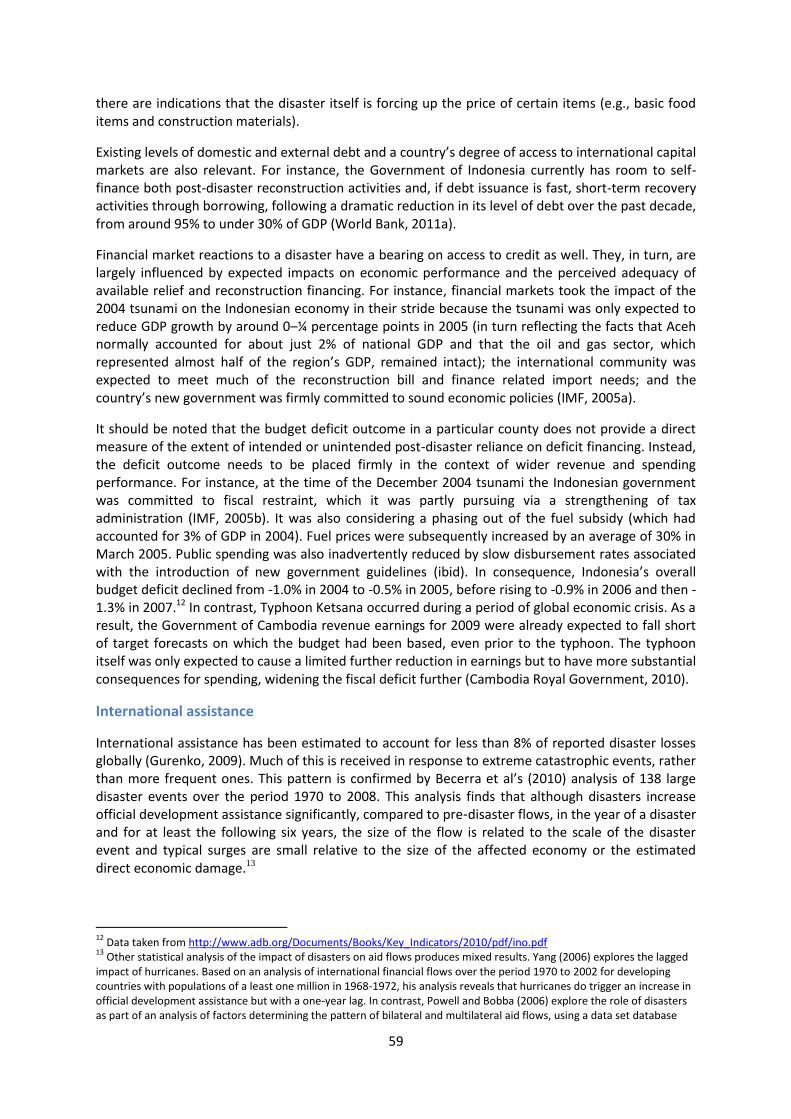
59
there are indications that the disaster itself is forcing up the price of certain items (e.g., basic food items and construction materials).
Existing levels of domestic and external debt and a country’s degree of access to international capital markets are also relevant. For instance, the Government of Indonesia currently has room to self-finance both post-disaster reconstruction activities and, if debt issuance is fast, short-term recovery activities through borrowing, following a dramatic reduction in its level of debt over the past decade, from around 95% to under 30% of GDP (World Bank, 2011a).
Financial market reactions to a disaster have a bearing on access to credit as well. They, in turn, are largely influenced by expected impacts on economic performance and the perceived adequacy of available relief and reconstruction financing. For instance, financial markets took the impact of the 2004 tsunami on the Indonesian economy in their stride because the tsunami was only expected to reduce GDP growth by around 0–¼ percentage points in 2005 (in turn reflecting the facts that Aceh normally accounted for about just 2% of national GDP and that the oil and gas sector, which represented almost half of the region’s GDP, remained intact); the international community was expected to meet much of the reconstruction bill and finance related import needs; and the country’s new government was firmly committed to sound economic policies (IMF, 2005a).
It should be noted that the budget deficit outcome in a particular county does not provide a direct measure of the extent of intended or unintended post-disaster reliance on deficit financing. Instead, the deficit outcome needs to be placed firmly in the context of wider revenue and spending performance. For instance, at the time of the December 2004 tsunami the Indonesian government was committed to fiscal restraint, which it was partly pursuing via a strengthening of tax administration (IMF, 2005b). It was also considering a phasing out of the fuel subsidy (which had accounted for 3% of GDP in 2004). Fuel prices were subsequently increased by an average of 30% in March 2005. Public spending was also inadvertently reduced by slow disbursement rates associated with the introduction of new government guidelines (ibid). In consequence, Indonesia’s overall budget deficit declined from -1.0% in 2004 to -0.5% in 2005, before rising to -0.9% in 2006 and then -1.3% in 2007.12 In contrast, Typhoon Ketsana occurred during a period of global economic crisis. As a result, the Government of Cambodia revenue earnings for 2009 were already expected to fall short of target forecasts on which the budget had been based, even prior to the typhoon. The typhoon itself was only expected to cause a limited further reduction in earnings but to have more substantial consequences for spending, widening the fiscal deficit further (Cambodia Royal Government, 2010).
International assistance
International assistance has been estimated to account for less than 8% of reported disaster losses globally (Gurenko, 2009). Much of this is received in response to extreme catastrophic events, rather than more frequent ones. This pattern is confirmed by Becerra et al’s (2010) analysis of 138 large disaster events over the period 1970 to 2008. This analysis finds that although disasters increase official development assistance significantly, compared to pre‐disaster flows, in the year of a disaster and for at least the following six years, the size of the flow is related to the scale of the disaster event and typical surges are small relative to the size of the affected economy or the estimated direct economic damage.13
12
Data taken from http://www.adb.org/Documents/Books/Key_Indicators/2010/pdf/ino.pdf 13
Other statistical analysis of the impact of disasters on aid flows produces mixed results. Yang (2006) explores the lagged impact of hurricanes. Based on an analysis of international financial flows over the period 1970 to 2002 for developing countries with populations of a least one million in 1968-1972, his analysis reveals that hurricanes do trigger an increase in official development assistance but with a one-year lag. In contrast, Powell and Bobba (2006) explore the role of disasters as part of an analysis of factors determining the pattern of bilateral and multilateral aid flows, using a data set database

60
Reflecting this general pattern, ASEAN states typically only formally request international assistance for major disasters (although existing NGOs and UN, bilateral and multilateral agencies already on the ground may get involved in less severe events, at least via adjustments to existing development programs).
Even then, efforts to raise international support for ASEAN Member States through UN appeals from bilateral, multilateral and UN agencies and private donors have proved relatively disappointing over the past decade, with the notable exception of the 2004 Indian Ocean tsunami and 2009 Lao Typhoon Ketsana appeals (Table A4.4). Appeals have raised as little as 15% of the requested funding.
Table A3.4. UN disaster appeals for ASEAN Member States: Funding requests and receipts, 2000 - 2010a
Country
Disaster
Year appeal
launched
Type of appealb
Funding requested
US$m
Funding received
US$m
Cover-age
%
Pledges
Philippines Floods 2004 Flash 6.3 1.4 23.4 -
Regional appealc
Indian Ocean Earthquake-
Tsunami 2005 Flash 1,400 1,200 88.3 54
Indonesia Java earthquake 2006 Flash 80 42 53.4 3.7
Philippines Typhoon Durian 2006 'Other' 48 7 14.8 -
Lao PDR Flood Recovery and Rehabilitation
2008 'Other' 9.9 4.5 45.5 -
Lao PDR Typhoon Ketsana 2009 Flash 12.0 9.5 74.7 -
Indonesia West Sumatra earthquake
2009 Flash 38 15 41.8 0.4
Philippines Typhoon Ketsana 2009 Flash 143 62 43.7 -
a Status as of 26 August 2011. No appeals were launched in 2000, 2001, 2002, 2003, 2007 or 2010. Appeals launched in
response to situations of conflict are not shown.
b Appeals are classified as consolidated appeals, flash appeals or other appeals.
c The appeal included specific requests for Indonesia and Thailand and various non-ASEAN states as well as some requests
for regional funding. No specific funding was requested for Malaysia or Myanmar.
Source: UN OCHA Financial Tracking Services (http://fts.unocha.org)
As such, international assistance cannot be counted on as a reliable source of post-disaster financing, even for more extreme events. Variations in the success of individual appeals reflect a wide range of determining variables, stretching beyond the scale of loss alone. These factors include the nature of the hazard experienced (with appeals in response to sudden-onset events often achieving greater success than those for slow-onset events); the political standing of the affected country; the relative strength of the global economy; and other concurrent demands on
organized both by recipient and donor for the period 1970-2003. Controlling for other determinants of flows, they find no evidence that natural disasters increase flows of international aid.

61
international humanitarian resources. For instance, the relatively weak responses to the Philippine Typhoon Ketsana and Indonesian West Java earthquake appeals may partly reflect the fact that donor attention was shortly thereafter diverted to the devastating January 2010 Haiti earthquake. The appeal launched in response to the latter sought a massive US$1.7 billion, of which 75% was raised. The Lao Typhoon Ketsana appeal probably fared better because of the country’s low income status.
Post-disaster external assistance is not necessarily additional either. Instead, it may partly displace short- to medium-term flows of development support. For instance, a large portion of the IFIs’ response to disasters has been provided via the reprograming of planned projects and, also, via the reallocation of undisbursed funds from ongoing projects (Cummins and Mahul, 2008). Arguably reflecting extensive reallocations, one of Becerra et al’s (2010) most robust results is that a higher initial (pre‐disaster) aid level will lead to a lower aid surge. 14
Furthermore, there can be delays in disbursement of international assistance; absorption difficulties, limiting the volume of aid that governments are able to receive; and issues around coordination with the government’s own response efforts and those of other donors and civil society, thereby undermining the effectiveness of available resources.
More positively, there have been some deliberate efforts to address some of these issues. Initiatives have been undertaken to improve coordination, including in the context of the 2004 Indian Ocean tsunami response in both Indonesia and Thailand. Such efforts should form an important component of any major disaster response program. Various steps have also been undertaken to increase the speed of delivery of international assistance, including via the creation of the UN Central Emergency Response Fund (CERF)15 and the Asian Development Bank’s (ADB’s) Asia Pacific Disaster Response Fund.16 Meanwhile, the World Bank is seeking to address issues of both timeliness and additionality by recently creating a crisis response window specifically for IDA countries. Under this facility, a portion of IDA resources has been set aside to provide additional funding to IDA countries, beyond their annual allocation, in the event of a major disaster.
Despite these efforts to address various difficulties, disaster assistance to the ASEAN region overall is likely to decline in the future as member states become increasingly economically prosperous. Indonesia and Viet Nam have recently graduated to lower-middle income status, joining the Philippines and Thailand. Malaysia is a higher-middle income country, whilst Brunei Darussalam and Singapore are high-income countries. Only Cambodia, Lao PDR and Myanmar now remain as low-income countries that can reasonably continue to assume significant donor support in the event of a major catastrophe.
Other government ex post disaster funding resources
Available evidence indicates that additional post-disaster public support can be provided from an array of other sources, including public-private partnerships. For instance:
The Viet Nam Bank for Social Policies and the Viet Nam Bank for Agriculture and Rural Development provide subsidized loans to certain disaster-affected households.
14
Alternatively, Becerra et al suggest that it could also mean that donors may downgrade their disaster support to countries that they already support generously. 15
The CERF is a stand-by fund established by the United Nations to enable more timely, reliable, equitable and coordinated humanitarian assistance to victims of natural disasters and other types of emergency. 16
The Asia Pacific Disaster Response Fund was established in March 2009. It provides up to US$3 million quick-disbursing grant resources in the event of a disaster to meet immediate expenses incurred in restoring life-saving services to affected populations and to augment other aid flows in times of national crisis (ADB, 2009)
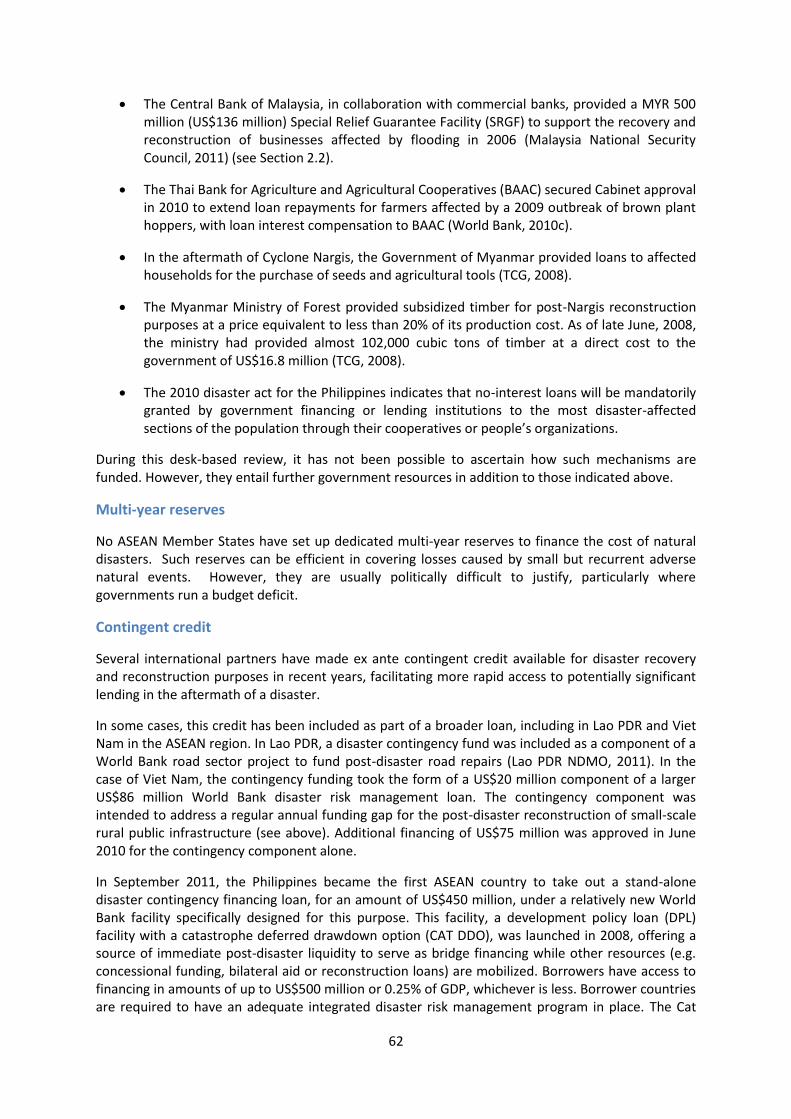
62
The Central Bank of Malaysia, in collaboration with commercial banks, provided a MYR 500 million (US$136 million) Special Relief Guarantee Facility (SRGF) to support the recovery and reconstruction of businesses affected by flooding in 2006 (Malaysia National Security Council, 2011) (see Section 2.2).
The Thai Bank for Agriculture and Agricultural Cooperatives (BAAC) secured Cabinet approval in 2010 to extend loan repayments for farmers affected by a 2009 outbreak of brown plant hoppers, with loan interest compensation to BAAC (World Bank, 2010c).
In the aftermath of Cyclone Nargis, the Government of Myanmar provided loans to affected households for the purchase of seeds and agricultural tools (TCG, 2008).
The Myanmar Ministry of Forest provided subsidized timber for post-Nargis reconstruction purposes at a price equivalent to less than 20% of its production cost. As of late June, 2008, the ministry had provided almost 102,000 cubic tons of timber at a direct cost to the government of US$16.8 million (TCG, 2008).
The 2010 disaster act for the Philippines indicates that no-interest loans will be mandatorily granted by government financing or lending institutions to the most disaster-affected sections of the population through their cooperatives or people’s organizations.
During this desk-based review, it has not been possible to ascertain how such mechanisms are funded. However, they entail further government resources in addition to those indicated above.
Multi-year reserves
No ASEAN Member States have set up dedicated multi-year reserves to finance the cost of natural disasters. Such reserves can be efficient in covering losses caused by small but recurrent adverse natural events. However, they are usually politically difficult to justify, particularly where governments run a budget deficit.
Contingent credit
Several international partners have made ex ante contingent credit available for disaster recovery and reconstruction purposes in recent years, facilitating more rapid access to potentially significant lending in the aftermath of a disaster.
In some cases, this credit has been included as part of a broader loan, including in Lao PDR and Viet Nam in the ASEAN region. In Lao PDR, a disaster contingency fund was included as a component of a World Bank road sector project to fund post-disaster road repairs (Lao PDR NDMO, 2011). In the case of Viet Nam, the contingency funding took the form of a US$20 million component of a larger US$86 million World Bank disaster risk management loan. The contingency component was intended to address a regular annual funding gap for the post-disaster reconstruction of small-scale rural public infrastructure (see above). Additional financing of US$75 million was approved in June 2010 for the contingency component alone.
In September 2011, the Philippines became the first ASEAN country to take out a stand-alone disaster contingency financing loan, for an amount of US$450 million, under a relatively new World Bank facility specifically designed for this purpose. This facility, a development policy loan (DPL) facility with a catastrophe deferred drawdown option (CAT DDO), was launched in 2008, offering a source of immediate post-disaster liquidity to serve as bridge financing while other resources (e.g. concessional funding, bilateral aid or reconstruction loans) are mobilized. Borrowers have access to financing in amounts of up to US$500 million or 0.25% of GDP, whichever is less. Borrower countries are required to have an adequate integrated disaster risk management program in place. The Cat

63
DDO has a ‘soft’ trigger, as opposed to a parametric trigger; funds can be drawn down upon the occurrence of a natural disaster resulting in the declaration of a state of emergency. It provides an affordable source of contingency credit. The expected net present value of the cost of the CAT DDO is estimated to be at least 30% lower than the cost of insurance for disasters occurring once every three years and even higher if the country’s opportunity cost of capital is greater (World Bank, 2011a). The CAT DDO is only available for IBRD countries to date but the Bank is exploring the scope for its extension to IDA countries.
Risk transfer
Risk transfer instruments transfer disaster risk to third parties, replacing the periodic fiscal burden of substantial disaster response needs with a relatively more predictable flow of expenditure in the form of annual premium payments. In practice, there has been relatively little public use of risk transfer instruments in the ASEAN region.
Traditional insurance of public assets Few governments in the ASEAN region have insured public buildings against natural hazards. Notable exceptions include certain local governments in the Philippines and Indonesia. In the Philippines there is some partial all-peril property cover provided under the Government Service Insurance System General Insurance Group (GSIS), a state-owned entity (see Annex 5). Local government units are required by law to purchase insurance from GSIS securing cover against all property in which the government has an interest (e.g., government offices, hospitals, schools, public markets). In practice, GSIS–GI estimated several years ago that around 30% of local government properties were actually insured, with highest coverage in Metro Manila, other cities and richer municipalities (Benson, 2008). Moreover, even those properties that are covered are considerably underinsured according to a recent brief survey of several local government units (World Bank-GFDRR, 2010). This survey found that, on average, assets owned by local governments were insured at 15 to 20% of their real replacement cost. The underinsurance is partly explained by budget shortages for premium payment and by a directive issued by the Commission on Audit prescribing that all government-owned property assets should be insured on the depreciable book value basis (i.e., original book value minus depreciation) (ibid).
In Indonesia, at least two local governments are known to have secured disaster insurance. The municipality of Yogyakarta has insured its public assets since 2003, including government buildings, schools, hospitals, traditional market places, and motor vehicles. The municipality received a payout of IDR3.4 billion (US$370,000) after the 2006 earthquake, equivalent to 14 times the annual premium that year (World Bank, 2011a). The provincial government of West Sumatra also decided to insure most of its properties against earthquake, tsunami and fire after the 2007 earthquake, at a total premium cost of around IDR 200 million (US$22,000) as of 2010 (Indonesia BNPB et al, 2009; World Bank, 2011a). It made its first claim after an earthquake in September 2009 and received a settlement of IDR 20 billion (US$2.2 million) the following May, seven months after the earthquake (World Bank, 2011a).
Parametric sovereign insurance Over the past decade or so, a new generation of parametric insurance instruments have been developed. These products are written against objectively and independently measurable indices that are correlated with loss, rather than against actual losses. Indemnifications are triggered by pre-specified patterns of these indices, potentially resulting in much faster post-disaster settlements as actual losses do not need to be assessed (WFP and IFAD, 2010). They can thereby facilitate a faster, more cost-effective response to a disaster than may be possible via traditional insurance.
Several such products have been developed providing sovereign cover, including for Malawi and the Caribbean. To date, however, none have been developed for ASEAN Member States.

64
Catastrophe bonds Catastrophe bonds are high-yield securities containing a provision that the principal will be forgiven and the funds used to settle losses in the event of a specified disaster. They typically target the highest levels of risk, associated with perils with an annual probability of occurrence of 2% or less (World Bank, 2011a). Since the first catastrophe bond was issued in 1994, the market has grown significantly and the volume of newly issued bonds reached around US$5 billion in 2010. 17 Catastrophe bonds were originally issued by reinsurance companies to cover traditional reinsurance risk segments but have also been issued by governments (Hofman and Brukoff, 2006). According to recent national submissions to the UNISDR on progress in implementation of the Hyogo Framework for Action, eight nations have now issued catastrophe bonds, including one low income (Kyrgyz Republic) and one lower-middle income country (Senegal) (Benson, 2011).
To date, no ASEAN states have issued catastrophe bonds. However, there is some informal discussion underway concerning the possible establishment of a joint catastrophe bond for ASEAN states plus China.18
Diaspora catastrophe bonds – a variant of catastrophe bonds - might also be worth exploring for the ASEAN region, particularly for Indonesia, the Philippines and Viet Nam, each of whom has a large overseas population located in high-income OECD or oil-rich Gulf countries. Diaspora bonds have been issued by some governments for development purposes, allowing them to obtain relatively cheap loans in the form of patriotic nationals’ wealth accumulated overseas (Ketkar and Ratha, 2007). Such securities could also be issued along the line of catastrophe bonds, seeking to tap into widely observed increases in flows of external remittances in the aftermath of disaster events in an ex ante fashion, whilst also offering slightly higher rates of interest than those available under more traditional diaspora bonds. To date, diaspora bonds have not been used in a disaster context anywhere in the world but there has been some discussion of their potential, particularly in the context of the 2010 Haiti earthquake (see, e.g., World Bank and UN, 2010).
Publicly-supported individual policy-holder insurance The public sector can actively encourage the growth of homeowner, crop and other individual risk transfer schemes, for instance by sharing potentially substantial start-up costs; by sharing the risk; and, where appropriate, by subsidizing premiums. This engagement may be justified on the grounds that it can ultimately reduce public contingent liability.
Several governments in the ASEAN region have supported individual policy-holder risk transfer schemes (see Chapter 4). Some engagement dates back many years, relying on traditional insurance instruments. For instance, the Government of the Philippines has provided crop insurance through a government-owned and controlled corporation, the Philippine Crop Insurance Corporation (PCIC), since 1981. In 2009, related public costs in the form of annual premium subsidies for subsistence farmers totaled PhP 184 million (US$3.7 million) (World Bank-GFDRR, 2010).
More recently, several governments have been involved in the development of parametric products, although in some cases only on a pilot basis, mostly focusing on crop insurance. For example, the Thai Government introduced a mechanism in October 2009, involving a crop price insurance scheme which, amongst other features, allows farmers to recover the government-guaranteed price for their crops if they are damaged as a consequence of a disaster (World Bank, 2010c).
Overall, however, ASEAN governments have had relatively limited engagement in this area.
17
http://www.munichre.com/en/media_relations/press_releases/2011/2011_01_24_press_release.aspx 18
http://www.thejakartapost.com/news/2011/04/08/asean-launch-infrastructure-fund-year.html
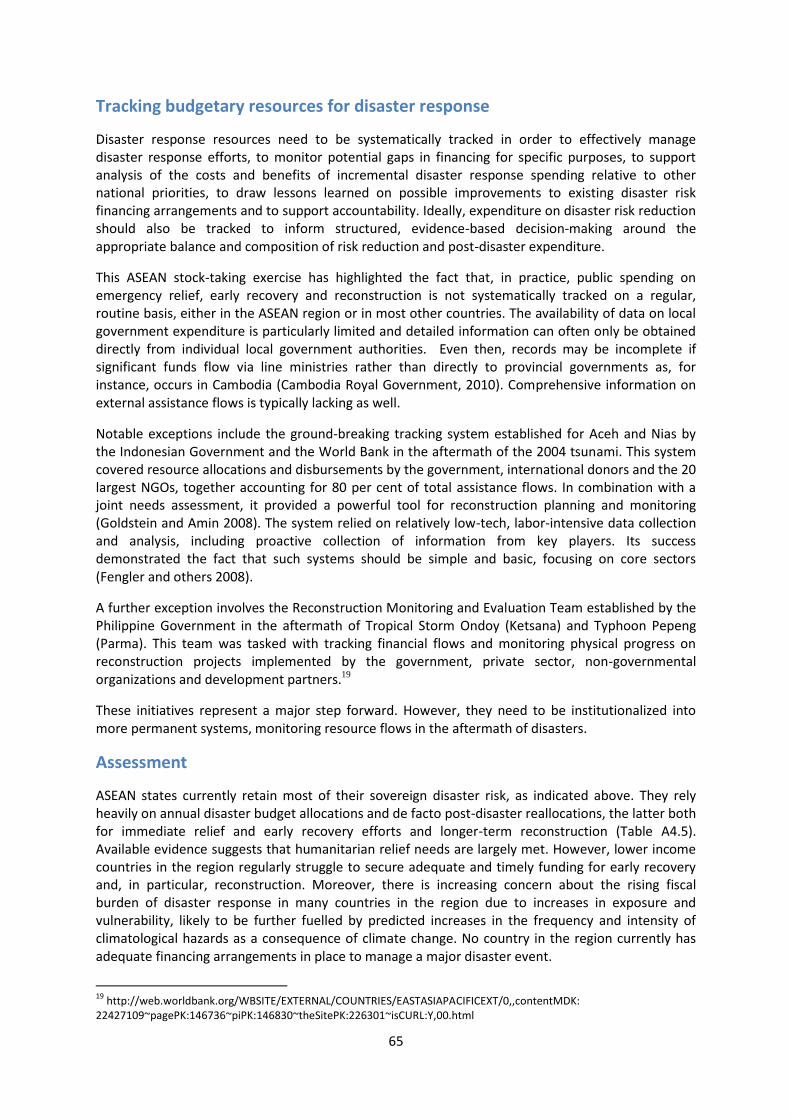
65
Tracking budgetary resources for disaster response
Disaster response resources need to be systematically tracked in order to effectively manage disaster response efforts, to monitor potential gaps in financing for specific purposes, to support analysis of the costs and benefits of incremental disaster response spending relative to other national priorities, to draw lessons learned on possible improvements to existing disaster risk financing arrangements and to support accountability. Ideally, expenditure on disaster risk reduction should also be tracked to inform structured, evidence-based decision-making around the appropriate balance and composition of risk reduction and post-disaster expenditure.
This ASEAN stock-taking exercise has highlighted the fact that, in practice, public spending on emergency relief, early recovery and reconstruction is not systematically tracked on a regular, routine basis, either in the ASEAN region or in most other countries. The availability of data on local government expenditure is particularly limited and detailed information can often only be obtained directly from individual local government authorities. Even then, records may be incomplete if significant funds flow via line ministries rather than directly to provincial governments as, for instance, occurs in Cambodia (Cambodia Royal Government, 2010). Comprehensive information on external assistance flows is typically lacking as well.
Notable exceptions include the ground-breaking tracking system established for Aceh and Nias by the Indonesian Government and the World Bank in the aftermath of the 2004 tsunami. This system covered resource allocations and disbursements by the government, international donors and the 20 largest NGOs, together accounting for 80 per cent of total assistance flows. In combination with a joint needs assessment, it provided a powerful tool for reconstruction planning and monitoring (Goldstein and Amin 2008). The system relied on relatively low-tech, labor-intensive data collection and analysis, including proactive collection of information from key players. Its success demonstrated the fact that such systems should be simple and basic, focusing on core sectors (Fengler and others 2008).
A further exception involves the Reconstruction Monitoring and Evaluation Team established by the Philippine Government in the aftermath of Tropical Storm Ondoy (Ketsana) and Typhoon Pepeng (Parma). This team was tasked with tracking financial flows and monitoring physical progress on reconstruction projects implemented by the government, private sector, non-governmental organizations and development partners.19
These initiatives represent a major step forward. However, they need to be institutionalized into more permanent systems, monitoring resource flows in the aftermath of disasters.
Assessment
ASEAN states currently retain most of their sovereign disaster risk, as indicated above. They rely heavily on annual disaster budget allocations and de facto post-disaster reallocations, the latter both for immediate relief and early recovery efforts and longer-term reconstruction (Table A4.5). Available evidence suggests that humanitarian relief needs are largely met. However, lower income countries in the region regularly struggle to secure adequate and timely funding for early recovery and, in particular, reconstruction. Moreover, there is increasing concern about the rising fiscal burden of disaster response in many countries in the region due to increases in exposure and vulnerability, likely to be further fuelled by predicted increases in the frequency and intensity of climatological hazards as a consequence of climate change. No country in the region currently has adequate financing arrangements in place to manage a major disaster event.
19
http://web.worldbank.org/WBSITE/EXTERNAL/COUNTRIES/EASTASIAPACIFICEXT/0,,contentMDK: 22427109~pagePK:146736~piPK:146830~theSitePK:226301~isCURL:Y,00.html

66
Funding gaps may be felt particularly acutely at a local level. Local governments typically have very limited revenue-raising capabilities of their own. Instead, they are dependent on the transfer of public resources from central government, both for reconstruction and other spending purposes. Local governments that receive most of their resources from central government in the form of non-earmarked block allocations can be particularly hard hit, as such allocations often fail to take disaster-related needs into account. In Cambodia, for example, the annual Commune Sangkat Fund (CSF) allocation (the primary mechanism for fiscal transfers from central to commune level for both administrative and development purposes) for 2010 included no additional supplement for communities affected by Typhoon Ketsana (Cambodia Royal Government, 2010). Meanwhile, in Viet Nam, annual allocations from central government for capital investment purposes are set every three years. If a disaster then strikes, provinces have to meet reconstruction costs for sub-national infrastructure out of this prior-established budget. Local governments can face further difficulties where funds promised by the national government for reconstruction purposes are not forthcoming. This has occurred on occasion in, for instance, the Philippines (Philippines NDCC, 2009).

67
Table A3.5. Preliminary summary of fiscal risk management arrangements in ASEAN Member Statesa
Ex post Ex ante
Risk transfer
Annual budget alloca-tions
In-year realloca-
tions
Medium-term
capital budget
realign--ments
Tax increases
Deficit financing
Inter-national
assistance
Contin-gent
credit
Insurance of public
assets
Public support of
private policy holder
insurance
Para-metric
sovereign insurance
Cata-strophe bonds
Brunei Darussalam
Cambodia
Indonesia
Lao PDR
Malaysia
Myanmar
Philippines
Singapore
Thailand
Viet Nam
a This table is based on the best information that the research team has been able to collate, but should be interpreted with due consideration to limitations arising from the secondary nature of the underlying sources. Note also that although many governments are purchasing some insurance for their assets, the number of buildings covered as a share of the total public asset portfolio is thought to be very limited.

68
Estimating funding gaps
Anecdotal evidence on the inadequacy of existing financing arrangements for post-disaster response is widespread, captured in media reports on humanitarian relief shortfalls and delays in reconstruction. In the case of Myanmar, for instance, Cyclone Nargis affected an estimated 800,000 housing units, 56% of which were totally destroyed (TCG, 2008). Three years later, the UN Human Settlements Programme estimates that some 75,000 households are still awaiting new housing. 20
However, estimating funding gaps more precisely is by no means simple. It requires comprehensive data on public contingency liability for a range of hazards with varying return periods, on all existing disaster risk financing mechanisms (both formal and informal) and, in the case of ex post analysis, on actual flows of funding. Moreover, even where all identified disaster response, early recovery and reconstruction needs are met, this does not necessarily mean that those needs have been met in the most cost-effective manner.
Nevertheless, even simplified analysis, focusing solely on ex ante tools, is useful in providing some first approximation of funding gaps as a basis for reviewing and strengthening disaster financing arrangements.
Several available worked case studies suggest that existing ex ante funding arrangements are not sufficient, at least in the countries analyzed. Preliminary retrospective analysis of the funding gap in Viet Nam for the period 2000 to 2008 indicated that short-term recovery funding needs were met in full through the government contingency budget (World Bank, 2010a).21 However, results relating to the funding gap for reconstruction were less favorable. It was assumed that reconstruction costs are met via the reallocation of up to 1% of planned capital expenditure in the relevant budget year. Between 2000 and 2004, the average value of disaster losses was below the long-term average and these short-term capital investment reallocations were either adequate (2003 and 2004) or left only small reconstruction expenditure funding gaps of less than VND 1 billion (2000 and 2001). In contrast, major reconstruction funding gaps were observed for 2006, 2007 and 2008. These gaps were estimated at VND 4,411 billion (US$275 million) for 2006 (the highest loss year over a wider 20-year period), VND 2,047 billion (US$127 million) for 2007 and VND 2,510 billion (US$152 million) for 2008. The analysis also indicated that, although there is likely to be an annual average government recovery funding surplus in the future, there will be a funding gap for disaster years with a return period higher than 10 years and an annual average reconstruction funding gap. The government should expect to face average annual reconstruction costs of around VND 4,900 billion (US$296 million) in real (2008) terms, of which about VND 1,500 billion could be financed through the short-term reallocation of capital expenditure (based on the 1% assumption above). The 1-in 10-year government reconstruction funding gap is estimated at about VND 8,500 billion (US$ 516 million), rising to around VND14,500 billion (US$ 880 million) once every 50 years.
In the Philippines, a simplified funding gap analysis was undertaken, based on a comparison of disaster response resources available from all government and private sector sources (e.g., including annual budget allocations, PCIC, local calamity funds and private donations) and losses resulting from the 2009
20
http://reliefweb.int/node/399646 21
The analysis assumed that, on average, about 40% of the central contingency budget and 20% of the local contingency budget are available to finance post-disaster recovery activities. The state contingent liability due to natural disasters was estimated at 55% of the total reported damage estimates, using Central Committee Flood and Storm Control (CCFSC) data. It was further assumed that the government recovery and reconstruction expenditure requirements represent 25 and 30% respectively of total CCFSC damage estimates.
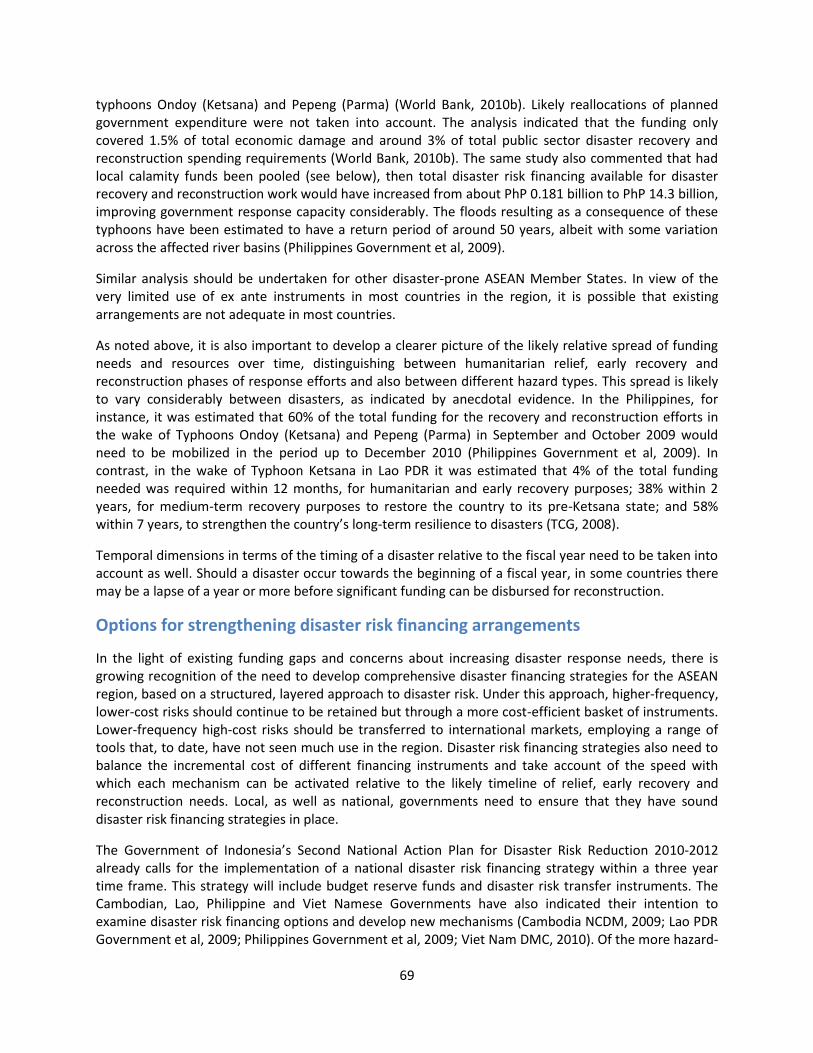
69
typhoons Ondoy (Ketsana) and Pepeng (Parma) (World Bank, 2010b). Likely reallocations of planned government expenditure were not taken into account. The analysis indicated that the funding only covered 1.5% of total economic damage and around 3% of total public sector disaster recovery and reconstruction spending requirements (World Bank, 2010b). The same study also commented that had local calamity funds been pooled (see below), then total disaster risk financing available for disaster recovery and reconstruction work would have increased from about PhP 0.181 billion to PhP 14.3 billion, improving government response capacity considerably. The floods resulting as a consequence of these typhoons have been estimated to have a return period of around 50 years, albeit with some variation across the affected river basins (Philippines Government et al, 2009).
Similar analysis should be undertaken for other disaster-prone ASEAN Member States. In view of the very limited use of ex ante instruments in most countries in the region, it is possible that existing arrangements are not adequate in most countries.
As noted above, it is also important to develop a clearer picture of the likely relative spread of funding needs and resources over time, distinguishing between humanitarian relief, early recovery and reconstruction phases of response efforts and also between different hazard types. This spread is likely to vary considerably between disasters, as indicated by anecdotal evidence. In the Philippines, for instance, it was estimated that 60% of the total funding for the recovery and reconstruction efforts in the wake of Typhoons Ondoy (Ketsana) and Pepeng (Parma) in September and October 2009 would need to be mobilized in the period up to December 2010 (Philippines Government et al, 2009). In contrast, in the wake of Typhoon Ketsana in Lao PDR it was estimated that 4% of the total funding needed was required within 12 months, for humanitarian and early recovery purposes; 38% within 2 years, for medium-term recovery purposes to restore the country to its pre-Ketsana state; and 58% within 7 years, to strengthen the country’s long-term resilience to disasters (TCG, 2008).
Temporal dimensions in terms of the timing of a disaster relative to the fiscal year need to be taken into account as well. Should a disaster occur towards the beginning of a fiscal year, in some countries there may be a lapse of a year or more before significant funding can be disbursed for reconstruction.
Options for strengthening disaster risk financing arrangements
In the light of existing funding gaps and concerns about increasing disaster response needs, there is growing recognition of the need to develop comprehensive disaster financing strategies for the ASEAN region, based on a structured, layered approach to disaster risk. Under this approach, higher-frequency, lower-cost risks should continue to be retained but through a more cost-efficient basket of instruments. Lower-frequency high-cost risks should be transferred to international markets, employing a range of tools that, to date, have not seen much use in the region. Disaster risk financing strategies also need to balance the incremental cost of different financing instruments and take account of the speed with which each mechanism can be activated relative to the likely timeline of relief, early recovery and reconstruction needs. Local, as well as national, governments need to ensure that they have sound disaster risk financing strategies in place.
The Government of Indonesia’s Second National Action Plan for Disaster Risk Reduction 2010-2012 already calls for the implementation of a national disaster risk financing strategy within a three year time frame. This strategy will include budget reserve funds and disaster risk transfer instruments. The Cambodian, Lao, Philippine and Viet Namese Governments have also indicated their intention to examine disaster risk financing options and develop new mechanisms (Cambodia NCDM, 2009; Lao PDR Government et al, 2009; Philippines Government et al, 2009; Viet Nam DMC, 2010). Of the more hazard-

70
prone countries in the region, the Philippines currently arguably comes closest to putting the basic bones of a strategy in place, with national and local calamity funds, a government-owned insurer providing cover for public assets, a publicly-supported crop insurance program and, most recently, a contingency loan arrangement. However, the insurance programs provide very limited coverage and the existing arrangements therefore include very little risk transfer element.
Under an optimal strategy, governments would continue to meet response efforts associated with high-frequency, low-cost events via the regular annual budgeting of contingency resources (say, up to around one-in-three year events). This provides one of the cheapest forms of disaster financing, assuming the resources are fully utilized within the budget year. Procedures for the release of funds should be based on clear, transparent triggers and designed to facilitate rapid disbursement, whilst also incorporating strict accountability mechanisms. Governments may also wish to examine whether long-term cost efficiency could be enhanced by retaining unutilized national and local government disaster contingency reserves in a special (interest-bearing, instant access) fund for use in future years or to help meet risk transfer and risk reduction costs. The collective pooling of local government contingency funding, allowing immediate access to much larger funding reserves, should also be explored.
Short and medium-term budgetary reallocations and related realignments of government priorities would be used to cover the second tier of risk. Reallocations can also provide a relatively cheap form of disaster financing, particularly where they soak up surplus funding from other slow-disbursing public initiatives. However, their marginal opportunity cost may increase exponentially if substantial funding is secured via this mechanism, forcing significant revisions in prior development goals and objectives. More generally, opportunity costs as measured in terms of progress in poverty reduction may be particularly high in low income countries. Governments should seek to learn much more about their existing extent of dependence on post-disaster reallocations and related costs in order to ensure that they do not over-rely on this source of post-disaster financing. Currently, available information on this source of disaster risk financing is particularly weak.
Depending on prevailing circumstances, some level of risk borrowing or, perhaps, monetary expansion could be an appropriate and viable way of covering medium levels of risk. In particular, higher disaster risk ASEAN Member States with IBRD status (Indonesia and Viet Nam) could consider following the Philippines’ example and securing an ex ante contingent loan. These loans provide significant, fast-disbursing financing for medium-return disasters at a lower cost than insurance alternatives. Viet Nam’s existing contingency credit under a wider natural disaster risk management loan expires relatively soon, at the end of 2013.
Low-risk, high-cost risks are best transferred to third parties. Under an optimal disaster risk financing strategy, governments would therefore seek to develop a range of disaster risk transfer instruments to cover sovereign risk and encourage private insurance cover, in effect spreading the cost of disaster response over time via regular premium payments. These instruments are not cheap. Premia tend to lie well above their long-term actuarially fair price due to high transaction costs and the covariant nature of the risk insured, the latter creating the need either to hold substantial capital reserves or purchase reinsurance (Arnold, 2008; Linnerooth-Bayer and Mechler, 2009).22 Nevertheless, they are the most cost-efficient way of covering low-risk, high-cost events.
22
In the Caribbean region, for instance, Auffret (2003) reported that insurance premiums (paid mostly by businesses) accounted for an estimated 1.5% of GDP over the period 1970 to 1999, while insured and uninsured disaster losses were equivalent to 0.5% of GDP.
71
As part of this, greater insurance cover of individual public assets may be appropriate, particularly in more hazard-prone countries in the ASEAN region. Options for local, as well as national, procurement of insurance should be explored. Increased insurance cover of public assets has already been explicitly recommended in the case of Indonesia (see World Bank, 2011a). However, certain obstacles would need to be overcome, in particular relating to a frequent reluctance on the part of government officials to commit limited resources to insurance premiums and, in some cases (especially at a local level), limited knowledge and understanding of risk transfer products. In the case of the Philippines, resource issues may be addressed to some degree by recent legislative changes permitting the use of local government disaster contingency funds to meet insurance premiums. Other ASEAN states could consider similar adjustments, assuming their existing contingency funds are not already over-stretched.
The introduction of sovereign parametric insurance products and catastrophe bonds could also be considered. These are becoming increasing feasible – and thus increasingly popular in international capital markets – as hazard monitoring and measurement capacities increase. The catastrophe bond market, in particular, has grown rapidly over the past 15 years and seems set to continue expanding as the risks associated with catastrophe bonds are not correlated with other risks faced by the financial markets and therefore provide investors a mechanism for risk diversification. ASEAN states should continue to explore the possible establishment of a joint catastrophe bond as well as national ones.
Another potential option perhaps worthy of further attention relates to the development of a regional sovereign risk insurance pool, although not necessarily either confined to ASEAN Member States or including all ASEAN member states. To be successful, the correlation of risk between participating countries for the hazards covered would need to be low whilst a relatively large number of countries should get involved to spread the risk. A regional insurance pool has already been launched in the Caribbean and a second pool is under development for the Pacific.
Fiscal instruments could also generate some disaster response resources, an option that is probably most politically viable in the case of lower frequency, high cost events. To date, there has been very limited such use of these instruments. Further research on appropriate fiscal response to different disaster scenarios is needed, exploring potential for raising disaster response financing as well as stimulating recovery.
The highest layer of risk, associated with very low frequency but substantial losses, could be covered by international grant assistance. However, thresholds at which governments could expect to attract aid will vary enormously, depending on a range of factors including a country’s level of income and relationship with donors. International grant assistance is likely to remain a significant source of funding for low-income ASEAN states in the aftermath of major disaster events. However, lower middle-income countries should not assume that they will receive any flows of international grant assistance in the medium-term future, expect in the case of catastrophic events (perhaps 1-in-200 year events or higher). Moreover, all governments should bear in mind that international donor assistance is an uncertain form of funding and actual flows cannot be predicted with any degree of accuracy.
As the above has clearly indicated, the most appropriate combination of instruments and cut offs (in terms of disaster rates of return) for moving from one disaster risk financing instrument to the next depends on individual country circumstances, including level of income, the disaster risks faced, the scale and nature of public contingent liability (including its spread over time), government fiscal capacity and level of access to international capital markets. Some potential country-specific illustrative disaster risk financing strategies are provided in Box A3.3, drawing on previous studies undertaken by the World Bank. Each seeks to combine self-retention and risk transfer tools to allow governments to secure access

72
to sufficient resources at the required points in time and at the lowest possible cost. The examples were intended to provide a basis for further discussion with the relevant governments on the development of a disaster risk financing strategy (World Bank, 2010a). Illustrative disaster risk financing strategies should be developed for low-income ASEAN Member States too. Low-income countries may well face somewhat different options, including fewer opportunities for disaster risk transfer, yet potentially higher opportunity costs too in retaining risk.
Box A3.3. Sample disaster risk financing strategy for the Government of Viet Nam
The World Bank has prepared a sample comprehensive disaster risk financing strategy for the Government of Viet Nam (GoV) based, for the sake of illustration, on the assumption that the GoV’s objective is to secure immediate liquidity to finance 30% of the damage caused by a onein-100 year natural disaster year (as reported by the GoV’s Central Committee Flood and Storm Control). This implies that the GoV wants to secure around US$1,200 million to cover recovery costs and start the reconstruction of key public assets.
The strategy is based on a four-tier risk financing strategy:
Contingency budget The contingency budget would cover the first US$270 million of government disaster expenditures. It follows the current disaster risk financing strategy under which the contingency budget is the main source of disaster response funding. It is estimated that such contingency funding would be exhausted with a 44% probability (about once every 2.5 years).
National reserves The disaster reserve fund would cover up to US$134 million of losses in excess of the contingency budget. The catastrophe risk financing analysis shows that such a reserve fund combined with the contingency budget would cover probable maximum losses of about US$450 million, as is likely to occur once every 4 years.
Contingent credit A contingent credit such as a World Bank DPL with CAT DDO would cover the third risk layer of US$250 million.
Disaster insurance A final tier would provide up to US$512 million cover in excess of US$654 million occurring once every 12 years or less frequently.
Figure A3.7. Illustrative sovereign disaster risk financing strategy for the Government of
Viet Nam

73
Note: PFL (probability of first loss); RP (Return Period); AEL (annual expected loss)s
This illustrative disaster risk financing strategy would allow the GoV to access up to $1.2 billion in the case of major natural disasters occurring on average once every 100 years. If the GoV wished to strengthen (or reduce) its level of financial resilience, it could increase (or decrease) the insurance coverage accordingly.
Source: World Bank (2010a)
Finally, as noted at the beginning, ASEAN state sovereign disaster risk financing strategies need to be placed in a broader disaster risk management context, incorporating disaster risk reduction. It is far more cost-effective to reduce some risk via ex ante risk reduction measures. Disaster risk financing mechanisms themselves also need to encourage and reinforce risk reduction messages. There is considerable opportunity for this. For instance, disaster risk reduction conditionalities could be linked to access to contingent credit (as already happens under the World Bank CAT DDO), insurance premium discounts could be offered for more resilient clients and, possibly, though controversially, local governments that invest more in disaster risk reduction could be given greater access to early recovery and reconstruction resources. Most governments in the ASEAN region appreciate the benefits in building back better and, in some cases with donor support and encouragement, have implemented related post-disaster programs. However, efforts to institutionalize post-disaster build-back-better principles need to be stepped up.

74
References
ADB, 2009. Establishment of the Asia Pacific Disaster Response Fund. Manila: Asian Development Bank, March.
ADB, 2010. Asian Development Outlook 2010: Macroeconomic Management Beyond the Crisis. Manila: Asian Development Bank, April.
ADB, 2011. Key Indicators for Asia and the Pacific 201. Manila: Asian Development Bank.
Arnold, Margaret, 2008. The role of risk transfer and insurance in disaster risk reduction and climate change adaptation. Stockholm: Commission on Climate Change and Development, March.
ASEAN Disaster Risk Management Initiative, 2010. Synthesis Report on Ten ASEAN Member States Disaster Risks Assessment. December.
Auffret, Philippe, 2003. ‘Catastrophe insurance market in the Caribbean region’. World Bank Policy Research Working Paper No. 2963. Washington, DC: The World Bank.
Becerra, Oscar, Eduardo Cavallo and Ilan Noy, 2010. ‘In the Aftermath of Large Natural Disasters, what happens to foreign aid?’ Working Papers 201018. Manoa: University of Hawaii at Manoa, Department of Economics.
Benson, Charlotte, 1997. The Economic Impacts of Natural Disasters in the Philippines’. ODI Working Paper No. 99. London: Overseas Development Institute, June
Benson, Charlotte, 2008. Socio-Economic Perspective on the Impact of Climate Extremes on the Rice Supply Chain and Implications for Macroeconomic Planning. Paper prepared for World Bank/ProVention Activity on Philippines: Agriculture Climate Risk Assessment in support of Philippines Climate Change Adaptation Project (P101076). Washington, DC: The World Bank.
Benson, Charlotte, 2009a. Developing and targeting economic and financial information in support of effective disaster risk management. Draft. Geneva: United Nations Development Programme, September.
Benson, Charlotte, 2009b. ‘Natural Disaster Risk Management Project Component 3: Additional Financing - Notes from Mission of 9 – 20 Nov 2009’ Mimeo.
Benson, Charlotte, 2011. Financing disaster risk reduction: A strategic framework to stimulate greater public and private investment. Background Paper commissioned by UNISDR for the Plenary Session on The Economics of Disaster –Effective Financial Instruments to Reduce Risk, Global Platform for Disaster Risk Reduction 2011, 8-13 May 2011, Geneva. Draft. Geneva: United Nations International Strategy for Disaster Reduction, April.
Blöndal, Jón R. and Sang-In Kim, 2006. ‘Budgeting in Thailand. OECD Journal on Budgeting, 5(3): 7-36.
Brunei Darussalam NDMC, 2011. Brunei Darussalam National progress report on the implementation of the Hyogo Framework for Action (2009-2011). Bandar Seri Begawan: National Disaster Management Center, Government of Brunei Darussalam, April.
75
Borensztein, Eduardo Cavallo, and Patricio Valenzuela. 2008. ‘Debt Sustainability under Catastrophic Risk: The Case for Government Budget Insurance.’ IMF Working Paper WP/08/44. Washington, DC: International Monetary Fund, February.
Cambodia NCDM, 2009. National progress report on the implementation of the Hyogo Framework for Action. Phnom Penh: National Committee for Disaster Management, Royal Government of Cambodia, May.
Cambodia Royal Government, 2010. Post-Ketsana Disaster Needs Assessment. A Report prepared by the Royal Government of Cambodia with support from the World Bank, GFDRR, UN System, ADB and ADPC Under the Leadership of the Cambodian National Committee for Disaster Management. Phnom Penh, March.
Cummins, J. David, Michael Suher, and George Zanjani, 2007. Federal Financial Exposure to Catastrophic Risk, Working paper, July 31.
Cummins, J David and Olivier Mahul, 2008. Catastrophe Risk Financing in Developing Countries: Principles for Public Intervention – Overview. Washington, DC: The World Bank. Available at http://gfdrr.org/docs/Track-II_Catrisk_financing_Overview_booklet.pdf
Fengler, Wolfgang, Ahya Ihsan and Kai Kaiser, 2008. ‘Managing Post-Disaster Reconstruction Finance: International Experience in Public Financial Management’. Policy Research Working Paper 4475. Washington, DC: Public Sector Unit, Poverty Reduction and Economic Management and Poverty Reduction and Economic Management Network, East Asia and the Pacific Region, The World Bank, January.
Ghesquiere, Francis and Olivier Mahul, 2007. ‘Sovereign Natural Disaster Insurance for Developing Countries: A Paradigm Shift in Catastrophe Risk Financing’. Policy Research Working Paper 4345. World Bank: Latin America and Caribbean Region, Hazard Risk Management Unit and Financial and Private Sector Development Vice Presidency, Social Safety Net Department, September.
Goldstein, Markus and Samia Amin (eds), 2008. Data Against Natural Disasters Establishing Effective Systems for Relief, Recovery, and Reconstruction. Washington, DC: World Bank. Available at http://siteresources.worldbank.org/INTPOVERTY/Resources/335642-1130251872237/9780821374528.pdf
Gurenko, Eugene N, 2009. ‘An Overview of Disaster Risk Financing Instruments in the World Bank Operations.’ Presentation at GFDRR sponsored BBL, Washington DC, March 4, 2009. Washington, DC: The World Bank.
Hallegatte, S, Hourcade, J.-C. and P Dumas, P, 2007. ‘Why economic dynamics matter in assessing climate change damages: Illustration on extreme events,’ Ecological Economics, Vol. 62(2), 330-340.
Hofman, David and Patricia Brukoff, 2006. ‘Insuring Public Finances Against Natural Disasters—A Survey of Options and Recent Initiatives.’ IMF Working Paper WP/06/199. Washington, DC: Policy Development and Review Department, International Monetary Fund, August.
IMF, 2005a. ‘IMF Executive Board Concludes Second Post-Program Monitoring Discussion with Indonesia’. Public Information Notice (PIN) No. 05/38 (March 22 205). Washington, DC: International Monetary Fund, March.
76
IMF, 2005b. Indonesia: 2005 Article IV Consultation and Third Post-Program Monitoring Discussions—Staff Report; Staff Supplement; and Public Information Notice on the Executive Board Discussion; and Statement by the Executive Director for Indonesia. IMF Country Report No. 05/326. Washington, DC: International Monetary Fund, September.
IMF, 2007. Lao People’s Democratic Republic: Selected Issues and Statistical Appendix. IMF Country Report No. 07/359. Washington, DC: International Monetary Fund, November.
Indonesia BAPPENAS and the International Donor Community, 2005. Indonesia: Preliminary Damage and Loss Assessment – The December 26, 2004 Natural Disaster. Jakarta: Badan Perencanaan Pembangunan Nasional (State Ministry for National Development Planning) and the International Donor Community, January.
Indonesia Government, 2005. Master Plan for the Rehabilitation and Reconstruction of the Regions and Communities of the Province of Nanggroe Aceh Darussalam and the Islands of Nias, Province of North Sumatra. Jakarta: Government of the Republic of Indonesia, April.
Indonesia Government Kecamatan Development Program and the World Bank, 2007. Aceh Flood: Damage and Loss Assessment. Jakarta: Kecamatan Development Program, Government of Indonesia and the World Bank
Indonesia BNPB et al, 2009. West Sumatra and Jambi Natural Disasters: Damage, Loss and Preliminary Needs Assessment. A joint report by the BNPB, Bappenas, and the Provincial and District/City Governments of West Sumatra and Jambi and international partners, October 2009. Jakarta: Badan Nasional Penanggulangan Bencana (National Disaster Management Agency) and others, October.
Indonesia BNPB, 2011. National progress report on the implementation of the Hyogo Framework for Action (2009-2011). Jakarta: Badan Nasional Penanggulangan Bencana, April.
Ketkar, Suhas L and Dilip Ratha, 2007. Development Finance via Diaspora Bonds: Track Record and Potential. Paper presented at the Migration and Development Conference at the World Bank, Washington D.C. May 23, 2007. Washington, DC: The World Bank.
Lao PDR Government et al, 2009. The Ketsana Typhoon in the Lao People’s Democratic Republic (September 29, 2009): Damage, Loss and Needs Assessment. A Report prepared by the Government of the Lao PDR with support from the World Bank, ADB, ASEAN, FAO, AusAID, GFDRR and ADPC. Vientiane: Government of the Lao PDR, November.
Lao PDR NDMO, 2011. Lao People's Democratic Republic: National progress report on the implementation of the Hyogo Framework for Action (2009-2011). Vientiane: National Disaster Management Office, Ministry of Labour and Social Welfare, May.
Linnerooth-Bayer, Joanne and Reinhard Mechler, 2009. ‘Insurance against Losses from Natural Disasters in Developing Countries’. DESA Working Paper No. 85. ST/ESA/2009/DWP/85. New York: Department of Economic and Social Affairs, October.
Malaysia National Security Council, 2011. Malaysia: National progress report on the implementation of the Hyogo Framework for Action (2009-2011). Kuala Lumpur: National Security Council, Prime Minister's Department, May.
77
Myanmar Relief and Resettlement Department, 2010. Myanmar National progress report on the implementation of the Hyogo Framework for Action (2009-2011) – interim. Naypyidaw: Relief and Resettlement Department, Government of the Union of Myanmar, November.
OECD, 2010. Good Practice for Mitigation and Financing Catastrophic Risks: OECD Recommendation. Paris: Organisation of Economic Cooperation and Development, December.
Philippines Government et al, 2009. Typhoons Ondoy and Pepeng: Post-Disaster Needs Assessment – Main Report. Manila: Government of the Republic of the Philippines, Asian Development Bank, United Nations, World Bank and Global Facility for Disaster Reduction and Recovery,
Philippines NDCC, 2009. Philippines National progress report on the implementation of the Hyogo Framework for Action. Manila: Office of Civil Defense, National Disaster Coordinating Council, Government of the Philippines, May.
Philippines Senate and House of Representatives, 2010. Republic Act No. 10121: An Act Strengthening the Philippine Disaster Risk Reduction and Management System, Providing for the National Disaster Risk Reduction and Management Framework and Institutionalizing the National Disaster Risk Reduction and Management Plan, Appropriating Funds Therefor and for Other Purposes. Manila: Congress of the Philippines, Government of the Republic of the Philippines.
Philippines OCD- NDRRMC, 2011. National progress report on the implementation of the Hyogo Framework for Action (2009-2011) – interim. Manila: Office of Civil Defense, National Disaster Risk Reduction and Management Council, Government of the Philippines, March.
Powell, Andrew and Matteo Bobba, 2006. ‘Multilateral Intermediation of Foreign Aid: What is the Trade-Off for Donor Countries?’. Working Paper 594. Washington, DC: Research Department, Inter-American Development Bank, November.
Singapore MSD, 2009. Singapore National progress report on the implementation of the Hyogo Framework for Action. Singapore: Meteorological Services Division, National Environment Agency, Government of Singapore, February.
Thailand DDPM, 2011. Thailand National progress report on the implementation of the Hyogo Framework for Action (2009-2011). Bangkok: Department of Disaster Prevention and Mitigation, Ministry of Interior, Government of Thailand.
TCG, 2008. Post-Nargis Joint Assessment. A report prepared by the Tripartite Core Group comprised of Representatives of the Government of the Union of Myanmar, the Association of Southeast Asian Nations and the United Nations with the support of the Humanitarian and Development Community. Yangoon: Tripartite Core Group, July.
UN, 2006. Tsunami Thailand One Year Later: National Response and Contribution of International Partners. Bangkok: Office of the UN Resident Coordinator, United Nations Country Team in Thailand.
Viet Nam DMC, 2010. Viet Nam: National progress report on the implementation of the Hyogo Framework for Action (2009-2011) – interim. Hanoi: Disaster Management Center, Ministry of Agriculture and Rural Development, September.

78
WFP and IFAD, 2010. The Potential for Scale and Sustainability in Weather Index Insurance for Agriculture and Rural Livelihoods. Rome: World Food Programme and International Fund of Agricultural Development, March.
World Bank and NDCC, 2005. Natural Disaster Risk Management in the Philippines: Enhancing Poverty Alleviation through Disaster Reduction. Report 33822. Manila: World Bank and National Disaster Coordinating Council.
World Bank, 2010a. Weathering the Storm: Options for Disaster Risk Financing in Viet Nam. Washington, DC: The World Bank, May.
World Bank, 2010b. Mitigating the Adverse Impacts of Natural Disasters on the Philippines: A Study of Disaster Risk Financing Options. Washington, DC: Global Facility for Disaster Reduction and Recovery, World Bank, October.
World Bank, 2010c. Thailand Economic Review: November 2010. World Bank Office—Bangkok
World Bank-GFDRR, 2010. Mitigating the Adverse Impacts of Natural Disasters on the Philippines: A Study of Disaster Risk Financing Options. Washington, DC: Global Facility for Disaster Reduction and Recovery, World Bank, October.
World Bank and UN, 2010. Natural Hazards, UnNatural Disasters: The Economics of Effective Prevention. Washington, DC and New York: The World Bank and the United Nations.
World Bank, 2011a. Indonesia: Advancing a National Disaster Risk Financing Strategy: Options for Consideration. Jakarta and Washington, DC: Disaster Risk Financing and Insurance Program (GFDRR and GCMNB), Indonesia Country Management Unit, East Asia Finance and Private Sector Unit, East Asia Social Development Department and Global Facility for Disaster Reduction and Recovery.
World Bank, 2011b. Thailand Economic Monitor April 2011. Bangkok: World Bank Office, April.
World Bank, 2011c. World Development Report 2011: Conflict, Security and Development. Washington, DC: World Bank.
Yang, Dean, 2006. ‘Coping with Disaster: The Impact of Hurricanes on International Financial Flows, 1970-2002. NBER Working Paper 12794. Cambridge, MA: National Bureau of Economic Research, December 2006.

79
Appendix 4. Property Catastrophe Risk Insurance Markets
Introduction
This Annex presents property catastrophe risk insurance (PCRI) market profiles for the ASEAN Member States, in addition to a discussion on the state of regulation of insurers exposed to catastrophe risk.
This report is a work in progress presented for further collaborative drafting and readers are requested to refer to the disclaimer presented on page 1 of the report for information on the limitations of the information presented herein. Readers are also advised to note that PCRI markets in the region are continually evolving and therefore the current state of markets may have altered since the publication of the sources that support this Annex.
However, with due consideration to the limitations outlined above, the authors present this information as a guide for readers to the state of ASEAN property catastrophe risk insurance markets.
Brunei Darussalam PCRI market profile
Cover availability
Flood presents the largest catastrophe risk to Brunei Darussalam. Although earthquakes and windstorms have been recorded, the risk is low and no significant losses have been observed.
Industrial all risks cover is available in the country, but the vast majority of catastrophe risk is placed through extensions to fire policies, with an additional component of premium applied. Flood specific deductibles are often applied to control exposure. An estimated 30-50%23 of fire policies are extended to cover flood risk, but flood insurance penetration is limited by the fact that non-life insurance penetration is relatively low (0.34% GDP24). Catastrophe risk cover is not mandatory.
In 2009 the country suffered the worst flooding in 40 years. An estimated $3.5mn25 of total insured loss was sustained, the small magnitude being a reflection of low insurance penetration as opposed to the extent of the catastrophe. Reports indicate that despite many affected households being uninsured, the event has not triggered an increase in the uptake of flood insurance in the country
23
AXCO Insurance Market Reports 24
Swiss Re Sigma No 2/2010 World Insurance in 2009 Statistical Appendix 25
AXCO Insurance Market Reports, National Insurance Company Berhad, Brunei Darussalam. 2009 Annual Report
80
Box A4.1. Brunei Darussalam Takaful Market26
Entities operating in the market
The market for non-life insurance in Brunei Darussalam has seen considerable consolidation as a result of legislation in 2006 increasing paid-up capital requirements for insurers. As a result, it is now one of the least fragmented general insurance markets in the region; the market leader National Insurance Company holds 40%27 of the market and only six non-life insurers and two takaful operators are currently active in this market.
International insurers Allianz, Etiqa, Mistui Sumitomo and Tokio Marine all participate in the market through shareholdings of domestic companies or local branches. Allianz is the major shareholder of the National Insurance Company with a 25% share, while Mitsui Sumitomo is also a significant shareholder with 5%. Local branches operated by Tokio Marine and Etiqa are ranked fourth and sixth amongst the largest non-life insurers in Brunei Darussalam.
State-owned Audley insurance operates under the umbrella of the ministry of finance and provides cover for government assets at home and abroad.
The government has a history of providing extensive assistance to disaster-affected individuals in the country. As a result, the perceived value of catastrophe risk insurance in Brunei Darussalam has been diminished and penetration rates affected; there is an assumption that the government will play the role of insurer of last resort should a disaster occur.
Box A4.2. Brunei Darussalam Reinsurance Market
26
Sources include Ernst and Young World Takaful Report 2011, Mohamed, Hafiz (2006) Middle East Insurance Review 27
National Insurance Company Berhad, Brunei Darussalam. 2009 Annual Report
Brunei Darussalam Takaful Market
0.23% GDP Overall takaful (life and non-life) penetration was 0.23% of GDP in 2009 with slow growth.
Takaful holds a larger portion of the non-life insurance market in Brunei Darussalam than any other
ASEAN country, with premiums broadly on a par with conventional non-life insurance in 2009.
Takaful penetration is, however, largely due to growth in motor insurance, with conventional
insurance dominating for all other lines, including property cover.
Reinsurance Market There are no reinsurers operating domestically, and as there are no restrictions on placing risk in the
international markets insurers place their reinsurance programs abroad.

81
Pricing
Tariffs for motor are prescribed, but no pricing control is in place for other lines of business.
Distribution28
Distribution of property insurance is split between agents (40%), brokers (35%) and direct sales (principally over the counter) or bank channels (25%). Willis is the sole broker.
Agent commissions for property business are reported to be extremely large - in the region of 40-65% (gross). These large rates keep downward pressure on premiums, although with few data available on historical catastrophe losses, it is impossible to conclude whether rate adequacy for catastrophic risk cover is an issue in the country.
Cambodia PCRI market profile
Cover availability
Flood is the principal catastrophic peril impacting Cambodia – typhoon Ketsana caused more than $130mn estimated economic damage to the country in 200929.
Standard homeowners and commercial and industrial property insurance does not include flood cover – flood insurance must be added as an endorsement to the standard policy. Additional premium is applied for the cover extension, and underwriters routinely refuse to underwrite risks in areas particularly vulnerable to flood.
Non-life insurance penetration in Cambodia is 0.16% of GDP30 , making the market the second least developed of ASEAN markets after Myanmar. Catastrophe risk insurance penetration is extremely low as a result, and is reduced further by the fact that catastrophic perils are not included in standard policies.
Entities operating in the market
The insurance market in Cambodia was established in 1992 with the creation of the state-owned Cambodian National Insurance Company (Caminco). It is therefore at a very early stage of development.
As of 2010, Caminco had been part privatized with the state retaining 25% and Cambodian investors accounting for the remaining 75%. Five other non-life insurers are currently operating in the country, the majority of which have some foreign ownership. These include two bank subsidiaries (Campubank LonPac Insurance of Cambodia Public Bank, Cambodia Viet Nam Insurance of the Bank for Investment and Development of Cambodia) with links to Malaysia and Viet Nam respectively and Asia Insurance (Cambodia) which is a member of Singapore-based Asia Insurance Group.
A pool is in place for energy risks, administered by local insurer Forte.
28
AXCO Insurance Market Reports, National Insurance Company Berhad, Brunei Darussalam. 2009 Annual Report 29
Cambodia Royal Government, 2010. Post-Ketsana Disaster Needs Assessment 30
AXCO Insurance Market Reports

82
Box A4.3. Cambodia Reinsurance Market31
Pricing
Advisory tariffs are in place for fire and additional perils. These include a surcharge for risks in flood zones, that varies by construction class. Competitive pressure in the market has led to insurers pricing outside of this guidance.
Distribution
Non-life insurance is principally distributed by insurers’ agents or through direct in-branch sales. Bancassurance is not a feature of the market, although Campubank LonPac uses its bank network for distribution.
In 2010 Poe-Ma became the first authorized broker in Cambodia. International brokers play a role in risk placement into the international markets, notably for facultative business.
Indonesia PCRI market profile
Cover availability
Indonesia is principally exposed to the catastrophic perils of earthquake and flood, but penetration of catastrophe risk cover is extremely low for all but large commercial and industrial risks. Although coverage for these perils is available under homeowner policies, non-life insurance penetration for homeowners is reported to be extremely low. Smaller commercial and industrial risks tend to have coverage for fire only as industrial all-risks policies covering catastrophic risk are prevalent only for larger facilities. Cover for catastrophic perils is not mandatory.
One estimate indicates that less than 2% of insured properties have earthquake cover in place32.
Ministry of Finance estimates indicate that typically between 1% and 5% of total damages attributable to natural disasters are covered by insurance (see figure A5.1), although higher estimates have been
31
Kingdom of Cambodia, Royal Government, 2001. Sub-Decree on Insurance. Phnom Penh, October 32
PT Maipark, reported by General Insurance Association of Indonesia
Reinsurance Market Only one reinsurer operates in Cambodia – Cambodia Re. The company is owned 80% by the state
and 20% by Asia Insurance Group (Asia International Holdings). Insurers are required by Insurance
Law to cede 20% of their risks to Cambodia Re although in practice, those companies with overseas
connections will reinsure overseas and bypass this mandate. Risk flows freely into the international
reinsurance market, with companies such as Swiss Re holding a significant component of total
reinsurance premium from the country. Reinsurance is not routinely purchased on the basis of
catastrophe risk accumulations as these are not tracked by insurers.

83
released by the private sector for the devastating Aceh tsunami 33. This low coverage is driven by low
insurance penetration for more general property cover in the country (estimates for non-life insurance penetration range from 0.4 – 0.6% of GDP compared to Thailand, Singapore and Malaysia all with penetration >1% of GDP).
Figure A4.1 Ministry of Finance insured losses as a % of total damage
Fitch Ratings anticipates that property earthquake insurance linked to mortgages will be a key driver of future growth in this market.
Box A4.4. Indonesia Takaful Market34
Entities operating in the market
AXCO reports a total of 82 insurers and reinsurers active in the non-life market in 2009, with an expectation of consolidation throughout 2011/2012 due to the 30 Dec 2010 deadline for all insurers to
33
RMS estimates just over 10% of total economic losses were insured for the Aceh disaster 34
Sources include Ernst and Young World Takaful Report 2011, Mohamed, Hafiz (2006) Middle East Insurance Review, Ortoritas Jasa Keuangan (Indonesian insurance regulator) http://www.depkeu.go.id/Ind/.
Indonesia Takaful Market
0.05% GDP
Although takaful penetration lags significantly behind Malaysia at 0.05% of GDP in 2009 (for life and
non-life), growth has been strong, with a growth rate of 70% reported for 2009. With the current low
level of penetration and the largest muslim population in the world, the market is likely to increase
significantly in the near term.
The takaful market is fragmented, with few dedicated operators (3 in 2008) but more than 30
conventional insurers offering takaful products through takaful windows.

84
reach the new higher minimum threshold for paid-up capital. As of 2008, the five largest property insurers held just under 50%35 of the market between them.
State insurers and reinsurers hold a significant part of the market for non-life insurance: state-owned PT Asuransi Jasa Indonesia held the second largest market share for non-life insurance after Sinar Mas Group in 2008, whilst state-owned Reasuransi Internasional Indonesia is the largest local non-life reinsurer in Indonesia. However, it is anticipated that Jasa Indonesia will not be state-owned for much longer: as part of a broader program of privatization of government-owned companies, the government has given the go-ahead for an IPO for the company in 2011. At present, Jasa Indonesia is understood to be the largest insurer of government property.
The Indonesian marketplace for non-life insurance is characterized by international joint ventures through which large international players have a presence in the local market, and the presence of large business/banking organizations with insurance units, operating cross-sector.
Specialist reinsurer Maipark was established by the government as a joint undertaking of all general insurance and reinsurance companies in Indonesia in 200336, in an attempt to improve cooperation in insurance of special risks. By order of the Ministry of Finance, all general insurers and reinsurers licensed to operate in Indonesia are required to become shareholders of Maipark. The mandate of the company is to: i) promote discipline and proper handling of earthquake insurance; ii) set a benchmark for earthquake insurance pricing; iii) develop a hazard and exposure database for earthquakes; and, iv) build local capacity for earthquake resilience.
Box A4.5. Indonesia Reinsurance Market37
Pricing
Compulsory tariffs are in place for earthquake risk that vary by zone, construction class and occupancy type (residential, commercial, industrial) to take account of differing levels of risk. There are no compulsory tariffs for flood risk and technical rates are rarely used. Underwriters use flood mapping and loss histories to inform pricing and control exposure to flood through the application of peril-specific deductibles, and will refuse to offer cover in areas considered particularly vulnerable.
Distribution
35
AXCO 36
Originally established as the Indonesian Earthquake Reinsurance Pool, transformed into public liability company Maipark in 2004 37
Multiple sources. including AM Best South East Asia Review, PT Maipark (www.maipark.com)
Reinsurance Market
Reinsurance is placed in both the domestic and international markets, with compulsory cessions
playing an important role in forming the reinsurance landscape. To promote national retention
capacity, all non-life insurance companies must make an obligatory cession of 2.5% of total sum
insured (but not exceeding $500k) to Reasuransi Internasional Indonesia through a pooling
arrangement. In addition, all domestic companies writing earthquake risk must cede a portion ranging
between 5 and 25% depending on risk location, to specialist reinsurer Maipark.

85
Distribution of non-life insurance occurs through various channels, including: agents, brokers (principally overseas reinsurance placement and large risks) and direct placement. The emergence of telemarketing as a sales method has been reported for insurance in general38, although this is not believed to account for a significant amount of business.
Informal-sector networks hold significant promise for the distribution of catastrophe risk insurance to low-income segments of the population – notably Arisans. Arisans are informal systems used by small numbers of people to pool financial resources. Small, regular payments are made by members and large cash payments are released either in times of particular need, or through a lottery system. Arisans are currently used principally as saving mechanisms and for health or life insurance, but may have potential as catastrophe risk insurance distribution channels.
Lao PDR PCRI market profile
Cover availability
Flood is the principal catastrophic risk in Lao PDR, although typhoon risk is present to a lesser degree.
Cover for wind damage is widely available as part of standard packages. Flood cover is available subject to higher premium as part of homeowners and SME packages. Cover is also available under all risks policies for commercial and industrial risks subject to surveys.
The level of catastrophe risk insurance penetration is thought to be low, limited by the relatively low level of non-life insurance penetration more broadly. Lao PDR has the 4th lowest non-life insurance penetration as % of GDP among ASEAN members, and is ranked lower still when premium per capita is examined.
Entities operating in the market
Prior to 2008, Assurances Generales du Laos (AGL) held a monopoly over the market. The company began as a venture jointly owned by the state (20% by the ministry of finance) and French insurer AGF (80%). The company’s ownership structure changed in 2000 with the state increasing its stake to 49%, the remaining 51% held by AGF (now effectively Allianz AG, following the company’s takeover of AGF in 2007).
Five non-life insurers have entered the market since 2008 although AGL still holds an estimated 80%39. Foreign ownership remains a market feature with new entrants stengthening links to Malaysia and Viet Nam. Of the recent entrants, Lao-Viet Insurance (LVI) and Tokojaya Assurance have made the most progress in increasing their market shares. The three newest entrants include international Japanese insurer Mitsui Sumitomo Insurance Group.
38
Deloitte, Alternative Insurance Distribution Models in Asia Pacific 39
2010, AXCO Insurance Market Reports
86
Box A4.6. Lao PDR Reinsurance Market
Pricing
Little information is available on pricing, although given the market structure, limited competition has ensured that downwards pressure on rates has not been as strong as for other ASEAN Member States.
Distribution
Agents have dominated sales in the burgeoning homeowners insurance market. However, new market entrants are seeking partnerships with banks for distribution and the growing mortgage market is expected to channel more premium through bank networks.
International brokers are involved in the placement of reinsurance and large industrial and commercial risks into the international markets.
Malaysia PCRI market profile
Cover availability
Malaysia is one of the most developed ASEAN markets for non-life insurance, with estimates of market penetration as high as 1.6% of GDP40. Flood is the major catastrophic peril in the country; risk from earthquakes and typhoons is considered relatively low. Coverage for flood is typically as an extension to a fire policy with an additional flood-specific component of premium associated. However, where individuals opt for a homeowner’s insurance package over fire coverage, flood coverage will be included as standard.
Following the devastating 2007 flood, awareness of flood risk has increased, and reports indicate that an increasing number of insurance policies are being extended to include flood cover. Local sources estimate total flood insurance penetration at 5% across all properties41. Although a split between residential and non-residential is not available, reports indicate that penetration is high for large commercial and industrial risks. It should be noted that flood insurance is not compulsory, although banks require that all borrowers have insurance in place with the scope of required cover varying bank to bank.
40
Source World Bank 41
Principal source AXCO Insurance Market Reports, supported by additional sources
Reinsurance Market There is no domestic reinsurance market and risk sharing between domestic companies is non-
existent largely due to the market structure. International reinsurers provide capacity for risk in Laos,
but have no direct presence in the domestic market.

87
Box A4.7. Malaysia Takaful Market42
Entities operating in the market
Malaysia’s non-life insurance market has been one of the more fragmented amongst ASEAN Member States, but a recent trend of consolidation is changing the competitive landscape. Prior to this trend, the number of general insurance companies operating remained relatively stable at around 30 (24 general insurers, 6 composite43), with the top 5 property insurers holding about 40% of the market between them and no clear market leader44.
However, the past 24 months have seen a number of mergers and acquisitions prompted by new risk-based capital requirements and further liberalization of the market by the country’s regulator. Foreign insurers in particular, have taken advantage of regulatory conditions to increase their presence; Mitsui Sumitomo Insurance Group (MSIG) recently acquired Hong Leong’s general insurance business and international players AXA and ACE have both recently acquired large stakes in local insurers.
Foreign-owned insurance companies have had a strong presence in the Malaysian non-life insurance market for a number of years, and hold an estimated 45%45 market share between them. Their share of the market is larger still in the property segment; at present the two largest property insurers in the country are foreign-owned Allianz and MSIG46.
The recent trend of consolidation has been prompted by two key factors. In April of 2009 the country’s insurance regulator Bank Negara Malaysia (BNM) continued its program of market liberalization by increasing the permitted threshold for foreign equity participation in insurance companies and takaful operators to 70%47. Additionally, the 2009 implementation of new risk-based capital requirements has presented opportunities for foreign insurers to increase their footprint; domestic insurers have struggled to meet capital and operational requirements, opening opportunities for mergers and acquisitions.
42
Sources include Ernst and Young World Takaful Report 2011, Mohamed, Hafiz (2006) Middle East Insurance Review, Malaysian Takaful Association http://www.malaysiantakaful.com.my/, Malaysian Re Evolution Of Reinsurance & Retakaful Industry 43
BNM insurance statistics 2010 44
AXCO 2008 data 45
AXCO – does not reflect changes from most recent mergers and acquisitions 46
BNM insurance statistics, considering MSIG recent acquisition of Hong Leong’s general insurance business 47
Herbert Smith Southeast Asia insurance market e-bulletin November 2010
Malaysia Takaful Market
0.60% GDP Malaysia is one of the largest takaful markets globally, despite non-life takaful premiums only
accounting for 7% of the non-life market in 2009. This share is set to increase; Malaysian takaful is
growing significantly faster than the rest of the insurance market with a rate of 30% in 2009.
The number of takaful operators in Malaysia is also growing, and international (re)insurers are looking
for entry opportunities, with recent entrants including HSBC and Tokio Marine. 12 takaful and
retakaful operators are registered with the Malaysian Takaful Association.

88
The Labuan international offshore financial centre (LIOFC) has attracted a large number of international insurance and reinsurance companies to Malaysia. The more liberal tax and regulatory requirements on the island have encouraged international companies to use the LIOFC as a base for business in the region.
Box A4.8. Malaysia Reinsurance Market48
Pricing
Malaysia operates a compulsory insurance tariff regime for lines of business including property, to prevent excessive competition in the market driving rates down to an unsustainable level. Pricing for catastrophe risk cover is controlled through the application of minimum rates for homeowner insurance packages (varying by construction type) and industrial and commercial all perils policies. Additional premium applied for catastrophe risk extensions is specified on a peril basis.
There is more flexibility in pricing for large commercial and industrial risks where sums insured exceed a threshold of approximately M$300mn under the "Large & Specialised Risks" category. These risks are not subject to compulsory tariffs and pricing is market based under the "Large & Specialised Risks" scheme where (depending on the size of the risk) a technical rating committee (chaired by Malaysian Re) may be utilized to determine appropriate rating.
Distribution
At present, agents are the principal distributers of homeowners insurance although reports indicate that banks are becoming increasingly important as distribution channels - due the growth of bancassurance. Brokers dominate the commercial and industrial segment of the insurance market, and also the placement of reinsurance. A number of large international brokers operate in Malaysia including Aon Benfield, Guy Carpenter and Willis Re.
48
Sources AXCO, Bank Negara Malaysia and others
Reinsurance Market
The majority of reinsurance in Malaysia is transacted within the domestic market (only 24% of
reinsurance premiums were ceded abroad in 2008). Malaysian Re is the market leader holding an
estimated 60% market share in 2008. The company’s dominance is due to a system of ‘voluntary
cession’ put in place by Bank Negara Malaysia to try and prevent overseas outflow of reinsurance
premiums. Under the voluntary cession rules, between 5% and 15% of facultative and treaty
programs must be ceded to Malaysian Re, with the percentage varying according to underlying risks
and program structure. Although Malaysian Re was established by the government, today it is a listed
company counting many of the country’s large domestic insurers among its top shareholders.
Domestic branches of foreign reinsurers also account for a large share of the non-life reinsurance
market. Swiss Re, Munich Re and Hannover Re all absorb a significant share of reinsurance premiums
in the country.
The Labuan international offshore financial centre (LIOFC) is also a source of reinsurance capacity for
the domestic property insurance market.
89
At present, direct sales of insurance do not constitute a significant part of the market. However, Bank Negara Malaysia is encouraging direct sales through its implementation of a program of premium rebates for consumers who purchase insurance directly (via walk-ins, the internet, direct mailing or telemarketing). The program targets personal lines business, and allows insurers to determine the level of rebate for homeowners (rebate levels for motor cover are prescribed by the bank)49.
Myanmar PCRI market profile
Cover availability
Myanmar is exposed to multiple catastrophic perils including earthquakes, cyclones and flood. The country has the least developed insurance market amongst the ASEAN Member States – non-life insurance penetration is 0.04% of GDP50. Cover is available for all perils from the sole insurer operating in the country – government owned Myanma Insurance - and is provided as an extension to a fire policy. However, take-up is low, particularly for residential lines. Total premium income in the non-life insurance market in 2007 was less than $7mn – with insurance of business and government interests accounting for the vast majority of this. The purchase of catastrophe risk insurance is not compulsory.
In 2008 the country was impacted by the worst natural disaster in its recorded history; cyclone Nargis. The storm caused severe losses to more than 2 million people, and at least 800,00051 homes were destroyed or severely damaged. Reports indicate that very few homes were insured, and Myanma Insurance reported that only 360 factories (state-owned and private) were insured.
Entities operating in the market
State owned Myanma Insurance has a monopoly over all insurance and reinsurance business in Myanmar. By law, insurance must be purchased from a Myanmar licensed entity and Myanma Insurance is the only company licensed to sell insurance in the country.
For some specialized lines of business, Myanma does not have the technical or financial capacity to provide insurance. In these cases, the risk is passed onto the international markets through a fronting arrangement where Myanma issues the policy and cedes all the risk onto international (re)insurers. Commercial and government assets in Myanmar are known to be insured in this way.
The number of international (re)insurers providing cover for interests in Myanmar is limited by financial sanctions passed by the US and Canada; these prohibit US and Canadian firms from providing insurance services to the country. A number of firms not subject to the sanctions have voluntarily ceased business activities in Myanmar in recent years.
49
Source Bank Negara Malaysia notice ref No: 04/07/05 50
AXCO Insurance Market Reports 51
Post Nargis Recovery and Preparedness Plan

90
Box A4.9. Myanmar Reinsurance Market
Pricing
Little information is available on pricing. No system of mandatory tariffs is in place.
Due to the market structure, limited competition has ensured that downwards pressure on rates has not been as strong as for other ASEAN Member States.
Distribution
Myanma uses a network of 38 branches and more than 2000 agents to distribute policies. No brokers are operating in the domestic market52.
A number of international brokers and (re)insurers were engaged in the provision of insurance and reinsurance for government and business assets in Myanmar, but many ceased all business activities in the country following the sanctions imposed by the US and Canada.
Philippines PCRI market profile
Cover availability
Property catastrophe risk cover is available through a number of policy options for residential, commercial and industrial risks in the Philippines, including as an extension to a standard fire policy. Cover is not mandatory, and requires additional premium from insureds. The country is exposed to earthquakes and other geological perils, floods and typhoons; cover is available for all these perils. Cover for losses as a result of volcanic eruption is widely available for industrial risks, and becoming an increasing feature of residential and commercial property cover.
Sources diverge in their estimates of catastrophe risk insurance penetration, with estimates ranging between 20 and 80%53 for the proportion of fire policies being extended to cover catastrophic risk. Incidences of inclusion of catastrophic risk are reported to be highest for commercial and industrial policies. Cover for catastrophic risk is limited by the relatively low non-life insurance penetration in the country, estimated at around 0.4% of GDP54. The country’s insurance and reinsurance association PIRA
52
AXCO Insurance Market Reports 53
Source Guy Carpenter. Note that a range of estimates exist - AXCO estimates that 20% of policies in 2009 were extended for earthquake/typhoon. Figures for flood unavailable. 54
AXCO and Swiss Re Sigma estimates for 2009 insurance penetration are approximately 0.4% of GDP
Reinsurance Market Myanma Insurance is known to purchase reinsurance on the international markets. There is no
domestic reinsurance market due to the existing insurance monopoly.

91
has noted an increase in uptake of catastrophic cover for typhoon and flood, through an increase in premium for fire and allied perils (5%). This is due in part to an increase in risk awareness following 2009 typhoons (Ondoy/Ketsana, Pepeng/Parma), but in addition, PIRA has reported a move by lending institutions post-2009, to make the purchase of catastrophe risk insurance mandatory for home loans. A standard fire policy is already compulsory for borrowing.
Entities operating in the market
More than 80 companies are registered as writing non-life business in the country, with the top five companies holding around 44% of the market between them, measured as % of net premiums written55.
However, consolidation in the market has been reported as a result of the Insurance Commission’s staggered program of minimum paid-up capital increases across all companies which will continue through 2011. More consolidation may occur as the implementation of higher minimum capital base thresholds through 2012-2015 pushes more companies to merge, seek buyers or cease operations. Malayan insurance and Prudential Guarantee Assurance are the market leaders with an estimated 14% and 10% respectively of the non-life market in 201056.
Only one state-owned entity underwrites property catastrophe risk: the Government Service Insurance System’s general insurance unit GI-GSIS. This unit writes non-life cover for government property. The National Reinsurance Corporation is not a state-owned institution although it counts the GSIS among its stockholders.
There are two pools operating in the country, one for machinery and engineering risks and one for agricultural risks. A proposal for a catastrophe risk insurance pool is being considered by the National Disaster Risk Reduction and Management Council and the Department of Finance and has gained support from industry players including the National Reinsurance Corporation.
Box A4.10. Philippines Reinsurance Market57
Pricing
Some areas are considered uninsurable due to high risk – for example, properties built within close proximity of the West Valley fault exposed to a high level of seismic risk. There have been concerns in recent years that excessive competition within the market has driven premiums for catastrophic risk down to an unsustainable level. The Insurance Commission has responded by mandating minimum rates 55
2010, Insurance Commission Non-Life Insurance Company Rankings (net premiums) 56
2010, Insurance Commission Non-Life Insurance Company Rankings (net premiums) 57
Sources include AM Best - A.M. Best Reaffirms Ratings of National Reinsurance Corporation of the Philippines
Reinsurance Market Reinsurance is placed in both domestic and international markets, including with the major
international reinsurers. For treaty reinsurance, a minimum amount of 10% of the risk being ceded
must first be offered to the National Reinsurance Corporation - which is the country’s only domestic
reinsurer – before being taken to the international reinsurance markets. Compliance with this
requirement is not universal, particularly among the smaller companies.
Additionally, risk to be ceded through facultative contracts must first be refused by at least five
domestic insurers (and the National Reinsurance Corp) before being offered to international markets.

92
of 0.05% of total sums insured for typhoon and flood, and 0.10% for Earthquake. Reports indicate that the regulator has not been able to fully enforce these mandatory tariffs.
Distribution
Intermediaries dominate distribution of non-life business, with direct placement accounting for only an estimated 30% of total business58. The remaining 70% is split between brokers and agents, with agents playing an important role in originating personal lines business, and the brokers dominating commercial and industrial risk placement. Banks are becoming increasingly important as conduits for the distribution of non-life insurance, while the internet is not yet a significant channel for insurance sales.
Agents already have a strong presence in small communities outside of Manila, and the Insurance Commission hopes to strengthen their reach further by means of a recent order relaxing licensing rules for agents distributing microinsurance products.
Singapore PCRI market profile
Cover availability
Among the ASEAN Member States Singapore is one of the least exposed to catastrophe risk. Historically, seismic and windstorm risk have been low, and whilst catastrophic flood risk is present it has significantly reduced over the past 30 years as a result of physical mitigation measures.
Catastrophe risk insurance, including flood cover, is available as an extension to standard fire insurance and as part of package policies for residential, commercial and industrial lines. Often it is given at no premium charge.
Singapore is the most mature of the ASEAN non-life insurance markets, and the most developed as measured by premiums per capita. The mortgage market has been a significant driver of property insurance penetration; around 90%59 of households own their homes, and lenders require that borrowers have comprehensive buildings cover in place as a condition of lending. Almost all policies are extended to include catastrophe risk, or include it automatically as part of a package – an estimated 95% of property policies cover flood risk.
Entities operating in the market
Singapore is used as a hub by international insurers and reinsurers for access to Asian markets; the large inflow of premiums from other Asian countries sets Singapore apart from the other ASEAN non-life insurance markets.
Insurance law was amended in 2000 to remove the 49% restriction on foreign ownership of insurers operating in Singapore. Since then, foreign companies have come to dominate both the insurance and
58
Source AXCO. Motor business excluded. 59
Department of Statistics Singapore

93
reinsurance market; the establishment of the Lloyd’s Asia platform in 2000 has brought 21 syndicates to Singapore60 and around the majority of companies operating in the non-life market are foreign-owned.
The non-life insurance market is competitive and fragmented with 45 direct general and 6 composite insurers registered to write business as of August 2011. A further 61 captive insurers provide exclusive insurance services to businesses. NTUC Income (a composite insurer) is the largest non-life insurer in Singapore.
Insurance for government assets is not restricted to domestic companies, but is open to all companies operating in the Singapore insurance market on a competitive basis.
Significant changes in the structure of the market are not expected, given its maturity.
Box A4.11. Singapore Reinsurance Market61
Pricing
Competitive pressures have reportedly driven prices down in recent years – there are no mandatory tariffs. Reports indicate that reinsurers started to review price adequacy of primary insurers after 2007 Sumatran earthquakes were felt in Singapore, however no measures have been taken to increase rating.
Distribution
A range of distribution methods are used for non-life insurance in Singapore. Agents, brokers, bank networks and direct sales all play an important role. Bank networks dominate the distribution of homeowners insurance, while agents are particularly active for other personal lines and smaller commercial risks. Large risks and reinsurance programs are typically placed by brokers.
The internet is being used as a distribution channel for personal lines insurance, including homeowners cover, but does not as yet account for a significant amount of premium.
Properties developed by the Singapore Housing Development Board have over recent years been insured through an exclusive tie-up with ETIQA insurance, a wholly owned subsidiary of a Malaysian financial services group.
60
Lloyd’s of London www.lloyds.com - note that the number of syndicates is as published by Lloyd’s, correct at time of drafting. This number is likely to change. 61
Monetary Authority of Singapore
Reinsurance Market 25 professional reinsurers are registered to write non-life insurance in Singapore, comprising 16
general and 9 composite reinsurers. A further 4 authorized reinsurers write non-life business without
a physical presence in the market, comprising 3 general and one composite reinsurer. The vast
majority of premiums coming through the non-life reinsurance market are for territories outside of
Singapore – the offshore market accounted for almost 90% of reinsurance premiums in 2008.

94
Thailand PCRI market profile
Cover availability
Thailand is among the more developed non-life insurance markets in the ASEAN region, with a penetration rate of 1.1%62 of GDP. However, penetration is largely attributable to motor insurance rather than those lines of business through which property catastrophe risk is covered. For example, one estimate indicates that only 8%63 of homes have any household insurance in the country.
Take-up of catastrophe risk insurance is thought to be low due to both lack of awareness of insurance and the perceived low level of risk. The country is subject to both geological and meteorological perils, with flood posing the largest catastrophic risk – earthquake and windstorm risk are present but relatively low. Following the devastating 2004 tsunami that impacted the country, insurance payouts accounted for a significant portion of the total damage (numbers as high as $500mn64 were released as insured loss estimates). This was however, due to the concentration of damage within tourist resorts which will typically have insurance cover and does not reflect the low insurance penetration for catastrophe risk which is seen throughout the residential and small business sector.
Cover is provided through industrial all risks policies and fire and allied perils policies - with an estimated 10%65 (or fewer) policies including cover for catastrophic perils. Although figures are not available for flood, as this peril is underwritten more selectively, take-up is likely lower than for wind and earthquake. The low level of homeowners’ insurance penetration is a limiting factor in the uptake of catastrophic risk insurance.
There is a Takaful market in Thailand, but it is growing at a slower pace than in Indonesia and Malaysia. Penetration in 2009 was an estimated 0.01%66 of GDP despite Thailand’s relatively high insurance penetration amongst the ASEAN Member States.
Entities operating in the market
The Thai market for non-life insurance is fragmented, with more than 70 general insurers listed by the Office of the Insurance Commission and the top 5 accounting for less than 40% of the market.
A number of international insurers have a market presence through joint ventures with local investors and local branches. Domestic banks also have a strong presence through equity participation in leading insurers, and distribution deals with insurers – banking distribution networks dominate sales of homeowners insurance. Family-controlled businesses are also a feature of the non-life insurance market in Thailand.
For property insurance, Bangkok Insurance – which counts Bangkok Bank as a major shareholder - leads the market. There is no state-owned insurer in Thailand, although the government and the crown retain
62
World Bank 63
AXCO Insurance Market Reports 64
Risk Management Solutions 65
AXCO Insurance Market Reports 66
Ernst and Young World Takaful report 2011
95
large shares in two insurers; Deves and Dhipaya. Dhipaya was formerly state-owned, and remains the principal insurer for government assets.
Ownership changes are anticipated with the introduction of the new Risk Based Capital (RBC) regime and 2008 amendments to the Non-Life Insurance Act that increased permitted foreign equity from 25% to 49%. Reports indicate that a number of non-life insurers will not be able to comply with the new capital requirements and must therefore cease operations or adjust their ownership structure to allow for capital injections. Consolidation through mergers is a possibility. However, a number of sources indicate that changes in ownership will be a more popular option, as larger companies may be reluctant to absorb their smaller, undercapitalized peers.
Box A4.12. Thailand Reinsurance Market67
Pricing
A system of advisory tariffs is in place for Fire and Allied Perils policies from the Office of the Insurance Commission, but in practice, companies do not always follow guidelines due to the competitive environment. Insurers are usually very selective when it comes to offering flood insurance cover under Fire and Allied Peril policies.
Competition in the commercial and industrial risks market segment has driven prices down, and there are concerns around rate adequacy given that flood risk is included in the all risks package with no peril-specific component of premium added. Underwriters control exposure to flood through peril-specific deductibles, and some underwrite selectively – refusing to insure properties in high risk areas.
Distribution
Distribution through banks is a growing feature of the non-life insurance market, and is already a major mode of sales for homeowners insurance. Agents are playing a decreasingly important role, whilst direct
67
Sources - Thai Re Annual Report 2010, AXCO Insurance Market Reports and others
Reinsurance Market Thailand has two domestic reinsurers (Thai Re and Asian Re), and reinsurance is routinely placed in
the international markets. Thai Re was established in 1978 as a common industry entity to build
technical and financial capacity in reinsurance in Thailand. It is no longer 100% owned by the
insurance industry, but still counts four insurers among its top 10 shareholders.
Various voluntary cession agreements and retention regulations exist to promote retention of risk in-
country. These include an agreement that insurers will cede 5% of direct business for most classes of
risk to Thai Re through quota share agreements. The company retains around 35% of this risk and
retrocedes the rest back to participating members. Despite efforts to keep premium ‘onshore’, more
than two thirds of reinsurance premium for non-life business was passed through the international
market in 2006.
The Thailand Fire Pool agreement had in addition, directed 10% of all fire and industrial all risk
policies (with sums insured in excess of 30mn Baht) from participating insurers to Thai Re. However,
this arrangement was discontinued at the start of 2010 due to poor performance.
96
sales make up a small part of the total. Brokers – and agents to a lesser extent - play a significant role in the placement of commercial and industrial risks. The internet shows promise as a direct sales route, with companies offering services such as quotes online – but has yet to develop into a distribution channel.
The Thai reinsurance market is characterized by a trend for direct placement between companies, although international brokers have a strong presence in the country and will be used for large/complex program placements.
Viet Nam PCRI market profile
Cover availability
Viet Nam is exposed to catastrophic flood and typhoon risk; these two perils accounted for 95% of total damage in the country from 1989-200868. Flood mainly affects North and South. Typhoon exposure is limited to Central Viet Nam. Risk from earthquake is relatively low.
Cover for these perils is typically provided through extensions to fire policies and as an automatic inclusion for industrial all risks policies. Most standard insurance policies are extended to cover flood and windstorm, however property catastrophe insurance penetration is limited by lack of development in the homeowners insurance market. Non-life insurance penetration in Viet Nam was an estimated 0.74%69 in 2010 putting the country fourth among ASEAN members, however the market is dominated by motor insurance with standard property cover (through fire and all risks policies) accounting for less than 10%70.
Entities operating in the market
The Viet Namese non-life insurance market has seen both rapid growth and extensive liberalization in recent years; 25% or higher compound annual growth has been predicted for the non-life sector over the next 3 years. State control of the market decreased significantly with part-privatization of former state-owned insurers Bao Viet, PetroViet Nam Insurance, Bao Minh and BIDV Insurance Company from 2003-2011.
The market is among the least fragmented of ASEAN non-life insurance markets due to the dominant role of state-owned enterprises prior to the recent program of liberalization. The top five non-life insurers hold more than 70% of the market between them, and less than 30 general insurers operate in the country in total. However, this is changing rapidly with small players taking market share from their larger peers and an increasing presence in the market from international insurers and financial service providers.
A number of 100% foreign-owned non-life insurers operate in Viet Nam. The country saw an influx of 100% foreign ventures in 2009 following 200871 legislation that removed operating restrictions on
68
World Bank analysis of CCFSC damage data 69
Swiss Re Sigma 2009 70
2009 data, AXCO 71
Legislation brought into force as a result of WTO commitments
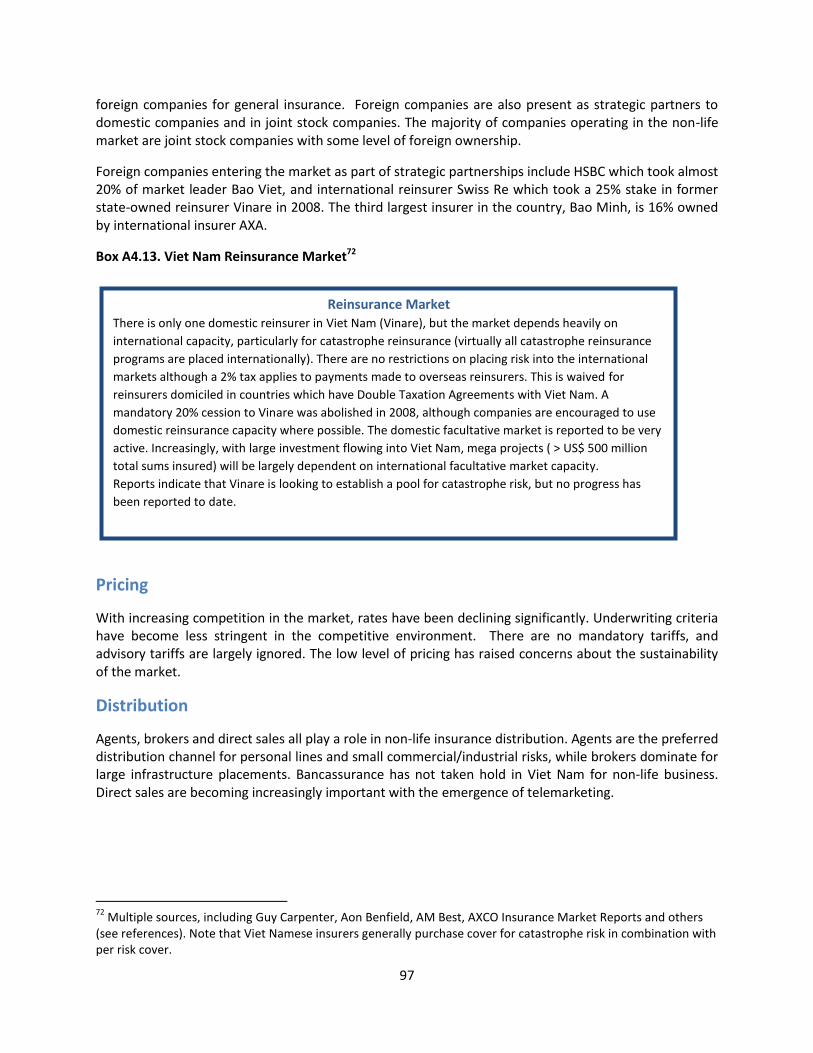
97
foreign companies for general insurance. Foreign companies are also present as strategic partners to domestic companies and in joint stock companies. The majority of companies operating in the non-life market are joint stock companies with some level of foreign ownership.
Foreign companies entering the market as part of strategic partnerships include HSBC which took almost 20% of market leader Bao Viet, and international reinsurer Swiss Re which took a 25% stake in former state-owned reinsurer Vinare in 2008. The third largest insurer in the country, Bao Minh, is 16% owned by international insurer AXA.
Box A4.13. Viet Nam Reinsurance Market72
Pricing
With increasing competition in the market, rates have been declining significantly. Underwriting criteria have become less stringent in the competitive environment. There are no mandatory tariffs, and advisory tariffs are largely ignored. The low level of pricing has raised concerns about the sustainability of the market.
Distribution
Agents, brokers and direct sales all play a role in non-life insurance distribution. Agents are the preferred distribution channel for personal lines and small commercial/industrial risks, while brokers dominate for large infrastructure placements. Bancassurance has not taken hold in Viet Nam for non-life business. Direct sales are becoming increasingly important with the emergence of telemarketing.
72
Multiple sources, including Guy Carpenter, Aon Benfield, AM Best, AXCO Insurance Market Reports and others (see references). Note that Viet Namese insurers generally purchase cover for catastrophe risk in combination with per risk cover.
Reinsurance Market There is only one domestic reinsurer in Viet Nam (Vinare), but the market depends heavily on
international capacity, particularly for catastrophe reinsurance (virtually all catastrophe reinsurance
programs are placed internationally). There are no restrictions on placing risk into the international
markets although a 2% tax applies to payments made to overseas reinsurers. This is waived for
reinsurers domiciled in countries which have Double Taxation Agreements with Viet Nam. A
mandatory 20% cession to Vinare was abolished in 2008, although companies are encouraged to use
domestic reinsurance capacity where possible. The domestic facultative market is reported to be very
active. Increasingly, with large investment flowing into Viet Nam, mega projects ( > US$ 500 million
total sums insured) will be largely dependent on international facultative market capacity.
Reports indicate that Vinare is looking to establish a pool for catastrophe risk, but no progress has
been reported to date.

98
Insurance Regulation for Catastrophe Risk in ASEAN Member States
Prudent regulation of insurers is of particular importance for catastrophe risk. This is because insurers exposed to catastrophe risk can incur large correlated losses across a portfolio, and higher volatility in claims. Regulators therefore face a particular challenge with respect to insurers exposed to catastrophe risk: defining an adequate capital buffer such that obligations to policyholders are met in the event of high volume of claims, whilst being consistent with a competitive industry.
Regulation in the region has been evolving over recent years, with more countries working towards frameworks of supervision that determine capital requirements based on some measure of the level of risk assumed by the insurer. Setting solvency capital requirements with reference to individual companies’ portfolios of risk is prudent and creates a more enabling environment under which insurers have the space to grow in a sustainable fashion. Also, in the Philippines, the insurance and reinsurance association PIRA has been lobbying to allow use of the ‘risk-based capital’ requirement without reference to the fixed minimum capital base requirement also in place. They argue that allowing use of the RBC framework will allow small insurance companies with a lower appetite for risk to exist alongside their larger peers.
Box A4.14. Minimum Capital and Microinsurance
Minimum Capital and Microinsurance
Regulators need to consider how fixed minimum capital requirements may impact the development of microinsurance markets given that operators of a different profile to the large traditional insurers that dominate the wider insurance market play an important role (such as mutual benefit associations in Philippines). The Philippines Insurance Commission has dealt with this issue through specific regulatory provisions for mutual benefit associations offering microinsurance, that lower fixed minimum capital requirements (see Annex 8).
Box A4.15. Shariah-Compliant Insurance
Shariah-Compliant Insurance
Those ASEAN Member States with large Muslim populations (principally Malaysia, Indonesia, Brunei) face the additional challenge of regulating the Takaful (Shariah-compliant insurance) market.
As liabilities under Takaful systems are defined differently than those under traditional insurance, and permitted assets for investment are also different, regulators will need to develop principles of supervision for Takaful operators in parallel to those developed for the traditional insurance market.
The risk sharing nature of Takaful insurance poses a particular challenge, where policyholders potentially share in any insufficiency of funds to cover claims payments. For example, to protect consumers in both Malaysia and Indonesia, regulators have formally introduced a requirement for Takaful operators to extend loans from the shareholders fund in the event of any deficit in funds to cover claims payments.
Malaysia has the most advanced regulatory framework for Takaful in the region, with the 2011 introduction of Takaful-specific RBC guidelines. The country has further promoted development of the Takaful sector through
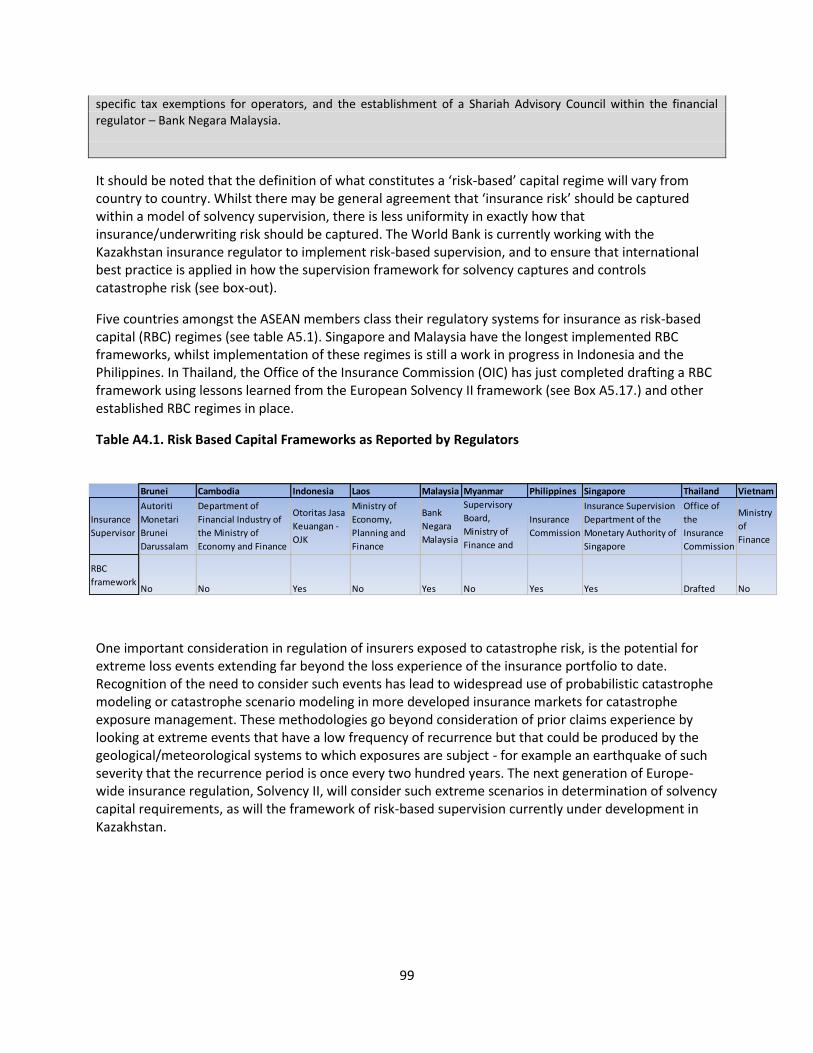
99
specific tax exemptions for operators, and the establishment of a Shariah Advisory Council within the financial regulator – Bank Negara Malaysia.
It should be noted that the definition of what constitutes a ‘risk-based’ capital regime will vary from country to country. Whilst there may be general agreement that ‘insurance risk’ should be captured within a model of solvency supervision, there is less uniformity in exactly how that insurance/underwriting risk should be captured. The World Bank is currently working with the Kazakhstan insurance regulator to implement risk-based supervision, and to ensure that international best practice is applied in how the supervision framework for solvency captures and controls catastrophe risk (see box-out).
Five countries amongst the ASEAN members class their regulatory systems for insurance as risk-based capital (RBC) regimes (see table A5.1). Singapore and Malaysia have the longest implemented RBC frameworks, whilst implementation of these regimes is still a work in progress in Indonesia and the Philippines. In Thailand, the Office of the Insurance Commission (OIC) has just completed drafting a RBC framework using lessons learned from the European Solvency II framework (see Box A5.17.) and other established RBC regimes in place.
Table A4.1. Risk Based Capital Frameworks as Reported by Regulators
One important consideration in regulation of insurers exposed to catastrophe risk, is the potential for extreme loss events extending far beyond the loss experience of the insurance portfolio to date. Recognition of the need to consider such events has lead to widespread use of probabilistic catastrophe modeling or catastrophe scenario modeling in more developed insurance markets for catastrophe exposure management. These methodologies go beyond consideration of prior claims experience by looking at extreme events that have a low frequency of recurrence but that could be produced by the geological/meteorological systems to which exposures are subject - for example an earthquake of such severity that the recurrence period is once every two hundred years. The next generation of Europe-wide insurance regulation, Solvency II, will consider such extreme scenarios in determination of solvency capital requirements, as will the framework of risk-based supervision currently under development in Kazakhstan.
Brunei Cambodia Indonesia Laos Malaysia Myanmar Philippines Singapore Thailand Vietnam
Insurance
Supervisor
Autoriti
Monetari
Brunei
Darussalam
Department of
Financial Industry of
the Ministry of
Economy and Finance
Otoritas Jasa
Keuangan -
OJK
Ministry of
Economy,
Planning and
Finance
Bank
Negara
Malaysia
Supervisory
Board,
Ministry of
Finance and
Revenue
Insurance
Commission
Insurance Supervision
Department of the
Monetary Authority of
Singapore
Office of
the
Insurance
Commission
Ministry
of
Finance
RBC
frameworkNo No Yes No Yes No Yes Yes Drafted No
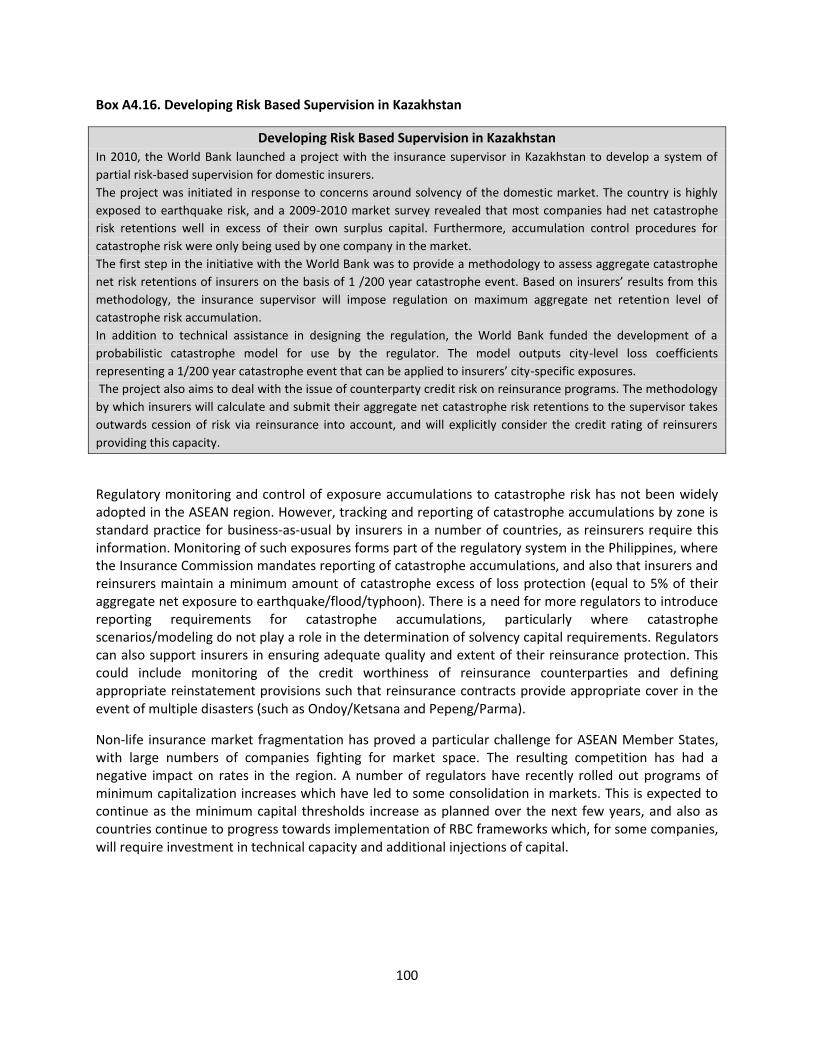
100
Box A4.16. Developing Risk Based Supervision in Kazakhstan
Developing Risk Based Supervision in Kazakhstan
In 2010, the World Bank launched a project with the insurance supervisor in Kazakhstan to develop a system of
partial risk-based supervision for domestic insurers.
The project was initiated in response to concerns around solvency of the domestic market. The country is highly
exposed to earthquake risk, and a 2009-2010 market survey revealed that most companies had net catastrophe
risk retentions well in excess of their own surplus capital. Furthermore, accumulation control procedures for
catastrophe risk were only being used by one company in the market.
The first step in the initiative with the World Bank was to provide a methodology to assess aggregate catastrophe
net risk retentions of insurers on the basis of 1 /200 year catastrophe event. Based on insurers’ results from this
methodology, the insurance supervisor will impose regulation on maximum aggregate net retention level of
catastrophe risk accumulation.
In addition to technical assistance in designing the regulation, the World Bank funded the development of a
probabilistic catastrophe model for use by the regulator. The model outputs city-level loss coefficients
representing a 1/200 year catastrophe event that can be applied to insurers’ city-specific exposures.
The project also aims to deal with the issue of counterparty credit risk on reinsurance programs. The methodology
by which insurers will calculate and submit their aggregate net catastrophe risk retentions to the supervisor takes
outwards cession of risk via reinsurance into account, and will explicitly consider the credit rating of reinsurers
providing this capacity.
Regulatory monitoring and control of exposure accumulations to catastrophe risk has not been widely adopted in the ASEAN region. However, tracking and reporting of catastrophe accumulations by zone is standard practice for business-as-usual by insurers in a number of countries, as reinsurers require this information. Monitoring of such exposures forms part of the regulatory system in the Philippines, where the Insurance Commission mandates reporting of catastrophe accumulations, and also that insurers and reinsurers maintain a minimum amount of catastrophe excess of loss protection (equal to 5% of their aggregate net exposure to earthquake/flood/typhoon). There is a need for more regulators to introduce reporting requirements for catastrophe accumulations, particularly where catastrophe scenarios/modeling do not play a role in the determination of solvency capital requirements. Regulators can also support insurers in ensuring adequate quality and extent of their reinsurance protection. This could include monitoring of the credit worthiness of reinsurance counterparties and defining appropriate reinstatement provisions such that reinsurance contracts provide appropriate cover in the event of multiple disasters (such as Ondoy/Ketsana and Pepeng/Parma).
Non-life insurance market fragmentation has proved a particular challenge for ASEAN Member States, with large numbers of companies fighting for market space. The resulting competition has had a negative impact on rates in the region. A number of regulators have recently rolled out programs of minimum capitalization increases which have led to some consolidation in markets. This is expected to continue as the minimum capital thresholds increase as planned over the next few years, and also as countries continue to progress towards implementation of RBC frameworks which, for some companies, will require investment in technical capacity and additional injections of capital.

101
Box A4.17. Solvency II
Best Practice in Insurance Regulation – Solvency II
A new regulatory regime for insurance will be introduced across the European Union in 2013 or 201473
; Solvency II. This new Directive is fast becoming the benchmark for best practice in insurance regulation worldwide as it represents a comprehensive, forward-looking, risk-based approach to insurance supervision.
The framework proposed is structured according to three pillars: a quantitative pillar to ensure adequate financial resources relative to liabilities; a qualitative pillar examining the strength of companies as regards governance, internal controls and risk management; and a third pillar on enhanced disclosure required under the new Directive.
Diagram A5.1. Pillars of Solvency II
Source: KPMG
One strength of the new regime is the comprehensive approach to supervision proposed, looking beyond capital requirements and in detail at governance and internal risk management and control processes.
Another key strength is the approach taken to quantify capital requirements. Solvency II introduces more sophisticated risk-based solvency measures, taking an economic perspective of risks and considering risk across the categories listed in the table below as part of the core solvency calculation (calculation of the Solvency Capital Requirement – SCR). The Solvency Capital Requirement is designed such that companies calculate a level of capital needed to cover their ‘one in two hundred year loss’. This is the largest single loss event within a time-series of two hundred years, taking into consideration the risks listed in the Risk Modules table below.
Diagram A5.2. Solvency II Risk Modules
Source: Lloyd’s of London
73
Note that latest reported date is 2013, but reports indicate that this may be pushed back to 2014
Underwriting
risk
The risk of loss due to inadequate pricing and
provisioning assumptions.
Market risk The risk of loss from fluctuations in the level and
in the volatility of market prices of assets and
liabilities.
Credit risk The risk of loss from fluctuations in the credit
standing of issuers of securities, counterparties
and any debtors to which insurers are exposed.
Operational
riskThe risk of loss arising from failed or inadequate
internal processes, personnel or systems or from
internal events.

102
The calculation of capital requirements under Solvency II will explicitly consider catastrophe risk as “the risk of loss, or of adverse change in the value of insurance liabilities, resulting from significant uncertainty of pricing and provisioning assumptions related to extreme or exceptional events”. One method used to include a quantification of catastrophe risk within the SCR will be modeling of extreme scenarios. These are being developed in consultation with the industry, and will represent one in two hundred year loss events. This forward-looking approach to calculating potential liabilities is critical in capital adequacy for catastrophe exposed insurers, as it recognizes the need to look beyond the insurers’ historical experience.

103
Bibliography and References
AM Best (June 2011). Special Report Viet Nam’s Insurance Market Awakening to Further Change.
AM Best, 2010. Best’s special report: Southeast Asia Life & Non-Life Market review, February.
AXCO (retrieved 2011). Insurance Market Reports retrieved from http://www.axco.co.uk.
Bangkok Insurance (2011). Annual Report 2010.
Bank Negara Malaysia. Various data retrieved from http://www.bnm.gov.my/.
Brata, Aloysius Gunadi (July 2010). Regional Development for a Disastrous Country. MPRA Paper No. 23606. Faculty of Economics, Atma Jaya Yogyakarta University. Indonesia.
Bugl, Werner. Indonesia: The Recent Tsunami - A Review of the Impact And Lessons Learnt. Asia Insurance
Review. SIRC Special Issue. September 2005.
Business Report Thailand (January 2011). ‘Hedging Distribution Strategies’. Issue #4. Retrieved from
http://www.businessreportthailand.com/bancassurance-insurance-strategies-12385.
Cambodia Royal Government, 2010. Post-Ketsana Disaster Needs Assessment. A Report prepared by the Royal
Government of Cambodia with support from the World Bank, GFDRR, UN System, ADB and ADPC Under the
Leadership of the Cambodian National Committee for Disaster Management. Phnom Penh, March.
Chan, David, 2008. Underinsurance and non-insurance: a factor of Attitude, Accessibility and Affordability: An
analysis of the factors contributing to underinsurance and the low penetration of insurance in Malaysia, Singapore
and Viet Nam. ANZIIF Peter Corrigan Award 2008 Research Paper.
Deh, Pak (April 2011). Malaysia: Takaful Insurance. Retrieved from
http://askpakdeh.blogspot.com/2011/04/malaysia-takaful-insurance.html
Deloitte, 2010.More than one approach: alternative insurance distribution models in Asia Pacific.
Directive 2009/138/EC of the European Parliament and of the Council of 25 November 2009 on the taking-up and
pursuit of the business of Insurance and Reinsurance (Solvency II). Official Journal of the European Union,
December 2009.
Ernst and Young, 2011. World Takaful Report.
Eugene Gurenko, 2011, ‘Strengthening FSA’s Reinsurance Regulatory Capabilities’. Washington DC: World Bank.
Excerpts from Ministry of Economy and Finance Royal Government of Cambodia, 2004. Insurance Developments
In Cambodia.
Fitch Ratings (December 2010). Fitch Revises Malaysian Re's Outlook to Positive; Maintains Mrt's Outlook at
Stable. Fitch Ratings-Singapore/Hong Kong.
Fitch Ratings, (July 2011). Indonesia Full Rating Report: PT Asurani Maipark Indonesia.
104
Fox-Pitt Kelton. (April 2005). Thai Non-Life Insurance.
Gavin, James (2010). Building Capacity For Sharia Supervision. Malaysia International Islamic Financial Centre.
General Insurance Association of Cambodia. 2006. Profile 2006.
General Insurance Association of Cambodia. Various data retrieved from http://www.giac.com.kh/.
Government of the Republic of the Philippines, the Asian Development Bank, European Commission, United
Nations, the World Bank Group and others (November 2009). Philippines Typhoons Ondoy And Pepeng: Post-
Disaster Needs Assessment.
Government of the Union of Myanmar, ASEAN, UN (December 2008). Post Nargis Recovery and Preparedness
Plan.
Guy Carpenter, 2010. Asia Pacific Catastrophe Report October 2010.
Guy Carpenter, 2011. Succeeding under Solvency II. September.
Herbert Smith, 2010, Southeast Asia insurance market e-bulletin, November
IFC, 2010. Weather Index Insurance for Maize Production in Eastern Indonesia, a Feasibility Study.
Institut Bank-Bank Malaysia (April 2010). Financial Sector Talent Enrichment Programme, Insurance & Takaful
Handbook.
Insurance industry stakeholders through GIA, TLAA (2007). Commentary. Risk Based Capital Framework for
Insurance Business in Thailand.
International Association of Insurance Supervisors, 2010. Insurance Core Principle (ICP) material adopted: ICP 17
Capital Adequacy, October.
Islamic Financial Services Board and International Association of Insurance Supervisors, 2006.
Issues in Regulation and Supervision of Takaful (Islamic Insurance), August.
Kingdom of Cambodia, Royal Government, 2001. Sub-Decree on Insurance. Phnom Penh, October.
KPMG, 2011. Evolving Insurance Regulation: Asia Pacific Supplement. March.
Laubuan Offshore Financial Services Authority (January 2006). Guidelines on General Reinsurance Arrangements.
Malaysian Re (April 2011). ‘Evolution Of Reinsurance & Retakaful Industry’. Malaysia.
Marsh (January 2011). Regional Overview (Asia). Retrieved from
http://www.insurancemarketreport.com/Reports/tabid/8078/ID/986/Regional-Overview.aspx.
Maung Nynt, Khin (June 2009). ‘Export of Services and Economic Growth: Needs and Opportunities for Myanmar’.
Mae Fah Luang University.
Milliman (June 2011). Asia e-alert: Risk Based Capital Guidelines for Takaful Operators in Malaysia.

105
Ministry of Finance, Viet Nam. Viet Nam Financial Review (May 2008). Covering bases: The Maturation of
Insurance.
Mohamed, Hafiz, 2006. ‘Takaful in Asean:Gaining Momentum With Malaysia Leading the Way’. Middle East
Insurance Review, September.
Monetary Authority of Singapore (MAS) (2004-2011). MAS Notices 114, IA/PP-N03.1, IA/PP-N01.1.
Monetary Authority of Singapore (MAS). Various data retrieved from http://www.mas.gov.sg/.
National Assembly of the Kingdom of Cambodia, 2000. Insurance Law of the Kingdom Of Cambodia, Adopted by
the National Assembly of the Kingdom of Cambodia on 20th June, 2000 at the 4th
Session , 2nd
Legislation.
National Insurance Company Berhad, Brunei Darussalam. 2009 Annual Report.
Office of the Insurance Commission (OIC) Thailand. Various data retrieved from
http://www.oic.or.th/en/home/index.php.
Ortoritas Jasa Keuangan (Indonesian insurance regulator). Various data retrieved from
http://www.depkeu.go.id/Ind/.
Philippine Insurance and Reinsurance Association (2010-2011). Official newsletters, chairman’s report. Retrieved
from http://www.pirainc.org/.
Philippines Insurance Commission. Various data retrieved from http://www.insurance.gov.ph/.
Phnom Penh Securities Plc, 2011. Research Paper Cambodia Insurance Sector. May.
Prudential Financial Policy Department, Bank Negara Malaysia. 2008. Risk-Based Capital Framework for Insurers
[Revised - Version 2.0],November.
PT. Asuransi Maipark. Various data retrieved from http://www.maipark.com/.
Republic of the Philippines, Department of Finance (2005 - 2009), Insurance Commission. Circular Letters No. 5-
2005, 22-2009, 24-2006, 29-2006, 39-2006, 8-2007. Manila.
Republic of the Philippines, Department of Finance (2006). Department Order 27-06. Manila.
Republic of the Philippines, Department of Finance (2006-2010), Insurance Commission. Insurance Memorandum
Circulars 7-2006, 1-2010. Manila.
Republic of the Philippines, Department of Finance (2010), Insurance Commission. Annual Report 2009. Manila.
Risk Management Solutions Ltd, 2006. Managing Tsunami Risk in the Aftermath of the 2004 Indian Ocean
Earthquake & Tsunami.
Rossi, Vanessa. 2010. The Challenges and Opportunities for Financial Services in Indonesia. City of London
Corporation and Chatham House. July.
Russin & Vecchi (May 2010). Insurance Law & Regulation Viet Nam. Ho Chi Min City.
Standard and Poor’s (October 2003). Ratings Direct - Thai Reinsurance Public Co. Ltd.
Swiss Re (December 2010). Sigma No 2/2010 World Insurance in 2009 Statistical Appendix.

106
Swiss Re (February 2011). Sigma No 1/2011 Natural Disasters and Man Made Catastrophes in 2010.
Thai Reinsurance Public Company Limited (2011). Annual Report 2010.
The Board of Directors of MNRB Holdings Berhad (MNRB) (December 2009). Announcement. Reference
No: MN-091231-38343. Subject : Voluntary Cessions (VC) to Malaysian Reinsurance Berhad.
World Bank, 2010a. Weathering the Storm: Options for Disaster Risk Financing in Viet Nam. Washington, DC: The
World Bank, May.

107
Appendix 5. Agricultural Insurance in ASEAN Member States
Importance of Agriculture
Agriculture is the most important socio-economic sector in most of the low income countries (LIC) and
lower middle income countries (LMIC) in the ASEAN Region, and it is the major source of employment,
livelihoods and income in these countries. Conversely, the two high income countries (HIC), Singapore
and Brunei Darussalam are very small geographic territories with predominantly urban populations and
agriculture is a very insignificant economic activity in these two countries.
In the LIC group of countries including Cambodia, Lao PDR, Myanmar and Viet Nam, more than two
thirds of the population are classified as rural, agriculture is the main source of employment with range
from 58% in Viet Nam to as high as 70% of total employment in Cambodia and in 2009 the agricultural
sector contributed between 21% of GDP in Viet Nam and a high of 48% of GDP in Myanmar. Agriculture
is also a very important source of rural livelihoods in the three LMIC of Indonesia, the Philippines and
Thailand although its contribution to GDP is about 15% or less. Agriculture continues to be an important
economic sector in the one upper middle income country (UMIC), Malaysia (Table A5.1).
There are major differences in the scale of the agricultural sector across the 10 ASEAN Member States.
For instance, in Indonesia the world’s fourth most populated country with 240 million people, the area
of arable land74 totals 22 million hectares, while Singapore with a population of 5 million inhabitants has
only 500 hectares of land suitable for crop and pasture production. The agricultural sectors are also very
large in Thailand, Myanmar, Viet Nam and the Philippines (Table A5.1).
The most important crop grown in the ASEAN region is paddy rice: in 2009 the 8 agrarian based ASEAN
Member States harvested more than 48 million hectares of paddy rice equivalent to two-thirds of the
total arable area in the region. Other important food crops include maize, grown in Indonesia, the
Philippines, Thailand, Viet Nam and Lao PDR, while in Myanmar beans are the second largest field crop.
Industrial plantation crops such as oil palm and rubber are very important in Indonesia and Malaysia and
to a lesser extent in Thailand, while coconuts are a very important industrial crop in the Philippines. Viet
Nam is one of the World’s largest coffee producers and exporters. (See individual country profiles for
further details).
Livestock, especially poultry and pigs are very important in the small-scale mixed farming systems of
many ASEAN Member States as are cattle and buffalo. Forestry and plantation crops are also very
important in several countries such as Indonesia, Malaysia, Thailand, Myanmar, Lao, and Cambodia.
Finally, fresh water and brackish-water aquaculture (fish farming) is very important in the region, mainly
for shrimp, tilapia and carp. (See Country Profiles for further details)
74 Arable land includes land defined by the FAO as land under temporary crops (double-cropped areas are counted once),
temporary meadows for mowing or for pasture, land under market or kitchen gardens, and land temporarily fallow. Land
abandoned as a result of shifting cultivation is excluded.
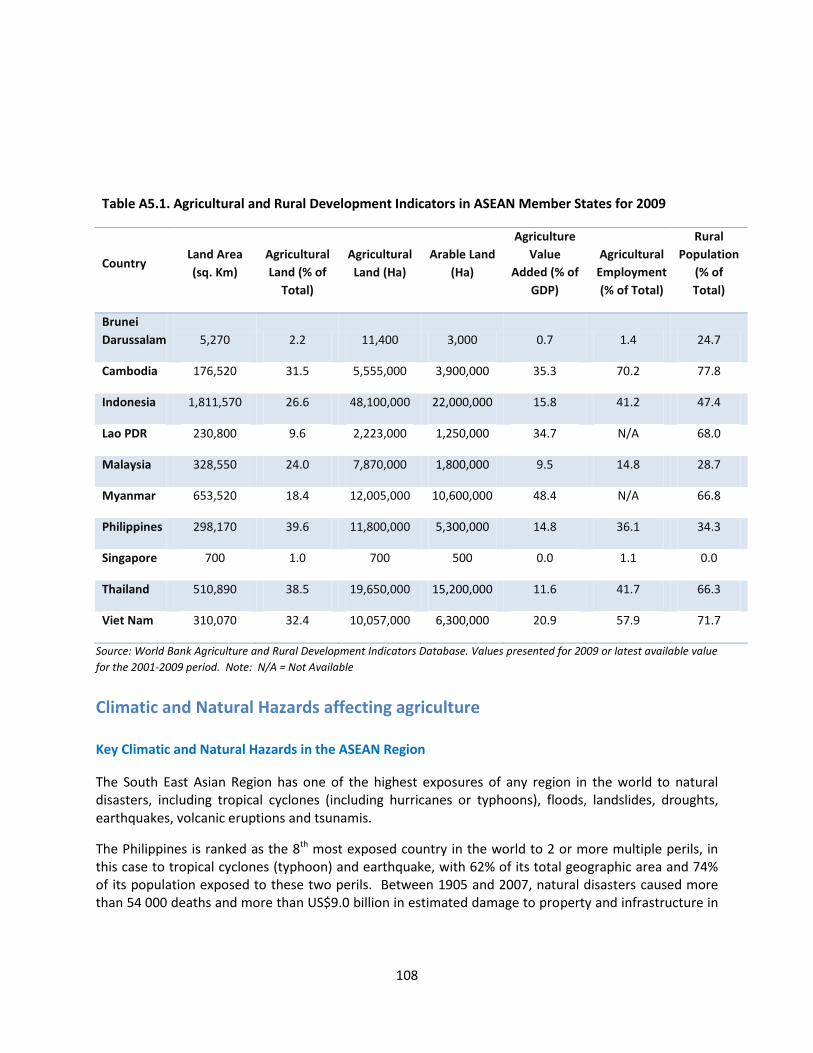
108
Table A5.1. Agricultural and Rural Development Indicators in ASEAN Member States for 2009
Country Land Area
(sq. Km)
Agricultural
Land (% of
Total)
Agricultural
Land (Ha)
Arable Land
(Ha)
Agriculture
Value
Added (% of
GDP)
Agricultural
Employment
(% of Total)
Rural
Population
(% of
Total)
Brunei
Darussalam 5,270 2.2 11,400 3,000 0.7 1.4 24.7
Cambodia 176,520 31.5 5,555,000 3,900,000 35.3 70.2 77.8
Indonesia 1,811,570 26.6 48,100,000 22,000,000 15.8 41.2 47.4
Lao PDR 230,800 9.6 2,223,000 1,250,000 34.7 N/A 68.0
Malaysia 328,550 24.0 7,870,000 1,800,000 9.5 14.8 28.7
Myanmar 653,520 18.4 12,005,000 10,600,000 48.4 N/A 66.8
Philippines 298,170 39.6 11,800,000 5,300,000 14.8 36.1 34.3
Singapore 700 1.0 700 500 0.0 1.1 0.0
Thailand 510,890 38.5 19,650,000 15,200,000 11.6 41.7 66.3
Viet Nam 310,070 32.4 10,057,000 6,300,000 20.9 57.9 71.7
Source: World Bank Agriculture and Rural Development Indicators Database. Values presented for 2009 or latest available value
for the 2001-2009 period. Note: N/A = Not Available
Climatic and Natural Hazards affecting agriculture
Key Climatic and Natural Hazards in the ASEAN Region
The South East Asian Region has one of the highest exposures of any region in the world to natural disasters, including tropical cyclones (including hurricanes or typhoons), floods, landslides, droughts, earthquakes, volcanic eruptions and tsunamis.
The Philippines is ranked as the 8th most exposed country in the world to 2 or more multiple perils, in this case to tropical cyclones (typhoon) and earthquake, with 62% of its total geographic area and 74% of its population exposed to these two perils. Between 1905 and 2007, natural disasters caused more than 54 000 deaths and more than US$9.0 billion in estimated damage to property and infrastructure in

109
the Philippines75. This is followed by Viet Nam which is ranked as the 14th most exposed country to natural hazards, in the world. Cambodia, Thailand, Laos, Myanmar and Indonesia are also ranked in the top 60 most exposed countries in the world to 2 or more natural hazards (Table A5.2).
Table A5.2. Ranking of ASEAN Member States according to Exposure to 2 or more Multiple Hazards
Country
Ranking (Top
60 countries)
Percent of Total
Area Exposed
Percent of Population
Exposed Max. No of Hazards
Philippines 8 62.2 73.8 5
Viet Nam 14 Severe Severe N/A
Cambodia 21 27.9 4.4 3
Thailand 23 25.2 17.7 2
Laos PDR 34 15.2 12.6 3
Myanmar 40 N/A Severe Severe
Indonesia 53 4.5 14.1 3
Malaysia Outside
Brunei Darussalam Outside
Singapore Outside
Source: World Bank 200576
ASEAN Member States are exposed to a large number of natural hazards, ranging from countries with
relatively low risk of natural disasters and agricultural exposure like Singapore and Brunei Darussalam
through to countries highly exposed to multiple natural hazards, such as the Philippines, Viet Nam and
Thailand (Table A5.3).
Most of the ASEAN Member States face a moderate to severe exposure to tropical cyclone (typhoon)
and/or tornados. Agriculture in the Philippines and Viet Nam is very exposed to typhoon damage from
Eastern Pacific tropical cyclones from May to December, while Myanmar and Thailand are very exposed
to tropical cyclones between January and April, originating in the Indian Ocean and Bay of Bengal.
3Data retrieved from EM-DAT: The International Disaster Database, Centre for Research on the Epidemiology of
Disasters (CRED), School of Public Health, Université Catholique de Louvain, Brussels, Belgium. (Available at
www.emdat.be).
76
World Bank (2005). Natural Disaster Hotspots: A Global Risk Analysis. Disaster Risk Management Series no. 5, 34423. The World Bank, Washington D.C.
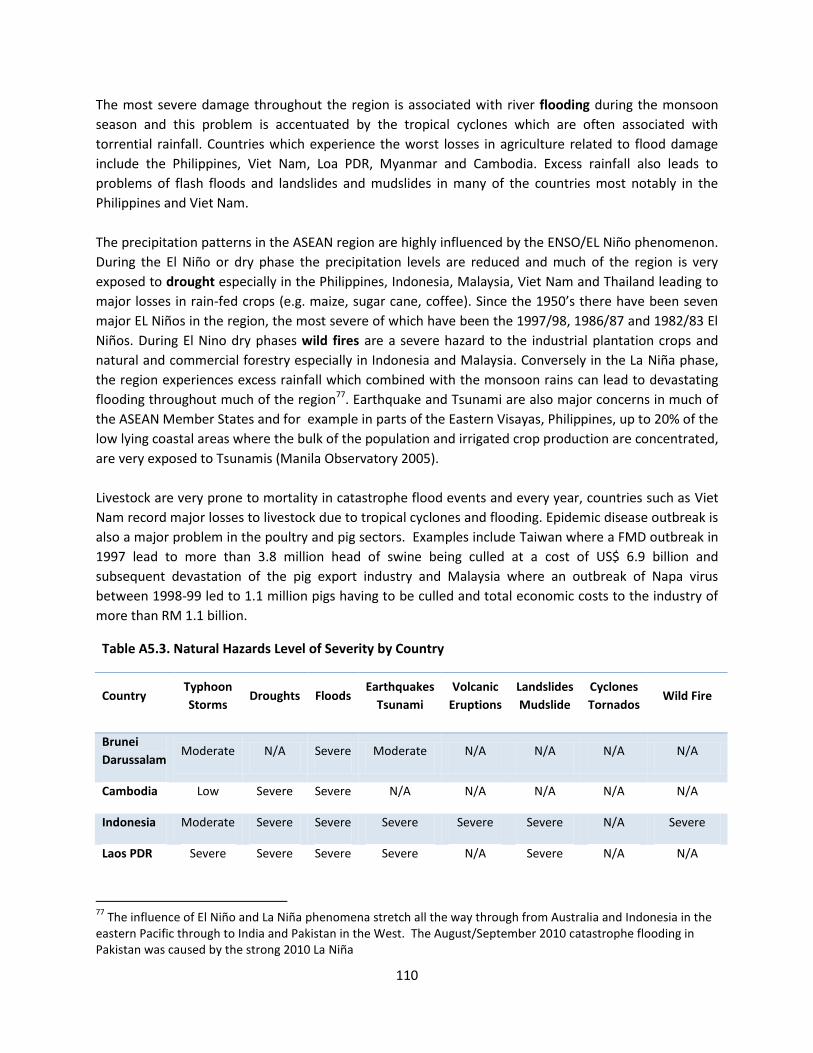
110
The most severe damage throughout the region is associated with river flooding during the monsoon
season and this problem is accentuated by the tropical cyclones which are often associated with
torrential rainfall. Countries which experience the worst losses in agriculture related to flood damage
include the Philippines, Viet Nam, Loa PDR, Myanmar and Cambodia. Excess rainfall also leads to
problems of flash floods and landslides and mudslides in many of the countries most notably in the
Philippines and Viet Nam.
The precipitation patterns in the ASEAN region are highly influenced by the ENSO/EL Niño phenomenon.
During the El Niño or dry phase the precipitation levels are reduced and much of the region is very
exposed to drought especially in the Philippines, Indonesia, Malaysia, Viet Nam and Thailand leading to
major losses in rain-fed crops (e.g. maize, sugar cane, coffee). Since the 1950’s there have been seven
major EL Niños in the region, the most severe of which have been the 1997/98, 1986/87 and 1982/83 El
Niños. During El Nino dry phases wild fires are a severe hazard to the industrial plantation crops and
natural and commercial forestry especially in Indonesia and Malaysia. Conversely in the La Niña phase,
the region experiences excess rainfall which combined with the monsoon rains can lead to devastating
flooding throughout much of the region77. Earthquake and Tsunami are also major concerns in much of
the ASEAN Member States and for example in parts of the Eastern Visayas, Philippines, up to 20% of the
low lying coastal areas where the bulk of the population and irrigated crop production are concentrated,
are very exposed to Tsunamis (Manila Observatory 2005).
Livestock are very prone to mortality in catastrophe flood events and every year, countries such as Viet
Nam record major losses to livestock due to tropical cyclones and flooding. Epidemic disease outbreak is
also a major problem in the poultry and pig sectors. Examples include Taiwan where a FMD outbreak in
1997 lead to more than 3.8 million head of swine being culled at a cost of US$ 6.9 billion and
subsequent devastation of the pig export industry and Malaysia where an outbreak of Napa virus
between 1998-99 led to 1.1 million pigs having to be culled and total economic costs to the industry of
more than RM 1.1 billion.
Table A5.3. Natural Hazards Level of Severity by Country
Country Typhoon
Storms Droughts Floods
Earthquakes
Tsunami
Volcanic
Eruptions
Landslides
Mudslide
Cyclones
Tornados Wild Fire
Brunei
Darussalam Moderate N/A Severe Moderate N/A N/A N/A N/A
Cambodia Low Severe Severe N/A N/A N/A N/A N/A
Indonesia Moderate Severe Severe Severe Severe Severe N/A Severe
Laos PDR Severe Severe Severe Severe N/A Severe N/A N/A
77
The influence of El Niño and La Niña phenomena stretch all the way through from Australia and Indonesia in the eastern Pacific through to India and Pakistan in the West. The August/September 2010 catastrophe flooding in Pakistan was caused by the strong 2010 La Niña

111
Malaysia Low N/A Severe Low N/A Severe N/A Severe
Myanmar Severe N/A Severe Severe N/A Severe Severe N/A
Philippines Severe Severe Severe Severe Severe Severe Severe Severe
Singapore Low N/A N/A Moderate N/A N/A N/A N/A
Thailand Moderate Severe Severe Severe N/A Severe Severe N/A
Viet Nam Severe Severe Severe Moderate N/A Severe Severe N/A
Source: Authors based on World Bank 2005
Climate Change Impacts on Agriculture
A recent study in 8 of the 10 ASEAN Member States with important agricultural sectors predicts that
these countries will be strongly affected by the impacts of climate change including the tendency for
more frequent and extreme droughts and floods. In these countries increasing water stress, the
increasing intensity of precipitation and the consequent floods will cause land erosion degradation and
decreases in soil fertility and crop productivity. In addition temperature changes and low water quality
and availability will impact negatively on agriculture, in general, and livestock production and especially
on aquaculture production. (AIT-UNEP RRC.AP 2011).
It is outside the scope of this present report to review the impacts of climate change in each ASEAN
territory and to analyze the implications for agricultural insurance provision in future. In general terms,
however, climate change tends to bring greater uncertainty over crop production and yields and for
traditional agricultural indemnity-based insurance the challenge will be to build climate change impacts
into the design and rating of these yield-based products. For the new range of weather index insurance
products, climate change also causes challenges for the design and rating of such covers because the
historical weather record may no longer be representative of the pattern of future weather - daily and
monthly and seasonal rainfall and temperature levels etc.
Government Natural Disaster Schemes for Farmers
A high proportion of rural farming households in the ASEAN region are currently dependent on publicly provided ex-post disaster relief assistance.
In response to the catastrophe exposure to losses of life, infrastructure and property associated with typhoons and associated flooding and storm surges and to earthquakes and tsunamis, most countries in the region have well developed national strategies and action plans for natural disaster prevention, response and mitigation from national level right down through provincial and county levels to the individual level. These natural disaster risk management programmes include well established ex-post-disaster response measures involving relief, recovery and reconstruction operations. Crop and livestock producers in these countries typically receive post-disaster compensation in the form of replacement poultry and small livestock and free seeds and fertilizers to enable them to replant their crops.
One country in the ASEAN region, the Philippines has a long history of public sector crop and livestock insurance that continues through to today, but in most of the other countries public sector crop

112
insurance initiatives in the 70s and 80s were a failure and were terminated, and while private sector agricultural insurance is gradually being introduced into these countries, in 2011 only five countries or 50% of total in the ASEAN region have some form of agricultural crop or livestock insurance program.
Most ASEAN governments are currently seeking to introduce private sector led agricultural insurance programs and there several examples from countries including Thailand, Indonesia and Viet Nam of new innovative public private partnership, PPPs that are being developed.
The linkages between ex-post government natural disaster compensation schemes for crop and
livestock producers and the new range of ex-ante crop and livestock insurance program should be
carefully assessed in ASEAN territories. On the one hand, international experience shows that
government disaster relief programs tend to act as a disincentive for farmers to purchase agricultural
insurance. On the other hand, the Thailand 2011 national rice insurance scheme which is linked to the
existing natural disaster relief system shows the potential cost-efficiencies that can be achieved by
combining disaster relief with a formally designed and rated crop insurance scheme.
Agricultural Insurance Provision in ASEAN Member States78
Global Agricultural Insurance Markets
Agricultural insurance is available in more than 100 countries or approximately 50% of all the countries
in the World (Mahul & Stutley 2010). The Global agricultural insurance market has grown very rapidly in
recent years: in 2005 total global agricultural insurance premium was estimated at about US$ 9 million,
but by 2009 this had risen to US$ 19.4 billion. Over this period agricultural insurance premiums in the
Asia-Pacific Region grew from US$ 1.6 billion in 2005 to US$ 4.0 billion in 2009 or a 28% per annum
growth rate. Several factors accounted for this major increase in global premium, including: (a) the
increases in global demand for and prices of commodities such as soybean, wheat, maize and thus
insured crop values and generated premiums; and (b) government policy towards the promotion of
agricultural insurance as a risk management instrument and thus the growth of public sector subsidized
agricultural insurance particularly in China, South Asia and Brazil.
In 2009 North America was the largest agricultural insurance market accounting for US$ 10.7 billion
(55% of global agricultural insurance market), followed by the Asia-Pacific Region (US$ 4.0 billion or
20.4% of total), then Europe (US$ 3.9 Billion or 20.1% of total), Latin America (US$ 0.78 billion or 4.0% of
total) and finally Africa (less than 1% of total). (Map A6.1).
Map A5.1. Global Agricultural Insurance Premiums 2009 (US$ Million)
78
This Section draws heavily on two sources namely 1) World Bank 2008 survey of agricultural insurance provision in more than 65 countries including key countries in South East Asia, the results of which are reported in Mahul and Stutley (2010), Government Support to Agricultural Insurance: Challenges and Options for Developing Countries, The World Bank, and 2) a 2010 FAO funded survey of agricultural insurance in the Asia-Pacific region, the results of which are due to be published shortly, FAO (forthcoming) Agricultural Insurance Provision in the Asia-Pacific Region, Regional Office for Asia and the Pacific (RAPA), Food and Agriculture Organisation of the United Nations. In addition the authors are grateful to the following organisations for 2011 information on specific countries and programs: SwissRe Singapore, AonBenfield, MicroEnsure Philippines, IFC Indonesia, WillisRe, London.

113
Source: Itturioz 2010
Agricultural Insurance Provision in ASEAN Member States
In 2011 agricultural insurance is available in 5 (50% of total) ASEAN Member States including the
Philippines which has a traditional of public sector agricultural crop insurance dating back to 1980,
Thailand, Viet Nam, Malaysia and Indonesia. There is no agricultural insurance in Cambodia, Lao PDR,
Myanmar, Brunei Darussalam or Singapore in 2011.
In the wider regional context, currently, agricultural insurance is available in 20 countries (45% of total)
of the 44 countries in the Asia-Pacific Region. The largest agricultural insurance markets in the Region
include China, Japan, India, Australia and South Korea (Table A5.4).
Table A5.4. Number of Countries in Asia Pacific Region with Agricultural Insurance in 2011
Region
Total No. of
Countries in
Region
No. of
Countries with
Agricultural
Insurance
% of Total
with Agric.
Insurance Countries
ASEAN 10 5 50%
Indonesia, Malaysia, Philippines, Thailand,
Viet Nam
Other East
Asia &
Pacific 26 10 38%
Australia, China, French Polynesia, Guam,
Hong Kong (China), Japan, New Zealand,
North Korea, Mongolia, South Korea
South Asia 8 5 63% Bangladesh, Nepal, India, Pakistan, Sri Lanka
Total Asia-
Pacific 44 20 45%

114
Sources: Mahul & Stutley 2010; FAO 2011 (forthcoming)
Types of Agricultural Insurance Market
There are three main institutional frameworks for agricultural insurance ranging from, (1) private
commercial market systems, (2) public sector programs and (3) public-private partnerships for
agricultural insurance (Figure A5.1).
Figure A5.1. Public and Private Insurance Models for Agricultural Insurance
1.1. Source: Iturrioz, 2009.
1.2.
Public-sector agricultural insurance. In the 1970s and 1980s many governments in the Asia-Pacific
region introduced monopoly public sector crop and livestock insurance schemes, often accompanied by
premium subsidies and other forms of government support including excess of loss (reinsurance)
protection. In three of the ASEAN Member States, the Philippines, Thailand and Viet Nam, governments
introduced public sector crop insurance during this period. The Philippines government established the
Philippines Crop Insurance Corporation (PCIC) in 1978 with a mandate to underwrite subsidized
multiple-peril crop insurance (MPCI) for rice and maize producers: the scheme was planned as a
compulsory crop-credit insurance program designed to leverage small and marginal rice and maize
producers’ access to seasonal crop loans from the cooperative and public sector banks. In Viet Nam, the
then national insurance company Boa Viet Insurance Company launched a pilot MPCI program for rice
farmers in Nam Dinh Province in 1982. Other Asia-Pacific countries including Bangladesh, China, India,
North Korea and Sri Lanka introduced public sector agricultural insurance programs in the 1970s and
1980s. (See Box A5.1 for further details of these programs).
Box A5.1. Public-Sector Agricultural Insurance Models in ASEAN and other Asia-Pacific countries
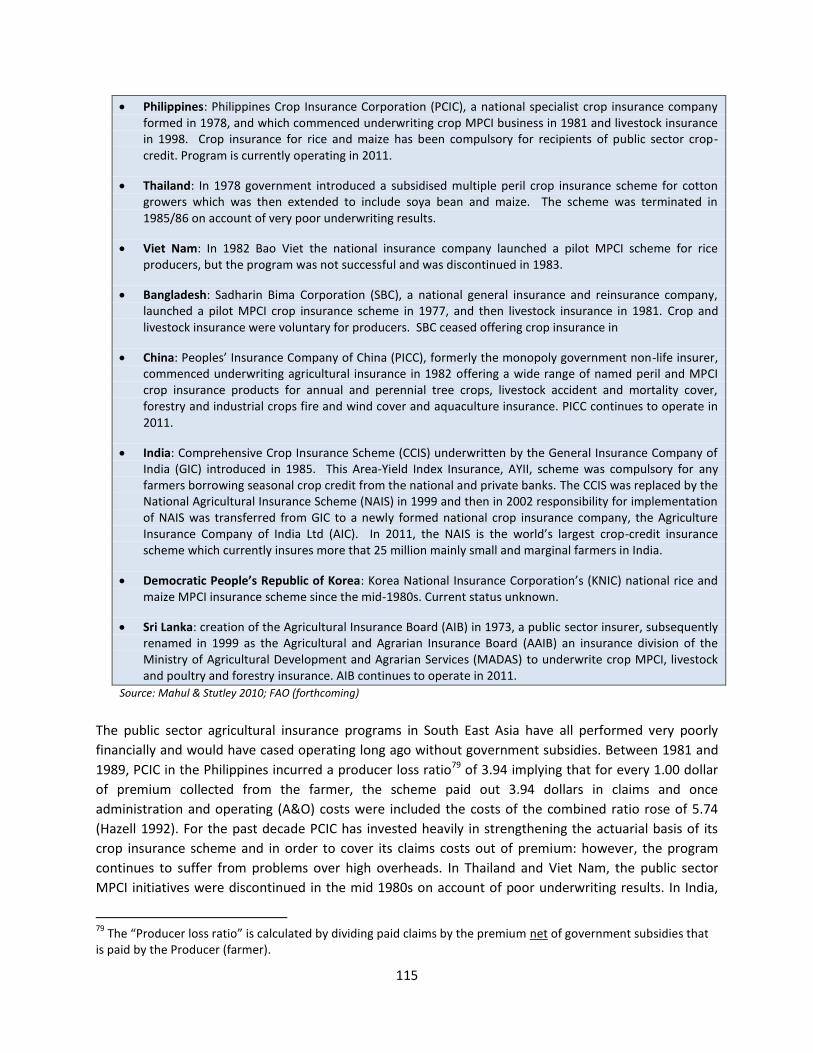
115
Philippines: Philippines Crop Insurance Corporation (PCIC), a national specialist crop insurance company formed in 1978, and which commenced underwriting crop MPCI business in 1981 and livestock insurance in 1998. Crop insurance for rice and maize has been compulsory for recipients of public sector crop-credit. Program is currently operating in 2011.
Thailand: In 1978 government introduced a subsidised multiple peril crop insurance scheme for cotton growers which was then extended to include soya bean and maize. The scheme was terminated in 1985/86 on account of very poor underwriting results.
Viet Nam: In 1982 Bao Viet the national insurance company launched a pilot MPCI scheme for rice producers, but the program was not successful and was discontinued in 1983.
Bangladesh: Sadharin Bima Corporation (SBC), a national general insurance and reinsurance company, launched a pilot MPCI crop insurance scheme in 1977, and then livestock insurance in 1981. Crop and livestock insurance were voluntary for producers. SBC ceased offering crop insurance in
China: Peoples’ Insurance Company of China (PICC), formerly the monopoly government non-life insurer, commenced underwriting agricultural insurance in 1982 offering a wide range of named peril and MPCI crop insurance products for annual and perennial tree crops, livestock accident and mortality cover, forestry and industrial crops fire and wind cover and aquaculture insurance. PICC continues to operate in 2011.
India: Comprehensive Crop Insurance Scheme (CCIS) underwritten by the General Insurance Company of India (GIC) introduced in 1985. This Area-Yield Index Insurance, AYII, scheme was compulsory for any farmers borrowing seasonal crop credit from the national and private banks. The CCIS was replaced by the National Agricultural Insurance Scheme (NAIS) in 1999 and then in 2002 responsibility for implementation of NAIS was transferred from GIC to a newly formed national crop insurance company, the Agriculture Insurance Company of India Ltd (AIC). In 2011, the NAIS is the world’s largest crop-credit insurance scheme which currently insures more that 25 million mainly small and marginal farmers in India.
Democratic People’s Republic of Korea: Korea National Insurance Corporation’s (KNIC) national rice and maize MPCI insurance scheme since the mid-1980s. Current status unknown.
Sri Lanka: creation of the Agricultural Insurance Board (AIB) in 1973, a public sector insurer, subsequently renamed in 1999 as the Agricultural and Agrarian Insurance Board (AAIB) an insurance division of the Ministry of Agricultural Development and Agrarian Services (MADAS) to underwrite crop MPCI, livestock and poultry and forestry insurance. AIB continues to operate in 2011.
Source: Mahul & Stutley 2010; FAO (forthcoming)
The public sector agricultural insurance programs in South East Asia have all performed very poorly
financially and would have cased operating long ago without government subsidies. Between 1981 and
1989, PCIC in the Philippines incurred a producer loss ratio79 of 3.94 implying that for every 1.00 dollar
of premium collected from the farmer, the scheme paid out 3.94 dollars in claims and once
administration and operating (A&O) costs were included the costs of the combined ratio rose of 5.74
(Hazell 1992). For the past decade PCIC has invested heavily in strengthening the actuarial basis of its
crop insurance scheme and in order to cover its claims costs out of premium: however, the program
continues to suffer from problems over high overheads. In Thailand and Viet Nam, the public sector
MPCI initiatives were discontinued in the mid 1980s on account of poor underwriting results. In India,
79
The “Producer loss ratio” is calculated by dividing paid claims by the premium net of government subsidies that is paid by the Producer (farmer).
116
the government subsidized Area-based Compulsory Crop Insurance Scheme (CCIS) also operated at a
major financial loss in the 1980’s with a producer loss ratio of 5.1180. In India the CCIS was converted
into the NAIS in 1999 and then in 2002 responsibility for implementation transferred to a new public
sector crop insurer the Agriculture Insurance Company AIC. Since the mid-2000s AIC with technical
assistance from the World Bank has invested heavily in strengthening the NIAS and in gradually
transforming the previously social insurance scheme to a more market oriented crop insurance scheme.
In Bangladesh the state insurer SBC implemented a pilot MPCI crop insurance program between 1977
and 1995 when it ceased to underwrite this product on account of heavy underwriting losses (loss ratio
of 499%): SBC’s major constraint was that it was unable to charge actuarially determined rates for crop
insurance (World Bank 2010). In China, the national monopoly insurer, Peoples Insurance Company of
China, PICC, incurred major underwriting losses on its agricultural insurance portfolio between 1982 and
2002: government’s response in China has been to privatize PICC and to open up the market to
competition by private commercial insurance companies often under forms of Public-Private
Partnership, PPP with state governments81. Finally in Sri Lanka, the Agricultural Insurance Board, AIB,
incurred very poor underwriting results on its MPCI crop portfolio in the between 1987 and 1990 and as
in the Philippines and India has required considerable reform and strengthening since then.
Private Commercial Crop Insurance Markets. Australia and New Zealand are the oldest and largest
purely private commercial agricultural insurance markets in the Asia-Pacific Region which have been
underwriting crop hail since the early 20th century and also more recently, livestock and forestry
insurance. These markets receive no financial or other support from governments.
Other examples of countries which since 2000 until recently had purely private agricultural insurance
markets include Thailand, Malaysia and Viet Nam. However, in 2011 government in Thailand has started
an ambitious PPP subsidized rice price-support scheme and in Viet Nam government has since 2010
drawn up proposals to implement a PPP subsidized crop, livestock, poultry and aquaculture insurance. In
India which for many years had a monopoly state crop insurance scheme, since 2006 the market has
opened up to competition by private commercial insurance companies who have been leaders in the
underwriting of new weather index crop insurance products and programs. (See Country Profiles for
further details).
Public Private Partnerships (PPP). With the failure of many of the public sector initiatives of the 1970s
and 1980s governments both globally and in the Asia-Pacific region have increasingly sought to promote
PPPs under which responsibility for the implementation of agricultural insurance is vested with the
private commercial insurance sector and government provides legal and financial support usually in the
form of premium subsidies and or financial support to claims compensation and in some cases
assistance with A&O costs.
In the ASEAN group of countries, since 2009, Indonesia has been implementing a pilot PPP for crop and
livestock insurance in West and Central Java which involves a pool of 10 private insurance companies
80
Hazell ibid. 81
For China, refer to: World Bank. 2007. China: Innovations in agricultural insurance. Promoting access to agricultural insurance for small farmers. Sustainable Development, East Asia and Pacific region, Finance and Private Sector Development, The World Bank, June 2007. and PICC. 2010. Introduction to China Agricultural Insurance Development. PICC Property & Casualty

117
and premium subsidy support is provided by government through the Ministry of Agriculture (MOA). In
2011 the Thai Government has established a major subsidized are-based multiple peril rice insurance
PPP scheme which provides top-up cover for the existing national disaster relief program and which is
underwritten by a coinsurance pool of local private insurers and reinsurers with support by international
reinsurers. Viet Nam is also due to launch a very ambitious PPP crop, livestock, poultry and aquaculture
insurance program in October 2011 which will be led by Boa Viet and Bao Minh and which will attract
major government premium subsidy support82. Reinsurance support for this PPP is being provided by
VinaRe the national reinsurer and by SwissRe the major international reinsurer which has also provided
technical design support for the scheme (See Box A5.2 for details of agricultural insurance PPPs in Asia).
Box A5.2. Countries with Public Private Partnerships for Agricultural Insurance, Asia and Pacific
Regions
ASEAN Member States:
Indonesia: Starting in 2009, the Ministry of Agriculture, MOA has been implementing a pilot crop and livestock
insurance scheme in West and Central Java in conjunction with a local broker (Daspindo) and 10 insurance
companies. MOA currently subsidizes 100% of the premiums on these schemes.
Thailand: In 2011 the Thai Government has established a PPP to underwrite the national rice crop against
catastrophe climatic and natural perils. The “Thailand Rice Disaster Relief Top-up” scheme is being underwritten
by a pool of 8 local insurance companies and 9 reinsurance companies and the international reinsurance program
is led by SwissRe. The program is being administered through and implemented by the Bank of Agriculture and
Agricultural Cooperatives (BAAC) to which all rice farmers are registered. Government support is in the form of
50% premium subsidies.
Viet Nam. There are proposals to launch a subsidized crop (rice) livestock, poultry and aquaculture PPP scheme in
October 2011 with participation by the Ministry of Finance, VinaRe (national reinsurance company), and several
private insurers including Bao Viet and Boa Minh. The international reinsurance program is led by SwissRe.
Government through MOF is planning to provide major premium subsidy support for this program between 2011
and 2013.
OTHER ASIAN Countries:
China is the largest PPP agricultural insurance market in 2011: all agricultural insurance is underwritten by private
or mutual insurance companies and national and local (provincial) governments provide premium subsidies.
Government also provides support to reinsurance either through China Re, the national reinsurance company,
and/or through government catastrophe co-reinsurance agreements in several provinces.
India. The national livestock insurance scheme which dates back to the late 1960’s is underwritten by a group of
public and private insurance companies under a pool agreement with premium subsidy support. Since 2006
private commercial insurers in India have offered weather index insurance and in recent years several state
governments have provided premium subsidy support to these programs.
82
For further details see: Decision on Implementing Pilot Agricultural Insurance Scheme in 2011-13. The Prime Minister, No 315/QD-TTg, Hanoi, March 1
st, 2011.
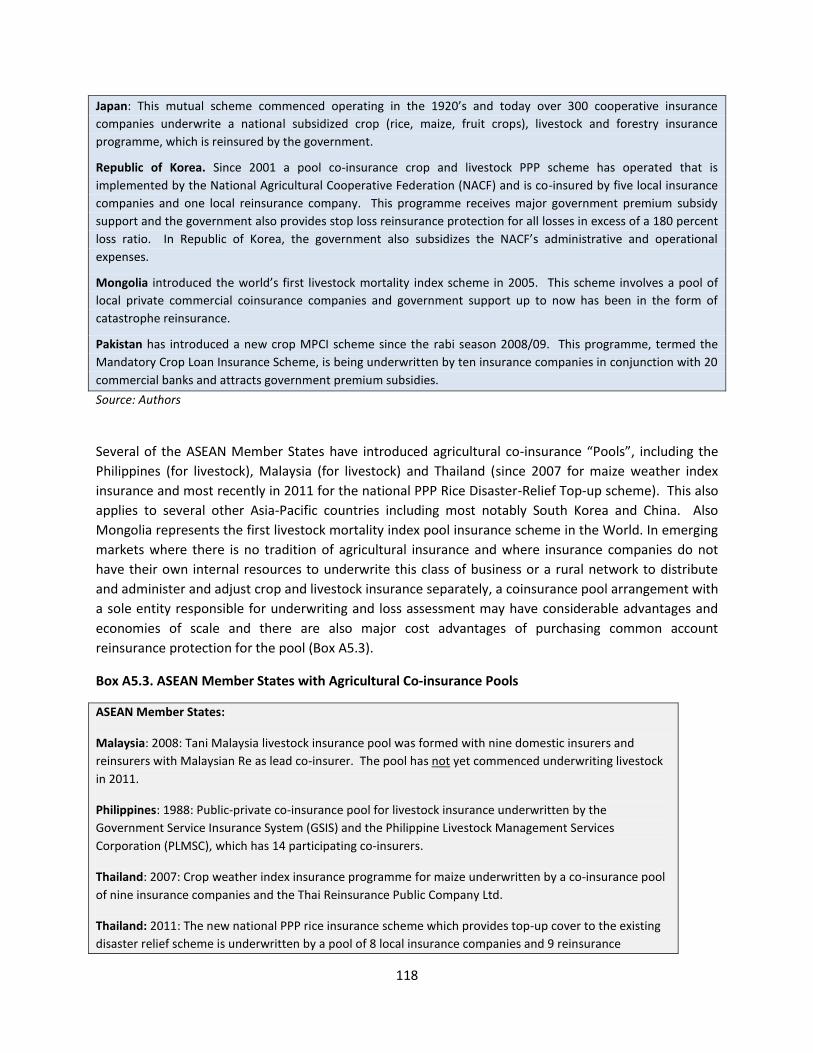
118
Japan: This mutual scheme commenced operating in the 1920’s and today over 300 cooperative insurance
companies underwrite a national subsidized crop (rice, maize, fruit crops), livestock and forestry insurance
programme, which is reinsured by the government.
Republic of Korea. Since 2001 a pool co-insurance crop and livestock PPP scheme has operated that is
implemented by the National Agricultural Cooperative Federation (NACF) and is co-insured by five local insurance
companies and one local reinsurance company. This programme receives major government premium subsidy
support and the government also provides stop loss reinsurance protection for all losses in excess of a 180 percent
loss ratio. In Republic of Korea, the government also subsidizes the NACF’s administrative and operational
expenses.
Mongolia introduced the world’s first livestock mortality index scheme in 2005. This scheme involves a pool of
local private commercial coinsurance companies and government support up to now has been in the form of
catastrophe reinsurance.
Pakistan has introduced a new crop MPCI scheme since the rabi season 2008/09. This programme, termed the
Mandatory Crop Loan Insurance Scheme, is being underwritten by ten insurance companies in conjunction with 20
commercial banks and attracts government premium subsidies.
Source: Authors
Several of the ASEAN Member States have introduced agricultural co-insurance “Pools”, including the
Philippines (for livestock), Malaysia (for livestock) and Thailand (since 2007 for maize weather index
insurance and most recently in 2011 for the national PPP Rice Disaster-Relief Top-up scheme). This also
applies to several other Asia-Pacific countries including most notably South Korea and China. Also
Mongolia represents the first livestock mortality index pool insurance scheme in the World. In emerging
markets where there is no tradition of agricultural insurance and where insurance companies do not
have their own internal resources to underwrite this class of business or a rural network to distribute
and administer and adjust crop and livestock insurance separately, a coinsurance pool arrangement with
a sole entity responsible for underwriting and loss assessment may have considerable advantages and
economies of scale and there are also major cost advantages of purchasing common account
reinsurance protection for the pool (Box A5.3).
Box A5.3. ASEAN Member States with Agricultural Co-insurance Pools
ASEAN Member States:
Malaysia: 2008: Tani Malaysia livestock insurance pool was formed with nine domestic insurers and
reinsurers with Malaysian Re as lead co-insurer. The pool has not yet commenced underwriting livestock
in 2011.
Philippines: 1988: Public-private co-insurance pool for livestock insurance underwritten by the
Government Service Insurance System (GSIS) and the Philippine Livestock Management Services
Corporation (PLMSC), which has 14 participating co-insurers.
Thailand: 2007: Crop weather index insurance programme for maize underwritten by a co-insurance pool
of nine insurance companies and the Thai Reinsurance Public Company Ltd.
Thailand: 2011: The new national PPP rice insurance scheme which provides top-up cover to the existing
disaster relief scheme is underwritten by a pool of 8 local insurance companies and 9 reinsurance
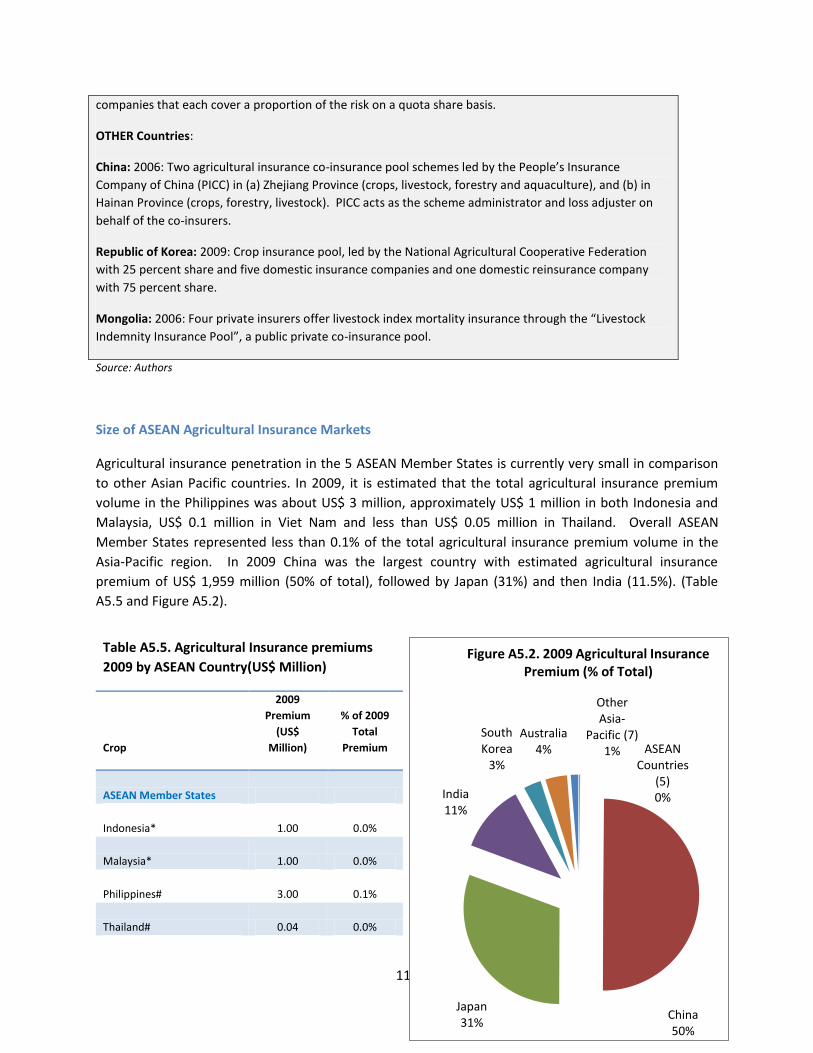
119
companies that each cover a proportion of the risk on a quota share basis.
OTHER Countries:
China: 2006: Two agricultural insurance co-insurance pool schemes led by the People’s Insurance
Company of China (PICC) in (a) Zhejiang Province (crops, livestock, forestry and aquaculture), and (b) in
Hainan Province (crops, forestry, livestock). PICC acts as the scheme administrator and loss adjuster on
behalf of the co-insurers.
Republic of Korea: 2009: Crop insurance pool, led by the National Agricultural Cooperative Federation
with 25 percent share and five domestic insurance companies and one domestic reinsurance company
with 75 percent share.
Mongolia: 2006: Four private insurers offer livestock index mortality insurance through the “Livestock
Indemnity Insurance Pool”, a public private co-insurance pool.
Source: Authors
Size of ASEAN Agricultural Insurance Markets
Agricultural insurance penetration in the 5 ASEAN Member States is currently very small in comparison
to other Asian Pacific countries. In 2009, it is estimated that the total agricultural insurance premium
volume in the Philippines was about US$ 3 million, approximately US$ 1 million in both Indonesia and
Malaysia, US$ 0.1 million in Viet Nam and less than US$ 0.05 million in Thailand. Overall ASEAN
Member States represented less than 0.1% of the total agricultural insurance premium volume in the
Asia-Pacific region. In 2009 China was the largest country with estimated agricultural insurance
premium of US$ 1,959 million (50% of total), followed by Japan (31%) and then India (11.5%). (Table
A5.5 and Figure A5.2).
Table A5.5. Agricultural Insurance premiums
2009 by ASEAN Country(US$ Million)
Crop
2009
Premium
(US$
Million)
% of 2009
Total
Premium
ASEAN Member States
Indonesia* 1.00 0.0%
Malaysia* 1.00 0.0%
Philippines# 3.00 0.1%
Thailand# 0.04 0.0%
ASEAN Countries
(5) 0%
China 50%
Japan 31%
India 11%
South Korea
3%
Australia 4%
Other Asia-
Pacific (7) 1%
Figure A5.2. 2009 Agricultural Insurance Premium (% of Total)

120
Viet Nam* 0.10 0.0%
SUB-TOTAL ASEAN 5.14 0.1%
China* 1,958.68 49.9%
Japan# 1,200.00 30.6%
India 450.00 11.5%
South Korea# 115.81 3.0%
Australia* 144.00 3.7%
Other Asia-Pacific (7)# 49.59 1.3%
TOTAL ASIA-PACIFIC 3,923.22 100.0%
Source: * Solloway 201083
; # Authors
The agricultural insurance market in the Asia-Pacific Region can be broken down into 2 main classes, (i)
crop and forestry which in 2009 accounted for US$ 2,325 million or 59% of total premium and (ii)
livestock plus poultry and aquaculture with estimated premium volume of US$ 1,598 million (41% of
total). The five largest crop and forestry insurance markets are located in China, Japan, India, Australia
and South Korea. Some of the largest livestock insurance programs in the World are located in Asia-
Pacific countries: the top five livestock insurance markets include China, followed by Japan, India, South
Korea and Australia (See Appendix A5.1. for full details).
Classes of Agricultural Insurance and Types of Products
Classes of Agricultural Insurance Available in ASEAN Member States
In 2011 crop insurance is available in four of the five ASEAN Member States with some form of
agricultural insurance: however, crop insurance is only being implemented on a commercial scale in the
Philippines and in Thailand. In the Philippines, PCIC has underwritten government subsidized MPCI crop
insurance for rice and maize farmers since 1980 as well as a wide range of non-subsidized commercial
crops. In Thailand there are two weather index crop insurance programs one of which is in its fifth year
of implementation and is achieving scale-up. In Indonesia in 2009/10 government and the Ministry of
Agriculture, MOA designed a pilot MPCI crop insurance program for famers located in West and Central,
and this is being implemented on a very small pilot scale. There are also separate proposals in Indonesia
for a new pilot weather index insurance program for maize farmers in Eastern Java. In Viet Nam
government has drawn up proposals for a major subsidized agricultural insurance program which is
intended to be launched in 2011 and there are also separate weather index programs awaiting launch
83
Solloway, R (2010) Market Overview. Paper presented at Aon Benfield Agricultural Insurance Conference, Beijing 2010.
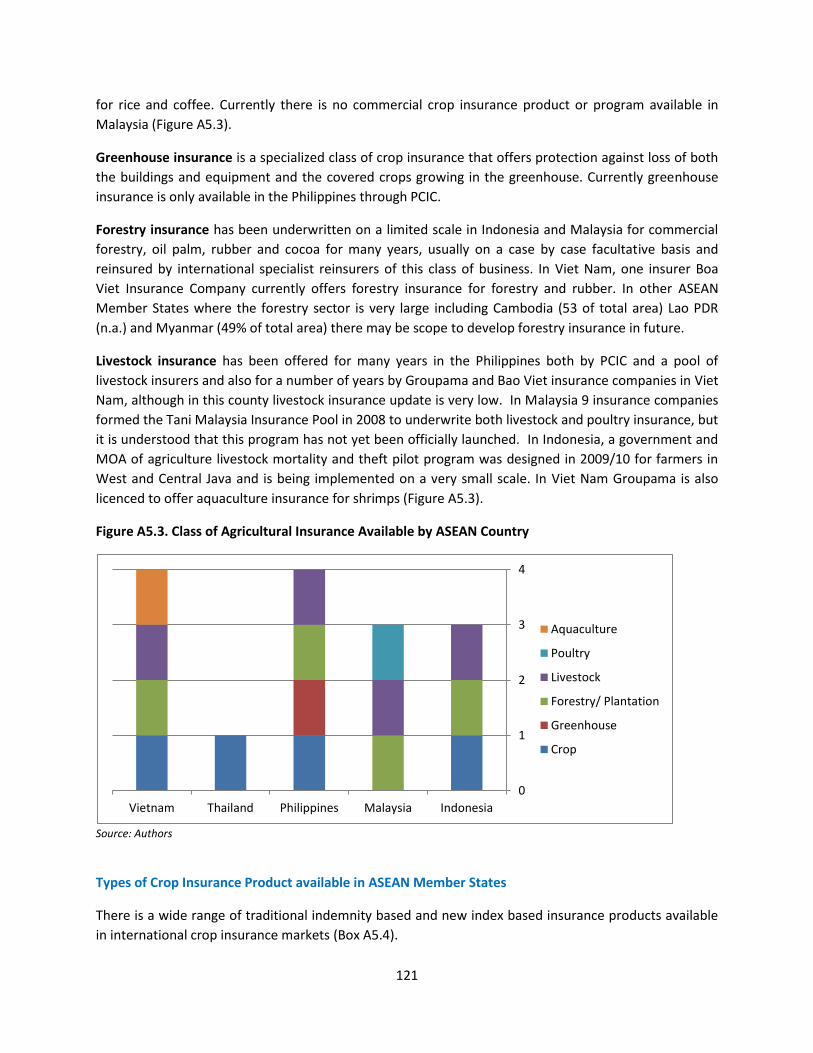
121
for rice and coffee. Currently there is no commercial crop insurance product or program available in
Malaysia (Figure A5.3).
Greenhouse insurance is a specialized class of crop insurance that offers protection against loss of both
the buildings and equipment and the covered crops growing in the greenhouse. Currently greenhouse
insurance is only available in the Philippines through PCIC.
Forestry insurance has been underwritten on a limited scale in Indonesia and Malaysia for commercial
forestry, oil palm, rubber and cocoa for many years, usually on a case by case facultative basis and
reinsured by international specialist reinsurers of this class of business. In Viet Nam, one insurer Boa
Viet Insurance Company currently offers forestry insurance for forestry and rubber. In other ASEAN
Member States where the forestry sector is very large including Cambodia (53 of total area) Lao PDR
(n.a.) and Myanmar (49% of total area) there may be scope to develop forestry insurance in future.
Livestock insurance has been offered for many years in the Philippines both by PCIC and a pool of
livestock insurers and also for a number of years by Groupama and Bao Viet insurance companies in Viet
Nam, although in this county livestock insurance update is very low. In Malaysia 9 insurance companies
formed the Tani Malaysia Insurance Pool in 2008 to underwrite both livestock and poultry insurance, but
it is understood that this program has not yet been officially launched. In Indonesia, a government and
MOA of agriculture livestock mortality and theft pilot program was designed in 2009/10 for farmers in
West and Central Java and is being implemented on a very small scale. In Viet Nam Groupama is also
licenced to offer aquaculture insurance for shrimps (Figure A5.3).
Figure A5.3. Class of Agricultural Insurance Available by ASEAN Country
Source: Authors
Types of Crop Insurance Product available in ASEAN Member States
There is a wide range of traditional indemnity based and new index based insurance products available
in international crop insurance markets (Box A5.4).
0
1
2
3
4
IndonesiaMalaysiaPhilippinesThailandVietnam
Aquaculture
Poultry
Livestock
Forestry/ Plantation
Greenhouse
Crop

122
Box A5.4. Internationally Available Crop Insurance Products
Traditional indemnity-based crop insurance:
Damage-based indemnity insurance (named peril crop insurance) - In this type of crop insurance the insurance
claim is calculated by measuring the percentage damage in the field, soon after the damage occurs. The
percentage damage measured in the field, less a deductible expressed as a percentage, is applied to the pre-
agreed sum insured. The sum insured may be based on production costs, or on the expected crop revenue. Where
damage cannot be measured accurately immediately after the loss, the assessment may be deferred until later in
the crop season. Damage-based indemnity insurance is best known for hail, but is also used for other named peril
insurance products (e.g. frost, excessive rainfall, wind).
Yield-based crop insurance (multi-peril crop insurance, MPCI) - In this case, an insured yield (e.g. tons/hectare) is
established, as a percentage of the historical average yield of the insured farmer. The insured yield is typically
between 50 percent and 70 percent of the average yield on the farm. If the realized yield is less than the insured
yield, an indemnity is paid equal to the difference between the actual yield and the insured yield, multiplied by a
pre-agreed value of sum insured per unit of yield. Yield-based crop insurance typically protects against multiple
perils, meaning that it covers many different causes of yield loss. This is because it is generally difficult to
determine the exact cause of the loss.
Crop revenue insurance - This product combines conventional loss crop yield based MPCI insurance with
protection against loss of market price at the time of sale of the crop. Currently, this product is only marketed on a
commercial basis in the USA for grains and oilseeds that are quoted on commodity markets (Chicago Board of
Trade) and where future price contracts can be combined into the revenue policy.
Greenhouse insurance. A specialist type of agricultural insurance cover combining material damage cover to
greenhouse structures and equipment and also conventional crop insurance cover (usually restricted to named
perils) to the covered greenhouse crop.
Forestry insurance. Traditional damage-based indemnity insurance against fire and allied peril losses in standing
timber. The valuation for insurance and indemnity purposes is often based on the investment and maintenance
costs up to the point where the trees can be harvested for timber following which the valuation is based on the
commercial value of the standing timber.
Index-based crop insurance:
Area-yield index insurance - Area-yield index insurance is insurance where the indemnity is based on the realized
(harvested) average yield of an area such as a county or district. The insured yield is established as a percentage of
the average yield for the area and typically ranges from 50 percent to a maximum of 90 percent of the area
average yield. An indemnity is paid if the realized average yield for the area is less than the insured yield
regardless of the actual yield on a policyholder’s farm. This type of index insurance requires historical area yield
data on which basis one can establish the normal average yield and insured yield.
Weather index insurance - This is insurance where the indemnity is based on realizations of a specific weather
parameter measured over a pre-specified period of time at a particular weather station. The insurance can be
structured to protect against index realizations that are either so high or so low that they are expected to cause
crop losses. For example, the insurance can be structured to protect against either too much rainfall or too little.
An indemnity is paid whenever the realized value of the index exceeds a pre-specified threshold (e.g. when
protecting against too much rainfall) or when the index is less than the threshold (e.g. when protecting against too

123
little rainfall). The indemnity is calculated based on a pre-agreed sum insured per unit of the index (e.g.
US$/millimeter of rainfall).
NDVI/satellite insurance - This refers to indexes constructed using time-series remote sensing imagery, for
example applications of false colour infrared waveband to pasture index insurance where the payout is based on a
NDVI (normalized dry vegetative index), which relates moisture deficit to pasture degradation. Research is
currently being conducted into applications of SAR (synthetic aperture radar) to crop flood insurance.
Source: Mahul and Stutley, 2010.
The simplest of the traditional indemnity-based products is named-peril crop insurance which adopts a
percentage damage basis of insurance and indemnity. Named peril crop hail insurance is the most
common form of product and which is available in temperate climates including parts of China, Australia
and New Zealand: crop hail insurance is not, however, applicable to most of the ASEAN region which
enjoy mainly sub-tropical climates and is not offered in any of the 4 countries where crop insurance is
currently being underwritten. In the Philippines, PCIC underwrites named peril crop insurance for
commercial crops which is termed “natural disaster cover” and excluded pests and diseases (Table
A6.6).
Multiple-peril crop Insurance, MPCI is the most widely underwritten type of crop insurance product in
the world and which is very popular with farmers because of the very comprehensive loss of yield
protection against a broad range of natural, climatic and usually biological perils afforded by this policy.
In the ASEAN region, MPCI cover has been offered in the Philippines since 1981, it is being pilot tested in
Indonesia under the MOA program in West and Central Java, and in Viet Nam government has been
designing a subsidized MPCI program which is due to start-up in 2011. The largest MPCI program in
ASEAN Member States is the subsidized rice and maize program underwritten by PCIC in the Philippines
since 1981. PCIC’s MPCI offers loss of yield coverage against climatic and biological perils (pests and
diseases). For irrigated rice the main cause of loss since scheme inception has been typhoon and flood
(54% of the total value of claims ion rice) and in the case of rain-fed maize the main cause of loss has
been drought (42% of the value of claims) . However for both crops pests and diseases have been a
significant cause of claims or 32% of claims in rice and 31% of claims in maize. On account of the very
comprehensive coverage afforded by the MPCI Policy average base rates for rice are now very high
(9.4% to 12.3% and for maize even higher (16.5% to 22.1%) (See Country Profile for further details). In
Viet Nam, Groupama experimented with MPCI crop insurance for rice in the mid-2000s but withdrew
this cover on account of low demand, severe anti-selection and financial losses (Table A6.6).
The global experience with MPCI is very mixed and programs usually experience problems of low
uptake, high levels of moral hazard and anti-selection on voluntary programs and very high
administration and operating costs especially the costs of individual field by field yield loss assessment.
MPCI programs are very exposed to systemic risk (droughts, floods, freeze, windstorm) and average
premium rates usually are very high at between 7.5% and 15%: on account of the very premium rates
cover is only affordable if accompanied by high levels of government premium subsidies. Nearly all MPCI
programs operate at a financial loss and are dependent on government support either in the form of

124
premium subsidies and or reinsurance of excess claims84. ASEAN Member States which are planning to
introduce crop insurance should therefore carefully study the potential disadvantages of individual
grower MPCI cover and alternatives (which may include area-yield index insurance and or weather index
insurance) before they opt for MPCI cover.
Standing timber or forestry fire insurance is a specialist type of damage-based insurance which is
offered for commercial forestry and for industrial plantation crops such as rubber, oil palm and cocoa.
Four of the five ASEAN Member States have to date offered forestry insurance against fire and in some
cases allied perils such as wind, the exception being Thailand. Fire policies tend to be insured on a case
by case (or facultative) basis with local insurers who provide fronting and the bulk of the risk is then
ceded to international specialist reinsurers who set the terms and conditions of cover. In some Asia-
Pacific territories such as Australia and New Zealand where forestry fire insurance has been
underwritten for many years, international reinsurers have agreed to local forestry facilities or treaty
agreements under which the local insurer may bind individual forestry risks according to pre-agreed
terms and conditions of cover and underwriting limits. In ASEAN Member States local forestry facilities
have previously been sought in Indonesia and Malaysia, but most of the large risks continue to be bound
on a facultative basis. There is a considerable accumulation exposure in the ASEAN region (especially in
Indonesia and Malaysia) to forestry fires caused by ENSO El Niño dry phases very three to five years.
Table A5.6. Types of Crop Insurance Product Available in ASEAN Member States in 2011
Country Traditional indemnity based Index Based
Named
Peril MPCI
Crop
Revenue
Crop
Greenhouse Forestry
Area
Yield Weather
Remote
Sensing
Indonesia
Malaysia
Philippines
Thailand
Viet Nam
Total 0 2 0 1 4 1 4 1
Notes:
Insurance product available on a commercial basis
insurance product is either being implemented on a pilot basis or is still awaiting launch
Source: Mahul and Stutley 2010; FAO 2011 (forthcoming)
84
See Hazell, P.B.R., C. Pomareda, and A. Valdes. 1986, Hazel 1992, on the performance of public-sectors subsidised crop insurance in the 1980s and 1990s and Mahul and Stutley 2010 for an up to date review.

125
Area-Yield Index Insurance, AYII, is considered by many agricultural insurance practitioners as an
alternative loss of yield cover to individual farmer MPCI insurance, as it does not suffer from the
inherent problems of moral hazard, anti-selection and high costs of implementation. The key difference
between AYII and MPCI is that the AYII product does not insure and indemnify yield loss at the individual
farmer and field level: rather it insures and indemnifies all farmers in a given area (e.g. a county or
district) against shortfall in the average area yield (the index). As AYII does not insure losses at the
individual farmer level, moral hazard and anti-selection are minimized and loss assessment costs are
greatly reduced (Box A6.3). The main drawback of AYII is basis risk, or the difference between the actual
area index yield and the yield outcome on individual farms: AYII cannot insure against localized losses on
individual farmers’ field for example due to hail or localized flooding. AYII is best suited in defined areas
where crop varieties and cropping systems and soils are relatively homogeneous and where there is a
marked systemic risk exposure (e.g. drought) which tends to impact in the same way in depressing yields
across all farms in the defined insured area. A further major challenge for AYII is how to speed up the
process of confirming the actual average area-yields: in India where crop-cutting is used there are
typically delays of 6 months or more for the results of crop-cutting to be published and farmers cannot
wait for so long to know whether or not they will receive an indemnity payment or not.
AYII was first tested in Sweden in the early 1950s and was introduced by government into India in the
late 1970s as an instrument to leverage small and marginal farmers’ access to seasonal production
credit: for this reason cover was made compulsory for all borrowing farmers. Furthermore, given the
mainly social objectives of this national AYII scheme the premium rates paid by farmers for food crops
and oil seeds were capped at affordable rates of between 20% to 33% of the actuarially required levels
and state and national government have provided excess of loss compensation (free reinsurance) to the
national implementing agency, Agricultural Insurance Company, AIC, of India. Today the National
Agricultural Insurance Scheme, NAIS, is the largest (in terms of numbers of insured farmers) AYII
program in the world insuring over 25 million farmers. For more than 30 years the NAIS has operated as
a heavily subsidized public sector crop insurance scheme: however, starting in the 2010/11 Rabi season
the AIC with technical assistance from the World Bank has introduced a new market-based AYII program
termed “modified NAIS” in about 10% of the districts under which the AYII scheme has been opened up
to competition by the private commercial insurance sector, actuarial rating has been introduced,
premium subsidies are provided to farmers to afford the much higher commercial premium rates and
finally part of the liability has been placed with the state reinsurer the General Insurance Corporation of
India, GIC, and international reinsurers (See Country Profile for further information on the Indian AYII
scheme).
In Thailand, the new 2011 subsidized Rice Disaster Relief Top-up scheme represents a form of area-
based multiple peril (including drought and flood) crop insurance program for rice. Claims are paid out
to any farmer whose farm is located within an area which has been declared a disaster area by the
department of agriculture and provincial government: the smallest area for which a disaster can be
declared is a sub-district. Once an area has been declared a disaster insured farmers in that area submit
their claims and losses are individually adjusted at a farmer-level where there is a total loss. The
insurance cover provides top-up indemnity over and above the government disaster relief scheme (See
Aon Benfield 2011 and Thailand County Profile for further details).
126
In Viet Nam, government through the Ministry of Finance MOF has since 2010 been working on
ambitious proposals to introduce a new subsidized crop, livestock, poultry and aquaculture insurance
program which will be tested and implemented for three years 2011-13 and on which basis decisions
will be taken whether to scale this up to cover the entire country. This program is due to be launched in
October 2011 starting with the winter season rice crop. The crop insurance program for rice is based on
an AYII policy with the district (an area of about 10 km x 10 km) as the Insured Unit: the policy will
provide loss of yield protection against catastrophe perils such as typhoon and flood, drought and frost
and also specific pests and diseases of rice (e.g. brown plant hopper disease) and insured yield coverage
levels will be set in each district to achieve average premium rates of about 4%. In order to make this
program affordable to small and marking farmers, premium subsidies of up to 100% will be provided.
The program will be marketed to the commune administration and cooperatives in 7 major rice
producing provinces in north central and southern Viet Nam including An Giang Province which is a very
important rice growing area. The authors estimate that approximately 1.8 million hectares of rice are
grown in these 7 provinces and if by year 3 a 30%-50% penetration rate can be achieved, the program
could be very significant with insured area of between 0.54 and 0.90 million hectares with TSI of
between US$ 135 million and US$ 225 million generating premium of between US$ 5.4 million and US$
9.0 million. In Viet Nam there are also separate 2011 proposals to launch an AYII program for rice
farmers which is designed to protect the loans of Agribank to these farmers: this program has not yet
been launched85. (See Viet Nam Country Profile for further details).
In August 2011, PCIC launched a new AYII pilot crop insurance scheme for rice farmers located in Leyte
Province, the Philippines86. Other Asia-Pacific countries where feasibility studies have recently been
concluded by the World Bank into the potential for AYII include China, Nepal and Bangladesh87.
AYII may offer considerable scope for development in ASEAN Member States which have large areas of
field row crops such as rice and maize, including in Indonesia, Malaysia, Loa PDR, Cambodia and
Myanmar. There are two main pre-requisites for the operation of AYII namely, i) a minimum of 10 to 15
years historical crop area, production and yield data at a district or county-level on which basis to design
and rate an AYII cover and secondly ii) an independent and accurate procedure for calculating at the
time of harvest the actual average yield of the crop and on which basis yield shortfall is measured and
indemnity payments made. In India one of the major reasons that AYII has been able to be introduced
and scaled up on such a massive scale, is the presence of a national system of crop area surveys and in-
field yield determination through sample crop-cutting.
Weather Index Insurance (WII). WII is a simplified form of insurance where payments are made based on a weather index, rather than a measurement of crop loss in the field. The index is selected to represent as closely as possible the crop yield loss likely to be experienced by the farmer. To date the most common application of WII has been for micro-level88 or individual farmer protection against
85
http://www.swissre.com/rethinking/agricultural/Yield- index_solutions 86
This program was designed with technical assistance from the German International Development Group, GIZ Manila, and from WillisRe, UK 87
See World Bank 2007, World Bank 2009 and World Bank 2010 for details respectively on AYII opportunities for China, Nepal and Bangladesh 88
However, WII also lends its self to the provision of meso-level cover for regional rural banks against catastrophe drought or flood induced crop failure thereby preventing the banks from recovering their loans from individual

127
rainfall deficit or drought, where rainfall measurements are made at a reference weather station or stations, during a defined period or defined periods, and insurance payouts are made based on a pre-established indemnity scale set out in the insurance policy. The main advantage of CWII is the elimination of adverse selection and moral hazard problems that are common to MPCI. In addition, CWII reduces administration costs (particularly because it does not require in-field inspections or loss adjustment) for the insurer and thus can make premiums more affordable. The most important challenge for CWII is basis risk namely the difference between the payout as measured by the index and the actual loss incurred by the insured farmer(s). The major operational challenge for WII is that in many low and middle income countries the density of weather stations is inadequate to support the wide-scale introduction of WII. To illustrate this problem, in the Philippines in 2010, it was not able to design rainfall deficit WII cover in Leyte Province because of the presence of only two synoptic weather stations in the entire province which could provide adequate historical daily rainfall data on which basis to design, rate and implement WII cover.
In the ASEAN Member States major attention is currently being focused on the potential for weather
index insurance. In Thailand there are currently two crop WII programs under implementation, including
(i) since 2006 a 3-vegetative phase rainfall deficit WII program for maize89 which is underwritten by a
coinsurance pool of nine local insurance companies and Thai Reinsurance Public Company Ltd and (ii) a
separate pilot cumulative rainfall-deficit index program for rice that started implementation in 2009 and
which is underwritten by Sompo Japan Insurance (Thailand) Company (SJIT). These two WII programs
are purely voluntary and do not attract any form of government premium subsidy support: the main
challenge faced by these 2 programs is how to achieve commercial scale-up.
In the Philippines Microensure in conjunction with Malayan Insurance Company launched two index
products in 2009, i) a multi-phase rainfall deficit cover for rice farmers and ii) a Remote Sensing-based
Typhoon damage index, again for rice farmers. The pilot drought and typhoon index programs were
tested with about 450 rice farmers in Iloilo and Antique, Panay Island Western Visayas and were free of
claims: however on account of concerns over basis risk and lack of reinsurance protection the programs
were not renewed in 2010 pending further review and development. Microensure is currently testing
new simpler rainfall index products based on the number of dry and wet days.
In Viet Nam there have been 2 initiatives to implement WII including i) a World Bank and ADB funded
project between 2008 and 2010 to design and rate a flood index cover for rice producers located in
Dong Thap Province of the Mekong River Delta and which was intended as a meso-level business
interruption cover to be marked to VIBARD the leading agricultural bank lending seasonal crop-credit to
the rice producers and ii) a separate Ford Foundation funded project for drought index cover for coffee
producers in Dak Lak Province in the Central Highlands of Viet Nam. Both product design studies have
been completed and their launch is pending decisions by policy makers and the insurance companies.
farmers. WII has also been marketed as a meso-level food security instrument to governments in 2 countries, Ethiopia and Malawi and as a meso-level catastrophe windstorm insurance instrument sold to Island Governments in the Caribbean. 89
The maize rainfall deficit program was designed by the Commodity Risk Management Group of the World Bank (CRMG)
128
In Indonesia, between 2009 and 2010 a technical feasibility study was implemented for a new pilot WII
program covering rainfall deficit in maize grown by farmers located in Eastern Java: this program is
currently awaiting launch90.
To date in the Asia-Pacific Region, WII is very new and the only country which to date has achieved
commercial scale-up is India where the public-sector insurer AIC91 currently underwrites a large WII
portfolio which is linked on a compulsory basis to crop-credit and where the premiums are subsidized by
state and national governments. In addition, the private commercial WII insurers in India have achieved
significant sales of this product to small farmers in spite of the fact that until recently they have not
qualified for premium subsidies. If WII is to be a successful crop insurance product in ASEAN territories
special attention will have to be given in the design to delivery channels and ways of achieving rapid
scale-up and sustainability.
Types of Livestock Insurance Product available in ASEAN Member States
Livestock insurance covers a wide range of animals: horses, cattle (dairy and beef), swine, sheep, goats, and domestic animals. It also includes poultry insurance, aquaculture insurance (freshwater and marine) and specialist bloodstock insurance for high value reproductive or show animals. The main types of traditional indemnity-based livestock insurance product available include: (i) standard accident and mortality cover; (ii) epidemic disease cover; (iii) all risk mortality cover. Normally livestock insurance is provided on an individual animal basis for large animals such as horses and cattle: however, for small ruminants and for poultry, insurance cover is offered on a herd or flock basis and in the case of aquaculture, insurance is on a fish-cage or pond basis. In additional livestock index mortality insurance is currently offered in one country in the World, Mongolia. (Box A5.5).
Box A5.5. Types of traditional and index livestock insurance products
Traditional livestock insurance:
Named peril accident and mortality insurance for individual animals is the basic traditional product for insuring
livestock. The cover includes death against natural perils such as fire, flood, lightning, electrocution, but normally
excludes diseases and specifically epidemic diseases. Premiums are set based on normal mortality rates within the
permitted age range, plus risk and administrative margins, and are generally quite expensive. Furthermore, as
mortality is to a considerable extent influenced by management, the product suffers from adverse selection by the
highest risk farmers.
Herd insurance is a variation on individual animal mortality cover for larger herds. A deductible is introduced,
where a certain number of animals or a percentage of the animals must be lost before an indemnity is paid.
90
. In addition in Indonesia, starting in 2009 the International Finance Corporation of the World Bank and the Australian Agency for International Development (AUSAID) has financed a feasibility study from drought weather index insurance for maize farmers located in selected locations in East Java. This study has been completed and is awaiting approval for implementation. See IFC (2010) Weather Index Insurance for Maize Production in Eastern Indonesia: A Feasibility Study. International Finance Corporation, World Bank Group, supported by Australia Indonesia Partnership, Kemitraan Australia Indonesia 91
In 2009/10 AIC underwrote its weather based crop insurance scheme (WBCIS) in 139 districts in 13 states with about two million insured farmers an insured area of 2.7 million ha, TSI of US$900 million and a premium of about US$80 million (Rao 2010).
129
All risk mortality insurance including diseases. In some countries, all risk accident and mortality insurance
including diseases is provided to large commercial farms that can demonstrate high levels of animal husbandry and
control over animal diseases. Such covers are normally offered for high value bloodstock or for herd insurances.
Epidemic disease insurance is offered in only a few countries, most notably Germany. Insurance of government
ordered slaughter or quarantine is normally excluded. Epidemic disease insurance carries major and infrequent
catastrophic claim exposures necessitating a high reliance on reinsurance for risk transfer. Because of the
difficulties of modelling epidemic disease spread and financial exposures, it is difficult to develop this type of
insurance and to obtain support from international reinsurers.
Index livestock insurance:
Index insurance for livestock has been applied for mortality risk in Mongolia where there is a high correlation of
livestock losses with an indexable extreme weather parameter (i.e. low temperature), and applications of satellite
imagery/NDVI indexes for some pasture and rangeland products in Canada, the United States and Spain.
Source: Mahul and Stutley, 2010
Livestock insurance is very important in Asia and the Pacific region and in 2009 was available in 15 (88 percent) of the 17 countries studied that have some form of agricultural insurance. Some of the largest livestock insurance markets in the world by premium volume are found in China, Japan, Republic of Korea and India. The most common form of livestock insurance product is named peril accident and mortality cover found in 13 (76 percent) countries with livestock insurance, followed by epidemic disease cover in five (29 percent) countries (FAO 2011, forthcoming).
Livestock insurance is relatively under-developed in the ASEAN Member States and currently is only available on a commercial scale in the Philippines and in Viet Nam. In the Philippines there are two separate livestock insurance programs, the Philippine Livestock Management Services Corporation scheme (PLMSC) which is a pool of 14 livestock insurers and then PCIC independently underwrites its own livestock portfolio (Table A6.7). Livestock insurance against accidental death and disease is offered by PCIC and the pool insurers for all commercial classes of livestock. Limited livestock epidemic disease coverage is available.
In Viet Nam Boa Viet the largest insurance company underwrites a very restricted accident and mortality livestock insurance portfolio in 2011. Groupama, the French Mutual agricultural insurance company was registered in Viet Nam in 2001 to underwrite crop and livestock insurance business: currently the company is insuring a tiny portfolio of cattle and it is also licensed to underwrite aquaculture insurance for fish and shrimps.
In October 2011, it is planned to launch the major PPP Pilot Agricultural Insurance Scheme 2011-13 in Viet Nam and which includes three classes of livestock insurance, (i) cattle and pigs, (ii), poultry and (iii) aquaculture insurance for fin fish, prawns and shrimps. Livestock insurance will cover epidemic diseases in cattle and pigs such as blue-ear disease and foot and mouth disease (FMD), poultry insurance will cover epidemic diseases including avian flu and aquaculture insurance will cover natural perils such as storm and flood and restricted cover for diseases of fish and shrimps, subject to the use of suitably high deductibles. The livestock insurance programs will receive government premium subsidy support.

130
In Indonesia, the MOA pilot livestock insurance project in West and Central Java in 2009 insured a total of 135 cattle in 2009 under an individual animal mortality and theft policy.
In Malaysia, the Tani Malaysia Pool designed a cattle and poultry insurance program in 2008, but this program had not yet been launched by mid-2010 pending agreements between the pool insurers and its reinsurers on the wordings and other terms and conditions of cover. It is not known whether there have been any developments on this scheme in 2011.
Cambodia is understood to be examining the potential to introduce micro-insurance for livestock92. No additional details of this initiative are available. There is, however, in south Asia much experience with livestock micro-insurance that Cambodia could draw on in designing a suitable system for its own livestock sector. Bangladesh, Nepal and India have considerable experience with mutual or community-based micro-insurance livestock credit guarantee protection schemes. In Bangladesh, for example, several leading NGOs/MFIs, including the Grameen Bank and Proshika have implemented small-scale livestock micro-insurance programmes for many years to protect their investment loans to dairy cattle and water buffalo livestock producers. Typically the insurance provides all risk mortality cover during the two to three year loan repayment period and the sum insured is fixed in accordance with the loan amount. The NGOs operate their own internal livestock indemnity funds without any form of catastrophe reinsurance protection. Similar livestock insurance products are provided under the MFI and or community-based schemes in Nepal and India. The key issues and challenges for these micro-insurance livestock programs include: they are usually non-regulated schemes and are therefore not recognised as formal insurance, they do not carry any form of excess of loss reinsurance protection and the schemes are therefore very exposure to catastrophe losses (e.g. to storm and flood and epidemic diseases) and they cease to provide insurance protection to the livestock owner once the loan has been repaid.
In Lao PDR, where there is currently no agricultural insurance available a recent demand study showed that in many rural areas one for the main forms of household savings was through investment in livestock and that farmers perceived livestock illness resulting in death as their second most important risk transfer requirement93. This finding clearly shows the need to develop appropriate livestock accident and mortality micro-insurance for farmers in Lao and in other ASEAN Member States.
Aquaculture production is extremely important in Asia: the region has 11 million fish farmers or the largest number in the world, most of whom are small and medium sized operators and in 2004, Asia accounted for 91 percent of the global production of farmed fish by volume, valued at about US$57 billion with annual average growth rates of 7.7 percent. In many parts of Asia, however, underwriters are unwilling to grant aquaculture insurance cover to small-scale fish and shrimp producers because these producers cannot meet the high husbandry and management standards required by insurers, the prohibitively high costs of insuring small risks and the Insurers’ perception that they will incur high losses (FAO 2007). This current study of ASEAN Member States has identified only one country where aquaculture insurance is available albeit on a very restricted scale namely in Viet Nam. Other non-HIC countries in the region with aquaculture insurance include China and South Korea.
92
PhnomPenhPost 2011. Micro-insurance rules nearly finished. 26 May 2011 93
Allianz AG, GTZ, and UNDP Public Private Partnership, 2006. MicroInsurance Demand and Market Prospects, Lao People’s Democratic Republic, August 2006

131
Table A5.7. Types of Livestock Insurance Product Available in ASEAN Member States in 2011
Country Traditional indemnity insurance Index Based
Livestock Accident
& Mortality
Livestock
Epidemic
Disease Poultry Aquaculture Livestock Mortality Index
Indonesia
Malaysia
Philippines
Thailand
Viet Nam
Total 4 2 2 1 0
Notes:
Insurance product available on a commercial basis
insurance product is either being implemented on a pilot basis or is still awaiting launch
Source: Mahul and Stutley 2010; FAO 2011 (forthcoming)
Insurance Uptake and Penetration in ASEAN Region
Agricultural insurance premium as a percentage of agricultural GDP
A useful measure of insurance penetration rates is to compare agricultural insurance premiums to Agricultural Gross Domestic Product, Ag.GDP. In the Asia and Pacific Regions the highest agricultural insurance penetration rates in 2009 were in countries such as Australia (0.57% of Ag.GDP) and New Zealand (0.39), which have well developed commercial insurance markets, a long history of crop and livestock insurance and where farmers know and understand the role of agricultural insurance; or in countries such as Japan (1.75%), China (0.4%) and South Korea (0.5%) where governments’ have a strong policy towards public support for agricultural insurance and provide farmers with high levels of premium subsidies by way of an incentive to purchase agricultural insurance and in the case of India (0.22%) compulsory crop-credit insurance combined with subsidized premium rates. Conversely in the rest of the region, the highest penetration rates were 0.012% in Pakistan and the Philippines and in all other territories including the other ASEAN Member States with some form of agricultural insurance, less than 0.01% of Agricultural GDP in 2009 (Figure A5.4).

132
Figure A5.4. Asia and the Pacific region: Agricultural insurance penetration rates
Source: FAO 2011 (Forthcoming)
Insured farmers, acreage and number of insured livestock
Further information on agricultural insurance penetration rates is provided by comparing the ratios of insured crop area to total cultivated area and the number of insured livestock to total national herd numbers. Table A6.8 and Table A6.9 present summaries for the ASEAN Member States of the most recent insurance penetration rates for crop and livestock insurance respectively and full details are contained in the individual Country Profiles.
In the Philippines where PCIC has now been underwriting individual grower MPCI crop insurance for more than 30 years and in the cases of rice and maize, where crop insurance linked on a compulsory basis to public-sector production credit, the 2007 penetration rate of slightly greater than 70,000 Ha is very low or less than 2% of the national cropped area of rice and maize. PCIC’s underwriting of agriculture is constrained by the relatively low budgetary allocation by government for premium subsidies: it is not therefore able to achieve its mandate to be a national crop insurer in the Philippines.
In Thailand the voluntary unsubsidised Pool Maize WII scheme is now in its fifth year of implementation and has achieved some degree of scale up in recent years following a major sales promotion drive by the Bank of Agriculture and Agricultural Cooperatives, BACC, the distributing agent: in 2010 a total of 3,182 policies were sold with an insured area of nearly 10,000 Ha of maize representing 1% of the total maize area in Thailand. The separate voluntary and again unsubsidised Rice WII scheme which is in its 3rd year of pilot implementation sold 1,158 polices in 2010 and has achieved a significant increase in 2011 of 6,173 policy sales. In 2011, the new government 50% premium subsidised PPP rice insurance scheme in Thailand which provides top-up protection to the existing government disaster relief programme was expected to achieve a penetration rate of about 15% of the national rice area of 57 million rai (about 9.1 million Ha) with a total sum insured, TSI of THB 11,790 million (US$ 400 million) and a premium income
0.0000%
0.2000%
0.4000%
0.6000%
0.8000%
1.0000%
1.2000%
1.4000%
1.6000%
1.8000%
2.0000%
0.0%
5.0%
10.0%
15.0%
20.0%
25.0%
30.0%
35.0%
40.0%
Agr
icu
ltu
ral I
nsu
ran
ce P
en
etr
atio
n R
ate
%
Agr
icu
ltu
ral G
DP
as
% G
DP
2008 Agricultural GDP % 2009 Agricultural Insurance Penetration Rate %

133
of THB 1,026 million (US$ 34 million) (AonBenfield 2011)94. Due to delayed inception of this new scheme it is understood that the actual uptake in 2011 has been 26,800 sales or about one-fifth of the planned area. Finally in Thailand under the government price support scheme for rice, cassava and maize a total nearly 4 million farmers (or more than 75% of total) received price compensation in 2009/10 valued at THB 36,438 million (about US$ 1.2 billion)95.
In the other ASEAN Member States, the Indonesian crop insurance pilot was implemented on a very small scale only in 2009 and current levels of uptake in 2010/11 are not known. In Viet Nam neither Bao Viet nor Groupama issued any crop insurance policies in 2009 and if they have subsequently underwritten any crop business this will only have been on a very restricted scale. In 2011, Malaysia has yet to implement crop insurance and this also applied to Myanmar, Cambodia and Lao PDR.
Table A5.8. Crop Insurance Penetration Rates ASEAN Region
Country Crop Insurance
Availability in 2011
Latest
year
No Insured
Farmers
Insured Area
(Ha)
Crop Penetration as % of
Potential Insured Crop
Area or Insured Values
Indonesia Pilot MPCI 2009 600 100 <0.0%
Malaysia No
Philippines PCIC MPCI 2009 37,810 70,036 <2%
WII Drought & Typhoon
cover 2009 467 677 <0.0%
Thailand Maize WII 2010 3,182 9,695 1.0%
Thailand Rice WII 2011 6,173 n.a. <1%
Thailand Government Rice Scheme 2011 26,800 n.a. (2011 Planned 15% of total
rice area: actual 3%-5%)
Viet Nam (Forestry only) 2009
Source: Authors
Livestock insurance penetration rates in ASEAN Member States are extremely low. PCIC only issued 6,273 livestock policies in 2007 (most recent year from which figures available) with total livestock sum insured of about US$ 2.1 million generating premium of slightly less than US$ 100,000. Details of the separate Pool Livestock insurance scheme are not available. In Indonesia livestock sales in 2009, the first year of the pilot mortality and theft insurance program for cattle were very small: it is not known whether the scheme has been scaled up in 2010-11 (Table A5.9).
In Viet Nam livestock sales in 2007 were also extremely low: however, this situation is expected to change significantly between 2011-13 when government launches the subsidised PPP for livestock (cattle and buffalo), poultry and aquaculture in 10 provinces. (See Country Profile for further details).
94
AonBenfield 2011. Thailand Rice Insurance. Thailand Case Study in conjunction with the World Bank 15 August 2011. 95
Yimlami, A. (2010) Agricultural Weather Index Insurance in Thailand. BAAC, July 2010

134
Table A5.9. Livestock Insurance Penetration Rates ASEAN Region
Country Livestock Insurance in 2011 Latest
Year No Farmers
Head of
Animals
Livestock Penetration %
of national herd insured
Indonesia Pilot Mortality & Theft for
cattle 2009 135 135
<0.0%
Malaysia Yes (not implementational) 2007
Philippines PCIC 2007 6,273 All livestock <0.0%
Philippines PCIC 2007 3,597 cattle 0.14%
Philippines PCIC 2007 6, 606 swine <0.0%
Philippines PCIC 2007 1, 145 goats <0.0%
Thailand No livestock insurance
Viet Nam Cattle Insurance n.a. n.a. n.a. <0.0%
Source: Authors
By way of conclusion, it is apparent that apart from the major new subsidised PPP initiative in Thailand for rice which started up in 2011 and the subsidised PPP planned for Viet Nam from 2011-13 for crops, livestock, poultry and aquaculture that there is currently very little penetration by or growth in agricultural insurance in the other ASEAN Member States. There will be major challenges for policy-makers in these countries to find ways to support and encourage private commercial insurers to develop and implement and scale-up the range of products and services they offer to farmers in their countries.
Performance of Agricultural Insurance in ASEAN Region
The financial performance of the major crop and livestock insurance schemes in the Asia and Pacific
Region is reviewed below using premium to claims ratios (loss ratios) for the period 2003-2007 and
where possible updated results to 2009. The analysis is divided into 2 types of scheme for comparative
purposes, (i) the government subsidized crop and livestock programs and (ii) programs which receive no
government premium subsidies at all. For the subsidized programs, two performance ratios are
available, the “loss ratio” (equal to claims divided by 100% premium) and the “producer loss ratio”
(equal to claims divided by the non-subsidized portion of the premium paid by farmers). As a guideline,
where the average loss ratio over a number of years exceeds 70% to 75% the company will be losing
money as it will not be covering its claims costs plus its business acquisition costs and administration
and operating overheads, let alone generating underwriting profits for its shareholders.
The performance of the government subsidized and then non-subsidized crop insurance schemes in the
Asia Pacific Region are compared in Figure A5.5 and Appendix A5.2. The analysis shows that most of the
heavily subsidized national crop insurance schemes in Asia have gross loss ratios of about 70% or above
which implies that they are operating at break-even position at best and in both India and Bangladesh
the government crop insurance schemes have performed very much poorly. The producer loss ratios are
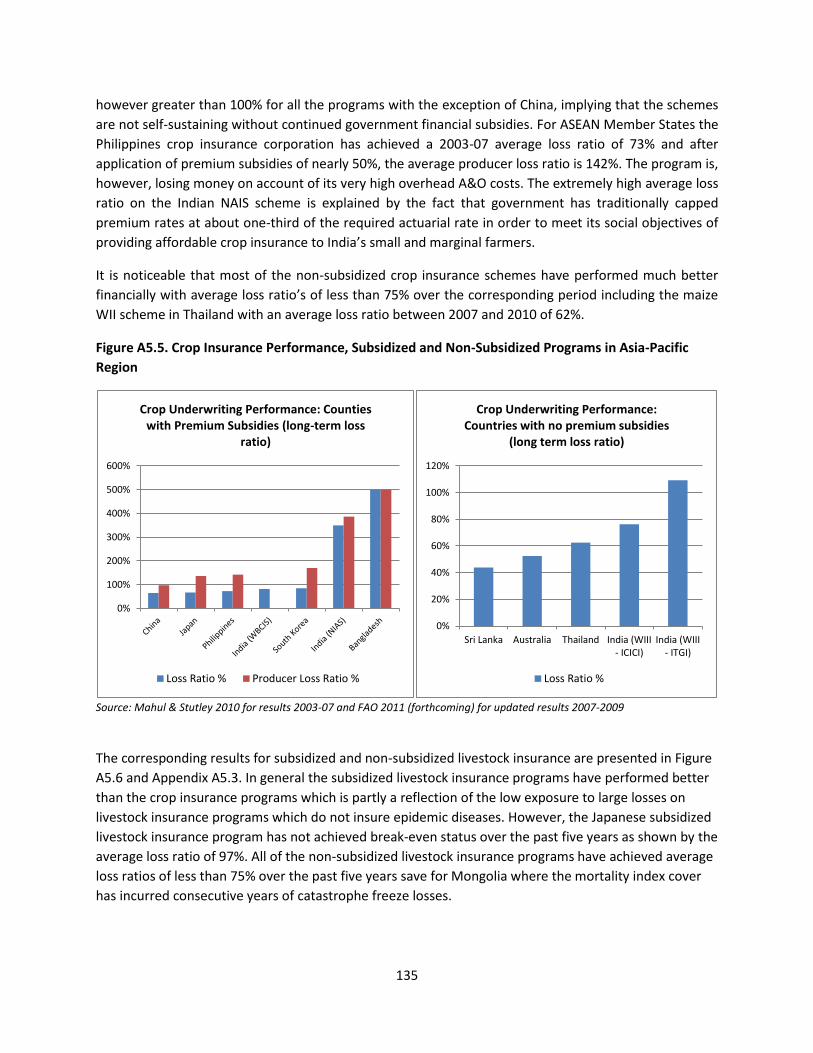
135
however greater than 100% for all the programs with the exception of China, implying that the schemes
are not self-sustaining without continued government financial subsidies. For ASEAN Member States the
Philippines crop insurance corporation has achieved a 2003-07 average loss ratio of 73% and after
application of premium subsidies of nearly 50%, the average producer loss ratio is 142%. The program is,
however, losing money on account of its very high overhead A&O costs. The extremely high average loss
ratio on the Indian NAIS scheme is explained by the fact that government has traditionally capped
premium rates at about one-third of the required actuarial rate in order to meet its social objectives of
providing affordable crop insurance to India’s small and marginal farmers.
It is noticeable that most of the non-subsidized crop insurance schemes have performed much better
financially with average loss ratio’s of less than 75% over the corresponding period including the maize
WII scheme in Thailand with an average loss ratio between 2007 and 2010 of 62%.
Figure A5.5. Crop Insurance Performance, Subsidized and Non-Subsidized Programs in Asia-Pacific
Region
Source: Mahul & Stutley 2010 for results 2003-07 and FAO 2011 (forthcoming) for updated results 2007-2009
The corresponding results for subsidized and non-subsidized livestock insurance are presented in Figure
A5.6 and Appendix A5.3. In general the subsidized livestock insurance programs have performed better
than the crop insurance programs which is partly a reflection of the low exposure to large losses on
livestock insurance programs which do not insure epidemic diseases. However, the Japanese subsidized
livestock insurance program has not achieved break-even status over the past five years as shown by the
average loss ratio of 97%. All of the non-subsidized livestock insurance programs have achieved average
loss ratios of less than 75% over the past five years save for Mongolia where the mortality index cover
has incurred consecutive years of catastrophe freeze losses.
0%
100%
200%
300%
400%
500%
600%
Crop Underwriting Performance: Counties with Premium Subsidies (long-term loss
ratio)
Loss Ratio % Producer Loss Ratio %
0%
20%
40%
60%
80%
100%
120%
Sri Lanka Australia Thailand India (WIII- ICICI)
India (WIII- ITGI)
Crop Underwriting Performance: Countries with no premium subsidies
(long term loss ratio)
Loss Ratio %

136
Figure A5.6. Livestock Insurance Performance, Subsidized and Non-Subsidized Programs in Asia-Pacific
Region
Source: Mahul & Stutley 2010 for results 2003-07 and FAO 2011 (forthcoming) for updated results 2007-2009
The main conclusion from this simple profitability analysis is that the non-subsidized crop and livestock
insurance schemes operate under a much higher level of financial responsibility as they are more
accountable to their shareholders for generating profitability than under the government subsidized
programs. The evidence also refutes the argument that crop and livestock insurance cannot be
underwritten without premium subsidies.
Public Sector Support to Agricultural Insurance in ASEAN Member States
Government support to agricultural crop and livestock insurance is extremely high in the Asia Pacific
Region and this is increasingly becoming a feature in the ASEAN sub-group of countries. The most
common form of support is through premium subsidies both to promote agricultural insurance and to
make this more affordable to the predominantly small farmers in these territories. In 2011,
governments provide premium subsidies to crop insurance in 70% of the 14 countries with some form of
crop insurance in 2011 and premium subsides for livestock insurance in 50% of the 14 countries which
underwrite livestock insurance (Figure A5.7). This is followed by government support to reinsurance and
in 6 countries (43% of total with crop insurance) there is either a national reinsurer which supports crop
insurance, or government itself provides catastrophe excess of loss protection including in India (state
and national government share 50:50 in the excess losses on the NAIS scheme), China (some provincial
governments participate in excess of loss programs) and in South Korea (government provides excess of
loss reinsurance of losses excess 180% of GNPI). Government provides reinsurance support for livestock
programs in 5 (36%) of the countries with livestock insurance. Other forms of government intervention
include legal and regulatory support for agricultural insurance, in some countries including India and
South Korea government subsidies the costs of agricultural insurance implementation including loss
adjustment expenses and in others support is provided to research and development and training and
education programs for insurance staff and farmers. (Figure A5.7 and Appendix A5.4 and Appendix
A5.5).
0%
50%
100%
150%
200%
Nepall(SFCL)
Nepal(DICGC)
India SouthKorea
Japan
Livestock Underwriting Performance: Countries with Premium Subsidies (long-
term loss ratio)
Loss Ratio% Producer Loss Ratio %
0%20%40%60%80%
100%120%
Livestock Underwriting Performance: Countries with NO Premium Subsidies
(long-term loss ratio)
Loss Ratio%

137
Figure A5.7. Government Support to Agricultural Insurance in Asia and Pacific Regions in 2011
(a) Crop Insurance (b) Livestock Insurance
Source: Mahul & Stutley 2010; FAO 2011(forthcoming) and updated to 2011 by authors
In the ASEAN Group of countries, in 2011 governments are providing agricultural insurance premium
subsidies for: the PCIC rice and maize scheme in the Philippines, the Indonesian pilot crop and livestock
insurances program in West and Central Java, the Thailand national rice insurance scheme and in Viet
Nam for the new crop, livestock, poultry and aquaculture insurance programs. In Indonesia under the
PPP pilot crop and livestock insurance, government through the MOA financed 100% of the premiums in
2009. It is understood that MOA planned to bear the full costs of premiums for the first two years of the
program before asking farmers to bear the insurance costs (IFC 2011).
In the Philippines, PCIC’s premium subsidy levels on the rice and maize MPCI schemes are currently
about 65% and 80% of the technical or risk premium according to the risk zone: under the compulsory
crop-credit insurance agreement PCIC has with the banks, PCIC covers 75% of the premium subsidies
through government and the lending institutions finance about 25% of the premium subsidies. In 2007
PCIC’s crop premium amounted to US$2.4 million and the premium subsidies would have been in the
order of about US$ 1.75 million. Livestock insurance in the Philippines does not currently attract
government premium subsidies. (See Country Profile for further details).
In Thailand government has introduced crop insurance premium subsidies for the first time on the 2011
national rice insurance scheme. The premium subsidy level has been set at 50% of the fixed premium
rate of THB 120 per hectare. Government is extremely committed to insuring all the rice area and all
farmers under the rice scheme over time and has authorized BACC to provide maximum subsidies up to
THB 3.99 billion (US$ 132 million): in 2011 the planned scheme uptake was 15% of total rice area, with
expected sum insured of US$ 400 million and premium income of US$ 34 million (AonBenfield 2011).
This would imply a 2011 planned cost of about US$ 17 million for the 50% premium subsidy equivalent
to average premium subsidy of about US$ 12.5 per hectare of insured rice (AonBenfield 2011).
In Viet Nam the government is also proposing to provide very high levels of premium subsidy support to
the three year 2011-13 pilot crop, livestock, poultry and aquaculture programs: for near-poor and poor
households and individual farmers premium subsidies will be between 80% and 100% of the cost of
0%10%20%30%40%50%60%70%80%
0%
10%
20%
30%
40%
50%
60%
138
premiums, for other farm households and individual farmers the subsidy level will be 60% and
agricultural production organizations will quality for 20% premium subsidies. Details of government’s
financial allocation to premium subsidies over the three year pilot project are not available, but given
the very high implied subsidy levels and ambitious coverage plans, the costs of subsidies is likely to run
into many tens of millions of dollars.
The costs to governments of premium subsidy and reinsurance subsidy support in the Asia-Pacific
Region have increased dramatically in recent years. In 2007 total agricultural insurance premiums in the
region amounted to about US$ 2.31 billion of which government financial subsidies amounted to US$
0.892 billion or 39% of total premium (Mahul and Stutley 2010). By 2009 total agricultural insurance
premium had increased to US$ 3.92 billion but the share of premium subsides had risen
disproportionately to US$ 1.96 billion or 50% of total premium. Four countries, China, Japan, India and
South Korea accounted for nearly 99% of the total agricultural insurance premium subsidies in the
region (FAO 2011 forthcoming).
While it is likely that lower and middle income countries such as China and India can continue to provide
massive public-sector financial support for agricultural insurance premium subsidies, it is questionable
whether other governments in the region which are currently seeking to develop PPP agricultural
insurance systems could afford such high levels of funding. PCIC in the Philippines is a case where
increased government premium subsides are not available and this means the scheme cannot increase
its coverage for the subsidized rice and maize programs.
Role of Government in Promoting Agricultural Insurance
Following the very poor experience with public sector MPCI programs in the 1970s and 1980s both
globally and specially in the Asia and Pacific Region there has been a marked shift away from public to
private agricultural insurance, usually through public-private partnerships PPPs. This study has
highlighted the changes in countries from public to PPP agricultural insurance in several ASEAN Member
States including Viet Nam and Thailand and similar changes in China and India. In general the switch
from public to private-sector implemented agricultural insurance schemes has led to greater
accountability, more effective management over underwriting and risk selection and especially in the
adjusting of losses and this is reflected in the improved underwriting results.
The evidence also strongly suggests that in emerging economies where insurance markets are relatively
poorly developed and where there is no tradition of agricultural insurance provision or infrastructure, if
agricultural insurance is to be successfully introduced through the private sector, that governments can
provide play extremely important roles in assisting in the start-up phase and in enabling the programs to
achieve scalability and sustainability. Specific areas where government can provide support under an
appropriate PPP with the private commercial insurers are listed below in Box A6.6.
An important role for government is to address market and regulatory imperfections and to encourage
participation by the private insurance sector through developing risk market infrastructure, such as a
strong and enabling legal and regulatory framework, public awareness campaigns, data collection and
management, and capacity building (Mahul & Stutley 2010). In the specific case of index insurance
(area-yield and weather index), it is important that the introduction of these non traditional insurance
139
products is accompanied by a review of and where necessary amendments to insurance legislation to
enable these products legally to be offered by the insurance markets. Similarly governments can support
the introduction of index insurance, for example as has happened in India, by investing in strengthening
the weather station network density and in improving the public-sector area-yield crop-cutting
capabilities.
Government support to reinsurance may be justified on two grounds, either where agricultural
insurance is in a start-up phase and is not mature enough to attract international reinsurance capacity,
as in the case of the Mongolia livestock index program, or when it is more cost effective for government
to provide catastrophe risk layering than to seek to place this into international capital or reinsurance
markets (Mahul and Stutley 2010).
The role of government support in the form of premium subsidies should be carefully analyzed under
any planned PPP agricultural insurance program for the ASEAN region. In the Asia and Pacific Region
premium subsidies currently account for about 50% of total premiums and this is placing a huge
financial burden on governments. It remains to be seen whether low and middle income countries in
the region which are now developing PPP agricultural insurance systems will be able to afford premium
subsidies. The World Bank does not support the argument that premium subsidies are always a
necessary precondition to induce crop and livestock producers to purchase crop insurance: the evidence
shows that where crop and livestock insurance products are carefully design to meet the farmers’ real
risk exposures and risk transfer requirements that farmers are willing to afford and take up such
products (Mahul and Stutley 2010). In many cases it may therefore be more cost-effective for
governments to subsidize the start-up costs and strengthening of risk management infrastructure of
these new PPP agricultural insurance programs.
Box A5.6. Roles for the government in supporting agricultural insurance
Legal and regulatory framework. One of the most important functions for governments in facilitating
agricultural insurance markets is to establish an appropriate legal and regulatory framework and, where necessary, to enact specific agricultural insurance legislation.
Enhancing data and information systems. Time-series data and information on crop production and yields
and climate are essential for the design and rating of any traditional crop insurance product or new weather index product. Governments can provide an invaluable service by creating national databases and making these databases available to all interested private commercial insurers either free of cost or at concessionary rates.
Product research and development. Among the major start-up costs for any new crop or livestock insurance
programme is the design (including the design of loss assessment procedures) and rating of new products and pilot testing the new products and programmes. Such costs may be prohibitive for individual private commercial insurers especially in developing countries. In such situations there is justification for governments to provide financial support to product design and rating, especially where the products and rates are then made available to all interested insurers.
Education, training and capacity building. Governments can play an important role in new agricultural
insurance programmes by supporting farmer awareness and education programmes, capacity building workshops and technical training programmes for key agricultural insurance staff.
Catastrophe risk financing. Agricultural insurance often has to protect against catastrophe perils of flood,
drought, and windstorm in crops and epidemic disease outbreak in livestock. Most insurance companies do not

140
have adequate capital to retain their catastrophe risk exposures and they typically purchase some form of contingency financing and/or reinsurance protection. For new companies that do not have large amounts of capital and have not yet built up claims reserves, the ability to retain risk is usually low and they typically need to purchase quota share treaty reinsurance and to then seek non-proportional reinsurance protection on their retention. In start-up situations where the insurance company does not have an established track record and loss history, the costs of reinsurance protection may be very high. In such situations, government support to the reinsurance programme may be highly cost effective.
Public sector premium subsidies. Premium subsidies are the most widely practiced form of government
support to agricultural insurance - they are practiced by over two-thirds of countries that have some form of agricultural insurance. Governments justify the provision of agricultural insurance premium subsidies on the grounds that they make insurance more affordable for farmers, particularly small and marginal farmers, thereby increasing the rate of adoption and uptake of agricultural insurance. There are, however, some major drawbacks of premium subsidies, e.g. they disproportionately benefit larger farmers to the detriment of small and marginal farmers, they tend to promote moral hazard in that they encourage crop production in high risk regions, once premium subsidies are introduced they are very difficult to reduce or to withdraw, and they represent a major cost to governments.
Source: Authors based on Mahul and Stutley 2010
Issues, Challenges and Options for ASEAN Member States
This final section summaries some of the technical, institutional, operational and financial issues,
challenges and options that ASEAN Member States are likely to face in promoting agricultural insurance
in their own countries.
Technical Challenges
In the ASEAN region the catastrophe nature of the main risks (typhoons, floods, drought, and epidemic
diseases) affecting agriculture will pose major challenges for the design of suitable risk transfer products
and to place these with local insurance and international reinsurance markets. The starting point in each
territory will be to conduct detailed risk mapping and modeling for each of these catastrophe perils to
quantify the key hazards facing agriculture, to map the risk exposures for each agricultural sub-sector
and to then develop damage models for each hazard for risk rating and probable maximum loss
assessment purposes. This is a specialist activity and which is likely to require assistance from the donor
community, international risk modeling companies and or leading reinsurers. While market-based
agricultural insurance solutions are likely to be available for wind and drought, flood is a very difficult
peril to insure either under traditional indemnity-based products and this also applies to index products.
Epidemic disease cover in livestock is again a very complex area to insure (see further comments below).
Product development will need to be carefully considered. Only one ASEAN country to date, PCIC in the
Philippines has tried with modest success to implement individual grower MPCI. For ASEAN Member
States such as Loa DPR, Cambodia, Myanmar and Malaysia which are seeking to develop crop insurance
for the first time, it is unlikely that MPCI will offer a large-scale solution. Rather it is recommended that
these countries should explore opportunities for developing area-yield index insurance, AYII, building on
the experience of neighbouring countries such as India and most recently Viet Nam. There may also be
opportunities to develop weather index insurance (rainfall deficit and flood products), but here the main
141
challenge with be how best to deliver and market index products – either at the individual farmer
(micro-level) or as at a regional aggregator level (meso-level insurance). Named peril crop and forestry
insurance should be promoted where a need is identified.
The experience of Thailand in developing an innovative damage based total loss policy for rice which
provides top-up cover for the existing disaster relief program operated through the public sector merits
further attention. Other countries which have natural disaster relief programs may wish to consider
linking ex-ante formal crop insurance mechanisms (with technically determined premium rates and pre-
agreed indemnity payout formula) to their ex-post disaster relief compensation schemes. Indonesia is
one country which is apparently studying the possibilities of utilizing part of its “disaster budget” more
effectively to fund crop insurance premiums.
For livestock, standard animal accident and mortality cover should be relatively easy to design and
implement. Planners will, however, need to conduct detailed epidemic disease modeling to establish
catastrophe exposures prior to offering epidemic disease cover in livestock and poultry. The lessons of
countries such as Taiwan where an FMD outbreak in 1997 lead to more than 3.8 million head of swine
being culled at a cost of US$ 6.9 billion and subsequent devastation of the pig export industry and
Malaysia where an outbreak of Nipah virus between 1998-99 led to 1.1 million pigs having to be culled
and total economic costs to the industry of more than RM 1.1 billion should be very carefully considered
in deciding whether to introduce epidemic disease cover in livestock. A further determining factor will
be international reinsurers’ appetite for reinsuring epidemic diseases and unless livestock veterinary
services and animal vaccination programs are well developed in the country it is very unlikely reinsurers
will approve such cover.
Institutional Challenges
Governments in the ASEAN region should promote market-based agricultural insurance through private
agricultural insurance companies, backed up wherever possible by commercial reinsurance (local and
international reinsurance). Government’s main roles should be to create an enabling legal and
regulatory environment which will promote the crowding in of private commercial insurers into this
difficult class of agricultural insurance business.
In ASEAN Member States with no expertise or tradition in agricultural insurance there will be major
challenges to convince insurers to invest in recruitment and training of underwriting and field-based
staff, in product design and rating and in putting in place underwriting and claims management systems
and operating procedures: the start up costs of putting in place this basic infrastructure is often
prohibitively expensive for individual insurance companies. Here, there are many potential economies of
scale which can be gained from forming a Pool coinsurance system. Pools offer the ability to form a
single underwriting and claims management unit to handle all operations on behalf of the pool
coinsurers: there are also major potential cost savings from pooling risk when it comes to the purchase
of reinsurance protection for the pool. In the ASEAN region examples of Agricultural Insurance Pools
apply to Thailand and Indonesia and Malaysia and it is recommended that this institutional model is
considered by other ASEAN Member States which are only now starting-up their own PPP agricultural
insurance schemes.
142
ASEAN Governments should actively promote PPPs in their regions and establish clearly defined roles for
the private sector insurers and supporting public sector organizations. The previous section has
recommended a series of important roles governments may play under these PPPs especially in creating
risk market infrastructure and in funding start-up costs.
From a legal perspective ASEAN governments which are introducing new agricultural insurance
programs will also need to decide whether agricultural insurance should be purely voluntary or linked on
a compulsory basis to seasonal credit (as in the Philippines and India). In the case of livestock epidemic
disease cover which has the potential to impact adversely on the wider economy and on society, there is
a strong case to make this class of insurance compulsory for all livestock producers. In most other cases,
however, it is preferable that agricultural insurance is a voluntary class of business.
Operational Challenges
Most agriculture in the ASEAN Member States is dominated by small scale farmers or “micro” buyers of
insurance and the key challenge for insurance companies will be how to deliver and administer
agricultural insurance products and services to these small-scale farmers cost-effectively. In this context,
insurers will need to partner with local aggregators which already have rural client networks and existing
distribution channels including the national and rural banks (e.g. BAAC in Thailand to which every rice
farmer is affiliated) or the rural cooperatives in Viet Nam and the many cooperative banks and micro-
finance organizations in the Philippines.
There is evidence from many parts of the world that offering agricultural insurance alone is not a useful
intervention for small scale farmers and that for agricultural insurance to be effective it should be
bundled with other products and services, including for example credit for the purchase of news seeds
and fertilizers and preferably output marketing services. In addition for agricultural insurance to scale-
up it must be accompanied by intensive awareness and education and training programs for small
farmers. Similarly the experience with livestock micro-insurance in southern Asia (India and Bangladesh)
is that livestock insurance is most effective where this is combined with livestock veterinary services and
training in animal husbandry practices.
While the focus of most agricultural insurance in ASEAN Member States is likely to be for individual
farmer or micro-level insurance, due attention should also be to designing and implementing meso-level
index insurance solutions to financial aggregators and input suppliers and farmer organizations.
Financial Challenges
In each territory and for each agricultural insurance program, financial risk modeling is a pre-requisite to
a sound understanding of the probable maximum loss, PML, that could be experienced on the program
for a given return period (e.g. 1 in 250 years). This risk modeling exercise will enable a financial risk
layering exercise to be carried out and to layer and price an insurance and reinsurance program.
Under certain circumstances it may be cost-effective for national governments to particulate in the risk
layering, risk financing program or in other words to provide free reinsurance capacity for catastrophe
layers.
143
In most circumstances, however, it is recommended that the insurers should first seek to place their
reinsurance program (either on a proportional or non –proportion basis or a combination of both) with
local and international reinsurers.
Government financial support for start-up costs and for creating risk management infrastructure should
be encouraged under PPP arrangements in ASEAN Member States. Agricultural insurance premium
subsidies should only be considered where these are specifically targeted at a particular commodity or
group of farmers and where government and the insurers have a clear strategy for the budgeting of
subsidies and the time-frame over which they will be provided. Open-ended premium subsidy programs
are not recommended and it is unlikely that they could be afforded by the lower and medium income
ASEAN Member States.

144
Appendix A5.1. 2009 Crop (+Forestry) and Livestock(Including Poultry and Aquaculture) Insurance
Premiums by Country (US$ Million)
Country
2009 Crop +
Forestry
Premium
(US$
Million)
% of 2009
Crop +
Forestry
Premium
2009 Livestock
+ Poultry +
Aquaculture
Premium (US$
Million)
% of 2009
Livestock
Premium
Total
Premium
(US$
Million)
% of 2009
Total
Premium
ASEAN Member States
Indonesia* 1.00 0.0% 1.00 0.0%
Malaysia* 1.00 0.0% 1.00 0.0%
Philippines# 2.80 0.1% 0.20 0.0% 3.00 0.1%
Thailand# 0.04 0.0% 0.04 0.0%
Viet Nam# 0.03 0.0% 0.08 0.0% 0.10 0.0%
SUB-TOTAL ASEAN 4.87 0.2% 0.28 0.0% 5.14 0.1%
Australia* 119.50 5.1% 24.50 1.5% 144.00 3.7%
Bangladesh# 0.10 0.0% 0.10 0.0%
China* 1,214.38 52.2% 744.30 46.6% 1,958.68 49.9%
India* 360.00 15.5% 90.00 5.6% 450.00 11.5%
Japan# 528.00 22.7% 672.00 42.1% 1,200.00 30.6%
Mongolia# 0.09 0.0% 0.09 0.0%
Nepal# 0.00 0.0% 0.13 0.0% 0.13 0.0%
New Zealand# 12.50 0.5% 12.50 0.8% 25.00 0.6%
North Korea# 20.00 0.9% 20.00 0.5%
Pakistan* 4.00 0.2% 0.10 0.0% 4.10 0.1%
South Korea# 61.81 2.7% 54.00 3.4% 115.81 3.0%
Sri Lanka# 0.09 0.0% 0.08 0.0% 0.17 0.0%
SUB-TOTAL ASIA-
PACIFIC 2,320.28 99.8% 1,597.80 100.0% 3,918.08 99.9%
TOTAL PREMIUM 2,325.15 100.0% 1,598.07 100.0% 3,923.22 100.0%
% of Total Premium 59% 41% 100%
Sources: * Solloway 2010; # Authors

145
Appendix A5.2. Crop insurance underwriting results by country, Asia-Pacific Region
Countries with premium
subsidies and or public
programmes Period Currency
Total crop
premium Total crop claims Loss ratio
Average
crop
premium
subsidy % Producer premium
Producer loss
ratio
Pakistan 2008/09 US$ 3 800 000 280 000 7% 58% 1 600 000 18%
China 2003–2007 US$ 254 86 887 165 448 366 65% 34% 168 934 813 98%
Japan 2003–2007 US$ 2 092 416 600 1 401 555 872 67% 51% 1 026 951 613 136%
Philippines 2003–2007 US$ 9 520 591 6 935 714 73% 49% 4 887 186 142%
India (WBCIS) 2007–2009 RS 5 770 130 000 4 705 300 000 82% n.a. n.a. n.a.
Republic of Korea 2001–2009 US$ 355 000 000 302 460 000 85% 50% 177 500 000 170%
India (NIAS) 1999–2009 Rs 44 278 855 000 154 859 953 000 350% 10% 40 033 375 000 387%
Bangladesh 1977–1995 Taka 3 962 337 19 766 803 499% 0% 3 962 337 499%
Countries with NO premium
subsidies and private
insurance Period Currency
Total crop
premium Total crop claims Loss ratio
Average
crop
premium
subsidy % Producer premium
Producer loss
ratio
Sri Lanka 2004–2007 US$ 276 890 121 331 44% 0% 276 890 44%
Australia 2003–2007 US$ 133 179 386 69 907 358 52% 0% 133 179 386 52%
Thailand 2007–2010 US$ 250 754 156 698 62% 0% 250 754 62%
India (WIII - ICICI) 2003–2007 US$ 2 292 690 1 748 070 76% 0% 2 292 690 76%
India (WIII - ITGI) 2205–2007 US$ 2 230 143 2 439 199 109% 0% 2 230 143 109%
Source: Mahul and Stutley, 2010 and FAO 2011 (forthcoming)

146
Appendix A5.3. Livestock insurance underwriting results by country
Countries with Premium
Subsidies Period Currency
Total Livestock
Premium
Total Livestock
Claims Loss Ratio%
Average
Livestock
Premium
Subsidy %
Producer
Premium
Producer Loss
Ratio %
Nepal (SFCL) 1987-2006 NRs. 113,032,000 10,212,000 9% 50% 56,516,000 18%
Nepal (DICGC) 1987-2006 NRs. 135,141,000 51,945,000 38% 50% 67,570,500 77%
India 1997-2004 RS 10,785,700,000 8,587,900,000 80% 50% 5,392,850,000 159%
South Korea 2005-2008 US$ 169,647,563 137,657,947 81% 50% 84,823,781 162%
Japan 2003-2007 US$ 2,850,490,540 2,752,512,650 97% 48% 1,474,008,600 187%
Countries with NO Premium
Subsidies Period Currency
Total Livestock
Premium
Total Livestock
Claims Loss Ratio%
Average
Livestock
Premium
Subsidy %
Producer
Premium
Producer Loss
Ratio %
Philippines 2003-2007 US$ 326,526 187,596 57% 0% 326,526 57%
Nepal (CLDP) 2004-2008 NRs. 831,778 536,130 64% 0% 831,778 64%
Bangladesh (SBC) 1981-2008 Taka 5,734,364 3,220,500 56% 0% 5,734,364 56%
Bangladesh (Proshika) 1990-2009 Taka 31,400,000 21,300,000 68% 0% 31,400,000 68%
Bangladesh (Grameen) 2001-2005 Taka 1,975,000 1,485,000 75% 0% 1,975,000 75%
Mongolia 2007-2008 US$ 176,381 203,082 115% 0% 176,379 115%
Source: Mahul and Stutley, 2010 and FAO 2011 (forthcoming)

147
Appendix A5.4. Types of Government Support to Crop Insurance, Asia and Pacific Region (2011)
Country
Crop
Insurance in
2011
Insurance
Legislation
Insurance
Premium
Subsidies
Admin. &
Operational
Subsidies
Loss
Assessment
Subsidies
Public Sector
Reinsurance
Other Support
(R&D, Training)
Australia Yes
Bangladesh No
China Yes
India Yes
Indonesia Yes (Pilot)
Japan Yes
Malaysia No
Mongolia No
Nepal Yes (Pilot)
New Zealand Yes
North Korea Yes
Pakistan Yes
Philippines Yes
South Korea Yes
Sri Lanka Yes
Thailand Yes (2011)
Viet Nam Yes (2011)
Total 14 4 10 5 3 6 6
Percent of countries
with Crop Insurance 29% 71% 36% 21% 43% 43%
Source: Mahul & Stutley (2010); FAO (2011 forthcoming), author’s update to 2011
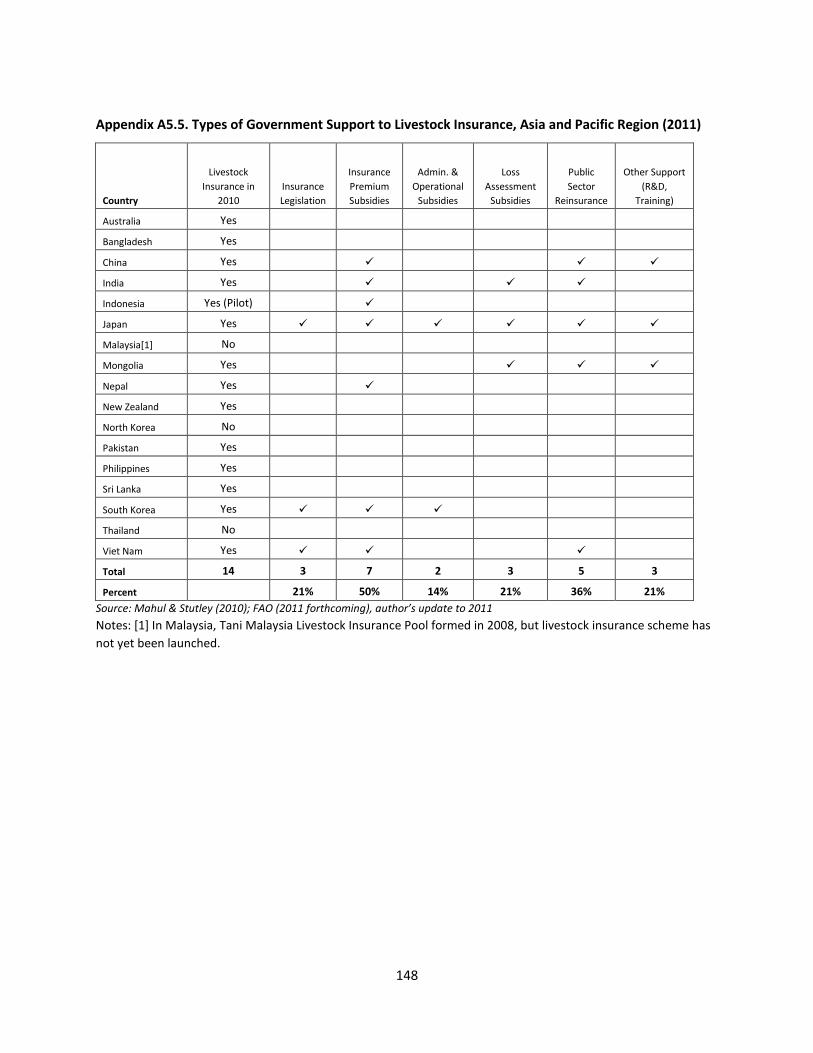
148
Appendix A5.5. Types of Government Support to Livestock Insurance, Asia and Pacific Region (2011)
Country
Livestock
Insurance in
2010
Insurance
Legislation
Insurance
Premium
Subsidies
Admin. &
Operational
Subsidies
Loss
Assessment
Subsidies
Public
Sector
Reinsurance
Other Support
(R&D,
Training)
Australia Yes
Bangladesh Yes
China Yes
India Yes
Indonesia Yes (Pilot)
Japan Yes
Malaysia[1] No
Mongolia Yes
Nepal Yes
New Zealand Yes
North Korea No
Pakistan Yes
Philippines Yes
Sri Lanka Yes
South Korea Yes
Thailand No
Viet Nam Yes
Total 14 3 7 2 3 5 3
Percent 21% 50% 14% 21% 36% 21%
Source: Mahul & Stutley (2010); FAO (2011 forthcoming), author’s update to 2011
Notes: [1] In Malaysia, Tani Malaysia Livestock Insurance Pool formed in 2008, but livestock insurance scheme has
not yet been launched.

149
Brunei Darussalam Agricultural Insurance Market Profile
Importance of Agriculture
The agricultural sector plays a small role in Brunei Darussalam’s economy, which is primarily driven by
extensive petroleum and natural gas extraction. Of Brunei’s total land area of 5, 270 km2, 2.2% or 11,400
hectares were devoted to agriculture in 2008 of which 3,000 hectares, was arable. Agricultural
employment only represented 1.4% of total employment in 2001. Agricultural production accounted for
0.7% of total GDP in 2007, evidencing agriculture’s small participation in the country’s economy.
The most important crops produced in 2009 include cassava, cucumbers, gherkins, rice (paddy), and
leguminous vegetables. Livestock production consists on small scale chicken, duck, cattle, sheep and
goats production, with significant stocks of buffaloes and cattle and the poultry sector accounting for
96% of meat produced in the country for 2009.
Table A5.10. Major crops produced in Brunei Darussalam in
2009*
Crop
Area Harvested
(Ha)
Production
(Tons)
Cassava 180 2,993
Cucumbers and gherkins 188 2,112
Rice, paddy 1,062 1,371
Leguminous vegetables 167 1,360
Pineapples 125 988
Bananas 254 842
Spinach 148 668
Pumpkins, squash and
gourds 31 504
Roots and Tubers 389 484
Oranges 66 435 *Source: FAOSTAT: http://faostat.fao.org/default.aspx; Data retrieved 5 September 2011.
Figure A5.8. Meat Production in Brunei
Darussalam for 2009*
Table A5.11 Livestock in Brunei Darussalam in 2009*
Livestock Stocks (Head)
Buffaloes 4,600
Cattle 1,000
Chickens (in 000's) 16,000
Ducks (in 000's) 220
Goats 3,000
Pigs 1,300
Sheep 3,800
96%
4% 0% 0% Poultry
Beef andBuffaloSheep andGoat
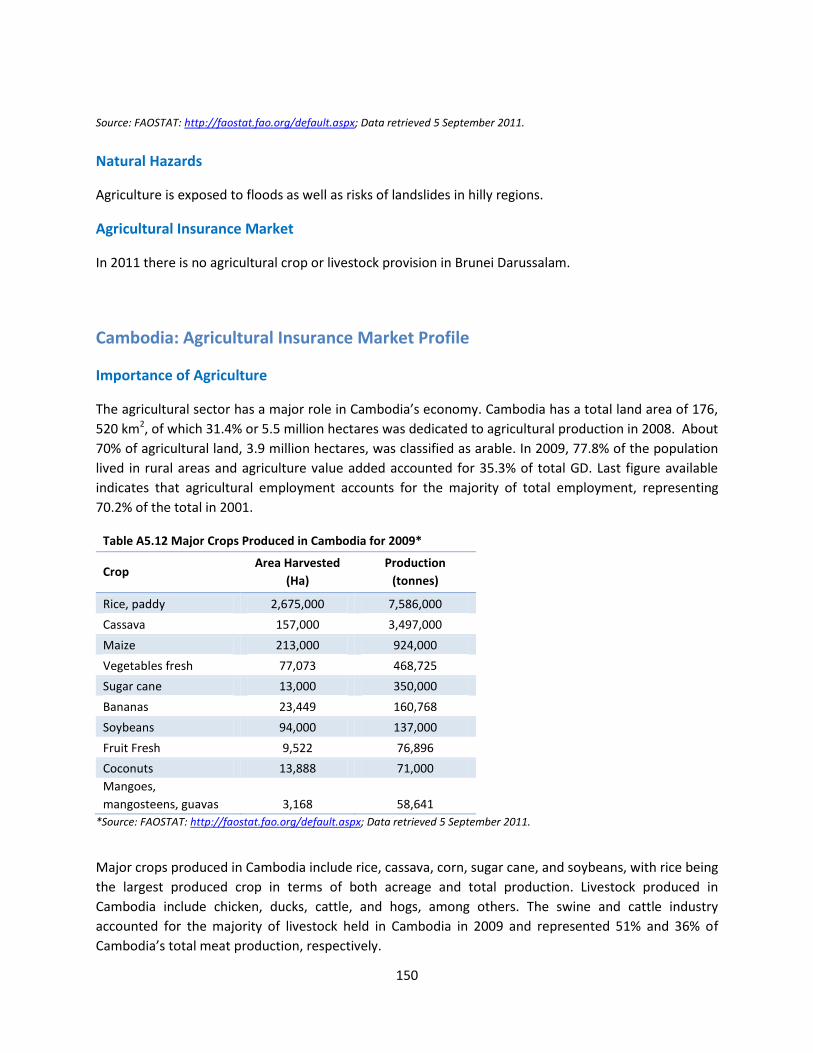
150
Source: FAOSTAT: http://faostat.fao.org/default.aspx; Data retrieved 5 September 2011.
Natural Hazards
Agriculture is exposed to floods as well as risks of landslides in hilly regions.
Agricultural Insurance Market
In 2011 there is no agricultural crop or livestock provision in Brunei Darussalam.
Cambodia: Agricultural Insurance Market Profile
Importance of Agriculture
The agricultural sector has a major role in Cambodia’s economy. Cambodia has a total land area of 176,
520 km2, of which 31.4% or 5.5 million hectares was dedicated to agricultural production in 2008. About
70% of agricultural land, 3.9 million hectares, was classified as arable. In 2009, 77.8% of the population
lived in rural areas and agriculture value added accounted for 35.3% of total GD. Last figure available
indicates that agricultural employment accounts for the majority of total employment, representing
70.2% of the total in 2001.
Table A5.12 Major Crops Produced in Cambodia for 2009*
Crop Area Harvested
(Ha)
Production
(tonnes)
Rice, paddy 2,675,000 7,586,000
Cassava 157,000 3,497,000
Maize 213,000 924,000
Vegetables fresh 77,073 468,725
Sugar cane 13,000 350,000
Bananas 23,449 160,768
Soybeans 94,000 137,000
Fruit Fresh 9,522 76,896
Coconuts 13,888 71,000 Mangoes,
mangosteens, guavas 3,168 58,641 *Source: FAOSTAT: http://faostat.fao.org/default.aspx; Data retrieved 5 September 2011.
Major crops produced in Cambodia include rice, cassava, corn, sugar cane, and soybeans, with rice being
the largest produced crop in terms of both acreage and total production. Livestock produced in
Cambodia include chicken, ducks, cattle, and hogs, among others. The swine and cattle industry
accounted for the majority of livestock held in Cambodia in 2009 and represented 51% and 36% of
Cambodia’s total meat production, respectively.

151
Figure A5.9 Meat Production in Cambodia for
Table A5.13 Livestock in Cambodia for 2009* 2009*
Livestock Stocks (Head)
Cattle 3,550,000
Pigs 2,200,000
Buffaloes 750,000
Horses 28,000
Chickens (in 000's) 17,000
Ducks (in 000's) 7,000
*Source: FAOSTAT: http://faostat.fao.org/default.aspx; Data retrieved 5 September 2011.
Natural Hazards
Floods and droughts are the main natural hazards affecting Cambodia’s agriculture.
Agricultural Insurance Market
In 2011 there is no agricultural crop or livestock provision in Cambodia.
Indonesia: Agricultural Insurance Market Profile
Importance of Agriculture
Indonesia is the largest economy in the South-East Asia. Agriculture is a relatively important economic
sector in Indonesia. Of the 1.8 million km2 land area encompassing Indonesia, 26.6% was devoted to
agricultural production in 2008. This amounted to 48.1 million hectares devoted to agricultural activities,
of which 22 million hectares were arable. Rural population accounted for and 47.4% of the total and
agriculture’s value added accounted for 15.8% of total GDP. Further, agricultural employment
represented 41.2% of total employment in 2007.
Among Indonesia’s most important crops are palm fruit, rice, sugar cane, and cassava. Livestock
production is also significant in the country, with important stocks of goats and cattle and the poultry
industry accounting for the largest share of meat produced in 2009.
Table A5.14. Major Crops Produced in Indonesia for 2009*
Crop
Area
Harvested
(Ha)
Production
(Tons)
Oil palm fruit 5,000,000 86,000,000
Rice, paddy 12,883,600 64,398,900
Sugar cane 420,000 26,500,000
Cassava 1,175,670 22,039,100
Coconuts 3,231,710 21,565,700
Maize 4,160,660 17,629,700
Bananas 105,000 6,273,060
51% 36%
13% Pig
Beef andBuffalo
Poultry
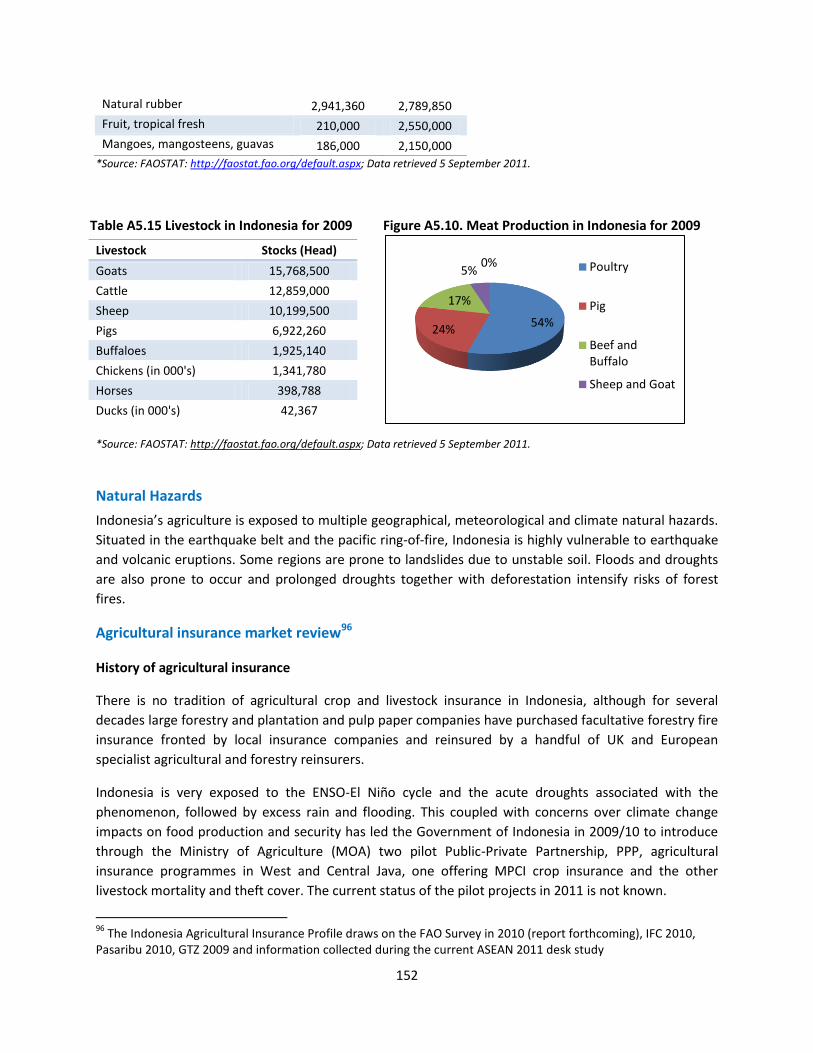
152
Natural rubber 2,941,360 2,789,850
Fruit, tropical fresh 210,000 2,550,000
Mangoes, mangosteens, guavas 186,000 2,150,000
*Source: FAOSTAT: http://faostat.fao.org/default.aspx; Data retrieved 5 September 2011.
Table A5.15 Livestock in Indonesia for 2009 Figure A5.10. Meat Production in Indonesia for 2009
*Source: FAOSTAT: http://faostat.fao.org/default.aspx; Data retrieved 5 September 2011.
Natural Hazards
Indonesia’s agriculture is exposed to multiple geographical, meteorological and climate natural hazards.
Situated in the earthquake belt and the pacific ring-of-fire, Indonesia is highly vulnerable to earthquake
and volcanic eruptions. Some regions are prone to landslides due to unstable soil. Floods and droughts
are also prone to occur and prolonged droughts together with deforestation intensify risks of forest
fires.
Agricultural insurance market review96
History of agricultural insurance
There is no tradition of agricultural crop and livestock insurance in Indonesia, although for several
decades large forestry and plantation and pulp paper companies have purchased facultative forestry fire
insurance fronted by local insurance companies and reinsured by a handful of UK and European
specialist agricultural and forestry reinsurers.
Indonesia is very exposed to the ENSO-El Niño cycle and the acute droughts associated with the
phenomenon, followed by excess rain and flooding. This coupled with concerns over climate change
impacts on food production and security has led the Government of Indonesia in 2009/10 to introduce
through the Ministry of Agriculture (MOA) two pilot Public-Private Partnership, PPP, agricultural
insurance programmes in West and Central Java, one offering MPCI crop insurance and the other
livestock mortality and theft cover. The current status of the pilot projects in 2011 is not known.
96
The Indonesia Agricultural Insurance Profile draws on the FAO Survey in 2010 (report forthcoming), IFC 2010, Pasaribu 2010, GTZ 2009 and information collected during the current ASEAN 2011 desk study
Livestock Stocks (Head)
Goats 15,768,500
Cattle 12,859,000
Sheep 10,199,500
Pigs 6,922,260
Buffaloes 1,925,140
Chickens (in 000's) 1,341,780
Horses 398,788
Ducks (in 000's) 42,367
54% 24%
17%
5% 0% Poultry
Pig
Beef andBuffalo
Sheep and Goat

153
Moreover, since 2009 the International Finance Corporation of the World Bank, in conjunction with the
Australian Agency for International Development (AUSAID) has financed a feasibility study for the
introduction of micro-level (individual farmer) rainfall deficit insurance for maize farmers located in
Negusa Tenggara Barat (NTB) and East Lombok, East Java. The current status in 2011 of this maize WII
project is that the feasibility study has been completed and decisions are pending by local stakeholders
whether to proceed with the implementation of a pilot project (IFC 2010).
In 2011 it is understood that MOA has invited the insurance industry, represented by the Insurance
Association (AAUI) to form a focus group for the implementation of an agricultural insurance scheme.
The AAUYI has presented its outline proposals for a nation-wide parametric rice only crop insurance
scheme covering harvest failure due to natural disasters: the insurers are seeking government support
to pay premiums in full for the first 3 to 5 years and thereafter premiums to be shared on a 70:30 basis.
The insurers are also seeking stop loss protection to limit their liability to 100% loss ratio. Ten insurance
companies have indicated their interest in this scheme and are currently filing their interest with the
Insurance Bureau of BAPEPAM LK, which is insurance industry regulator97.
Flood weather index insurance has in fact been implemented in Indonesia since 2009, but not for
agriculture. A flood index insurance scheme for small and marginal urban property owners in Jakarta
was designed by GTZ in collaboration with Munich Re between 2006 and 2008 and is currently
underwritten by the Asuransi Wahana TataInsurance Company. This scheme uses manual river-height
gauge stations to trigger an indemnity. The product was launched in 2009 but has yet to achieve
significant sales levels (GTZ 2009).
Agricultural insurance market structure
In 2005 there were over 150 registered life and non-life insurance companies in Indonesia with total
market premium of about US$3.8 billion (1.4 percent of GDP). For life insurance the market penetration
rate is 0.8 percent of GDP and lower for non-life insurance at 0.6 percent of GDP.
Currently there are no companies that are specialists in agricultural insurance. Under the MOA’s 2009
PPP pilot crop (and livestock) insurance programs in West and Central Java, the program has been
operated by MOA and Daspindo, a local insurance broker, under a coinsurance agreement with a group
(pool) of ten local insurance companies.
Agricultural insurance products available
Forestry and plantation fire cover is available on a facultative basis for commercial standing timber
(eucalyptus, pine, acacia etc.) and plantation crops (e.g. oil palm).
Under the 2009/10 MOA pilot initiatives, traditional indemnity based MPCI crop insurance cover is being
offered to rice growers and an individual animal mortality and theft cover is being marketed to livestock
raisers.
97
Untitled (2011) Note on Agricultural Insurance in Indonesia
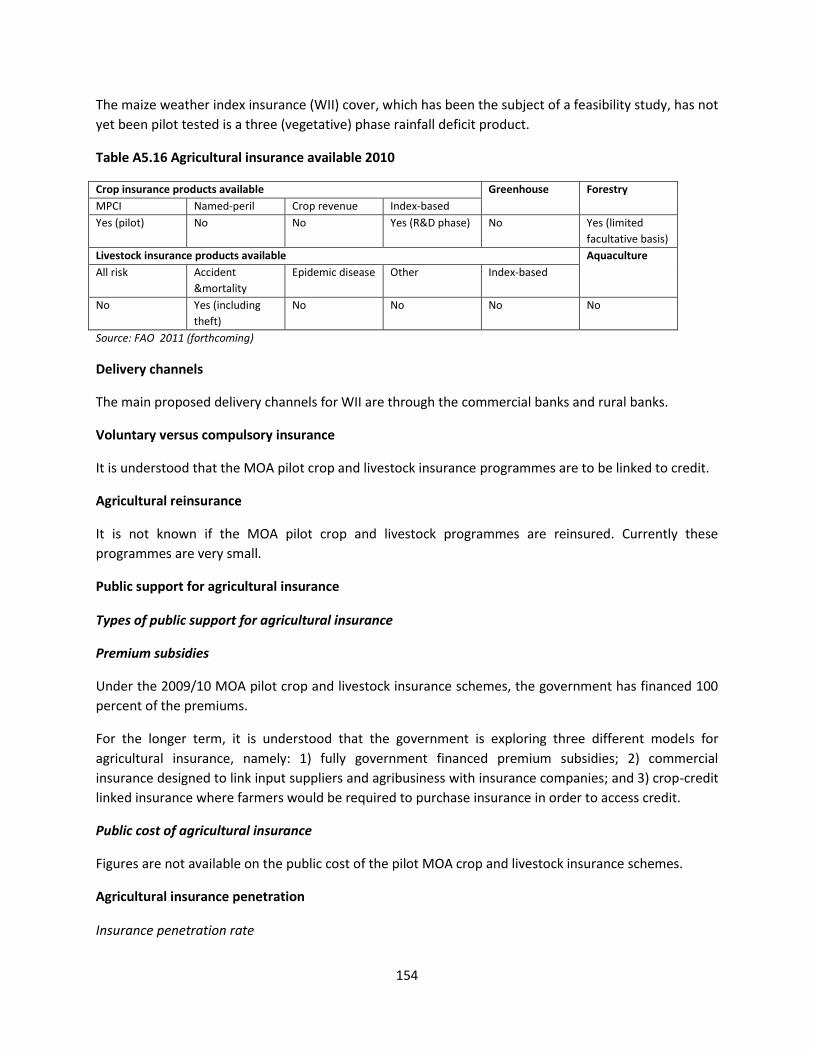
154
The maize weather index insurance (WII) cover, which has been the subject of a feasibility study, has not
yet been pilot tested is a three (vegetative) phase rainfall deficit product.
Table A5.16 Agricultural insurance available 2010
Crop insurance products available Greenhouse Forestry
MPCI Named-peril Crop revenue Index-based
Yes (pilot) No No Yes (R&D phase) No Yes (limited
facultative basis)
Livestock insurance products available Aquaculture
All risk Accident
&mortality
Epidemic disease Other Index-based
No Yes (including
theft)
No No No No
Source: FAO 2011 (forthcoming)
Delivery channels
The main proposed delivery channels for WII are through the commercial banks and rural banks.
Voluntary versus compulsory insurance
It is understood that the MOA pilot crop and livestock insurance programmes are to be linked to credit.
Agricultural reinsurance
It is not known if the MOA pilot crop and livestock programmes are reinsured. Currently these
programmes are very small.
Public support for agricultural insurance
Types of public support for agricultural insurance
Premium subsidies
Under the 2009/10 MOA pilot crop and livestock insurance schemes, the government has financed 100
percent of the premiums.
For the longer term, it is understood that the government is exploring three different models for
agricultural insurance, namely: 1) fully government financed premium subsidies; 2) commercial
insurance designed to link input suppliers and agribusiness with insurance companies; and 3) crop-credit
linked insurance where farmers would be required to purchase insurance in order to access credit.
Public cost of agricultural insurance
Figures are not available on the public cost of the pilot MOA crop and livestock insurance schemes.
Agricultural insurance penetration
Insurance penetration rate

155
In 2009/10 the pilot MOA crop and livestock programmes have been implemented on a very small scale
in West and Central Java. The crop MPCI scheme covered 600 farmers with an insured area of 100 ha
and the livestock scheme had 135 insured animals belonging to 135 farmers.
Financial performance
Cost of agricultural insurance provision
The MOA pilot crop MPCI scheme carries a fixed 3.75 percent premium rate that has not been set on an
actuarially calculated basis – rather it has been set on the basis of crop insurance experience in the
region (including India). The MOA livestock pilot carries a fixed 3.5 percent premium rate. No further
information is available on 2009/10 premiums for the pilot programmes.
The total estimated premium volume in 2009 including forestry insurance is about US$1 million.
Public disaster assistance programmes
According to MOA legislation exists that commits the MOA to provide rice farmers with compensation in
the case of harvest failure, but this scheme is not operating effectively98. Further details of public sector
disaster schemes are not available.
References
GTZ. 2009. Development of an index-based micro flood insurance product in Indonesia: a public-private
partnership Munich Re & GTZ - Lessons learnt. Bonn, Germany.
IFC. 2010. Weather index insurance for maize production in Eastern Indonesia: A feasibility study. International
Finance Corporation, World Bank Group, supported by Australia Indonesia Partnership, Kemitraan Australia
Indonesia
Pasaribu, S. M. 2010. Developing rice farm insurance in Indonesia. Presented at the International Conference on
Agricultural Risk and Food Security 2010. Agriculture and Agricultural Science Procedia 1: 33–41.
98
Untitled (2011) Note on Agricultural Insurance in Indonesia.

156
Lao PDR: Agricultural Insurance Market Profile
Importance of Agriculture:
Lao PDR comprises a territory of 230, 800 km2, of which 9.6% or 2.2 million hectares were used for
agricultural production in 2008. A total of 1.2 million hectares of agricultural land was classified as
arable. In spite of the relatively small land area allocated to agriculture, the sector is one of the most
important sources of income in Lao PDR’s economy. In 2008, 68% of the population lived in rural area,
and agriculture’s value added represented 34.7% of GDP.
Rice is the most important crop produced in Lao PDR, followed by assorted vegetables, corn, sugar cane,
and cassava. Swine and cattle stocks are the largest within the livestock sector in Lao PDR, with 2 million
swine heads and 1.4 million cattle heads held in the country for 2009. The swine and cattle and
buffaloes industries are the most productive in Lao PDR, accounting for 48% and 35% of 2009 meat
production.
*Source: FAOSTAT: http://faostat.fao.org/default.aspx; Data retrieved 5 September 2011.
Table A5.18 Livestock in Lao PDR for 2009 Figure A5.11. Meat production in Lao PDR for 2009
Livestock Stocks (Head)
Pigs 2,947,000
Cattle 1,426,000
Buffaloes 1,178,000
Goats 367,450
Horses 31,000
Chickens (in 000's) 22,521
Ducks (in 000's) 3,200
Geese and guinea fowls (in 000's) 100
*Source: FAOSTAT: http://faostat.fao.org/default.aspx; Data retrieved 5 September 2011.
Table A5.17.Major crops produced in Lao PDR for 2009*
Crops
Area Harvested
(Ha)
Production
(Tons)
Rice, paddy 872,896 3,144,800
Vegetables 86,000 860,850
Maize 175,965 848,745
Sugar cane 13,830 433,500
Cassava 10,375 152,590
Sweet potatoes 11,070 127,708
Watermelons 6,370 114,780
Bananas 4,952 61,203
Fruit Fresh 7,291 56,216
Other melons
(inc.cantaloupes) 2,442 47,823
48%
35%
16% 1% Pig
Beef andBuffalo
Poultry
Sheep and Goat
157
Natural Hazards
Floods, droughts, and typhoons are the most dominant hazards impacting Lao PDR’s agriculture. The
country is also vulnerable to landslides, and in the northern parts, to earthquakes.
Agricultural Insurance Market
In 2011 there is no agricultural crop or livestock provision in Cambodia.

158
Malaysia: Agricultural Insurance Market Profile
Importance of Agriculture:
Malaysia’s agricultural sector is important in the country’s economy. Of the 328,550 km2 Malaysian
territory, 24% was allocated to agriculture in 2008, which amounted 7.8 million hectares dedicated to
agriculture. Of total agricultural land, 1.8 million hectares were arable. Agriculture’s contribution to total
GDP represented 9.5% in 2009, and while 29% of the population lived in rural areas, the last available
figure indicates that only 15% of total employment was in agricultural activities in 2007.
Oil palm fruit and kernel are the most important crops produced in Malaysia, followed by rice, natural
rubber, cassava, and sugar cane.
Table 5.19. Major Crops produced in Malaysia for
2009*
Crops Area Harvested
(Ha)
Production
(Tons)
Oil palm fruit 4,002,000 84,842,000
Rice, paddy 672,304 2,510,000
Natural rubber 1,237,000 857,019
Sugar cane 15,000 700,000
Bananas 28,640 625,000
Coconuts 166,400 459,640
Cassava 42,000 440,000
Pineapples 11,650 400,070
Vegetables fresh 16,322 295,556
Watermelons 11,270 228,880 *Source: FAOSTAT: http://faostat.fao.org/default.aspx; Data retrieved 5 September 2011.
The poultry sector is the most active within Malaysia’s livestock industry, with chicken and ducks
presenting the largest stock in 2009. Likewise, poultry meat production accounted for 82% of total meat
produced that year, followed by pig meat, which accounted for 16% of total.
Table 5.20. Livestock in Malaysia for 2009 Figure A5.12. Meat Production in Malaysia for 2009
Livestock Stocks (Head)
Buffaloes 128,000
Cattle 800,000
Chickens (in 000's) 205,000
Ducks (in 000's) 48,000
Goats 336,000
Horses 7,500
Pigs 2,050,000
Sheep 116,000
Source: FAOSTAT: http://faostat.fao.org/default.aspx; Data retrieved 5 September 2011.
82%
16%
2% 0%
Poultry
Pig
Beef and Buffalo
Others

159
Natural Hazards
Droughts, Floods, landslides, and wild-fires most important natural hazards facing Malaysia’s agriculture.
Agricultural insurance market review99
History of agricultural insurance
Malaysia, unlike several of its neighbours, has never implemented a national agricultural crop or
livestock insurance scheme.
Since the 1980s there has been some limited private commercial insurance of plantation export crops
including rubber, oil palm, coconut, fruit and cocoa. These crops have been insured under a
forestry/plantation fire policy with additional perils (FAO, 1986; FAO, 1991).
Crop insurance for cereals and other field crops has not been available to date in Malaysia although on
several occasions in the past there have been attempts to introduce crop insurance. In 2002, the
National Insurance Association of Malaysia (NIAM) was invited by the government to establish a
national agricultural insurance programme. In 2004, NIAM with technical support from Partner
Reinsurance Company, Zurich branch, designed proposals for a national paddy (rice) multiple-peril yield
shortfall (MPCI) programme. Although the programme was well received by NIAM’s members, the
government and farmers, the programme was not implemented because of the high premium rates.
NIAM notes that although the deferment was a disappointment, it was a blessing in disguise as the
target sector was plagued with perennial flood and pest related losses.100 In 2010 there were proposals
to reconsider launching crop insurance through the Tani pool.
Until 2008 there was no formal livestock or poultry insurance in Malaysia. Malaysia suffered catastrophe
(uninsured) losses in swine under the Nipah virus outbreak of 1998/99 – in the absence of any form of
livestock insurance the government partially compensated their direct losses (see further discussion
below). On 31 January 2008 the Bank Negara gave approval for the formation of a poultry and livestock
insurance scheme. It was agreed to form a pool that would be managed by Malaysian Re. On 5 February
2008 the Standing Committee invited NIAM members to establish a new Tani Malaysia scheme geared
toward commercial livestock and poultry farms. On 24 July 2008 nine insurance companies signed up to
the Tani Malaysia Pool with capital of RMI 1 750 000 million.101 Tani, has however, subsequently faced
major delays in launching the livestock insurance scheme because the proposed livestock wordings were
not well received by the test market and by treaty reinsurers. Although the wordings were simplified to
conform to those in other markets, to date the livestock insurance scheme has not been incepted
pending agreement on terms and conditions with reinsurers (NIAM 2010). It is understood that the
situation has not changed in 2011 and the livestock scheme has not yet begun writing business.
Agricultural insurance market structure
99
Source of country profile information for Malaysia: Author and FAO Survey 2010 (FAO 2011 forthcoming) 100
http://www.niam.org.my/tani.htm 101
Extract from the address of the Chairman Mr Sonny Tan Siew Hock, at the 35th
Annual General Meeting of NIAM on 27/03/2008.
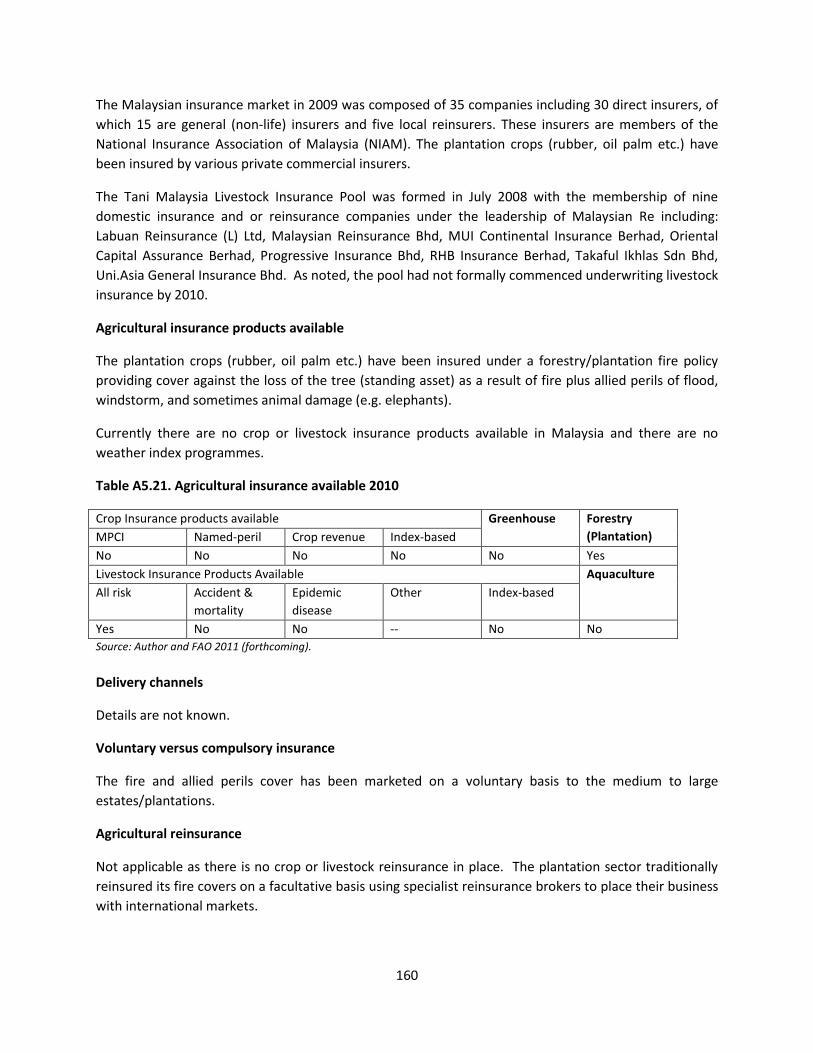
160
The Malaysian insurance market in 2009 was composed of 35 companies including 30 direct insurers, of
which 15 are general (non-life) insurers and five local reinsurers. These insurers are members of the
National Insurance Association of Malaysia (NIAM). The plantation crops (rubber, oil palm etc.) have
been insured by various private commercial insurers.
The Tani Malaysia Livestock Insurance Pool was formed in July 2008 with the membership of nine
domestic insurance and or reinsurance companies under the leadership of Malaysian Re including:
Labuan Reinsurance (L) Ltd, Malaysian Reinsurance Bhd, MUI Continental Insurance Berhad, Oriental
Capital Assurance Berhad, Progressive Insurance Bhd, RHB Insurance Berhad, Takaful Ikhlas Sdn Bhd,
Uni.Asia General Insurance Bhd. As noted, the pool had not formally commenced underwriting livestock
insurance by 2010.
Agricultural insurance products available
The plantation crops (rubber, oil palm etc.) have been insured under a forestry/plantation fire policy
providing cover against the loss of the tree (standing asset) as a result of fire plus allied perils of flood,
windstorm, and sometimes animal damage (e.g. elephants).
Currently there are no crop or livestock insurance products available in Malaysia and there are no
weather index programmes.
Table A5.21. Agricultural insurance available 2010
Crop Insurance products available Greenhouse Forestry
(Plantation) MPCI Named-peril Crop revenue Index-based
No No No No No Yes
Livestock Insurance Products Available Aquaculture
All risk Accident &
mortality
Epidemic
disease
Other Index-based
Yes No No -- No No
Source: Author and FAO 2011 (forthcoming).
Delivery channels
Details are not known.
Voluntary versus compulsory insurance
The fire and allied perils cover has been marketed on a voluntary basis to the medium to large
estates/plantations.
Agricultural reinsurance
Not applicable as there is no crop or livestock reinsurance in place. The plantation sector traditionally
reinsured its fire covers on a facultative basis using specialist reinsurance brokers to place their business
with international markets.
161
Public support for agricultural insurance
There is no government support for agricultural insurance in Malaysia at present.
Agricultural insurance penetration
Insurance penetration rate
The insurance penetration rates for primary crops such as oil palm, rubber and cocoa are currently very
low. The risks are well spread and owners do not see the need to insure their crops (Shen, 2010). There
is no crop or livestock insurance at present.
Public disaster assistance programmes
In the past the government has operated both crop and livestock disaster compensation programmes.
For plantation crops, the former compensation programmes were provided through the Federal Land
Development Authority (FELDA), the Federal Land Consolidation and Rehabilitation Authority (FELCRA)
and the Rubber Industries Small Holder Development Authority (RISDA). Crops included under the
government compensation programmes are rubber, oil palm, cocoa and coffee, and covered hazards
included fire, flood, windstorm, animal damage (elephant) and insect damage (bagworms). The
compensation schemes were compulsory for the settlers and participants in the FELDA, FELCRA and
RISDA programmes. The compensation funds were either financed directly by the government or, in the
case of rubber, by a cess on grower’s rubber exports and by the government (FAO, 1986). The current
status of these disaster compensation programmes is not known.
In the case of livestock, Malaysia suffered a catastrophe epidemic disease outbreak of Nipah virus in
Negri Sembilan between September 1998 and May 1999. The epidemic caused the death of 105 people
and also devastated the swine industry – 1.1 million pigs had to be culled, 951 pig farms ceased
production and close to 36 000 people lost their jobs in the pork/food industry and the livelihoods of up
to 700 000 people were affected. The government paid RM 140 million in compensation for the pigs
destroyed and an estimated RM 548 million was spent in the disease control programme. None of these
losses were insured.
References
FAO. 1986. Crop insurance in Asia: Report on regional expert consultation on crop insurance programmes and
policies in Asia, held in Tianjin, People’s Republic of China, 1–5 April 1986. Regional Office for Asia and the Pacific
(RAPA), Food and Agriculture Organization of the United Nations (FAO) and Asian and Pacific Regional Agricultural
Credit Association (APRACA), Bangkok.
FAO. 1991. Crop insurance compendium 1991. Marketing and Credit Service Agricultural Services Division, FAO,
Rome.
Lai Poong Shen. 2010. Agricultural insurance: Positioned for growth – Malaysian perspective. Presented at
International Agricultural Insurance Conference 18–20 April 2010, Beijing.
NIAM. See Website at: http://www.niam.org.my/tani.htm
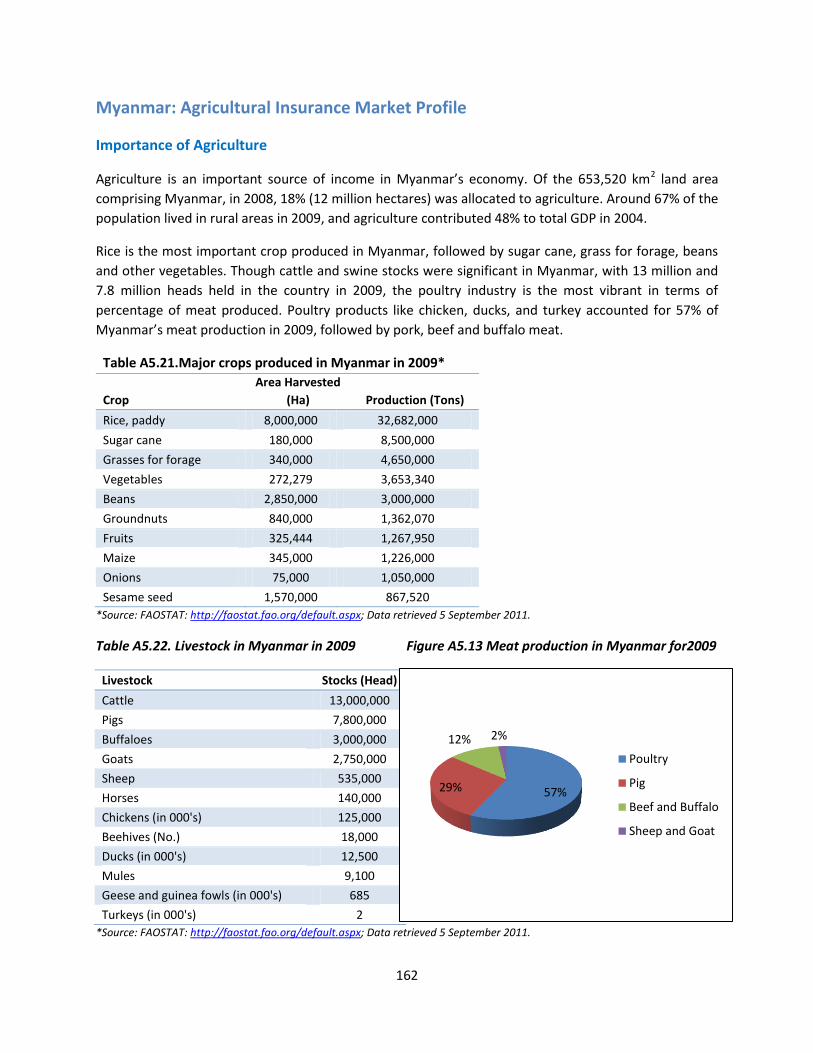
162
Myanmar: Agricultural Insurance Market Profile
Importance of Agriculture
Agriculture is an important source of income in Myanmar’s economy. Of the 653,520 km2 land area
comprising Myanmar, in 2008, 18% (12 million hectares) was allocated to agriculture. Around 67% of the
population lived in rural areas in 2009, and agriculture contributed 48% to total GDP in 2004.
Rice is the most important crop produced in Myanmar, followed by sugar cane, grass for forage, beans
and other vegetables. Though cattle and swine stocks were significant in Myanmar, with 13 million and
7.8 million heads held in the country in 2009, the poultry industry is the most vibrant in terms of
percentage of meat produced. Poultry products like chicken, ducks, and turkey accounted for 57% of
Myanmar’s meat production in 2009, followed by pork, beef and buffalo meat.
Table A5.21.Major crops produced in Myanmar in 2009*
Crop
Area Harvested
(Ha) Production (Tons)
Rice, paddy 8,000,000 32,682,000
Sugar cane 180,000 8,500,000
Grasses for forage 340,000 4,650,000
Vegetables 272,279 3,653,340
Beans 2,850,000 3,000,000
Groundnuts 840,000 1,362,070
Fruits 325,444 1,267,950
Maize 345,000 1,226,000
Onions 75,000 1,050,000
Sesame seed 1,570,000 867,520 *Source: FAOSTAT: http://faostat.fao.org/default.aspx; Data retrieved 5 September 2011.
Table A5.22. Livestock in Myanmar in 2009 Figure A5.13 Meat production in Myanmar for2009
Livestock Stocks (Head)
Cattle 13,000,000
Pigs 7,800,000
Buffaloes 3,000,000
Goats 2,750,000
Sheep 535,000
Horses 140,000
Chickens (in 000's) 125,000
Beehives (No.) 18,000
Ducks (in 000's) 12,500
Mules 9,100
Geese and guinea fowls (in 000's) 685
Turkeys (in 000's) 2
*Source: FAOSTAT: http://faostat.fao.org/default.aspx; Data retrieved 5 September 2011.
57% 29%
12% 2%
Poultry
Pig
Beef and Buffalo
Sheep and Goat

163
Natural Hazards
Floods, drought, and earthquakes are the main natural hazards affecting Myanmar’s agriculture, with
drought being the most persistent and floods causing the largest economic losses. Cyclones and
landslides also pose significant risks in some areas of the country.
Agricultural Insurance Market
In 2011 there is no agricultural crop or livestock provision in Cambodia.
Philippines: Agricultural Insurance Market Profile
Importance of Agriculture:
Agriculture is a very important economic activity in the Philippines. In 2008, 40% of the country’s total
land area of 298,170 km2, or 11.8 million hectares, was used in agricultural activities, 5.3 million of
which consisted of arable land. Moreover, 34% of total population lived in rural areas and agriculture
contributed with 15% to total GDP in 2009. Agricultural employment accounted for 36% of total in 2007.
The most important crops produced in Philippines are sugar cane, rice, coconuts, and corn. The hog
industry dominates livestock production. With 13 million heads of hogs held in the country in 2009, the
swine industry accounted for 60% of the country’s total meat production in 2009, followed by poultry,
beef and buffalo meat production.
Table A5.23 Major crops produced in Philippines*
Crop
Area
Harvested (Ha)
Production
(Tons)
Sugar cane 404,000 22,932,800
Rice, paddy 4,532,300 16,266,400
Coconuts 3,401,500 15,667,600
Maize 2,683,900 7,034,030
Taro (cocoyam) 20,000 120,000
Potatoes 7,904 119,159
Roots and Tubers 15,369 75,000
Yams 5,500 25,000
Beans 38,700 27,694
Groundnuts 28,200 30,978 *Source: FAOSTAT: http://faostat.fao.org/default.aspx; Data retrieved 5 September 2011.

164
Table A5.24. Livestock in Philippines for 2009* Figure A5.14. Meat Production in Philippines for 2009
Livestock
Stocks
(Head)
Pigs 13,596,000
Goats 4,222,000
Buffaloes 3,321,000
Cattle 2,586,000
Horses 240,000
Chickens (in 000's) 158,372
Sheep 30,000
Ducks (in 000's) 10,577
Turkeys 575
Geese and guinea fowls (in 000's) 400
*Source: FAOSTAT: http://faostat.fao.org/default.aspx;; Data retrieved 5 September 2011.
Natural Hazards
As one of the countries with highest risks and exposure to multiple natural hazards, Philippines’s
agriculture faces multiple high frequency risks, including storms, floods, droughts, typhoons, landslides,
mudslides, and lower frequency, high impact hazards such as earthquakes and volcano eruptions.
Typhoons are the most frequent and damaging hazards.
Agricultural insurance market review102
History of agricultural insurance
Crop insurance was first introduced in 1978 with the formation of the Philippines Crop Insurance
Corporation (PCIC). PCIC is the sole crop insurance provider in the Philippines. PCIC was created under
Presidential Decree 1467 issued on 11 June 1978. Agricultural crop insurance was introduced in May
1981 and livestock insurance in 1988. PCIC is 100 percent owned by government entities. PCIC is
governed by agricultural insurance legislation and regulation, which were most recently revised in 1995
(“Revised PCIC Charter”). Livestock insurance is regulated as a commercial line of insurance.
Agricultural insurance market structure 2010
Prior to 2009, PCIC was the sole public-sector crop insurance company. With regard to livestock, the
Government Service Insurance System (GSIS) is part of a pool with private insurers: the Philippine
Livestock Management Services Corporation (PLMSC). GSIS provides livestock insurance for livestock
owned by government institutions. PCIC was a member of this group since it started in 1988 until 2005
102
Source of country overview information: World Bank Survey 2008 for PCIC; FAO 2010 survey; Author’s communication in 2010 and 2011
with MicroEnsure for micro-level crop index insurance programmes; updated for World Bank ASEAN Study 2011.
60%
10%
27%
2%
1% Pig
Beef and Buffalo
Poultry
Sheep and Goat
Others

165
when it disengaged from PLMSC to gain flexibility and strengthen control on underwriting and claims
adjustment and settlement. The PLMSC has 14 participating insurers.
Since 2008, MicroEnsure (an international financial intermediary that specializes in micro-insurance
products for small urban and rural households and has a local office in the Philippines) has been actively
working with Malayan Insurance Company (the largest commercial insurer in the Philippines) to develop
two pilot micro-level individual farmer crop index programmes: (a) a CWII programme for rainfall deficit
(drought); and (b) a separate remote sensing/satellite based typhoon index. These two pilot
programmes were launched in 2009/10 with Malayan Insurance Company, but have not been renewed
in 2010/11 pending a review of certain issued including basis risk and upgrading of the weather station
network (see Appendix A5.6 at end of Country report).
In 2011 PCIC in conjunction with GIZ (the German International Technical Development Organization)
has launched a new Area-Yield Index Insurance (AYII) Program for rice farmers located in Leyte Island.
Under a separate initiative, GIZ Manila (2009-12) has formed a strategic alliance with MunichRe, a
leading reinsurer, to develop micro-insurance products and services for poor urban households against
natural catastrophes including typhoon and flood103.
Agricultural insurance products available
Traditional indemnity based crop and livestock insurance products
PCIC’s main insurance lines are multi-peril crop insurance (MPCI) policies for palay (rice) and corn. These
two products account for 75 percent and 16 percent of PCIC premium income (2006), respectively.
Cover includes losses for natural calamity and for pest and disease.
PCIC also offers high value commercial crop insurance for higher value crops, particularly fruits and
vegetables. Greenhouse and forestry are included in the high-value commercial crop (HVCC) insurance
programme of PCIC. PCIC has insurance packages for the following HVCCs: abaca, ampalaya (bitter
gourd), asparagus, banana, cabbage, carrot, cassava, coffee, commercial trees, cotton, garlic, ginger,
mongo, onion, papaya, peanut, pineapple, sugarcane, sweet potato, tobacco, tomato, watermelon,
white potato, and others.
Livestock insurance against accidental death and disease is offered by PCIC and other commercial
insurers for all classes of commercial farm livestock. Livestock epidemic disease coverage is subject to
additional premium loading and other conditions.
PCIC also offers life insurance and accident insurance to individuals or linked to loans from financial
institutions to farmers and fisherfolk.
The main insurance lines for palay and corn are provided to individual farmers. Loss assessment
formulas have been developed to assign damage functions and indemnity schedules related to type of
damage, timing of the damage in relation to crop calendar, and other criteria. Area-based assessment of
damage can occur if there are extensive events. Main causes of loss are typhoon, floods, and drought in
103
See http://microinsurance.ph for further details.

166
corn, but pest and disease is also a very significant factor in claims by cause of loss. Farmers may choose
between MPCI or natural disaster cover, the main difference being that the latter does not include pest
and disease. The majority purchase MPCI, which is required by lending institutions.
Index based products
In 2009 two micro-level index crop insurance products were launched by Microensure / Malayan
Insurance Company on a pilot basis in the Philippines, namely a drought index cover for rice and an
innovative typhoon damage index. Both covers have not been renewed in 2010/11. In 2011 Microensure
is designing a simplified number of wet days and dry days WII policy to meet the demand for excess rain
and drought insurance cover (see Appendix A5.6. for further details).
In 2011 PCIC in conjunction with GIZ (the German International Technical Development Organization)
has launched a new Area-Yield Index Insurance (AYII) Program for rice farmers located in Leyte Island.
The project is being implemented with the national irrigation system in 17 rice growing municipalities of
the Leyte and Southern Leyte. This product is designed to provide irrigated rice farmers with optional
coverage levels of up to 80% of the Area-Yield at affordable premium levels of about 4%. It is
understood this product does not carry government premium subsidies.
Table A5.25. Agricultural insurance available 2011
Crop insurance products available Greenhouse Forestry
MPCI Named-peril Crop revenue Index-based
Yes Yes No Yes Yes Yes
Livestock insurance products available Aquaculture
All risk Accident and
mortality
Epidemic
disease
Other Index-based
Yes Yes Yes No No No Source: World Bank Survey 2008; FAO 2011 (forthcoming); updated by authors to 2011.
Delivery channels
For traditional crop insurance, the most important delivery channel is through linkage to agricultural
credit for farmers through the Land Bank of the Philippines (LBP). Other outlets are through sales to
cooperatives, through PCIC agents and offices, and through brokers. For livestock insurance, most sales
are through cooperatives and producer associations, followed by agricultural banks, and PCIC agents
and brokers. There are no special organizations or programmes for small and marginal farmers. The
majority of farmer clients of PCIC are small-scale and subsistence producers.
Voluntary versus compulsory insurance
The majority of formal seasonal credit for rice and corn production is through LBP, who require
borrowers to insure. However, 18 percent of rice premium and 21 percent of corn premium (2005/06)
was derived from non-borrowing farmers. Livestock insurance is voluntary. Financial institutions’ lending
for livestock production may require that insurance is taken out.
The drought and typhoon index products were marketed on a purely voluntary basis in 2009/10.

167
Agricultural reinsurance
PCIC has been purchasing reinsurance from the private market since inception of the company.
Reinsurance schemes are as follows: rice and corn crops –stop loss; high-value crops (cassava) – quota
cum surplus; other high value crops – facultative; livestock – facultative; non-crop agricultural assets–
quota cum surplus/facultative. Access to reinsurance has not been a significant constraint over the
history of PCIC. There are many reinsurance brokers and reinsurers who are interested to participate in
the reinsurance programmes of PCIC. There is no involvement of government in the reinsurance of PCIC.
The Malayan Insurance company crop index pilot programmes were reinsured on a proportional treaty
basis by Paris Re in 2009 (Paris Re was acquired by Partner Re in 2010).
Public support for agricultural insurance
Types of public support for agricultural insurance
The government financed the start-up costs of PCIC and its main ongoing support for agricultural
insurance is through premium subsidies for PCIC’s main lines of rice and corn insurance. A serious
constraint to PCIC has been the accumulation of arrears of subsidy that remain due from the
government to the company. There is limited other involvement of government in crop insurance;
however, government extension staff assist with loss assessment activities. Under regulation 8175, a
state reserve fund for catastrophic losses amounting to P500 million is to be provided by the
government. Exemption from premium taxes is granted for subsidized rice and corn insurance.
Premium subsidies
PCIC’s rice and corn MPCI insurance programme is subsidized. Premium subsidies are payable by
government and vary between 48 percent and 63 percent of the original gross premium (OGP) in the
case of rice insurance. For borrowing farmers, the lending institutions (banks) also make a contribution
of between 16 percent and 21 percent for rice. The farmer therefore pays a variable rate according to
the risk zone of only between 16 percent and 36 percent for rice. Government pays a fixed rate of
subsidy as a percent of sum insured (e.g. 5.9 percent of sum insured for multi-risk cover); the farmer
pays a variable rate. Borrowing farmers benefit from additional subsidies from the lending institution.
Insurance for livestock and commercially rated high value crops is not subsidized.
In 2009 the private commercial drought and typhoon index crop insurance programmes did not attract
any premium subsidies from the government and participating farmers paid the full technically derived
commercial premium rates.
Public cost of agricultural insurance
The cost of PICC premium subsidies averaged P48.5 million (US$970 000) between 2003 and 2006. Note
that the government allocates a specific sum annually for premium subsidies, and this limits the scope of
operations of PCIC. Subsidies are also in arrears (see comments below), and this constrains PCIC’s overall
financial and operating position. In 2008 PCIC’s budget from the government for premium subsidies was
PHP 113 million (about US$2.5 million at the current 2010 exchange rate). In 2009 the senate voted to

168
increase PCIC’s premium subsidy budget by PHP 70 million to PHP 183 million in total (US$4 million).
This will enable the company to underwrite a larger MPCI portfolio for maize and rice growers.
Agricultural insurance penetration
Insurance penetration rate
Crop insurance penetration has varied during the period of PCIC’s existence. It is estimated that only 2
percent of rice farmers and 1.76 percent of national rice and maize area cropped are now insured by
PCIC (Tables A5.27). The peak penetration of crop insurance was in 1991 when 15 percent of farmers
were insured. In 2007 6,273 livestock producers were insured by PCIC with a total of 3,597 insured head
of cattle, 6,606 swine and 1,145 sheep and goats (Tables A5.29 and A5.30). The extent of penetration in
the livestock sector is not available, but is very low.
Financial performance
Five-year results
PCIC sets its gross premium rates (inclusive of farmer premium, government subsidy, and lending
institutions) to cover anticipated long term loss costs, plus a margin of approximately 20 percent to
cover marketing and acquisition costs and costs directly related to underwriting. PCIC does not include a
margin for reserve accumulation, or administrative overheads of the company, within this rate (see
below). Table 6 shows that loss ratios in the last five years have averaged 73 percent for crop insurance
(rice and corn) and 57 percent for livestock insurance and 72 percent for the combined crop and
livestock programmes. PCIC’s updated long-term consolidated results by program since inspection in
1981 and 2008 are summarized by programme in Table A6.6.7.
PCIC’s analysis of the main causes of loss on the national rice and maize programmes for the period
1981 to 2006 is reproduced in Figure A6.7.1. For rice, the major cause of loss has been typhoon and
flood, accounting for 54 percent of the total value of claims in rice, followed by pests (19 percent of
claims) and diseases (13 percent of claims) or nearly one third of claims overall. Drought has been a
relatively minor cause of loss in rice (much of which is irrigated) accounting for 13 percent of claims. In
maize, drought has been the major cause of loss accounting for 42 percent of the total value of claims in
this crop between 1982 and 2006. This is followed by pests and diseases, which account for a combined
31 percent of all claims, and finally typhoon and flood (26 percent of all claims in maize).
In 2009 the Malayan drought and typhoon index programmes were implemented on a very small pilot
scale and both programmes were free of claims (See Appendix A6.7.1 for full details).
Cost of agricultural insurance provision
PCIC’s intention is that administrative overhead costs of the company should be met out of investment
income and interest on reserves. Marketing and acquisition costs (10 percent for rice and corn crop
insurance, up to 30 percent for livestock and other lines) are intended to be met out of gross premium
income, and this is reflected in the loss ratios being achieved. The company has been hampered in its
objectives of meeting company overheads from investment income and interest by late payment of

169
government subsidies and a declining client base, plus costs associated with an infrastructure of offices
originally established to serve farmers in all regions.
Table A6.7.8 shows that overhead costs of the company (over all lines), excluding loss adjustment,
represent 87 percent of OGP income. Loss adjustment costs do not exceed 12 percent of claims cost.
Marketing and acquisition costs are 10 percent of gross premium for crops, 30 percent for livestock, and
between 10 percent and 30 percent for other lines of business.
Public disaster assistance programmes
There is no scheme for financial compensation of farmers following losses. In-kind provision of seed,
fertilizer, and inputs may be provided post-disaster by local and central government ad hoc. Emergency
food and shelter may be supplied by the government or NGOs. Rescheduling of credit repayments or
interest may be granted by financial institutions. Infrastructure rehabilitation (e.g. irrigation) is the
responsibility of the government, and calamity funds or re-allocations of other funds are applied to relief
and rehabilitation. However, there is no financial compensation for farmers. The National Calamity Fund
was established for rehabilitation (e.g. irrigation facilities). There is an extensive system for disaster
management by government organizations, under the umbrella of the National Disaster Coordinating
Council (NDCC) and the Department of National Defense (DND). The Department of Budget and
Management (DBM) is responsible for the budget for agricultural relief activities.
Additional tables
Table A5.26. PCIC national composite (technical) premium rates for rice and maize
(a) Rice:
Multiple peril cover (natural + biological perils)
Low risk
(%)
Share
(%)
Medium risk
(%)
Share
(%)
High risk
(%)
Share
(%)
Farmer 1.46 15.6 2.91 26.9 4.37 35.6
Lending institution 2.00 21.4 2.00 18.5 2.00 16.3
Government 5.90 63.0 5.90 54.6 5.90 48.1
Total 9.36 100.0 10.81 100.0 12.27 100.0
(b) Maize:
Multiple peril cover (natural + biological perils)
Low risk
Share
(%)
Medium risk
(%)
Share
(%)
High risk
(%)
Share
(%)
Farmer 2.83 17.20 5.65 29.32 8.48 38.37
Lending institution 3.00% 18.24 3.00 15.57 3.00 13.57
Government 10.62% 64.56 10.62 55.11 10.62 48.05
Total 16.45% 100.00 19.27 100.00 22.10 100.00
Source: PCIC 2010.
Table A5.27. Estimated PCIC crop insurance penetration, 2003 to 2007

170
Year
Number of
policies
Percent of farmers
insured
Insured area
(ha)
Percent of national
crop area insured
2003 39 939 -- 68 275 --
2004 46 053 -- 79 194 --
2005 44 663 -- 68 602 --
2006 37 243 -- 61 952 --
2007 37 810 -- 70 036 1.8
Source: World Bank Survey 2008.
Note: Number of policies and insured area includes rice, corn, and high value crop types. Percentage of national
crop area insured includes irrigated rice and yellow corn crop areas only.
Table A5.28. Estimated livestock insurance penetration
Year
Number
of insured
cattle
Percent of
national
cattle herd
insured
Number
of insured
swine
Percent of
national
swine herd
insured
Number
of insured
sheep and
goats
Percent of
national
sheep flock
insured
Number
of insured
poultry
birds
Percent
of
national
poultry
insured
2003 4,197 -- 5,533 -- 813 -- -- --
2004 4,030 -- 5,728 -- 1,096 -- -- --
2005 2,447 -- 4,767 -- 952 -- -- --
2006 3,543 -- 7,075 -- 1,421 -- -- --
2007 3,597 -- 6,606 -- 1,145 -- -- --
Source: World Bank Survey 2008.
Note: 6,837 livestock farmers were insured in 2006 and 6 273 livestock farmers in 2007.
Table A5.29. Crop and livestock insurance results, 2003 to 2007
Year
Number of
policies
TSI
(US$ million)
Premiums
(US$)
Paid claims
(US$)
Loss ratio
(%)
Crops
2003 39,939 14.6 1.6 mil 1.2 mil 76
2004 46,053 16.2 1.9 mil 1.3 mil 71
2005 44,663 15.3 1.8 mil 1.4 mil 77
2006 37,243 15.4 1.8 mil 1.5 mil 83
2007 37,810 20.6 2.4 mil 1.5 mil 62
Livestock
2003 7,824 1.2 41,434 35,531 86
2004 7,572 1.2 68,225 31,398 46
2005 6,133 1.1 53,849 31,701 59
2006 6,837 1.6 67,043 38,005 57
2007 6,273 2.1 95,957 50,952 53
Total
2003 47,763 15.8 1.7 mil 1.3 mil 76
2004 53,625 17.4 2.0 mil 1.4 mil 70
2005 50,796 16.4 1.8 mil 1.4 mil 77
2006 44,080 16.9 1.9 mil 1.6 mil 82
2007 44,083 22.8 2.5 mil 1.5 mil 61
Source: World Bank Survey 2008.

171
Table A5.30 Summary of PCIC’s long-term underwriting results,1981 to 2008
Production Indemnity
Insurance
programme Period
No. of
farmers
Area
(ha)/no. of
heads/no.
of policies
Amount of
cover (PHP
million)
No. of
farmers
Area
(ha)/no. of
heads/no.
of policies
Indemnity
paid
(PHP
million)
Rice (palay)
1981 to
2008 3 085 081 5 162 261 28 94.202 864 515 1 477 475 2 059.224
Maize (corn)
1982 to
2008 464 632 856 538 5 209.352 192 588 364741 628.855
HVCC
1991 to
2008 15 066 18 525 562.282 1 948 2 032 16.894
Livestock
1988 to
2008 264 361 1 844 017 2 622.541 9 137 41 121 52.340
NCI
1996 to
2008 37 625 38 585 4 006.270 31 31 10.252
TIPP
2005 to
2008 96 820 55 237 2 330.757 109 108 2.581
Total 3 963 585 43 125.404 1 068 328 2 770.146
Source: PCIC, 2010 personal communication with Author
Table A5.31. PCIC insurers’ costs as a percent of OGP
Costs Crop Livestock
Marketing & acquisition 10 % 30 %
Administration 87 % 87 %
Loss adjustment
≤12% of losses or
claims
≤12% of losses or
claims
Insurance premium taxes 5 % + DST 5 % + DST
Total -- Variable
Source: World Bank Survey 2008.
Note: There are no insurance premium taxes for rice and corn. DST = Documentary stamp tax
Figure A5.15. PCIC: Causes of loss in rice and maize 1981 to 2006 (PHP 000)

172
Source: PCIC, 2006.
Appendix A5.6: Weather index insurance and remote sensing insurance in the Philippines
In 2009/10, the Malayan Insurance Company underwrite a pilot micro-level, individual farmer CWII programme for typhoon and drought that was developed by a local financial intermediary, MicroEnsure. MicroEnsure is an international financial intermediary or broker, with offices in the Philippines, India, Ghana, Uganda and Tanzania and which is involved in the design and marketing of low cost micro-insurance products in conjunction with microfinance institutions, rural banks and SACCOs, as well as working closely with insurance companies. In 1009/10 the Malayan Insurance Company/MicroEnsure typhoon and drought index pilot programmes were the only CWII products available in the Philippine market.
The typhoon weather index is a remote sensing or satellite based insurance product that was designed by MicroEnsure using typhoon data supplied by the Japanese Meteorological Authority (JMA). MicroEnsure employed the services of an international actuary to conduct a typhoon risk modelling and mapping exercise for all of the Philippines and to define homogeneous risk-rating zones (28 km grid squares) for the entire country – typhoon premium rates have been calculated for each grid according to the frequency and severity of the tropical cyclone/typhoon hazard. The product is operated by the JMA satellite tracking system for typhoons and an indemnity payment is triggered if the typhoon tracks within a defined distance (maximum of 140 kilometres) from the insured farm location(s) and according to the maximum sustained wind speed at the closest point of track: at strong tropical storm wind speeds the policy pays out 15 percent of the maximum sum insured and at “hurricane 4” wind speed, the payout is 100 percent of the sum insured. The location of each insured farm is plotted using GPS and the actual payouts are automatically calculated according to how close the farm is to the centre of the typhoon’s path and the calculated wind speed at the location.104 Further details of the typhoon product and the indemnity formula for wind speed and distance from the typhoon track are presented in Martirez (2009).105
104
MicroEnsure is the world-first typhoon weather index insurance for smallholder Philippines rice farmers. For information see http://www.microensure.com. 105
Martirez, H, W., 2009.
Typhoon & Flood,
1,046,097, 54%
Drought, 255,869,
13%
Pest, 365,004,
19%
Diseases, 241,642,
12% Others,
28,738, 2%
RICE: Cause of Loss 1981 to 2006 (P'000)
Typhoon & Flood,
160,383, 26%
Drought, 255,523,
42%
Pest, 119,829,
20%
Diseases, 63,413,
11%
Others, 7,897, 1%
CORN (Maize): Cause of Loss 1982-2006 (P'000)

173
In 2009 the micro-level typhoon index insurance cover was launched for rice farmers in Panay Island, Region VI of the Philippines. The typhoon index was approved in 2009 by the Insurance Commission. The typhoon index is underwritten by the Malayan Insurance Company with reinsurance protection from Partner Re (formerly Paris Re prior to 2010). Taytay Sa Kauswagan, Inc., the largest microfinance lending institution in the Philippines with a current outreach of over 250 000 borrowers, is providing seasonal credit to the rice producers under this pilot micro-level individual farmer crop-typhoon index scheme.
In addition, in 2009, Malayan Insurance Company/MicroEnsure piloted individual farmer micro-level weather index insurance for rainfall deficit (drought) in rice in Region VI. This was a conventional three-phase (three vegetative stages: establishment / tillering, flowering / grain formation, maturity) weather index product that makes indemnity if rainfall in each stage falls below a pre-determined level.
In 2009 the drought and typhoon index pilot programmes for rice farmers in Panay Island were free of claims. The 2009 underwriting results are summarized below. In 2009, MicroEnsure as the appointed intermediary sold 446 typhoon index policies with an insured equivalent of 647 ha of rice and TSI of PHP 8.7 million (nearly US$190,000), and the drought policy was sold to 21 farmers with insured area of 29.5 ha and TSI of PHP 0.5 million (US$109,000). The average premium rate levied on both index programmes was 10 percent generating premium on the typhoon index programme of slightly more than PHP 871 000 (US$18 900) and for the drought index programme premium of PHP 50 000 (US$1 100). Although a total of 14 typhoons were recorded in the Philippines Area of Responsibility between May and October 2009, none of the typhoons tracked within 140 km of the insured locations and therefore there were no indemnity payouts on the typhoon index programme. The drought index cover was also free of claims.
Table A5.6.1 2009 Underwriting results, Malayan (MicroEnsure) typhoon and drought index pilot schemes
Details Typhoon Drought
No. of farmers 446 21
Farm area 647.04 hectares 29.50 hectares
Premium production PHP 871,170.89 PHP 50,000.00
Sum insured PHP 8,711,708.85 PHP 500,000.00
2009 registered typhoons in
Philippines Area of Responsibility
(PAR) – during product piloting
14 Typhoons – 2 in May, 1 in June, 2 in July, 2 in August, 4 in September; 3 in
October
Claims payout PHP 0.00 PHP 0.00
Location of farms Panay Island – Antique, Central and
Northern Iloilo Panay Island - Dumangas
Source: Martirez, 2009.
Since 2010/11, Microensure has not renewed the drought index and typhoon index policies pending a review of the basis of cover. In 2011 the company is designing a simplified number of wet days and dry days WII policy to meet the demand for excess rain and drought insurance cover. It is anticipated that this product will be launched in 2012106.
References
106
Authors’ communication with Microensure Philippines, September 2011.

174
Martirez, H, W. 2009. Micro insurance, climate change and agriculture as sustainable measures for risk management. Presented to the Community of Practice for Agriculture, Rural Development and Food Security, Asian Development Bank, 22 October 2009.
PCIC. 2006. Agricultural insurance: The Philippines experience. Paper presented to the Asia-Pacific Organization Conference, New Delhi, 15 October 2006.
EFOS 2011. Agricultural Based Yield Index Insurance (ARBY). Pas-Pas-KLARO. Enhancement of Food
Security (EFOS)-Micro Insurance. GIZ in collaboration with PCIC Tacloban, Leyte.
Singapore: Agricultural Insurance Market Profile
Importance of Agriculture
Agriculture plays a marginal role in Singapore’s economy, with only 1% of the country’s total land
allocated to agricultural activities. Of the 7,000 hectares comprising Singapore, only 700 hectares were
allocated to agriculture, of which 500 hectares were considered arable in 2008. Agricultural employment
only accounted for 1.1% of total employment in 2007 and the country’s population is concentrated in
urban areas. Assorted vegetables and poultry are major Singapore’s agricultural produce.
Natural Hazards
Singapore is relatively free from natural hazards due to its geographical location. Apart from epidemics,
the only potential risk facing Singapore is the impact of tsunami.
Agricultural Insurance Market
In 2011 there is no agricultural insurance market in Singapore in 2011.

175
Thailand: Agricultural Insurance Market Profile
Importance of Agriculture
Of Thailand’s total territory of 510, 890 km2, 38% was used in agricultural production in 2008.
Agricultural land accounted for 19.6 million hectares, 15.2 million of which were classified as arable.
With a rural population accounting for 66% of the total in 2009, agriculture’s contribution to total GDP is
relatively small, accounting for 12% of total GDP in 2009. Nevertheless, last figure available indicates
that agricultural employment accounted for 42% of total employment in 2007. Thus, though Thailand’s
economy is relatively diversified, agriculture remains an important source of employment for the
country’s vast rural population.
Table A5.32. Major Crops produced in Thailand for 2009*
Crop Area Harvested (Ha) Production (Tons)
Sugar cane 932,465 66,816,400
Rice, paddy 10,963,100 31,462,900
Cassava 1,326,740 30,088,000
Oil palm fruit 510,213 8,162,380
Maize 1,104,870 4,616,120
Natural rubber 1,856,070 3,090,280
Mangoes, mangosteens, guavas 308,026 2,469,810
Pineapples 90,656 1,894,860
Bananas 112,391 1,528,080
Coconuts 237,882 1,380,980
*Source: FAOSTAT: http://faostat.fao.org/default.aspx; Data retrieved 5 September 2011.
Sugar cane, rice, cassava, oil palm fruit, and corn are the most important crops produced in Thailand,
with sugar cane and rice alone accounting for the vast majority of crops produced in 2009. Swine and
cattle stocks are the most significant in terms of number of heads held in Thailand in 2009. The poultry
and swine industry dominates the livestock production, accounting for 53% and 35% of total meat
produced in 2009, respectively.
Table A5.33. Livestock in Thailand for 2009* Figure A5.16. Livestock in Thailand for 2009*
Livestock Stocks (Head)
Pigs 7,480,530
Cattle 6,700,000
Buffaloes 1,670,510
Goats 383,796
Chickens (in 000's) 228,207
Sheep 40,269
Ducks (in 000's) 16,347
Horses 5,443
Geese and guinea fowls (in 000's) 270
Mules 50
Asses 35
*Source: FAOSTAT: http://faostat.fao.org/default.aspx; Data retrieved 5 September 2011.
53% 35%
12% 0% Poultry
Pig
Beef andBuffalo
Sheep andGoat
176
Natural Hazards
Agriculture is exposed to a combination of typhoons (and windstorm), excess rain, flooding, landslides
and droughts and low lying coastal areas are highly susceptible to Tsunami.
Agricultural insurance market review107
History of agricultural insurance
A crop insurance programme operated in Thailand between 1978 and 1990. The programme was a
multi-peril crop insurance (MPCI) product covering cotton, maize, and soybeans, and was closed
principally because of high administrative and loss adjustments. Livestock insurance was available for
dairy cows during 1979/80, but the programme was discontinued and currently there is no livestock
insurance in Thailand.108
In 2006 a weather index insurance (WII) pilot for rain-fed maize was developed with technical assistance
from the World Bank. The programme was introduced in 2006 without insurance contracts and
implemented on a small pilot scale with insurance contracts in 2007. The maize drought-index scheme
has expanded further between 2008 and 2010.
In addition, since 2009 separate a rice WII scheme has been piloted tested in Thailand.
In 2011 there has been a major development in Thailand though the introduction of a Public Private
Partnership subsidized crop insurance scheme for rice which is linked to the existing natural disaster
compensation scheme for rice and which provides voluntary top-up protection for payment of a fixed
premium. Government is providing premium subsidies for the rice insurance scheme and its objective is
to achieve national coverage of all Thailand’s rice farmers. This new scheme is termed the “Thailand Rice
Disaster Relief Top-up Scheme” (See Appendix A5.7 for full details).
From the early 1990’s the government has provided aid to farmers by way of a price guarantee109
scheme for rice, maize and tapioca, to protect the farmers from volatility in the world rice price.
Agricultural insurance market structure 2008
The maize weather index insurance programme (2006–2010) was underwritten by a co-insurance pool
of nine insurance companies and the Thai Reinsurance Public Company Ltd. The General Insurance
Association of Thailand is an important stakeholder and acted as market coordinator when the
programme was introduced. The Department of Insurance is involved as regulator. The Bank of
Agriculture and Agricultural Cooperatives (BAAC) is the distribution channel for weather index
insurance.
107
Source of country overview information: World Bank Survey 2008, FAO Survey 2010 and updated under World Bank 2011 ASEAN country desk study 108
Agra-CEAS, 2007. 109
This is a crop price guarantee scheme and not a price insurance scheme because farmers do not pay a premium for the price protection they receive from government.

177
Since 2009 the Japanese Bank for International Cooperation (JBIC), in conjunction with Sompo Japan
Insurance (Thailand) Company Ltd (SJIT) has been pilot testing a separate cumulative season rainfall
deficit WII product for rice. BAAC is again acting as the distributer and main implementing agency for
this pilot rice WII programme.
The 2011 subsidized Thailand Rice Disaster Relief Top-UP Scheme is being implemented through a pool
of 8 local insurance companies and 9 reinsurance companies under a quota share agreement. The lead
international reinsure is SwissRe. The program is being implemented through BACC which has a
database of all rice farmers in Thailand. (Appendix A5.7).
Agricultural insurance products available
The maize weather index insurance product is a conventional three-vegetative rainfall deficit cover that
carries an average premium rate of about 10 percent. In 2007 it was introduced in one province and
now in 2010 has been expanded into seven provinces.
The SJIT insured rice WII product is a simplified cumulative season (July to September) rainfall deficit
cover that carries a premium rate of slightly less than 5 percent and which has two indemnity payout
thresholds: (a) drought with an indemnity of 15 percent of the principle; and (b) severe drought with an
indemnity of 40 percent of the principle.
Thailand is one of the most flood prone countries in the world (flood ranking 6th). Prior to 2011, crop
flood insurance was not available for agriculture, but research was being conducted into remote sensing
applications to flood insurance.
The 2011 Thailand Rice Disaster Relief Top-Up Scheme for rice protection against catastrophe losses
(100% crop losses) due to flood, excess rain, drought, frost, windstorm/typhoon, fire and hail. The
product is a form of area-based crop insurance scheme with a double trigger: claims are payable only
when (i) an area has been declared a total loss by the appointed loss committee under the Ministry of
Agriculture, Department of Extension, and then (ii) individual farmers are indemnified according to the
amount of rice area they have individually insured (Appendix 5.7).
There is no commercial livestock insurance in Thailand in 2011. (Table A5.34).
Table A5.34. Agricultural insurance available 2011
Crop Insurance products available Greenhouse Forestry
MPCI Named-peril Crop revenue Index-based
Yes No No Yes No No
Livestock insurance products available Aquaculture
All risk Accident
&mortality
Epidemic
disease
Other Index-based
No No No No No No
Source: World Bank Survey 2008; FAO Survey 2011, updated by authors to 2011.
Delivery channels
178
For weather index insurance, the sole delivery channel at present is BAAC, which has been an
instrumental stakeholder in the development of both the maize and the rice WII programmes. BAAC has
a major outreach to farmers, as an agricultural bank, throughout the country, and has been involved in
many extension activities to educate and enroll farmers in the weather index programme. BAAC was
also involved in the earlier crop insurance programme in the 1980s. There are no special delivery
channels or programmes for small and emerging farmers in Thailand, as the majority of farmers are
small-scale producers.
Under the new 2011 Thailand Rice Disaster Relief Top-up scheme, BACC acts as the sole distributor: it
holds a master policy for all farmers who have elected to join the scheme and maintains a schedule of all
insured farmers and collects premiums and settles claims on behalf of the pool coinsurers (Annex A5.7).
Voluntary versus compulsory insurance
The maize and rice weather index programmes are voluntary and this also applies to the new 2011 rice
scheme. Insurance has not been made a pre-condition for access to loans by BAAC.
Agricultural reinsurance
Prior to 2010, the maize WII programme was considered too small to need a specific reinsurance
programme, and capacity was provided by the pool of nine (seven today) insurers and one reinsurer
operating under a co-insurance arrangement. Beginning in 2010 the maize WII pool co-insurers have
placed a quota share treaty with leading international reinsurers of this class of business. It is not known
whether the separate rice WII scheme is protected by reinsurance, but currently the scheme is very
small.
The new 2011 Thailand Rice Disaster Relief Top-up scheme is reinsured on a quota share basis by 9
reinsurance companies. SwssRe leads the international reinsurance program.
Public support for agricultural insurance
Types of public support for agricultural insurance
There is no direct public support for the crop weather index insurance programmes in Thailand, but
there is indirect support in that the programme development costs are being carried by BAAC (a public
company) as well as by the private sector insurance companies. The programme overheads are not yet
economically sustainable from the premium generated.
The government of Thailand has, however, since 2009, operated a minimum price guarantee
programme for rice, maize and tapioca (cassava), which is administered through BAAC. Features of this
minimum price guarantee programme are reviewed at the end of this country report.
Under the new 2011 Thailand Rice Disaster Relief Top-up scheme, government is providing a flat 50%
premium subsidy on the single premium rate of THB 120 per rai (THB 750/Ha or a premium of about US$
25 per hectare). The government has set aside a major sum for premium subsidies of THB 3.99 billion
(US$ 132 million) which is administered through BACC.

179
Premium subsidies
In 2011 government is providing a 50% premium subsidy on the Thailand Rice Disaster Relief Top-up
scheme.
Public cost of agricultural insurance
The government has set aside a major sum for premium subsidies of THB 3.99 billion (US$ 132 million).
The cost to government of the crop price guarantee support system is very high or THB 36.4 billion (US$
1.2 billion) in 2009/10.
Agricultural insurance penetration
Insurance penetration rate
The pilot maize weather index insurance programme has now been operating for four full years (2006-
2010). In 2010 BAAC and the insurers have made major attempts to scale up the programme with the
result that 3,182 maize farmers purchased voluntary WII cover on a total of 60,594 rai (nearly 10 000
hectares), equivalent to an insurance penetration rate of nearly 1 percent of the national maize crop
area. (Table A5.35).
Table A5.35. Maize WII uptake (2007 to 2010)
Year
Number of farmers
insured
Insured area
(ha)
National
maize area
(ha)#
Percent of
national crop
area insured
2007 35 154 989 992 0.02%
2008 324 1,070.24 1,042 826 0.10%
2009 817 2,152.64 1,104 870 0.19%
2010 3,182 9,695.04 1,045 896 0.93%
Source: GIA, 12 July 2010; FAO 2011 (forthcoming).110
Note: # FAO maize area statistics
In 2008 the maize rainfall-deficit WII programme was scaled up to four weather stations in four
provinces, and then in 2009 this was further increased to eight trigger stations in five provinces and
finally in 2010 the programme was expanded to cover 15 weather stations in seven provinces.
The SJIT rice seasonal rainfall deficit scheme started on a pilot basis in 2009 with 276 farmers in five
districts of Khon Kaen Province and then in 2010 this was expanded to 1 122 farmers in 25 districts of
Khon Kaen Province.111. In 2011 (February to end May), Sompo has declared sales through BAAC of
6,173 policies in five provinces of northeast Thailand112.
110
General Insurance Association (GIA), Thailand: Maize WII results at 12 July 2010. 111
Yimlamai, 2010. 112
Sompo Japan Insurance Inc (2011) Increase in applications for Weather Index Insurance for Thai Farmers, 24 August 2011.

180
For 2011 the government expected that the Thailand Rice Disaster Relief Top-up scheme would achieve
an uptake rate of about 15% of the total rice area with a total sum insured of THB 11,970 billion (US$ 40
million) and a premium income of THB 1,026 million (US$ 34 million) (Appendix A5.7). It is understood
that actual have been somewhat lower in 2011 with actual premium income of about US$ 5 million.
Financial performance
Five-year results
In 2007 the maize WII pilot programme was very small with reported TSI of US$41,622 and premium of
US$2,782 and the policy was free of claims. The updated figures for 2008 to 2010 are reported in Table
A6.9.5 with overall loss ratio of 63 percent. These underwriting results are satisfactory to date, but the
programme is still too small to be commercially attractive to the stakeholders and premium is
inadequate to cover the A&O costs.
Table A5.36. Maize WII underwriting results 2007 to 2010
Year Premium (baht) Claims (baht) Loss ratio
2008 769,120 0 0%
2009 1,345,400 817,103 61%
2010 6,059,400 4,326,452 71%
Total 8,173,920 5,143555 63%
Year Premium (US$) Claims (US$) Loss ratio
2008 22,827 0 0%
2009 42,040 23,876 61%
2010 186,024 132,822 71%
Total 250,891 156,698 63%
Source: GIA, 12 July 2010; FAO 2011 (forthcoming).
In 2010 the SJIT rice WII pilot programme generated a total premium of US$22,500. It is not known
whether the programme incurred any claims in 2010.
2011 results are not available for either of the WII programs. Also the levels of claims on the Thailand
Rice Disaster Relief Top-up scheme are not known.
Cost of agricultural insurance provision
The weather index insurance programmes are currently in an early phase of implementation. As with
any new product, a heavy investment is required, and such investment costs are not able to be
supported by the initial low premium income volumes. At present the cost structure (percentage of
premium income) of a mature programme cannot yet be stated. During this initial phase, it was agreed
by stakeholders that the percentage of premium to be deducted as overhead expenses would be set at 5
percent of premium income, payable to insurers, and for marketing and distribution, 5 percent, payable
to BAAC. The premium tax is 7.43 percent of premium income.

181
Public disaster assistance programmes
A system of financial compensation is operated in Thailand by the Ministry of Agriculture and
Cooperatives. This programme has operated since 1993 and in early years provided compensation to
farmers on an ad hoc basis in the form of seeds and fertilizers for losses caused by catastrophe events
including drought and floods that result in a total loss as declared by the MOA/Agricultural Extension
Department. In recent years, BACC has assisted the government to formalize the disaster relief scheme
and in the case of rice, to register all growers. Currently the disaster scheme provides rice farmers with
compensation of THB 606 per rai (US$ 125 per hectare). The New subsidized Rice scheme provides top
up protection over and above the government’s compensation level.
Government minimum price guarantee programme for rice, maize and tapioca farmers
Traditionally the Government of Thailand (GoT) has provided a price pledging or price support
programme for rice farmers under which the government would purchase large quantities of rice at
above market prices and to then store the rice – this practice often lead to major oversupply and very
high costs to government of holding surplus rice stocks.
For the past two years the GoT has operated an alternative Price Guarantee Scheme (PGS) for three
commodities, rice, maize and cassava. This programme is also known as a Farmers’ Income Guarantee
Scheme.
Under the PGS, farmers are required to register with the BAAC and to enter into a minimum price
guarantee contract for that crop. During the price guarantee period, if the actual market prices of the
crop are lower than the contract minimum guarantee price, then BAAC pays the difference directly to
the farmer’s account with the bank. In contrast, if actual market prices are higher than the minimum
price guarantee the farmers are free to sell their produce in the market at the higher price. The
programme is financed by GoT and farmers do not pay any fee for the minimum price coverage they
receive. As such, this is a crop price guarantee scheme and not a crop price insurance scheme.
In 2009/10 the PGS was taken up by over 4.25 million farmers (mainly rice growers) and the scheme
compensated over 3.9 million farmers for price shortfall below the guaranteed minimum prices for their
rice, maize and cassava with total compensation of over 36 billion baht (Figures at July 2010, see Table
A6.9.6 for details).
Table A5.37. Results from farmers price (income) guarantee scheme (2009/10)
Crop
No. of
farmers
registered
No. of farmers
receiving price
compensation
No. of
contracts
compensated
Value of
compensation
(baht million)
Maize
398 395
379 361 466 548
5 633
Cassava
445 776
380 294 428 853
2 432
Rice 3 411777 3193 201 4 816 016
28 372
Total 5 711 417
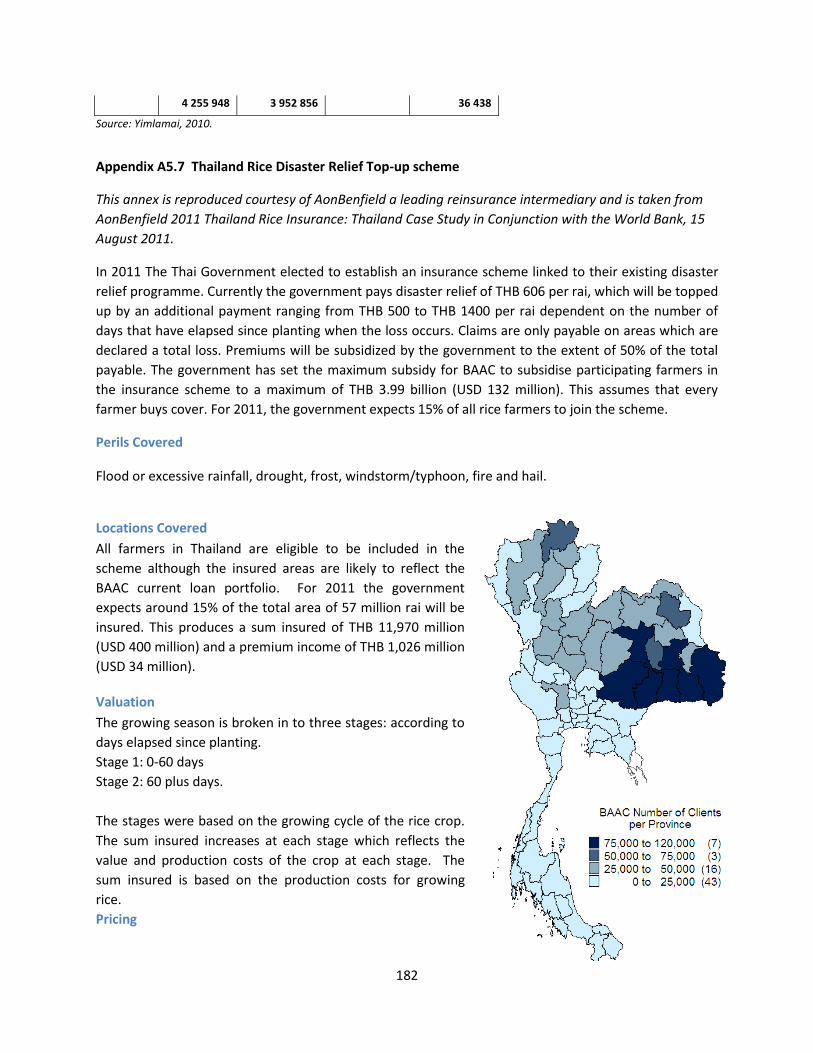
182
4 255 948 3 952 856 36 438
Source: Yimlamai, 2010.
Appendix A5.7 Thailand Rice Disaster Relief Top-up scheme
This annex is reproduced courtesy of AonBenfield a leading reinsurance intermediary and is taken from
AonBenfield 2011 Thailand Rice Insurance: Thailand Case Study in Conjunction with the World Bank, 15
August 2011.
In 2011 The Thai Government elected to establish an insurance scheme linked to their existing disaster
relief programme. Currently the government pays disaster relief of THB 606 per rai, which will be topped
up by an additional payment ranging from THB 500 to THB 1400 per rai dependent on the number of
days that have elapsed since planting when the loss occurs. Claims are only payable on areas which are
declared a total loss. Premiums will be subsidized by the government to the extent of 50% of the total
payable. The government has set the maximum subsidy for BAAC to subsidise participating farmers in
the insurance scheme to a maximum of THB 3.99 billion (USD 132 million). This assumes that every
farmer buys cover. For 2011, the government expects 15% of all rice farmers to join the scheme.
Perils Covered
Flood or excessive rainfall, drought, frost, windstorm/typhoon, fire and hail.
Locations Covered
All farmers in Thailand are eligible to be included in the
scheme although the insured areas are likely to reflect the
BAAC current loan portfolio. For 2011 the government
expects around 15% of the total area of 57 million rai will be
insured. This produces a sum insured of THB 11,970 million
(USD 400 million) and a premium income of THB 1,026 million
(USD 34 million).
Valuation
The growing season is broken in to three stages: according to
days elapsed since planting.
Stage 1: 0-60 days
Stage 2: 60 plus days.
The stages were based on the growing cycle of the rice crop.
The sum insured increases at each stage which reflects the
value and production costs of the crop at each stage. The
sum insured is based on the production costs for growing
rice.
Pricing
183
Premium rates for the programme have been set based a 16 year history of disaster declarations and a
29 year history of total loss area records. The total premium rate will be THB 120 per rai.
Distribution
The insurance product will be distributed to farmers through the Bank of Agriculture and Agricultural
Cooperatives (BAAC).
Participants
The current programme has been developed by a Crop Insurance Committee which is chaired by the Deputy Prime
Minister (HE Trairong Suwankiri). The committee includes members from the Fiscal Policy Office (FPO),
Office of the Insurance Commission (OIC), the Ministry of Agriculture, the Bank of Agriculture and
Agricultural Cooperatives (BAAC) and the General Insurance Association (GIA).
The participants include farmers, a pool of 8 local insurance companies and 9 reinsurance companies
that will each cover a proportion of the risk on a quota share basis. The other main participants and
their roles are outlined below:
Participant Role
Fiscal Policy Office Overall responsibility for implementing the programme and
ensuring it runs to budget and meets the governments
objectives.
Office of the Insurance
Commission (OIC),
Approval of the policy terms and conditions and the policy
wordings.
Bank of Agriculture and
Agricultural Cooperatives
(BAAC)
Administration of the programme including information
provision and marketing the product to farmers, collecting
premiums, and distributing claims.
The General Insurance
Association (GIA).
Represents local insurance companies, including reaching
agreement on the structuring of their involvement in the
programe.
Ministry of Agriculture Provided statistical and general information on rice
production, and details on the current disaster relief
scheme.
Aon Benfield: Provided advice on programme design and premium pricing.
Sole reinsurance broker.
Claim Payouts
Claims are paid out to any farmers whose farm is within an area that has been declared a disaster area.
Initially the Governor of the Province will declare a disaster area. This declaration is based on advice
from the local agricultural department. The smallest area for which a disaster can be declared is a sub-
district, so there are no declarations made for isolated instances of damage with only a few farms
184
affected. Generally the declaration of a disaster area is clear cut with areas obviously affected by
drought or flood. If not, the advice provided to the Governor and collated by the Ministry of Agriculture
can originate from village level, with village heads reporting to the sheriff who then reports to the
Ministry and Governor. Once the Governor of the Province has declared a disaster, then individual
farmers may apply for disaster compensation. The farmer completes a claim form. The farmer must also
have title to the land and is usually requested to provide a photograph of the damage.
Assessment
Once the farmer has submitted a claim, a loss assessment is made by a committee of which the most
important members are from the local Ministry of Agriculture, Department of Agricultural Extension.
The assessors determine which areas have sustained a total loss to the rice crop. Usually this is an entire
farm, but it may also be part of a farm, in which case compensation is paid for the total loss part only.
Besides the condition of the crop, in the case of flooding, the level and duration of the flood is taken into
account and for drought the growth stage and number of days without water are taken into account.
Insured
The BAAC will hold a master policy on behalf of all farmers who have elected to join the Thailand Rice
Disaster Relief Top-Up Scheme. The BAAC will maintain a record of all those farmers who have taken the
cover, and the land area of rice that they plant.
Insurer
Local insurance companies underwrite the new programme through a pool structure. The General
Insurance Association has liaised with its members and 8 local insurance companies have expressed
interest in participating in the programme.
The government acts as a coinsurer on disaster payments, paying THB 606 per rai in addition to any
insurance claim payment
Reinsurance
Reinsurance companies participate in the programme on a quota share basis with the pool members. In
the quota share structure both pool members and reinsurers collect premiums and pay claims in direct
proportion to their level of participation. Nine reinsurance companies are supporting the programme in
2011-12.
References
Agra-CEAS Consulting. 2008. Prevention and control of animal diseases worldwide: Part III: Pre-feasibility study –
supporting insurance of disease losses. Final Report prepared for The World Organisation for Animal Health (OIE).
AonBenfield 2011. Thailand Rice Insurance: Thailand Case Study in Conjunction with the World Bank. 15 August
2011
Yimlamai, A. 2010. Agricultural weather index insurance in Thailand. BAAC, July 2010
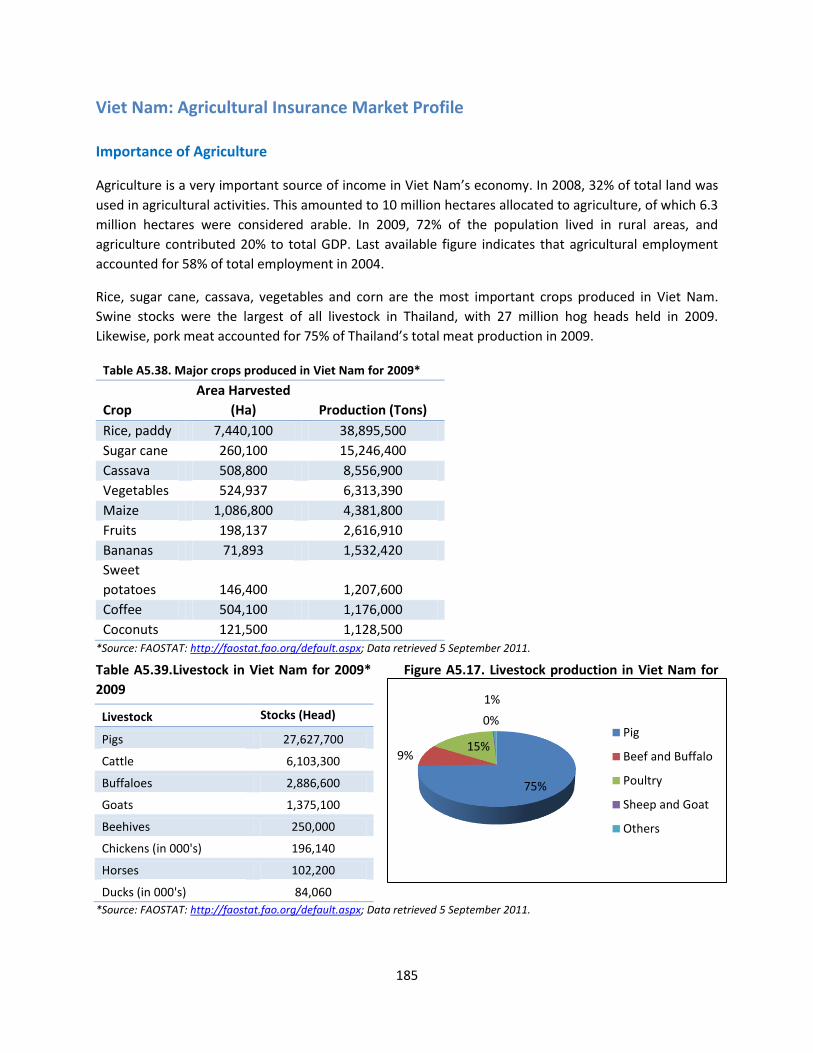
185
Viet Nam: Agricultural Insurance Market Profile
Importance of Agriculture
Agriculture is a very important source of income in Viet Nam’s economy. In 2008, 32% of total land was
used in agricultural activities. This amounted to 10 million hectares allocated to agriculture, of which 6.3
million hectares were considered arable. In 2009, 72% of the population lived in rural areas, and
agriculture contributed 20% to total GDP. Last available figure indicates that agricultural employment
accounted for 58% of total employment in 2004.
Rice, sugar cane, cassava, vegetables and corn are the most important crops produced in Viet Nam.
Swine stocks were the largest of all livestock in Thailand, with 27 million hog heads held in 2009.
Likewise, pork meat accounted for 75% of Thailand’s total meat production in 2009.
Table A5.38. Major crops produced in Viet Nam for 2009*
Crop
Area Harvested
(Ha) Production (Tons)
Rice, paddy 7,440,100 38,895,500
Sugar cane 260,100 15,246,400
Cassava 508,800 8,556,900
Vegetables 524,937 6,313,390
Maize 1,086,800 4,381,800
Fruits 198,137 2,616,910
Bananas 71,893 1,532,420
Sweet
potatoes 146,400 1,207,600
Coffee 504,100 1,176,000
Coconuts 121,500 1,128,500 *Source: FAOSTAT: http://faostat.fao.org/default.aspx; Data retrieved 5 September 2011.
Table A5.39.Livestock in Viet Nam for 2009* Figure A5.17. Livestock production in Viet Nam for
2009
Livestock Stocks (Head)
Pigs 27,627,700
Cattle 6,103,300
Buffaloes 2,886,600
Goats 1,375,100
Beehives 250,000
Chickens (in 000's) 196,140
Horses 102,200
Ducks (in 000's) 84,060
*Source: FAOSTAT: http://faostat.fao.org/default.aspx; Data retrieved 5 September 2011.
75%
9% 15%
0%
1%
Pig
Beef and Buffalo
Poultry
Sheep and Goat
Others

186
Natural Hazards
Viet Nam’s agriculture is highly exposed to multiple natural disasters, including tropical cyclones,
tornados, landslides, and droughts. With the agricultural sector located in coastal lowlands and deltas,
Viet Nam’s agriculture is highly susceptible to frequent typhoons, exacerbating risks of coastal flooding
and storm surges associated to typhoons.
Agricultural insurance market review113
History of agricultural insurance
Agriculture is a very important sector in Viet Nam accounting for 22 percent of 2008 GDP and nearly
three quarters of the population are based in rural areas. The country is very exposed to typhoons and
excess rain leading to flooding, landslides, seasonal drought and also, in the south, to storm surge and
coastal flooding.
The history of agricultural insurance dates back to 1982 when the former national insurance company
Bao Viet Insurance Company launched a pilot MPCI individual farmer insurance scheme for rice farmers
in Vu Ban and Nam Ninh districts of Nam Dinh Province. The programme was not a success and was
discontinued in 1983. Between 1993 and 1997 Bao Viet mounted a further crop insurance scheme in 12
provinces. Currently (in 2009/10) Bao Viet does not insure crops and underwrites a small forestry and
livestock portfolio. Groupama, the French mutual agricultural insurance company, was registered in Viet
Nam in 2001 to underwrite crop and livestock insurance business.
Agricultural insurance market structure2011
In 2008 there were 27 registered non-life insurance companies in the Viet Namese insurance market and
one national reinsurance company Vina Re, with total non-life premium volume of VND11 813 billion or
US$713 million or 0.8 percent of GDP. According to the Association of Viet Namese Insurers, in 2008
total agricultural insurance premiums amounted to VND1.68 billion (US$0.1 million) or less than 0.014
percent of total non life premium. In 2008, four non-life companies underwrote agricultural insurance
including: Bao Viet (99 percent share of total agricultural insurance premium), Groupama (<1 percent
share premium), Bao Minh (<0.0 percent share) and Bao Tin (<0.0 percent share).
In 2010 only Bao Viet and Groupama were underwriting very small agricultural insurance portfolios.
There is, however, an ambitious new public-private partnership initiative to introduce subsidized crop
and livestock, poultry and aquaculture insurance into Viet Nam in October 2011. This program will be
led by Bao Viet and Bao Minh insurance companies (See Box A6.10.1 for further details).
113
The Viet Nam Country Profile draws on the following sources: 1) Word Bank. 2010. Weathering the storm: Options for disaster risk financing in Viet Nam, GFDRR, The World Bank, Washington DC; and 2) N. Quang Hung. 2010. Agricultural insurance in Viet Nam: Current situation and the pilot project, presented at AonBenfield 2010 conference Beijing 3) The Prime Minister DECISION No 315/QD-TTg, 1
st March 2011On implementing Pilot
Agricultural Insurance Scheme in 2011 -2013

187
Agricultural insurance products available
In 2010, Bao Viet offered limited capacity for forestry (standing timber) insurance cover for forestry,
rubber and sandalwood trees and traditional livestock mortality insurance cover. Groupama
commenced underwriting agriculture in the Mekong Delta area in 2001 and offered a range of products
including traditional MPCI cover for rice, livestock insurance and also aquaculture insurance for shrimps.
On account of poor uptake of their crop insurance products and anti-selection the company incurred
high losses in 2005 and has subsequently ceased offering crop insurance. In 2010 the company is
underwriting a very small livestock portfolio.
In addition, there has been extensive research and development into weather index insurance in Viet
Nam over the past three or four years including a meso-level flood river-gauge insurance scheme aimed
at rice farmers located in the lower tracts of the Mekong River Delta who receive seasonal production
loans from VIBARD, the major agricultural credit bank, and coffee drought index cover for individual
farmers.
Under the government subsidized Pilot Agricultural Insurance Scheme 2011-13, it is proposed to
introduce an area yield index insurance AYII product for paddy rice in 7 Provinces of Viet Nam. For
livestock, natural disaster and epidemic disease cover will be introduced for buffalo, cattle pigs and
poultry and also for fin fish and shrimps and prawns. (See Box A5.7 for further details). There is also a
separate pilot AYII program waiting approval and launch in 2011: this program was designed by SwissRe
in conjunction with ABIC, the insurance arm of a leading agricultural bank Agribank, to protect the banks
seasonal loans to rice producers114.
Table A5.40. Agricultural insurance available 2011
Crop insurance products available Greenhouse Forestry
MPCI Named-peril Crop revenue Index-based
No No No Yes (but not
implemented)
No Yes (limited for
rubber)
Livestock insurance products available Aquaculture
All risk Accident
&mortality
Epidemic
disease
Other Index-based
No Yes Yes (2011)No No No Yes (Pilot)
Source: World Bank 2010b; FAO 2011 (forthcoming); updated by Authors 2011.
Delivery channels
The main delivery channels include agricultural banks and farmers cooperatives.
Voluntary versus compulsory insurance
Currently, agricultural insurance in Viet Nam is voluntary.
Agricultural reinsurance
114
For further details see http:/www.swissre.com/rethinking /agricultural/Yield Index_solutions
188
Vina Re, the former national reinsurer, which is now privatized (and which includes Swiss Re as a
majority shareholder) is the main reinsurer for all non-life business including agriculture. SwissRe is the
leader for the 2011-13 subsidized agricultural insurance pilot scheme.
Public support for agricultural insurance
Types of public support for agricultural insurance
Premium subsidies
To date, government has not provided any form of premium subsidy support to agricultural insurance in
Viet Nam. However, under the proposed PPP 2011–2013, it is planned that the Government of Viet Nam
will provide premium subsidies of between 60 percent and 100 percent of premium according to the
type of farmer and up to 20% premium subsidies for agricultural production organizations (See further
details in Box A5.7).
Public cost of agricultural insurance
According to Quang Hung (2010), the subsidized premiums may be in the order of VND1,358 billion
(US$70 million) for the crop, livestock and aquaculture insurance pilot programme 2011–2013.
Agricultural insurance penetration
Insurance penetration rate
In 2011 there is very little or no crop insurance at all and livestock and forestry insurance is insignificant.
The 2011-03 Pilot Agricultural Insurance Scheme for paddy rice in 7 Provinces and for livestock in 9
Provinces is expected to reach very large numbers of crop and livestock producers over the next 3 years.
Financial performance
Five-year results
The agricultural insurance premium volume has been very small over the period 2004 to 2008 and is
currently in the order of about US$100,000 per year. The five-year loss ratio is 92 percent with very high
losses reported in 2005 (loss ratio 267 percent).
Table A5.41. Viet Nam: Agricultural insurance results 2004–2008
Year
Gross written
premium (VND
million)
Gross
written
premium
(US$)
Claims
(VND
million)
Claims
(US$)
Loss
Ratio
(%)
2004 3 267 207 060 3 635 230 384 111
2005 454 28 553 1 211 76 163 267
2006 737 47 888 535 34 762 73
2007 833 52 936 647 41 115 78
2008 1 677 98 241 349 20 398 21
Total 6 968 434 678 6 377 402 822 92

189
Source: Quang Hung, 2010.
Public disaster assistance programmes
Viet Nam has an extremely well developed natural disaster management system and post-disaster emergency relief and reconstruction scheme that is partly funded by central government and local government (provincial and district-level governments). Under the State Budget Law of 2002, the central and local governments are required to allocate between 2 percent and 5 percent of their total planned budgeted for capital and recurrent expenditures to a contingency budget to meet contingent spending on preventing, combating and overcoming natural disasters (e.g. typhoon, flood, landslide, drought). In 2008 the total central and local contingency budgets were in the order of VND9 050 billion (US$650 million).115 Following major typhoon and flood events, farmers receive compensation payments usually in the form of seeds and fertilizers or small animals to replaced lost livestock.
Box A5.7. Viet Nam: Government subsidized pilot agricultural insurance programme 2011–13
According to the Ministry of Agriculture and Rural Development MARD and the Ministry of Finance (MOF) a new
pilot agricultural insurance programme will be launched by the government in conjunction with the insurance
sector from 2011 and 2013. The objectives of the pilot programme are to protect rural livelihoods, to improve the
efficiency of the insurance market and to enable farmers to recover (get back into production) more quickly
following natural disasters and or epidemic disease outbreaks.
Insured classes:
The pilot programme will include the following classes:
Crop insurance: rice
Livestock insurance: cattle and pigs
Poultry insurance
Aquaculture insurance: fin fish and prawns and shrimps.
Pilot provinces:
The pilot crop insurance programme for rice will be implemented in Nam Dinh, Thai Binh, Nghe An, Ha Tinh, Binh
Tuan, An Giang, Dong Thap provinces.
The pilot livestock and poultry insurance programmes will be implemented in Bac Ninh, Nghe An, Dong Nai, Vinh
Phuc, Hai Phong, Thanh Hoa, Binh Dinh, Binh Duong and Hanoi provinces.
Insured perils:
Crop insurance will cover catastrophe perils such as typhoon (wind storm) and flood, drought and frost and also
specific pests and disease of rice (e.g. brown plant hopper disease).
Livestock insurance will cover epidemic diseases in cattle and pigs such as blue-ear disease and foot and mouth
disease (FMD).
Poultry insurance will cover epidemic diseases including avian flu.
Aquaculture insurance will cover natural perils such as storm and flood and diseases of fish and prawns.
Premium subsidies:
The following premium subsidy levels are proposed in the draft:
Poor rural farming households, premium subsidies of 90 percent to 100 percent
115
World Bank, 2010b.

190
Other farmers, premium subsidies of 60 percent
Agricultural production organizations, premium subsidies of 20 percent.
Source: The Prime Minister No. 315/QD-TTg DECISION On Implementing Pilot Agricultural Insurance Scheme in 2011-13. Hanoi
March 1st
,2011
References Quang Hung, N. 2010. Agricultural insurance in Viet Nam: Current situation and the pilot project, presented at Aon_Benfield 2010 conference Beijing. Word Bank. 2010b. Weathering the storm: Options for disaster risk financing in Viet Nam, GFDRR, The
World Bank, Washington, DC

191
Appendix 6. Disaster Microinsurance: Selected case studies and profiles of ASEAN Member States
Case Study: Bajaj Allianz and CARE India offer composite microinsurance
When the 2004 Indian Ocean tsunami caused massive damages and took 230,000 lives, Allianz Insurance Company felt little to no impact on its balance sheet. CARE International, on the other hand, was one of many NGOs deeply involved in the response. For Allianz, the event made it realize how underinsured the South Asian region was. For CARE, the event underlined the importance of livelihood protection to protect low-income populations against cyclical poverty from natural disasters. Allianz’s Indian joint venture, Bajaj Allianz, and CARE India decided to partner in the coastal Tamil Nadu state, with Bajaj Allianz providing financial management, experience, and process, and CARE providing a trusted name and relationships with local communities.
The partners designed a microinsurance product based on expressed needs in household surveys. The target demographic was poor non-landowners. The partners designed a general insurance policy covering a range of risks. The base product, priced at €0.95 per year, would payout a defined sum in case of total or partial disability, hospitalization, loss or damage to the household or other assets, and death. The comprehensive coverage was attractive to policyholders: with only one policy, they did not have to tie up resources in a range of microinsurance products.
Neither partner had information of the probability of loss of the product; they determined to place the product in the market and to adjust pricing based on annual reviews. The product launched in March 2008, selling almost 63,500 products within nine months.
In November 2008, Cyclone Nisha struck India and Sri Lanka, causing losses for thousands of families. Within days, the partners received more than 16,000 claims in 44 widespread villages. When a team of claims adjusters arrived in the affected area, it was clear that assessing every claim would take months. The partners had to waive all requirements that slowed the claims settlement process, and Allianz paid around €800,000 worth of claims, nearly 10 times the amount collected, by the end of January 2009.
The experience demonstrated insurance’s value to the communities, who were subsequently more interested in purchasing coverage. Although the payout helped Bajaj Allianz and CARE India to receive credit on the ground, it exposed the need to improve the business case for microinsurance for Bajaj Allianz. Two changes were made in response to the event: the premium was raised from €0.95 to €2.95 per year and the program expanded into inland areas less prone to disasters.
Time will tell whether these adaptations increase the program’s viability in the long-term. Increasing the price for the product could significant reduce communities’ interest in the product if they first experienced it at a lower price. Furthermore, although the product is now available in lower-risk inland regions, adverse selection may occur, meaning only the populations close to the coast at high risk of damage from natural disasters are interested in purchasing microinsurance protection. In either case, Bajaj Allianz and CARE India’s experience demonstrates the difficulty of pricing microinsurance products without adequate risk data and the challenges of claims adjustment. It also demonstrates, however, that positive experiences with microinsurance can increase the community’s interest in microinsurance.

192
Case Study: Microinsurance Catastrophe Risk Organization (MiCRO)116
In March 2011, the launch of the Microinsurance Catastrophe Risk Organization (MiCRO), a licensed insurance company domiciled in Barbados, was announced by its founding partners117. MiCRO began operations in Haiti in January 2011, providing mandatory group catastrophe insurance118 to 58,000 microentrepreneur borrowers of the microfinance institution (MFI) Fonkoze. Although initially launched in Haiti, MiCRO is intended to expand to other markets, providing catastrophe covers distributed through organizations such as MFIs, NGOs, cooperatives, mutual benefit associations (MBAs), etc.
The evolving MiCRO partnership has the following structure (Figure A8.1): Fonkoze – Haiti's largest MFI – and Mercy Corps are equity investors in the facility, with support for operations provided by donors the United Kingdom Department for International Development (DFID) and the Swiss Agency for Development and Cooperation (SDC) through a multi-donor trust fund. Swiss Re provides parametric (re)insurance to the Facility, and CaribRM and GC Micro are the contracted operators of the Facility (responsible for technical design and financial risk management, respectively).
Figure A6.1. Simplified technical structure of MiCRO
Source: Microinsurance Catastrophe Risk Organization
In MiCRO's inaugural operation in Haiti, Fonkoze purchases US$10M in annual aggregate parametric coverage from MiCRO to protect approximately US$11M of catastrophe exposure through a local fronting company. Fonkoze distributes individual coverage to its underlying 58,000 lending clients. As an equity investor in MiCRO, Fonkoze is able to access basis risk coverage119 from the Facility in conjunction with its parametric catastrophe insurance policy. Mercy Corps provides technical support and is exploring methods of utilizing MiCRO’s platform for its microfinance portfolios on a global basis.
116
The author gratefully acknowledges the feedback provided by MiCRO on this case study. 117
MiCRO’s founding partners include: Fonkoze Financial Services, Mercy Corps, the United Kingdom Department for International Development (DFID), the Swiss Agency for Development and Cooperation (SDC), Swiss Re, Caribbean Risk Managers Limited (CaribRM), and Guy Carpenter’s GC Micro Risk SolutionsSM group (GC Micro). 118
Cover is provided for wind, rainfall, and earthquake. 119
Basis risk is the risk of mismatch between actual losses incurred and associated parametric payouts. A Basis Risk Gain occurs when assessed losses are less than associated parametric payouts and a Basis Risk Loss occurs when assessed losses are greater than associated parametric payouts.

193
Catastrophe coverage provided by MiCRO takes advantage of the cost and expediency of parametric insurance while buffering MFIs and their clients against basis risk by offering them the option to purchase basis risk coverage. Basis risk coverage is seen as MiCRO’s key innovation: It provides a hedge against basis risk, which is a significant impediment to the development of viable parametric micro(re)insurance products.
To access parametric insurance with basis risk coverage, the insured organization must make an equity investment in MiCRO – to assure interest alignment – and adopt MiCRO-approved loss assessment procedures. Under the Parametric Coverage currently reinsured by Swiss Re, if certain trigger levels are met for an event, the Reinsurer will make a payment to MiCRO which in turn will transfer the funds to the MFI. The MFI in turn will administer use of these funds to ensure that borrowers recover promptly.
Under the Basis Risk Coverage, any losses that occur from a catastrophic event may be indemnified if the parametric coverage did not trigger or did not trigger sufficiently. In this case, the MFI would file a claim with the MiCRO Board, which would have authority to approve payment to the MFI, subject to the application of loss co-participation and other policy parameters.
MiCRO was first tested in June 2011 when heavy rains in south-western Haiti triggered the Facility. A US$1.05 million parametric payout was provided to Fonkoze, which in turn fielded claims from nearly 3,900 borrowers (average payout of nearly US$270 per borrower). The parametric payout was designed to eliminate borrowers’ debt and provide them with a HTG5000 (US$125) emergency expense payment. For this event, actual losses incurred were close to the parametric payout amount.
The combination of basis risk protection with an efficient parametric cover is a promising development for the disaster microinsurance market. Individual programs program’s premiums and required equity investment will depend upon risk appetites and geographic divergence, MiCRO states that investment in the company – in the form of equity and/or premium dollars – represent a more efficient method of financing disaster risk for MFIs (and other entities) than self-insuring against systemic default following a natural disaster. While individual instances will differ, MiCRO estimates that access basis risk cover will require an equity investment magnitude equal to about 5% of the maximum coverage limit.
An open question about the sustainability and scalability of this model remains the role donor capitalization for the provision of basis risk coverage; as MiCRO expands to additional countries and covers120, it will need to reduce its dependence on donor funding. If it is able to maintain the efficacy of its operations while transitioning away from donor funding, MiCRO could play a role in extending disaster microinsurance coverage to microcredit providers and other potential insureds in ASEAN member countries.
120
MiCRO committed at the Clinton Global Initiative (September 2011) to pilot the design and implementation of a cholera insurance product in Haiti.
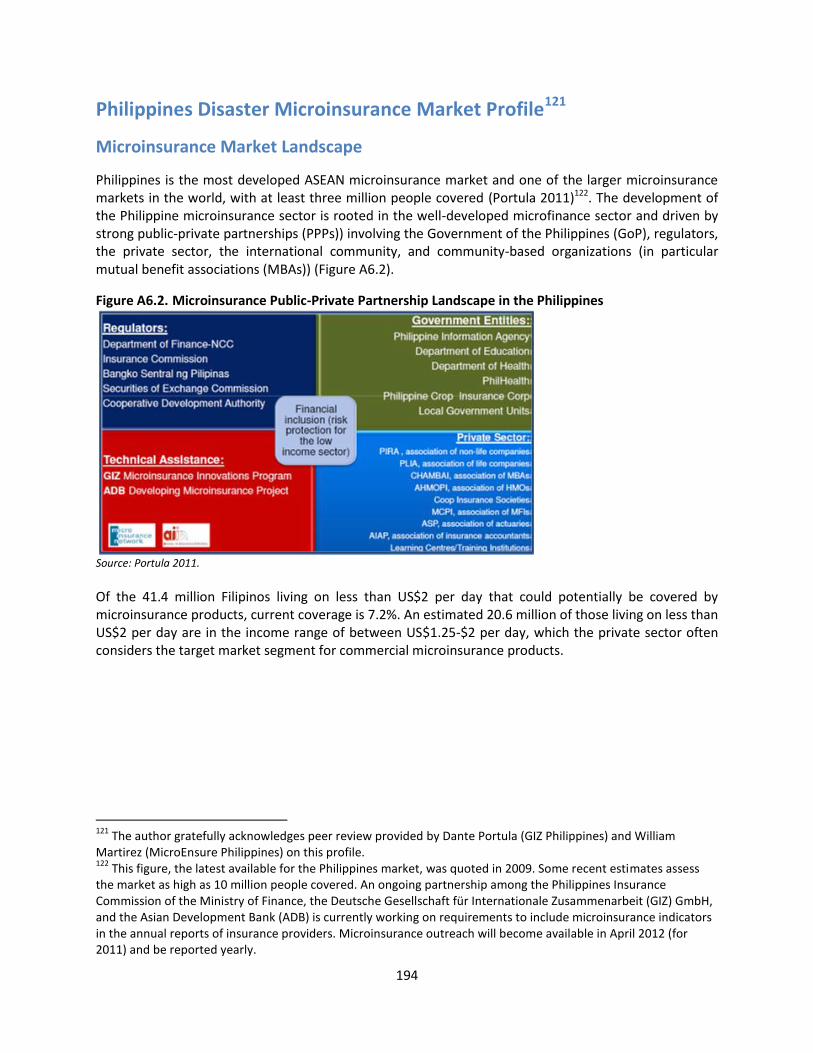
194
Philippines Disaster Microinsurance Market Profile121
Microinsurance Market Landscape
Philippines is the most developed ASEAN microinsurance market and one of the larger microinsurance markets in the world, with at least three million people covered (Portula 2011)122. The development of the Philippine microinsurance sector is rooted in the well-developed microfinance sector and driven by strong public-private partnerships (PPPs)) involving the Government of the Philippines (GoP), regulators, the private sector, the international community, and community-based organizations (in particular mutual benefit associations (MBAs)) (Figure A6.2).
Figure A6.2. Microinsurance Public-Private Partnership Landscape in the Philippines
Source: Portula 2011.
Of the 41.4 million Filipinos living on less than US$2 per day that could potentially be covered by microinsurance products, current coverage is 7.2%. An estimated 20.6 million of those living on less than US$2 per day are in the income range of between US$1.25-$2 per day, which the private sector often considers the target market segment for commercial microinsurance products.
121
The author gratefully acknowledges peer review provided by Dante Portula (GIZ Philippines) and William Martirez (MicroEnsure Philippines) on this profile. 122
This figure, the latest available for the Philippines market, was quoted in 2009. Some recent estimates assess the market as high as 10 million people covered. An ongoing partnership among the Philippines Insurance Commission of the Ministry of Finance, the Deutsche Gesellschaft für Internationale Zusammenarbeit (GIZ) GmbH, and the Asian Development Bank (ADB) is currently working on requirements to include microinsurance indicators in the annual reports of insurance providers. Microinsurance outreach will become available in April 2012 (for 2011) and be reported yearly.

195
Non-life microinsurance premiums for 2009 are estimated at about Php200 million, or 0.5%, of the non-life insurance market. Non-life microinsurance products also only have limited outreach in the context of the total microinsurance insurance market; life microinsurance products have a much longer history in the country, with an average age of over 20 years (ILO 2007), and are much more widely available. The microinsurance covers with significant volume are, in order of number of lives covered, personal accident and disability, term life, funeral, and credit life. These products make sense in the Filipino context given that poor Filipinos’ priority risks are death, old age, and illness, as captured in Churchill (2006). More than two-thirds of microinsurance sales are compulsory with loan acquisition. Other non-life products approved by the regulator include motor, residential fire, property, and area-yield and weather-index crop microinsurance (Chiong 2010).
The primary, regulated providers of microinsurance in the Philippines are 27 mutual benefit associations of which 20 are dedicated microinsurance mutual benefit associations (MI-MBAs), eight non-life insurers (of 87 non-life and composite in the market) and eight life insurers (of 34 life and composite), and two cooperative insurance societies. Pre-need companies and health maintenance organizations play less important roles in the provision of microinsurance (health maintenance organizations cannot directly provide microinsurance, they must partner with microinsurance providers through product bundling).
Regulation of Microinsurance
The Insurance Commission (IC) of the Department of Finance regulates insurance business in the Philippines, including microinsurance. The legal basis for the insurance industry in the Philippines is the Insurance Code of 1978, of which Chapter VII, Title I: Provisions on Mutual Benefit Associations, serves as the foundation for microinsurance regulation (Chiong 2010). The strong regulatory stance for microinsurance is rooted in the well-developed microfinance regulatory framework. The National Regulatory Framework for Microfinance was passed in 1997, and was rated first of 58 countries in regulatory framework in an Economist Intelligence Unit study on microfinance in 2010123.
The IC treats microinsurance separately from traditional insurance. In 2006, it issued Insurance Memorandum Circular (IMC) No. 6, which outlines regulation of microinsurance in broad terms. In 2010, after a review of IMC No. 6 by a technical working group and technical assistance from Deutsche Gesellschaft für Internationale Zusammenarbeit (GIZ) GmbH and the Asian Development Bank (ADB), the IC issued IMC No. 1, again modifying microinsurance regulation. IMC No. 1 provides a more detailed definition of microinsurance, a microinsurance product, and microinsurance provision and distribution. It articulates the key features of a microinsurance contract, including risks and contingent events able to be covered; included are, “Calamities/disasters/catastrophic events (e.g., typhoon, earthquake, infestation, and other natural calamities)” (Insurance Commission 2010).124
The Philippine Insurance code is currently being reviewed, and the treatment of microinsurance may change in the revised code. It is likely that the revised code will articulate performance standards for microinsurance providers, possibly including risk-based capital requirements (Chiong 2010).
123
Review of survey results in Portula 2011. 124
According to the GIZ GmbH, the Philippine Insurance code is currently being reviewed. In the draft proposal of the insurance industry, microinsurance is included as separate provision.

196
Although there is no one-sized-fits-all approach to microinsurance regulation, the Filipino example is widely acknowledged as a role model in developing enabling microinsurance regulation. The GoP has publically stated its commitment to the development of a sustainable microinsurance sector in the context of broader financial inclusion efforts. Since the issuance of IMC No. 6 in January 2010, the IC has approved 32 microinsurance products from 21 insurance providers. In August 2011, the IC Microinsurance Technical Committee was established; the GIZ Microinsurance Innovation Program for Social Security (GIZ MIPSS) is providing TA in the daily functioning of this committee.
Disaster Microinsurance Market Development
In recent years, non-life disaster insurance products have started to be developed by partnerships involving the government, the private sector, and the international community (Jiao 2011). In spring 2011, for example, the IC approved a prototype non-life insurance product, Buhay-Bahay-Kabuhayan (BBK) or Life-Dwelling-Livelihood. The product, created with technical assistance from GIZ GmbH, covers named perils such as personal accident, permanent disability, fire, typhoon, flood, earthquake, and lightning; BBK will provide the insured Php 10,000 per unit if the place of dwelling or livelihood of the insured suffers a loss or damage. BBK is the first microinsurance product in the Filipino market using a simple, one page policy written in the Filipino language. Insurance companies can adapt the number of perils they will cover under BBK and its pricing; six commercial insurance companies have adapted BBK.
The Filipino non-life insurance association estimates that the non-life microinsurance sector could be worth Php2 billion if fully developed (Jiao 2011); others familiar with the market estimate this amount to be even higher. Non-life insurers have signaled their interest in developing the non-life microinsurance market, including catastrophe covers. According to an April 2011 industry publication, non-life insurers expressed interest in the Buhay-Bahay-Kabuhayan product, as well as expanding their offerings more broadly.
Although there is significant interest in developing stand-alone disaster microinsurance products (e.g., BBK), the first disaster microinsurance products that been developed are meso-level and/or bundled with credit. The following two case studies are innovative examples of meso- and micro-level disaster covers developed through public-private-partnerships in the Philippines.125
Meso-level catastrophe insurance
An innovative public-private partnership involving global reinsurer Munich Re, GIZ, and the Cooperative Life Insurance and Mutual Benefit Services (CLIMBS), an umbrella cooperative and licensed composite (life & non-life) insurer, aims to mitigate the effects of extreme weather events in order to enhance the financial stability of cooperatives and other microfinance providers and to protect their credit portfolios. The ultimate goal of the partnership is to pass on insurance benefits to cooperative and MFI members (Munich Re 2011).
125
It is reinforced that these disaster (micro)insurance products are not the only disaster microinsurance products currently available in the Philippine market.
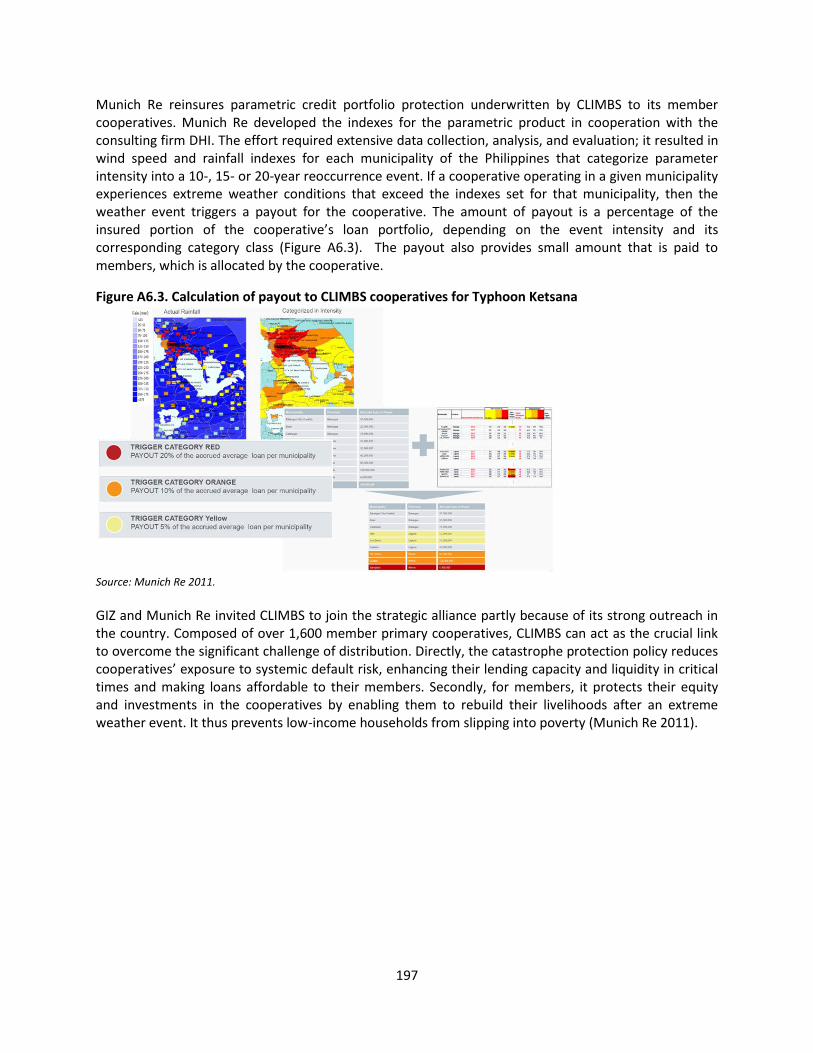
197
Munich Re reinsures parametric credit portfolio protection underwritten by CLIMBS to its member cooperatives. Munich Re developed the indexes for the parametric product in cooperation with the consulting firm DHI. The effort required extensive data collection, analysis, and evaluation; it resulted in wind speed and rainfall indexes for each municipality of the Philippines that categorize parameter intensity into a 10-, 15- or 20-year reoccurrence event. If a cooperative operating in a given municipality experiences extreme weather conditions that exceed the indexes set for that municipality, then the weather event triggers a payout for the cooperative. The amount of payout is a percentage of the insured portion of the cooperative’s loan portfolio, depending on the event intensity and its corresponding category class (Figure A6.3). The payout also provides small amount that is paid to members, which is allocated by the cooperative.
Figure A6.3. Calculation of payout to CLIMBS cooperatives for Typhoon Ketsana
Source: Munich Re 2011.
GIZ and Munich Re invited CLIMBS to join the strategic alliance partly because of its strong outreach in the country. Composed of over 1,600 member primary cooperatives, CLIMBS can act as the crucial link to overcome the significant challenge of distribution. Directly, the catastrophe protection policy reduces cooperatives’ exposure to systemic default risk, enhancing their lending capacity and liquidity in critical times and making loans affordable to their members. Secondly, for members, it protects their equity and investments in the cooperatives by enabling them to rebuild their livelihoods after an extreme weather event. It thus prevents low-income households from slipping into poverty (Munich Re 2011).

198
Munich Re believes that in the long-term, this model provides a sustainable option for building a commercial market in disaster microinsurance. Often, microinsurance is distributed through MFIs that provide only credit products to their clients, which can contribute to the development of a “credit culture.” In this program, however, microinsurance is provided with a package of financial services that includes savings in addition to credit. In the long-term, this approach benefits low-income populations by helping them to build assets and engage in more productive activities while managing their risks. This approach is aligned with a financial risk management strategy for natural disasters that employs risk retention and risk transfer.
Catastrophe housing microinsurance
MicroEnsure Philippines was established in 2006 and has worked with its three insurance and six microfinance partners to develop six different product lines serving over three million Filipinos. MicroEnsure Philippines is a private microinsurance broker that provides back office services (e.g., product design, negotiation with (re)insurers, training and education, data management, etc.) to develop domestic microinsurance markets.
In 2008, MicroEnsure Philippines developed the first housing microinsurance product, Bahay Asenso, loosely translated as “home improvement.” Bahay Asenso covers homeowners or renters who take out loans to make home improvements against damage from fire and natural disasters. The microinsurance product is compulsory for MFI clients who take microhousing loans; in the case of a verified claim, the payout is automatically deducted from the amount due for the loan. Table A6.1 provides more details on the product.
Since its launch in 2008, the product has covered a total of 3,351 borrows.
Table A6.1. Bahay Asenso Product Overview
199
Indonesia Disaster Microinsurance Market Profile
Microinsurance Market Landscape
The microinsurance market in Indonesia remains underdeveloped, although there is evidence to suggest that it is growing quickly. Updated information on the total number of Indonesians accessing microinsurance is unavailable; the most recent market sizing is from a 2007 assessment by the International Labor Organization (ILO), which places total number of lives covered at 221,000.
The experience of one Allianz microinsurance product, Payung Keluarga, however, suggests that the microinsurance market has been growing. Coverage of the credit life product has increased significantly since its introduction in 2006; it currently covers about 350,000 lives126. Given that there is a range of providers in the country with small microinsurance volumes, the actual number of low-income people accessing microinsurance in Indonesia can be estimated to be somewhat higher.
Microinsurance experts consider Indonesia as one of the three largest opportunities for development of microinsurance127; it is by far the largest potential market in ASEAN based on population. Approximately 116 million Indonesians live on less than US$2 per day, nearly three times the largest population in the low-income bracket of the next most populous ASEAN Member State. The National Financial Inclusion Strategy of Indonesia, which includes microinsurance, will be formally launched by the Government in the near future; it may be able to reduce certain supply and demand constraints and increase access of this population to microinsurance.
In May 2011, Leapfrog Investments, a private equity firm in the microinsurance sector, announced it would infuse between US$5-US$20 million in the Indonesian microinsurance market. Leapfrog said that it was considering both life and nonlife insurers providing microinsurance and that it would consider personal accident, life insurance, motorcycle insurance, and property insurance product lines (Haryono and Fauzie 2011).
Information on the number of microinsurance providers and distributors was not available at the time of drafting. The General Insurance Association has expressed interest in developing the microinsurance market and the Insurance Council of Indonesia hosted the First Indonesia Microinsurance Marketplace in October 2011. The event brought together a range of participants to advance innovation in microinsurance in Indonesia.
Few formal insurers in Indonesia underwrite microinsurance, although more are beginning to move down-market, a development supported by the Directorate of Insurance (Allianz et al 2006). Asuransi Central Asia (ACA), for example, recently began piloting an innovative dengue fever microinsurance product. The government-backed Bank Rakyat Indonesia (BRI) established BRIngin Life and General to provide life and property insurance to BRI as collateral on its microlending portfolio (BRI is Indonesia’s largest single microfinance provider).
126
About 325,000 borrowers and 25,000 spouses. 127
Accompanied by China and India. Reported by Reuters 2011.
200
Informal providers of microinsurance in Indonesia are known to include credit unions, microfinance institutions, faith-based organizations, and NGOs; the market is highly fragmented and most of these types of organizations service small membership bases. Informal traditional rotating savings and credit groups, called arisans, also provide some informal microinsurance coverage. Arisans are not regulated and may not provide effective coverage for members. Insurance benefits are equal for all members, regardless of premium payments, and premiums are not always sufficient to settle pending claims (Allianz et al 2006).
Regulation of Microinsurance
Microinsurance is not currently regulated in Indonesia. The Government of Indonesia committed at the abovementioned Microinsurance Marketplace in October 2011, however, that it would develop microinsurance regulation during 2012. Market participants anticipate that future regulation will address, among other issues, the relaxation of licensing requirements for agents. Past and current microinsurance initiatives have advanced under the framework of existing laws. Index-based products are not expressly mentioned in insurance code, and only one index-based product, the flood index product mentioned above, has been tried in Indonesia and has received regulatory approval. If this experience can be considered to have set a precedent, then it appears that as long as index-based products are allowed if they do not violate conditions of the insurance code.
Disaster Microinsurance Market Development
Disaster microinsurance is currently unavailable in the market, although flood microinsurance was piloted at a small scale by Munich Re in 2009. Multiple initiatives are also advancing to bring new disaster microinsurance products to the market. These involve two initiatives to development earthquake microinsurance and one by the Swiss cement, building material, and construction company, Holcim Ltd., to market multi-peril property catastrophe insurance to homeowners.
These examples augur well for the development of the disaster microinsurance market in Indonesia. The challenges and opportunities identified by all three can inform broader disaster microinsurance development initiatives in the country.
Flood index microinsurance
In 2009, Indonesian insurance company Asuransi Wahana Tata, Munich Re, and German aid agency Deutsche Gesellschaft für Technische Zusammenarbeit (GTZ)128 launched the first-ever flood microinsurance pilot in Jakarta. The program aimed to provide affordable, easy-to-understand, and non-bureaucratic insurance coverage for a risk known to be very difficult to assess.
128
On January 1, 2011 GTZ was merged with two other German development services to form the Deutsche Gesellschaft für Internationale Zusammenarbeit (GIZ).

201
The insurance product was a simple protection card, similar in size to a telephone card, which carried insurance coverage. Residents of the pilot area could purchase an unlimited number of insurance cards; each card cost slightly less than US$5 and guaranteed a one-off payment of approximately US$24.50 if the waters rose to or above 950 centimeters at the Manggarai Water Gate in Jakarta during the rainy season. Cards could be purchased during the dry season and were valid for one year. In case of a triggering flood, policyholders could redeem their insurance cards for payment within an approximated five days of the event. Payouts could be used to cover asset losses and livelihood expenses such as medical expenses and food.
Although lauded for its simple design and availability of flexible coverage, the flood insurance product had limited outreach. In its first month, approximately 50 policies were sold, and sales did not increase significantly in the following months. One issue cited by community members in the months following the product launch was that they did not feel that flood water level at the Manggarai Water Gate accurately reflected their own losses (i.e., basis risk). They also felt that the trigger level (950 cm) was set too high and demanded insurance for more frequent events. For this and a number of more practical reasons (i.e., an urban drainage project that attenuated flooding problems in the area), the pilot was discontinued in 2010.
This case raises interesting questions about design and development of index-based insurance products. The project appeared well positioned to provide a valuable coverage for Jakarta residents – it addressed a compelling infliction on the community, involved community members in its design, and adopted a straightforward product design – and yet demand was weak. What can other disaster microinsurance programs learn from this project? How can programs balance the demand for coverage that pays out frequently with insurability constraints? How can educational messages on insurance be effectively conveyed to the population? Is it feasible for insurance to be part of the response to recurrent urban flooding?
PT Asuransi Maipark earthquake microinsurance
The Indonesian insurance industry, through its representative PT Asuransi Maipark129, is developing a parametric earthquake microinsurance product for homeowners, Kartu Gempa. The product is still in the design phase; the triggering parameter (i.e., shakemap, magnitude, distance, depth) and pricing for Kartu Gempa are still under research. Some targeting, design, and distribution choices, however, have been made.
Like the flood insurance product, Kartu Gempa will be a one-off purchase in the form of an insurance voucher. Each voucher is being targeted to cost around IDR 100,000 (US$11), with a maximum payout per voucher of IDR 2,000,000 (US$225). A maximum of five cards per homeowner is allowed, for total maximum coverage worth ISD 10,000,000 (US$1,225). The insurance policy’s term is one year.
129
PT Asuransi Maipark is jointly-owned by all general insurance companies in Indonesia; currently 92 companies are shareholders.

202
The insurance industry plans to take advantage of mobile phones to distribute and administer the product. Kartu Gempa will be sold by all general insurance companies as well as by traditional insurance agents and alternatives such as mini-markets and local governments, among others. Insurance policies will be registered and activated at the point of sale via telephone or SMS; policy holders will submit their information, including policy number and the location of the home, and receive an SMS confirmation. In the case of an earthquake, policyholders will receive an SMS to confirm the payout following verification of a triggering event, and a cash payment will be made within two weeks of the event. This distribution and administration model mirrors that of other schemes for parametric microinsurance products internationally130.
GlobalAgRisk earthquake microinsurance
GlobalAgRisk, a consulting firm specializing in index-based insurance for natural disaster risk transfer, is advancing the development of a market-based earthquake risk insurance product through the support of the Ford Foundation. The goal of the product will be to protect the asset accumulation and access to financial services for Indonesia’s working poor. The initiative is still in its early stages; a pre-feasibility study has been completed that includes a preliminary seismic hazard risk assessment and simple index insurance structure. The study also outlines a sequenced, double-lane approach to develop a meso-level product for risk aggregators, followed by a micro-level product for households. The former would target microfinance providers and small- and medium enterprises that target the poor and the latter would bundle earthquake index insurance with existing microfinance products (GlobalAgRisk 2011).
The initiative is currently focusing on further seismic hazard risk assessment and modeling in Indonesia and the pursuit of the meso-level strategy to target risk aggregators. GlobalAgRisk believes that this strategy of bundling earthquake coverage with simple triggering conditions with certain classes of household level insurance products could be an initial entry point into the market that could help avoid some issues of basis risk while offering a product of value to the productive working poor (GlobalAgRisk 2011).
Holcim Ltd. multi-peril property catastrophe insurance
Holcim Ltd., a Swiss cement, building material, and construction company, has announced that it is selling property catastrophe insurance covering earthquakes, tsunamis, fires, windstorms, and riots for the homes built with its products in Indonesia. Zurich Financial will underwrite the policies; they will be provided to homeowners who have purchased Holcim products at no cost for the first year and less than US$10 annual premiums in subsequent years.
Holcim may implement this approach in other markets as well for construction materials and fertilizer. For Holcim, providing customers with access to property catastrophe insurance can help to grow its business in developing countries in the long-term. Customers who avail themselves of the insurance will protect their valuable assets, increasing their protection against financial shocks from natural disasters.
130
The Syngenta Foundation’s weather index-based insurance scheme, Kilimo Salama, in Kenya, is a good example of another program successfully using this model.

203
Bibliography
Alip, J., Navarro, E., & Catibog, M. (2009). Status of Microinsurance in Southeast Asia: The cases of Cambodia, the Philippines, and Viet Nam. Bangkok, Thailand: Asia Pacific Rural and Agricultural Credit Association.
Allianz Group. (2010). Learning to insure the poor: Microinsurance report.
Bandel, C. (6 April 2011). Holcim Uses Cut-Price Insurance to Lure Homebuilders in Emerging Markets. Bloomberg. Retrieved from http://www.bloomberg.com/news/2011-04-06/holcim-uses-cut-price-insurance-to-tap-emerging-markets-clients.html
Chiong, V. (2010). Microinsurance in the Philippines and its Regulation. Speech presented at 6th International Microinsurance Conference 2010, Hotel Intercontinental, Manila, Philippines.
Churchill, C. (Ed.). (2006). Protecting the poor: A microinsurance compendium. Geneva, Switzerland: International Labor Office & Munich Re Foundation.
Deutsche Gesellschaft für Technische Zusammenarbeit (GTZ) GmbH (4 May 2009). “Innovative non-life microinsurance launched in Indonesia.” Press Release.
Galenzoga, E. (2010). Opportunities and Challenges for Microinsurance in the Philippines. Speech presented at 6th International Microinsurance Conference 2010, Hotel Intercontinental, Manila, Philippines.
Geron, M. P., Llanto, G. M. (2009). Making Insurance Markets Work for the Poor: Microinsurance Policy, Regulation, and Supervision – Philippines Case Study. Bill and Melinda Gates Foundation, Canadian International Development Research Centre, FinMark Trust, The Deutsche Gesellschaft für Technische Zusammenarbeit (GTZ) GmbH.
GlobalAgRisk Inc. (2011). Pre-feasibility: Earthquake risk and index-based insurance for Indonesia.
Haryono, I. and Fauzie, A.W. (20 May 2011). Leapfrog enters microinsurance market in Indonesia. Indonesia Finance Today. Retrieved from http://en.indonesiafinancetoday.com/read/5612/Leapfrog-Enters-Micro-Insurance-in-Indonesia
Insurance solutions to protect the low-income population against the effects of natural catastrophes: A strategic alliance. Eschborn, Germany: The Deutsche Gesellschaft für Internationale Zusammenarbeit (GIZ) GmbH.
Kunzemann, T. (27 May 2010). Cyclone Nisha Batters India. Retrieved from http://knowledge.allianz.com/?424/allianz-bajaj-care-cyclone-nisha-microinsurance
Leftley, R. (2010). Helping the Poor Weather Life’s Storms. Speech presented at 6th International Microinsurance Conference 2010, Hotel Intercontinental, Manila, Philippines.
Microinsurance Catastrophe Risk Organization (20 June 2011). “Haiti’s microentrepreneurs receive insurance proceeds after devastating rainfall.” Press release.
Mogato, M. (2010, November 9). India, Indonesia and the Philippines offer the biggest opportunities for the fledging microinsurance industry, which has a potential market of 3 billion people, industry officials
204
said on Tuesday. Reuters. Retrieved from http://in.reuters.com/article/2010/11/09/idINIndia-52774220101109
McCord, M. J., Ramm, G., & McGuinness, E. (2006). Microinsurance Demand & Market Prospects – Indonesia. Allianz AG, The Deutsche Gesellschaft für Technische Zusammenarbeit (GTZ) GmbH & United Nations Development Programme (UNDP).
Munich Re Singapore Microinsurance Team (2011). Nat-Cat Protection Philippines. Speech.
Portula, D. (2011). Philippines Model of Microinsurance Inclusion: Process and Success Factors of Public-Private Collaboration. Speech presented at 5th Asian Conference on Microinsurance, Le Meridien Jakarta, Indonesia.
Simanjuntak, K. (2011). Earthquake Microinsurance for Indonesia. Speech. General Insurance Assocation of Indonesia.
Swiss Reinsurance Co., Ltd. Economic Research and Consulting. (2010). Microinsurance for 4 billion people. Sigma study no. 6.

205
Appendix 7. Catastrophe Microinsurance – The Need
and the Challenge, Finding Solutions
Robert LK Tiong, Associate Professor NTU
Pane Stojanovski, Adjunct Professor NTU, and Executive Director of Asia Risk Centre, Pte. Ltd.
Shao Zhe – PhD Candidate, NTU
Leny Maryouri – Researcher, NTU
This paper reflects the authors’ views and experiences on catastrophe
microinsurance. It served as an input for discussion on the topic at a Disaster Risk
Financing and Insurance Forum held with ASEAN Member States in Jakarta,
Indonesia in November 2011.
Microinsurance refers to insurance characterized by low premium and low caps or low coverage limits,
sold as part of atypical risk-pooling and marketing arrangements, and designed to service low-income
people and businesses not served by conventional social or commercial insurance schemes.
Microinsurance is intended to protect low-income individuals against specific perils in exchange for
regular premium payments proportionate to the likelihood and cost of the risk involved. It needs to link
multiple small units into larger structures, creating networks that enhance both insurance functions
(through broader risk pools) and support structures for improved governance (i.e. training, data banks,
research facilities, access to reinsurance etc.).
Similar to regular insurance, microinsurance may be offered for a wide variety of risks. These include
both health risks (illness, injury, or death) and property risks (damage or loss). A wide variety of
microinsurance attempts exist to address these risks, including crop insurance, livestock/cattle
insurance, insurance for theft or fire, health insurance, term life insurance, death insurance, disability
insurance, insurance for natural disasters, etc. Historically, one of the greatest challenges for
microinsurance has been the actual delivery to clients, for both access to premium and payment of loss
claims. Methods and models for doing so vary depending on the region, country, organization,
institution, and providers involved.
Microinsurance for natural disasters, i.e., catastrophe microinsurance, is much less available due to the
lack of models necessary to quantify and transfer risk, but also due to the lack of established eco-
systems connecting the various players, which is the case with conventional (indemnity based)
insurance. Other challenges are related to minimizing distribution and claims settlement costs (as
compared to conventional insurance) and premium affordability issues. It has increasingly become clear
that catalysts are needed to connect all the stake holders: those at the Bottom of the Pyramid (BoP),
governments, insurers/reinsurers, Brokers and financial markets. Catalysts’ role is to develop solutions
and help the stake holders implement them starting with a fundamental assumption that solutions for
mitigating risks for those at the BOP must be based on a solid business proposition and not based on
philanthropy or Corporate Social responsibility (CSR) concepts. “Solving the problem and challenge at
206
hand” is an imperative for the stake holders and everybody involved needs to benefit from
implementing the developed solutions.
Building viable and sustainable capacity for catastrophe microinsurance should be a major priority for
the ASEAN Member States. Microinsurance and catastrophe microinsurance could be a useful tool in
economic development. As many low-income people do not have access to adequate risk-management
tools, they are vulnerable to fall back into poverty in times of hardship, for example when the
breadwinner of the family dies, or when high hospital bills force families to take out loans against high
interest rates. Furthermore, microinsurance makes it possible for people to take more risks and to “get
back on their feet” with cash in hand after a disaster strikes. Microinsurance does not stand on its own,
rather it should fit within the framework of risk retention, risk pooling, commercial insurance /
reinsurance transfers, and government stop loss protections.
Life challenges of the poor populations require providing comprehensive microinsurance risk transfer
solutions. The reality is that catastrophe risk awareness of these populations is very low, and for a good
reason. Risks they face and are most concerned about include life and health and the breadwinner’s
ability to earn the living for the family. These risks have much higher frequency than the tail
catastrophic risks, as well as high consequences. When a farmer gets sick and cannot work, say during
the growing season, without health microinsurance the consequences may be very severe – hunger and
insufficient nutrition, family disruptions and efforts to find alternate sources of support during this crisis,
possibly the family being pushed into deeper poverty and losing the land. Similar situation occurs with
the urban poor, as well. Tail catastrophic risks only exacerbate this situation and could be the difference
between remaining into poverty or start escaping from it. Therefore, catastrophic risk transfer through
microinsurance needs to be embedded into comprehensive multi-peril risk transfer solutions.
ASEAN Member States are facing challenges with regards to the region’s rapid development over the
last twenty years, particularly its population growth, growing wealth disparity and rapid urbanization
which is leaving behind underserved and disadvantaged populations, including the agrarian ones. A
recent study by research and advisory firm Stratbase Research Institute (Abigail L. Ho, 2011) noted that
that Philippines registered a Gini coefficient of 44 percent last year, Thailand 42.5 percent, Indonesia
39.4 percent, Malaysia 37.9 percent and Viet Nam 37.8 percent. Gini coefficient is a measure of the
inequality of a distribution, a value of 0 expressing total equality and a value of 100% maximal
inequality. It is commonly used as a measure of inequality of income or wealth. These statics point out
to an income distribution issue, and in that sense they point out to the need for cat risk sustainable
protection of the poor, with bearing on the sovereign risk as well.
Governments recognize that catastrophic incidents (e.g. earthquakes, typhoons) and cyclical events
(droughts) jeopardize the economic development and security of their populations as well as place
severe strains on governmental finances. The speed of urbanization, the effort by governments to
reduce risks for rural and poor populations and governments’ need to manage their budgets in a more
comprehensive manner create a foundation for demand for microinsurance solutions. Balancing
continued economic development while continuing to fight poverty is an important challenge, one that
will likely occupy the region’s public sector over the long run. Focus on the rural and urban poor – the

207
BoP – has emerged as a key to breaking the cycle of poverty and ensuring the region’s continued
economic development as well as reducing sovereign risk in the region. This is a challenge not only for
the region, but also a global one. (Distribution of the world’s population according to the economic
pyramid is illustrated in Fig 1 below.)
Fig 1 The Economic Pyramid
Source: Agricultural Insurance: Contribution to Stable Food Production and Supply
.

208
We will conclude this section with quick review of the challenges and requirements for successful
catastrophe microinsurance programs:
• Programs need to demonstrate clear / recognized contribution to solution of the fundamental poverty problem, otherwise they have no real value
• High program participation is necessary to achieve critical mass of the programs in terms volume and risk diversification. Governments could play significant role in achieving this.
• Minimal operational costs and loss settlement costs, as well as quick disbursement of payments are necessary for commercial viability of catastrophe microinsurance solutions.
• Premiums must be affordable to the poor population, but also must reflect the true cost of the risk. The gap should be bridged by appropriate government subsidies.
• Engaged catalysts are needed to connect various stake holders and drive towards sustainable solutions. Part of their mission is to enhance the risk awareness and educate some stake holders about insurance solutions for catastrophe risk transfer and financing.
• Multi-peril coverage(s) and comprehensive covers greatly enhance the chances of catastrophe microinsurance programs.
• Use of robust catastrophe models and transparent risk metrics per insurance industry standards are necessary for programs design and transparent risk transfer.
• Regulatory and legal environment is necessary for proper governance of the cat microinsurance programs

209
MICROINSURANCE EXPERIENCES IN THE ASEAN MEMBER STATES
This section provides an overview of the microinsurance experience in the ASEAN Member States. The limited time for preparation of this background paper did not allow for a comprehensive reference search, as well as interviews with various stake holders in the ASEAN Member States. Our research resulted in several examples of microinsurance schemes or pilots mostly in the Philippines, Indonesia, Cambodia and Viet Nam. .
Demand for catastrophe risk protection is low on the priority list of the poor. A lot of research has gone
into this, and we will only point to a more recent summary (Lloyd’s 360, 2009). Risks causing highest
concern to low income people (Table 1 below - Churchill C., 2006) health (hospitalization costs),
followed by death of the breadwinner. In rural areas, losses of crops and livestock, as well as price
fluctuations are considered to be important risks.
Table 1 Priority risks for low income people in selected countries
Country Priority risk
Philippines Death, old age, illness
Viet Nam Illness, natural disaster, accidents, illness/death of livestock
Indonesia Illness, children’s education, poor harvest
Lao PDR Illness, livestock disease, death
It can be inferred that “on-the-ground” demand for property insurance due to catastrophic events
(disasters) is lower than for health and life insurance though catastrophic losses to property and
agriculture are becoming more visible, and are attributed in many instances to the impact of climate
change (Lloyd’s 360, 2009). Thus, without proper bigger picture approach, it is difficult to provide
insurance to cover earthquake, flood or other types of natural hazards for the low income markets. On
the other hand, low income communities are often located in areas with higher exposure to natural
hazards. Demand for agricultural insurance (crop and livestock) is very strong in most rural areas.
However, the costs and risks associated with small farmer cover can be major, especially if payouts are
managed on an indemnity basis. Index insurance appears as a more efficient and sustainable approach
in the agricultural sector and catastrophic risks such as floods, earthquakes, typhoons, etc. However, it
brings the issue of basis risk (trigger activation when there is no loss and vice versa). Basis risk cannot be
eliminated, but could be significantly reduced over given geographic area with availability of sufficient
data (resolution and coverage), application of the best suited risk modeling technologies, and
development of risk transfer products that take into account risk variability within the area and quantify
the risk and associated uncertainties. The challenge is bigger in many developing countries due to
inadequate or incomplete data, as well as relative lack of catastrophe risk models since most risk
modeling efforts has followed the needs of the traditional and mature markets insurance markets. In
many ways, agricultural insurance could be equated with microinsurance, which we will not elaborate
further since the topic of agricultural insurance is addressed elsewhere in the paper. A comprehensive
summary o the issue could be found in (Boissonnade, et al 2011)

210
Defining the market size for catastrophe (disaster) microinsurance is not a straightforward exercise. The simplest way would be to assess the number of people at the bottom of the economic pyramid in the region and in each country separately who would benefit from catastrophe risk transfer through microinsurance. There are two issues with this definition that are critical to activating these markets on viable and sustainable principles. The first one is that the targeted beneficiaries do not show interest for protection against catastrophe risk – their everyday risks are way far more frequent than the frequency of catastrophe risk. In turn this creates a situation of a “market” without organically driven demands, which in our opinion would render the marketing campaigns to penetrate these markets unsuccessful on their own. The second one is that although the numbers are substantial, in order risk transfer solutions to be viable and sustainable, there is a need of risk aggregation so that the costs of the programs could reflect the true price of the risk , as well as conform to the affordability constraints to make the catastrophe risk microinsurance solutions effective and sustainable. In absence of solutions to these challenges, sustainability of the programs and schemes will be at least doubtful.
In the following section we will look at the market size by correlating it to the number of people living in
poverty in the studied region, while keeping in mind the reservations expressed in the previous
paragraph. Based on the World Bank statistics, around 4 billion people are living under $4/day (in 2005
international dollars based on purchasing power parity basis), of which 2.6 billion people (40% of the
world’s population) live on $2 or less per day (Swiss Re, 2010b). Rural areas account for three in every
four people living on less than $1 a day. GDP growth originating in agricultural sector is at least twice as
effective in reducing poverty as GDP growth originated outside agriculture (Swiss Re, 2010b). Fig 2
below provides a poverty population distribution in the Asian countries, as well as several ASEAN
nations.
Fig 2 Asian population living in poverty

211
Source: UNDP Human Development Report (2009)
There is also a view that micro insurance will pave the way for huge potential growth in insurance over
the next decade (Lloyd’s 360, 2009). Estimating the time it will take to grow microinsurance markets
eventually merging into more conventional insurance links the economic development and poverty
reduction. Government spending on activation of microinsurance needs to be balanced with other
governments and society priorities, as well as part of a synchronized action, including market
development and commercial risk transfer and diversification.
Table 2 (John Tan, 2010) illustrates the above considerations, as compiled from several sources.
Table 2 Lifespan of microinsurance
Population base
(million)
Population living
in poverty (%)
GDP per capita
(US$)
Lifespan of
microinsurance
(year-range)
a b a c
Malaysia 26.6 7.8 7,033 15-20
Thailand 67.0 11.5 3,844 20-25
Indonesia 224.7 53.4 1,918 30-35
Philippines 88.7 45.0 1,639 30-35
Viet Nam 86.1 48.4 806 30-35
Laos 6.1 76.8 701 -
Cambodia 14.3 68.2 578 -
a) Data refer to 2007 figures;
b) Poverty defined as living below $2 a day. Data refer to most recent year available during 2000 to
2007;
c) Lifespan of microinsurance before transition to commercial insurance is based on estimated time
period to achieve minimal poverty level of less than 2% of population.
Sources: Column 1, 2 & 3: UNDP Human Development Report 2009; column 4: International
Monetary Fund, World Economic Outlook Database, Oct 2009, & ACR estimates & Delphi Analysis.
Brief examination of the table above shows that relatively wealthier countries have better chances of
success. It also shows that poorer countries need financial support from various sources to be able to
support viable and sustainable catastrophe risk transfer programs (including cat microinsurance) for
their populations that are economically sustainable.
Potential microinsurance market size could also be depicted in the following figure, which contains data
for 3 ASEAN Member States (Philippines, Indonesia, and Viet Nam) (John Tan, 2010)

212
Fig 3 Estimated microinsurance potential market size of selected ASEAN Member States
Source: UNDP Human Development Report 2009; ADB Development Report & ACR estimates.
PHILIPPINES
The Philippines has experienced fastest growth of microinsurance, particularly in weather based index
agro insurance and disaster microinsurance. A good reason for this is the fact that Philippines is one of
the most exposed and vulnerable countries to typhoon, flood and earthquake.
According to the Philippines insurance regulators, the growth of microinsurance will increase country’s
insurance penetration to as much as 20% by the end of 2011 (ARTEMIS, 2011), with a large contribution
from the fast growth of weather based index microinsurance and disaster microinsurance. Insurance
penetration of 20% may not sound big compared to the insurance penetration in the western developed
economies (exceeding 60%). However, compared to the insurance penetration between 2002 and 2006
of slightly higher than 1% (Gilberto M. Llanto, et al, 2008), this is extraordinary increase.
a. Microinsurance Regulatory System and Disaster Risk Financing
In 2006, the Insurance Commission officially declared the month of January of every year as “Micro-
insurance Month” to promote the micro-insurance in the Country. Furthermore, the Commission
issued a circular (Circular 9-2006) that paved the way for designing both life and non-life insurance for
the low income population based on:
Definition of microinsurance to guide the market players; It clearly defines what microinsurance is and in line with the general provisions of the Insurance Code, at the mean time well delineates the products apart from commercial insurance products
Setting the maximum insurance premiums at an amount not to exceed an affordable amount deemed affordable (US$0.85 daily or $5.95 per week);
Requiring that contract provisions be simple and easy to understand;
Reducing the capital requirement for “microinsurance MBAs” from US $3 million to US$ 122 thousand. The “microinsurance MBAs” being defined as those who only provide microinsurance policies and at least have 5,000 member-clients.

213
Regulation of microinsurance space is important in order to facilitate the growth, as well as to achieve
appropriate governance of the participants. Setting maximum rates from the affordability point of view
is important. Premiums set this way may not reflect the true cost of the risk, and in this case such risks
may not be accepted in the insurance markets (reinsurance in particular), unless the insurance product
is developed in such a way to cover as much risk as possible with the pre-defined rate. The challenge is
to design a product that still provides viable protection against catastrophe risk under the rate
constraints. Requirements for simplicity of the products are “right on the money”. .
National Strategy and Regulatory Framework for Microinsurance was launched in January 2010. This
document summarized Government’s policy in providing access to insurance to the low-income
population. Despite the positive effects of the initiatives, some regulatory issues remain to be
addressed, such as: a) Regulatory ambiguity; b) Absence of implementing rules and regulations for
cooperative insurance societies; c) Inability of rural banks to sell insurance products within bank
premises (Gilberto M. Llanto, et al, 2008).
In parallel with strengthening of the legal framework of microinsurance in the country, country’s
disaster risk financing system has also been developed. Sovereign disaster risk financing is addressed
elsewhere in the paper, however it is worth mentioning that effective micro insurance disaster risk
solutions contribute to reduction of the sovereign risk.
b. Microinsurance Market in the Philippines
The majority of the insurance products are offered for middle- and high-income classes which exclude
the low-income population due to the characteristics and constraints of the commercial insurance
products – high distribution costs, and high and unaffordable premiums for the poor. However, the
government has been trying to enable sustainable microinsurance policies, as well as to create a
favorable regulatory environment to spur the interests of the private sectors in providing the financial
solutions to the poor. Obviously, this goal would not be achieved if the solutions are not viable and
sustainable commercially.
A market survey among 527 families in June 2002 by RIMANSI Organization of the Philippines, Inc.
RIMANSI) indicated that 54% of the families were covered by insurance with 39% having on-going
policies. The survey also observed that 73% of the respondents showed interests in the microinsurance
products of CARD-MBA (Agriculture and Rural Development Mutual Benefit Association) which offers
life and disability insurance, as well as an obligatory provident fund to CARD Inc. and CARD Bank clients.
There exists a huge gap between the actual coverage and the potential demand which means the local
level or communities have not yet been reached by the formal insurance market. Microinsurance is
provided by both formal and informal providers (Gilberto M. Llanto, et al, 2008). Formal providers are
those who are registered under the Insurance Commission and have necessary licenses to run the
business. The informal ones, on the contrary, are not regulated by the Commission and do not have any
license to sell their insurance policies. This creates challenges in the market, particularly related to the
business practices and proper risk control and capital allocation by the insurance providers. The role of
the informal providers will be discussed in the section after the formal providers.

214
Formal Providers
There are three types of formal providers as described below:
Commercial insurance companies These companies are registered with the Securities and Exchange Commission (SEC) under the
Cooperative Code and regulated by the Insurance Commission. There are 37 life insurance
companies and 94 non-life insurance companies in the country in 2008. Some of the companies set
up partnerships with microfinance institutes (MFIs) to provide microinsurance in the Philippines.
Mutual Benefit Associations (MBAs) MBAs are entities organized with the purposes of 1) paying sickness benefits to its member; 2)
providing financial support to its unemployed members and 3) paying the deceased members’
relatives a pre-agreed sum of money. In 2008 there were 18 licensed MBAs in which six were
recognized as microinsurance MBAs.
Cooperative insurance providers Registered under the Cooperative Code (Republic Act 6938), the cooperatives are allowed to
operate Cooperative Insurance Societies. The insurance from this approach may cover the
insurance requirement for the cooperative members including their properties. In 2008 there are
two cooperatives providing insurance services to their members.\
Informal Providers
Microinsurance products could also be provided through mutual fund schemes. These types of schemes
are offered by the MFIs, NGOs and cooperatives. Under a typical scheme, the member contributes a
pre-determined amount of funds on a regular basis and will get a guaranteed amount of benefits when
events occurred. According to Cooperative Development Authority, there are at least 70,000 registered
cooperatives in the country and 22,000 of which are operating. Approximately half of the operating
cooperatives offer informal insurance schemes. Other than the cooperatives, according to RIMANSI,
some MFIs and small transport associations provide informal products to cater the specific demand of
their clients. However, due to the informality, there is no a complete database of the informal providers
and their operations.
c. Examples of Ongoing & Past Insurance Programs For Low-Income Population
In this section we provide brief overviews of few current and past programs, as well as comment on
their features and express our views.
As an example of a recent catastrophe microinsurance program in the Philippines we will provide a brief
overview CLIMBS catastrophe policy (CLIMBS Catastrophe Protection Policy (Munich Re, 2011)

215
The product was designed by Munich Re and Deutsche Gesellschaft für Internationale Zusammenarbeit
(GIZ). In this project the umbrella organization CLIMBS has become the third partner and acts as a
primary insurer for the local cooperatives and offers them portfolio protection. This is an example of
indirect microinsurance program, where protection is provided to an organization which is serving the
poor and indirectly the poor should benefit from the program, as well. CLIMBS unites over 1,600
cooperatives nationwide, which means a potential portfolio of over 900,000 members. The program
itself is an ongoing project aimed at minimizing the operational and claims settlement costs of the
cooperatives, providing quick payouts, minimizing moral hazard, and affordable premiums to their low-
income members with fast and liquidity pay-out. It follows the trends of index based triggers
applications in microinsurance that have been successful in other environments, primarily due to
avoidance of indemnity related administration costs. The program addresses a subset of the population
at risk (credit default risk of a loan portfolio), i.e. only the population that has taken a loan with the
finance institution.
The program guards against credit default risk, by a guarantee for the liquidity of the loan portfolio of
the cooperatives in case of disasters. Payouts are triggered by recorded wind speed and rainfall
measurements (e.g. caused by typhoons). The microinsurance product would provide quick payout via
CLIMBS since no loss assessment is necessary and payouts are triggered by occurrence of qualified
events and parametric triggers. The cooperatives receive 5 percent, 10 percent, or 20 percent of their
loan portfolio if a parametric trigger for rainfall or wind speed is reached as shown in Fig 4. Such trigger
or index is categorized into a 10-, 15- or 20-year recurrence events corresponding to the three layers of
payout. The trigger levels vary for each municipality determined by the area’s exposure to typhoons and
its corresponding category class. By a binding statement and principle guidelines, the cooperatives
commit themselves to passing on the benefits to those members most affected by the catastrophic
event. The insurance payout would be used by the cooperative members to, for example, rebuild their
dwellings or replace the livestock or other assets.
There are a number of current and past crop insurance programs in the Philippines, which are structured
as micro insurance programs. Since this topic is covered elsewhere in the paper it is not addressed
further in this section.
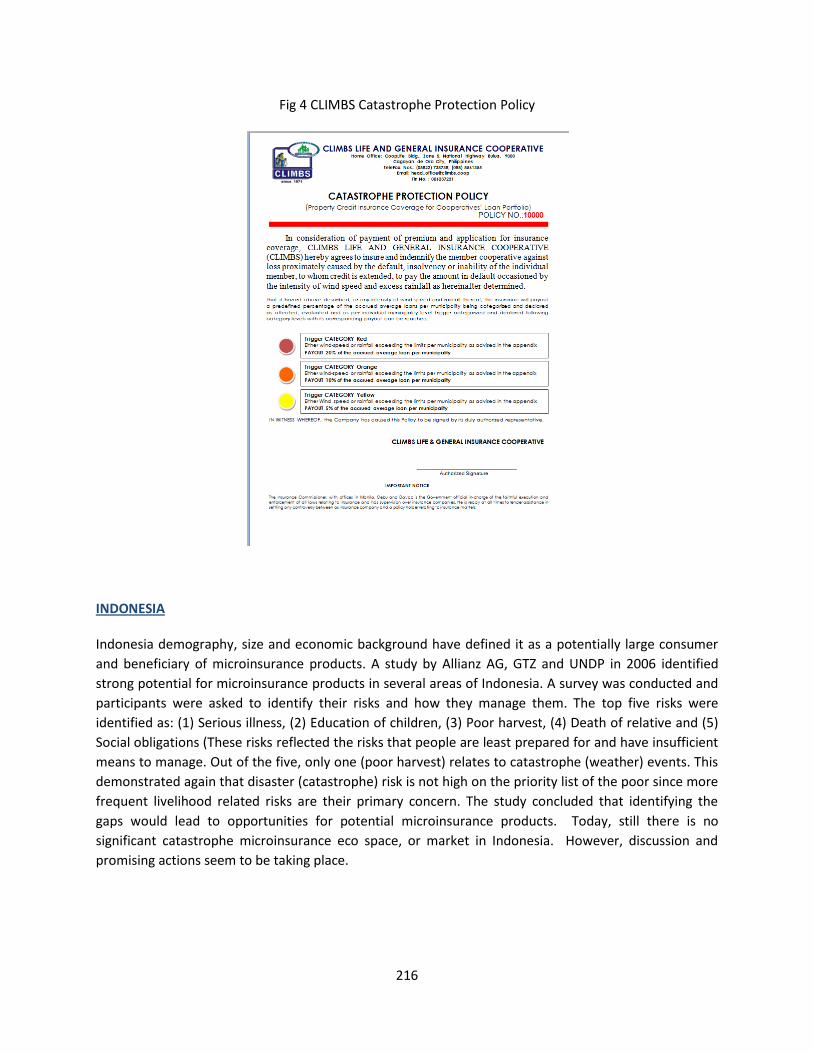
216
Fig 4 CLIMBS Catastrophe Protection Policy
INDONESIA
Indonesia demography, size and economic background have defined it as a potentially large consumer
and beneficiary of microinsurance products. A study by Allianz AG, GTZ and UNDP in 2006 identified
strong potential for microinsurance products in several areas of Indonesia. A survey was conducted and
participants were asked to identify their risks and how they manage them. The top five risks were
identified as: (1) Serious illness, (2) Education of children, (3) Poor harvest, (4) Death of relative and (5)
Social obligations (These risks reflected the risks that people are least prepared for and have insufficient
means to manage. Out of the five, only one (poor harvest) relates to catastrophe (weather) events. This
demonstrated again that disaster (catastrophe) risk is not high on the priority list of the poor since more
frequent livelihood related risks are their primary concern. The study concluded that identifying the
gaps would lead to opportunities for potential microinsurance products. Today, still there is no
significant catastrophe microinsurance eco space, or market in Indonesia. However, discussion and
promising actions seem to be taking place.

217
a. Legislative and regulatory background
The insurance industry is governed from within the Office of the Directorate General of Financial
Institutions in the Ministry of Finance (Allianz AG, GTZ and UNDP, 2006). Directorate of Insurance is
under the Directorate General that also covers pension funds, banks and other financial institutions and
other directorates (Isa Rachmatarwarta, Directorate of Pension Funds “Supervisory Structure of Pension
Funds in Indonesia”, Ministry of Finance of Indonesia, 2003)
No relevant microinsurance law is on the books in Indonesia, and laws commonly seen in other
countries such as Philippines that might facilitate microinsurance are absent, such as a Mutual Benefit
Associations Law. The one major insurer that is member-owned, Bumiputera, is governed under the
traditional insurance law. There is discussion of revising current insurance law, but it appears that
microinsurance is not a part of those discussions. This is primarily because microinsurance has been
treated under the current insurance statutes, and is not seen as significantly different from traditional
insurance.
However, the Directorate of Insurance supported insurers moving down-market (Allianz AG, GTZ and
UNDP, 2006). Their efforts encouraged the pension funds and others to develop business in the low-end
market. Thus far, microinsurance initiatives have either been conducted under the framework of the
existing law (AIG/Lippo, Bumiputera), or without legislation, yet with the full knowledge and often the
participation of local governments.
b. Catastrophe Risk Protection Schemes in Design
The complex regulatory and legislative environment in Indonesia has not produced a successful
catastrophe (disaster) microinsurance program yet. The 2009 pilot program by Munich Re and GTZ
based on an index product for flood insurance of Jakarta resulted in a small number of polices sold
(Jason H. et al, 2011). Lack of demand was attributed to inadequate understanding of the targeted
population related to the value of paying a small premium for a payout that is triggered only by low
frequency, and high consequences extreme flood events. However, the importance of this pilot is that it
provides valuable insights for the future programs.
National Disaster Insurance Scheme in preparation by MAIPARK (PT Asurancy MAIPARK) designed to
provide protection to homeowners against disasters, follows some trends which are typical to
microinsurance. More details could b found in (Kornelius 2011): We comment on this program since its
attributes are similar to microinsurance solutions:
Risk aggregation ( central / local governments are insured) to provide larger program penetration
Comprehensive coverage (perils covered include earthquake, volcanic eruption, tsunami, and fire following earthquake)
Faster claims settlement through a two phase approach using technology (satellite imagery) in the first phase, and fast field loss assessment.

218
Using existing distribution channels (through government agencies)
On the catastrophe microinsurance front, MAIPARK is preparing a new earthquake microinsurance
product - KARTU GEMPA. The product is index based and provides cover up to IDR 2.000.000 (USD 225)
cash payment to the policy holders whenever an earthquake occurs and falls within pre-determined
parameters (shake map, magnitude, distance, depth). The program is still under research and is
envisioned to be distributed through vouchers. Retail price for a voucher of KARTU GEMPA is under
research and is expected to be +/- IDR 100.000 (USD 11). A homeowner would be allowed to have
maximum five unites of KARTU GEMPA. Policy coverage will be for one year period. The program
design has given great deal of consideration to the distribution channels and minimization of the
program costs by a variety of retail outlets, such as: all general insurance companies, insurance agencies
and brokers, mini markets, building material stores, home appliance stores, property agencies, banks,
local government, etc. The program design also takes into consideration experiences with technology
use to minimize the program costs. The distribution process is envisioned to work as follows:
• Homeowner buys KARTU GEMPA at retail outlets
• Using telephone or SMS (Sort Message Service) he homeowner registers and activates the cover
(providing : name, ID card number, risk address, PIN number)
• After registration process is complete the homeowner will receive confirmation through phone
call and/or SMS
• Home owner keep the voucher card of KARTU GEMPA
Cash payment will be paid if a qualifying earthquake occurs based on the triggering parameter (using
official report from USGS and/or BMKG – Meteorological, Climatological and Geophysical Agency of
Indonesia). Homeowner will notify the insurance company through a phone call and/or SMS, or
alternatively the insurance company will inform homeowner when claim is payable due to an
earthquake. Payments will be made within 2 weeks after the disaster.
OTHER COUNTRIES
Microinsurance in Cambodia
Cambodia’s recent history of civil unrest has left the country one of the poorest countries in the Asia-
Pacific region, recording more than 30 percent of its 14 million citizens living below the poverty line
(Jaime A.B. Alip, et al, 2009). Cambodia’s financial sector is relatively underdeveloped, lacking a
comprehensive network of banks and bounded by weak rural finance linkage.
The Gross Premiums of general insurance business decreased by 3.18 % to USD 20.01 million which
represented 0.19% of Cambodia Gross Domestic Product (GDP) (In Meatra, 2010). For 6 months of 2010,
the gross premium of the whole market increased by 35% to USD 11.43 million over the previous year
(2008: USD 8.5 million). The main reason of the drop of the gross premium is the global financial crisis
which resulted in delay and cancellation of several large construction projects.

219
MFIs are recognized as one of the leading providers of formal financial services to Cambodia’s poor
including microinsurance. Again, the pilot or/and priority is given to health microinsurance. In 2009,
three licensed MFIs have started microinsurance scheme (Jaime A.B. Alip, et al, 2009). In order to
attract more interests from Cambodia-based MFIs, the Government has issued a regulatory framework
for microinsurance to address the need for a broadened, competitive but practically sound financial
system, the Royal Government of Cambodia (RGC) has formulated the Financial Sector Development
Plan (FSDP) for 2001-2010 and the Financial Sector Development Strategy (FSDS) 2006-2015, a long-
term strategy intended to develop Cambodia’s financial sector. In 2010, regulations to cover large
micro-insurance initiatives in Cambodia have been drafted by the Ministry of Economy and Finance
(MEF), providing a potential boost for the nascent insurance industry. This regulation planned to be
launched as soon as August 2011. At this time we do not have information related to launching of this
initiative. The capital requirement to operate a microinsurance business was US$ 200,000, though it is
not yet finalized (PhnomPehn Post, 2011).Still, there are some issues which affect the progress of
microinsurance in the country:
1) Lack of regulatory framework. Despite the existence of insurance law in Cambodia, the general
framework of the insurance regulatory system is yet to be developed;
2) Limited capacity to supervise and regulate microinsurance;
3) Options for MFIs interested in microinsurance.
The Cambodia government recognized that the social health insurance is the priority risks. Thus, the
health microinsurance program SKY has been implemented in 1998 and managed by a French NGO
Groupe de Recherche et d'Echanges Technologiques (GRET) (Churchill C. 2006). Two Cambodia
provinces have been selected as pilot experiment. Up to 2008, the scheme had 15,500 members and the
margin is 31% of the actual premium (ILO, 2008). However, it is still not sufficient to sustain the program
alone due to the high administration costs and the scheme is partially subsidized by GTZ (German
Technical Cooperation) and AFD (French Agency for Development).
The success of the health microinsurance implies the fast speed growth and large potential of
microinsurance in the country though the achievement of effectiveness among the stakeholders,
policyholders and insurance companies may take time. Since the microinsurance has worked well for
low-income population, the disaster microinsurance program would be expected in the near future as
well.
Microinsurance in Viet Nam
Viet Nam has more than 84 million people, and roughly 24.1% of its population or 4.6 million
households live below poverty line in 2004 and was reduced to 22% in 2005 (Jaime A.B. Alip, et al,
2009). Indeed, Viet Nam has made considerable progress in reducing poverty in the last decade;
however, there are still around 5-10% of Viet Nam’s population are living close to the poverty line and
are vulnerable to fall back into poverty.
a. Microinsurance Status and Market in Viet Nam

220
As studied by Alip and David C., microinsurance is still fairly new and limited in Viet Nam. Providers of
microinsurance include the mainstream commercial insurance companies and MFIs. The commercial
sectors have increasing interest in channeling insurance product to poor people. However, varied
opinions on “who should provide them with insurance and whether low income households would be
able and willing to purchase commercial insurance” are noted. The majority of MFIs provide their
services following the self-insurance model which is commonly known as mutual assistance funds
(MAFs) which are unlicensed and only offer services to members. Due to the small scale of MFIs, the risk
pool is small and their pricing strategies are unsustainable though affordable by the poor.
Table 3 below presents the classification of insurance products that are presently available for Viet
Nam’s low-income population based on a study by the International Labor Organization (ILO) Office in
Hanoi:
Table 3 Insurance Products Available for the Low-income Groups in Viet Nam
Classification Inclusions
Long-term life insurance
products
Life/savings products, cash cash-value policies, annuities and term-life
products with more than one-year coverage
Shorter-term death benefit
insurance products
Personal accident insurance products which cannot be
offered by a life insurance company in Viet Nam
Health insurance products Supports preventive health and treatment of illnesses
not requiring hospitalization or surgery
Other insurance products Agricultural insurance, and new products being pilot-tested for rural
households
Source: Alip and David-C., 2008
Obviously, catastrophe microinsurance products are yet to be developed.
The regulatory environment could affect the progress of microinsurance. There are two important
landmarks in the legal environment for Viet Nam insurance after economic reforms in 1986. The first is
the governmental decree on insurance introduced in December 1993 and the second legal landmark is
the first Law on Insurance Business (Legislation 24/2000/QH10) passed in 2000. With the strategy for
insurance industry development, it is hoped that a “more professional, more stable, higher quality
supply of insurance services” can be delivered in Viet Nam.
b. Ongoing Disaster Microinsurance Programs in Viet Nam
Viet Nam agriculture microinsurance (Swiss Re, 2010a)
In coping with the high exposure of rice harvest to natural perils such as floods, typhoons and droughts,
Swiss Re introduced an index-based insurance program to cover loans to rice farmers in up to 10
provinces in Viet Nam, with the potential to extend the scheme to the entire country.

221
Under the arrangement, ABIC – the insurance arm of Agribank, Viet Nam’s agriculture bank and key
provider of agriculture loans – will insure Agribank’s rice farming clients against the inability to make
loan repayments due to low yields. ABIC will in turn transfer the risk via reinsurance to Swiss Re and the
Viet Nam National Reinsurance Corporation (Vina Re). Payouts are defined by an independent “area-
yield index” that is based on data from the Viet Nam’s Bureau of Statistics.
222
CONCLUDING REMARKS
ASEAN, region is expected to grow and activation of sustainable and viable microinsurance programs
could be facilitated by the elements listed below.
Substantial Numbers - Number of people in need for disaster micro insurance protection is substantial.
In Malaysia, Thailand, Indonesia, Philippines, Viet Nam, Laos, and Cambodia total population is about
half a billion people, 60% of which lives at or around the poverty line and which needs protection from
natural disasters in its climb out of poverty.
Diverse Risks - A multitude of inter-related forces and risks shape the risk landscape in the region: food
security and agricultural risk, natural catastrophes, resource needs (water, energy), population growth,
urbanization and population migrations, dynamic changes in life expectancy, rapid economic
advancement, dramatic wealth and income disparities, exposure to pandemics, climate change and
geopolitical instability.
Governments - The complexity of demographic, economic and other risks in the region manifest an
environment where government involvement, interest, and oversight (control) of risk and insurance
markets needs to be significant. Historically, the region has suffered the most due to catastrophic
events and has the least developed marketplace mechanism for transferring and managing the risk.
Governments are recognizing this and are looking for ways to mitigate the impacts. Fortunately, the
economic growth and a culture bias of saving could allow some governments to accumulate and
organize resources (intellectual, fiscal and infrastructure) to begin to address and mitigate some of
their key risks, e.g. Philippines.
New policies could create commercial opportunities - Some governments in the region have mandated
requirements for finance / insurance / reinsurance protection for the poorest portions of their
populations, as well as focusing on agricultural risk transfer for the small-scale growers. In support of
these mandates and laws, governments are stimulating the development of the necessary insurance
mechanisms and markets for catastrophic risks. Legislative efforts in Philippines should be mentioned
in this context.
Based on our prior work and research, as well as the limited scope research for this paper, we
summarize our recommendation for catastrophe (disaster) microinsurance development and growth on
sustainable foundations in the region below.
Pilot projects divided between various consultants would not contribute significantly for catastrophe microinsurance activation since they do not address holistically all issues and focus on proof of concept, rather than on a scaled up products. Many pilots around the world have demonstrated the key challenges and obstacles. Instead, capacity building projects awarded to consortia consisting of the key players – catalysts, modelers, government agencies, and risk transfer participants where the success of the projects is measured by capacity development metrics and creation of risk transfer markets are avenue worth exploring in the region. We would bring here the example of International Financial Corporation (IFC) capacity building support in sub-Saharan Africa as a possible approach to building microinsurance capacity in the region. IFC has supported efforts to promote insurance capacity building thorough the Global

223
Index Insurance Facility (GIIF) which is aimed at insurance / reinsurance capacity building through access to index-based insurance for natural disasters and weather risks in some developing countries. The facility is funded through participation of donors into the GIIG Thrust Fund, which is intended to support advisory services and capacity building programs to providing substantial funding to build local partners’ skills and support the regulatory environment, product development, and specific risk transfer projects.
• Government engagement is necessary to provide supportive regulatory and legislative background. The challenge is, if there is too much legislation it is more difficult to develop the markets in an entrepreneurial way given the specific economic, cultural, and political circumstances in each country and the region. If there are too little regulatory provisions, then there is danger that disaster microinsurance activities may not in fact contribute to the benefits of the insured and the civic societies.
• Microinsurance programs must clearly demonstrate the commercial viability and sustainability for all participants in the market – insureds, primaries, reinsurers, and governments. While contributing to mitigation of the poverty problem, catastrophe microinsurance should provide incentives for the involved stakeholders in order to be successful.
• Models to quantify and price risk are necessary, though on their own they are not sufficient. Risk metrics should be developed as per insurance industry standards so that risk transfer across the insurance verticals is transparent and necessary diversification achieved.
• Microinsurance programs must provide comprehensive multi-peril catastrophe coverage specific for each country. For example, a program providing earthquake cover for earthquake and not for typhoon would be of limited value in the Philippines. Along the same token, it would be advisable if (subsidized) disaster covers are bundled with programs addressing risks of higher importance to the poor (i.e. life and health risks).
• Governments are the “payers” – they should provide subsidies to premiums (for affordability) that reflect the cost of risks, and should not subsidize the losses. This lesson has been learned, but it would not hurt to repeat it in this context.
• Minimal operational and loss settlement costs are a must. Non-indemnity, parametric trigger solutions, use of technology, on the ground distribution channels, risk aggregators (gov. NGO’s etc), in any and all combinations will facilitate implementation of viable and sustainable catastrophe risk microinsurance programs.
As discussed above, governments’ active and engaged participation is necessary. Not tending to the risk
protection needs of the poor populations is not an option – it dramatically increases the social instability
and sovereign risk in the nation and / or in the region. Timely action of the governments aimed at
providing catastrophe risk protection to the economic BoP populations reduces the likelihoods of the
poor being “trapped in poverty” after the disasters, provides protection to farmers and their
sustainability to get out of poverty, and in general has positive economic impacts.

224
Earthquakes and other natural catastrophes have the potential to suddenly create unforeseen
(unplanned) budget demands necessary to deal with their consequences (beyond the immediate
response and relief measures). Government interest is to minimize such unexpected hits, which in some
cases could be very high. To illustrate the options a government might have, we present a summarized
conceptual discussion based on (Stojanovski et al. 2010). In this case (originally developed for rural
China), there is an earthquake microinsurance program that requires certain high level of participation,
and which requires certain amount of premium in aggregate. How could such a program be measured
against the reduction of unexpected budget demands in case of natural disasters? Let’s first look at the
following three options:
Option 1: Do Nothing; Government costs (unexpected budget demands) are defined as the
payouts for the proposed program without any risk transfer. The entire risk is retained b the
government.
Option 2: Self Insurance; Government sets aside every year an amount equal to the aggregate
premium required by the program and uses these funds to pay the losses as in Option 1 (for
simplicity, money growth over time has not been considered in this example).
Option 3: Implement the Micro-insurance Program; Money growth over time has not been
considered in this case, as well.
Figure 5 Simulated Unexpected Budget Demands
Based on: (Stojanovski, et al, 2010)
Figure 5 shows the simulated government payments (using a reputable CAT model) for each of
the three options after 10 years of consistent program implantation. The magnitude of the
unexpected budget demand (or surplus) over a range of risk horizons (return periods of 10, 100,
1,000 and 10,000 years) is shown on the horizontal axis, and the vertical axis depicts the
government payments for each of the options. For a risk horizon bellow 100 yr. return period
(exceeding probability 0.01) Option 3 (implementation of micro-insurance program ) exhibits
little or no loss, while Option 1 (do nothing) it is considerable..
For risk horizons (return periods) beyond 100 years, government losses (unexpected budget
demands for Option 3 are one half up to one third of the losses for Option 1. These risk horizons
correspond to the deep tail risks, where losses are very high, and consequently the benefits

225
(savings) form the program is very substantial. In summary, implementation of a well designed
and sustainable disaster micro insurance program almost eliminate unexpected budget demands
for shorter return periods, and significantly reduce needs for additional disaster financing at high
return periods. For different programs, perils and regions the actual numbers will be different,
but the key arguments will supported and quantified by this type of analysis.
Appendix A illustrates this program in greater level of detail.
Appendix B provides a brief description of five catastrophe Microinsurance Round Table Forums that
were held at NTU since 2007.

226
References
1. Abigail L. Ho. (July 2011). Philippines Leads In Income Inequality In ASEAN, Says Study. Online available at: http://business.inquirer.net/8377/philippines-leads-in-income-inequality-in-asean-says-study
2. Allianz AG, GTZ and UNDP. (2006). Microinsurance: Demand and Market Prospects – Indonesia. MicroLiNKS.
3. Boissonnade, A.C., Stojanovski, P., and P. Mehta, “Modeling Approaches to Agricultural Crop Risk Quantification”, 3rd General Insurance Conference, Singapore, June 2-3, 2011 (Prize for Best Paper).
4. Celia M. Reyes and Sonny N. Domingo, (2009). Crop Insurance: Security for Farmers and Agricultural Stakeholders in the Face of Seasonal Climate Variability, Discussion Paper Series No. 2009-12.
5. Churchill, Craig, (2006). Protecting the Poor: A Microinsurance Compendium. ILO, Geneva in association with Munich Re Foundation, Germany.
6. Denisa M. Dumitru, (2009). The Philippines Disaster Risk Financing Strategy Executive Summary.
7. GIZ and Munich Re. (2011). Development Partnership with the Private Sector Insurance Solutions to Protect the Low-Income Population Against The Effects of Natural Catastrophes: A Strategic Alliance.
8. ILO Subregional Office for East Asia. (2008). Cambodia: Sky Health Insurance Scheme
9. Jaime A.B. Alip. and David-Casis, Ma. C., (2008). Microinsurance in Viet Nam
10. Jaime A.B. Alip, Enrique L. N., and Mae M.C., (2009). Status of Microinsurance in Southeast Asia. Asia-Pacific Rural and Agricultural Credit Association (APRACA)
11. Jason H., Ntongi McFadyen, Jerry R.S., (2011). Pre-Feasibility: Earthquake Risk and Index Based Insurance for Indonesia.
12. John Tan. (2010) “Micro-Insurance: Inclusive and Committed”. 4th Micro Insurance Round table Forum, Singapore.
13. Kornelius S., (2011). Earthquake Microinsurance for Indonesia. 5th Micro-insurance Round Table Forum.
14. Llanto, Gilberto M.Geron, Maria P.Almario, Joselito (2008). Developing Principles for the Regulation of Microinsurance (Philippine Case Study). Discussion Paper Series No. 2008-27, Philippine Institute for Development Studies.
15. Lloyd’s 360. (2009). Insurance in Developing Countries: Exploring Opportunities in Microinsurance.

227
16. In Meatra, (2011). Insurance Supervision in Cambodia. Ministry of Economy and Finance, Cambodia.
17. Munich Re. (2011). Nat-cat Protection Philippines.
18. Munich Re Foundation. (2011). “The 6th International Microinsurance Conference 2010 – Making insurance work for the poor”.
19. Pane S., W.M Dong, H. C. Shah, Chris M., Suruchi W., (2010). Catastrophe (Disaster) Microinsurance – Viable and Sustainable Risk Reduction Alternative: the Case of Rural China and Gujarat, India. International Disaster and Risk Conference, Davos 2010.
20. PhnomPehn Post. (2011). Micro-Insurance Rules Nearly Finished. Available online at: http://www.phnompenhpost.com/index.php/2011052049250/Business/micro-insurance-rules-nearly-finished.html
21. Swiss Re. (2010a). Viet Nam's rice farmers to get loss protection if yields fall; Swiss Re and ABIC deliver a first for world's second largest rice exporter. Media Information.
22. Swiss Re. (2010b). Microinsurance - risk protection for 4 billion people. Sigma Report.
23. Teddy Hailamsah. (2011). How the working poor can have access to insurance with only an SMS - A case study of Dengue Fever Insurance in Indonesia. 5th Micro-insurance Round Table.
24. Till Heydel. (2008). Microinsurance Trigger Product Jakarta.

228
APPENDIX A
AN EXAMPLE RELATED TO EARTHQUAKE MICROINSURANCE IN
RURAL CHINA
Double Trigger Earthquake Micro–Insurance Program for Rural China
Viability and Sustainability Study Viability and Sustainability Study
Pane Stojanovski, Weimin Dong, Suruchi Wagh, Chris Mortgat,
Haresh C. Shah Risk Management Solutions, Inc., Newark, CA, U.S.A.
ABSTRACT:
Our hope in developing this pilot project is to boost the activation of catastrophe microinsurance in sustainable and
viable ways, and to contribute to the solution of the fundamental problem of poverty and economic safety for more
than 2 billion poor people worldwide. It is well known fact that the poor suffer the most after natural disasters such
as earthquakes, typhoons, floods, droughts, etc. Catastrophe micro-insurance cannot be a charity; rather it has to be
set on a foundation of affordability, viability and sustainability in order to provide protection to the poor from being
pushed down the poverty spiral after major natural disasters. While catastrophe micro-insurance programs need to
provide multi-peril coverage, this paper only reports on earthquake risk related work in this area carried out by
RMS micro-insurance team. The paper presents the details of a design of a double trigger earthquake micro-
insurance program for rural China, program risk quantification, as well as demonstration of its commercial viability
and sustainability for all involved in the risk transfer – insured, primary insurance, reinsurance and government.
Program viability and sustainability is demonstrated by determining the technical basis for pricing the risk, by
applying customary risk loading and expenses used in the insurance industry, as well as by simulating the
probabilistic cash flow (premium income and loss payouts) for all risk-taking entities.
Keywords: Earthquake Risk, Micro-insurance, Economic Safety for the Poor, BoP, China Earthquake Risk
1. INTRODUCTION
Activation of catastrophe (cat) micro-insurance for protection of those at the BoP is gaining a lot of
momentum from the insurance industry with an emphasis on “tapping into and activating these markets”.
These efforts are often approached as business opportunities (with some exceptions), and they do not look
deeply into the fundamental problem of poverty and how cat microinsurance could contribute to
mitigation of the problem and its exacerbation after natural disasters. A lecture by Haresh Shah at this
conference (“Catastrophe Micro-Insurance for Those at the BoP: Bridging the Last Mile”) elaborates on
how solutions could be found, as well as on some of the efforts of Risk Management Solutions (RMS)
acting as a catalyst to bring about solutions that are affordable, feasible, and viable. This paper addresses
in detail these aspects for the pilot double trigger program for earthquake microinsurance protection for
rural / underdeveloped China.
2. DOUBLE TRIGGER PROGRAM SUMMARY

229
China micro-insurance program was developed as a double trigger mechanism. The purpose of these two
triggers is that a lower trigger, when a moderate size earthquake occurs, a small amount of cash would be
available to those who experienced the event but did not really have catastrophic damage. This way, more
frequent events would provide more frequent cash payout to insured. The higher trigger (bigger
earthquake with severe damage) which would occur infrequently would provide the full amount of the
policy limit. Geographic region for which the program was designed includes about 800 counties in rural
China , as described in more detail in Stojanovski et al (2010). Policy details of the program are as
follows:
The first parametric trigger activates cash payments to insureds in case of a qualifying earthquake
in the county where the epicenter of the event is. The trigger is occurrence of an earthquake with
magnitude between 6.5 and 8 resulting in fixed cash payout to insureds in the amount of 500
RMB, and 1,000 RMB for magnitudes higher than 8. A note of caution – in this study the issue
of aftershocks within the trigger range has not been addressed. However, aftershocks should be
excluded since for larger events their number may activate the trigger excessively and deplete
program’s financial structure. Issues like this need to be addressed in the detailed program design
prior to implementation.
The second non-indemnity trigger applies to all collapsed or red tagged (uninhabitable) insured
houses (irrespective of the earthquake magnitude). It pays a fixed amount of 16,000 RMB and
provides no payments for other levels of damage.
For trigger based programs it is important that the qualifying parameters are verified by reputable
independent entities. In this case, the first trigger could be verified with the coordinates and the
magnitude of the earthquake by a selected scientific agency. The second trigger (collapsed or red tagged
houses) could be verified by the government agency responsible for post event recon. This situation
illustrates the importance of government and regulators’ involvement necessary to minimize moral
hazards of the program.
Since the program is not based on indemnification principles, its operational and loss adjustment expenses
are much smaller than for regular indemnity based programs in developed countries.
We started with an annual premium of 10RMB per house (family), which is well within the affordability
range. Exploring the feasibility of charging 10RMB as the annual premium, the total country wide
premium (assuming 100% participation in the program) would be:
10RMB x (222 million population /4 family members per house) = 550 million RMB
This is quite respectable country wide aggregate premium. The question that we are going to answer
later, is whether this amount of premium could cover the technical cost of underwriting the earthquake
risk, as well as the expenses of risk transfer among all key players participating in this venture. It should
be a win-win situation for all involved (the rural poor for whom micro-insurance product is designed, the
government, the insurance and reinsurance industry, as well as for the civil society).
How could this be verified? First, the risk metrics for the insured risks need to be established by using a
model that is used and accepted by the global risk markets. We used RMS earthquake model for China,
which was developed in collaboration with the Institute of Engineering Mechanics (IEM) in Harbin, the
leading earthquake institute in China, and released in 2007. The model was reviewed and endorsed by
independent academia and industry practitioners, and today is the market leading earthquake model for
China. The model consists of state-of-the-art source models, ground motion models, geotechnical site
hazards, and building vulnerability and inventory models. It has more than 9,000 primary sources, more
than 6,000 background sources, as well as 11 regional inventories, out of which 4 are specifically

230
developed for rural China. This well calibrated model contains approximately 85,000 stochastic events.
It is important to use state-of-the art models since in this case the risk loads applied by the risk markets
participants are lower. Ultimately, the costs of the micro-insurance program will be lower.
Figure A1 shows the ground up Exceeding Probability (EP) curve developed by the model. It shows for
every loss level its probability of being exceeded. The ground up loss at the very tail of the curve is just
above 18 billion RMB, with exceeding probability of 0.01% (equivalent to 10,000 yr. return period). The
overall aggregate risk is customarily divided between risk taking entities: primary insurance at the lower
end, reinsurance in the middle / upper range, and government in the tail range of the probabilistic ground
up losses. Segmentation of the risk profile approximately allocates losses with return period of 100 yr. or
less to primary insurance, losses with approximate return period of 100 to 1,000 year are taken by the
reinsurance layer, and losses with return period higher than 1,000 years, but less than 10,000 years are
taken by the government. The tiny excess loss over the 10,000 yr. return period is allocated back to the
primary insurance layer.
Figure A2 shows an enlarged view of the EP curve and loss allocation to primary, reinsurance, and
government layers. Program layers (in absolute numbers) are defined as follows:
Primary, 2 billion RMB
Reinsurance, 4 billion RMB
Government, 12 billion RMB
Figure 2 also shows the average annual loss (AAL) and its standard deviation, as well as the entering and
exit probabilities for each layer.
Figure A1. Ground Up Exceeding Probability (EP) Curve
Figure A2. Program Structure
0.0001
0.001
0.01
0.1
1
0 2 4 6 8 10 12 14 16 18 20
Ground Up Loss
PR
IMA
RY
REINSURANCE GOVERNMENT
PR
IMA
RY
AAL
(million RMB)
181.0 542.7
St. Deviation
(million RMB)
90%
1.10%
0.11%
0.01%
0
2
4
6
8
10
12
14
16
18
Loss
(R
MB
Bill
ion
)
Probability
4 billion
2 billion
12 billion
PI : AAL = 193 m. = 344 m.
Government
AAL = 4.5 m. = 182 m.
Reinsurance
AAL = 13.9 m. = 187 m.

231
Risk metrics summarized in Figure A1 and Figure A2 provide basis for estimating the overall expenses of
the program, leading to an answer whether the program is viable and sustainable.
Estimation of the expenses, risk loading, and risk transfer fees reflect established practices of the
insurance industry. It is worth noting that in this program government is one of the risk taking entities,
and as such takes its share of the annual premiums that could be used to finance its share of the risk.
After expenses are taken into account, the program shows a surplus of 157 million RMB over the
expenses, assuming a country wide annual premium of 550 million RMB. Details of this exercise are
shown in Figure A3.
The next element of the viability and feasibility estimation is to develop a probabilistic view of the cash
flow (premium income and loss payouts) over a number of years for each program participant, so that the
risk of this program could be compared to the risk profiles of regular insurance programs that program
participants have broad experience with. This exercise is summarized in the next section.
Figure A3. Double Trigger Program Expenses
3. PROBABILISTIC CASH FLOW ESTIMATION FOR PROGRAM PARTICIPANTS
To estimate the probabilistic cash flow for the program participants we carried out 10,000 year
simulations of a 10 yr. program sequence. For each simulated year, we accounted for the premium
income (as per Figure A3), as well as for the losses paid out (as per Figure A2). The number, location
and magnitude of events in any given year were sampled from the RMS stochastic event set for the China
earthquake model (event occurrence was modeled as a Poisson process). Event losses were sampled from
the Beta distributed loss as generated by RMS earthquake model for China. The simulation framework
was set as a low discrepancy Monte Carlo simulation that enabled convergence of the mean and the
standard deviation of the cash flow for each layer of the program (primary, reinsurance, and government).
Losses or gains from the prior years were carried over to the future years.
In case of a negative cash flow, no infusion of external funds was used to balance it. The entire
simulation was executed using simple recursive formulae for each layer. For illustration, formulae (in
pseudo code notation) for the primary layer are shown below.
First Year Balance:
isim = 1, 10,000
Nth Year Balance:
© 2010 Risk Management Solutions, Inc. 18
Layer Expense Amt. (mil. RMB)
PI : Primary Ins. Risk loaded AAL 193 + 0.2*344 262Fixed costs: 2.5% of
collected premium 0.025*550 14
Loss adjustment: 5% of
layer AAL 0.05*193 8
RI : Reinsurance
AAL = 13.9 m.
= 187 m. Brokerage: 25% of
premium 0.25*51.3 13
GOV : Government
AAL = 4.5 m.
= 182 m. Brokerage: 11% of
premium 0.11*40.9 4
All Layers 393
550
157
51
Risk loaded AAL 4.5 + 0.2*182 41
Countrywide Premium (100% participation)
Premium Over Expenses
AAL = 193 m.
= 344 m.
Risk loaded AAL 13.9 + 0.2*187
1RePr)1,( YearhAdjCostAtAnnLossWitinExpenFixExpenemAnnisimPI
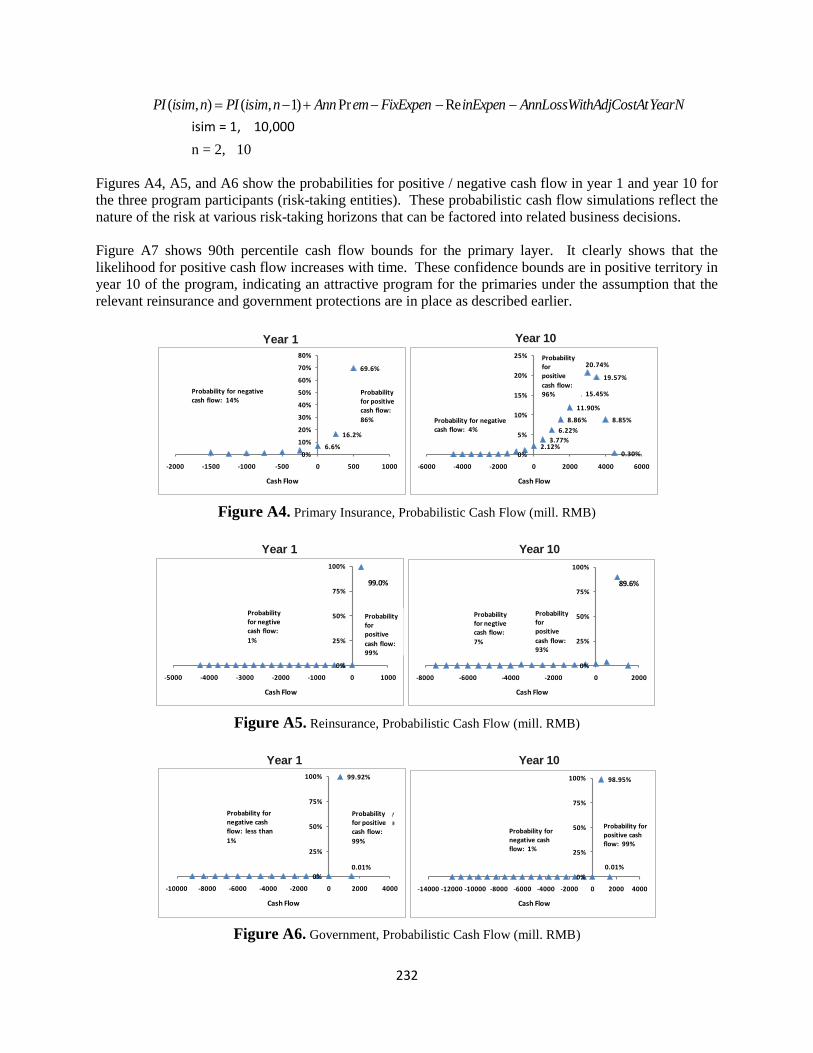
232
isim = 1, 10,000
n = 2, 10
Figures A4, A5, and A6 show the probabilities for positive / negative cash flow in year 1 and year 10 for
the three program participants (risk-taking entities). These probabilistic cash flow simulations reflect the
nature of the risk at various risk-taking horizons that can be factored into related business decisions.
Figure A7 shows 90th percentile cash flow bounds for the primary layer. It clearly shows that the
likelihood for positive cash flow increases with time. These confidence bounds are in positive territory in
year 10 of the program, indicating an attractive program for the primaries under the assumption that the
relevant reinsurance and government protections are in place as described earlier.
Figure A4. Primary Insurance, Probabilistic Cash Flow (mill. RMB)
Figure A5. Reinsurance, Probabilistic Cash Flow (mill. RMB)
Figure A6. Government, Probabilistic Cash Flow (mill. RMB)
Year 1
6.6%
16.2%
69.6%
0%
10%
20%
30%
40%
50%
60%
70%
80%
-2000 -1500 -1000 -500 0 500 1000
Cash Flow
Probability for positive cash flow:
86%
Probability for negative cash flow: 14%
Year 10
2.12%3.77%
6.22%
8.86%
11.90%
15.45%
20.74%
19.57%
8.85%
0.30%0%
5%
10%
15%
20%
25%
-6000 -4000 -2000 0 2000 4000 6000
Cash Flow
Probability for positive
cash flow:96%
Probability for negative cash flow: 4%
Year 1
0%
25%
50%
75%
100%
-5000 -4000 -3000 -2000 -1000 0 1000
Cash Flow
99.0%
Probability for positive
cash flow:99%
Probability for negtive cash flow:
1%
Year 10
0%
25%
50%
75%
100%
-8000 -6000 -4000 -2000 0 2000
Cash Flow
89.6%
Probability for positive
cash flow:93%
Probability for negtive cash flow:
7%
Year 1
99.92%
0.01%
0%
25%
50%
75%
100%
-10000 -8000 -6000 -4000 -2000 0 2000 4000
Cash Flow
Probability for positive cash flow:
86%
Probability for positive cash flow:
99%
Probability for negative cash flow: less than
1%
Year 10
98.95%
0.01%
0%
25%
50%
75%
100%
-14000 -12000 -10000 -8000 -6000 -4000 -2000 0 2000 4000
Cash Flow
Probability for positive cash flow: 99%
Probability for negative cash flow: 1%
YearNhAdjCostAtAnnLossWitinExpenFixExpenemAnnnisimPInisimPI RePr)1,(),(

233
Figure A7. Primary Insurance, Simulated 90th Percentile Bounds Cash Flow
4. DECISION MAKER’S (GOVERNMENT) DILEMMA
Earthquakes and other natural catastrophes have the potential to suddenly create unforeseen (unplanned)
budget demands necessary to deal with their consequences (beyond the immediate response and relief
measures). In the case of China, the 2008 winter storm and the 2009 Wenchuan earthquake showed that
the tail risk in consecutive years could be very high. Even with China’s size and its potential to reallocate
the funds necessary to deal with the consequences of natural disasters, there is little doubt that the
government interest is to minimize such unexpected hits. To quantify this risk three options for the
government have been evaluated using the results of the loss and cash flow simulations, as follows:
Option 1: Do Nothing
Government costs (unexpected budget demands) are defined as the payouts for the proposed
program without any risk transfer.
Option 2: Self Insurance
Government sets aside every year 550 million RMB and uses these funds to pay the losses, as in
Option 1 (money growth over time has not been considered for simplicity).
Option 3: Commercially Viable Micro-insurance Program
Government collects every year the 45 million RMB (its share of the program premium) and sets
these funds aside to pay their share of the losses (the highest excess layer). Money growth over
time has not been considered for simplicity.
Figure 8 shows the probability of exceeding given levels of unexpected budget demands in the 10th year
of the program. The horizontal axis shows exceeding probability (risk horizons) from 0.1 to 0.0001
(return periods 10 yr. to 10,000 years). The vertical axis shows unexpected budget demands (in million
RMB) for each of the three options. For a risk horizon bellow 100 yr. return period Option 3 (micro-
insurance) exhibits little or no loss, while for Option 1 (do nothing) it approaches 10 billion RMB.
Option 2 falls in between the other two options. For risk horizons (return periods) between 100 years and
10,000 years, budget demands for Option 1 approach 35 billion RMB, while for Option 3, they are
capped between 10 and 15 billion RMB.
-1,500
-500
500
1,500
2,500
3,500
4,500
0 1 2 3 4 5 6 7 8 9 10
Pri
mar
y C
cash
Flo
w
[mill
ion
RM
B]
Year
Mean

234
Figure A8. Unexpected Budget Demand - 10th Year Perspective
We also examined another variation of Option 3, where government pays all premiums and program costs
and diversifies risk through insurance / reinsurance as described earlier. This option is better than options
one and two, but it is inferior to Option 3, as shown in Figure A9. Nonetheless, this may be an option to
initiate the program and to facilitate its adoption in the early years, and over time switch to Option 3.
Finally, in Figure A10 we summarize the budget demands or budget surplus for the government at various
risk horizons: from 10 years to 10,000 years return periods (risk horizons). It shows the superiority of the
commercially viable and sustainable microinsurance program by capping the unexpected budget
demands to 12 billion RMB for the very tail risk horizons (1,000 year and higher return periods), while
generating budget surplus for risk horizons 100 yr or shorter.
Figure A9. Unexpected Budget Demand, Modified Option 3
Figure A10. Government Options Comparison
It is our belief that activation of a micro-insurance program like this provides the following advantages:
-40,000
-35,000
-30,000
-25,000
-20,000
-15,000
-10,000
-5,000
0
5,000
10,000
0.0001 0.001 0.01 0.1 1
UN
FOR
ESEE
N B
UD
GET
DEM
AN
D(m
illio
n
RM
B)
EXCEEDING PROBABILITY
Option 1
Option 2
Option 3
-40,000
-35,000
-30,000
-25,000
-20,000
-15,000
-10,000
-5,000
0
5,000
10,000
0.0001 0.001 0.01 0.1 1
UN
FOR
ESEE
N B
UD
GET
DEM
AN
D(m
illio
n
RM
B)
EXCEEDING PROBABILITY
Option 3
Option 3 Modified – Gov.
Pays All Premiums
OPTIONRISK HORIZON
RP 10,000 Yrs. RP 1,000 Yrs. RP 100 Yrs. RP 10 Yrs.
Option 1 - 34,600 -20,500 -8,800 -4,000
Option 2 -29,100 -15,000 -3,300 +1,500
Option 3 -12,200 -12,200 +100 +400

235
It significantly reduces and “smoothes” the magnitude of unexpected budget demands at all risk
horizons
It generates potential for budget surplus for shorter risk horizons, and
It supports the economic growth and insurance system activation.
5. CONCLUDING REMARKS
We hope that this paper demonstrates the viability and sustainability of a micro-insurance program for
earthquake protection of Rural China. Its principal attributes are outlined below.
The program with annual premium of 10 RMB per policy is affordable for the rural population
The parametric trigger provides payouts for smaller and more frequent events and addresses
“insurance trust” issue
The program provides catastrophic non-indemnity “step policy” coverage for large destructive
earthquakes
The program is commercially viable and sustainable for all participants (primary, reinsurance,
government)
Fronting operations and technology details need to be elaborated in more detail before program
implementation. From this example, it can be seen that an affordable product for those who are at the BoP
can be developed which over a long period of time not only will result in providing profit potential to the
insurers and reinsurers, but will also improve the confidence of insured in the risk transfer mechanism.
Finally, such a program could help governments in providing high liquidity for rapid reconstruction and
renovation.
REFERENCES
Stojanovski, P., Dong, W., Wagh, S., Mortgat, C., Shah, H.. (2010). Rural China Double Trigger Earthquake
Catastrophe Microinsurance Program. 4th Microinsurance Round Table Forum, April 8-10, Nanyang
Technological University, Singapore., invited presentation.

236
APPENDIX B
MICRO-INSURANCE ROUNDTABLE FORUM (MIRT) AT NANYANG TECHNOLOGICAL UNIVERSITY,
SINGAPORE
Micro-Insurance Round-Table (MiRT) Forum
Organized by Nanyang Technological University, Singapore
&
Risk Management Solutions, Inc., California, USA
The Institute of Catastrophe Risk Management (ICRM), NTU, Singapore and Risk Management Solutions
(RMS), Inc., California, USA, have jointly organized five Micro-Insurance Round-Table Forums in March
2007, April 2008, April 2009, April 2010 and April 2011 at the Nanyang Executive Centre of NTU. The
main objective of the Forum is to discuss how to bring micro-insurance to those in the lower rungs of
the income pyramid and the old in the developing countries, who are affected by natural disasters such
as earthquakes, major floods, volcanic eruptions, hurricanes and tsunamis. Whilst insurance has been
introduced to this sector of the economy, both the extent and the rate of insurance penetration in this
sector have been extremely low. This is due to low supply and demand, with sellers finding it
unprofitable while buyers do not know much about risk transfer mechanisms. Even if the buyers know
of such a product, they would think that they could not afford it. It is therefore in the vision of the
Forum that new opportunities could be created to develop micro-insurance as the new service area, to
provide the financial means for those in the lower income pyramid to protect themselves against
catastrophic risks.
Objectives
The Micro-Insurance Round-Table Forum is designed to focus on the following issues:
1. Current work and identifying the main advocates / players / beneficiaries. 2. Case studies of completed and on-going projects on catastrophe risk and catastrophe micro-
insurance. 3. Identifying the most urgent steps needed to make this concept implemented on a sustained basis. 4. The role that insurance, (re)insurance, investment banks, governments, NGOs, international
organizations (such as the World Bank), and academics can play in this effort. 5. Developing and understanding appropriate loss estimation models for such a product and
development of the product. 6. Where do we go from here? What are the next steps?
Singapore-NTU Alliance for Micro-Insurance
The Singapore-NTU Alliance for Micro-Insurance is set up after the 3rd MiRT in 2009. It is made up of
individuals and organization partners, who have the knowledge and interest in furthering the concept of
using micro-insurance to assist those who need help after major man-made or natural disasters. The
Alliance is a public-private partnership alliance with participation by (re)insurance companies, brokers,
government agency, and NTU, and it will guide and act on an advisory basis. Projects from different
countries will be proposed and pilot projects would be carried out in the Asian region.
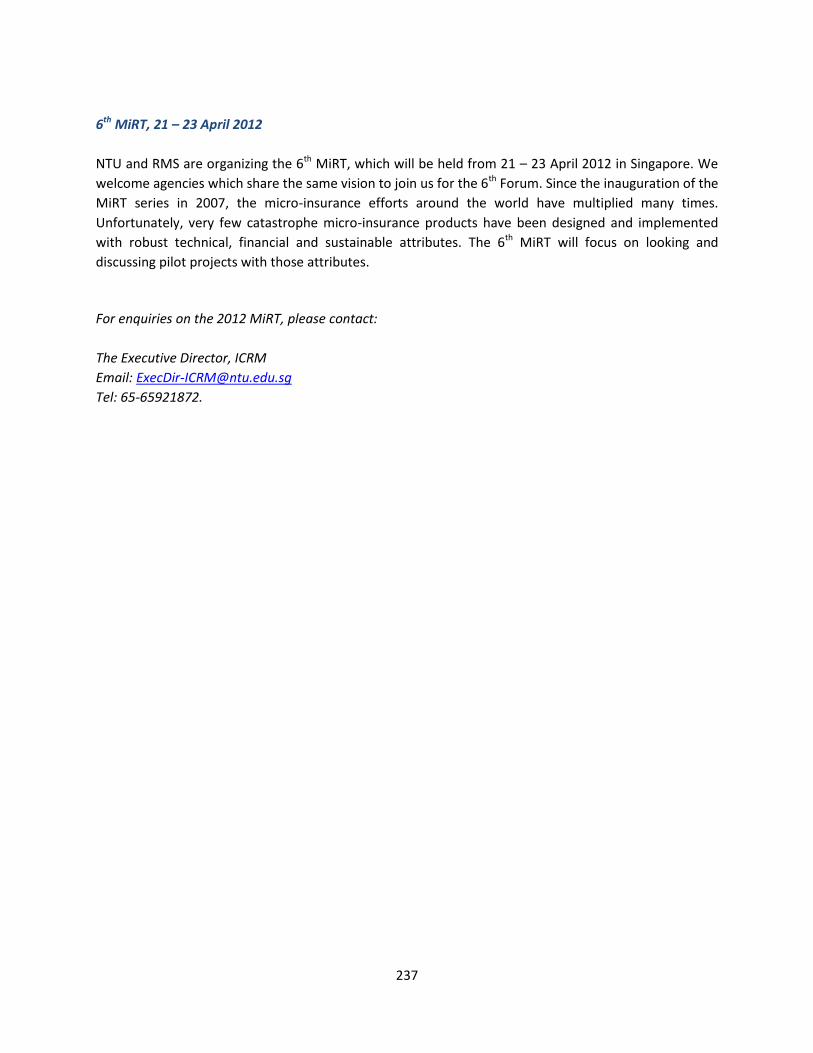
237
6th MiRT, 21 – 23 April 2012
NTU and RMS are organizing the 6th MiRT, which will be held from 21 – 23 April 2012 in Singapore. We
welcome agencies which share the same vision to join us for the 6th Forum. Since the inauguration of the
MiRT series in 2007, the micro-insurance efforts around the world have multiplied many times.
Unfortunately, very few catastrophe micro-insurance products have been designed and implemented
with robust technical, financial and sustainable attributes. The 6th MiRT will focus on looking and
discussing pilot projects with those attributes.
For enquiries on the 2012 MiRT, please contact:
The Executive Director, ICRM
Email: [email protected]
Tel: 65-65921872.
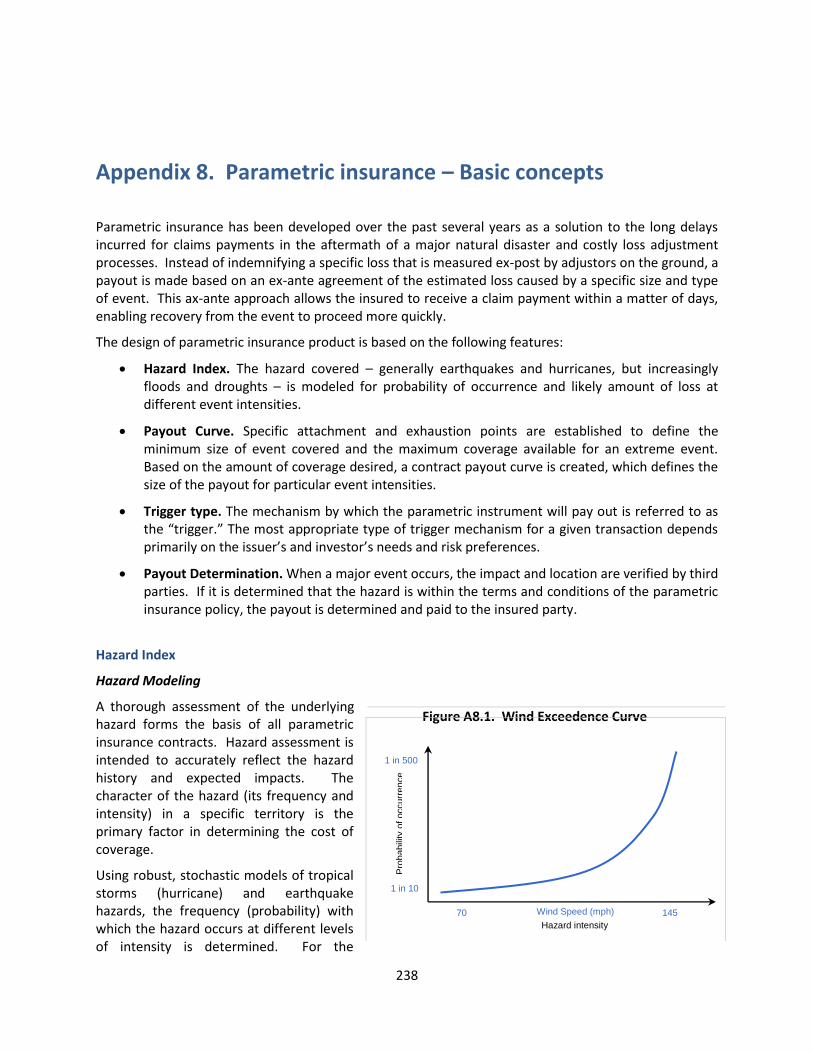
238
Appendix 8. Parametric insurance – Basic concepts
Parametric insurance has been developed over the past several years as a solution to the long delays incurred for claims payments in the aftermath of a major natural disaster and costly loss adjustment processes. Instead of indemnifying a specific loss that is measured ex-post by adjustors on the ground, a payout is made based on an ex-ante agreement of the estimated loss caused by a specific size and type of event. This ax-ante approach allows the insured to receive a claim payment within a matter of days, enabling recovery from the event to proceed more quickly.
The design of parametric insurance product is based on the following features:
Hazard Index. The hazard covered – generally earthquakes and hurricanes, but increasingly floods and droughts – is modeled for probability of occurrence and likely amount of loss at different event intensities.
Payout Curve. Specific attachment and exhaustion points are established to define the minimum size of event covered and the maximum coverage available for an extreme event. Based on the amount of coverage desired, a contract payout curve is created, which defines the size of the payout for particular event intensities.
Trigger type. The mechanism by which the parametric instrument will pay out is referred to as the “trigger.” The most appropriate type of trigger mechanism for a given transaction depends primarily on the issuer’s and investor’s needs and risk preferences.
Payout Determination. When a major event occurs, the impact and location are verified by third parties. If it is determined that the hazard is within the terms and conditions of the parametric insurance policy, the payout is determined and paid to the insured party.
Hazard Index
Hazard Modeling
A thorough assessment of the underlying hazard forms the basis of all parametric insurance contracts. Hazard assessment is intended to accurately reflect the hazard history and expected impacts. The character of the hazard (its frequency and intensity) in a specific territory is the primary factor in determining the cost of coverage.
Using robust, stochastic models of tropical storms (hurricane) and earthquake hazards, the frequency (probability) with which the hazard occurs at different levels of intensity is determined. For the
Figure A8.1. Wind Exceedence Curve
Pro
babili
ty o
f occurr
en
ce
1 in 10
1 in 500
Wind Speed (mph) 70 145
Hazard intensity

239
hurricane hazard, intensity can be expressed in wind speed, and for earthquakes, ground acceleration can be used. As a result of this analysis, hazard exceedence curves are produced for each location of interest. These curves (see Figure A8.1) depict the relationship between the intensity of the hazard and the probability of that hazard intensity occurring.
Loss Estimation
Damage and losses due to hazard impacts increase exponentially as the intensity of the hazard increases; that is, the rate of damage increases more rapidly than does the increase in the intensity of the hazard. A single hazard event can have varying impacts at different locations within a country and hazard intensities should be measured at multiple significant locations in the country for determining the parametric trigger.
To understand the precise impact of an event, hazard intensities and frequencies are taken for several measurement points. These measurement points are pre-selected to correspond to key economic activity areas in the covered area. The hazard values measured at each of these points during a hazard event are combined with a predetermined weighting that reflects the economic loss potential of economic activities surrounding each measurement point. This analysis helps ensure that the parametric hazard trigger reflects the actual impacts experienced across a territory.
Composite Damage Function
The relationship between the intensity of an event and the losses incurred as a result of the event is known as a damage function. Damage functions take into account the resilience of the capital stock in a given area and are specific to various categories of infrastructure and building types in residential and commercial sectors.
Using a set of damage functions appropriate to the territory, in combination with information on the quantity and location of development and infrastructure, a composite damage function (Figure A8.2) can be derived for use with the results of the hazard analysis. These damage functions are based on data derived from insurance claims and by engineering-based damage modeling.
Payout Curve
Attachment and Exhaustion Points
Parametric contracts include attachment and exhaustion points. The attachment point is the hazard index value at which the contract is triggered, and functions like a deductible in a standard insurance policy. Payouts are made on the policy when the hazard index for an event in a covered territory equals or exceeds the attachment point specified in the contract. The policyholder covers all losses for events that generate a hazard index below the attachment point.
Figure A8.2. Composite Damage Function
Perc
ent
da
ma
ge
10%
95 %
Wind Speed (mph) 70 145
Composite
Damage Function
Hazard intensity

240
As the hazard index increases above the attachment point, the corresponding payout increases up to the exhaustion point selected by the participating territory. The exhaustion point is the upper limit of disaster intensity to be covered.
The policy limit is the difference between the attachment and exhaustion points (exhaustion – attachment) and is the maximum amount to be paid out under the contract. Payouts for events that have in-country hazard indexes that exceed the exhaustion point will be paid at the policy limit. This limit applies to the full term (one year) of the contract; the total amount paid out under the contract during the one-year period will not exceed the policy limit, whether that limit is reached due to payout from one large event or multiple smaller events that each trigger payments under the contract.
Selection of Attachment and Exhaustion Points
When developing a parametric contract, a policyholder will identify a level of financial impact on the government budget, beyond which it would want to receive an immediate cash injection. This value is an appropriate starting point for identifying an attachment point for the contract. Once an attachment point has been selected, the exhaustion point can be set based on the cost of the contract and the maximum amount that the country is interested in paying for the catastrophe coverage. The frequency with which the hazard index exceeds the attachment point and the range between attachment and exhaustion point are primary determinants of the premium cost.
Based on an index curve derived, it is possible to identify the hazard index value that corresponds to a specific payout amount. In the example shown in Figure A8.3, a contract attachment point of US$15 million is selected. Based on the territory’s index curve, this corresponds to a hazard index value of 550, and an exhaustion point of US$35 million corresponds to a hazard index of 980 on this same curve. The selection of these two points results in a policy limit of US$20 million (US$35 million – US$15 million).
Final Parametric Payout Curve
An example of a final payout curve for one hazard for a participating territory can be found in Figure A8.4. This curve is defined by the following, which will be explicitly included in the parametric contract:
equation for calculating the hazard index (including country-specific measurement points and importance factors [weights]);
equation for the payout curve; and
the attachment and exhaustion points.
Figure A8.3. Fitting the Index Curve
Figure A8.4. Final Contract Payout Curve
Attachment
Exhaustion
Hazard index 500 1000
15
35
550
980
Policy Limit
Attach
me
nt
Hazard index
Payou
t ($
Mil)
0
20
550
980
E
xhau
stio
n
Desir
ed c
ove
rage f
or
loss t
o g
ove
rnm
ent
accts
50

241
The cost of the final parametric contract is based on a pure premium charge derived directly from the final payout curve, plus an administrative load to cover costs such as reserve development, reinsurance, and administration.
Trigger Mechanism
The mechanism by which a risk financing product (e.g., insurance, catastrophe (cat) bond) will pay out is referred to as the “trigger.” The most appropriate type of trigger mechanism for a given transaction depends primarily on the issuer’s and investors’ needs and risk preferences. Each trigger described below, including: i) modeled loss trigger; ii) first generation parametric trigger; iii) second generation parametric trigger; and, iv) hybrid parametric trigger, has a different level of basis risk. Basis risk is the risk that the payments received from the policyholder do not correlate well with the actual losses.
Modeled Loss Trigger
A modeled loss trigger is based upon predicted losses to the underlying exposure database. Structuring such a transaction is relatively straightforward because the trigger amount and layer size are set directly to the levels of protection desired, such as US$120 million policy limit coverage with an attachment point equal to a 1-in-20 year event. When an event occurs, the loss to the insurance product is determined by simulating the actual event in its catastrophe model and estimating its financial impact.
Remodeling the event requires the collection of certain event parameters such as epicenter location, depth and magnitude for earthquake, and landfall location, maximum wind speed, central pressure and precipitations for hurricanes. Because this type of information is quickly available after an event, modeled loss triggers can be structured to pay out relatively quickly.
First Generation Parametric Trigger
Known as the “cat-in-a-box” parametric trigger, payment is based on the occurrence of predefined event parameters, such as an earthquake with a specified magnitude and hypocenter depth occurring in a specified area, or a tropical cyclone whose eye with a specified maximum central pressure crosses within a specified “box” drawn around the territory or populated areas to be protected. The advantage of such a trigger is that the event parameters are quickly and easily available, with no need to perform any post-event modeling or having recording stations on the ground. The rate of occurrence of trigger events in each specified zone and resulting loss probabilities can then be computed and aggregated to estimate the risk of the overall structure.
This trigger was successfully used in the analysis performed for the CAT-Mex bond in 2009 for the Government of Mexico. Note that although the CAT-Mex transaction triggered a full payout upon meeting its trigger, this type of binary payout is by no means mandatory for this trigger type.
Second Generation Parametric Trigger
Second generation or “index” parametric triggers are most common in areas of the world like Europe and Japan where a dense network of seismic or wind stations is available, as this type of trigger requires the measurement of event parameters at hundreds or thousands of locations near concentrations of exposure. The event parameters recorded at each station are combined with station-specific weights meant to account for the relative accumulation of exposure by means of a formula such as described in Box A8.1 below.
Box A8.1. Second Generation Parametric Trigger Loss Formula

242
∑
( )
Where:
– Lossj is the estimated loss from event j, expressed in millions of US$;
– is the payout factor, such as 16% for earthquakes and 23% for tropical cyclones;
– β is a constant determined through an optimization process, whose purpose is to minimize any discrepancy
between the modeled loss estimate and the parametric formula (i.e., basis risk);
– Wi is the weight associated with recording station i, based on the relative amount of exposure near that station;
– (Pj,i)z is a polynomial to the power z. P is the intensity of the peril from event j as measured at recording station i.
It typically represents spectral acceleration for earthquakes and wind speed for tropical cyclones, though it could
also be adapted to measure precipitation and storm surge levels should the proper measuring stations be
available.
The insurance product is structured to trigger based on exceeding a given index value which corresponds to the loss level for which the issuer wants protection. Beyond the need for a dense network of measuring stations, this structure is not appropriate to provide protection for events that would be expected to destroy or otherwise render ineffective the physical stations. Storm surge and tsunami height, both elements modeled for the South Pacific, would likely fall in that category.
Hybrid Parametric Trigger
Hybrid triggers present features of both second generation parametric structures and modeled loss triggers. This trigger can be identical to a traditional second generation parametric trigger; with the important difference being the intensity of the event collected near each concentration of exposure is predicted based on the event parameter values, instead of being based on field measurements from physical recording stations.
This trigger is most useful where the reporting network is not dense enough (or cannot report its observations fast enough) to provide sufficient parameters for a traditional second generation structure. To simulate local event intensity such as ground motion or wind speed, event parameters such as an earthquake’s epicenter location, hypocenter depth, and magnitude; or, a tropic storm’s landfall location, central pressure, and radius of maximum wind, are used as inputs to recreate a simulated ground motion or wind speed at each point of interest. The weights associated with these points are combined with the simulated event parameter in an index formula similar to that described in Box A8.1. Hybrids can also be calibrated to accommodate other metrics of damage such as the number of people affected by an earthquake, a measure similar to the USGS PAGER system.
The concept of collecting relatively simple predicted event intensity values to simulate the local impact of wind and ground shaking is very close to that of modeled loss triggers. The difference being that hybrid triggers do not require the use of full-blown modeling software to estimate the losses and subsequent payment from an event. Instead, the event parameter values are input into a spreadsheet that would automatically apply simplified formulas to determine local intensity. Such a spreadsheet could be made widely available to risk managers, who could use it to generate a quick preliminary estimate of potential payouts from an event by entering in the spreadsheet the widely-available event parameter values.
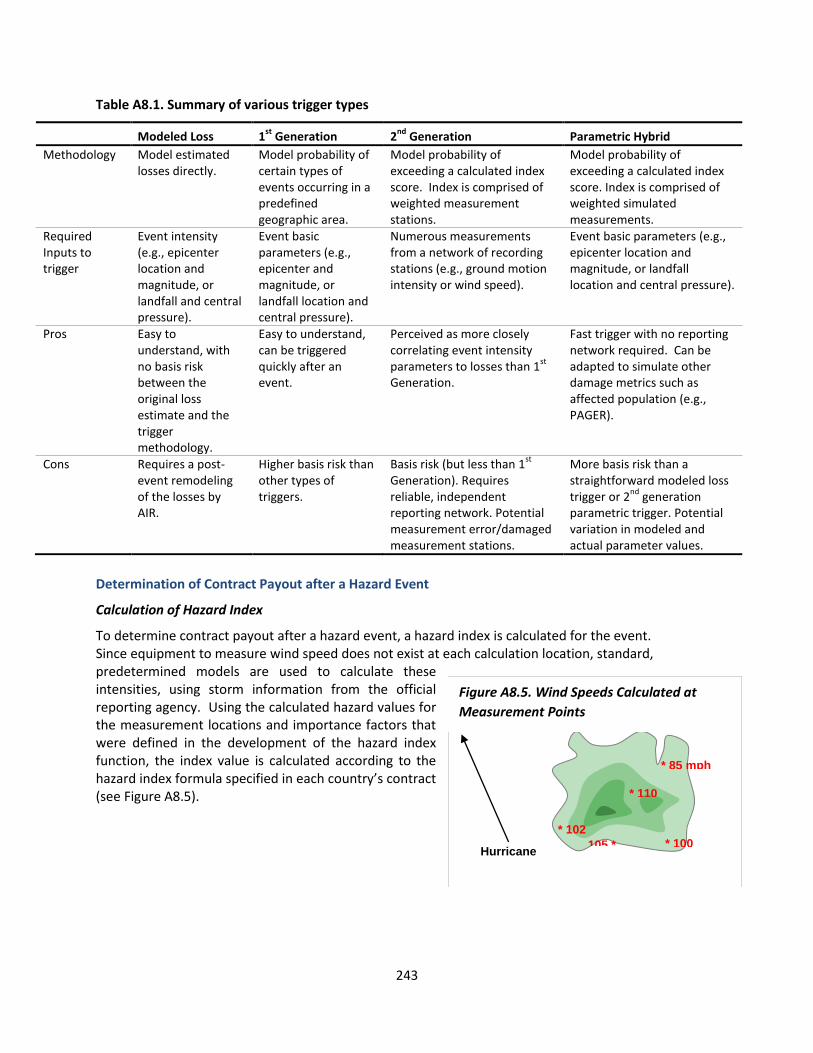
243
Table A8.1. Summary of various trigger types
Modeled Loss 1st
Generation 2nd
Generation Parametric Hybrid
Methodology Model estimated losses directly.
Model probability of certain types of events occurring in a predefined geographic area.
Model probability of exceeding a calculated index score. Index is comprised of weighted measurement stations.
Model probability of exceeding a calculated index score. Index is comprised of weighted simulated measurements.
Required Inputs to trigger
Event intensity (e.g., epicenter location and magnitude, or landfall and central pressure).
Event basic parameters (e.g., epicenter and magnitude, or landfall location and central pressure).
Numerous measurements from a network of recording stations (e.g., ground motion intensity or wind speed).
Event basic parameters (e.g., epicenter location and magnitude, or landfall location and central pressure).
Pros Easy to understand, with no basis risk between the original loss estimate and the trigger methodology.
Easy to understand, can be triggered quickly after an event.
Perceived as more closely correlating event intensity parameters to losses than 1
st
Generation.
Fast trigger with no reporting network required. Can be adapted to simulate other damage metrics such as affected population (e.g., PAGER).
Cons Requires a post-event remodeling of the losses by AIR.
Higher basis risk than other types of triggers.
Basis risk (but less than 1st
Generation). Requires reliable, independent reporting network. Potential measurement error/damaged measurement stations.
More basis risk than a straightforward modeled loss trigger or 2
nd generation
parametric trigger. Potential variation in modeled and actual parameter values.
Determination of Contract Payout after a Hazard Event
Calculation of Hazard Index
To determine contract payout after a hazard event, a hazard index is calculated for the event. Since equipment to measure wind speed does not exist at each calculation location, standard, predetermined models are used to calculate these intensities, using storm information from the official reporting agency. Using the calculated hazard values for the measurement locations and importance factors that were defined in the development of the hazard index function, the index value is calculated according to the hazard index formula specified in each country’s contract (see Figure A8.5).
* 85 mph
* 100 * 102
105 *
* 110
Hurricane
Figure A8.5. Wind Speeds Calculated at
Measurement Points

244
Calculation of Payout Amount
Once the hazard index has been calculated for a particular hazard event that affected a participating territory, the index value is compared to the attachment and exhaustion points for the covered territory. If the hazard index calculated for the event in the territory is below the attachment point, no payment is made to for the event. If the hazard index for the event exceeds the attachment, the payout amount can be determined directly based on the attachment and exhaustion points and the policy limit, as shown in the theoretic Equation 1 below:
Equation 1. Payout Calculation Formula
Payout = (event index – attachment)
* policy limit (exhaustion – attachment)
The resulting payout amount cannot be less than zero or greater than the policy limit.
In the example shown in Figure A8.6, the hazard index for a specific event was 750. Since this index
value is above the attachment value of 550, this event triggers a payment on the parametric contract.
The payout for this territory for this event would be approximately US$9.3 million, as demonstrated in
Equation 2 below.
Equation 2. Payout Calculation
Payout = (750 – 550)
* US$20 million (980 – 550)
= 200
* US$20 million 430
= US$9.3 million
Treatment of Multiple Events
The policy limit is an annual loss limit—it is the maximum total payment from the Facility over the course of the contract year, whether from one or multiple events.
In the example shown in Figure A.8.7, a payment of US$9.3 million is made for the first storm to trigger the contract. A second storm occurs, with a hazard index of 851, which corresponds to a payout of
Figure A8.6. Payout Calculation for First Hazard Event
Figure A8.7. Payout Calculation for Multiple Events
Policy Limit
Attach
me
nt
Hazard index
Payou
t ($
Mil)
0
20
550
980
E
xhau
stio
n
750
Storm 1 payout: $9.3 mil
9.3
Policy Limit
Attach
me
nt
Hazard index
Payou
t ($
Mil)
0
20
550
980
E
xhau
stio
n
750
851
Storm 2
Storm 1 9.3
14
Storm 1 payout: $9.3 mil
Storm 2 payout: Calculated–$14 mil
Capped–$10.7 mil
Total payout for year: $20 mil

245
US$14 million. Since the combined total of the two payments (US$23.3 million) exceeds the policy limit, the second payment is capped at US$10.7 million, so that the total payment for the year is equal to the policy limit of US$20 million.
Parametric instruments have significant advantages over indemnity coverage, particularly in regards to speed of payment and low costs. These benefits come at a cost, most prevalent of which is the risk of not receiving a payment for a hazard event, or receiving a payment that does not sufficient cover the losses incurred. A summary of the pros and cons of parametric instruments can be found in Box A8.2.
Box A8.2. Benefits and Challenges of Parametric Insurance
Benefits to Parametric Insurance
Challenges to Parametric Insurance
No moral hazard. Moral hazard arises when insured
parties can alter their behavior to increase the potential
likelihood or magnitude of a loss. Parametric insurance
policies are exempt from moral hazard because the
indexes used in the calculation of the indemnity payouts
(for example, wind speed, ground motion) are
independent on the individual actions of the
governments.
No adverse selection. Adverse selection occurs when the
potential insured has better information than the insurer
about the potential likelihood or magnitude of a loss, thus
using that information to self-select whether or not to
purchase insurance. This informational asymmetry
problem is eliminated, as sophisticated country-specific
catastrophic risk models are developed to assess the
frequency and severity of hurricanes and earthquakes.
Lower operating costs. Unlike traditional insurance,
parametric insurance does not require costly monitoring
processes (since there is no moral hazard or adverse
selection) or loss adjustment processes. Parametric
insurance products depend exclusively on the realized
value of the underlying index as measured by
independent agencies (such as the U.S. National Hurricane
Center or the U.S. Geological Survey, National Earthquake
Information Center).
Transparency. Parametric insurance contracts are based
on independently reported indexes and transparent
indemnity formulas. As such, they give little opportunity
for litigation between the parties. With payouts
calculated based on a predefined formula included in the
contract, and input data provided by an independent
agency, the parties to a contract can calculate the
potential impact of a disaster event immediately after it
Basis risk. Basis risk emerges when the insurance
payout does not exactly match the actual loss. By
definition, the index used in a parametric contract is
a proxy for the real loss, and thus one cannot
exclude that the parametric insurance indemnity
may slightly underestimate (or overestimate) the
actual loss. Careful design of the terms and
conditions of the parametric insurance policy is
critical to minimize this basis risk. Recent
catastrophe risk modeling techniques allow for the
design of composite indexes that better mimic
potential losses. At the same time, it is important to
remember that the objective of a parametric
instrument is not to cover the full losses in a
covered territory, but to guarantee a minimum
amount of liquidity in case of a major adverse
natural event.
Model bias. Model bias is the possibility that the
catastrophe models consistently underestimate or
overestimate the type and probability of losses
resulting from certain catastrophic events. In other
words, it is the basis risk between reality and its
(necessarily incomplete) representation through a
mathematical model. Model bias can be reduced
through a thorough understanding of the
catastrophe environment of a region including the
type, distribution, quantity and vulnerability of its
building stock to disaster. The incorporation of this
information into a model calibrated based on
expertise and historical loss experience should limit
model bias. The more information that is available
about local catastrophe activity, local building stock
and local loss experience, the lower the model bias
is likely to be.

246
occurs and start processing a claim.
No cross-subsidization. The detailed risk model permits
the individual assessment of the risk exposure of each
participating territory in the pool. The insurance premium
will thus be calculated individually based on the estimated
risk faced by each territory. This process will ensure that
opportunities for cross-subsidization are kept to a
minimum and remain negligible when compared to the
benefits provided by the pooled portfolio.
Immediate disbursement. Because no loss assessment is
required, parametric contracts allow for the settlement of
claims shortly after an event. It is expected that claims
are settled within four weeks following a disaster, as
weather/earthquake information is available on a daily
basis. This rapid claim settlement is essential if the
affected states are to get access to liquidity to cover
emergency and early recovery expenditures.
Reinsurance and securitization. Parametric insurance is a
new type of financial product where the underlying asset
is a physical index (for example, wind speed, ground
motion). Financial markets are interested in these types
of products, which are uncorrelated with their asset
portfolio and thus allow for further diversification. While
they are sometimes reluctant to invest in insurance and
reinsurance companies, because they do not fully
understand the risks faced by these companies,
parametric instruments are generally event specific,
making them more transparent and thus more attractive
to investors. This facilitates the access of the capital
markets through securitization (for example, index-linked
securities, including catastrophe bonds).
Technical limitations of insurable hazards. Because
parametric instruments rely on a calculated index,
their use is limited to hazards that can be modeled
with a sufficiently high level of confidence.
Hurricane and earthquake models have been
developed and tested for more than a decade and
are under constant improvement (particularly
following Hurricane Katrina in the United States in
2005). However, catastrophe risk assessment
models for hazards like volcanic eruptions or
tsunamis are still under development.
Market limitations of insurable hazards. The
existence of a catastrophe risk model developed by
an independent agency is a necessary but not
sufficient condition to make this risk insurable.
Financial investors generally charge an uncertainty
load in the premium to accept risks that are new in
the market. This uncertainty load can make the
premium so high, compared to the expected loss,
that the risk becomes uninsurable. This is currently
the case for tsunamis and volcanic eruptions.
Education. Parametric insurance is a combination
of insurance concepts and financial concepts.
Education of policymakers and government agencies
will be essential to ensure that the instrument is
understood and used appropriately by local
authorities.
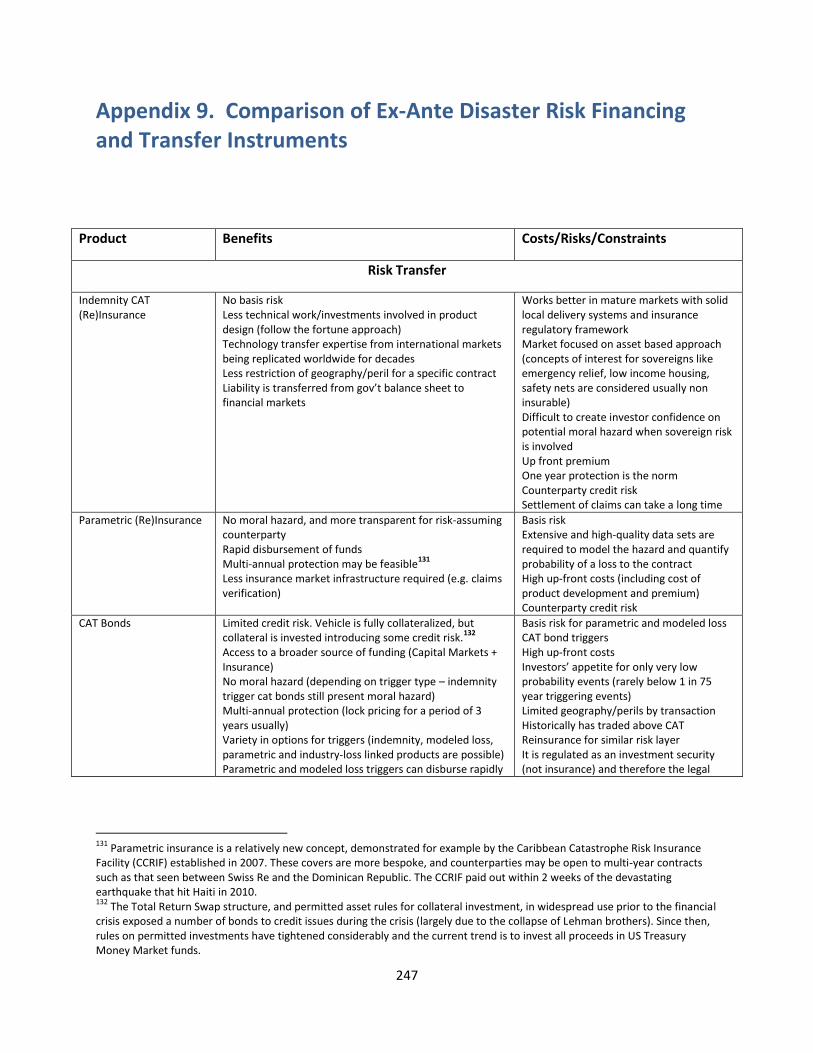
247
Appendix 9. Comparison of Ex-Ante Disaster Risk Financing and Transfer Instruments
131
Parametric insurance is a relatively new concept, demonstrated for example by the Caribbean Catastrophe Risk Insurance Facility (CCRIF) established in 2007. These covers are more bespoke, and counterparties may be open to multi-year contracts such as that seen between Swiss Re and the Dominican Republic. The CCRIF paid out within 2 weeks of the devastating earthquake that hit Haiti in 2010. 132
The Total Return Swap structure, and permitted asset rules for collateral investment, in widespread use prior to the financial crisis exposed a number of bonds to credit issues during the crisis (largely due to the collapse of Lehman brothers). Since then, rules on permitted investments have tightened considerably and the current trend is to invest all proceeds in US Treasury Money Market funds.
Product Benefits Costs/Risks/Constraints
Risk Transfer
Indemnity CAT (Re)Insurance
No basis risk Less technical work/investments involved in product design (follow the fortune approach) Technology transfer expertise from international markets being replicated worldwide for decades Less restriction of geography/peril for a specific contract Liability is transferred from gov’t balance sheet to financial markets
Works better in mature markets with solid local delivery systems and insurance regulatory framework Market focused on asset based approach (concepts of interest for sovereigns like emergency relief, low income housing, safety nets are considered usually non insurable) Difficult to create investor confidence on potential moral hazard when sovereign risk is involved Up front premium One year protection is the norm Counterparty credit risk Settlement of claims can take a long time
Parametric (Re)Insurance No moral hazard, and more transparent for risk-assuming counterparty Rapid disbursement of funds Multi-annual protection may be feasible
131
Less insurance market infrastructure required (e.g. claims verification)
Basis risk Extensive and high-quality data sets are required to model the hazard and quantify probability of a loss to the contract High up-front costs (including cost of product development and premium) Counterparty credit risk
CAT Bonds
Limited credit risk. Vehicle is fully collateralized, but collateral is invested introducing some credit risk.
132
Access to a broader source of funding (Capital Markets + Insurance) No moral hazard (depending on trigger type – indemnity trigger cat bonds still present moral hazard) Multi-annual protection (lock pricing for a period of 3 years usually) Variety in options for triggers (indemnity, modeled loss, parametric and industry-loss linked products are possible) Parametric and modeled loss triggers can disburse rapidly
Basis risk for parametric and modeled loss CAT bond triggers High up-front costs Investors’ appetite for only very low probability events (rarely below 1 in 75 year triggering events) Limited geography/perils by transaction Historically has traded above CAT Reinsurance for similar risk layer It is regulated as an investment security (not insurance) and therefore the legal

248
133
ILWs trade for US perils, European windstorm and to a lesser extent Japanese earthquake. Third party industry loss providers recognized and accepted by the market include US Property Claims Services (PCS) and European companies (PERILS AG, Swiss Re Sigma, Munich NatCat services)
Liability is transferred from gov’t balance sheet to financial markets
framework can be complicated for sovereigns
CAT Derivatives (ex. Industry Loss Warranties)
Limited basis risk for large diversified portfolios of assets (settled on third party industry loss indices or tailor made indices) Attractive to risk-assuming counterparty as there is no moral hazard, and product is easy to understand Liability is transferred from gov’t balance sheet to financial markets
Works only when there is a mature, credible methodology to generate an aggregate industry loss estimation which is not currently available outside of developed insurance markets
133
Typically only annual protection is offered Counterparty credit risk (depending on where trade occurs – many contracts are negotiated directly between counterparties)
Weather Derivatives
Flexibility with regards to incorporate tailor made indices Multi-annual protection available Flexibility with regards to perils/geography of protection Rapid payout
Sufficient historic data and ground measurement tends to be limited in LIC Basis risk High up-front costs Counterparty credit risk
Risk Financing
Contingent Credit Multilaterals (Ex. CAT DDO)
Lower costs No basis risk (Use of softer triggers that can be linked to gov’t actions like Declaration of Disaster) Flexibility on financial terms (including a longer term than any of the other risk financing alternatives) Funds are ring-fenced and are not at risk of depletion as a result of political pressure for purposes other than disaster response No counterparty credit risk (where the counterparty is the World Bank as per the Cat DDO)
Financial impact is retained in gov’t balance sheet Institutions like the World Bank have an absolute size limit of 0.25% of GDP, which is very limiting in LIC because the potential impact of natural disasters can usually be substantially higher
Structured Financing Vehicles
Limited credit risk (fully funded vehicles) Possibility to generate positive cost of carry (service of debt repaid through the vehicle) Multi-annual availability
Basis risk (triggers/risks are usually limited on a similar fashion as done in the CAT Bond space) Financial impact is retained in gov’t balance sheet
Structured Risk Financing
Finite Risk Contracts Can be used to combine risk retention (through reserving), risk financing and risk transfer elements into the program Provides flexibility to include a wider spectrum of risks (from lower to higher probability events) and flexibility in how much of the risk is transferred versus retained Can combine both soft and tighter parametric triggers Multi-annual contracts (5 year terms are not uncommon) Contract includes cancellable clauses
These are ‘next generation instruments’ intended to complement existing risk retention and transfer strategies. Therefore instruments are only suitable for institutions that already have a sophisticated risk financing strategy in place, and that have technical capacity to accurately assess their risk in detail Few countries have legislation in place to regulate these instruments Lack of supervision has led some financial intermediaries in developed countries to use these tools to hide liabilities Legal language is sophisticated