volkswagen – on the road of successvolkswagen – on the road of success goldman sachs investor...
TRANSCRIPT

Volkswagen –
On the Road of SuccessGoldman Sachs Investor VisitWolfsburg, September 22, 2010
22
Volkswagen –
On the Road of Success
Part 1:
Hans Dieter Pötsch, Member of the Board of Management
Part 2: Frank Fiedler, CFO Volkswagen Financial Services AG
Part 3: Dr. Christof
Spathelf, Senior Vice President of Volkswagen Group Manufacturing Overseas
3
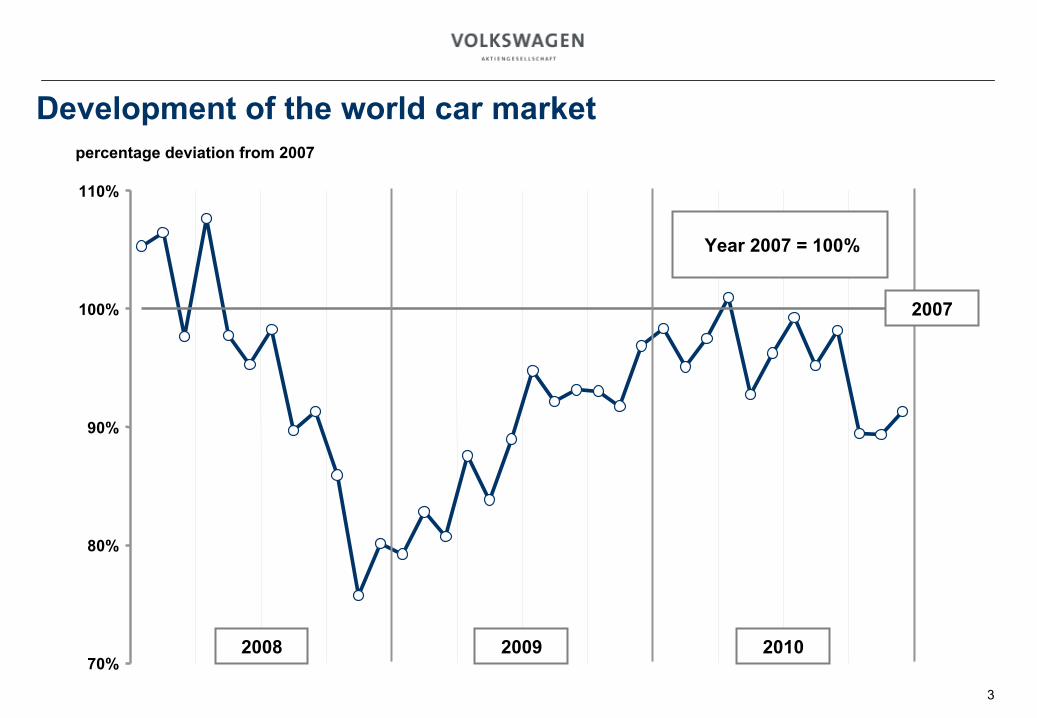
Development
of the world
car
market
70%
80%
90%
100%
110%
percentage
deviation
from
2007
2008
Year
2007 = 100%
2009 2010
2007
41 incl. Scania (Jan-Jun), incl. Trucks and Busses (until
Feb 2009)
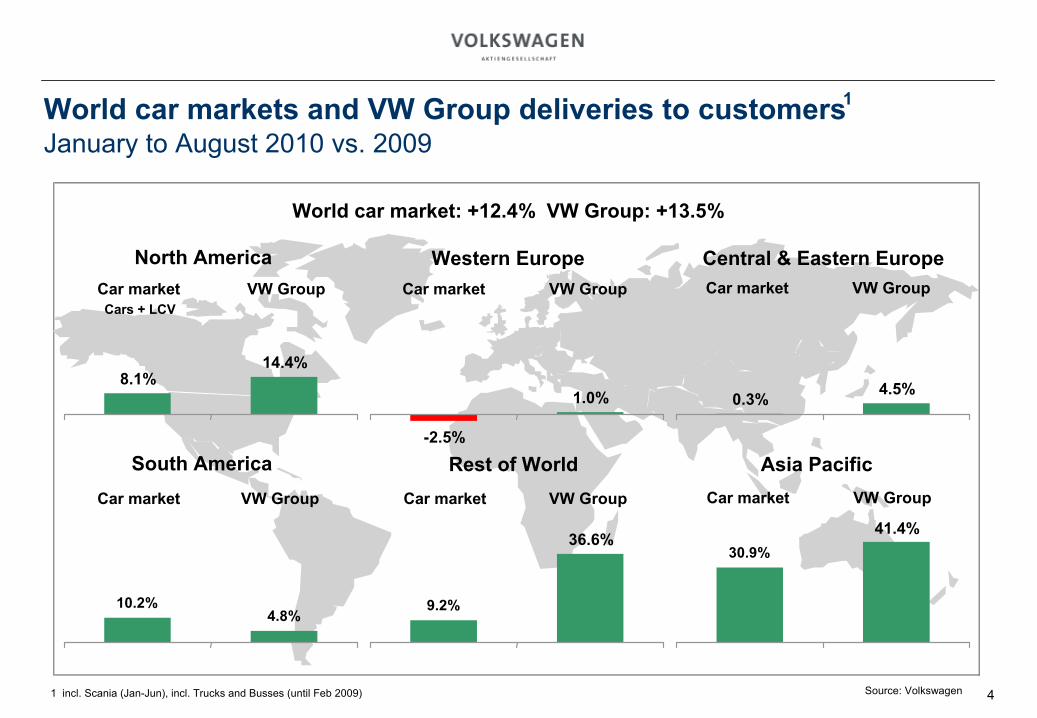
World car markets and VW Group deliveries
to customers January to August
2010 vs. 2009
Source: Volkswagen
1
World car
market: +12.4% VW Group: +13.5%
14.4%8.1%
-2.5%
1.0% 4.5%0.3%
4.8%10.2% 9.2%
36.6%41.4%
30.9%
North America Western Europe Central & Eastern Europe
South America Asia
PacificRest of World
Car marketCars + LCV
VW Group Car market VW Group Car market VW Group
Car market VW GroupCar market VW GroupCar market VW Group
55
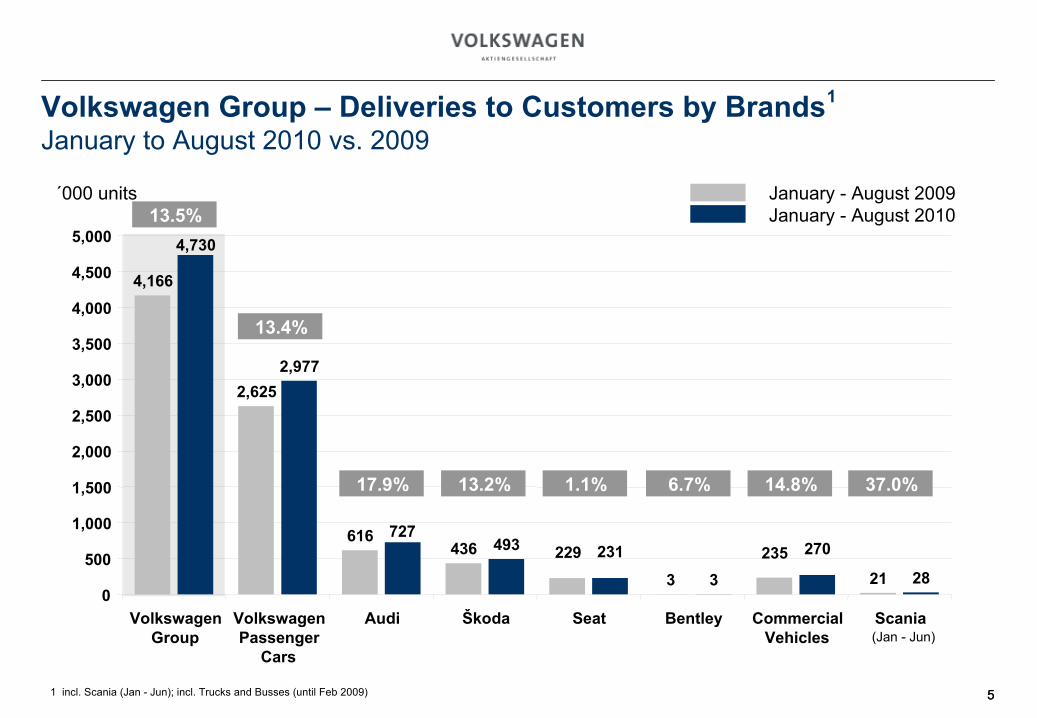
Volkswagen Group –
Deliveries to Customers by Brands January to August 2010 vs. 2009
1
´000 units January
-
August 2009January
-
August 2010
1 incl. Scania (Jan -
Jun); incl. Trucks and Busses (until
Feb 2009)
213 28
436 229 235
4,166
2,625
616
3
231493 270
4,730
2,977
727
0
500
1,000
1,500
2,000
2,500
3,000
3,500
4,000
4,500
5,000
VolkswagenGroup
VolkswagenPassenger
Cars
Audi Škoda Seat Bentley CommercialVehicles
Scania
13.5%
13.4%
17.9% 13.2% 1.1% 6.7% 14.8% 37.0%
(Jan -
Jun)
66
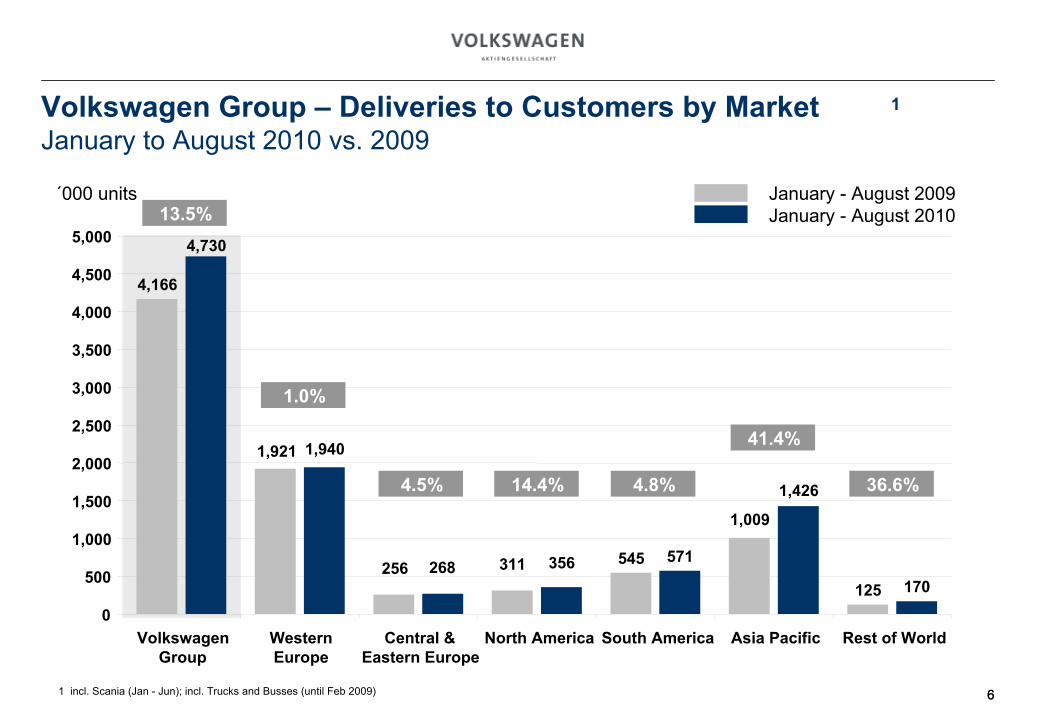
Volkswagen Group –
Deliveries to Customers by Market January to August 2010 vs. 2009
1
´000 units January
-
August 2009January
-
August 2010
1 incl. Scania (Jan -
Jun); incl. Trucks and Busses (until
Feb 2009)
125 170
1,921
545256 311
1,009
4,166
1,426
1,940
571268 356
4,730
0
500
1,000
1,500
2,000
2,500
3,000
3,500
4,000
4,500
5,000
VolkswagenGroup
WesternEurope
Central &Eastern Europe
North America South America Asia
Pacific Rest of World
13.5%
1.0%
4.5% 14.4% 4.8%
41.4%
36.6%
77
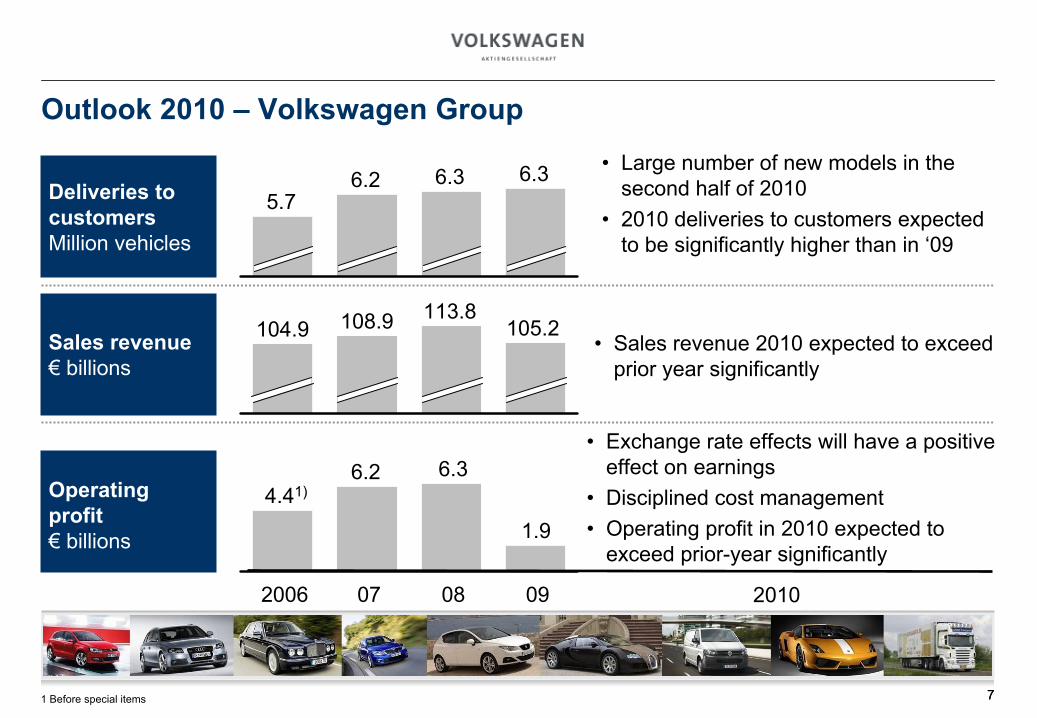
2010
1.9
09
6.3
08
6.2
07
4.41)
2006
Sales revenue€
billions
Operating profit€
billions
105.2113.8108.9104.9
6.36.36.25.7Deliveries to
customersMillion vehicles
•
Large number of new models in the second half of 2010
•
2010 deliveries to customers expected to be significantly higher than in ‘09
•
Sales revenue 2010 expected to exceed prior year significantly
•
Exchange rate effects will have a positive effect on earnings
•
Disciplined cost management•
Operating profit in 2010 expected to exceed prior-year significantly
1 Before special items
Outlook 2010 –
Volkswagen Group
88
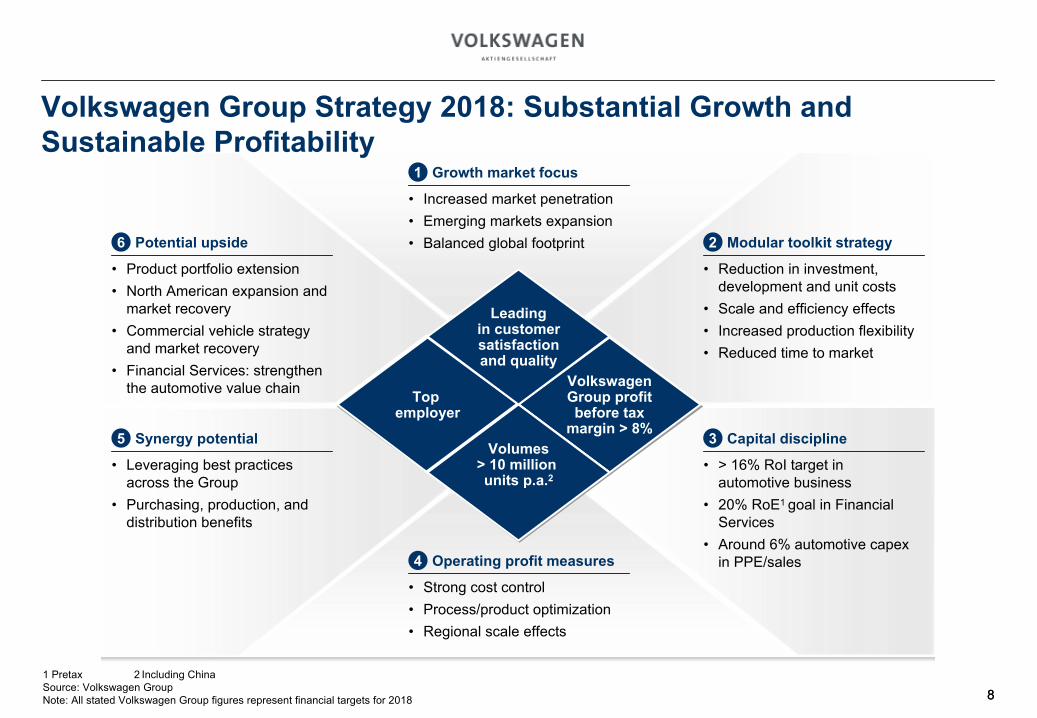
Volkswagen Group Strategy 2018: Substantial Growth and Sustainable Profitability
Top employer
Volkswagen
Group profit
before tax
margin > 8%Volumes
> 10 million units p.a.2
Leading
in customer
satisfaction
and quality
1 Growth market focus
•
Increased market penetration•
Emerging markets expansion•
Balanced global footprint 2 Modular toolkit strategy
•
Reduction in investment, development and unit costs
•
Scale and efficiency effects•
Increased production flexibility•
Reduced time to market
3 Capital discipline
•
> 16% RoI
target in automotive business
•
20% RoE1 goal in Financial Services
•
Around 6% automotive capex in PPE/sales4 Operating profit measures
•
Strong cost control•
Process/product optimization•
Regional scale effects
5 Synergy potential
•
Leveraging best practices across the Group
•
Purchasing, production, and distribution benefits
6 Potential upside
•
Product portfolio extension•
North American expansion and market recovery
•
Commercial vehicle strategy and market recovery
•
Financial Services: strengthen the automotive value chain
1 Pretax 2 Including ChinaSource: Volkswagen Group Note: All stated Volkswagen Group figures represent financial targets for 2018

999
Volkswagen Offers Diversified Economic Exposure through Attractive Mix of Emerging and Mature Markets
EmergingMarkets
47%
MatureMarkets
53% 27%
60%
Mature Markets
EmergingMarkets
Volkswagen Group 2018(based on units)Market growth 2009 -
18Volkswagen Group 2009(based on units)
Source: Global Insight, Volkswagen GroupNote: Market = Cars and LCVs; Mature markets: Western Europe, US, Canada, Japan, Australia and New Zealand; all other countries defined as emerging markets
EmergingMarkets
52%
MatureMarkets
48%
1010
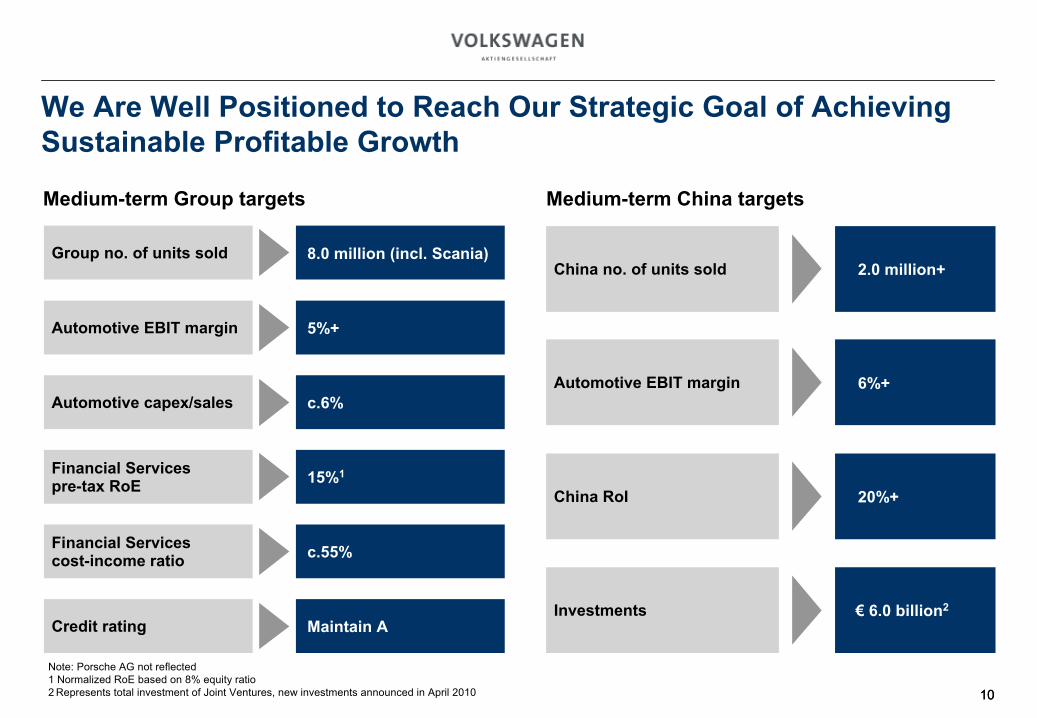
We Are Well Positioned to Reach Our Strategic Goal of Achieving Sustainable Profitable Growth
Medium-term Group targets Medium-term China targets
Group no. of units sold
Automotive EBIT margin
Financial Services pre-tax RoE
Credit rating
Financial Services cost-income ratio
Automotive capex/sales
China no. of units sold
Automotive EBIT margin
China RoI
Investments
Note: Porsche AG not reflected1 Normalized RoE
based on 8% equity ratio2 Represents total investment of Joint Ventures, new investments announced in April 2010
8.0 million (incl. Scania)
5%+
c.6%
15%1
c.55%
Maintain A
2.0 million+
6%+
20%+
€
6.0 billion2
1111
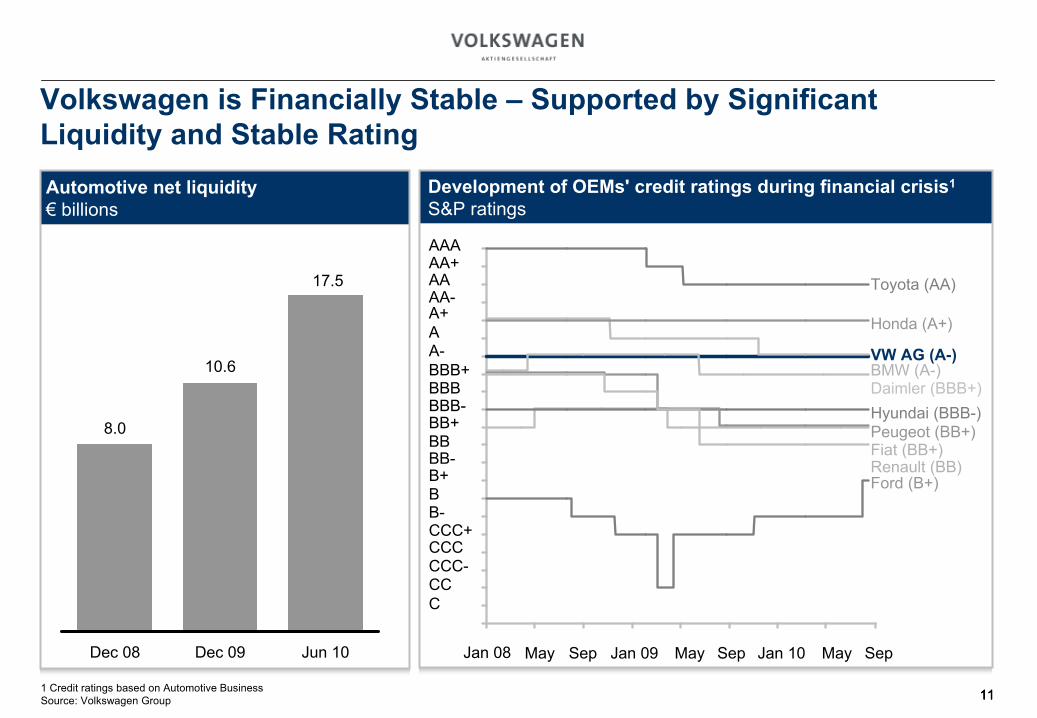
Volkswagen is Financially Stable –
Supported by Significant Liquidity and Stable RatingAutomotive net liquidity€
billions
Jun 10
17.5
Dec 09
10.6
Dec 08
8.0
1 Credit ratings based on Automotive BusinessSource: Volkswagen Group 11
Development of OEMs' credit ratings during financial crisis1
S&P ratings
Jan Mai Sep Jan Mai Sep Jan Mai Sep
AAA
Toyota (AA)
Honda (A+)
VW AG (A-)BMW (A-)Daimler (BBB+)Hyundai (BBB-)Peugeot (BB+)Fiat (BB+)Renault (BB)Ford (B+)
AA+AAAA-A+AA-BBB+BBBBBB-BB+BBBB-B+BB-CCC+CCCCCC-CCC
May Sep Jan 09 May Sep Jan 10 May SepJan 08
1212
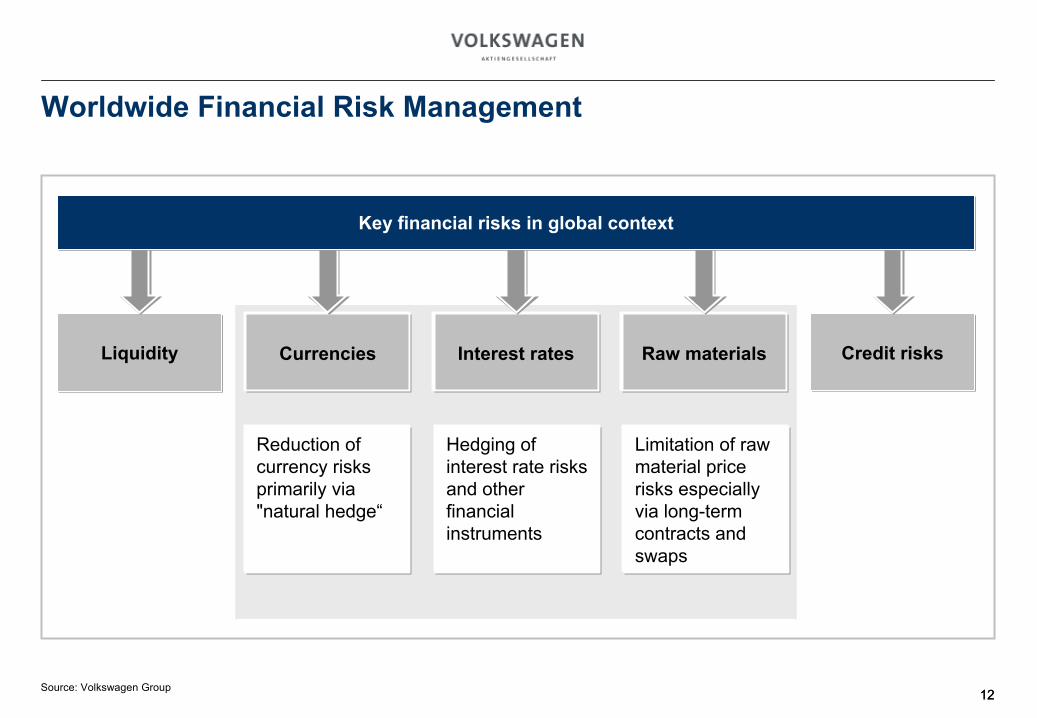
Worldwide Financial Risk Management
Credit risksRaw materialsInterest ratesCurrenciesLiquidity
Hedging of interest rate risks and other financial instruments
Limitation of raw material price risks especially via long-term contracts and swaps
Reduction of currency risks primarily via "natural hedge“
Key financial risks in global context
Source: Volkswagen Group
1313
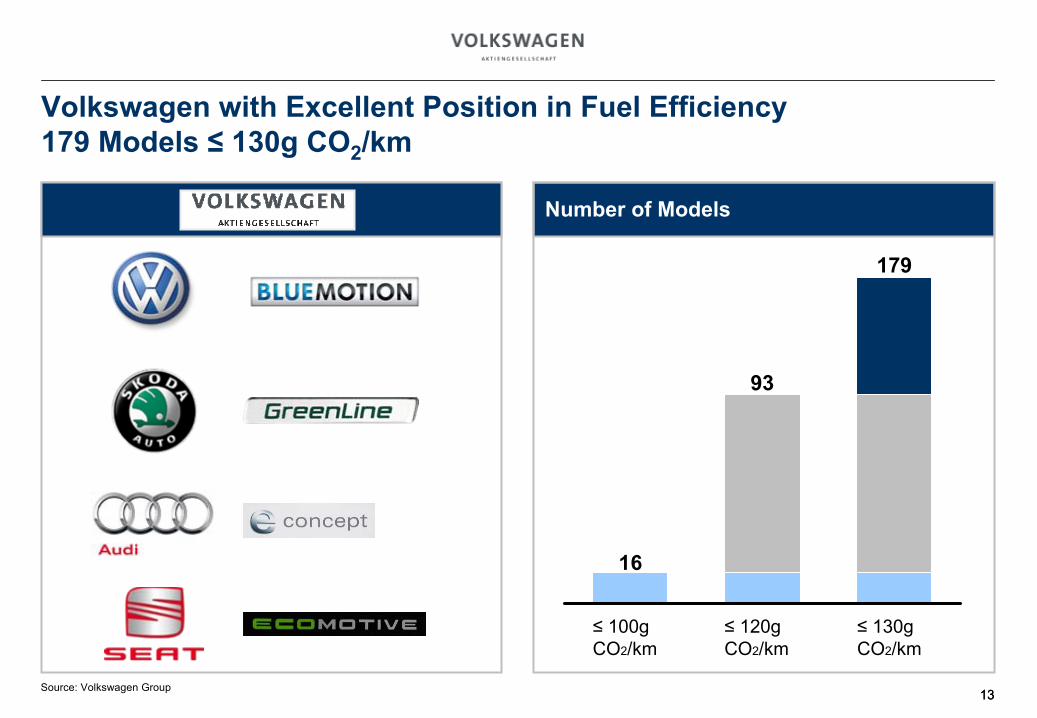
Volkswagen with Excellent Position in Fuel Efficiency 179 Models ≤
130g CO2
/km
16
≤
130g CO2/km
179
≤
120g CO2/km
93
≤
100g CO2/km
Number of Models
Source: Volkswagen Group
1414
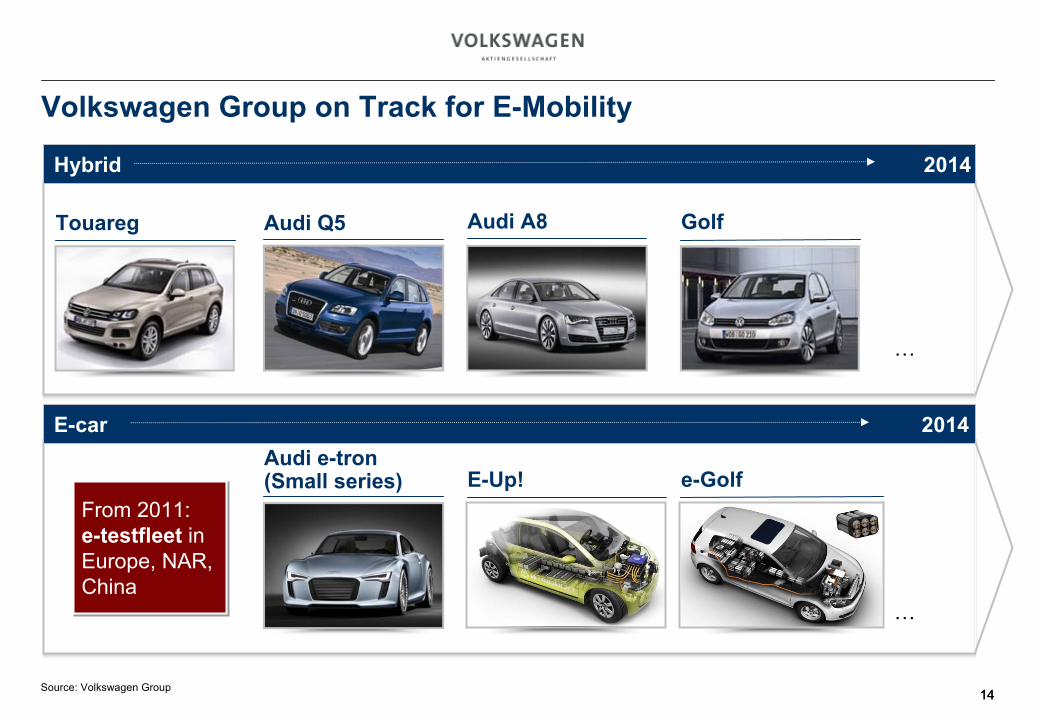
Volkswagen Group on Track for E-Mobility
Hybrid 2014
Touareg Audi Q5 Audi A8
Audi e-tron (Small series) e-GolfE-Up!
Golf
…
…
From 2011: e-testfleet
in Europe, NAR, China
E-car 2014
Source: Volkswagen Group
1515
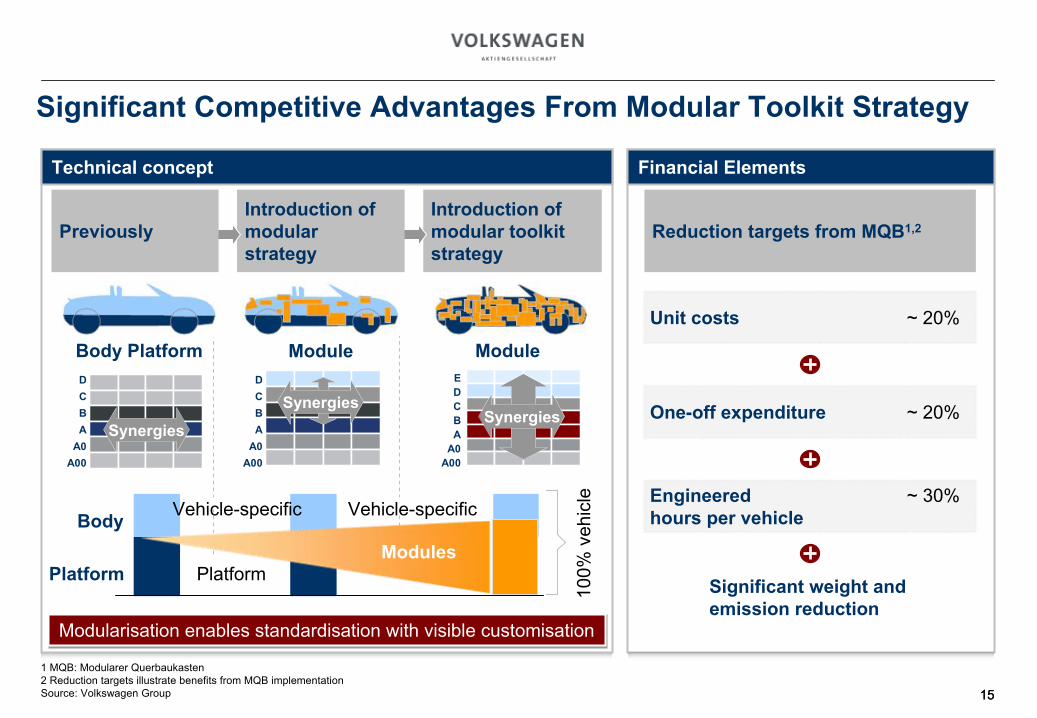
Significant Competitive Advantages From Modular Toolkit Strategy
1 MQB: Modularer
Querbaukasten2 Reduction targets illustrate benefits from MQB implementationSource: Volkswagen Group
Synergies
D
C
B
A
A0
A00
Introduction ofmodular toolkit strategy
Introduction ofmodular strategy
Previously
100%
veh
icle
Vehicle-specificVehicle-specific
Platform
Body
PlatformModules
ModuleModuleBody PlatformD
C
B
A
A0
A00
SynergiesE
D
C
B
A
A0
A00
Synergies
Technical concept
Modularisation
enables standardisation
with visible customisation
Reduction targets from MQB1,2
Financial Elements
Unit costs ~ 20%
One-off expenditure ~ 20%
Engineered
hours per vehicle
~ 30%
Significant weight and emission reduction
16
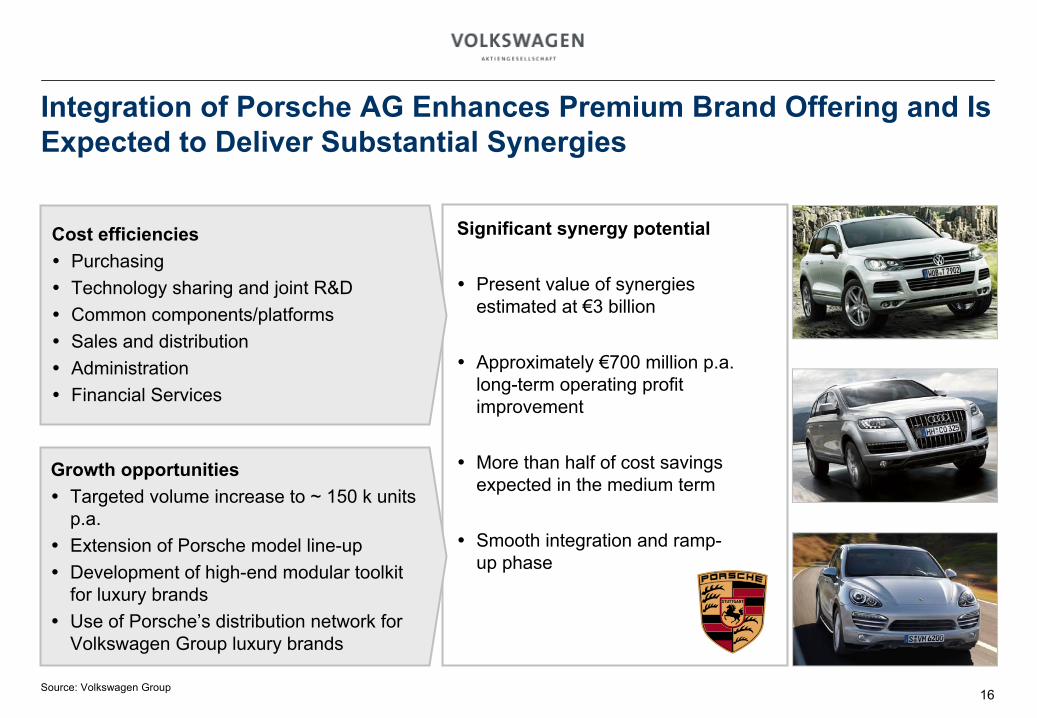
Integration of Porsche AG Enhances Premium Brand Offering and Is Expected to Deliver Substantial Synergies
Cost efficiencies
Purchasing
Technology sharing and joint R&D
Common components/platforms
Sales and distribution
Administration
Financial Services
Growth opportunities Targeted volume increase to ~ 150 k units
p.a. Extension of Porsche model line-up Development of high-end modular toolkit
for luxury brands Use of Porsche’s distribution network for
Volkswagen Group luxury brands
Significant synergy potential
Present value of synergies estimated at €3 billion
Approximately €700 million p.a. long-term operating profit improvement
More than half of cost savings expected in the medium term
Smooth integration and ramp-up phase
Source: Volkswagen Group
1717
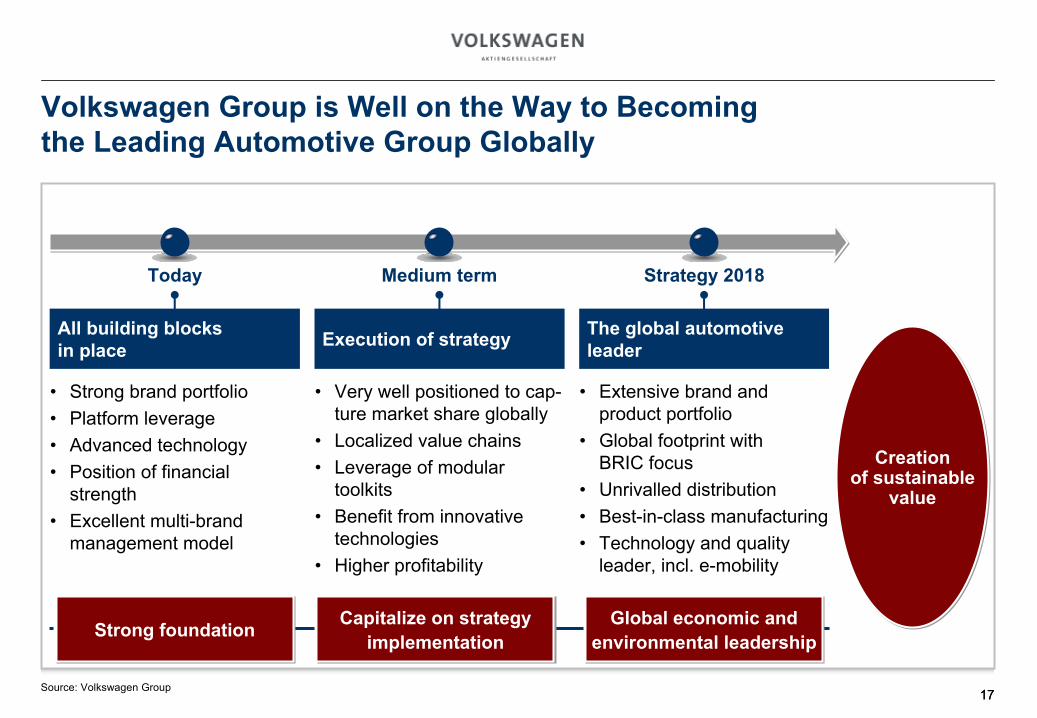
Volkswagen Group is Well on the Way to Becoming the Leading Automotive Group Globally
Creation of sustainable
value
Strong foundation Capitalize on strategy implementation
Global economic and environmental leadership
All building blocks in place Execution of strategy The global automotive
leader
Today Medium term Strategy 2018
•
Strong brand portfolio•
Platform leverage•
Advanced technology•
Position of financial strength
•
Excellent multi-brand management model
•
Very well positioned to cap-
ture
market share globally•
Localized value chains•
Leverage of modular toolkits
•
Benefit from innovative technologies
•
Higher profitability
•
Extensive brand and product
portfolio•
Global footprint with BRIC
focus•
Unrivalled distribution•
Best-in-class manufacturing•
Technology and quality leader, incl. e-mobility
Source: Volkswagen Group
1818
Volkswagen –
On the Road of Success
Part 1: Hans Dieter Pötsch, Member of the Board of Management
Part 2: Frank Fiedler, CFO Volkswagen Financial Services AG
Part 3: Dr. Christof
Spathelf, Senior Vice President of Volkswagen Group Manufacturing Overseas
19
Creating value
–
Our
Business Model
Volkswagen Financial Services:
Company Overview
Financial Basis
Preparing for the Future –
Our Strategy 2018
20
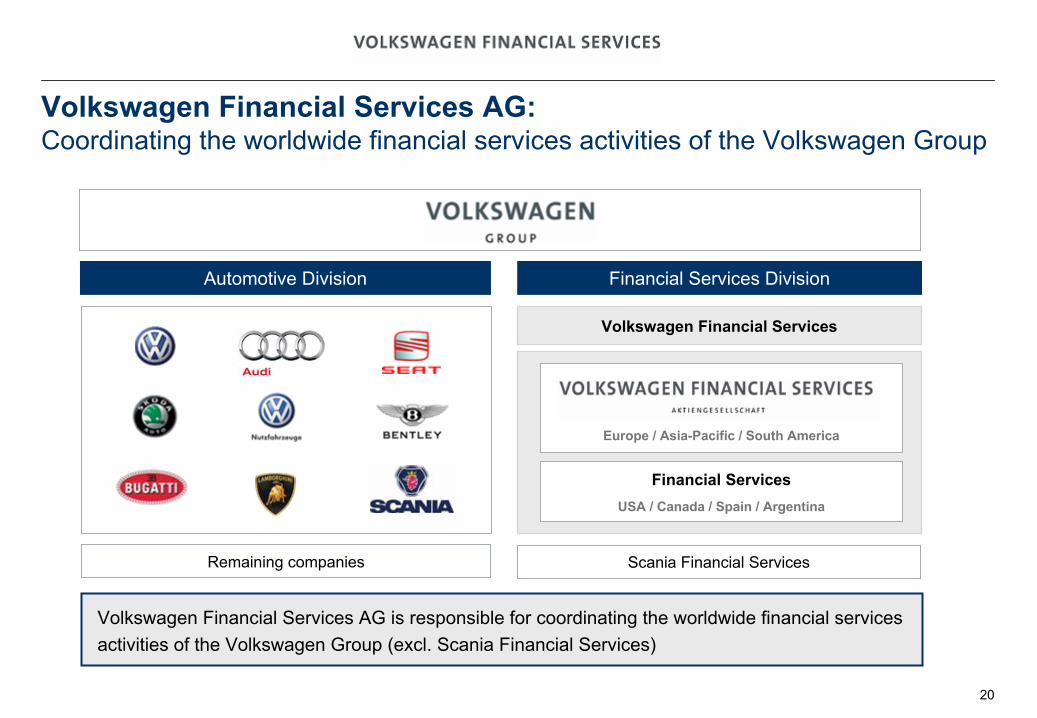
Scania Financial Services
Volkswagen Financial Services
Europe / Asia-Pacific / South America
Financial ServicesUSA / Canada / Spain / Argentina
Financial Services DivisionAutomotive Division
Remaining companies
Volkswagen Financial Services AG: Coordinating the worldwide financial services activities of the Volkswagen Group
Volkswagen Financial Services AG is responsible for coordinating
the worldwide financial services activities of the Volkswagen Group (excl. Scania Financial Services)
21
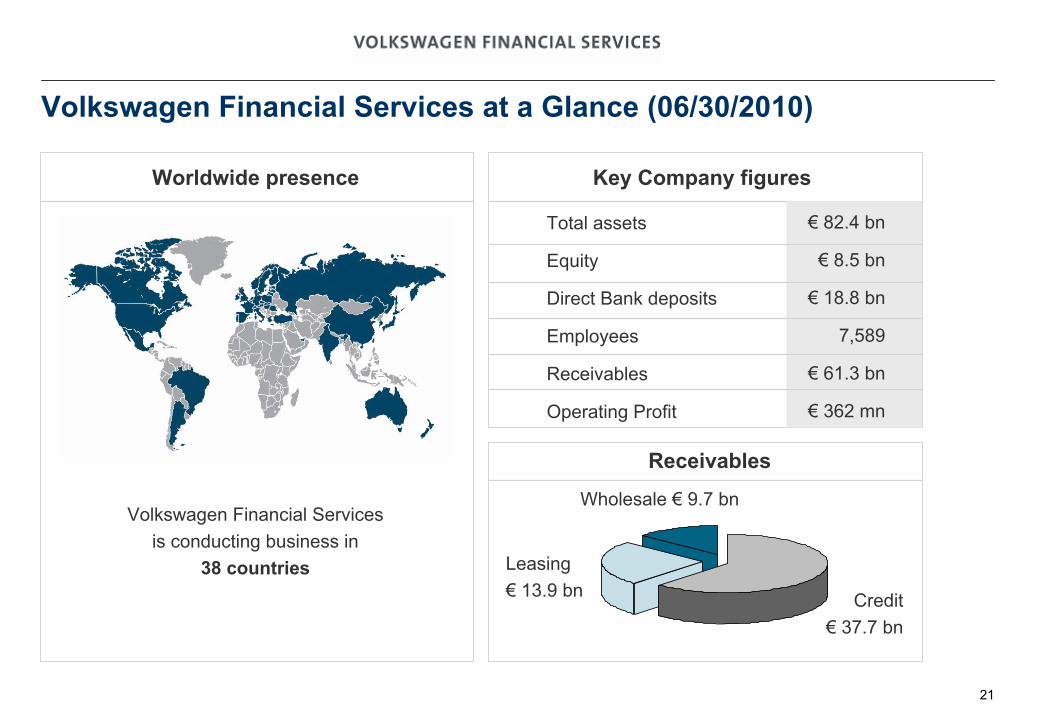
Total assets
Equity
Direct Bank deposits
Employees
Receivables
Operating
Profit
€
82.4 bn
€ 8.5 bn
€ 18.8 bn
7,589
€ 61.3 bn
€ 362 mn
Key Company figures
Volkswagen Financial Services at a Glance (06/30/2010)
Volkswagen Financial Services
is conducting business in 38 countries
Worldwide
presence
Receivables
Credit€
37.7 bn
Leasing€
13.9 bn
Wholesale €
9.7 bn
22
Creating value
–
Our
Business Model
Volkswagen Financial Services:
Company Overview
Financial Basis
Preparing for the Future –
Our Strategy 2018
23
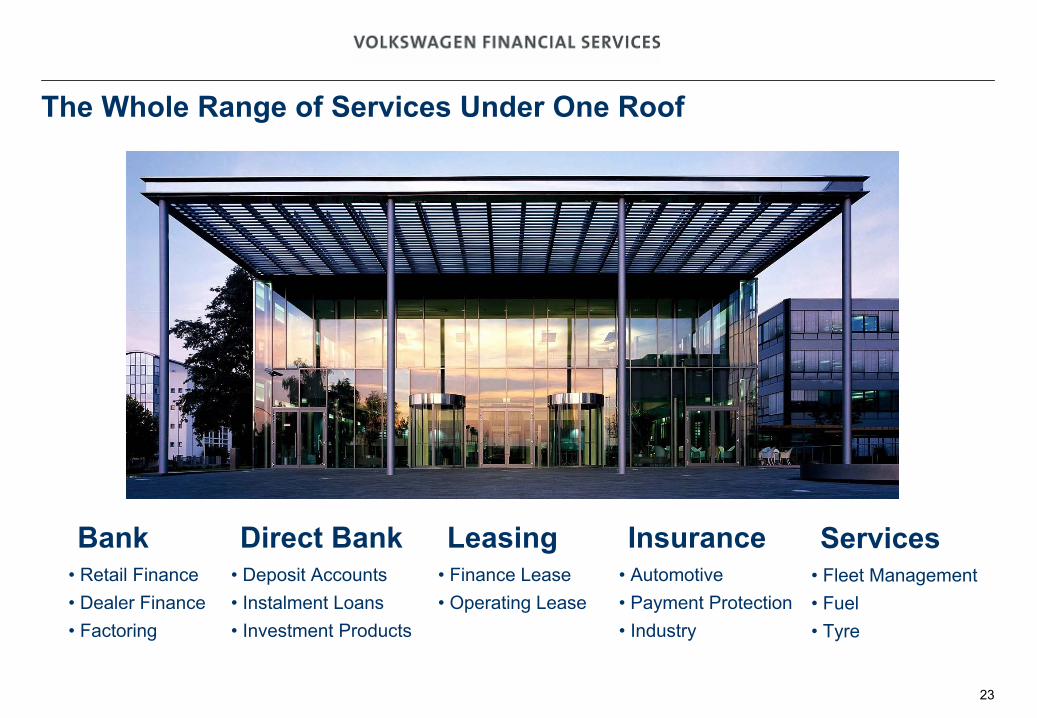
The Whole Range of Services Under One Roof
Bank• Retail Finance• Dealer Finance• Factoring
Direct Bank• Deposit Accounts• Instalment Loans• Investment Products
Leasing• Finance Lease• Operating Lease
Insurance• Automotive • Payment Protection • Industry
Services• Fleet Management• Fuel • Tyre
24
R&
D
Procurem
ent
Production
Sales
After S
ales
Credit
/ Leasing
Dealer Financing
Insurance
Total
Mobility
AutomotiveMobility
AutomotiveMobility
FinancialMobility
FinancialMobility
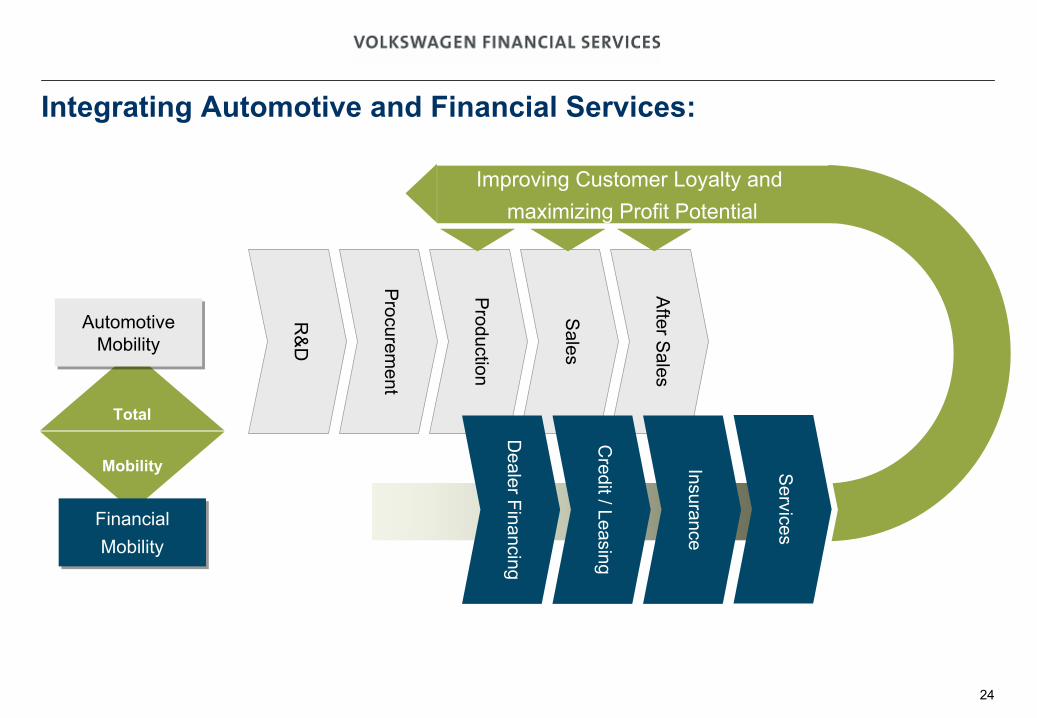
Integrating
Automotive and Financial Services:
Improving Customer Loyalty and maximizing Profit Potential
Services
25
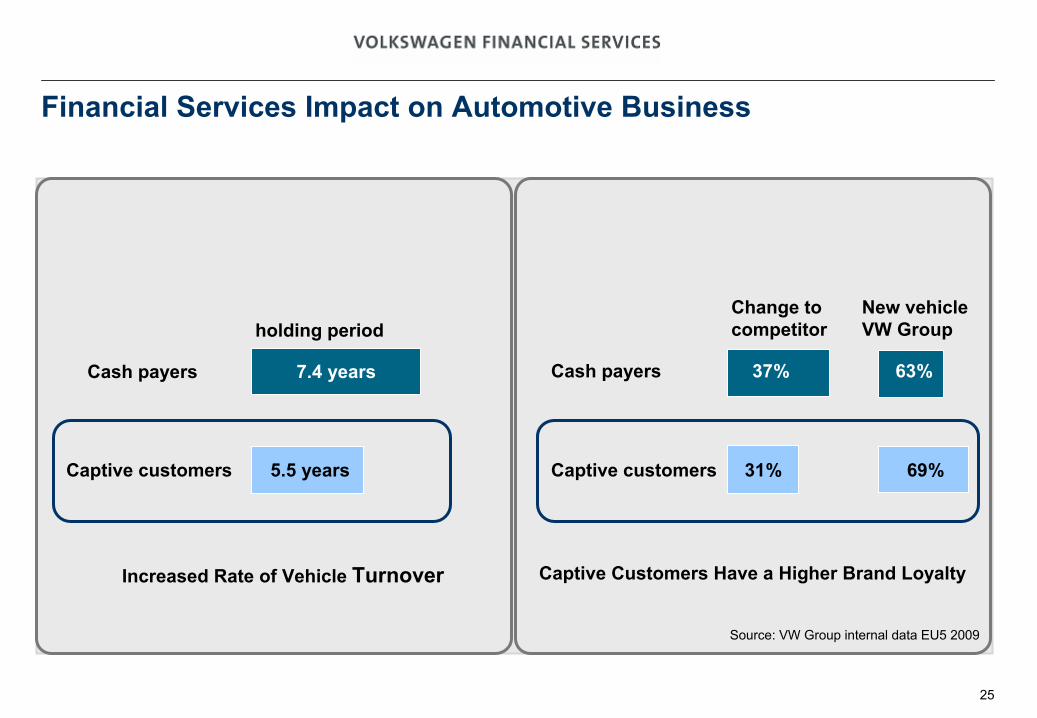
Financial Services Impact on Automotive Business
Cash payers
Captive customers
Increased Rate of Vehicle Turnover
5.5 years
7.4 years
Source: VW Group internal data EU5 2009
holding periodChange to competitor
New vehicle
VW Group
Cash payers
Captive customers 31%
37%
69%
63%
Captive Customers
Have
a Higher
Brand Loyalty
26
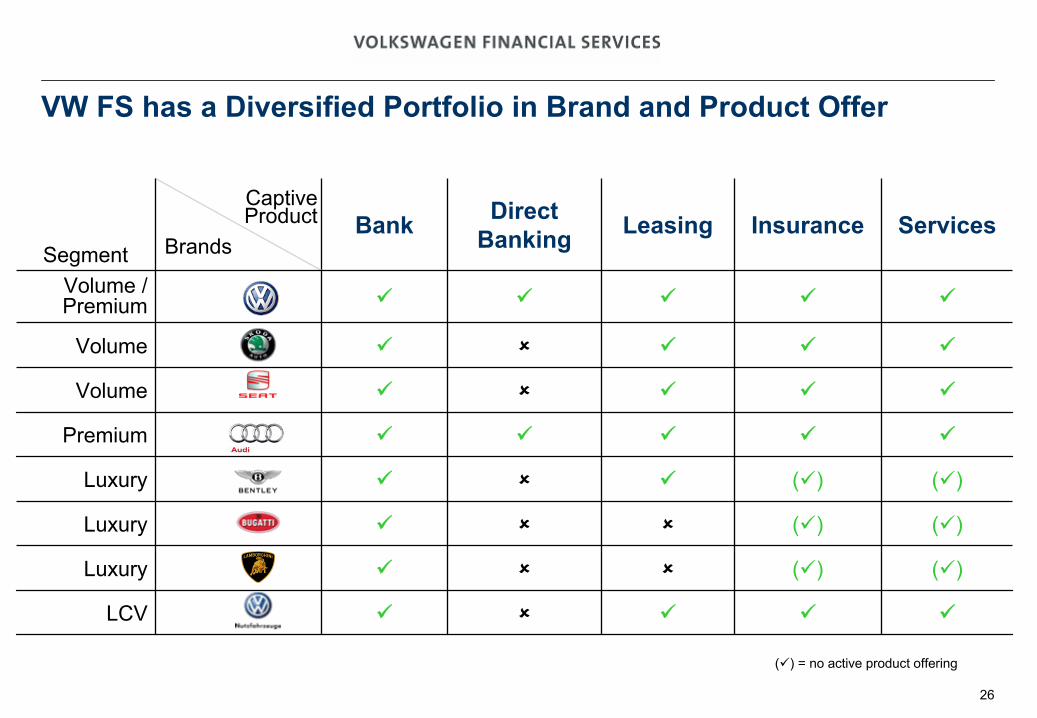
VW FS has a Diversified Portfolio in Brand and Product Offer
Segment
Captive
Product
BrandsBank Direct
Banking Leasing Insurance Services
Volume
/ Premium
Volume
Volume
Premium
Luxury () ()
Luxury () ()
Luxury () ()
LCV
() = no active product offering

27
Creating value
–
Our
Business Model
Volkswagen Financial Services:
Company Overview
Financial Basis
Preparing for the Future –
Our Strategy 2018
28
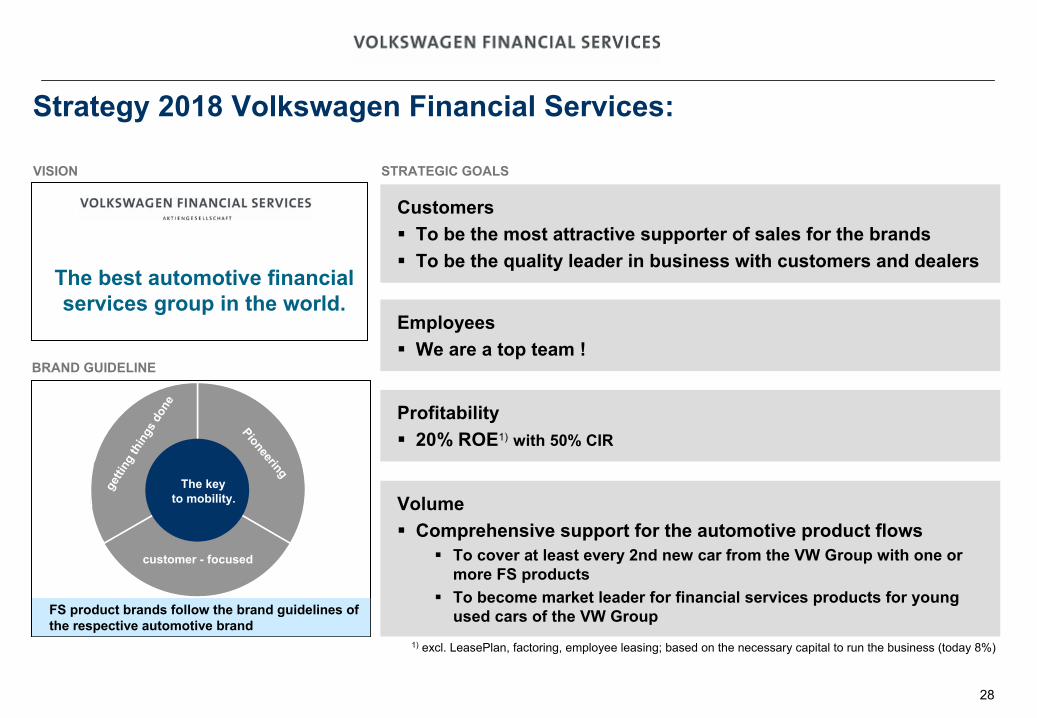
The best automotive financial services group in the world.
VISION
BRAND GUIDELINE
STRATEGIC GOALS
1)
excl. LeasePlan, factoring, employee leasing; based on the necessary capital to run the business (today 8%)
Strategy 2018 Volkswagen Financial Services:
FS product brands follow the brand guidelines of the respective automotive brand
getti
ng th
ings
don
e
Pioneering
customer -
focused
The keyto mobility.
Customers
To be the most attractive supporter of sales for the brands
To be the quality leader in business with customers and dealers
Volume
Comprehensive support for the automotive product flows
To cover at least every 2nd new car from the VW Group with one or more FS products
To become market leader for financial services products for young used cars of the VW Group
Profitability
20% ROE1)
with 50% CIR
Employees
We are a top team !
29
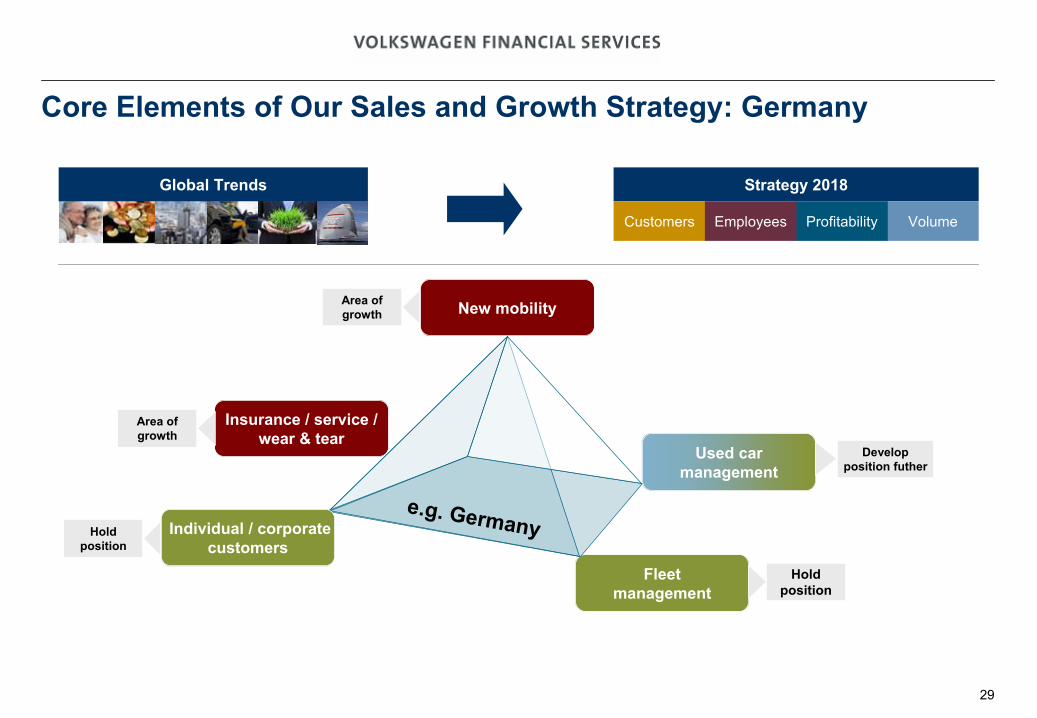
Core
Elements of Our
Sales and Growth Strategy: Germany
FlottenmanagementFleet
management
Neue MobilitätNew mobility
Einzel-/Firmenkunden
Versicherung, Wartung und Verschleiß
Gebrauchtwagen-
management
Individual
/ corporate
customers
Insurance / service
/ wear
& tearUsed
car
management
Area
of growth
Area
of growth
Develop
position
futher
Hold position
Hold position
e.g. Germany
Strategy 2018
VolumeProfitabilityCustomers Employees
Global Trends
30
Used car management
Used
car
management
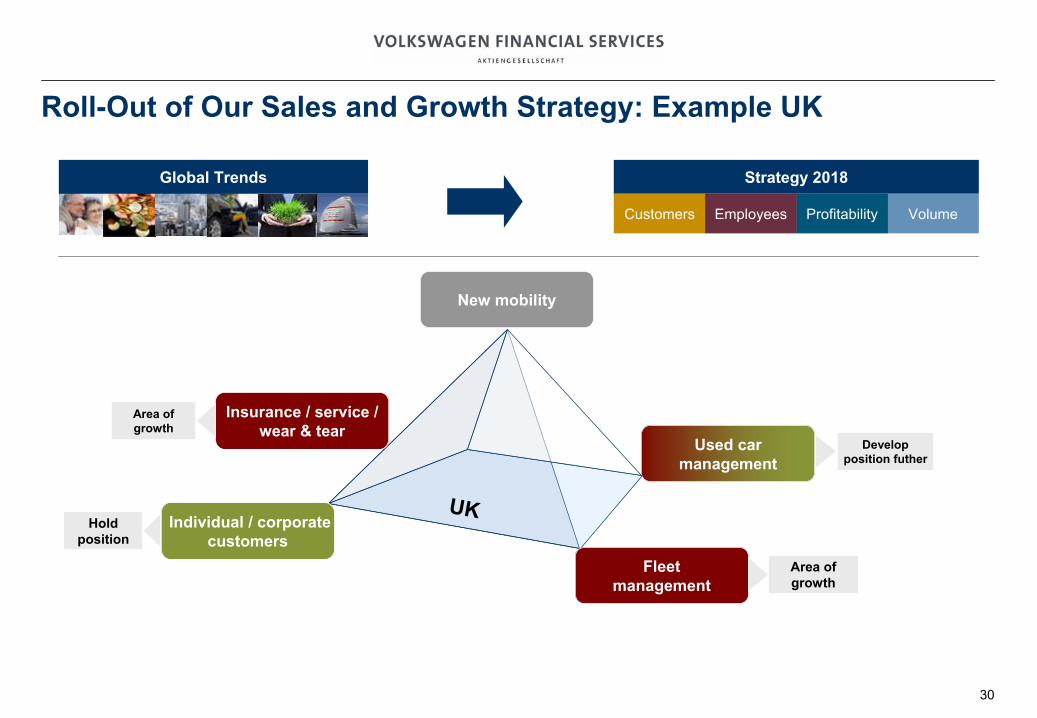
Roll-Out
of Our
Sales and Growth Strategy: Example
UK
New mobility
Insurance / service / wear & tear
Insurance / service
/ wear
& tear
Fleet
management
Fleet
management
Area
of growth
Area
of growth
UK
Develop
position
futher
Individual / corporate customers
Individual
/ corporate
customers
Hold position
Strategy 2018
VolumeProfitabilityCustomers Employees
Global Trends
31
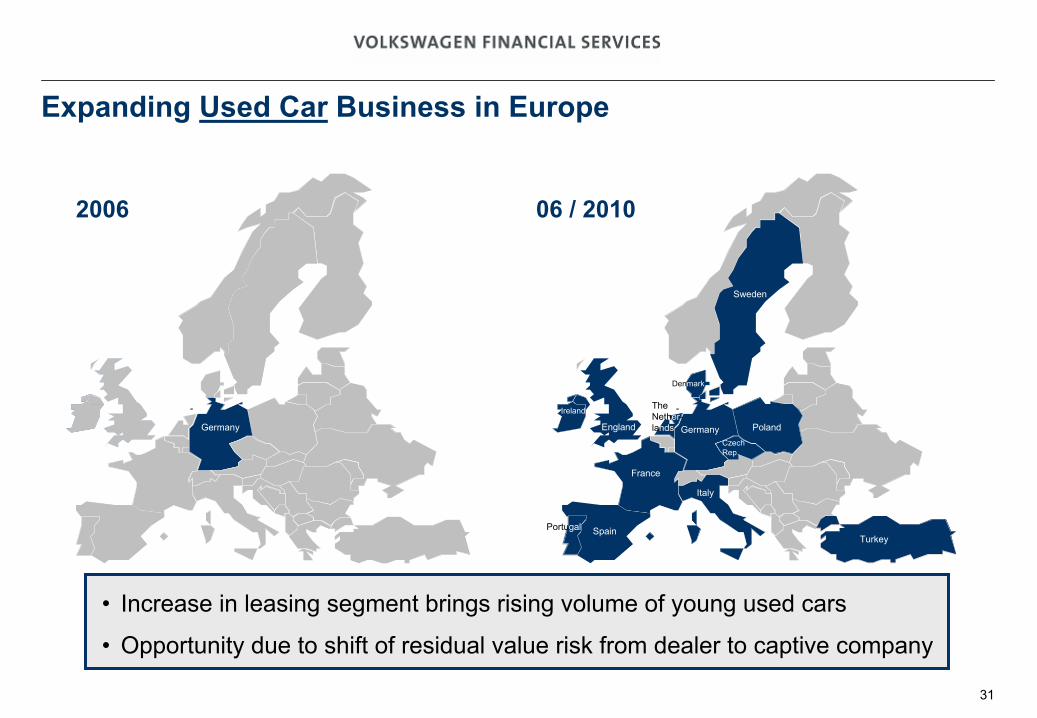
Expanding Used Car
Business in Europe
06 / 2010
-
2006
Sweden
-
England
Ireland
France
Spain
Italy
GermanyCzechRep.
Germany Poland
Turkey
Denmark
TheNether-lands
Portugal
•
Increase in leasing segment brings rising volume of young used cars
•
Opportunity due to shift of residual value risk from dealer to captive company
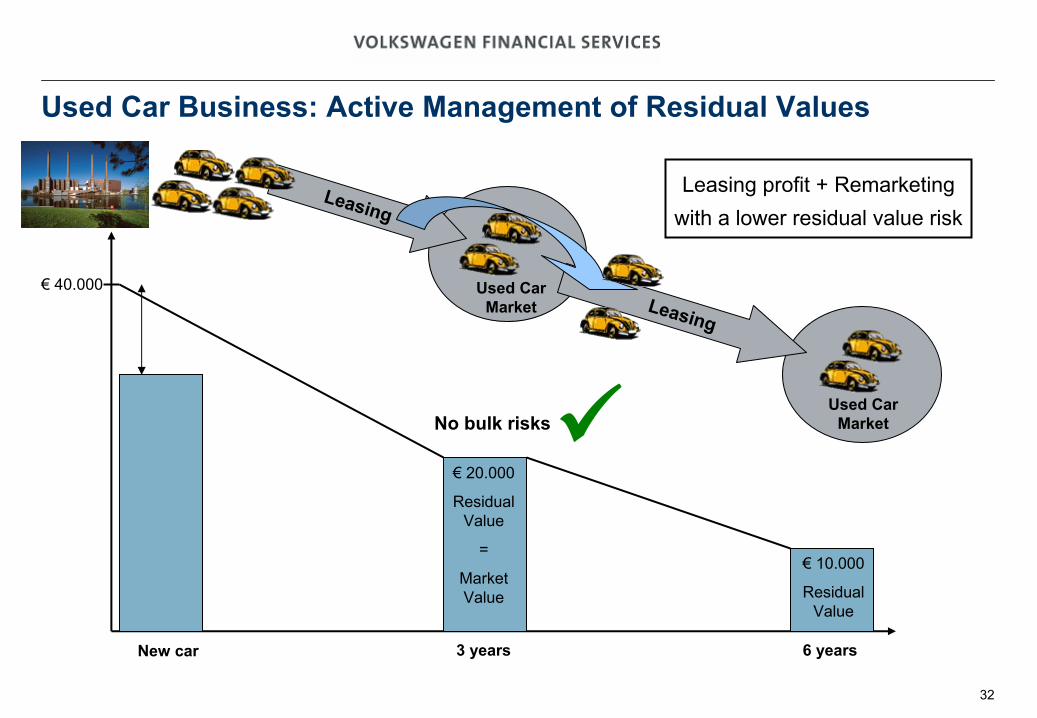
32
Used
Car Market
Used
Car Business: Active
Management of Residual Values
€
40.000
€
20.000
Residual Value
=
Market
Value
Leasing
€
10.000
Residual Value
New car 3 years 6 years
No bulk
risks
Leasing profit
+ Remarketing
with
a lower
residual value
risk
Leasing
Used
Car Market
33
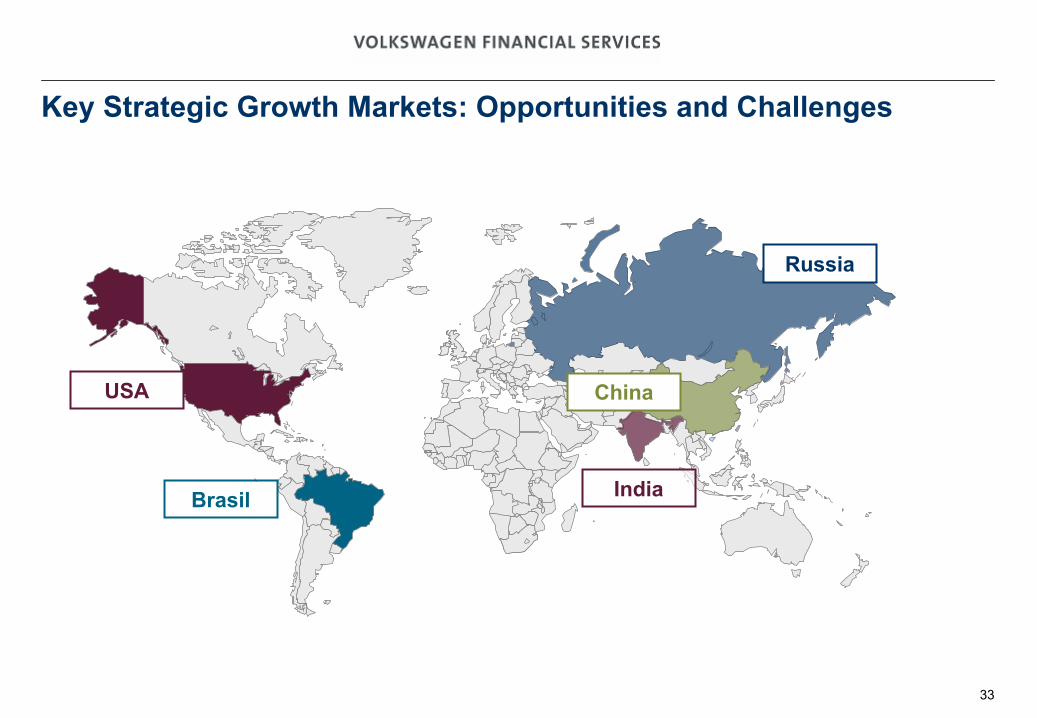
Key Strategic
Growth Markets: Opportunities
and Challenges
Russia
India
ChinaUSA
Brasil
34
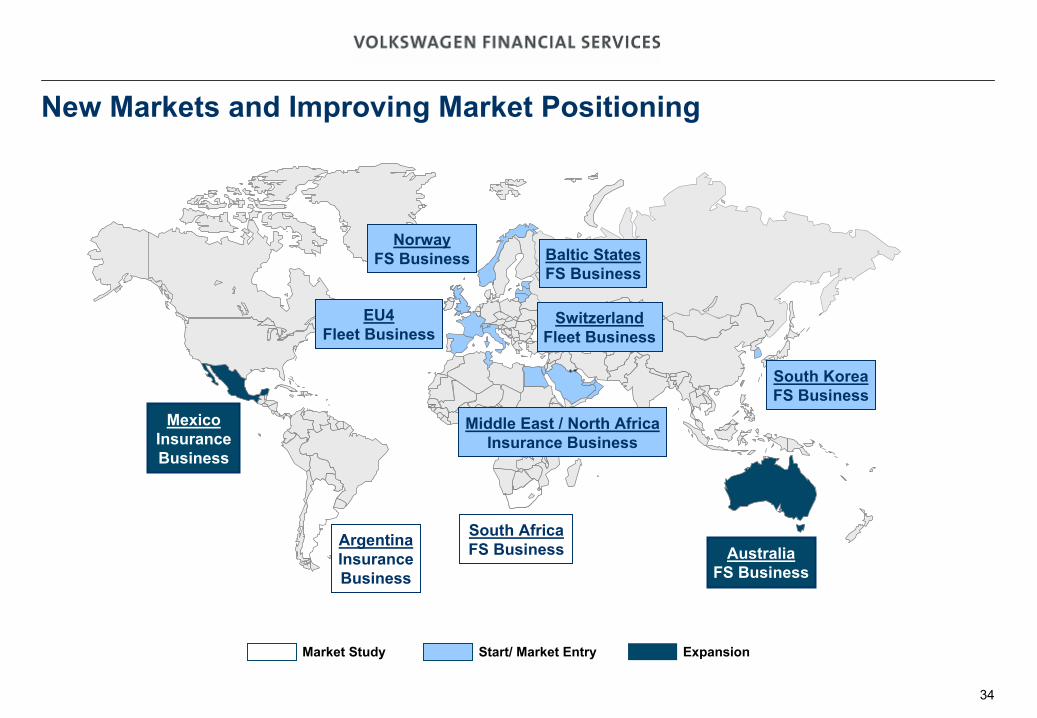
New Markets and Improving
Market Positioning
South Africa
FS Business
Middle East / North Africa
Insurance Business
Argentina
Insurance Business
MexicoInsurance Business
South KoreaFS Business
Australia FS Business
NorwayFS Business
EU4Fleet Business
Baltic States
FS Business
Switzerland Fleet Business
Market Study Start/ Market Entry Expansion
35
Creating value
–
Our
Business Model
Volkswagen Financial Services:
Company Overview
Financial Basis
Preparing for the Future –
Our Strategy 2018
36
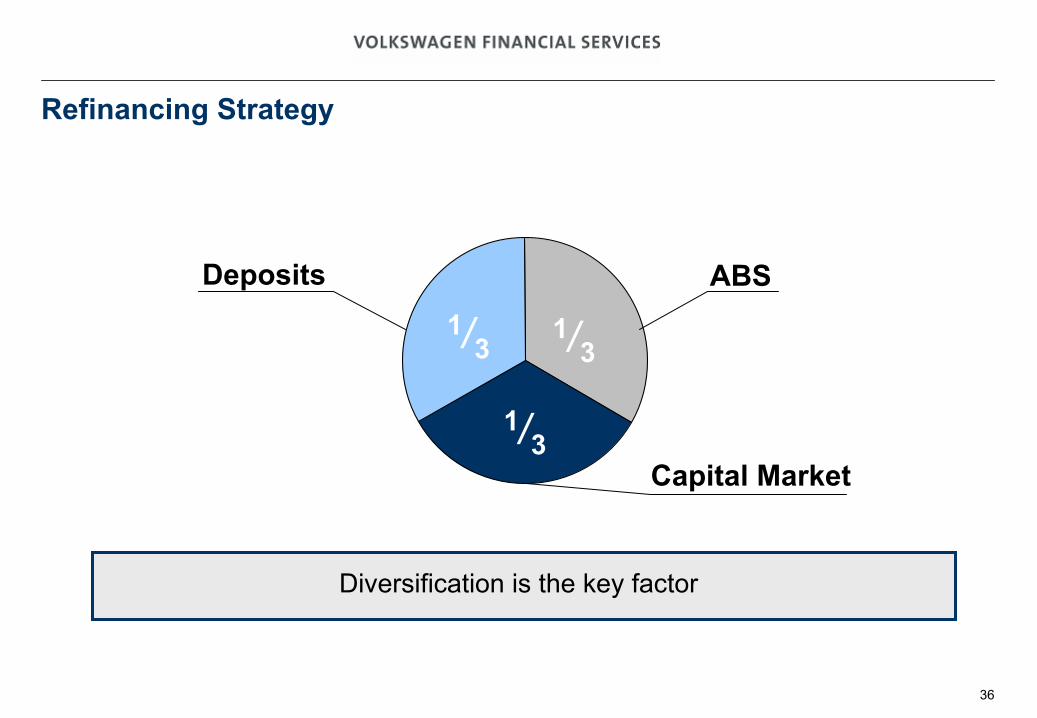
Refinancing Strategy
Diversification is the key factor
ABS
Capital Market
Deposits1/3
1/3
1/3
37
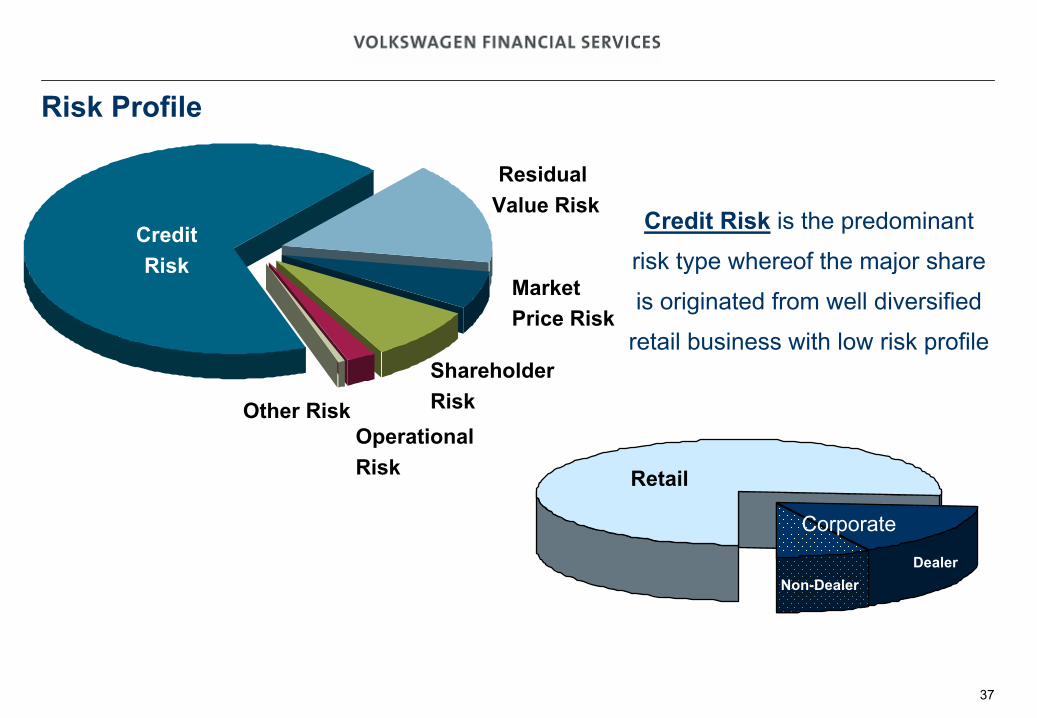
Risk Profile
Credit Risk
Residual Value Risk
Market Price Risk
Shareholder RiskOther
Risk
Credit Risk
is the predominant
risk type
whereof
the major
share
is originated
from
well diversified retail
business
with
low
risk profile
Retail
Operational Risk
Corporate
Non-DealerDealer
38
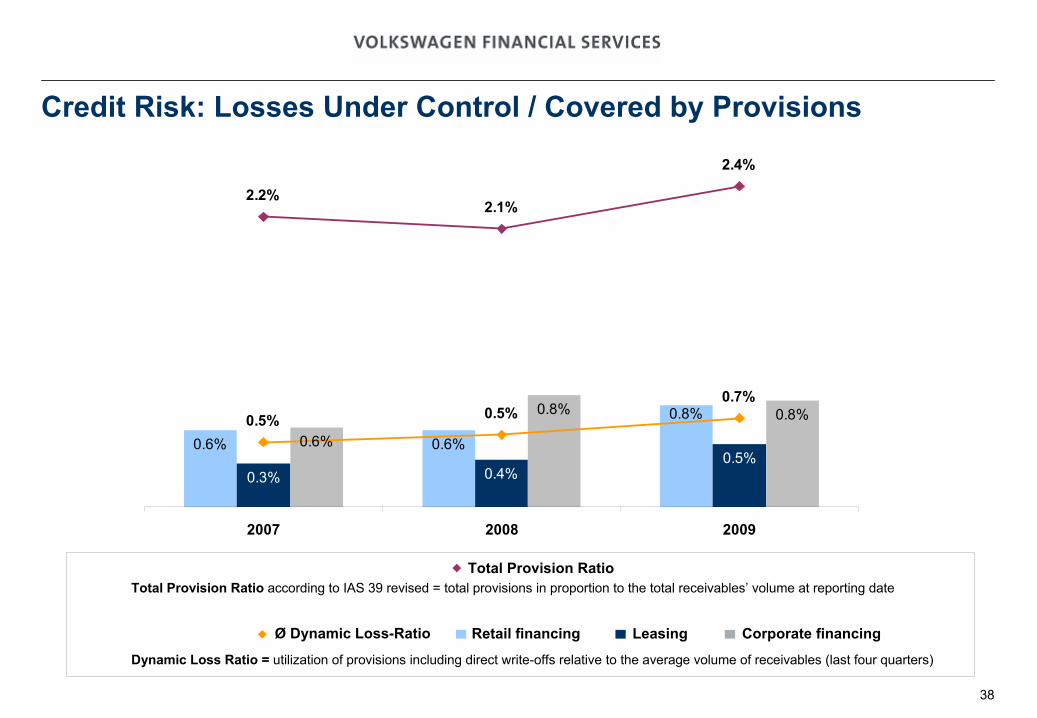
0.6% 0.6%
0.3% 0.4%0.5%
0.6%
0.8% 0.8%0.8%
2.2%2.1%
2.4%
0.5% 0.5%0.7%
2007 2008 2009
Credit Risk: Losses Under Control / Covered by Provisions
Retail financing Leasing Corporate financingØ
Dynamic Loss-Ratio
Total Provision Ratio
Dynamic Loss Ratio = utilization of provisions including direct write-offs relative to the average volume of receivables (last four quarters)
Total Provision Ratio
according to IAS 39 revised = total provisions in proportion to
the total receivables’ volume at reporting date
39
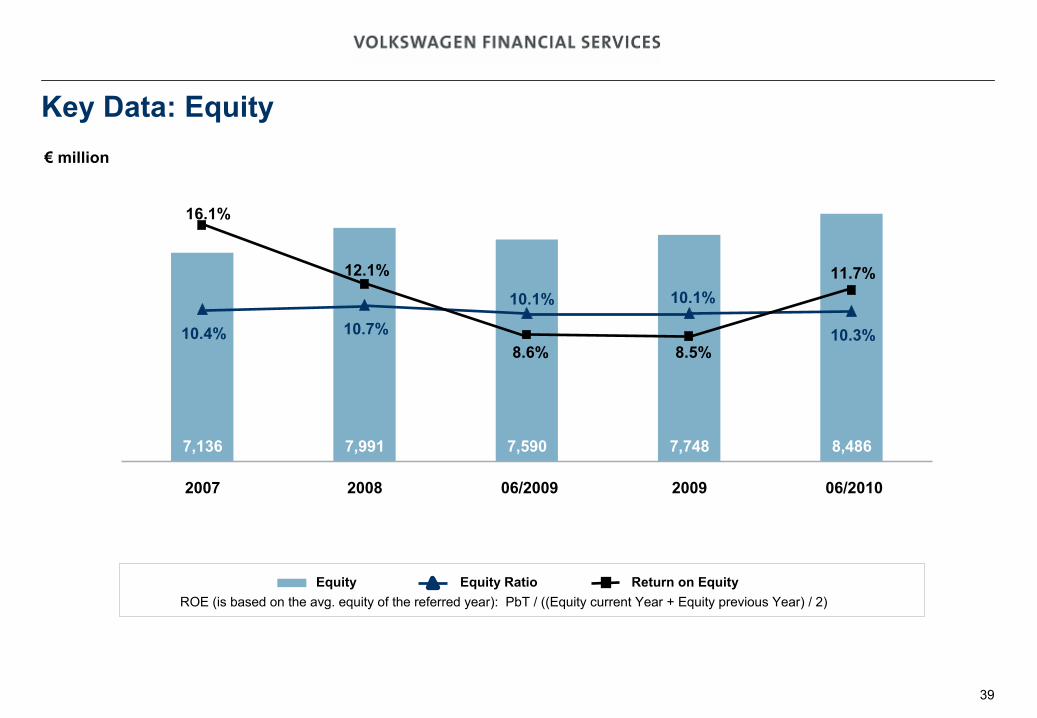
8,4867,7487,5907,9917,136
10.4% 10.7% 10.3%8.5%
16.1%
11.7%
8.6%
12.1%10.1%10.1%
2007 2008 06/2009 2009 06/2010
Equity Equity
Ratio Return on EquityROE (is
based
on the avg. equity
of the referred
year): PbT
/ ((Equity
current
Year
+ Equity
previous
Year) / 2)
€
million
Key Data: Equity
40
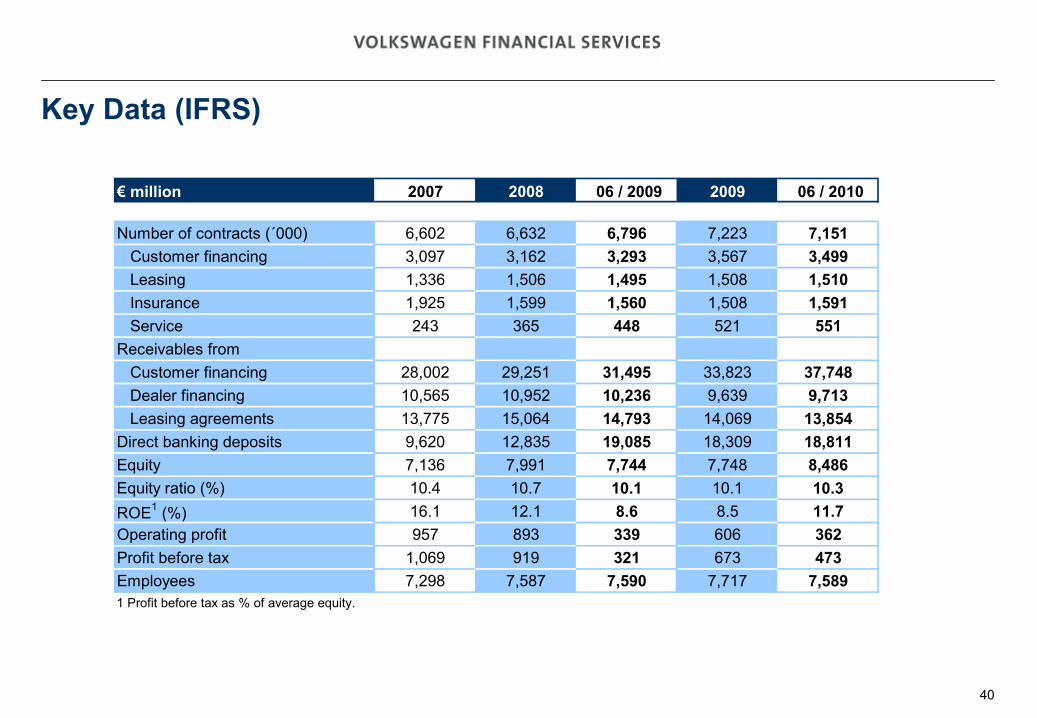
Key Data (IFRS)
€ million 2007 2008 06 / 2009 2009 06 / 2010
Number of contracts (´000) 6,602 6,632 6,796 7,223 7,151Customer financing 3,097 3,162 3,293 3,567 3,499Leasing 1,336 1,506 1,495 1,508 1,510Insurance 1,925 1,599 1,560 1,508 1,591Service 243 365 448 521 551
Receivables from Customer financing 28,002 29,251 31,495 33,823 37,748Dealer financing 10,565 10,952 10,236 9,639 9,713Leasing agreements 13,775 15,064 14,793 14,069 13,854
Direct banking deposits 9,620 12,835 19,085 18,309 18,811Equity 7,136 7,991 7,744 7,748 8,486Equity ratio (%) 10.4 10.7 10.1 10.1 10.3ROE1 (%) 16.1 12.1 8.6 8.5 11.7Operating profit 957 893 339 606 362Profit before tax 1,069 919 321 673 473Employees 7,298 7,587 7,590 7,717 7,5891 Profit before tax as % of average equity.
41
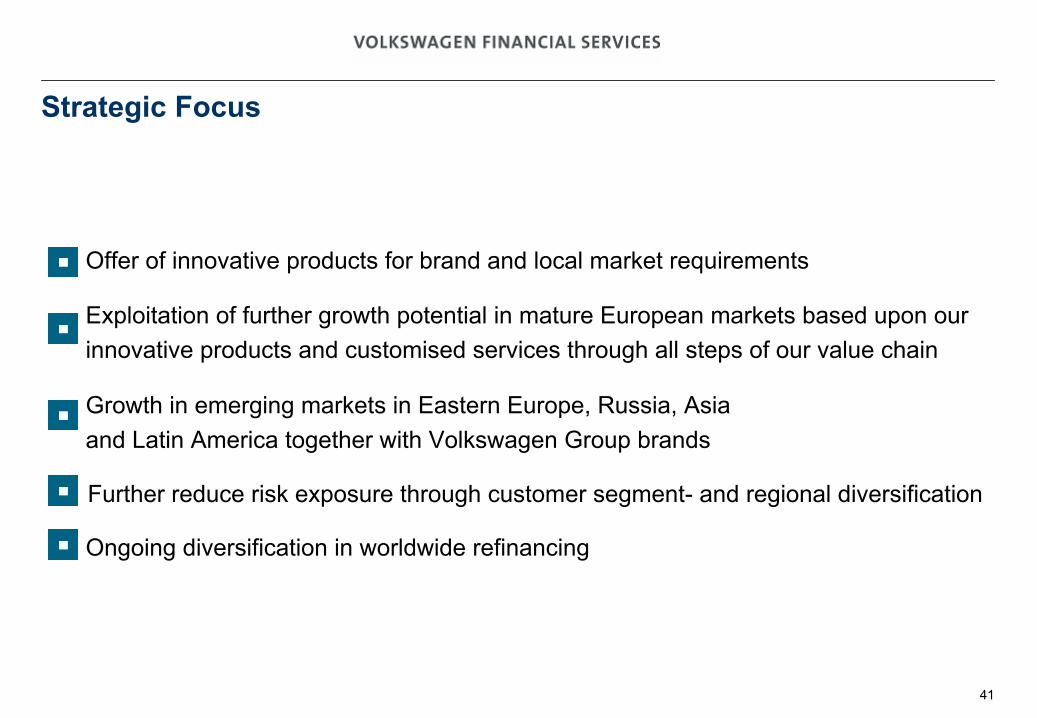
Strategic
Focus
Offer of innovative products for brand and local market requirements
Exploitation of further growth potential in mature European markets based upon our innovative products and customised services through all steps of
our value chain
Growth in emerging markets in Eastern Europe, Russia, Asia and Latin America together with Volkswagen Group brands
Ongoing diversification in worldwide refinancing
Further reduce risk exposure through customer segment-
and regional diversification
42
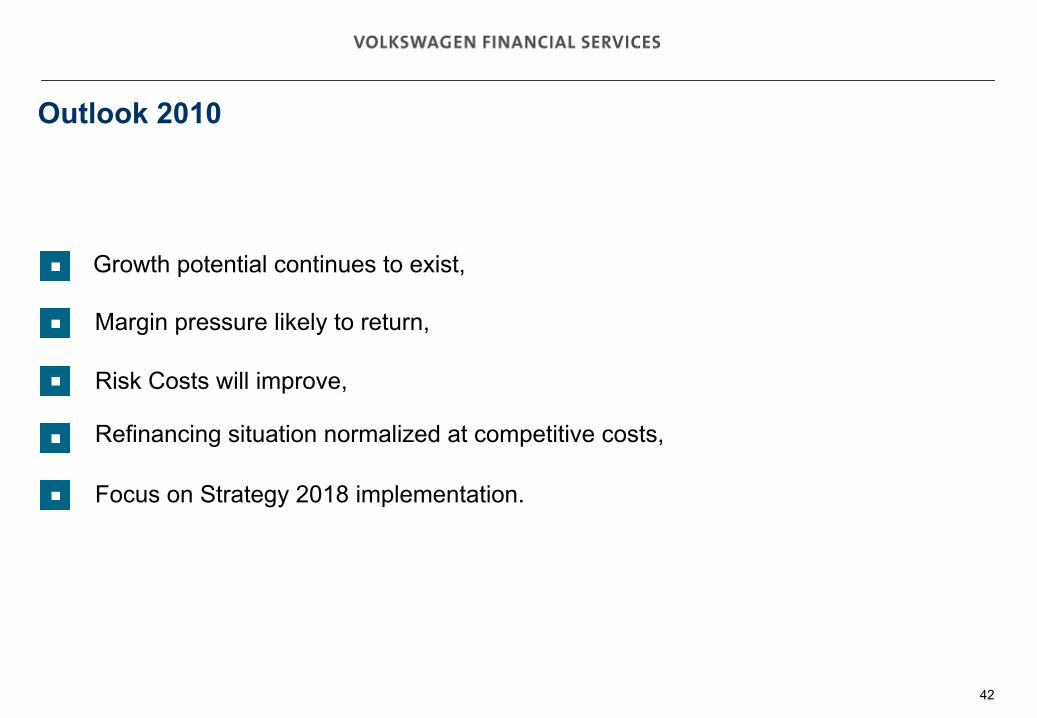
Risk Costs will improve,
Outlook 2010
Growth potential continues to exist,
Margin pressure likely to return,
Refinancing situation normalized at competitive costs,
Focus on Strategy 2018 implementation.
4343
Volkswagen –
On the Road of Success
Part 1: Hans Dieter Pötsch, Member of the Board of Management
Part 2: Frank Fiedler, CFO Volkswagen Financial Services AG
Part 3: Dr. Christof
Spathelf, Senior Vice President of Volkswagen Group Manufacturing Overseas
4444
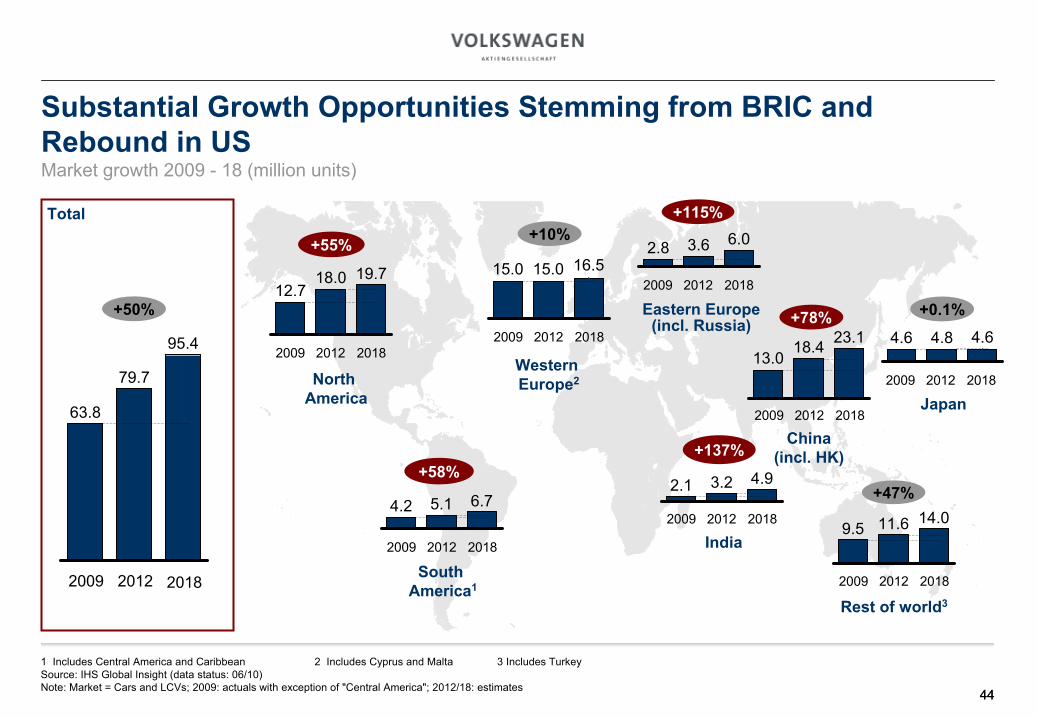
Substantial Growth
Opportunities Stemming from BRIC and Rebound in US
Market growth 2009 -
18 (million units)
1 Includes Central America and Caribbean
2 Includes Cyprus and Malta
3 Includes Turkey Source: IHS Global Insight (data status: 06/10)Note: Market = Cars and LCVs; 2009: actuals
with exception of "Central America"; 2012/18: estimates
Total
2009 2012 2018
19.712.7
18.016.515.015.0
+55% +10%
6.74.2 5.1
+58%
14.09.5 11.6
+47%
4.64.6 4.8
+0.1%23.1
13.018.4
+78%
6.03.62.8
+115%
North America
Western Europe2
Eastern Europe (incl. Russia)
China
(incl. HK)
4.92.1 3.2
+137%
South America1
Rest of world3
2009 2012 2018
95.4
63.8
79.7
+50%
Japan
India
2009 2012 2018
2009 2012 2018
2009 2012 2018
2009 2012 2018
2009 2012 2018
2009 2012 2018
2009 2012 2018
4545
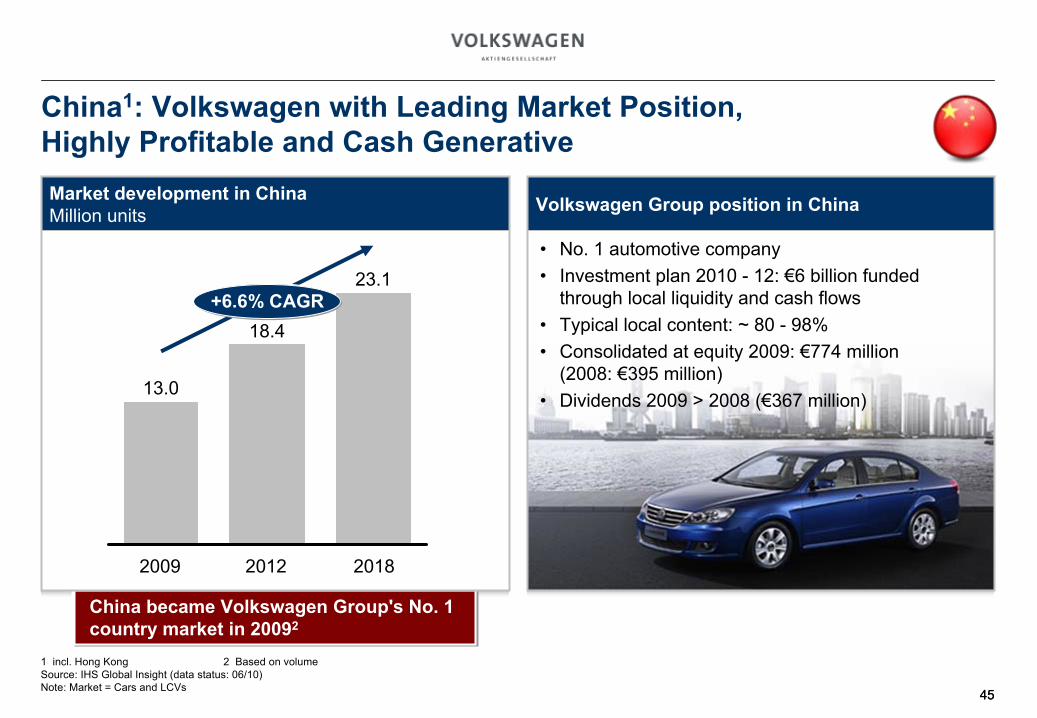
China1: Volkswagen with Leading Market Position, Highly Profitable and Cash Generative
Volkswagen Group position in China
•
No. 1 automotive company•
Investment plan 2010 -
12: €6 billion funded through local liquidity and cash flows
•
Typical local content: ~ 80 -
98%•
Consolidated at equity 2009: €774 million (2008: €395 million)
•
Dividends 2009 > 2008 (€367 million)
China became Volkswagen Group's No. 1 country market in 20092
Market development in China
Million units
+6.6% CAGR
2018
23.1
2012
18.4
2009
13.0
1 incl. Hong Kong
2 Based on volumeSource: IHS Global Insight (data status: 06/10)Note: Market = Cars and LCVs
4646
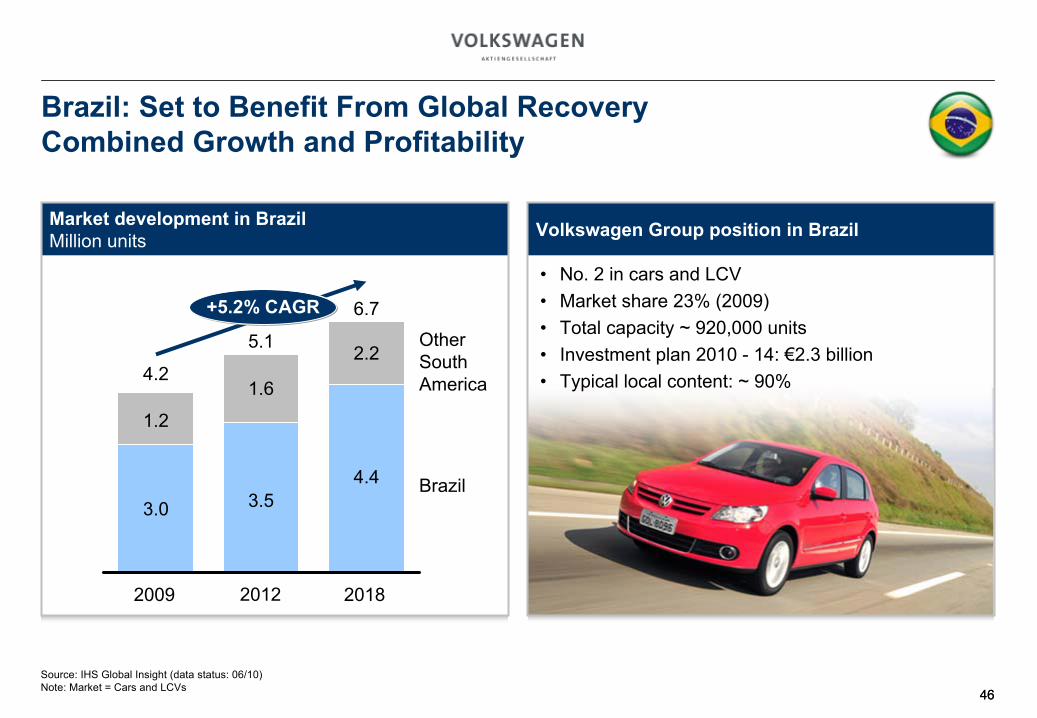
… k units p.a.
Brazil
Other
South
America
2018
6.7
4.4
2.2
2012
5.1
3.5
1.6
2009
4.2
3.0
1.2
Volkswagen Group position in Brazil
•
No. 2 in cars and LCV•
Market share 23% (2009)•
Total capacity ~ 920,000 units•
Investment plan 2010 -
14: €2.3 billion•
Typical local content: ~ 90%
Market development in Brazil
Million units
Brazil: Set to Benefit From Global Recovery Combined Growth and Profitability
Source: IHS Global Insight (data status: 06/10)Note: Market = Cars and LCVs
+5.2% CAGR
4747
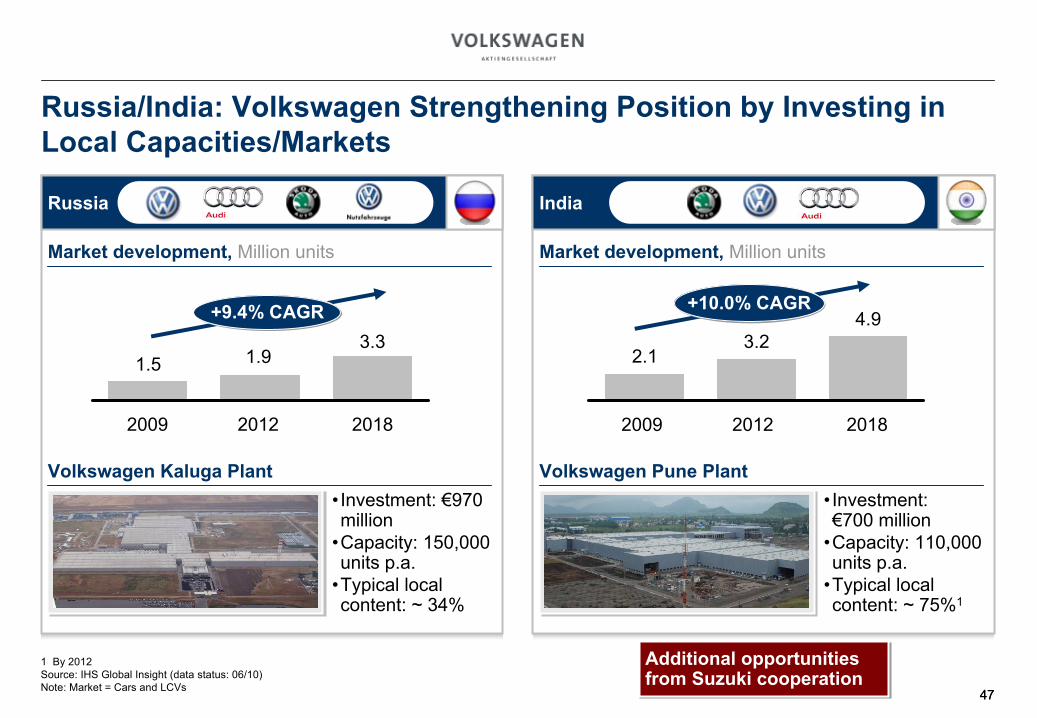
Russia/India: Volkswagen Strengthening Position by Investing in Local Capacities/Markets
3.3
2012
1.9
2009
1.5
2018
3.22.1
4.9
1 By 2012Source: IHS Global Insight (data status: 06/10)Note: Market = Cars and LCVs
Russia
Market development,
Million units
Volkswagen Kaluga Plant•
Investment: €970 million
•
Capacity: 150,000 units p.a.
•
Typical local content: ~
34%
Additional opportunities from Suzuki cooperation
India
Market development,
Million units
Volkswagen Pune Plant• Investment:
€700 million
•Capacity: 110,000 units p.a.
•Typical local content: ~ 75%1
20122009 2018
+9.4% CAGR +10.0% CAGR
48
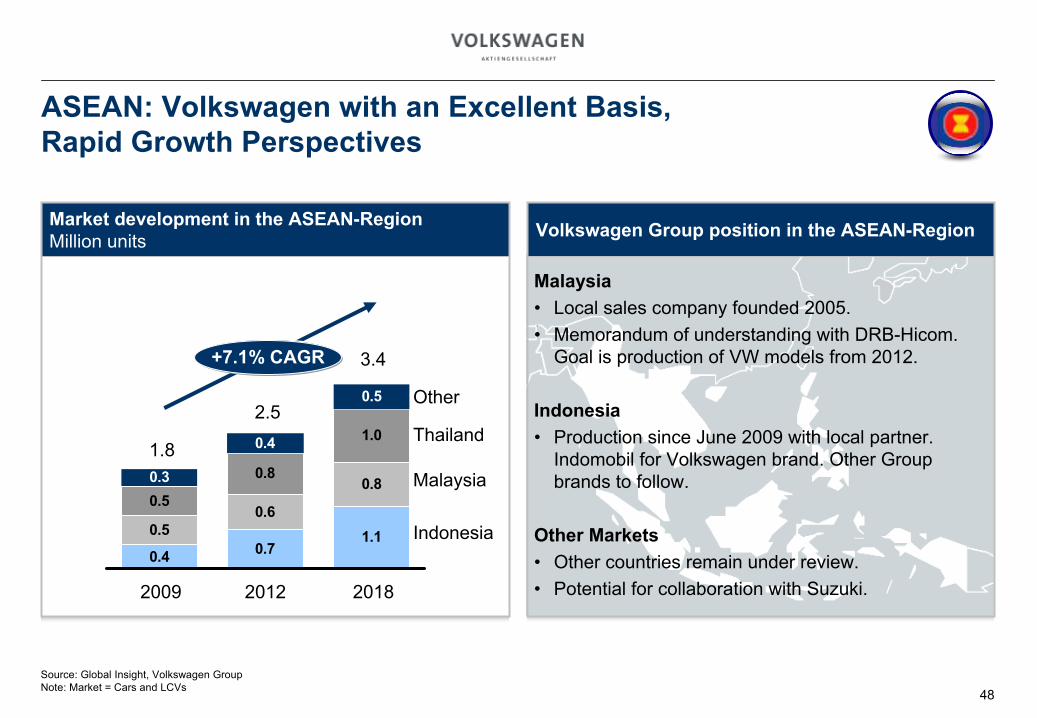
Volkswagen Group position in the ASEAN-Region
Malaysia•
Local sales company founded 2005.•
Memorandum of understanding with DRB-Hicom. Goal is production of VW models from 2012.
Indonesia•
Production since June 2009 with local partner. Indomobil
for Volkswagen brand. Other Group brands to follow.
Other Markets•
Other countries remain under review.•
Potential for collaboration with Suzuki.
Market development in the ASEAN-Region
Million units
1.10.70.4
0.50.6
0.8
1.0
0.8
0.5
0.5
0.4
0.3
+7.1% CAGR
2018
3.4
2012
2.5
2009
1.8
Source: Global Insight, Volkswagen GroupNote: Market = Cars and LCVs
ASEAN: Volkswagen with an Excellent Basis,Rapid Growth Perspectives
Indonesia
Malaysia
Thailand
Other
4949
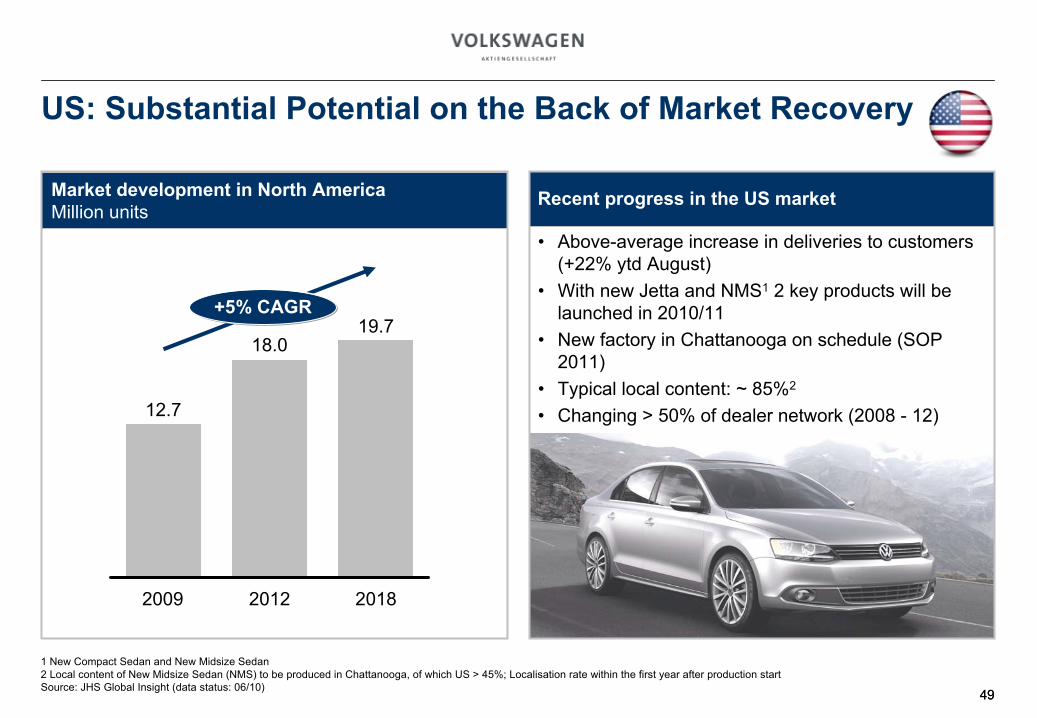
US: Substantial Potential on the Back of Market Recovery
Market development in North America
Million units
Recent progress in the US market
•
Above-average increase in deliveries to customers (+22% ytd August)
•
With new Jetta and NMS1
2 key products will be launched in 2010/11
•
New factory in Chattanooga on schedule (SOP 2011)
•
Typical local content: ~ 85%2
•
Changing > 50% of dealer network (2008 -
12)
2018
19.7
2012
18.0
2009
12.7
+5% CAGR
1 New Compact Sedan and New Midsize Sedan2 Local content of New Midsize Sedan (NMS) to be produced in Chattanooga, of which US > 45%; Localisation
rate within the first year after production startSource: JHS Global Insight (data status: 06/10)
5050
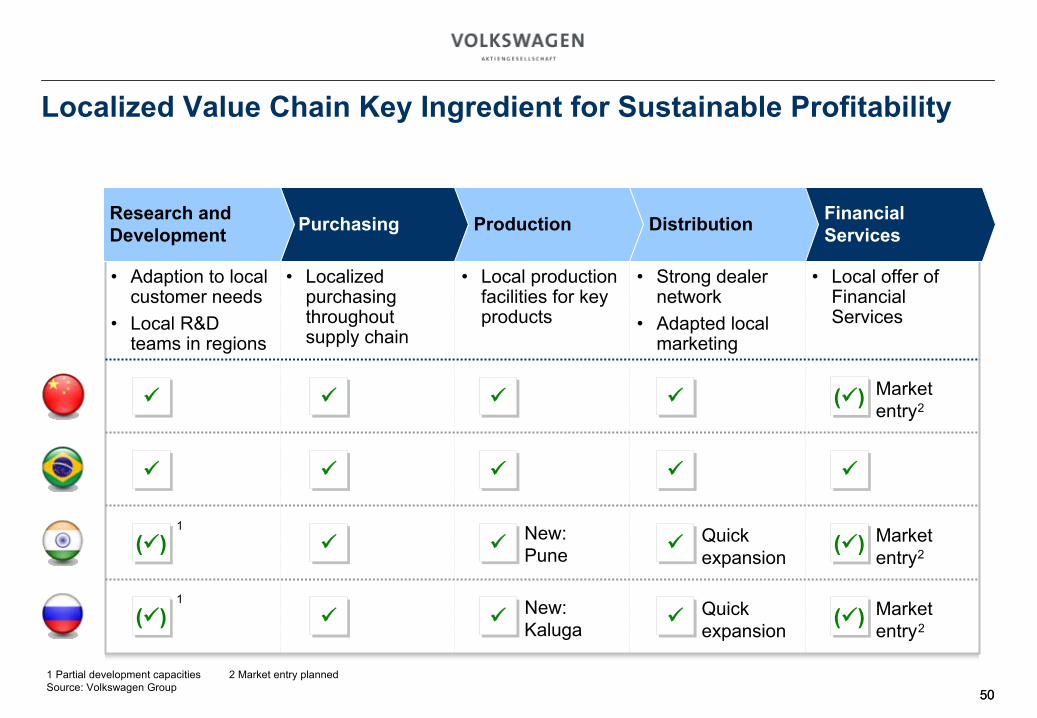
•
Localized purchasing throughout supply chain
Localized Value Chain Key Ingredient for Sustainable Profitability
•
Adaption
to local customer needs
•
Local R&D teams in regions
•
Local production facilities for key products
•
Strong dealer network
•
Adapted local marketing
•
Local offer of Financial Services
()1
()
New: Pune
New: Kaluga
Quick expansion
Quick expansion
Market
entry
()
Market entry
()
Market entry
()1
PurchasingResearch andDevelopment Production Distribution Financial
Services
1
Partial development capacities
2 Market entry plannedSource: Volkswagen Group
2
2
2
51
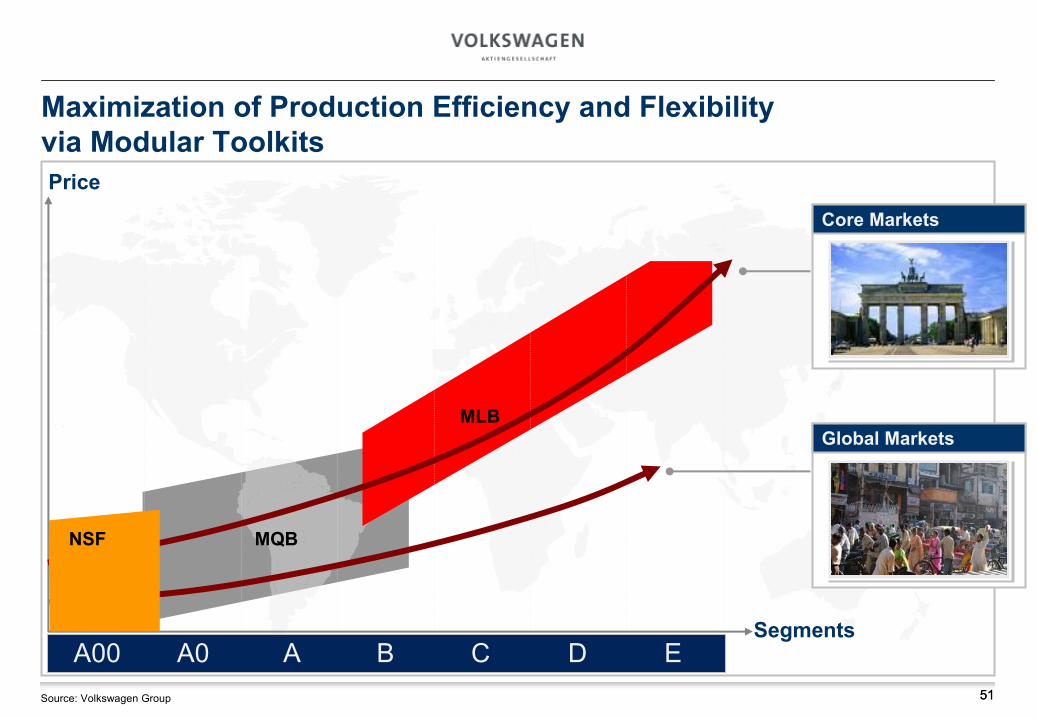
Maximization of Production Efficiency and Flexibility via Modular Toolkits
SegmentsA00 A0 A B C D E
Price
MLB
NSF MQB
Core Markets
Global Markets
Source: Volkswagen Group 51

5252
Local Sourcing of Key Components Examples for local parts
Europe
Polo steering system
Electronic hydraulic power system
India
Electric power system
Cost savings: 15 -
25%
Polo twist beam rear axle
Source: Volkswagen Group
5353
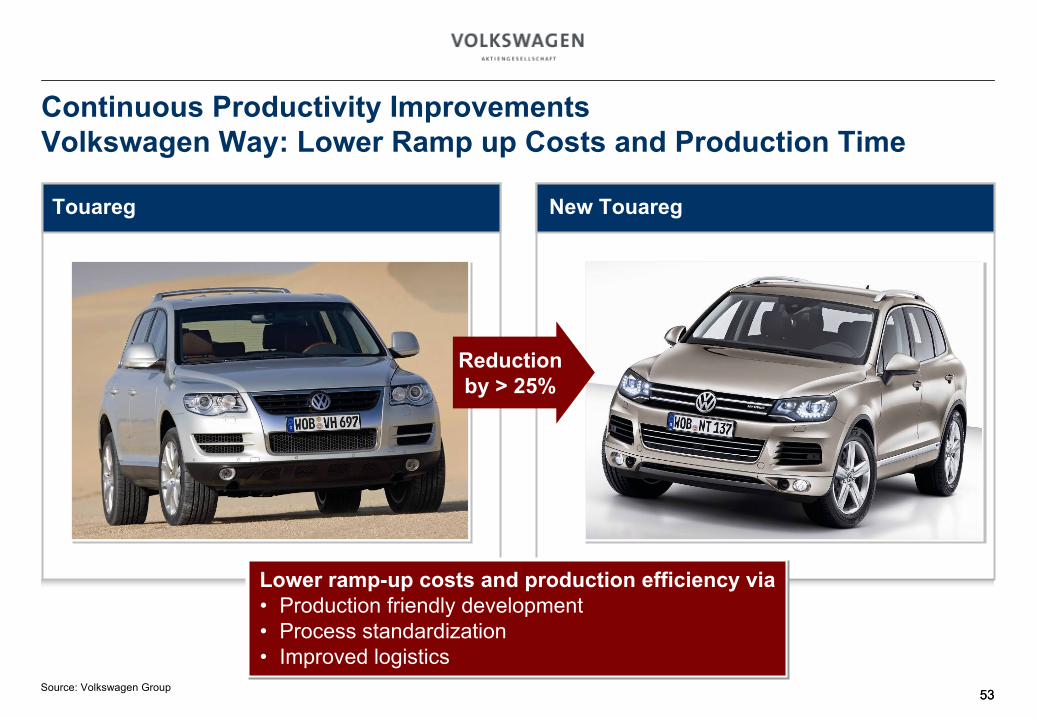
Continuous Productivity Improvements Volkswagen Way: Lower Ramp up Costs and Production Time
Touareg New Touareg
Lower ramp-up costs and production efficiency via•
Production friendly development•
Process standardization•
Improved logistics
Reduction by > 25%
Source: Volkswagen Group
5454
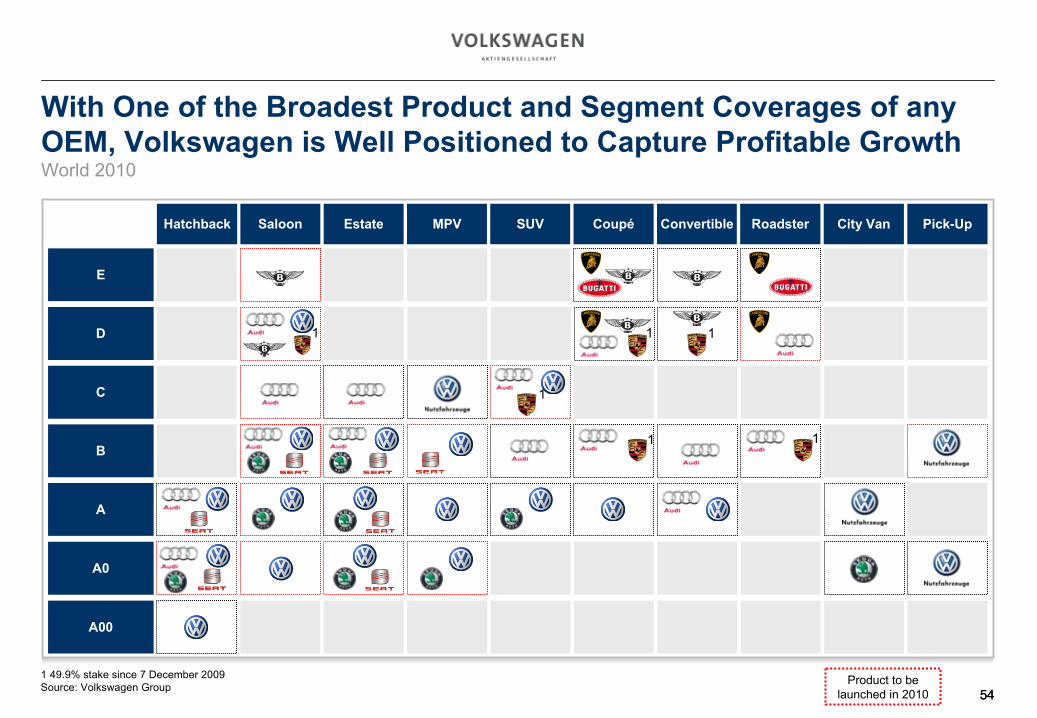
With One of the Broadest Product and Segment Coverages
of any OEM, Volkswagen is Well Positioned to Capture Profitable Growth World 2010
Product to be launched in 2010
E
D
C
B
A
A0
Hatchback Saloon Estate MPV Coupé Roadster City VanConvertibleSUV Pick-Up
A00
1 1
1
1 1
1
1
49.9% stake since 7 December 2009Source: Volkswagen Group
5555
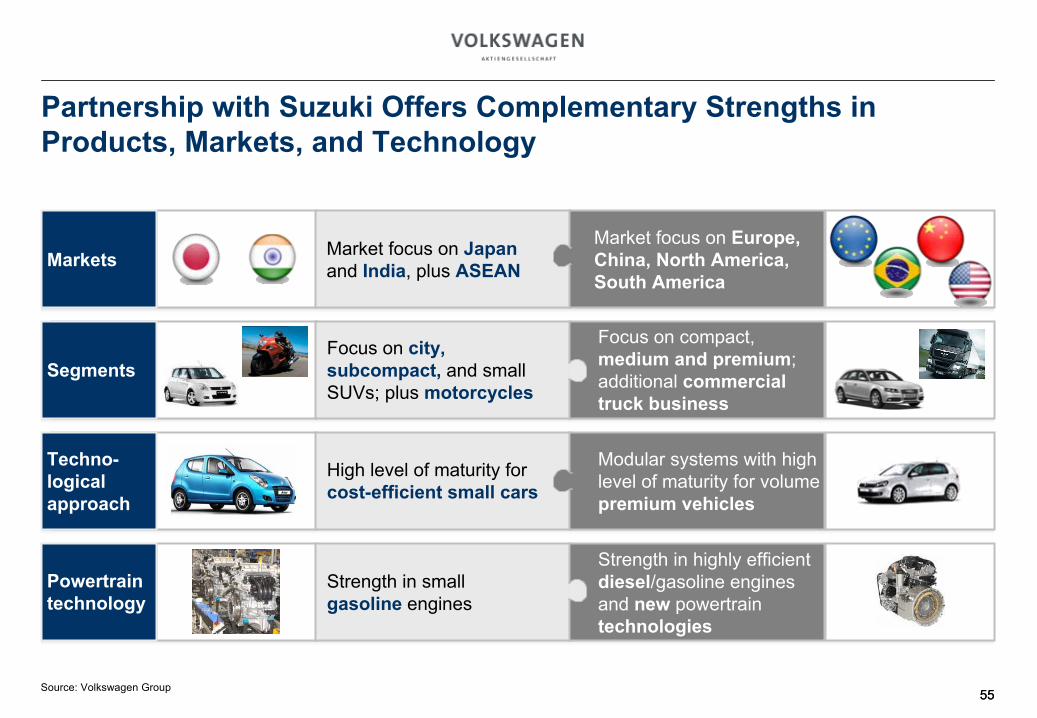
Partnership with Suzuki Offers Complementary Strengths in Products, Markets, and Technology
Market focus on Japan
and India, plus ASEAN
Market focus on Europe, China, North America, South America
Focus on city, subcompact,
and small SUVs; plus motorcycles
Focus on compact, medium and premium; additional commercial
truck
business
High level of maturity for cost-efficient small cars
Modular systems with high level of maturity for volume premium vehicles
Strength in small gasoline
engines
Strength in highly efficient diesel/gasoline engines and new
powertrain technologies
Markets
Segments
Techno-logical approach
Powertrain technology
Source: Volkswagen Group
Volkswagen –
On the Road of SuccessGoldman Sachs Investor VisitWolfsburg, September 22, 2010
57
APPENDIX
58
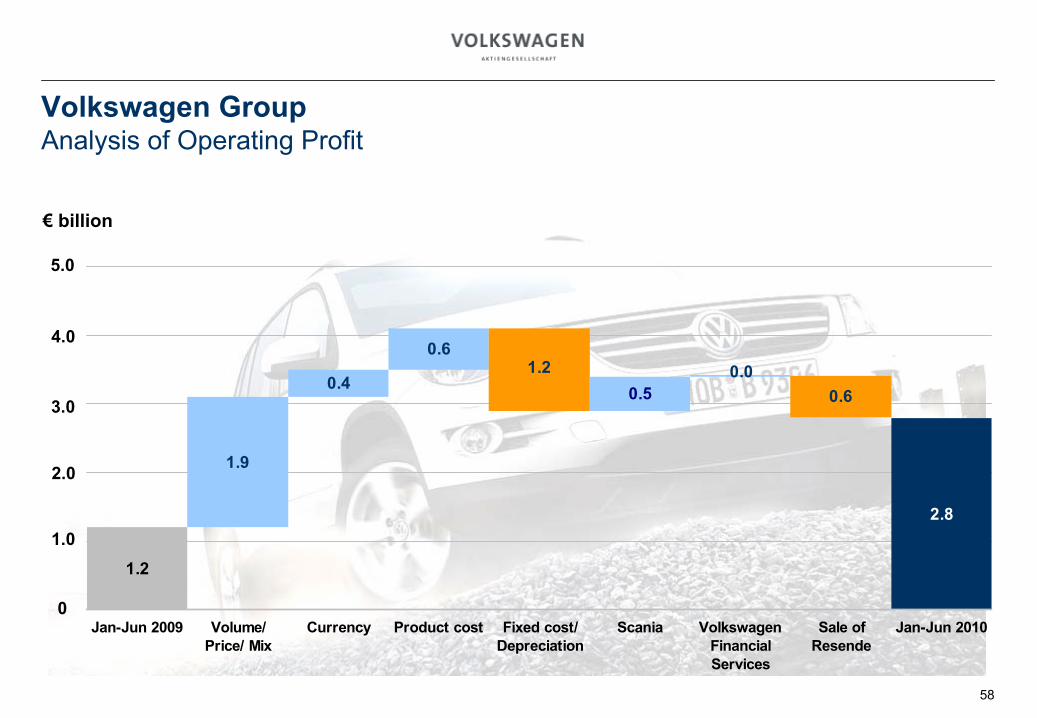
2.8
1.2
0.60.0
1.9
0.4
0.61.2
0.5
Jan-Jun 2009 Volume/Price/ Mix
Currency Product cost Fixed cost/Depreciation
Scania VolkswagenFinancialServices
Sale ofResende
Jan-Jun 2010
Volkswagen Group Analysis of Operating Profit
€
billion
2.0
1.0
0
3.0
5.0
4.0
59
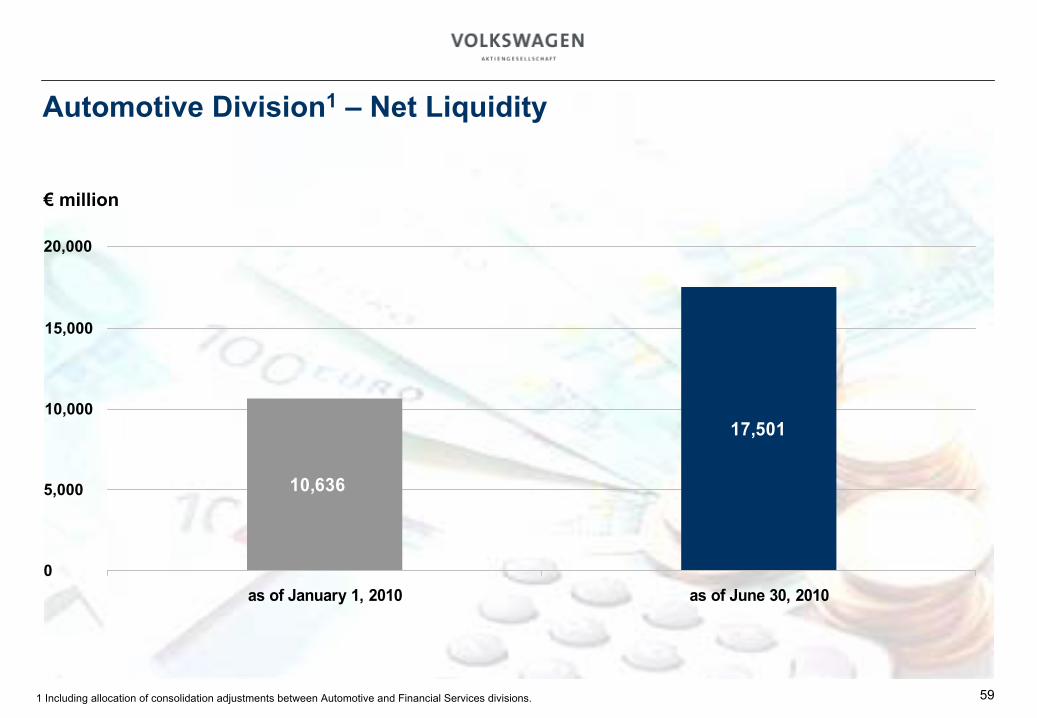
10,636
17,501
as of January 1, 2010 as of June 30, 2010
Automotive Division1
–
Net Liquidity
10,000
15,000
5,000
0
1 Including allocation of consolidation adjustments between Automotive and Financial Services divisions.
€
million
20,000
60
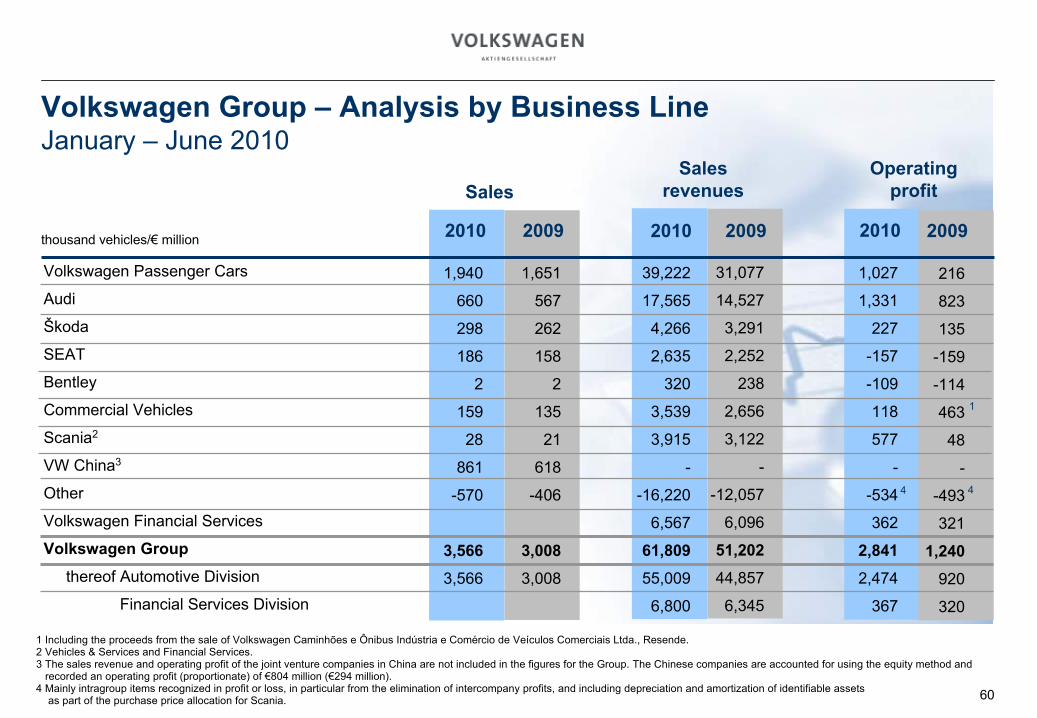
Volkswagen Group –
Analysis by
Business Line January
–
June
2010
Operating profit
Sales revenuesSales
thousand
vehicles/€
million
1,027
1,331
227
-157
-109
118
577
-
-534
362
2,841
2,474
367
2010
Volkswagen Passenger
Cars
Audi
Škoda
SEAT
Bentley
Commercial Vehicles
Scania2
VW China3
Other
Volkswagen Financial Services
Volkswagen Group
thereof Automotive Division
Financial Services Division
2009
216
823
135
-159
-114
463
48
-
-493
321
1,240
920
320
2009
31,077
14,527
3,291
2,252
238
2,656
3,122
-
-12,057
6,096
51,202
44,857
6,345
39,222
17,565
4,266
2,635
320
3,539
3,915
-
-16,220
6,567
61,809
55,009
6,800
2010
1,651
567
262
158
2
135
21
618
-406
3,008
3,008
20092010
1,940
660
298
186
2
159
28
861
-570
3,566
3,566
1
4 4
1 Including
the proceeds
from
the sale
of Volkswagen Caminhões
e Ônibus
Indústria
e Comércio
de Veículos
Comerciais
Ltda., Resende.2 Vehicles & Services and Financial Services.3 The sales revenue and operating profit of the joint venture companies in China are not included in the figures for the Group. The Chinese companies are accounted for using the equity method and
recorded an operating profit (proportionate) of €804 million (€294 million).4 Mainly intragroup
items recognized in profit or loss, in particular from the elimination of intercompany
profits, and including depreciation and amortization of identifiable assetsas part of the purchase price allocation for Scania.
61
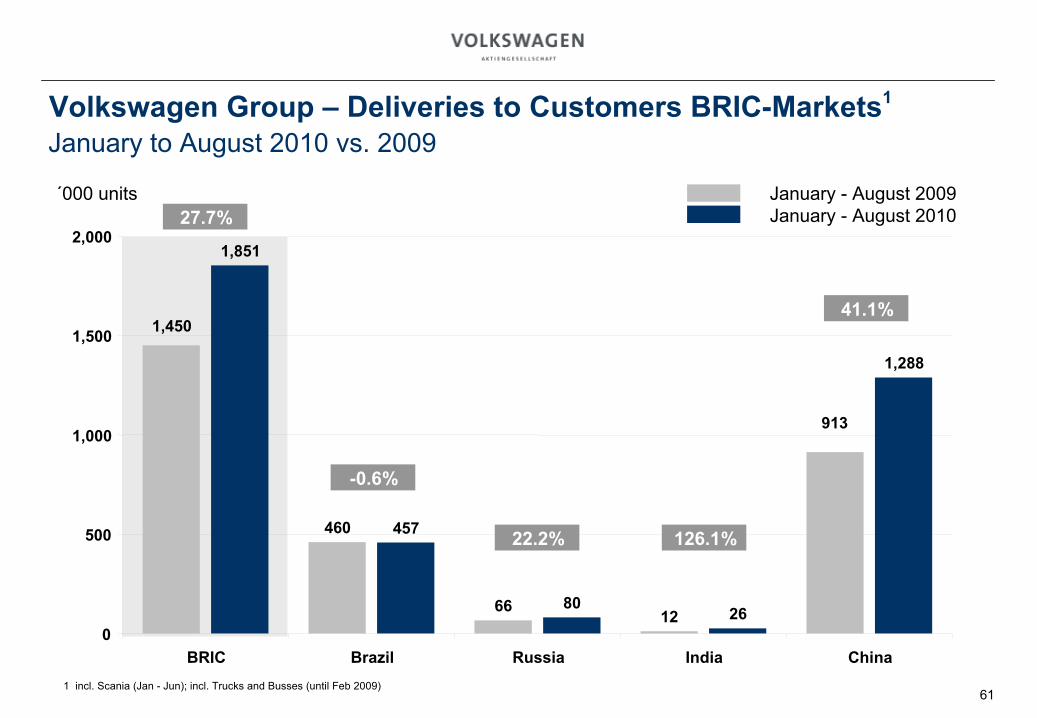
21.2%
Volkswagen Group –
Deliveries
to Customers
BRIC-Markets1
January
to August 2010 vs. 2009
´000 units January
-
August 2009January
-
August 2010
1 incl. Scania (Jan -
Jun); incl. Trucks and Busses (until
Feb 2009)
460
913
66 12
1,450
1,288
80 26
1,851
457
0
500
1,000
1,500
2,000
BRIC Brazil Russia India China
27.7%
-0.6%
22.2% 126.1%
41.1%
62
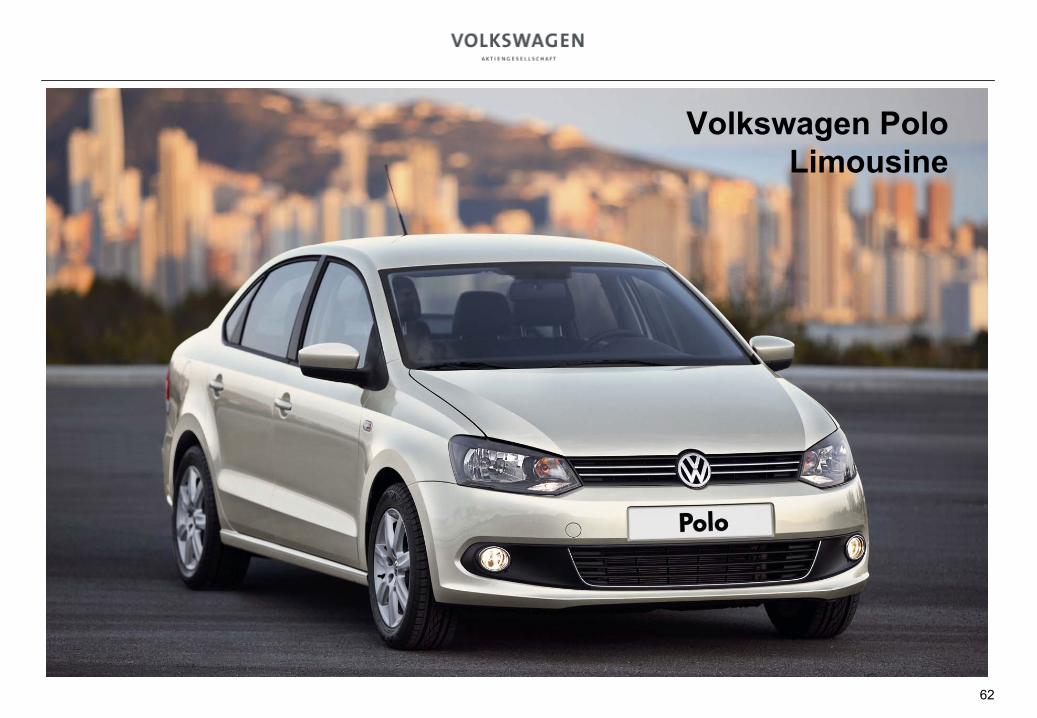
Volkswagen Polo Limousine
63
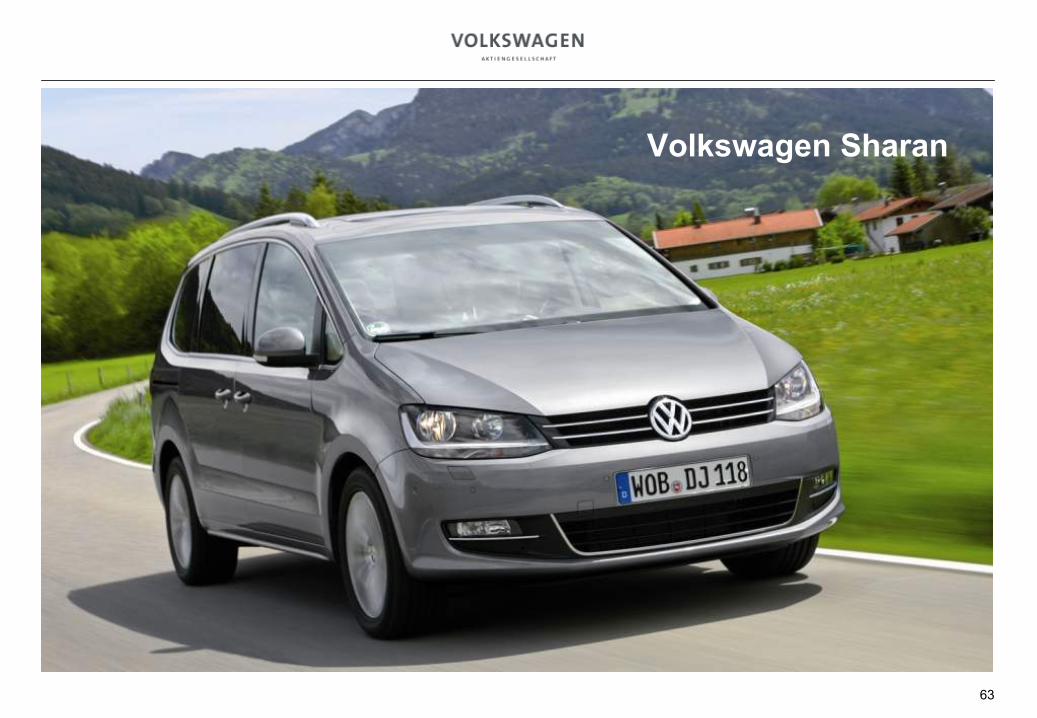
Volkswagen Sharan
64
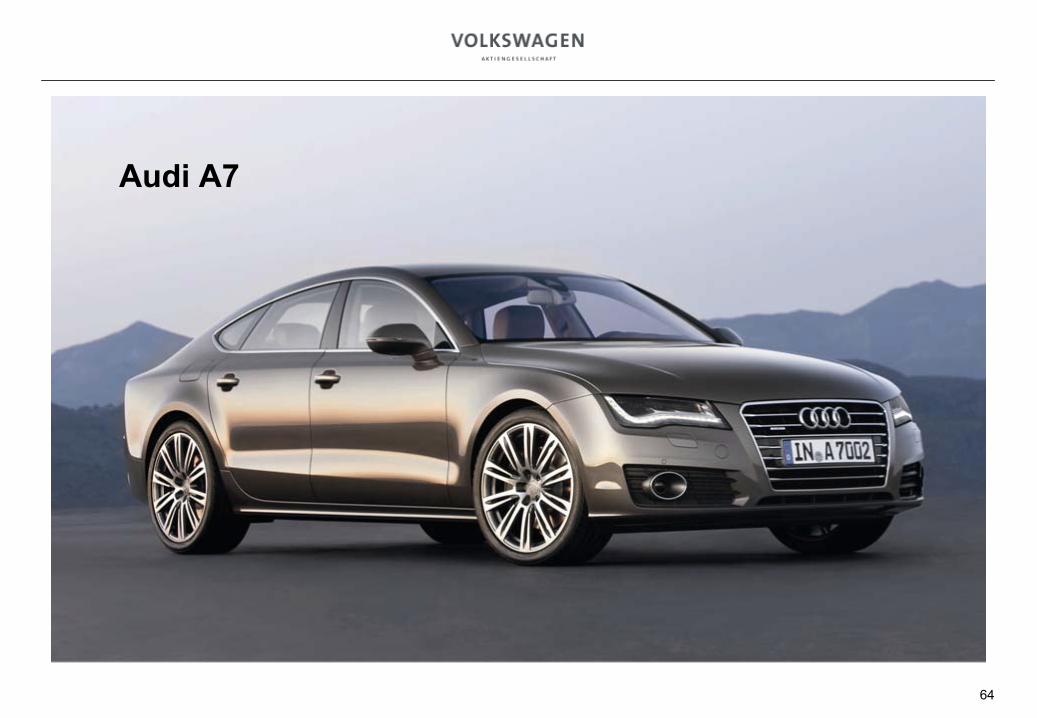
Audi A7
6565
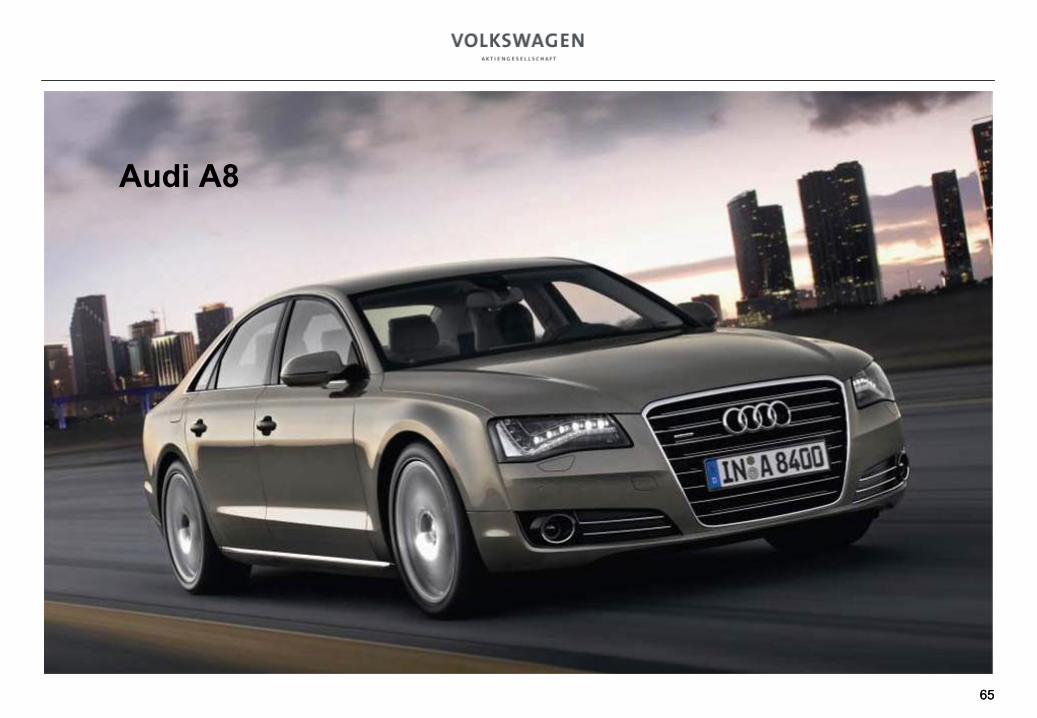
Audi A8
66
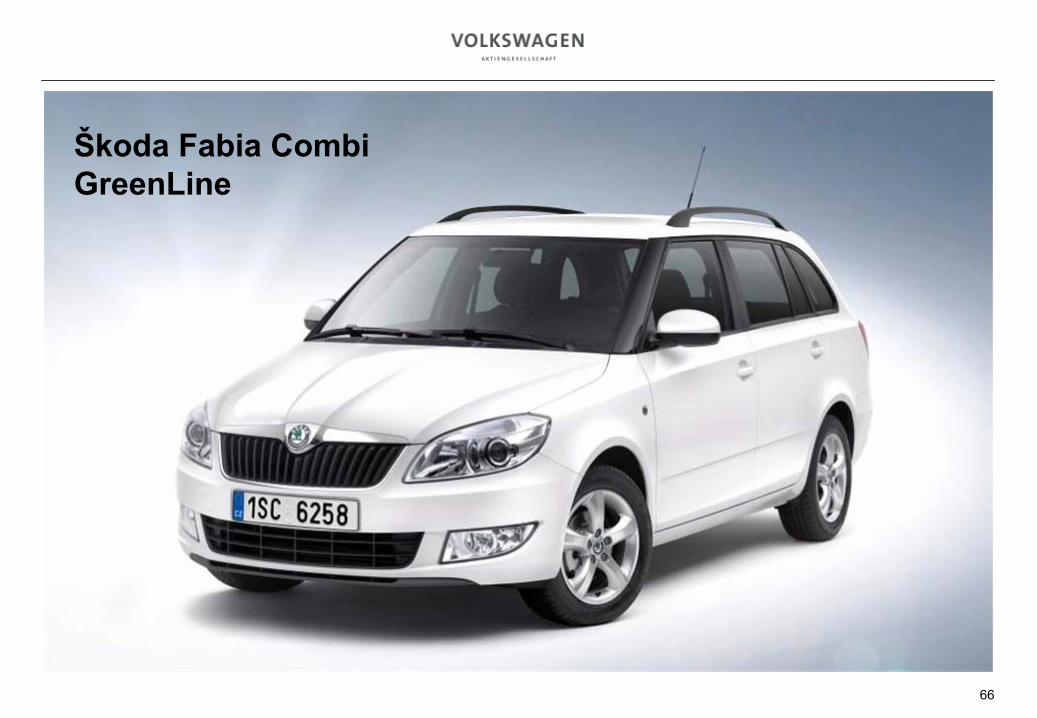
Škoda Fabia Combi GreenLine
6767
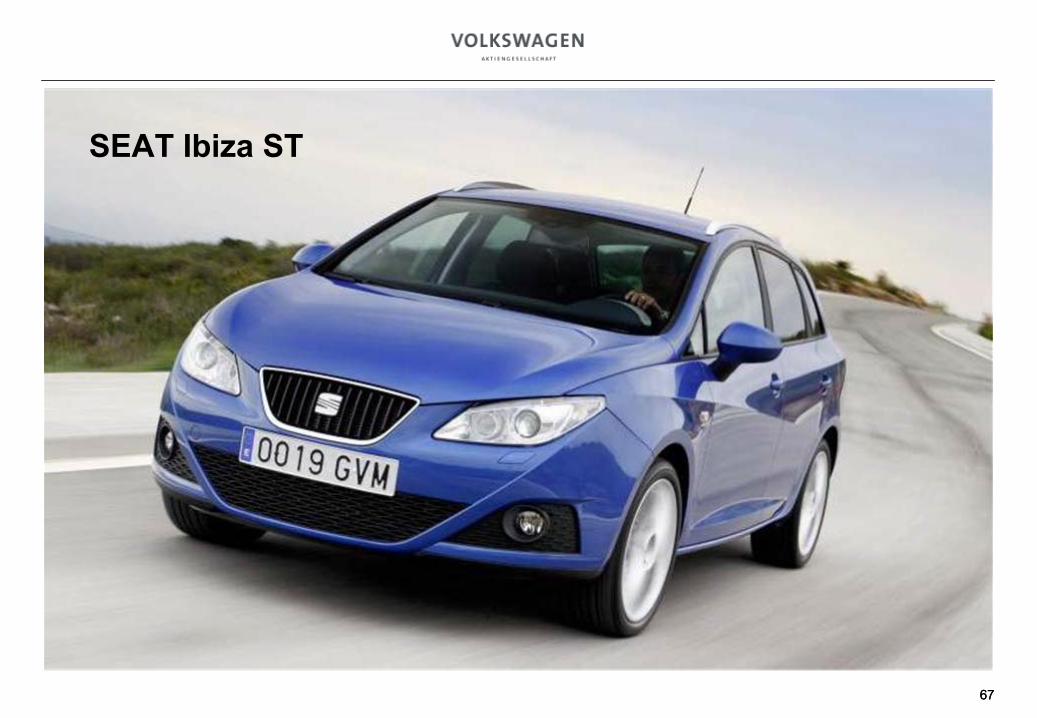
SEAT Ibiza ST
6868
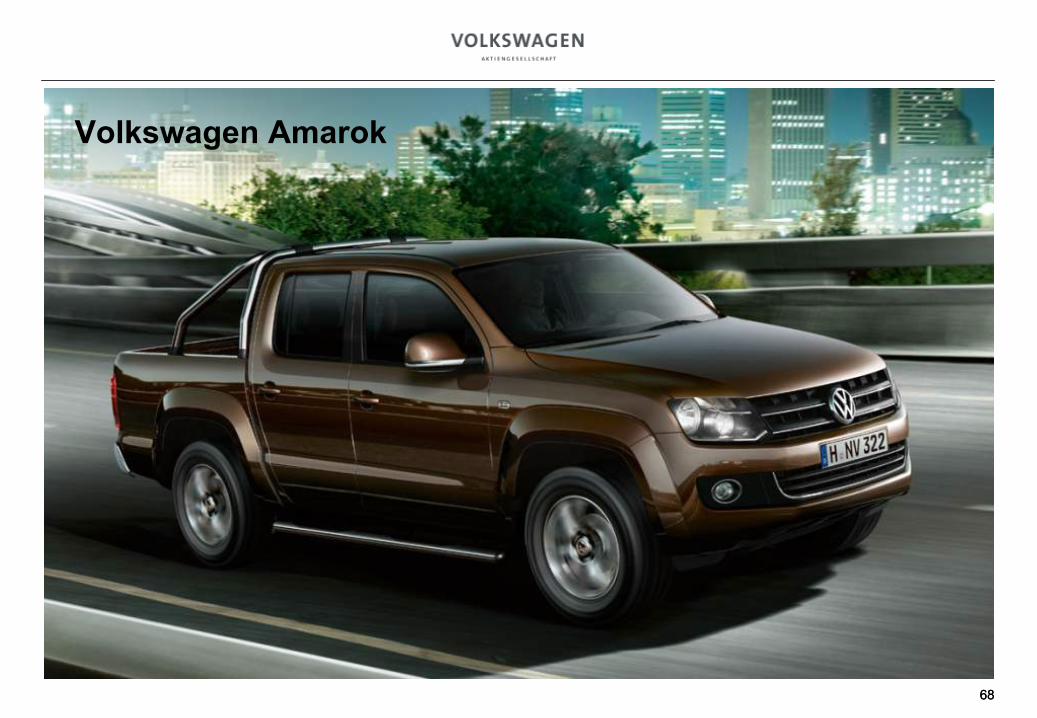
Volkswagen Amarok
69
Scania R 620 Highline
70
This presentation contains forward-looking statements and information on the business development of the Volkswagen Group. These statements may be spoken or written and can be recognized by terms such as “expects”, “anticipates”, “intends”, “plans”, “believes”, “seeks”, “estimates”, “will”
or words with similar meaning. These statements are based on assumptions relating to the development of the economies of individual countries, and in particular of the automotive industry, which we have made on the
basis of the information available to us and which we consider to be realistic at the time of going to press. The estimates given involve a degree of risk, and the actual developments may differ from those forecast.
Consequently, any unexpected fall in demand or economic stagnation in our key sales markets, such as in Western Europe (and especially Germany) or in the USA, Brazil or China, will have a corresponding impact on the development of our business. The same applies in the event of a significant shift in current exchange rates relative to the US dollar, sterling, yen, Brazilian real, Chinese rinminbi
and Czech koruna.
If any of these or other risks occur, or if the assumptions underlying any of these statements prove incorrect, the actual results may significantly differ from those expressed or implied by such statements.
We do not update forward-looking statements retrospectively. Such statements are valid on the date of publication and can be superceded.
Disclaimer