volatility comes back to haunt stock marketsmerchandise trade balance in real terms is an indicator...
TRANSCRIPT

WEEKLY NEWSLETTER
François Dupuis, Vice-President and Chief Economist • Carine Bergevin-Chammah, Economist Mathieu D’Anjou, Senior Economist • Benoit P. Durocher, Senior Economist • Francis Généreux, Senior Economist • Hendrix Vachon, Senior Economist
Desjardins, Economic Studies: 514-281-2336 or 1 866-866-7000, ext. 5552336 • [email protected] • desjardins.com/economics
NOTE TO READERS: The letters k, M and B are used in texts and tables to refer to thousands, millions and billions respectively.IMPORTANT: This document is based on public information and may under no circumstances be used or construed as a commitment by Desjardins Group. While the information provided has been determined on the basis of data obtained from sources that are deemed to be reliable, Desjardins Group in no way warrants that the information is accurate or complete. The document is provided solely for information purposes and does not constitute an offer or solicitation for purchase or sale. Desjardins Group takes no responsibility for the consequences of any decision whatsoever made on the basis of the data contained herein and does not hereby undertake to provide any advice, notably in the area of investment services. The data on prices or margins are provided for information purposes and may be modified at any time, based on such factors as market conditions. The past performances and projections expressed herein are no guarantee of future performance. The opinions and forecasts contained herein are, unless otherwise indicated, those of the document’s authors and do not represent the opinions of any other person or the official position of Desjardins Group. Copyright © 2018, Desjardins Group. All rights reserved.
HIGHLIGHTS
f The U.S. balance of trade deteriorated more than expected in December.
f Canada: The labour market lost ground in January.
f Canada: The trade balance finished Q4 on a negative note.
f Canada: The number of housing starts remained virtually unchanged in January.
A LOOK AHEAD
f Will the stock market’s nosedive shake U.S. consumer confidence?
f United States: Slow auto sales in January will curb retail sales growth.
f Gas prices are expected to bump up the U.S. Consumer Price Index.
f Canada: Manufacturing sales should continue to climb.
FINANCIAL MARKETS
f Stock markets tumble about 10% from their peak.
f Bond rates remain high, supporting the pessimism on stock markets.
f The greenback capitalizes on its safe-haven status.
Volatility Comes Back to Haunt Stock Markets
ECONOMIC STUDIES | FEBRUARY 9, 2018
CONTENTSKey Statistics of the Week ................................. 2
United States, Canada
Financial Markets ............................................... 3
A Look Ahead ................................................... 4United States, Canada, Overseas
Economic Indicators of the Week ...................... 6
TablesEconomic indicators ......................................... 8Major financial indicators ...............................10
#1 BEST OVERALLFORECASTER - CANADA

ECONOMIC STUDIES
2FEBRUARY 9, 2018 | WEEKLY NEWSLETTER
UNITED STATES
f After two consecutive monthly decreases that brought the numbers down from 59.8 to 56.0, the ISM non-manufacturing index gained some ground in January, reaching a new cyclical peak of 59.9. This is its highest point since August 2005. Seven of the non-manufacturing index’s ten components advanced. The steepest rise is observed in new orders (+8.2 points), followed by employment (+5.3 points). The only declines are in business inventories components.
f The U.S. balance of trade in goods and services deteriorated a little more than expected in December, falling from -US$50.4B in November to -US$53.1B. This is the worst deficit since October 2008. Exports rose 1.8%, but the increase in imports is even higher at 2.5%.
f As expected, monthly growth in consumer credit decelerated sharply in December. The monthly change went from +US$31.01B in November to +US$18.45B. Both revolving credit (lines of credit and credit cards) and term loans posted declines.
Francis Généreux, Senior economist
CANADA
f The labour market trimmed 88,000 jobs in January. This came after 17 monthly increases in a row for a total of 600,900 jobs created, an average of 35,300 jobs per month. The unemployment rate edged up from 5.8% in December to 5.9% in January. In view of the strong growth in employment in recent months, the labour market was going to have to stop to catch its breath at some point. That said, the trend is still positive and the unemployment rate remains close to its record low (since 1976). We should also point out that January’s drop in employment was accentuated by a significant reduction in part-time jobs in Ontario (-59,400). Some observers will link that to the hike in Ontario’s minimum wage. Given the volatility of employment data, we think it is far too soon to draw conclusions.
f The value of merchandise exports rose 0.6% in December while the value of imports grew 1.5%. The trade balance therefore deteriorated over the month, from -$2.7B to -$3.2B. December’s result was not only weaker than expected, but the performance for the fourth quarter as a whole was somewhat disappointing. The deterioration of the merchandise trade balance in real terms is an indicator that foreign trade will curb economic growth. According to our estimates, the contribution of the balance of trade in goods and services to the change in real GDP could be around -1.5% in the fourth quarter.
f Despite the introduction of tighter mortgage rules at the beginning of 2018, the number of housing starts remained fairly high in January with 216,000 units, compared with 216,300 units in December. Slight pullbacks in most provinces were offset by a roughly 30% jump in Ontario, due to a rebound in multi-unit housing in urban regions.
Benoit P. Durocher, Senior economist
Key Statistics of the Week

3FEBRUARY 9, 2018 | WEEKLY NEWSLETTER
ECONOMIC STUDIES
14,75014,95015,15015,35015,55015,75015,95016,15016,350
2,525
2,575
2,625
2,675
2,725
2,775
2,825
2,875
2017/12/28 2018/01/05 2018/01/15 2018/01/23 2018/01/31 2018/02/08
S&P 500 (left) S&P/TSX (right)
GRAPH 1 Stock markets
Sources: Datastream and Desjardins, Economic Studies
Index Index
1.9
2.1
2.3
2.5
2.7
2.9
-0.50
-0.45
-0.40
-0.35
-0.30
2017/12/28 2018/01/05 2018/01/15 2018/01/23 2018/01/31 2018/02/08
Spread (left) United States (right) Canada (right)
GRAPH 2 Bond markets
10-year yield
In % points In %
Sources: Datastream and Desjardins, Economic Studies
GRAPH 3 Currency markets
US$/C$ US$/€
Sources: Datastream and Desjardins, Economic Studies
1.19
1.20
1.21
1.22
1.23
1.24
1.25
1.26
0.790
0.795
0.800
0.805
0.810
0.815
0.820
2017/12/28 2018/01/05 2018/01/15 2018/01/23 2018/01/31 2018/02/08
Canadian dollar (left) Euro (right)
Financial MarketsAnxiety Spreads to the Stock Markets
Rising volatility hit the markets this week. The VIX volatility index in the United States reached 50.30 before the open on Tuesday, its highest level since 2015. The decline that began last week continued in nearly every session. The world’s major stock markets lost a total of about 10% compared to their previous peak. This wave of pessimism appears to be no more than a correction of the steady growth recorded on the markets in recent months since the economy is generally healthy. The S&P 500 ended the week down about 6% at the time of writing. The downtrend affecting Canada’s stock market in recent weeks continued, but with fewer swings than in the United States. Last Friday, the S&P/TSX shed almost 4% of its value.
High U.S. and Canadian bond yields contributed to the pessimism on the stock markets. Stock market volatility overnight from Monday to Tuesday also dragged down bond yields on both sides of the border, but they quickly recovered closer to last week’s levels, i.e. almost 2.85% for the U.S. 10-year and 2.35% for its Canadian counterpart.
Given its safe-haven status, the U.S. dollar benefited from the rising volatility on the markets, recording gains against most other main currencies. The euro trimmed about US$0.020 for the week, trading at about US$1.225 on Friday. The pound was down nearly US$0.03 for the week. The Bank of England’s more upbeat tone at its monetary policy meeting on Thursday supported the pound temporarily, but in the end it depreciated to close to US$1.38 on Friday. The loonie did not escape the general trend. It fell below the psychological barrier of US$0.80 for the week, edging closer to US$0.79 briefly on Friday on the disappointing employment figures released in Canada. The drop in oil prices also hurt Canada’s currency.
Hendrix Vachon, Senior Economist
Carine Bergevin-Chammah, Economist

ECONOMIC STUDIES
4FEBRUARY 9, 2018 | WEEKLY NEWSLETTER
A Look Ahead
UNITED STATES
Consumer price index (January) – After a 0.3% rise in November, the consumer price index (CPI) monthly change slowed to 0.1% in December. We expect stronger growth in January. Part of the increase will come from the 3.3% rise in average gas prices across Canada. That effect will be exacerbated by the fact that gas prices usually drop 2.3% in January. We expect the core CPI, which does not include food and energy, to post a monthly 0.2% gain as it did in December. The total CPI is expected to rise by 0.4%. Due to the base effect (the monthly change in total CPI was +0.5% in January 2017), the annual change will likely drop from 2.1% to 2.0%. Core inflation should go from 1.8% to 1.7%.
Retail sales (January) – Retail sales grew nicely but modestly from 0.4% in December. A slowdown is expected in January. The weakness is partly due to the automobile sector, where sales of new vehicles were down 3.8%. Excluding automobiles, sales should be boosted by the effect of rising gas prices on the value of service station sales. Sales growth, excluding automobiles and gas, is expected to be somewhat stronger than in December: 0.5% compared with 0.4%. Total sales are expected to go up only 0.2%.
Industrial production (January) – After a drop of 0.2%, largely due to a decline in energy production, industrial production bounced back with a monthly change of 0.9%. However, manufacturing growth remained modest at 0.1%. We expect a more robust gain for this sector, as suggested by the ISM index levels and the increased hours worked in the manufacturing sector in January. We also expect healthy growth in the mining sector. The cold weather at the beginning of January gave way to more normal temperatures, which will likely lead to a drop in energy production of about 1.0%. All in all, industrial output should increase 0.2%, with manufacturing production inching up 0.4%. On Thursday, the results of the New York Fed’s Empire index and the Philadelphia Fed’s index will give us preliminary indications of the strength of the manufacturing sector in February.
Housing starts (January) – Housing starts were down 8.2% in December. This was the sharpest monthly decline since November 2016 and brought annualized new construction numbers to 1,192,000 units. However, we expect them to bounce back in January despite the early cold weather snap. The 1,300,000 building permits issued in December, strong homebuilder confidence and home sales trends all suggest that the level will rise. In addition, 5,100 residential construction jobs were created. Housing starts could therefore go as high as 1,280,000 units.
University of Michigan consumer confidence index (February – preliminary) – Consumer confidence was relatively stable in January according to the University of Michigan index. At first glance, the situation could be similar or even better in February. The Conference Board index (which is often ahead of the Michigan index) was up 2.3 points in January, the monthly TIPP index rose in February and the Bloomberg weekly index was down only slightly in the first week of the month. However, none of this takes into account the stock market’s nosedive since its peak on January 26. At the time of writing, the S&P 500 had lost more than 9% of its value. The highly publicized Dow Jones has plummeted more than 2,600 points. This situation is a game changer. It remains to be seen how the markets will react between now and February 14, the deadline for releasing February’s preliminary results of the University of Michigan survey. For the time being, we are predicting a drop of at least three points. That would bring the University of Michigan index to its lowest level since October 2016.
WEDNESDAY February 14 - 8:30January m/m Consensus 0.3% Desjardins 0.4%December 0.1%
WEDNESDAY February 14 - 8:30January m/m Consensus 0.2% Desjardins 0.2%December 0.4%
THURSDAY February 15 - 9:15January m/m Consensus 0.2% Desjardins 0.2%December 0.9%
FRIDAY February 16 - 8:30January ann. rate Consensus 1,230,000 Desjardins 1,280,000December 1,192,000
FRIDAY February 16 - 10:00February Consensus 95.0 Desjardins 92.7January 95.7

5FEBRUARY 9, 2018 | WEEKLY NEWSLETTER
ECONOMIC STUDIES
CANADA
Manufacturing sales (December) – After bouncing back in November, manufacturing sales should continue to rise in December. Exports increased 0.6% during the month, which will encourage manufacturers. Exports of energy products were up 6.2%.
OVERSEAS
Japan: Real GDP (Q4) – Japan’s economic growth sped up in 2017. From an average of 0.3% from spring 2016 to winter 2017, the non-annualized quarterly growth of real GDP reached 0.7% in the second quarter of 2017 and 0.6% in the third quarter. However, the consensus expects lower results for last fall, despite an anticipated rebound in consumer spending. Real GDP should increase 0.2%. If there aren’t too many revisions, this would bring the annual change for 2017 overall to 1.8%, compared with 0.9% in 2016.
Euro zone: Real GDP (Q4 – second estimate) – The preliminary version of the Euroland national accounts for the fourth quarter of 2017, which were released on January 30, indicated non-annualized quarterly growth of 0.6%. That preliminary estimate (released without details as to demand components or zone member countries) indicates less growth than the gains of 0.7% in the second and third quarters. The second estimate will give us more information about how the main countries performed, especially Germany and Italy. The euro zone’s industrial production for December will also be released on Wednesday. At 1.0%, November’s monthly change was particularly strong, but based on the Germany’s figures (-0.6%), we now expect a slight slump. The Euroland trade balance for December will be released on Thursday.
FRIDAY February 16 - 8:30December m/m Consensus -0.5% Desjardins 0.5%November 3.4%
TUESDAY February 13 - 18:50Q4 2017 q/q Consensus 0.2%Q3 2017 0.6%
WEDNESDAY February 14 - 5:00Q4 2017 - 2nd est. q/q Consensus 0.6%Q4 2017 - 1st est. 0.6%

ECONOMIC STUDIES
6FEBRUARY 9, 2018 | WEEKLY NEWSLETTER
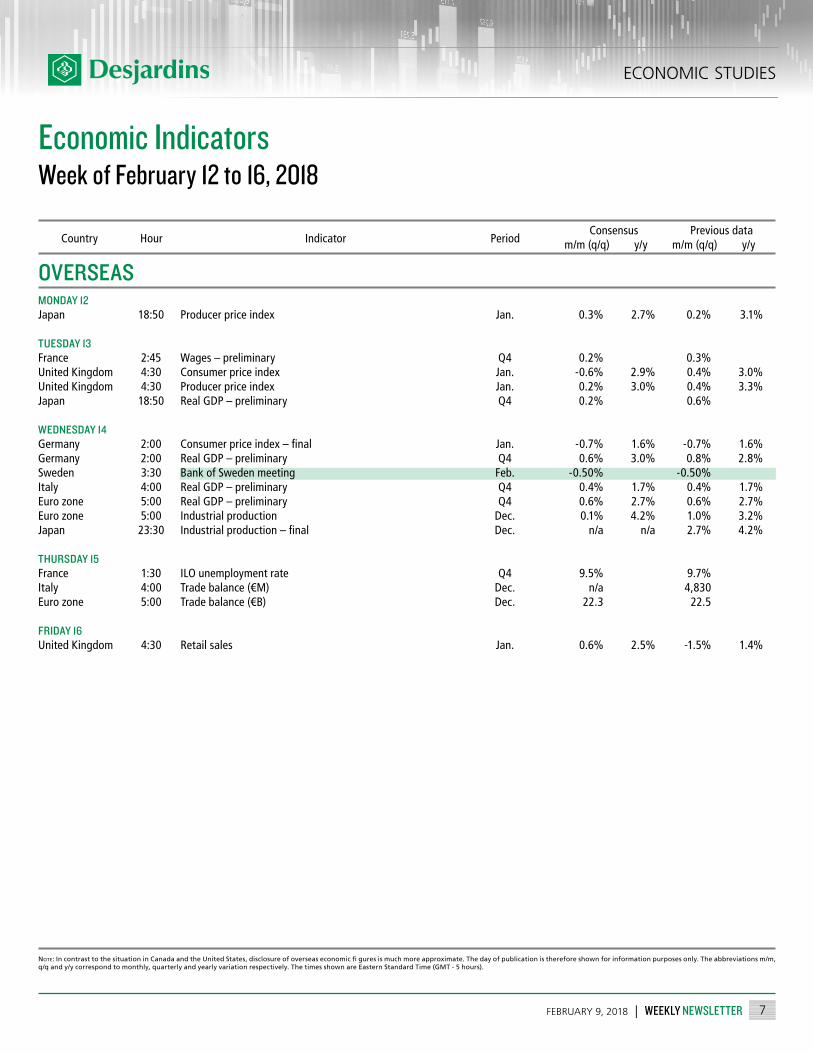
Economic IndicatorsWeek of February 12 to 16, 2018
Note: Desjardins, Economic Studies are involved every week in the Bloomberg survey for Canada and the United States. Approximately 15 economists are consulted for the Canadian survey and a hundred or so for the United States. Theabbreviations m/m, q/q and y/y correspond to monthly, quarterly and yearly variation respectively. Following the quarter, the abbreviations f, s and t correspond to first estimate, second estimate and third estimate respectively. The times shown are Eastern Standard Time (GMT - 5 hours). Forecast of Desjardins, Economic Studies of the Desjardins Group.
CANADA
Previous data Day Hour Indicator Period Consensus
UNITED STATES
MONDAY 12 --- ---
TUESDAY 13 --- ---
WEDNESDAY 14 --- ---
THURSDAY 15 9:00 Existing home sales Jan. 13:30 Speech of the Bank of Canada Deputy Governor, L. Schembri
FRIDAY 16 8:30 International transactions in securities ($B) Dec. n/a 20.50 19.56 8:30 Manufacturing sales (m/m) Dec. -0.5% 0.5% 3.4%
MONDAY 12 14:00 Federal budget (US$B) Jan. 51.0 51.0 51.3
TUESDAY 13 8:00 Speech of the Cleveland Fed President, L. Mester
WEDNESDAY 14 8:30 Consumer price index Total (m/m) Jan. 0.3% 0.4% 0.1% Excluding food and energy (m/m) Jan. 0.2% 0.2% 0.3% Total (y/y) Jan. 1.9% 2.0% 2.1% Excluding food and energy (y/y) Jan. 1.7% 1.7% 1.8% 8:30 Retail sales Total (m/m) Jan. 0.2% 0.2% 0.4% Excluding automobiles (m/m) Jan. 0.5% 0.6% 0.4% 10:00 Business inventories (m/m) Dec. 0.3% 0.3% 0.4%
THURSDAY 15 8:30 Initial unemployment claims Feb. 5-9 228,000 228,000 221,000 8:30 Producer price index Total (m/m) Jan. 0.4% 0.4% -0.1% Excluding food and energy (m/m) Jan. 0.2% 0.2% -0.1% 8:30 Philadelphia Fed index Feb. 21.6 22.0 22.2 8:30 Empire manufacturing index Feb. 18.0 20.0 17.7 9:15 Industrial production (m/m) Jan. 0.2% 0.2% 0.9% 9:15 Production capacity utilization rates Jan. 78.0% 78.0% 77.9% 10:00 NAHB housing market index Feb. 72 n/a 72 16:00 Net foreign security purchases (US$B) Dec. n/a n/a 57.5
FRIDAY 16 8:30 Housing starts (ann. rate) Jan. 1,230,000 1,280,000 1,192,000 8:30 Building permits (ann. rate) Jan. 1,300,000 1,270,000 1,300,000 8:30 Export prices (m/m) Jan. 0.3% 0.3% -0.1% 8:30 Import prices (m/m) Jan. 0.6% 0.5% 0.1% 10:00 Michigan’s consumer sentiment index – preliminary Feb. 95.0 92.7 95.7
7FEBRUARY 9, 2018 | WEEKLY NEWSLETTER
ECONOMIC STUDIES
Economic IndicatorsWeek of February 12 to 16, 2018
Note: In contrast to the situation in Canada and the United States, disclosure of overseas economic fi gures is much more approximate. The day of publication is therefore shown for information purposes only. The abbreviations m/m, q/q and y/y correspond to monthly, quarterly and yearly variation respectively. The times shown are Eastern Standard Time (GMT - 5 hours).
Previous data m/m (q/q) y/y Country Hour Indicator Period
OVERSEAS
Consensus m/m (q/q) y/y
MONDAY 12Japan 18:50 Producer price index Jan. 0.3% 2.7% 0.2% 3.1%
TUESDAY 13France 2:45 Wages – preliminary Q4 0.2% 0.3% United Kingdom 4:30 Consumer price index Jan. -0.6% 2.9% 0.4% 3.0%United Kingdom 4:30 Producer price index Jan. 0.2% 3.0% 0.4% 3.3%Japan 18:50 Real GDP – preliminary Q4 0.2% 0.6%
WEDNESDAY 14Germany 2:00 Consumerpriceindex–final Jan. -0.7% 1.6% -0.7% 1.6%Germany 2:00 Real GDP – preliminary Q4 0.6% 3.0% 0.8% 2.8%Sweden 3:30 Bank of Sweden meeting Feb. -0.50% -0.50% Italy 4:00 Real GDP – preliminary Q4 0.4% 1.7% 0.4% 1.7%Euro zone 5:00 Real GDP – preliminary Q4 0.6% 2.7% 0.6% 2.7%Euro zone 5:00 Industrial production Dec. 0.1% 4.2% 1.0% 3.2%Japan 23:30 Industrialproduction–final Dec. n/a n/a 2.7% 4.2%
THURSDAY 15France 1:30 ILO unemployment rate Q4 9.5% 9.7% Italy 4:00 Trade balance (€M) Dec. n/a 4,830 Euro zone 5:00 Trade balance (€B) Dec. 22.3 22.5
FRIDAY 16United Kingdom 4:30 Retail sales Jan. 0.6% 2.5% -1.5% 1.4%

ECONOMIC STUDIES
8FEBRUARY 9, 2018 | WEEKLY NEWSLETTER
REF. MONTH LEVEL
-1 month -3 months -6 months -1 year
Leading indicator (2010 = 100) Dec. 107.0 0.6 2.4 3.1 5.7
ISM manufacturing index1 Jan. 59.1 59.3 58.5 56.5 55.6
ISM non-manufacturing index1 Jan.* 59.9 56.0 59.8 54.3 56.8
Cons. confidence Conference Board (1985 = 100)1 Jan. 125.4 123.1 126.2 120.0 111.6Personal consumption expenditure (2009 $B) Dec. 12,071 0.3 0.9 1.7 2.8Disposable personal income (2009 $B) Dec. 12,839 0.2 0.4 0.5 2.1Consumer credit ($B) Dec.* 3,841 0.5 1.9 2.8 5.4Retail sales ($M) Dec. 495,381 0.4 1.9 4.4 5.4
Excluding automobiles ($M) Dec. 393,317 0.4 2.2 4.6 6.3Industrial production (2007 = 100) Dec. 107.5 0.9 2.6 2.1 3.6
Production capacity utilization rate (%)1 Dec. 77.9 77.2 76.1 76.6 76.0New machinery orders ($M) Dec. 498,229 1.7 3.8 3.3 8.4New durable good orders ($M) Dec. 249,321 2.8 4.2 1.5 11.5Business inventories ($B) Nov. 1,895 0.4 0.4 1.9 3.2
Housing starts (k)1 Dec. 1,192 1,299 1,159 1,217 1,268
Building permits (k)1 Dec. 1,300 1,303 1,225 1,275 1,266
New home sales (k)1 Dec. 625.0 689.0 639.0 619.0 548.0
Existing home sales (k)1 Dec. 5,570 5,780 5,370 5,510 5,510
Commercial surplus ($M)1 Dec.* -53,118 -50,435 -44,830 -45,626 -44,607
Nonfarm employment (k)2 Jan. 147,810 200.0 576.0 1,082 2,114
Unemployment rate (%)1 Jan. 4.1 4.1 4.1 4.3 4.8Consumer price (1982–1984 = 100) Dec. 247.9 0.2 0.6 1.6 2.1
Excluding food and energy Dec. 254.4 0.2 0.6 1.1 1.8Personal cons. expenditure deflator (2009 = 100) Dec. 113.6 0.1 0.5 1.2 1.7
Excluding food and energy Dec. 113.9 0.2 0.5 0.8 1.5Producer price (2009 = 100) Dec. 114.3 -0.1 0.8 1.5 2.7Export prices (2000 = 100) Dec. 124.5 -0.1 0.5 2.4 2.6Import prices (2000 = 100) Dec. 125.2 0.1 1.0 2.3 3.0
1 Statistic shows the level of the month of the column; 2 Statistic shows the variation since the reference month; * New statistic in comparison with last week.
UNITED STATESMonthly economic indicators
VARIATION (%)
UNITED STATESQuarterly economic indicators
REF. QUART. LEVEL
Quart. ann. 1 year 2017 2016 2015
Gross domestic product (2009 $B) 2017 Q4 17,272 2.6 2.5 2.3 1.5 2.9Consumption (2009 $B) 2017 Q4 12,028 3.8 2.8 2.7 2.7 3.6Government spending (2009 $B) 2017 Q4 2,921 3.0 0.7 0.1 0.8 1.4Residential investment (2009 $B) 2017 Q4 603.4 11.6 2.3 1.7 5.5 10.2Non-residential investment (2009 $B) 2017 Q4 2,366 6.8 6.3 4.7 -0.6 2.3
Business inventory change (2009 $B)1 2017 Q4 9.2 --- --- 13.6 33.4 100.5Exports (2009 $B) 2017 Q4 2,229 6.9 4.9 3.4 -0.3 0.4Imports (2009 $B) 2017 Q4 2,882 13.9 4.6 3.9 1.3 5.0Final domestic demand (2009 $B) 2017 Q4 17,891 4.3 2.8 2.5 2.1 3.3GDP deflator (2009 = 100) 2017 Q4 114.3 2.4 1.9 1.8 1.3 1.1Labor productivity (2009 = 100) 2017 Q4 108.8 -0.1 1.1 1.2 0.0 1.2Unit labor cost (2009 = 100) 2017 Q4 108.9 2.0 1.3 0.2 1.1 1.8Employment cost index (Dec. 2005 = 100) 2017 Q4 131.4 2.5 2.7 2.5 2.2 2.1
Current account balance ($B)1 2017 Q3 -100.6 --- --- -451.7 -434.6 -373.8
VARIATION (%) ANNUAL VARIATION (%)
1 Statistics representing the level during the period; * New statistic in comparison with last week.

9FEBRUARY 9, 2018 | WEEKLY NEWSLETTER
ECONOMIC STUDIES
REF. MONTH LEVEL
-1 month -3 months -6 months -1 year
Gross domestic product (2007 $M) Nov. 1,759,223 0.4 0.7 1.0 3.5Industrial production (2007 $M) Nov. 379,929 1.1 0.9 0.3 4.6Manufacturing sales ($M) Nov. 55,469 3.4 3.5 0.9 6.0
Housing starts (k)1 Jan.* 216.2 216.3 221.7 225.1 205.5Building permits ($M) Dec.* 8,059 4.8 1.4 -1.8 11.5Retail sales ($M) Nov. 50,056 0.2 2.0 2.3 6.5
Excluding automobiles ($M) Nov. 36,998 1.6 2.9 3.3 6.7Wholesale trade sales ($M) Nov. 63,552 0.7 1.3 2.8 10.8
Commercial surplus ($M)1 Dec.* -3,186 -2,710 -3,344 -3,022 249.7Exports ($M) Dec.* 46,510 0.6 6.9 0.3 0.4Imports ($M) Dec.* 49,696 1.5 6.1 0.6 7.8
Employment (k)2 Jan.* 18,557 -88.0 19.3 20.1 24.1
Unemployment rate (%)1 Jan.* 5.9 5.8 6.2 6.3 6.7Average weekly earnings ($) Nov. 988.3 0.6 1.2 1.9 2.8
Number of salaried employees (k)2 Nov. 16,367 16.1 6.4 30.8 27.1Consumer price (2002 = 100) Dec. 130.8 -0.4 0.0 0.3 1.9
Excluding food and energy Dec. 125.6 -0.5 -0.2 0.0 1.7Excluding 8 volatile items Dec. 129.6 -0.5 -0.2 -0.2 1.2
Industrial product price (2002 = 100) Dec. 114.7 -0.1 2.4 1.0 2.2Raw materials price (2002 = 100) Dec. 104.3 -0.9 8.5 8.4 6.2Money supply M1+ ($M) Dec. 965,358 1.1 2.1 2.3 7.7
1 Statistic shows the level of the month of the column; 2 Statistic shows the variation since the reference month; * New statistic in comparison with last week.
CANADAMonthly economic indicators
VARIATION (%)
REF. QUART. LEVEL
Quart. ann. 1 year 2016 2015 2014
Gross domestic product (2007 $M) 2017 Q3 1,860,679 1.7 3.0 1.4 1.0 2.9Household consumption (2007 $M) 2017 Q3 1,071,880 4.0 4.0 2.4 2.1 2.7Government consumption (2007 $M) 2017 Q3 358,066 3.0 2.3 2.2 1.6 0.5Residential investment (2007 $M) 2017 Q3 127,395 -1.4 2.6 3.3 3.8 2.2Non-residential investment (2007 $M) 2017 Q3 171,508 3.7 0.6 -9.4 -11.3 4.8
Business inventory change (2007 $M)1 2017 Q3 17,065 --- --- 978.0 4,711 8,662Exports (2007 $M) 2017 Q3 579,899 -10.2 -0.4 1.0 3.5 5.9Imports (2007 $M) 2017 Q3 594,543 -0.2 2.4 -1.0 0.7 2.3Final domestic demand (2007 $M) 2017 Q3 1,847,387 3.7 3.2 1.1 0.3 2.1GDP deflator (2007 = 100) 2017 Q3 115.2 0.0 1.9 0.6 -0.8 2.0Labour productivity (2007 = 100) 2017 Q3 109.0 -2.3 0.8 0.6 -0.5 3.0Unit labour cost (2007 = 100) 2017 Q3 114.9 4.8 0.7 -0.1 2.3 0.6
Current account balance ($M)1 2017 Q3 -19,346 --- --- -65,372 -71,526 -47,779
Production capacity utilization rate (%)1 2017 Q3 85.0 --- --- 80.2 80.5 82.3Disposable personal income ($M) 2017 Q3 1,208,252 3.4 3.7 2.2 4.7 3.3Corporate net operating surplus (2007 $M) 2017 Q3 269,708 -2.8 14.6 -1.9 -19.8 10.1
1 Statistics representing the level during the period; * New statistic in comparison with last week.
CANADAQuarterly economic indicators
VARIATION (%) ANNUAL VARIATION (%)
ECONOMIC STUDIES
10FEBRUARY 9, 2018 | WEEKLY NEWSLETTER
ACTUAL
Feb. 9 Feb. 2 -1 month -3 months -6 months -1 year Higher Average Lower
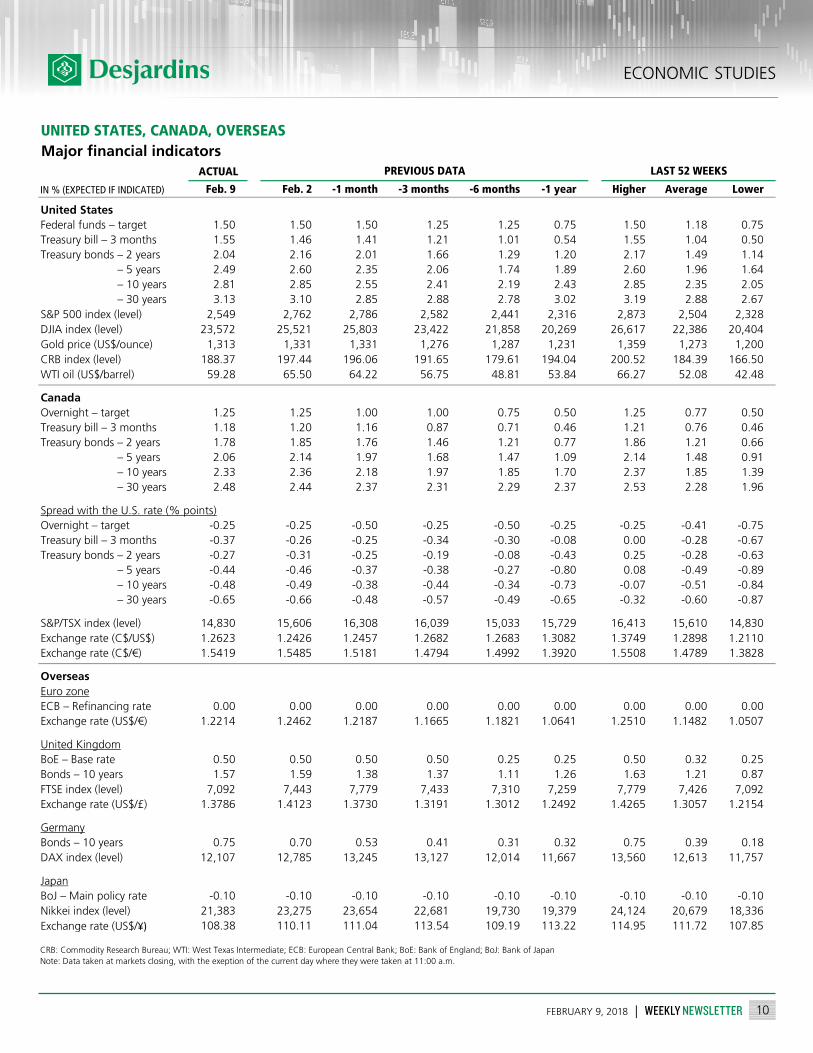
United StatesFederal funds – target 1.50 1.50 1.50 1.25 1.25 0.75 1.50 1.18 0.75Treasury bill – 3 months 1.55 1.46 1.41 1.21 1.01 0.54 1.55 1.04 0.50Treasury bonds – 2 years 2.04 2.16 2.01 1.66 1.29 1.20 2.17 1.49 1.14Treasury bonds – 5 years 2.49 2.60 2.35 2.06 1.74 1.89 2.60 1.96 1.64Treasury bonds – 10 years 2.81 2.85 2.55 2.41 2.19 2.43 2.85 2.35 2.05Treasury bonds – 30 years 3.13 3.10 2.85 2.88 2.78 3.02 3.19 2.88 2.67S&P 500 index (level) 2,549 2,762 2,786 2,582 2,441 2,316 2,873 2,504 2,328DJIA index (level) 23,572 25,521 25,803 23,422 21,858 20,269 26,617 22,386 20,404Gold price (US$/ounce) 1,313 1,331 1,331 1,276 1,287 1,231 1,359 1,273 1,200CRB index (level) 188.37 197.44 196.06 191.65 179.61 194.04 200.52 184.39 166.50WTI oil (US$/barrel) 59.28 65.50 64.22 56.75 48.81 53.84 66.27 52.08 42.48
CanadaOvernight – target 1.25 1.25 1.00 1.00 0.75 0.50 1.25 0.77 0.50Treasury bill – 3 months 1.18 1.20 1.16 0.87 0.71 0.46 1.21 0.76 0.46Treasury bonds – 2 years 1.78 1.85 1.76 1.46 1.21 0.77 1.86 1.21 0.66Treasury bonds – 5 years 2.06 2.14 1.97 1.68 1.47 1.09 2.14 1.48 0.91Treasury bonds – 10 years 2.33 2.36 2.18 1.97 1.85 1.70 2.37 1.85 1.39Treasury bonds – 30 years 2.48 2.44 2.37 2.31 2.29 2.37 2.53 2.28 1.96
Spread with the U.S. rate (% points)Overnight – target -0.25 -0.25 -0.50 -0.25 -0.50 -0.25 -0.25 -0.41 -0.75Treasury bill – 3 months -0.37 -0.26 -0.25 -0.34 -0.30 -0.08 0.00 -0.28 -0.67Treasury bonds – 2 years -0.27 -0.31 -0.25 -0.19 -0.08 -0.43 0.25 -0.28 -0.63Treasury bonds – 5 years -0.44 -0.46 -0.37 -0.38 -0.27 -0.80 0.08 -0.49 -0.89Treasury bonds – 10 years -0.48 -0.49 -0.38 -0.44 -0.34 -0.73 -0.07 -0.51 -0.84Treasury bonds – 30 years -0.65 -0.66 -0.48 -0.57 -0.49 -0.65 -0.32 -0.60 -0.87
S&P/TSX index (level) 14,830 15,606 16,308 16,039 15,033 15,729 16,413 15,610 14,830Exchange rate (C$/US$) 1.2623 1.2426 1.2457 1.2682 1.2683 1.3082 1.3749 1.2898 1.2110Exchange rate (C$/€) 1.5419 1.5485 1.5181 1.4794 1.4992 1.3920 1.5508 1.4789 1.3828
OverseasEuro zoneECB – Refinancing rate 0.00 0.00 0.00 0.00 0.00 0.00 0.00 0.00 0.00Exchange rate (US$/€) 1.2214 1.2462 1.2187 1.1665 1.1821 1.0641 1.2510 1.1482 1.0507
United KingdomBoE – Base rate 0.50 0.50 0.50 0.50 0.25 0.25 0.50 0.32 0.25Bonds – 10 years 1.57 1.59 1.38 1.37 1.11 1.26 1.63 1.21 0.87FTSE index (level) 7,092 7,443 7,779 7,433 7,310 7,259 7,779 7,426 7,092Exchange rate (US$/£) 1.3786 1.4123 1.3730 1.3191 1.3012 1.2492 1.4265 1.3057 1.2154
GermanyBonds – 10 years 0.75 0.70 0.53 0.41 0.31 0.32 0.75 0.39 0.18DAX index (level) 12,107 12,785 13,245 13,127 12,014 11,667 13,560 12,613 11,757
JapanBoJ – Main policy rate -0.10 -0.10 -0.10 -0.10 -0.10 -0.10 -0.10 -0.10 -0.10Nikkei index (level) 21,383 23,275 23,654 22,681 19,730 19,379 24,124 20,679 18,336Exchange rate (US$/¥) 108.38 110.11 111.04 113.54 109.19 113.22 114.95 111.72 107.85
CRB: Commodity Research Bureau; WTI: West Texas Intermediate; ECB: European Central Bank; BoE: Bank of England; BoJ: Bank of JapanNote: Data taken at markets closing, with the exeption of the current day where they were taken at 11:00 a.m.
UNITED STATES, CANADA, OVERSEASMajor financial indicators
IN % (EXPECTED IF INDICATED)
PREVIOUS DATA LAST 52 WEEKS