vol2no2 17
TRANSCRIPT

Volume 2 No. 2, February 2012 ISSN 2223-4985
International Journal of Information and Communication Technology Research
©2012 ICT Journal. All rights reserved
http://www.esjournals.org
207
A Novel Edge Detection Algorithm for Digital Mammogram
Indra Kanta Maitra, Sanjay Nag, Samir K. Bandyopadhyay Department of Computer Science & Engineering
University of Calcutta Kolkata, India
ABSTRACT
Detection of edges in an image is a very important step towards understanding image features. Since edges often occur at image locations representing object boundaries, edge detection is extensively used in image segmentation when images are divided into areas corresponding to different objects. This can be used specifically for enhancing the tumor area in mammographic images. Different methods are available for edge detection like Roberts, Sobel, Prewitt, Kirsch and Laplacian of Gaussian edge operators. In this paper a novel algorithm for edge detection has been proposed for mammographic images. Breast boundary, pectoral region and tumor location can be seen clearly by using this method. For comparison purpose Roberts, Sobel, Prewitt, Kirsch and Laplacian of Gaussian edge operators are used and their results are displayed.
Keywords- Mammographic Images, Edge Detection, Segmentation, Edge Operator, Filter
1. INTRODUCTION
Diagnostic imaging is a vital tool in medicine today. These imaging techniques provide an effective means for noninvasive mapping of the anatomy of an organ of a patient. These technologies have greatly increased knowledge of normal and diseased anatomy for medical research and are a critical component in diagnosis and treatment planning. With the increasing size and number of medical images, the use of computers for processing and analysis of medical images has become necessary and critical. The relative change in size, shape and the spatial relationships between anatomical structures obtained from intensity distributions provide important information in clinical diagnosis for monitoring disease progression. Therefore, radiologists are particularly interested to observe the size, shape and texture of the organs and/or parts of the organ. The recognition, labeling and the quantitative measurement of specific objects and structures are involved in the analysis of medical images. To provide the information about an object clinically in terms of its morphology and anatomy, image segmentation and classification are important tools to obtain the desired information.
In medical images edge detection is an important work for object recognition of the human organs such as breasts. For mammograms manifesting masses this corresponds to the detection of suspicious mass regions. The work of the edge detection decides
the result of the final processed image. Conventionally, edge is detected according to some early brought forward algorithms like Sobel algorithm, Prewitt algorithm and Laplacian of Gaussian operator, but in theory these operators belongs to the high pass filtering, which are not suitable for noisy images.
The medical image detection system consists of several phases. The first phase consists of capturing of the medical image by common capture devices like X-ray, MRI (Magnetic Resonance Imaging), CT (Computed Tomography), Mammographic Devices and Sonographer devices. In the next phase we need to convert the mode of medical image to gray scale image. Medical images from different devices show different intensities. We need to adjust the intensity to get a normalized intensity level. Then we need to apply an edge-detection filter on the image. In this paper, we have proposed a new edge-detection technique for mammographic images. We have compared the results obtained by our proposed method with other known methods of edge detection namely, Sobel, Prewit, Roberts, Kirsch and LoG edge detection filters. The final phase of the detection system is feature extraction. The objective of this process is to find the specification of the medical image and define the image morphology.
This paper is organized as follows. Section 2 describes the background of edge detection where the classical edge detection filters have been discussed. Section 3 describes our proposed algorithms for edge detection of mammographic. Comparative results of

Volume 2 No. 2, February 2012 ISSN 2223-4985
International Journal of Information and Communication Technology Research
©2012 ICT Journal. All rights reserved
http://www.esjournals.org
208
edge detection for methods described in Section 2 and Section 3 are displayed in Section 4 and Section 5 concludes the work.
2. BACKGROUND
Edge detection is a problem of fundamental importance in image analysis. In a typical image, edges characterize object boundaries and are therefore useful for segmentation, registration, and identification of objects in a scene.
Edge detection is one of the most commonly used operations in image analysis. An edge is defined by a discontinuity in gray level values. In other words, an edge is the boundary between an object and the background. The shape of edges in images depends on many parameters: The geometrical and optical properties of the object, the illumination conditions, and the noise level in the images [1]. The importance of the classification is that it simplifies several problems in Artificial Vision and Image Processing, by associating specific processing rules to each type of edges [2].
In practice, sampling, and other image acquisition imperfections yield edges that are blurred, with the degree of blurring being determined by the factors such as quality of the image acquisition system, the sampling rate, and illumination conditions under which the image is acquired. As a result, edges are more closely modeled as having a "ramp like" profile. The slope of the ramp is inversely proportional to the degree of blurring in the edge. The blurred edges tend to be thick and sharp edges tend to be thin [3].
The common classification is based on the behavioral study of these edges with respect to the following differentiation operators:
2.1. Gradient Edge Detectors (First Derivative or Classical)
An image gradient is a directional change in the intensity or color in an image. Image gradients may be used to extract information from images. The gradient of a two-variable function image intensity function is at each image point a 2D vector with the components given by the derivatives in the horizontal and vertical directions. At each image point, the gradient vector points in the direction of largest possible intensity increase, and the length of the gradient vector corresponds to the rate of change in that direction.
Roberts' Cross
Roberts Cross operator is one of the first edge
detectors and was initially proposed by Lawrence Roberts in 1963 [4]. It is a differential operator. The idea is to approximate the gradient of an image through discrete differentiation which is achieved by computing the sum of the squares of the differences between diagonally adjacent pixels. According to Roberts, an edge detector should have the following properties: the produced edges should be well-defined, the background should contribute as little noise as possible, and the intensity of edges should correspond as close as possible to what a human would perceive. With these criteria in mind and based on then prevailing psychophysical theory Roberts proposed the following equations:
and
Where x is the initial intensity value in the
image, z is the computed derivative and i,j represent the location in the image. The results of this operation will highlight changes in intensity in a diagonal direction. One of the most appealing aspects of this operation is its simplicity; the kernel is small and contains only integers. However with the speed of computers today this advantage is negligible and the Roberts cross suffers greatly from sensitivity to noise [5].
To perform edge detection with the Roberts operator we first convolve the original image, with the following two kernels:
Let I(x,y) be a point in the original image and
Gx(x,y) be a point in an image formed by convolving with the first kernel and Gy(x,y) be a point in an image formed by convolving with the second kernel. The gradient can then be defined as:
The direction of the gradient can also be defined as follows:
Sobel Filter
It is a discrete differentiation operator, computing an approximation of the gradient of the
Volume 2 No. 2, February 2012 ISSN 2223-4985
International Journal of Information and Communication Technology Research
©2012 ICT Journal. All rights reserved
http://www.esjournals.org
209
image intensity function. At each point in the image, the result of the Sobel operator is either the corresponding gradient vector or the norm of this vector. The Sobel operator is based on convolving the image with a small, separable, and integer valued filter in horizontal and vertical direction and is therefore relatively inexpensive in terms of computations. Mathematically, the operator uses two 3×3 kernels which are convolved with the original image to calculate approximations of the derivatives - one for horizontal changes, and one for vertical [6]. If we define A as the source image, and Gx and Gy are two images which at each point contain the horizontal and vertical derivative approximations, the computations are as follows:
Where * here denotes the 2-dimensional convolution operation. The x-coordinate is here defined as increasing in the "right"-direction, and the y-coordinate is defined as increasing in the "down"-direction. At each point in the image, the resulting gradient approximations can be combined to give the gradient magnitude, using:
Using this information, we can also calculate the gradient's direction:
Where, for example, Θ is 0 for a vertical edge which is darker on the left side [3]. Prewitt Filter
It is a discrete differentiation operator, computing an approximation of the gradient of the image intensity function. At each point in the image, the result of the Prewitt operator is either the corresponding gradient vector or the norm of this vector. The Prewitt operator is based on convolving the image with a small, separable, and integer valued filter in horizontal and vertical direction and is therefore relatively inexpensive in terms of computations. Mathematically, the operator uses two 3×3 kernels which are convolved with the original image to calculate approximations of the derivatives - one for horizontal changes, and one for
vertical [7]. If we define A as the source image, Gx and Gy are two images which at each point contain the horizontal and vertical derivative approximations, the latter are computed as:
Compass Operator - Kirsch Operator
The kirsch edge detector detects edges using eight filters that are applied to the image. The eight filters are a rotation of a basic compass convolution filter. For comparison with Sobel and Prewitt operator here only two directions horizontal and vertical convolution kernels (3x3) are considered.The operator is calculated as follows for directions with 45° difference:
where the direction kernels and so on.
2.2. Second – Order derivative Method Some edge-detection operators are instead
based upon second-order derivatives of the intensity. They essentially capture the rate of change in the intensity gradient. Thus, in the ideal continuous case, detection of zero-crossings in the second derivative captures local maxima in the gradient. In order to effectively detect intensity changes (edges), the operator needs to have two characteristics. First, it must be a differential operator, taking either a first or second spatial derivative of the image. Second, it should be capable of being tuned to act at any desired scale so that large filters can be used to detect blurry shadow edges, and small ones can be used to detect sharply focused fine detail in the image. This led to the so-called Laplacian-of-Gaussian edge operator.

Volume 2 No. 2, February 2012 ISSN 2223-4985
International Journal of Information and Communication Technology Research
©2012 ICT Journal. All rights reserved
http://www.esjournals.org
210
Laplacian of Gaussian (LoG)
This is a compound operator that combines a smoothing operation, using a Gaussian-shaped, linear-phase FIR filter, with a differentiation operation, using a discrete Laplacian [8]. The edges are identified by the location of zero crossings (recall that the second derivative changes sign in the vicinity of maxima of the first derivative). As Laplace operator may detect edges as well as noise (isolated, out-of-range), it may be desirable to smooth the image first by convolution with a Gaussian kernel of width
to suppress the noise before using Laplace for edge detection:
The first equal sign is due to the fact that
So we can obtain the Laplacian of Gaussian ∆Gσ(x, y)first and then convolve it with the input image. To do so, first consider
and
Note that for simplicity we omitted the normalizing coefficient 1
√2πσ2� . Similarly we can get
Now we have LoG as an operator or convolution kernel defined as
2D LoG can be approximated by a 5 by 5 convolution kernel such as:
The kernel of any other sizes can be obtained
by approximating the continuous expression of LoG given above. However, we must make sure that the sum (or average) of all elements of the kernel has to be zero (similar to the Laplace kernel) so that the convolution result of a homogeneous regions is always zero. The edges in the image can be obtained by these steps: • Applying LoG to the image • Detection of zero-crossings in the image • Threshold the zero-crossings to keep only those
strong ones (large difference between the positive maximum and the negative minimum). This last step is needed to suppress the weak zero-crossings most likely caused by noise.
In the ideal case, the result of applying an edge
detector to an image may lead to a set of connected curves that indicate the boundaries of objects. Thus, applying an edge detection algorithm to an image may significantly reduce the amount of data to be processed and may therefore filter out information that may be regarded as less relevant, while preserving the important structural properties of an image. Edges extracted from an image is often hampered by fragmentation, meaning that the edge curves are not connected, missing edge segments as well as false edges, thus complicating the subsequent task of interpreting the image data[9]. Edge detection is one of the fundamental steps in image processing, image analysis, image pattern recognition, and computer vision techniques [10].
3. PROPOSED METHOD
The detection of edge in mammographic images is done in two phases. In the first phase the mammographic image is homogenized and the color is quantized to a set of sixteen color gray scale palette. This process is carried out in both x direction (horizontal) and in the y direction (vertical) so that the

Volume 2 No. 2, February 2012 ISSN 2223-4985
International Journal of Information and Communication Technology Research
©2012 ICT Journal. All rights reserved
http://www.esjournals.org
211
image is homogenized in both directions. Then we detect the edge by traversing the image in two passes to obtain the horizontal and vertical edge points. The final edge map is the union of edges obtained in the two passes. The outline of the process is as follows:
3.1. Binary Homogeneity Enhancement Algorithm (BHEA)
In this research paper we have proposed a new
homogeneity enhancement process namely Binary Homogeneity Enhancement Algorithm (BHEA) for digital mammogram. In this process, the Mammogram image is treated as an array of pixel data. First step of the process is to determine the dimension of the image and determine the middle position of image array. We then take a maximum difference threshold (MDT) value i.e. ± Δd, which is constant threshold determine by the intensity of the image. The homogeneity process is done in two passes. In the first pass the image is scanned in horizontal direction considering each row from the first row till the last row of the image. In the next pass the same process is repeated in the vertical direction by considering a column wise scanning, starting from first column till the last column of the image.
The algorithm starts by checking intensity values from the image data by horizontally scanning from leftmost pixel of a row of a two dimensional pixel array to the rightmost pixel of the same row. The algorithm considers one row of image data at a time and after completing the operations iterates to the next row and continues till the last row is reached. If the result of any subtraction is greater than the MDT, the one dimensional pixel array constituting the row will be divided into two equal subsets along the middle position (M).
│Px,y – Px+1,y │ › Δd (1)
M = Px+n,y−Px,y
2 (2)
S1(Pi … M) , S2(M+1 … Pn) where I = x to n
The first subset containing pixels from the first position till the middle position and the second subset containing pixels from middle position till the last position will be pushed to a stack. Otherwise, the statistical mode value of image intensity of the pixels within the subset will be propagated to all the pixels within the current subset of pixels. This is done after modifying intensity value using uniform color quantization technique to obtain quantized value (Q) in color space breaking in sixteen level scales. The statistical mode value is taken as the image intensity of surrounding pixels is prevalently of similar intensity with only few pixels are dissimilar. The central tendency is better represented by the statistical mode operation.
Where Mode = fmax(∑ Pix+ni=x ) (3)
Q = Mode/16
f(B) = ∑ (Pix+ni=x =Q) (4)
The process will be continued, popping the
subset of arrays from the stack and repeating the aforesaid process. The process will be continued until the stack is empty.
f(Mif(B)) = f(Mi f(B)),f(Mi+1f(B)), …..f(Mn
f(B)) (5)
In the next pass the same process will be
repeated by scanning the image vertically from top to bottom considering each individual column, from first column till the last column in the two dimensional pixel array representing the mammographic image. The algorithm considers one column of image data at a time and after completing the operations iterates to the next column and continues till the last column is reached. If the result of any subtraction of image intensity is greater than the MDT, the one dimensional pixel array constituting the column will be divided into two equal subsets along the middle position (M).
│Px,y – Px,y+1 │ › Δd (6)
BHE Mammogram
Horizontal Processing
Vertical Processing
Edge Map of Mammogram

Volume 2 No. 2, February 2012 ISSN 2223-4985
International Journal of Information and Communication Technology Research
©2012 ICT Journal. All rights reserved
http://www.esjournals.org
212
M = Px,y+n−Px,y
2 (7)
S1(Pi … M) , S2(M+1 … Pn) where i=x to n
The first subset containing pixels from the first position till the middle position and the second subset containing pixels from middle position till the last position will be pushed to a stack. Otherwise, the statistical mode value of image intensity of the pixels within the subset will be propagated to all the pixels within the current subset of pixels. This is done after modifying intensity value using uniform color quantization technique to obtain quantized value (Q) in color space breaking in sixteen level scales. The statistical mode value is taken to obtain the central tendency as provided by the equation (3).
f(B) = ∑ (Piy+ni=y =Q) (8)
The process will be continued, popping the subset of arrays from the stack and repeating the aforesaid process. The process will be continued until the stack is empty.
f(Mif(B)) = f(Mi f(B)),f(Mi+1f(B)), …..f(Mn
f(B)) (9)
(a) (b) (c)
Figure. 1. (a) Showing a 6X6 pixel 2-D array with different intensities, (b) The 6X6 pixel 2-D array is homogenized in horizontal direction in first pass of algorithm, (c) The final 6X6 pixel 2-D array after homogenized in vertical direction in second pass.
The resultant image obtained after the two passes of the algorithm represents the mammographic image that has homogenous regions that is color quantized to sixteen-color in gray scale. This image forms the input image for the edge detection process.
3.2. Edge Detection Algorithm (EDA) After the mammogram image was processed
by the proposed Binary Homogeneity Enhancement Algorithm (BHEA) we obtain an image that is homogenous and have pixels in gray scale of sixteen level scales. This image forms the input for the next level of processing for detection of the edge, i.e. breast
boundary and the breast region. In this research paper we have proposed a new method for detecting edge rather than using one of the known methods of edge detection that uses a convolution filter.
It can be observed that all the mammogram images in the mini MIAS database, has the image of the breast at the center (left to right or right to left), and is bounded by non-breast image on either side. The mammogram image have skin-air interface on the side of the nipple where the air interface have black pixels. Similarly, the other side behind the breast has well defined baseline that separates the breast image from the body and contains black pixels. We consider these features in our proposed method of edge detection.
The edge detection process is done in three passes. In the first pass the scanning of image is done horizontally in the x direction i.e in a row major order. The algorithms start from the leftmost pixel of the first row and traverse all pixels on the first row to reach the last pixel of the first row. Then we repeat the scanning of pixel from the next row and continue to subsequent rows till we reach the last pixel in the last row of the two dimensional image data array. An adaptive threshold value (Δt) is taken for pixel intensity comparison. The threshold value changes depending on the intensity of the pixels in the surrounding region. During the scanning of pixels the algorithm compares the intensities of subsequent pixels. If a change in intensity is observed between two pixels that exceed the absolute threshold value then the algorithm marks the last pixel as edge and adds this pixel location to the horizontal edge map image.
f(h) = ∑ ∑ �Px,y − Px+i,y�ci=0
rj=0 > ∆t (10)
The algorithm now continues the scanning of image vertically in the y direction i.e. in a column major order. The algorithm starts from the topmost pixel of the first column and traverse all pixels on the first column to reach the last pixel of the first column. Then we repeat the scanning of pixel from the next column and continue to subsequent columns till we reach the last pixel in the last column of the two dimensional image data array. The same technique of adaptive threshold value (Δt) is taken for pixel intensity comparison. During the scanning of pixel the algorithm compares the image intensities of subsequent pixels. If a change in intensity is observed between two pixels that exceed the absolute threshold value then the algorithm marks the last pixel as edge and adds this pixel location to the vertical edge map image.
F(v) = ∑ ∑ �Px,y − Px,y+i�ri=0
cj=0 > ∆t (11)
Volume 2 No. 2, February 2012 ISSN 2223-4985
International Journal of Information and Communication Technology Research
©2012 ICT Journal. All rights reserved
http://www.esjournals.org
213
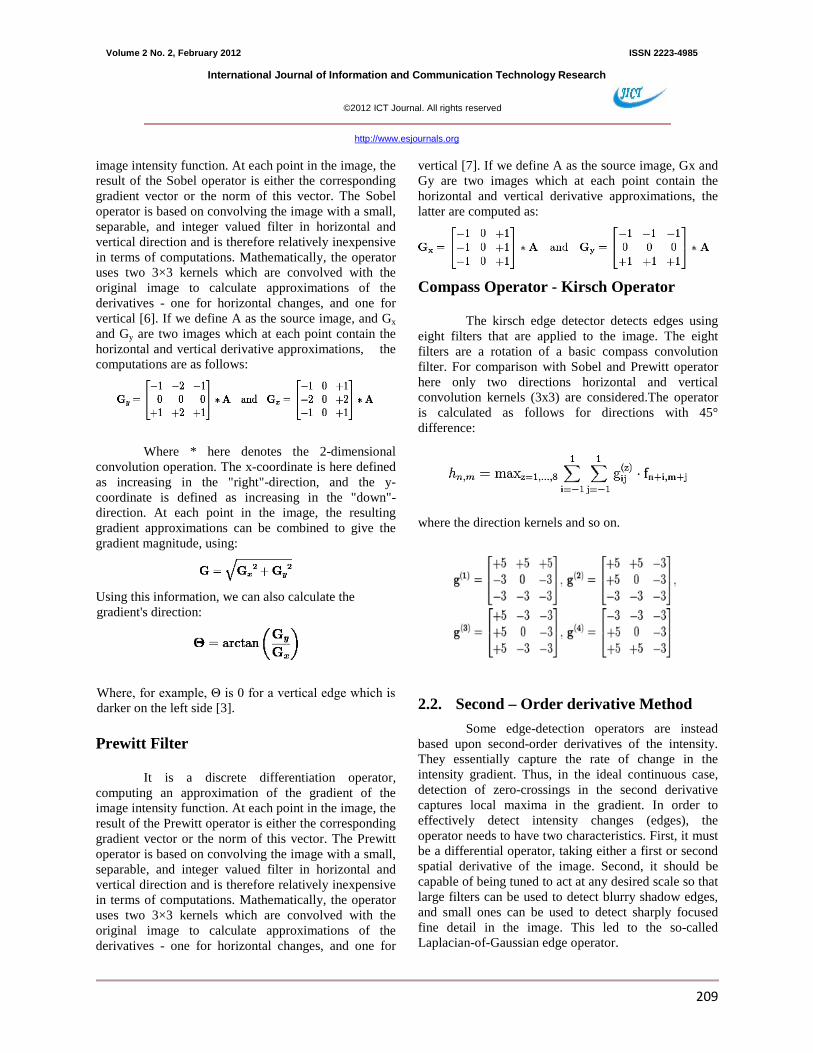
Finally, in the last pass we merge the Horizontal Edge Map image with Vertical Edge Map image by performing a Union operation on the two image files, to obtain the Edge map of mammogram image. The edge image obtained uniquely contains single pixel continuous edge line as a result we need not perform further edge thinning process. The edge line is continuous so the process of edge linking is also not required.
EdgeMap = f(h) U f(v) (12)
(a) (b)
(c) (d)
Figure. 2. (a) The 6X6 pixel 2-D array of image after performing the
first pass of EDA showing horizontal edge map image, (b) The 6X6 pixel 2-D array of image after performing the second pass of EDA showing vertical edge map image, (c) The 6X6 pixel 2-D array of image after performing the Union showing complete edge map image, (d) The final output of EDA with edge map image on a white background (Monotone image).
The edge map image is mostly free from any noise that is observed in other known methods of edge detection. It can be observed from the edge map image that each region of the breasts in a mammogram image is clearly visible. The edge detection process has also separated the breast boundary from the exterior non breast region. The edge map image also clearly demarcates the pectoral muscle region thus making it easier to obtain the breast region of interest. Abnormal masses or other abnormalities if present within the mammogram image is clearly visible and forms closed objects that can be easily isolated from the image. With this edge detection method, the image segmentation process becomes very easy as most of the breast region is already isolated by the process. This edge detection method is simple, fast as it does not require convolution, robust and can also be implemented to other medical imaging with little modifications.
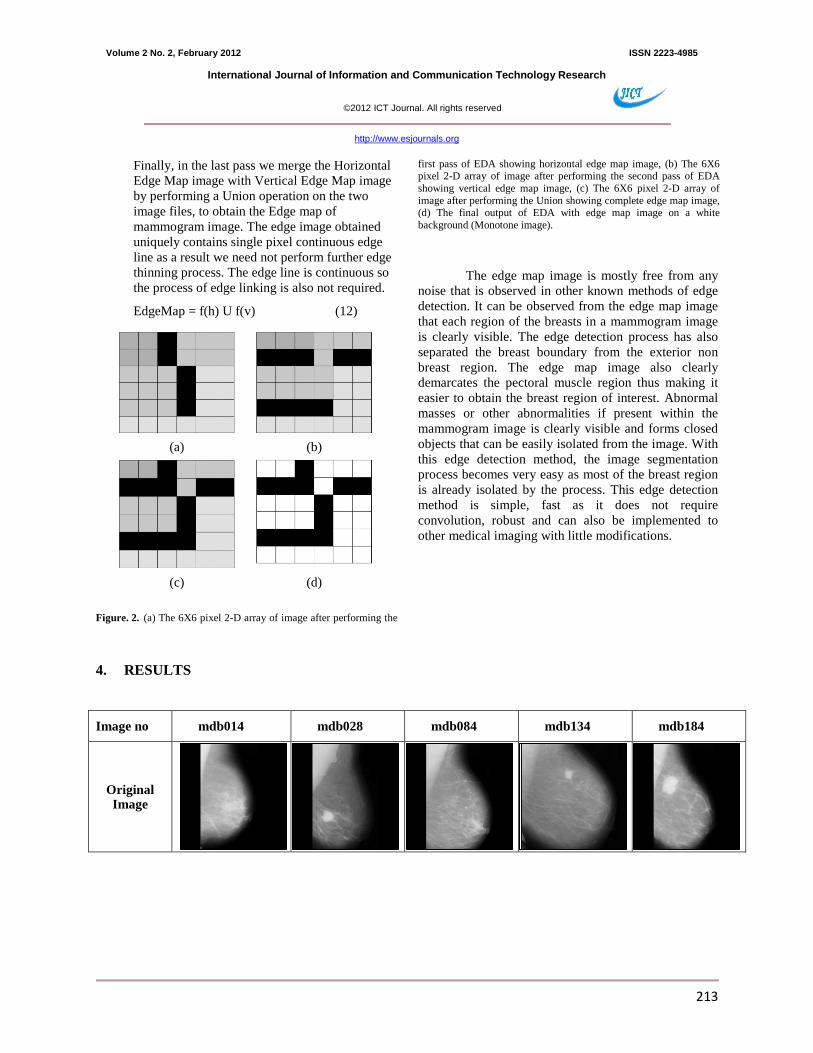
4. RESULTS
Image no mdb014 mdb028 mdb084 mdb134 mdb184
Original Image

Volume 2 No. 2, February 2012 ISSN 2223-4985
International Journal of Information and Communication Technology Research
©2012 ICT Journal. All rights reserved
http://www.esjournals.org
214
Roberts
Prewit
Sobel
Kirsch
LoG
BHEA+ EDA
5. CONCLUSION
The proposed algorithm produces edge map image that uniquely contains single pixel continuous edge line so edge thinning process is not required. The edge line is continuous so the process of edge linking is
also not required. The edge map image is free from any noise that is observed in other known methods of edge detection. It can be observed from the edge map image that each region of the breasts is clearly visible. The added advantage of this edge detection process is that it separated the breast boundary from the exterior non

Volume 2 No. 2, February 2012 ISSN 2223-4985
International Journal of Information and Communication Technology Research
©2012 ICT Journal. All rights reserved
http://www.esjournals.org
215
breast region. The edge map image also clearly demarcates the pectoral muscle region thus making it easier to obtain the breast region of interest (ROI) for further studies. Abnormal masses within the mammogram image are clearly visible and forms closed objects that can be easily isolated from the image. With this edge detection method, the image segmentation process becomes simple. This method is simple, efficient as it does not require convolution, robust and can also be made useful for other medical imaging with little modifications.
REFERENCES
[1] H.Chidiac, D.Ziou, “Classification of Image Edges”,Vision Interface’99, Troise-Rivieres, Canada, 1999.pp. 17-24.
[2] Q.Ji, R.M.Haralick, “Quantitative Evaluation of Edge Detectors using the Minimum Kernel Variance Criterion”, ICIP 99. IEEE International Conference on Image Processing volume: 2, 1999, pp.705-709.
[3] Gonzalez, Rafael; Richard Woods. "3". Digital Image Processing (3rd ed.). Upper Saddle River, New Jersey: Pearson Education, Inc. pp. 165–68. ISBN 978-0-13-168728-8.
[4] Pellegrino FA, Vanzella W, Torre V. Edge Detection Revisited. IEEE Trans Syst Man Cybernetics Part B Cybernetics 2004; 34(3):1500-18.
[5] LS. Davis, "A survey of edge detection techniques", Computer Graphics and Image Processing, Vol 4, no. 3, pp. 248-260, 1975.
[6] Rosin Pl, Ioannidis E. Evaluation of global image thresholding for change detection. Pattern Recognit Lett 2003; 24: 2345-56.
[7] Prewitt JMS. Object enhancement and extraction. In: Lipkin BS, Ed. Picture Processing and Psychopictorics. New York: Academic Press 1970; pp. 75-149.
[8] Huertas, A. and Medioni, G., “Detection of intensity changes with sub pixel accuracy using Laplacian-Gaussian masks,” IEEE Trans. On Pattern Analysis and Machine Intelligence, PAMI, vol. 8, pp. 651–664,1986
[9] T. Lindeberg (1998) "Edge detection and ridge detection with automatic scale selection", International Journal of Computer Vision, 30, 2, pages 117--154.
[10] Zhai, L., Dong, S., and Ma, H. 2008. Recent Methods and Applications on Image Edge Detection. In Proceedings of the 2008 international Workshop on Education Technology and Training & 2008 international Workshop on Geoscience and Remote Sensing - Volume 01 (December 21–22, 2008). ETTANDGRS. IEEE Computer Society, Washington, DC, 332-335.