vol. 6 no. 2, june 2015 ra ii wigos project newsletter · ra ii wigos project newsletter ... usa,...
TRANSCRIPT
- 1 -
Vol. 6 No. 2, June 2015
RA II WIGOS Project Newsletter DEVELOPING SUPPORT FOR NATIONAL METEOROLOGICAL AND HYDROLOGICAL SERVICES IN SATELLITE DATA, PRODUCTS AND TRAINING
Contents of this issue Page
Himawari-8 soon to be operational 1 The 43rd meeting of CGMS-43 in Boulder, USA, 18-22 May 2015 3 KMA’s improvement in cloud amount estimation from the COMS 7 Himawari-8 CSR product 10 The 1st KMA International Meteorological Satellite Conference 11 Members of the Coordinating Group 12 From the Co-editors 13
Himawari-8 soon to be operational The Japan Meteorological Agency (JMA) is
pleased to announce that its next-generation geostationary meteorological satellite, Himawari-8, will begin operation at 02:00 UTC on 7 July 2015, replacing the current operational satellite, MTSAT-2.
JMA has been testing and checking Himawari-8 and related systems since its launch on 7 October 2014. The satellite has captured incredible imagery during the commissioning phase as highlighted in this article. More samples:
http://www.jma.go.jp/jma/jma-eng/satellite/news/himawari89/20150501_himawari8_sample_data.html True-color imagery
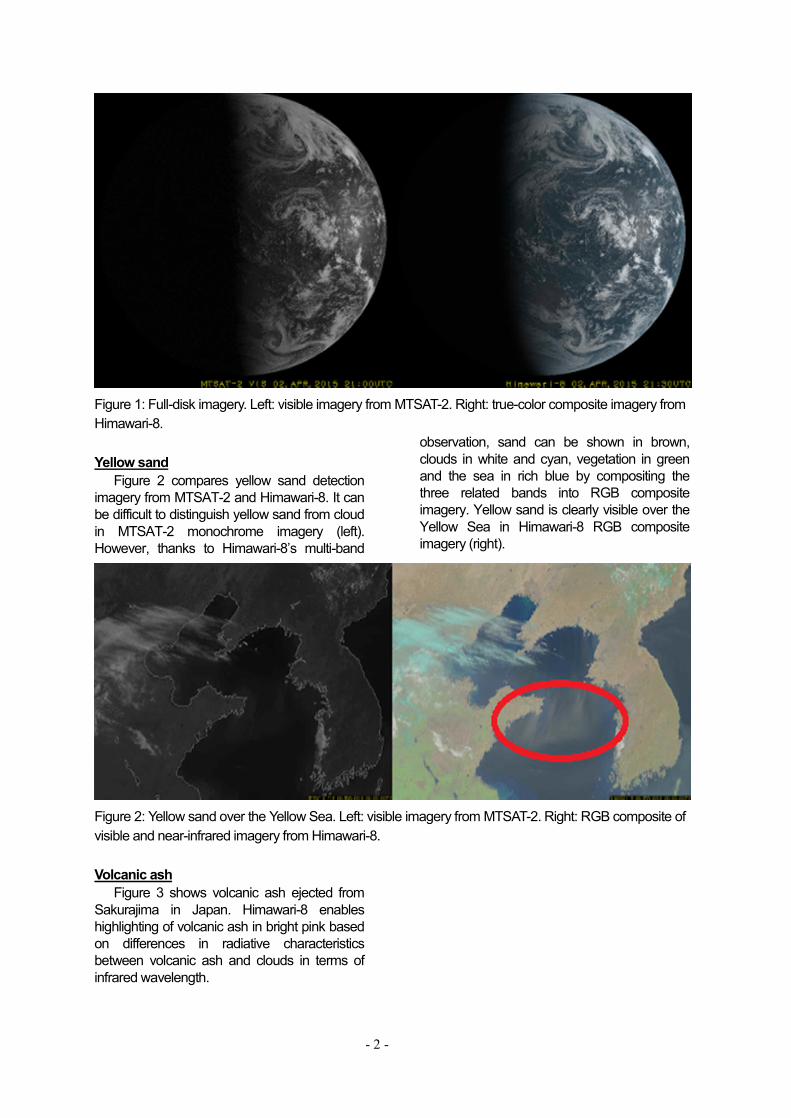
Figure 1 compares full-disk imagery between MTSAT-2 and Himawari-8. MTSAT-2 captures monochrome images with one visible band, whereas Himawari-8 enables the creation of true-color imagery with three visible bands corresponding to red, green and blue. In this way, it provides stunning images of the earth with details including white clouds, blue oceans and variously colored continents.
- 2 -
Figure 1: Full-disk imagery. Left: visible imagery from MTSAT-2. Right: true-color composite imagery from Himawari-8. Yellow sand
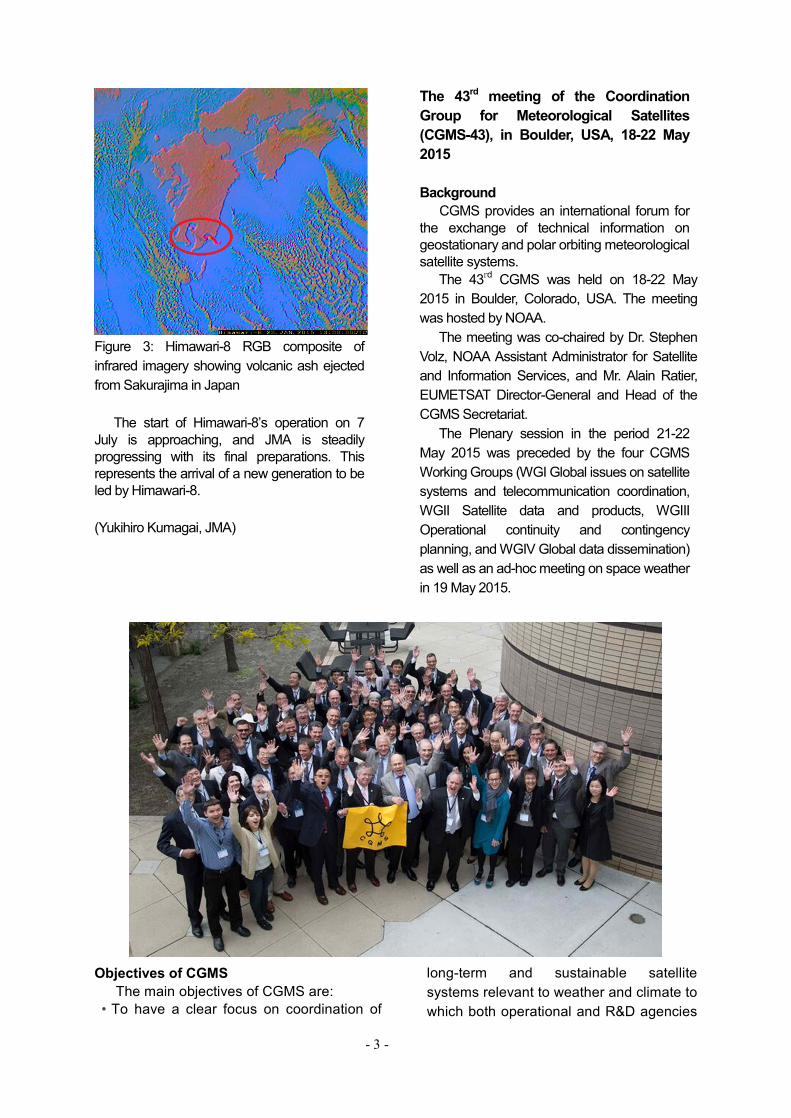
Figure 2 compares yellow sand detection imagery from MTSAT-2 and Himawari-8. It can be difficult to distinguish yellow sand from cloud in MTSAT-2 monochrome imagery (left). However, thanks to Himawari-8’s multi-band
observation, sand can be shown in brown, clouds in white and cyan, vegetation in green and the sea in rich blue by compositing the three related bands into RGB composite imagery. Yellow sand is clearly visible over the Yellow Sea in Himawari-8 RGB composite imagery (right).
Figure 2: Yellow sand over the Yellow Sea. Left: visible imagery from MTSAT-2. Right: RGB composite of visible and near-infrared imagery from Himawari-8. Volcanic ash
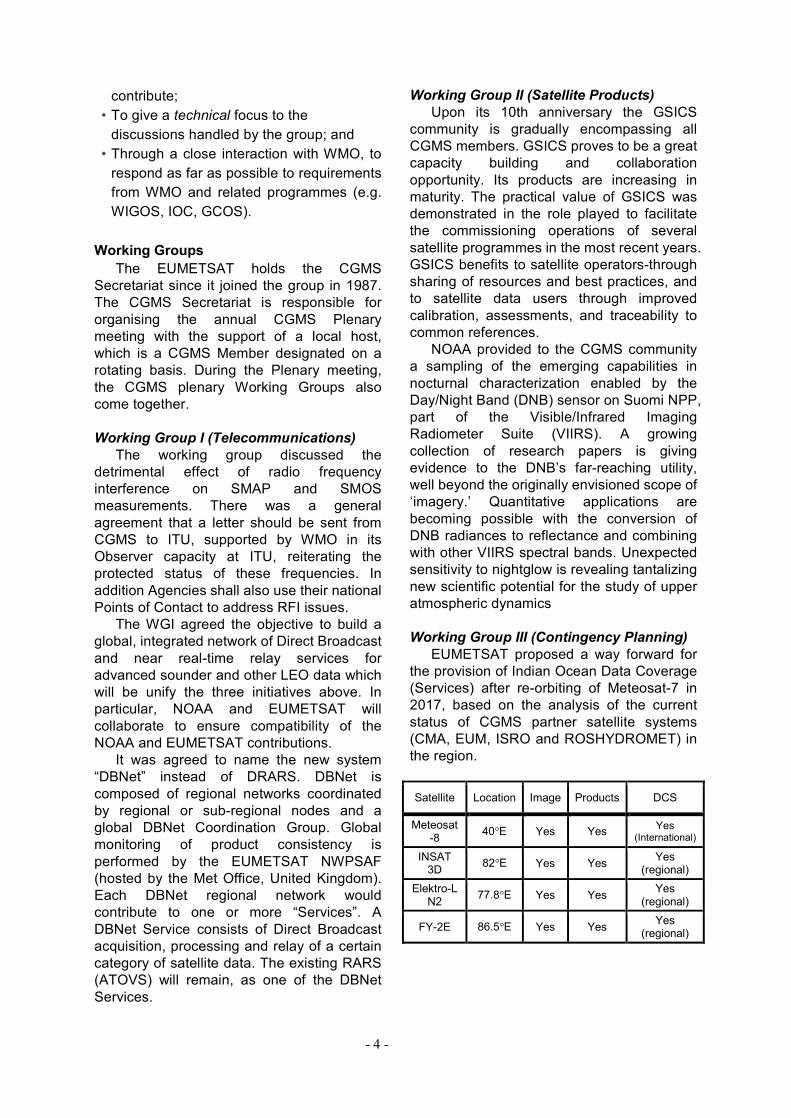
Figure 3 shows volcanic ash ejected from Sakurajima in Japan. Himawari-8 enables highlighting of volcanic ash in bright pink based on differences in radiative characteristics between volcanic ash and clouds in terms of infrared wavelength.
- 3 -
Figure 3: Himawari-8 RGB composite of infrared imagery showing volcanic ash ejected from Sakurajima in Japan
The start of Himawari-8’s operation on 7 July is approaching, and JMA is steadily progressing with its final preparations. This represents the arrival of a new generation to be led by Himawari-8. (Yukihiro Kumagai, JMA)
The 43rd meeting of the Coordination Group for Meteorological Satellites (CGMS-43), in Boulder, USA, 18-22 May 2015 Background
CGMS provides an international forum for the exchange of technical information on geostationary and polar orbiting meteorological satellite systems.
The 43rd CGMS was held on 18-22 May 2015 in Boulder, Colorado, USA. The meeting was hosted by NOAA.
The meeting was co-chaired by Dr. Stephen Volz, NOAA Assistant Administrator for Satellite and Information Services, and Mr. Alain Ratier, EUMETSAT Director-General and Head of the CGMS Secretariat.
The Plenary session in the period 21-22 May 2015 was preceded by the four CGMS Working Groups (WGI Global issues on satellite systems and telecommunication coordination, WGII Satellite data and products, WGIII Operational continuity and contingency planning, and WGIV Global data dissemination) as well as an ad-hoc meeting on space weather in 19 May 2015.
Objectives of CGMS The main objectives of CGMS are:
• To have a clear focus on coordination of
long-term and sustainable satellite systems relevant to weather and climate to which both operational and R&D agencies
- 4 -
contribute; • To give a technical focus to the
discussions handled by the group; and • Through a close interaction with WMO, to
respond as far as possible to requirements from WMO and related programmes (e.g. WIGOS, IOC, GCOS).
Working Groups
The EUMETSAT holds the CGMS Secretariat since it joined the group in 1987. The CGMS Secretariat is responsible for organising the annual CGMS Plenary meeting with the support of a local host, which is a CGMS Member designated on a rotating basis. During the Plenary meeting, the CGMS plenary Working Groups also come together. Working Group I (Telecommunications)
The working group discussed the detrimental effect of radio frequency interference on SMAP and SMOS measurements. There was a general agreement that a letter should be sent from CGMS to ITU, supported by WMO in its Observer capacity at ITU, reiterating the protected status of these frequencies. In addition Agencies shall also use their national Points of Contact to address RFI issues.
The WGI agreed the objective to build a global, integrated network of Direct Broadcast and near real-time relay services for advanced sounder and other LEO data which will be unify the three initiatives above. In particular, NOAA and EUMETSAT will collaborate to ensure compatibility of the NOAA and EUMETSAT contributions.
It was agreed to name the new system “DBNet” instead of DRARS. DBNet is composed of regional networks coordinated by regional or sub-regional nodes and a global DBNet Coordination Group. Global monitoring of product consistency is performed by the EUMETSAT NWPSAF (hosted by the Met Office, United Kingdom). Each DBNet regional network would contribute to one or more “Services”. A DBNet Service consists of Direct Broadcast acquisition, processing and relay of a certain category of satellite data. The existing RARS (ATOVS) will remain, as one of the DBNet Services.
Working Group II (Satellite Products) Upon its 10th anniversary the GSICS
community is gradually encompassing all CGMS members. GSICS proves to be a great capacity building and collaboration opportunity. Its products are increasing in maturity. The practical value of GSICS was demonstrated in the role played to facilitate the commissioning operations of several satellite programmes in the most recent years. GSICS benefits to satellite operators-through sharing of resources and best practices, and to satellite data users through improved calibration, assessments, and traceability to common references.
NOAA provided to the CGMS community a sampling of the emerging capabilities in nocturnal characterization enabled by the Day/Night Band (DNB) sensor on Suomi NPP, part of the Visible/Infrared Imaging Radiometer Suite (VIIRS). A growing collection of research papers is giving evidence to the DNB’s far-reaching utility, well beyond the originally envisioned scope of ‘imagery.’ Quantitative applications are becoming possible with the conversion of DNB radiances to reflectance and combining with other VIIRS spectral bands. Unexpected sensitivity to nightglow is revealing tantalizing new scientific potential for the study of upper atmospheric dynamics
Working Group III (Contingency Planning)
EUMETSAT proposed a way forward for the provision of Indian Ocean Data Coverage (Services) after re-orbiting of Meteosat-7 in 2017, based on the analysis of the current status of CGMS partner satellite systems (CMA, EUM, ISRO and ROSHYDROMET) in the region.
Satellite Location Image Products DCS
Meteosat-8
40°E Yes Yes Yes
(International)
INSAT 3D
82°E Yes Yes Yes
(regional)
Elektro-L N2
77.8°E Yes Yes Yes
(regional)
FY-2E 86.5°E Yes Yes Yes
(regional)
- 5 -
Working Group IV (Global data dissemination)
WGIV proposed a medium-term Satellite Data Dissemination Strategy. This Strategy calls for active support of CGMS members in particular in the following areas: Enhancing data availability - Global Coverage of LEO Direct Broadcast
Acquisition, Processing and Distribution Systems
- Bilateral Exchange of Data and Products - Routine Availability of Data and Products
from R&D Satellites Description and Registration of Satellite Data and Products - Making Satellite Data and Products
Discoverable on the WIS - Standardized Data Formats Dissemination and user access - Standardized Direct Broadcast - Global Access to Data and Products on
the Core WIS Network - Full Integration and Operation of DVB
Broadcast Services On-demand Access to Satellite Data and Products ISRO CGMS Membership
The Director-General of EUMETSAT was very pleased to have ISRO requested to be a member of CGMS. NOAA supported and agreed on contribution of ISRO to CGMS activities. WMO also expressed support for ISRO joining CGMS. RA II WIGOS project
JMA and KMA provided a progress report on the RA II WIGOS project to develop support for NHMSs in satellite data, products and training. The Project serves as a bridge between the six satellite operators in RA II and users through the Coordinating Group, representing a number of RA II member countries. • Newsletters to RA II Members: Quarterly
newsletters have been issued to share recent satellite-related information on topics such as imagery data, products and training.
• 5th Asia/Oceania Meteorological Satellite Users’ Conference and VLab training event: The conference was preceded by a two day training event at CMA training facilities and brought together participants from Region II and V.
• Support activities to prepare satellite data users for the new generation of geostationary meteorological satellites: The RA II WIGOS Project to Develop Support for NMHSs in Satellite Data, Products and Training will support preparations by NMHSs in RA II, especially in LDCs and other developing nations, for the new satellites
• 6th Asia/Oceania Meteorological Satellite Users’ Conference and training event: JMA will host the sixth AOMSUC in Japan in 9-13 November 2015 (http://www.jma-net.go.jp/msc/en/aomsuc6/). There will be a two day training event is also planned at the time of the meeting. It is suggested to continue such a cooperative training event in conjunction with future AOMSUC sessions.
• The third meeting of the Coordinating Group of the RA II WIGOS Project will be held in 2015 in Japan on the occasion of AOMSUC-6.
First results and products from Himawari-8
JMA presented first results and products from HImawari-8. The next-generation geostationary meteorological satellite of the Japan Meteorological Agency (JMA), Himawari-8, was successfully launched on 7 October 2014 and will start operation in July 2015. Himawari-8 features the new 16-band Advanced Himawari Imager (AHI), whose spatial resolution and observation frequency are improved over those of its predecessor MTSAT-series satellites. These improvements will bring unprecedented levels of performance in nowcasting services and short-range weather forecasting systems. In view of the essential nature of navigation and radiometric calibration in fully leveraging the imager’s potential, the working paper reports on the current status of navigation and calibration for
- 6 -
the AHI and outlines related products.
Socio economic benefits issues
UCAR provided a brief overview of socio-economic approaches to weather information including discussing why economics is needed and what detail of economic analysis is required. An exercise based on the benchmarking approach used by the World Bank was provided to illustrate a very basic approach to valuing weather information. This was followed by an illustration of the weather information value chain for improved irradiance forecasting for use by utility scale solar power generation indicating the complexity of more advanced valuation efforts. The weather information value chain concept was then discussed as a tool for understanding the value creation process and economic methods. An overview of some key economic concepts and a taxonomy of benefits assessment methods were presented.
Information was also provided on some available resources on economic analysis for hydro-met services including the new USAID/WMO/World Bank book on socio-economic benefits assessment. Some thoughts on the CGMS SETT were provided from the viewpoint of an economist, and recommendations were made for future socio-economic benefits work including showing results from a study on the value of improved hurricane forecasts and an
illustration of the potential importance of a study of values to the general public of improved weather information
In additions, NOAA as chair of the CGMS Socioeconomic Benefits Tiger Team (SETT) provided a status report from SETT and its plans for the next year. The report discussed the outcome of Workshop #2, including the work being done on the case study on "Understanding and Assessing the Value of Improved Satellite Data for the Users of Operational Sea Ice Products and Information." 6th Asia/Oceania Meteorological Satellite Users Conference and 3rd meeting of the Coordination Group the RAII WIGOS Project
JMA announced the 6th Asia/Oceania Meteorological Satellite Users’ Conference from 9 to 13 November 2015 in Tokyo, Japan. Satellite users and operators in the Asia and Oceania regions were warmly invited to attend.
In conjunction with AOMSUC-6, JMA plans to hold a two-day training event for representatives from National Meteorological and Hydrological Services (NMHSs) in the Asia and Oceania regions. The 3rd Meeting of the Coordinating Group of the RA II WIGOS Project is also scheduled for the day before AOMSUC-6. The attendance of Coordinating
- 7 -
Group members is requested. The latest information and the initial
announcement of the conference are provided on the following webpages: http://www.jma-net.go.jp/msc/en/aomsuc6/ http://www.jma-net.go.jp/msc/en/aomsuc6/1stannounce.html Closing of the meeting
The 44th CGMS will be hosted by EUMETSAT and will be held on 13-17 June 2016 in Reading, United Kingdom. The venue selected is conveniently located close to London’s Heathrow Airport allowing for easy travel connections. Meeting venue and recommended hotel are on the same site.
(Dohyeong Kim, NMSC/KMA) KMA’s improvement in cloud amount estimation from the COMS Introduction
Cloud amount (CA) is one of the essential parameters of weather forecasting related to the maximum/minimum temperature, insolation etc., because cloudiness in the atmosphere regulates the global climate system by adjusting the intensity of incoming solar energy and the emission for terrestrial radiation at the top of the atmosphere
However, due to the lack of objective reliability with the spatial and temporal limitation of ground observation, the retrieval of CA (i.e. Cloud cover) is requested to be made through satellites. The National Meteorological Satellite Center (NMSC) in KMA has been operationally retrieving the CA at ten levels (0 to 10) from the COMS Meteorological Data Processing System (CMDPS) since 2011.
This report is intended to introduce the improvement in CA estimation based on the COMS in order to support automated observation and very short range forecast in KMA.
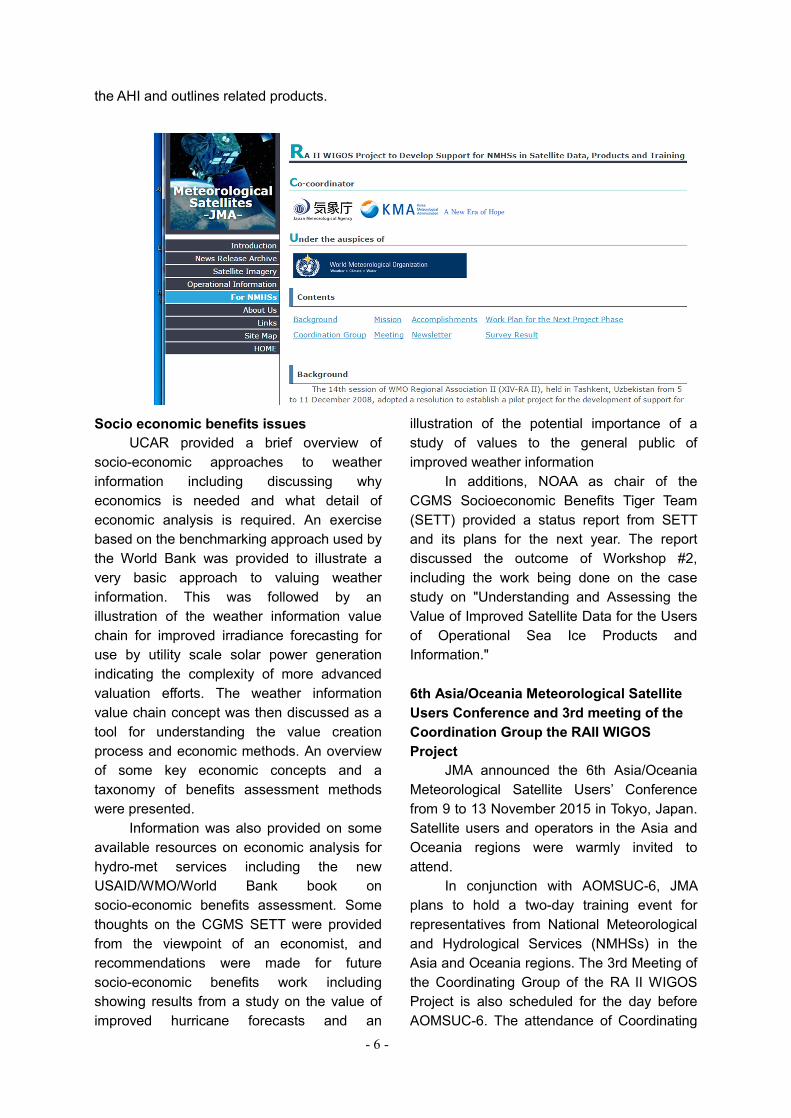
Improvement in the Cloud Amount Estimation from COMS 1) CA estimation algorithm
The retrieval process of COMS CA algorithm is presented in Figure 4. The difference between satellite observed CA and human observed CA caused by the observation conditions and horizontal and vertical structures of clouds were corrected. After deciding the presence of clouds based on cloud detection information, the cloud is multiplied by the weighted value depending on the relative position of cloud from the reference pixel as the position of the ground observer. CA of satellite (Nnadir) is calculated from the average of cloud information in the surrounding 7x7 pixels. We calculate the cloud aspect ratio (γ) considering the horizontal and vertical size of the cloud. After inputting the weighted value of the clouds, satellite-observed cloud fraction (CF), and cloud aspect ratio, ground-observed CA is retrieved. The final product for ground-observed CA of cloud/clear condition was generated by averaging the surrounding 7x7 pixels and converting by the Kassianov et al. (2005) method.
Figure 4: Diagram of the COMS CA estimation algorithm. CLD is cloud detection information and CTP is cloud top pressure.
2) Performance of Operational CA from COMS
COMS retrieved CA was compared with visual observation CA by humans in Seoul, Korea from Dec. 2013 to Nov. 2014 to investigate the possibility of automated observation of CA from COMS observation.
- 8 -
The visual observation of CA is made every 3 hours from 12 to 18UTC and every hour for the rest of time, for ten minutes before the on-time observation hour. So, the collocation dataset was made by averaging 3X3 pixels of COMS CA from the closest ground observation station within 15 minutes before the ground observation time.
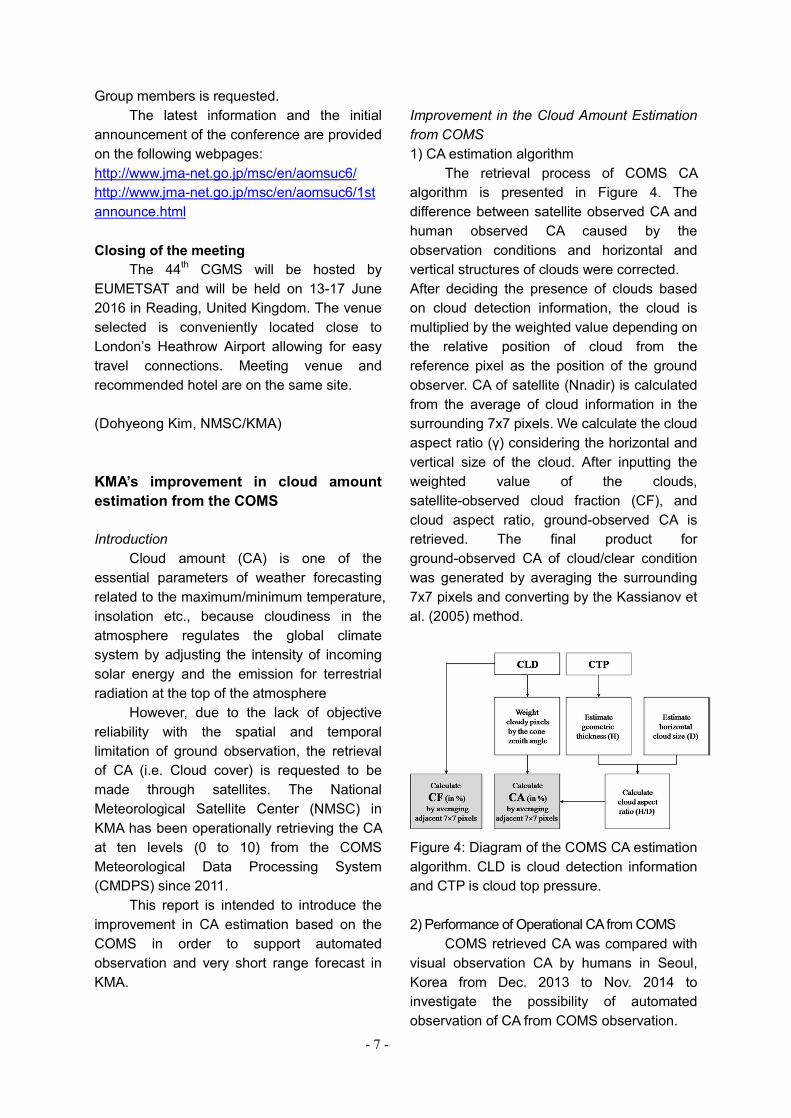
Figure 5 indicates the number density distribution of operational CA from the COMS and visual observation in Seoul from Dec 2013 to Nov. 2014. CA derived from the COMS algorithm compares quite well with CA from visual observation with a correlation coefficient of 0.85, even though the COMS overestimates CA with Bias and RMSE of 0.51 and 2.33 respectively. However, the frequencies of CA from the COMS are mostly concentrated in 0 (clear) and 1 (cloudy), which may be caused by the spatial resolution of the COMS and the difference of observation method. The deviations are nearly symmetrically distributed around zero, though positive biases are larger than negative biases. CA differences between the COMS and visual observations are within ±1 in 61.5% and within ± 2 in 77% in Seoul from Dec. 2013 to Nov. 2014.
Figure 5: Comparison of the number density distribution between operational CA from the COMS and visual observation CA in Seoul from Dec. 2013 to Nov. 2014.
To investigate the cause of large
difference between CA from the COMS and
visual observation, the frequency distribution and cloud type with difference larger than ±7 were analyzed according to the time. Large bias was mainly appeared from 18~23UTC and mostly occupied by low clouds, which implies the COMS may misidentify the cloud due to the low surface temperature during the nighttime.
3) Improvement in Cloud Amount Performance
The CA retrieval algorithm is totally dependent on the cloud detection (CLD) algorithm. If the COMS overestimates clouds, CA derived from the COMS will be overestimated. CLD algorithm performs in pixel units based on the threshold value methods, which is composed of 6 steps with 14 tests : 1) single channel reflectivity test, 2) dual channel reflectivity ratio test, 3) single IR channel threshold test, 4) dual channel difference of brightness temperature test, 5) homogeneity test, and 6) sunglint test.
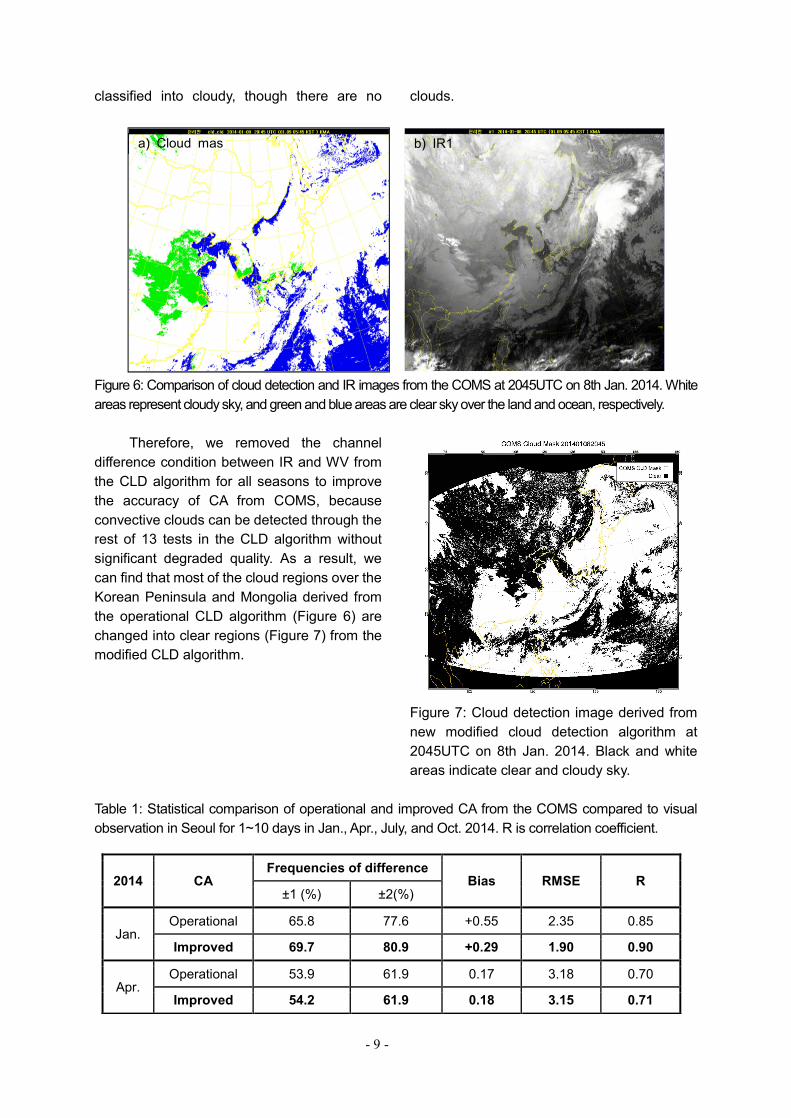
Compared to the visual observation, the COMS tends to overestimate CA especially in winter season, when the cold air from the north expands to the Korean Peninsula. Figure 6 shows an example of cloud detection at 2045UTC on 8th Jan., 2014. Compared to the IR image, the cloud mask image seems to misidentify clouds especially over the middle and north regions of Korea and Mongolia. Large bias was occurred in Seoul: CA from COMS was 8, whereas visual observation was 0.
To find the reason of misidentification of cloud, 14 tests of CLD algorithm were examined step by step. The result indicates that test for dual channel difference of brightness temperature between IR and WV, which is usually used for detection of convective clouds at the step 4, makes cloud overestimated. Generally, surface temperature becomes lower during the wintertime and air temperature at the middle atmosphere also becomes lower when the cold air expands to the south from the north region. In this winter condition, the difference of brightness temperature between IR and WV channel becomes smaller than the threshold value of IR and WV channel and consequently is
- 9 -
classified into cloudy, though there are no clouds.
Figure 6: Comparison of cloud detection and IR images from the COMS at 2045UTC on 8th Jan. 2014. White areas represent cloudy sky, and green and blue areas are clear sky over the land and ocean, respectively.
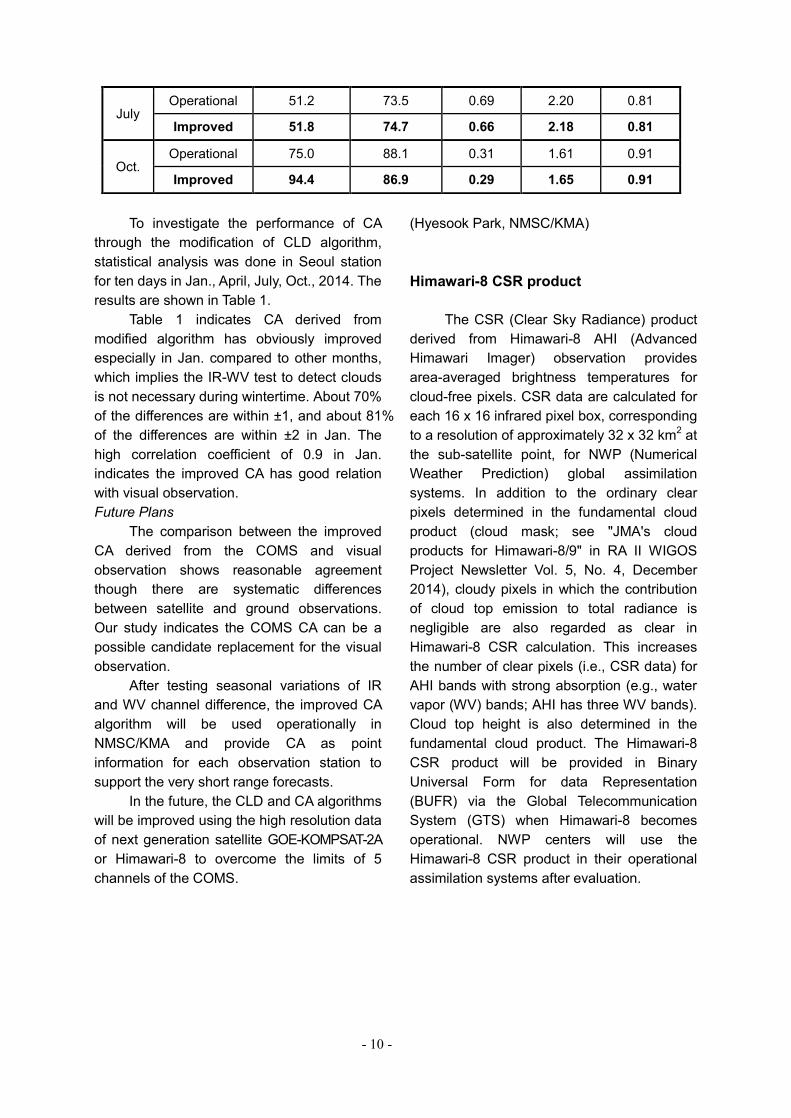
Therefore, we removed the channel difference condition between IR and WV from the CLD algorithm for all seasons to improve the accuracy of CA from COMS, because convective clouds can be detected through the rest of 13 tests in the CLD algorithm without significant degraded quality. As a result, we can find that most of the cloud regions over the Korean Peninsula and Mongolia derived from the operational CLD algorithm (Figure 6) are changed into clear regions (Figure 7) from the modified CLD algorithm.
Figure 7: Cloud detection image derived from new modified cloud detection algorithm at 2045UTC on 8th Jan. 2014. Black and white areas indicate clear and cloudy sky.
Table 1: Statistical comparison of operational and improved CA from the COMS compared to visual observation in Seoul for 1~10 days in Jan., Apr., July, and Oct. 2014. R is correlation coefficient.
2014 CA Frequencies of difference
Bias RMSE R ±1 (%) ±2(%)
Jan. Operational 65.8 77.6 +0.55 2.35 0.85
Improved 69.7 80.9 +0.29 1.90 0.90
Apr. Operational 53.9 61.9 0.17 3.18 0.70
Improved 54.2 61.9 0.18 3.15 0.71
a) Cloud mask
b) IR1
- 10 -
To investigate the performance of CA
through the modification of CLD algorithm, statistical analysis was done in Seoul station for ten days in Jan., April, July, Oct., 2014. The results are shown in Table 1.
Table 1 indicates CA derived from modified algorithm has obviously improved especially in Jan. compared to other months, which implies the IR-WV test to detect clouds is not necessary during wintertime. About 70% of the differences are within ±1, and about 81% of the differences are within ±2 in Jan. The high correlation coefficient of 0.9 in Jan. indicates the improved CA has good relation with visual observation. Future Plans
The comparison between the improved CA derived from the COMS and visual observation shows reasonable agreement though there are systematic differences between satellite and ground observations. Our study indicates the COMS CA can be a possible candidate replacement for the visual observation.
After testing seasonal variations of IR and WV channel difference, the improved CA algorithm will be used operationally in NMSC/KMA and provide CA as point information for each observation station to support the very short range forecasts.
In the future, the CLD and CA algorithms will be improved using the high resolution data of next generation satellite GOE-KOMPSAT-2A or Himawari-8 to overcome the limits of 5 channels of the COMS.
(Hyesook Park, NMSC/KMA) Himawari-8 CSR product
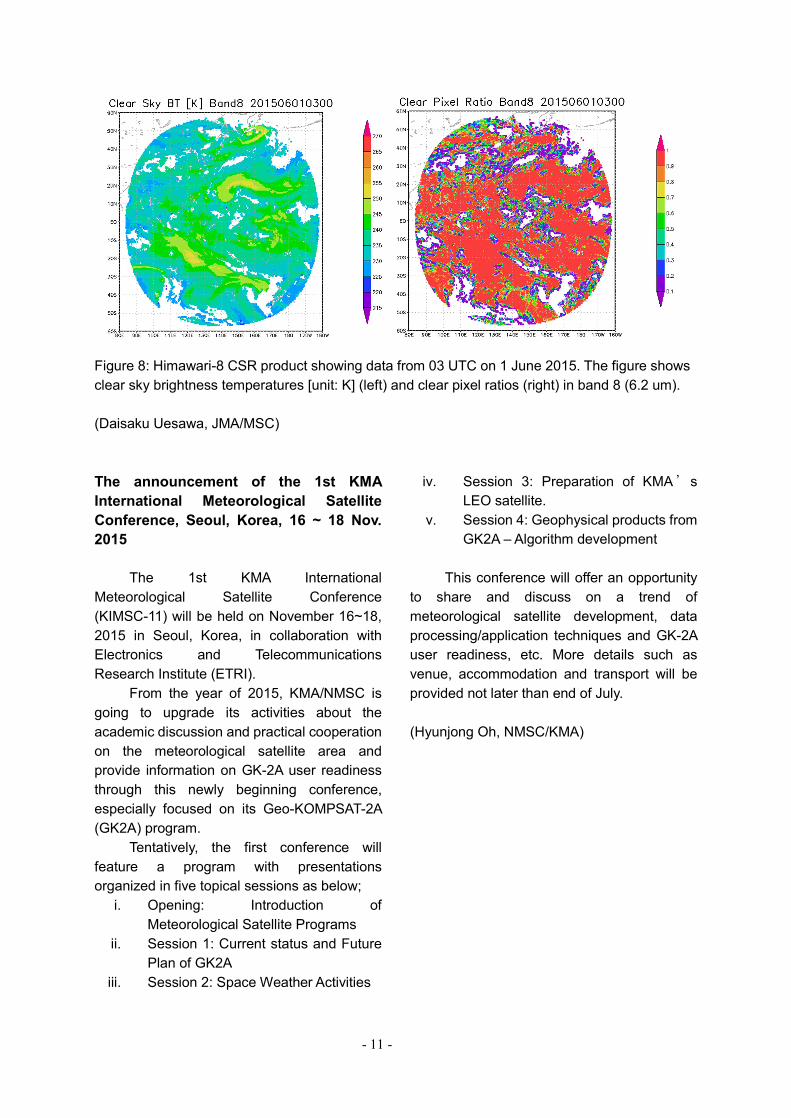
The CSR (Clear Sky Radiance) product derived from Himawari-8 AHI (Advanced Himawari Imager) observation provides area-averaged brightness temperatures for cloud-free pixels. CSR data are calculated for each 16 x 16 infrared pixel box, corresponding to a resolution of approximately 32 x 32 km2 at the sub-satellite point, for NWP (Numerical Weather Prediction) global assimilation systems. In addition to the ordinary clear pixels determined in the fundamental cloud product (cloud mask; see "JMA's cloud products for Himawari-8/9" in RA II WIGOS Project Newsletter Vol. 5, No. 4, December 2014), cloudy pixels in which the contribution of cloud top emission to total radiance is negligible are also regarded as clear in Himawari-8 CSR calculation. This increases the number of clear pixels (i.e., CSR data) for AHI bands with strong absorption (e.g., water vapor (WV) bands; AHI has three WV bands). Cloud top height is also determined in the fundamental cloud product. The Himawari-8 CSR product will be provided in Binary Universal Form for data Representation (BUFR) via the Global Telecommunication System (GTS) when Himawari-8 becomes operational. NWP centers will use the Himawari-8 CSR product in their operational assimilation systems after evaluation.
July Operational 51.2 73.5 0.69 2.20 0.81
Improved 51.8 74.7 0.66 2.18 0.81
Oct. Operational 75.0 88.1 0.31 1.61 0.91
Improved 94.4 86.9 0.29 1.65 0.91
- 11 -
Figure 8: Himawari-8 CSR product showing data from 03 UTC on 1 June 2015. The figure shows clear sky brightness temperatures [unit: K] (left) and clear pixel ratios (right) in band 8 (6.2 um). (Daisaku Uesawa, JMA/MSC) The announcement of the 1st KMA International Meteorological Satellite Conference, Seoul, Korea, 16 ~ 18 Nov. 2015
The 1st KMA International Meteorological Satellite Conference (KIMSC-11) will be held on November 16~18, 2015 in Seoul, Korea, in collaboration with Electronics and Telecommunications Research Institute (ETRI).
From the year of 2015, KMA/NMSC is going to upgrade its activities about the academic discussion and practical cooperation on the meteorological satellite area and provide information on GK-2A user readiness through this newly beginning conference, especially focused on its Geo-KOMPSAT-2A (GK2A) program.
Tentatively, the first conference will feature a program with presentations organized in five topical sessions as below;
i. Opening: Introduction of Meteorological Satellite Programs
ii. Session 1: Current status and Future Plan of GK2A
iii. Session 2: Space Weather Activities
iv. Session 3: Preparation of KMA’s LEO satellite.
v. Session 4: Geophysical products from GK2A – Algorithm development
This conference will offer an opportunity
to share and discuss on a trend of meteorological satellite development, data processing/application techniques and GK-2A user readiness, etc. More details such as venue, accommodation and transport will be provided not later than end of July. (Hyunjong Oh, NMSC/KMA)
- 12 -
Members of the Coordinating Group JAPAN (Co-coordinator) Mr Takeshi OTOMO Senior Coordinator for Satellite Systems Satellite Program Division Japan Meteorological Agency REPUBLIC OF KOREA (Co-coordinator) Dr Dohyeong KIM Senior Researcher Satellite Planning Division, National Meteorological Satellite Center Korea Meteorological Administration BAHRAIN Mr Adel Tarrar Mohammed DAHAM Acting Director Ministry of Transportation CHINA Mr Xiang FANG Director, Remote Sensing Data Application National Satellite Meteorological Center China Meteorological Administration HONG KONG, CHINA Mr Lap-shun LEE Senior Scientific Officer Hong Kong Observatory INDIA Mr A. K. SHARMA Deputy Director General of Meteorology India Meteorological Department KYRGYZSTAN Ms Mahkbuba KASYMOVA Head, Department of Weather Forecasting Kyrgyzhydromet MALDIVES Mr Ali SHAREEF Deputy Director General Maldives Meteorological Service
OMAN Mr Humaid AL-BADI Chief, Remote Sensing and Studies Section Oman Department of Meteorology PAKISTAN Mr Muhammad ASLAM Senior Meteorologist Allama Iqbal International Airport Pakistan Meteorological Department Mr Zubair Ahmad SIDDIQUI Deputy Director/Senior Meteorologist Institute of Meteorology & Geophysics Pakistan Meteorological Department RUSSIAN FEDERATION Ms Tatiana BOURTSEVA Chief, Information Department ROSHYDROMET Dr Oleg POKROVSKIY Principal Scientist, Main Geophysical Observatory ROSHYDROMET UZBEKISTAN Mr Sergey Klimov Acting Chief, Hydrometeorological Service UZHYDROMET VIET NAM Ms Thi Phuong Thao NGUYEN Researcher, Research & Development Division National Center for Hydrometeorological Forecasting Ministry of Natural Resources and Environment of Viet Nam EUMETSAT (OBSERVER) Dr Volker GAERTNER Head of User Services Division EUMETSAT Dr Kenneth HOLMLUND Head of Remote Sensing and Products Division EUMETSAT
- 13 -
From the Co-editors The co-editors invite contributions to the newsletter. Although it is assumed that the major contributors for the time being will be satellite operators, we also welcome articles (short contributions of less than a page are fine) from all RA II Members, regardless of whether they are registered with the WMO Secretariat as members of the WIGOS Project Coordinating Group. We look forward to receiving your contributions to the newsletter. (Dohyeong KIM, KMA, and Takeshi OTOMO, JMA) RA II WIGOS Project Home Page http://www.jma.go.jp/jma/jma-eng/satellite/ra 2wigosproject/ra2wigosproject-intro_en_jma. html
Editorials and Inquiries Takeshi OTOMO (Mr.) Senior Coordinator for Satellite Systems Satellite Program Division Observation Department Japan Meteorological Agency 1-3-4 Otemachi, Chiyoda-ku Tokyo 100-8122, Japan Tel: +81-3-3201-8677 Fax: +81-3-3217-1036 Email: [email protected] Dohyeong KIM (Dr.) Senior Researcher Satellite Planning Division, National Meteorological Satellite Center Korea Meteorological Administration 64-18 Guam-gil, Gwanghyewon, Jincheon, Chungbuk, 365-830, Republic of Korea Tel: +82-70-7850-5705 Fax: +82-43-717-0210 Email: [email protected] (Editor-in-chief of this issue: Dohyeong Kim)