vol. 2 - hyundai motor americakari.hyundai.com/karifile/ijaim_reports/vol2_no1/vol2_no1_full.pdf ·...
TRANSCRIPT


2008, Korea Automotive Research InstituteISSN 1976-7307(Print)
IJAIM, Vol. 2 (July 2008), 1-14
Abstract - Used car value depreciates when the age and kilometers increases. The value of the vehi-cle at the end of the leasing contract is often called residual value. The depreciation of value of thevehicle is the most significant part of the cost of leasing. There are very large differences in the rateof depreciation between cars based on the characteristics of them. Some cars hold their value muchbetter than the others. It is very important for the leasing business to identify which are the cars thathold their value the best and, more generally, to correctly forecast the car values at the end of thecontract. For the manufacturer, it is very important that they can produce cars that hold their valuewell. This is because the cost of the ownership of the car is then minimized for the customer. Thusbuyers try to find cars that hold value well. Using large amount of data and statistical modeling (mixed models) it is possible to estimate theresidual value function that relates the characteristics of the car and the expectation value of residualvalues as percentage of the new car value. This function is not constant in time. Rather, it is changingcontinuously, and usually rather slowly. There are many characteristics that have statistically signifi-cant effect on residual value percentage. One of the most important characteristic is the brand of thecar. If we have two technically similar cars having the same new car price, the residual value as per-centage of new car value differ very significantly based on the brand. Measuring the effect of thebrand gives numerical estimate of the brand value, i.e. how much more or less the consumer is will-ing to pay for technically similar cars just because the brand is different. These brand values changeslowly in time and we can follow the changes. Korean brands are rather new in the car market of Finland. It is very interesting to follow the brandvalue development of these brands. For any new and rather unknown brand in any market, it is ratherdifficult to attain high brand value, because it is about trust and people generally don t trust anunknown brand. In the Finnish car market Kia has been able to build valuable brand image quickly,which is very unusual. The secret has probably been a very well known retailer, intensive service pro-gram and the longest warranty in the market.
Keywords - Car leasing, Statistical modeling, Mixed models, Unlinear models, Residual values, Brand,
Passanger cars, Depreciation, Value, Forecasting, Hedonic regression
Markus Halonen is Manager in Statistics and Data Analyses, Grey-Hen
Oy(Autovista Information Solutions). Finland. His primary research field
concerns statistical price appraisal system and residual value analysis.
Markus Halonen
The Residual Value Function -Including the Estimated Brand
Effects on Residual Values
1
depreciation and we can define the residual value as fol-
lows;
Residual Value = New Car Price - Depreciation
Many times residual value is presented as percentage of its
initial value. Depreciation of the car values is the most sig-
nificant part of the cost of the leasing. The more the value
etting residual values is the core of the business of
any leasing company. The part of the value that
the car looses during the leasing period is calledS
of the car depreciates the higher price the leasing company
is forced to charge on the customer. If some manufacturers
are able to produce such cars that hold value better than
others, the leasing companies are able to sell the leasing
contracts with lower prices than other cars having same
price as new or the same production costs. Even outside
leasing market, individual consumers seek cars that hold
their value well. The depreciation of car value takes large
part of the costs for the consumers. This can have large
effect on the sales volume of the manufacturers. We can
actually measure the realized residual values and depre-
ciations using analyses of large car market data by
comparing the used car price to its initial value. The
future residual value refers to forecast of the future
value of a leased car as percentage of its new car value
today.
All leasing companies face the same problem around the
world: how they should set the future residual values, and
what would be the most reliable way of forecasting the value
of the car at the end of the contract. If leasing company is
bearing the risk and actually sells the car at the end of the
contract, its profit for the car depends on the actual value at
the end of the contract compared with the forecasted residual
value. Leasing company can avoid risks by setting the
forecasted residual values at the end of the contract very
low. This means that the company have to charge high
prices on its customer since the depreciation of the car
value is expected to be large. But by doing so the leas-
ing company will loose more customers since the com-
petitor can offer better contracts to customers or many
potential customers decide to buy the car instead of leas-
ing it.
In order to be competitive and profitable in the car mar-
ket, leasing company has to set the residual values in such
a way that it will maximise its forecasted profit, not too
high because it would mean losses and not too low
because it would hurt the selling volume. There is very
large variation in the rate of the depreciation of car values
as the age and kilometers increase. Certain cars hold value
much better than the others. For any leasing company it is
very important to know which cars hold their value longer.
So how is this usually done by leasing companies?
According to our knowledge, it is often based on the
educated guess by either leasing companies or some
firms specialized in giving such forecasts. Those compa-
nies usually do not make public how they actually fore-
cast the residual values.
In this paper, I try to propose a quantitative way to help the
residual value estimation. By using large transactional price
data and statistical methods, we can estimate the effects of
the different characteristics on the residual values while
keeping other things constant. We can estimate the function
that relates the expectation value of the residual value per-
centage to the observable characteristics of the car. By esti-
mating the function using the latest data we can estimate
what the function is (or has been lately). However, to be able
to set the future residual value, the value at the end of the
contract, we should be able to forecast also what kind of
changes will happen in the residual value function during the
leasing contract. When forecasting the FRVF it greatly helps
if we know what it is now and what it has been in the history
and how it has changed during the recent history. Therefore
to be able to forecast future RVF, we have to estimate the
present and historical RVF. One of the main characteristics
of the car that have effect on residual values is the brand
(make) of the car. In this paper these brand effects are espe-
cially on focus although other results of estimation are pre-
sented as well. A lot of research has been made on automo-
bile brands. Usually they are qualitative papers researching
the image of the brand. In this paper I try to show how it is
possible to measure and get numerical effects of brand as a
part of the estimated residual value function.
Literature Review
Used car market and residual values of vehicles have not
been empirically researched much. Akerlof (1970) created in
his seminal work the theoretical model of adverse selection
in durable goods market. According to the model, buyers
cannot make distinction between the qualities of used cars,
whereas the seller of the car knows the quality of the car he
or she is holding. This asymmetrical information causes the
cars of different qualities sell at a common price that reflects
2 / International Journal of Automotive Industry and Management, July 2008

The Residual Value Function-Including the Estimated Brand Effects on Residual Values / 3
the buyers’ estimate of average quality. As a consequence,
the holders of cars of higher than average quality, hold their
cars rather than trade them and holders of lemons sell their
cars. Thus asymmetrical information structure leads to lower
average quality in the market and even to the breakdown of
the market.
Many empirical tests have been made on lemons
model and many times they concentrate on adverse
selection. Gilligan (2004) finds inverse relationship
between depreciation and trading volume in the Used
Business Aircraft Market and views it as evidence of
adverse selection.
Gilligan (2004) also presents a theoretical model where in
the presence of full information, the cars having high rate of
depreciation of the quality, have also high rate of deprecia-
tion of value. Thus the prices reflect fully the true deprecia-
tion rates of different brands. I comment this model later in
the conclusions of this paper.
But as Emons and Sheldon (2005) pointed out, the
adverse selection does not necessarily imply information
asymmetry. The results indicate that the probability of a
vehicle having a defect increases if the car was sold private-
ly. They also found that the opposite holds true for used cars
sold by dealers. They find their results supporting both the
presence of adverse selection and asymmetrical informa-
tion.
I find these results of Emons and Sheldon very logi-
cal. The professional used car buyers are usually wise
enough to detect defects in a used car. Private con-
sumers are less able to find defects and thus a holder of
a lemon is likely to sell his car rather to consumers. And
the seller may don’t have a choice if the dealers just will
not buy the car with a defect into their stock.
Some empirical research on automotive leasing markets
has been also conducted. Pirotte and Vaessen (2008) made
empirical analysis of residual value losses in automotive
leasing sector.
Even though the above mentioned papers have something
in common with the topic of this paper, they don’t have the
same focus on residual value function and the effects of the
characteristics on residual values. Very few or no academic
research has been made on this very subject, about the rela-
tionship between residual value percentage and the charac-
teristics of the car. This is surprising because this subject
seems to be one of the most important for risk managers of
every leasing company.
Rosen (1974) presented famous hedonic model in his arti-
cle. Rosen sees the differentiated products as bundle of char-
acteristics. The products can be fully defined as vectors of
characteristics. Consumers are choosing between these pack-
ages of characteristics. There is a function that relates the
price and the characteristics of the car. For car i having vec-
tor of k characteristics the price is function of these character-
istics
This is hedonic price function that relates the prices and its
characteristics. The function can be estimated using statistical
modeling and large enough price data. These kinds of hedo-
nic models have been estimated for many products like
housing or used apartments (Can 1992; Halonen 1996) and
some durable goods (Halonen 1997) and used cars (Aalto-
Setala and Halonen 2003). Hedonic price models are also
often used in the calculations of Consumer Price Index to
solve the quality change problem (Vartia and Halonen 1997;
Haurin and Hendershott 1991)
In this paper the approach is rather similar to the hedonic
price models. Instead of price, the goal is to explain the
variation in residual value and estimate the function that
relates the characteristics of the car and the residual value
percent.
Data
The Overview and Sources of the Data
Grey-Hen Oy, an Autovista Information Solutions
Company, gets the very large data as daily transfers from
DMS-systems of car retailers. This company has presence in
Finland, Sweden, Holland and UK. In this paper, only data
of Finland is used, since there we have largest data and
longest experience of analyzing the market. The data covers
about 60 % of all used cars sold by franchised dealers in

Residual Value Percent of car i is defined as where is
Purchase Price of the car dealer. If over allowance is used
when buying a car, it is subtracted away from the price to get
real purchase price’.
is a List Price of the car i at the first registration date of
the car. It excludes options and delivery costs.
We have the extra options of the car as different variable in
the model and we can estimate the residual value of the car
and the residual value of the options separately. As we are
also interested in whether we could estimate the brand
affects using only publicly available asking price data, we
define showroom asking price residual value for car i as
In the final estimations we used log of these variables in the
model. Residual Value Function is written shortly as RVF.
Data Period and Restrictions
Finland had a significant new car tax change in the begin-
ning of the 2008. Based on that, some of the new car prices
went up by over 20 %. The average new car price level
dropped by 7 %. It was published on November 1, 2007 and
immediately after that the used car price formation changed
quite a lot. Also the level of used car prices dropped rather
quickly in November 2007, even before the new car tax
change was actually realized.
In this paper, the data from period November 25, 2007 -
May 25, 2008 was used in the final estimation. The data
consisted of over 44,000 observations. We left out small
buses but the vans were included. We also left out rare
brands in the market and the data of 33 brands were left in
estimation data. Some of the observations were deleted
since the different variables were not rational. For exam-
ple, the used car price was 2 times higher than new car
price. Also some very deviantly low prices were found to
belong to cars which were out of order according to the
information we got from authorities by using the registra-
tion plate inquiry. Otherwise we left the data not with
standing the very deviant prices if no clear reason was
found to delete them.
Finland, the dealers that sell new cars of some manufacturers
too. The franchised dealers mean dealers that sell also new
cars. They sell most of the cars of age less than 6 years in
Finland. The data is used for making BI-reporting for the
dealer chains, meaning that it contains very detailed informa-
tion about the transactions of the dealers. It includes show-
room asking price, realized prices and the sales channel, over
allowances, purchase prices, costs, selling times etc.
The data include type register consisting of the characteris-
tics of all the car models (types, versions) which have been
for sale during the past 20 years, and also the new car prices
of each model as time series. For example, certain version of
Toyota has had price of 22,900 euro between January 8,
2007, but it was 22,400 euro on August 1, 2004. This is
important for calculating the residual values as percentage of
its initial value.
For the majority of the cars in the used car price data we
know the car type code and thus we are able to know the used
car price and the new car price when it was sold as new. This
makes powerful data which we can use to estimate the func-
tion that relates the characteristics of the car and the residual
value.
The extra options also have an effect on the used car value.
In our data the options that the car holds are also mentioned.
If the options are not standard in the car type, the type regis-
ter contains also the price of that option as new. Thus we are
able to calculate the sum of the prices of all extra option that
the individual car has. This sum value of all extra options can
be used as explanatory variable in the model. Thus we are
able to estimate the value of the residual value of the car and
residual value of options separately.
The new car price we use here is the list price at the date of
first registration of the car in question. Delivery costs are not
included in the new car price.
Definitions
When the leasing contract ends, the leasing company sells
the car in Finland normally to a car dealer. Thus this price
concept is directly the residual value the leasing company
actually gets at the end of the contract.
4 / International Journal of Automotive Industry and Management, July 2008
The Residual Value Function-Including the Estimated Brand Effects on Residual Values / 5
Cars that were over 6.5 years old or had kilometers over
250,000 were also left out. If the kilometers were really
high, it was more common that there was really large devia-
tions from the expected residual value probably because of
larger variation in the condition of these more used cars.
These kinds of cars are anyway not relevant for leasing
companies.
The Model
The General Idea
The starting point of the modeling is that we can observe
variation in the market prices of used cars and also in resid-
ual value percentage. We want to understand what explains
this variation in residual value percentage. It can be easily
found that the age of the car seems to have strong effect on
residual value percentage.
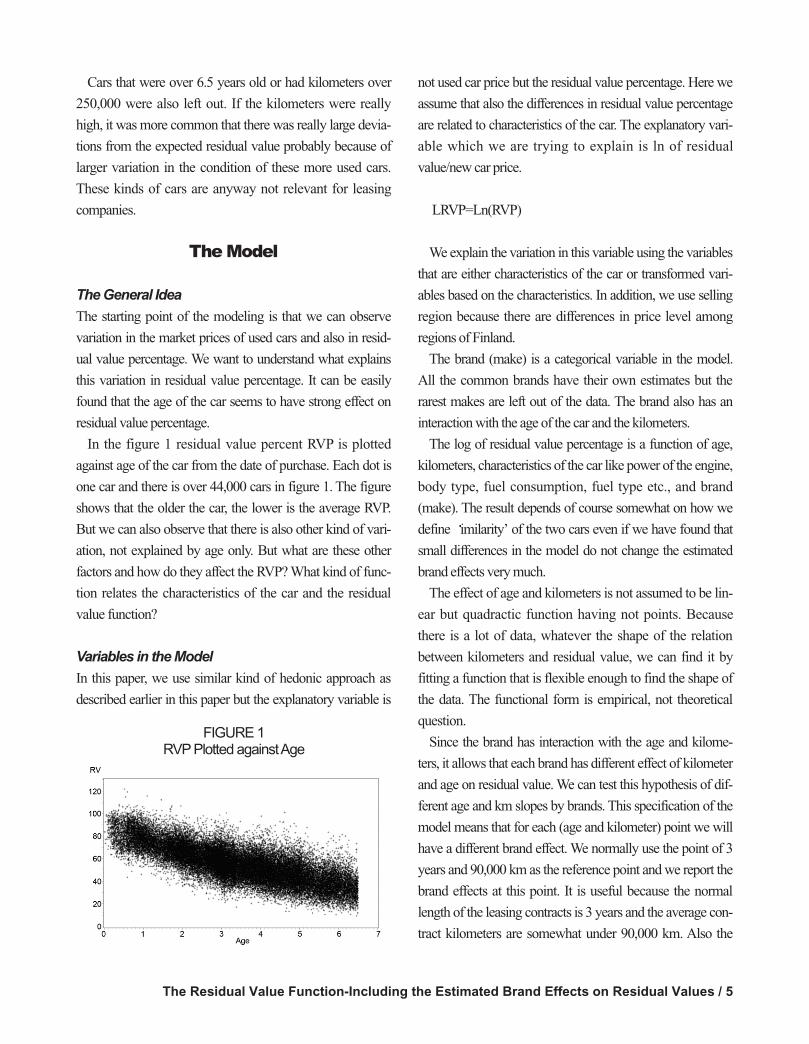
In the figure 1 residual value percent RVP is plotted
against age of the car from the date of purchase. Each dot is
one car and there is over 44,000 cars in figure 1. The figure
shows that the older the car, the lower is the average RVP.
But we can also observe that there is also other kind of vari-
ation, not explained by age only. But what are these other
factors and how do they affect the RVP? What kind of func-
tion relates the characteristics of the car and the residual
value function?
Variables in the Model
In this paper, we use similar kind of hedonic approach as
described earlier in this paper but the explanatory variable is
not used car price but the residual value percentage. Here we
assume that also the differences in residual value percentage
are related to characteristics of the car. The explanatory vari-
able which we are trying to explain is ln of residual
value/new car price.
LRVP=Ln(RVP)
We explain the variation in this variable using the variables
that are either characteristics of the car or transformed vari-
ables based on the characteristics. In addition, we use selling
region because there are differences in price level among
regions of Finland.
The brand (make) is a categorical variable in the model.
All the common brands have their own estimates but the
rarest makes are left out of the data. The brand also has an
interaction with the age of the car and the kilometers.
The log of residual value percentage is a function of age,
kilometers, characteristics of the car like power of the engine,
body type, fuel consumption, fuel type etc., and brand
(make). The result depends of course somewhat on how we
define imilarity’ of the two cars even if we have found that
small differences in the model do not change the estimated
brand effects very much.
The effect of age and kilometers is not assumed to be lin-
ear but quadractic function having not points. Because
there is a lot of data, whatever the shape of the relation
between kilometers and residual value, we can find it by
fitting a function that is flexible enough to find the shape of
the data. The functional form is empirical, not theoretical
question.
Since the brand has interaction with the age and kilome-
ters, it allows that each brand has different effect of kilometer
and age on residual value. We can test this hypothesis of dif-
ferent age and km slopes by brands. This specification of the
model means that for each (age and kilometer) point we will
have a different brand effect. We normally use the point of 3
years and 90,000 km as the reference point and we report the
brand effects at this point. It is useful because the normal
length of the leasing contracts is 3 years and the average con-
tract kilometers are somewhat under 90,000 km. Also the
FIGURE 1RVP Plotted against Age

age distribution of the sold used cars has the greatest fre-
quency at 3 years of age which means that we can most
accurately measure the brand effects at this point.
The function that relates the characteristics of the car to the
expectation value of residual values is in constant but rather
slow change. For example, if we estimate the model using
the used car price data period of January 1, 2006 - December
30, 2006, we get a bit different result from that of the data
period January 1, 2007 - December 30, 2007. However, usu-
ally the result does not change dramatically over time.
When the model is used to forecast the residual values at
the end of the contract, let’s say after 3 years, it also means
that we cannot assume that the function would be the same
when we get estimation using the latest data.
Price Concepts and Residual Value
As we have several price concepts for the very same car like
showroom asking price, realized selling price, purchase price
of car dealer, we can define residual value percent in several
different ways. We can define,
RVP_SAP=100*Showroom asking price/Original list price
The benefit of this definition is that price concept is public
and you have rather easy access to these prices. On the other
hand, this is not ’real’ value for the leasing company, but the
price leasing company actually gets is much lower. In
Finland the usual channel for leasing company to sell its car
is to sell it directly to car dealers.
In some other countries, there are car trade markets where
the leasing companies sell the cars at the end of the contract.
So here we can define residual value percent as,
RVP=100*Purchase price/ Original list price
Comparing the results from using the RVP_SAP and
RVP is interesting. If they are rather similar, it means that
just by modeling public showroom prices (or RVP_Sh) it
is possible to get approximately right view of the per-
centual effects of brand and other characteristics on resid-
ual values.
Options (Accessories)
The options have an effect on used car price. Many of the
options are standard, included in the car type without extra
payment. The extra options are those that can cause within
car type variation. The total value of extra options is used as
explanatory variable of the model.
Sampling Issues of Data and the Estimation
Method
The data is not simple random sample of the markets. First
of all, it is collected from only franchised dealers. So these
results concern directly only that market segment. We have
made some experiments of using our price model to forecast
the market prices of other market segment. The result was
that the price formation is really similar also in the segment
of non-franchised dealers not present in our data although
there was small level difference between these markets
(Aalto-Setala and Halonen 2003).
Secondly, the sample is clustered so that from the deal-
ers we have data, we usually have all the sold cars and the
cars for sale, but from part of the dealers have no data.
This kind of clustered sample may cause that the car
prices of the same dealer are statistically correlated and not
independent as it is assumed in standard covariance model
estimations (Dickey, Pantula and Rawlings 1998). To test
this hypothesis and to take it into account, it is possible to
use mixed model where the car dealer is used as random
variable. The dealer effect is assumed to be normally dis-
tributed with mean zero and some unknown variance.
The estimated model was so called mixed model where
other variables were fixed effects but the car dealer was used
as random effect.
The mixed model estimation was executed using STAT
module of the SAS system (Proc Mixed).
The Results of Model Estimation
The General Performance of the Model
The model explains the variation of the residual value well.
6 / International Journal of Automotive Industry and Management, July 2008

The Residual Value Function-Including the Estimated Brand Effects on Residual Values / 7
There is high correlation between real RVP and model esti-
mate. Large majority of the variation of modelled variables
can be explained by the variation in characteristics of the car.
Many variables that have statistically very significant
effects on residual values were found with p-values smaller
than 0.0001.
The figure 2 shows the histogram of residuals plotted
against normal curve. The distribution is rather symmetrical
and close to normal but it has somewhat heavier tails than
normal distribution. It means that most of the cases the
residual is close to zero and real residual value percent is
close to estimate but in some rare cases the observed resid-
ual value percentage are far from the model estimate. There
are some extremely low prices more often than extremely
high.
The unexplained residual variation means that there are
differences in residual values even the characteristics in the
model are the same. This is natural since there is variation in
the prices of every homogeneous product (Aalto-Setala
2003). If you buy a bottle of Coca Cola from 20 different
shops, you can observe variation in prices. Used car prices
don’t make any exception in this rule. Even if the characteris-
tics are the same, we can observe different prices and resid-
ual values.
There can be many causes of this unexplained variation.
During the 11 years I have spent in analyzing the car market
of 4 countries. I and other people in our company have spent
considerable amount of time trying to explain the part of the
price variation that the models can’t explain. One reason I
have found is that the situation in car dealers stock varies. In
some moment of time a dealer has plenty of Ford Mondeo’s
in your stock and the dealer is not willing to buy more. Thus
he is willing to pay less for the same car than dealer that
needs more of Mondeo into stock.
In the case of showroom asking prices, if the car has been
in stock over 90 days, many dealers have a policy that the car
must be sold fast even the price would be very low indeed.
This kind of situations explain some of the lowest retail
prices.
Second reason is that there can be variation in unobserved
characteristics of the car. If, at the moment of purchasing the
car, the dealer notice need of repairing in the car, the coming
repairing cost are subtracted from the purchase price. This can
be also the reason for the fact that there was more unex-
plained variation in residual value percentage using purchase
prices than when using retail asking prices. So it seems that it
is easier to predict accurately the retail price than purchase
price. This may be because the condition of the car when sell-
ing it out is mostly good because dealers are forced to repair
the cars by law, but when buying in there is more variation in
the condition and in the need of repairing.
When we plot the residuals against age (Figure 3), it can
be seen that most of the large negative residuals are a bit
older cars. The extremely low price can be because of poor
condition of the car. Many of the cases where we have large
negative residual, the car is rather cheap. Because we used
log of RVP as dependent variable, the large residual means
FIGURE 2The Histogram of the Residuals of the
(Purchase Price) Model
FIGURE 3The Residuals Plotted against Age of the Car
(N=44 067)

large relative difference between the observed value and the
estimate. If the car is cheap, the large relative difference is
not large in sum of money. Even 3,000 euro is two times
larger than 1,500 euro, the difference is only 1,500 euro .
Within data of 44,000 cases, there can many times be these
kind of cases.
One additional reason for deviant prices is that the seller
and the buyer can have some kind of special relation. The
buyer can be one of the managers of the car dealer or relative
to some of them.
Largest differences are such that the observed price is only
half of the model estimate, but in many cases the prediction
is 3,000 euro and real price is 1,500 euro.
The non-linearity of kilometer effect is very clear. The
proof that the model did find the shape of the residual val-
ues is the data in figure 4. The average value of observed
and estimated log RVP was calculated by kilometer group.
These averages of observed and estimated values were both
plotted against kilometer class. The non-linearity is very
clear but it is also clear that there is not much difference
between the observed and the estimated value. Thus the
model makes no significant systematic error in any of the
kilometer groups and thus kilometer effect has been mod-
eled accurately.
The Estimated Brand Effects
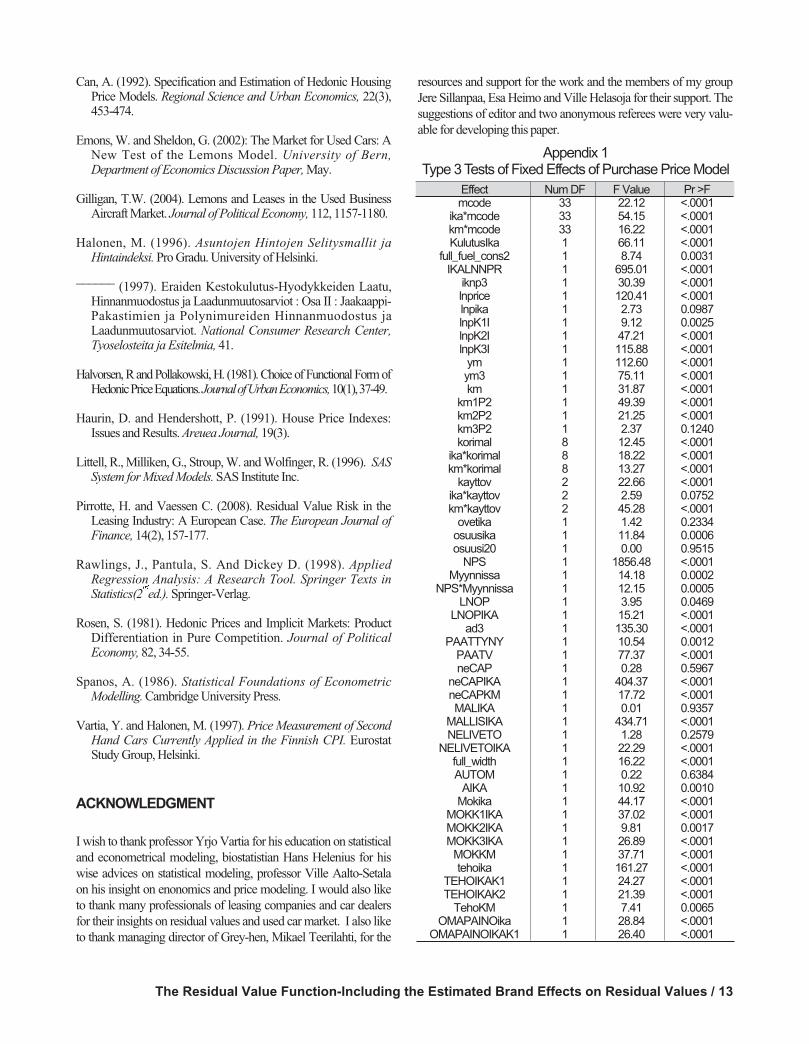
The brand effect on residual values is statistically very signifi-
cant (F=22.12, p<0.0001). This means that the probability
that the brand has no effect at all on residual value percentage
is lower than 0.0001 and in fact it is much lower. The interac-
tion of brand with the age was still stronger than brand inter-
cept (F=54.15, p<0.0001) and also the interaction with kilo-
meters was statistically very significant (F=16.22, p<0.0001).
This leaves little uncertainty that the brand of the car really
has a major effect on residual values. This means that there
are true differences between technically similar cars having
same new car price in residual value percentage based on the
brands. Moreover, there are true differences among brands, as
to how kilometers and age affect their residual values. The
brand effects were estimated for 33 brands. It is possible to
calculate the brand effect at any age-kilometer point for each
brand using the three estimated parameters.
The brand intercept tells what is the difference in brand
effect at the point of zero age and zero km compared with
average of all brands. Brand age tells the difference of age
slope of brand b compared to reference group. So by using
the estimated parameters of brand intercept, brand kilometers
and brand age, we can calculate the brand effect for brand b
at any age and kilometer point as,
where b denotes brand of car.
So the brand effect is a function of three factors which are
brand, age and kilometer.
We normally report the brand effect on residual value per-
centage at the point of 3 years and 90,000 km. This point is
used because it is very common length of the leasing con-
tracts and also because this kind of cars are really common in
the data and thus the results are the most reliable at this point.
Now if we calculate this at the point of 3 years and 90,000
km we will have one estimates effect per brand. The estimat-
ed brand effects (BE) at the point of 3 years and 90,000 km
are listed in table x both using showroom asking prices and
purchase price data. The brand effects are all divided by the
average brand effect. BE 100 means that it is average brand.
110 means that cars belonging to this brand have 10 % high-
er expectation value of residual value than similar car having
same characteristics and new car price, and average brand
value.
8 / International Journal of Automotive Industry and Management, July 2008
FIGURE 4The Average Values of the Estimated and
Observed Logs of Residual Value Percentage

The Residual Value Function-Including the Estimated Brand Effects on Residual Values / 9
Lexus, Toyota and Mercedes are the cars that have the
highest brand effects of all. Among these, Lexus is rather rare
in the car market of Finland, but it is well known that it was
made by Toyota. Usually rare brands hardly do very well but
there are exceptions.
German brands do especially well. Mercedes-Benz, Audi,
Volkswagen, Skoda, Mini and BMW are all in top 10.
Skoda is part of the Volkswagen group and consumers in
Finland know it very well nowadays. Mini is also part of the
BMW-group and well known as well. Although Opel is
made in Germany, it is not usually regarded as German
brand by consumers in Finland since it belongs to the GM
group. Also Japanese brands do well. Besides the top per-
formers, Lexus and Toyota, Honda, Mazda and Mitsubishi
rank in top 12.
Separate estimations were made using purchase prices and
publicly available showroom asking prices.
In the table 1 both results are shown. The correlation
between these results is high. This suggests that by using
publicly available portal asking prices, it is possible to esti-
mate rather accurately the effects of characteristics on RVP.
This is illustrated in the figure 5 showing the correlation plot
of asking price and purchase price BE.
Korean brands did not rank well except one clear excep-
tion: Kia. Kia has been able to build strong brand rather fast.
It has now higher brand value than Nissan, Peugeot, Ford
and Opel which all have been popular makers in the car mar-
ket of Finland for a long time. This does not happen so often.
Usually best brands are old and take long time to build the
value. The dealer network selling Kia is the biggest in
Finland and has a brand of its own. It has power to advertise
and make the unknown brand well known. In addition, giv-
ing longest warranty in the market is a wise move for an
unknown brand. The consumers had then the courage to
spend their money on unknown brand. When Kia was able
to break into top 10 in the selling volume list, it gave even
Rank BrandAsking Purchase
price BE price BE
1 Lexus 116.973 114.989
2 Toyota 112.626 114.199
3 Mercedes-Benz 111.103 112.470
4 Audi 110.393 112.196
5 Mini 115.285 112.138
6 Volkswagen 108.570 110.790
7 BMW 109.675 109.675
8 Skoda 106.177 109.629
9 Volvo 107.303 108.334
10 Honda 105.870 107.179
11 Mazda 103.280 104.001
12 Mitsubishi 103.748 103.607
13 Dodge 102.011 103.537
14 Kia 100.134 102.471
15 Subaru 100.842 99.453
16 Saab 97.648 98.458
17 Land Rover 97.382 97.890
18 Suzuki 96.864 97.644
19 Seat 97.964 97.607
20 Opel 97.317 97.475
21 Nissan 98.398 97.419
22 Alfa Romeo 95.779 96.784
23 Peugeot 95.924 96.687
24 Ford 94.969 96.569
25 Jaguar 95.977 94.680
26 Smart 106.266 93.567
27 Chrysler 89.478 91.571
28 Fiat 90.657 91.076
29 Citroen 90.622 89.629
30 Hyundai 88.240 88.980
31 Renault 88.782 88.290
32 Jeep 87.916 87.755
33 Daewoo 89.035 86.685
34 Chevrolet 86.788 86.565
TABLE 1The Brand Effects on Residual Values
FIGURE 5The Correlation of Showroom Asking Price and
Purchase Price BE
more boost. Kia has very intensive service program which
supports its maintenance also the long warranty itself sup-
ports the residual values since when buying three-year old
Kia, the warranty of manufacturer is still valid for a long
time. In the near future the residual values of Kia will be
under challenge because the supply of used Kia’s in the mar-
ket is increasing rapidly. Even so, it seems that Kia will be
able to stabilize its position in the car market of Finland. As
mentioned before, it is very rare that any new brand is able to
break its way into the markets and get good position in the
brand list in a very short time.
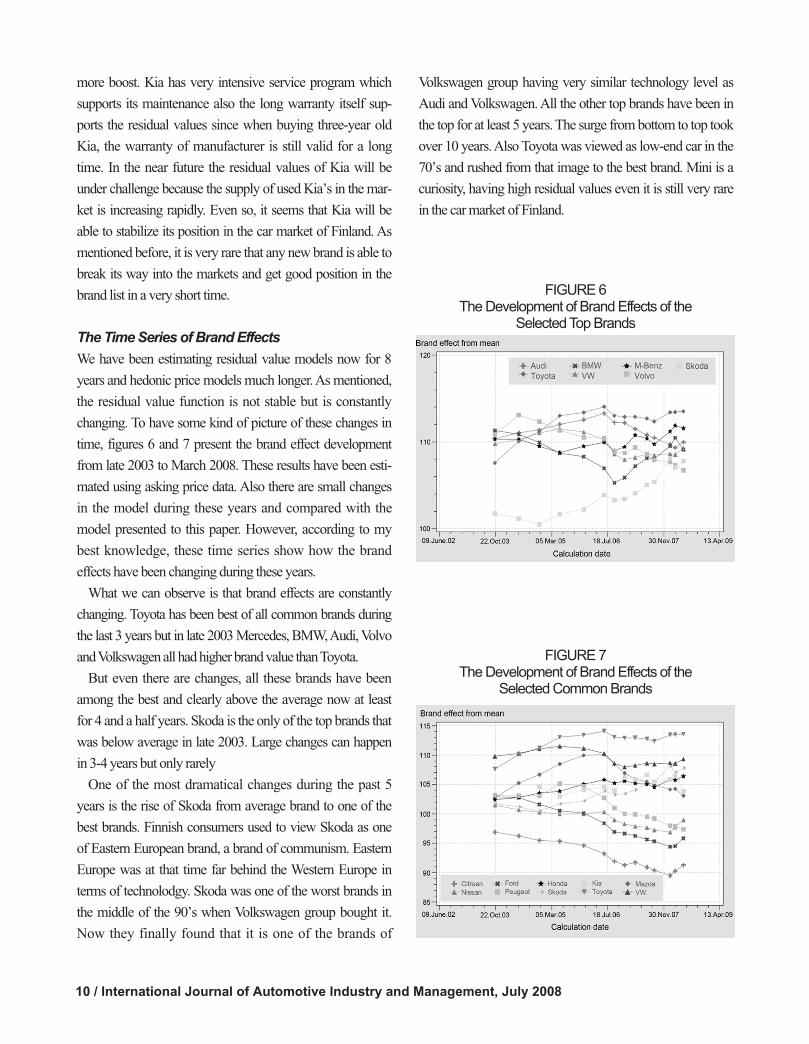
The Time Series of Brand Effects
We have been estimating residual value models now for 8
years and hedonic price models much longer. As mentioned,
the residual value function is not stable but is constantly
changing. To have some kind of picture of these changes in
time, figures 6 and 7 present the brand effect development
from late 2003 to March 2008. These results have been esti-
mated using asking price data. Also there are small changes
in the model during these years and compared with the
model presented to this paper. However, according to my
best knowledge, these time series show how the brand
effects have been changing during these years.
What we can observe is that brand effects are constantly
changing. Toyota has been best of all common brands during
the last 3 years but in late 2003 Mercedes, BMW, Audi, Volvo
and Volkswagen all had higher brand value than Toyota.
But even there are changes, all these brands have been
among the best and clearly above the average now at least
for 4 and a half years. Skoda is the only of the top brands that
was below average in late 2003. Large changes can happen
in 3-4 years but only rarely
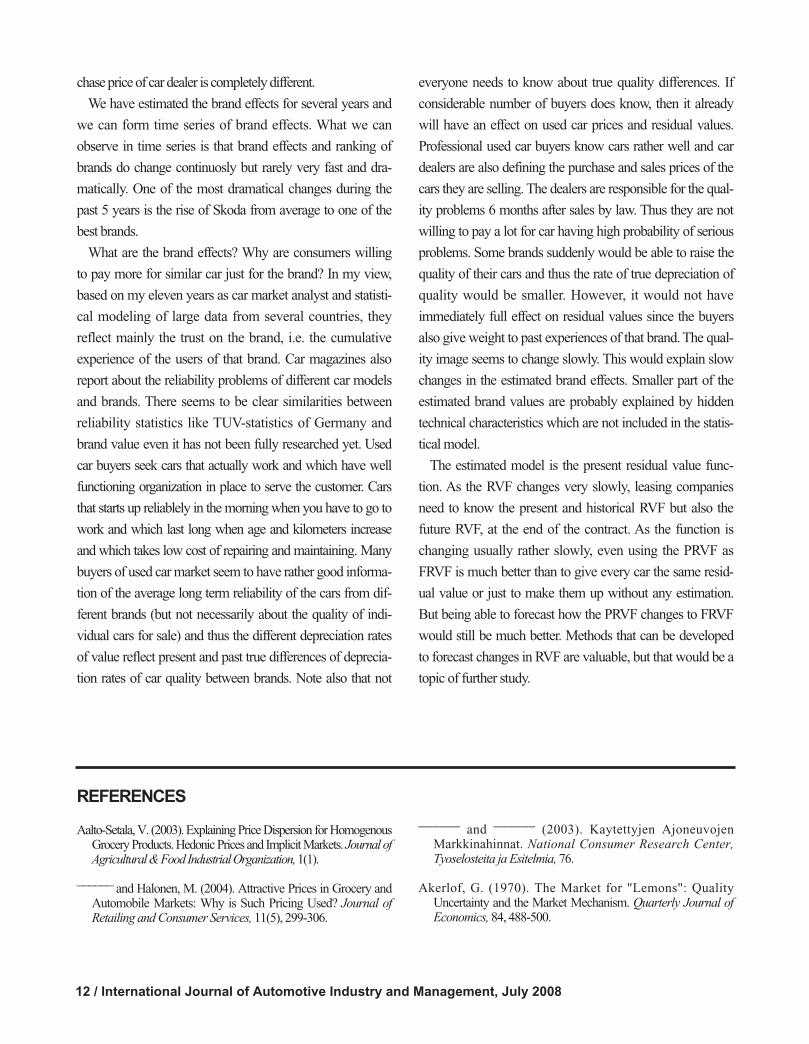
One of the most dramatical changes during the past 5
years is the rise of Skoda from average brand to one of the
best brands. Finnish consumers used to view Skoda as one
of Eastern European brand, a brand of communism. Eastern
Europe was at that time far behind the Western Europe in
terms of technolodgy. Skoda was one of the worst brands in
the middle of the 90’s when Volkswagen group bought it.
Now they finally found that it is one of the brands of
Volkswagen group having very similar technology level as
Audi and Volkswagen. All the other top brands have been in
the top for at least 5 years. The surge from bottom to top took
over 10 years. Also Toyota was viewed as low-end car in the
70’s and rushed from that image to the best brand. Mini is a
curiosity, having high residual values even it is still very rare
in the car market of Finland.
10 / International Journal of Automotive Industry and Management, July 2008
FIGURE 6The Development of Brand Effects of the
Selected Top Brands
FIGURE 7The Development of Brand Effects of the
Selected Common Brands

The Residual Value Function-Including the Estimated Brand Effects on Residual Values / 11
Other Characteristics and Residual Values
Even in this paper focuses on brand effects, we can find
many other factors which have statistically very significant
effect on residual values.
The strongest variable having highest F-value(=1856.48) is
the change in the list price. When the new car price decreases,
also the used car prices and residual value decreases but very
importantly, less than new car value. In Finland there was
considerable tax reform in the beginning of 2008 which
caused the retail prices of new cars to change based on CO2-
emissions. Mainly because of this, the effect was this time so
strong. Usually the price changes of the same car type in time
are rather small. Now they have been from -25 % to +25 %
depending on fuel type and fuel consumption.
Fuel consumption has very clear effect on residual value,
but even more importantly it has strong interaction with age.
Because the estimated effect is positive, this means that cars
that have low fuel consumption also have higher residual
value because they lose value slower when the age increases.
The age of model generation is very strong explanatory
variable having F-value of 434.71. For example, when new
generation of VW Golf IV comes into market, it first has
higher residual value but then the residual value of the same
version at the same age km point decreases. This is very logi-
cal because as generation gets older, the consumers start to
view it as old fashioned and do not value it so highly as in its
first years of sales.
Note that the age of the model itself does not play a major
role. It was not statistically significant having F-value of only
0.01. Also this is logical since there are many classical old
models like Golf or Corolla that have high residual values
but whereas old models like Mondeo or Laguna have low
residual values.
The ending of the production of the car model (e.g.,
Nissan Almera) has clearly negative effect on residual values
of the model. Very interestingly, only small part of the effect
comes immediately after the ending. Majority of it comes
year by year after the ending. The interaction between the
ending of the model and the time from the end of the model
has F-value of 77.37, p<0.0001).
Conclusion
In this paper it was shown, how we can estimate the residual
value functions that relate the (expectation values of) residual
value percentage to the characteristics of the cars. The data
used was both public retail asking price data and the real pur-
chase prices of the same vehicle. Data was obtained from the
franchised dealers and car market of Finland. Especially the
effect of the brand on the residual value was reported. The
brand effect of residual value means that some brands seem
to have higher residual value percentage than other even they
are technically similar having same price as new.
The brand effect on residual values was statistically very
significant. The brand had also very significant interaction
between both age and kilometers. Thus there were statistical-
ly significant differences of the age and kilometers effects on
residual value between brands.
Lexus and Toyota were the most valued brands in the car
market of Finland. Out of these, Lexus is rare and Toyota is
very common. These brands were followed by many
German brands: Mercedes, Audi, Volkswagen, BMW,
Skoda and Mini(BMW). The other Japanese brands, Mazda
and Honda were the next. French, Italian and American
brands did not perform well.
Other than brand, the new car price difference within the
model was a very strong explanatory variable. The more
expensive version of the model, the lower the residual value
if the characteristics are kept constant.
New car price changes are also reflected very clearly on the
residual values. If the new car price drops during the contract,
the residual value drops too but not as much as new car price.
The model generation age had also very significant effect
on residual value percent. For new generation of a model, the
residual values are first higher but then gradually decrease
before new generation again replaces it. The age of the
model itself did not have any significant effect.
The results of estimation using purchase prices and retail
asking prices were strikingly similar. This suggests that we can
use most easily available portal asking price data to estimate
the effects of brand on residual value and the effects of other
characteristics too. Of course the level of the asking and pur-
chase price of car dealer is completely different.
We have estimated the brand effects for several years and
we can form time series of brand effects. What we can
observe in time series is that brand effects and ranking of
brands do change continuosly but rarely very fast and dra-
matically. One of the most dramatical changes during the
past 5 years is the rise of Skoda from average to one of the
best brands.
What are the brand effects? Why are consumers willing
to pay more for similar car just for the brand? In my view,
based on my eleven years as car market analyst and statisti-
cal modeling of large data from several countries, they
reflect mainly the trust on the brand, i.e. the cumulative
experience of the users of that brand. Car magazines also
report about the reliability problems of different car models
and brands. There seems to be clear similarities between
reliability statistics like TUV-statistics of Germany and
brand value even it has not been fully researched yet. Used
car buyers seek cars that actually work and which have well
functioning organization in place to serve the customer. Cars
that starts up reliablely in the morning when you have to go to
work and which last long when age and kilometers increase
and which takes low cost of repairing and maintaining. Many
buyers of used car market seem to have rather good informa-
tion of the average long term reliability of the cars from dif-
ferent brands (but not necessarily about the quality of indi-
vidual cars for sale) and thus the different depreciation rates
of value reflect present and past true differences of deprecia-
tion rates of car quality between brands. Note also that not
everyone needs to know about true quality differences. If
considerable number of buyers does know, then it already
will have an effect on used car prices and residual values.
Professional used car buyers know cars rather well and car
dealers are also defining the purchase and sales prices of the
cars they are selling. The dealers are responsible for the qual-
ity problems 6 months after sales by law. Thus they are not
willing to pay a lot for car having high probability of serious
problems. Some brands suddenly would be able to raise the
quality of their cars and thus the rate of true depreciation of
quality would be smaller. However, it would not have
immediately full effect on residual values since the buyers
also give weight to past experiences of that brand. The qual-
ity image seems to change slowly. This would explain slow
changes in the estimated brand effects. Smaller part of the
estimated brand values are probably explained by hidden
technical characteristics which are not included in the statis-
tical model.
The estimated model is the present residual value func-
tion. As the RVF changes very slowly, leasing companies
need to know the present and historical RVF but also the
future RVF, at the end of the contract. As the function is
changing usually rather slowly, even using the PRVF as
FRVF is much better than to give every car the same resid-
ual value or just to make them up without any estimation.
But being able to forecast how the PRVF changes to FRVF
would still be much better. Methods that can be developed
to forecast changes in RVF are valuable, but that would be a
topic of further study.
12 / International Journal of Automotive Industry and Management, July 2008
REFERENCES
Aalto-Setala, V. (2003). Explaining Price Dispersion for HomogenousGrocery Products. Hedonic Prices and Implicit Markets. Journal ofAgricultural & Food Industrial Organization,1(1).
______and Halonen, M. (2004). Attractive Prices in Grocery and
Automobile Markets: Why is Such Pricing Used? Journal ofRetailing and Consumer Services, 11(5), 299-306.
______and
______(2003). Kaytettyjen Ajoneuvojen
Markkinahinnat. National Consumer Research Center,Tyoselosteita ja Esitelmia, 76.
Akerlof, G. (1970). The Market for "Lemons": QualityUncertainty and the Market Mechanism. Quarterly Journal ofEconomics, 84, 488-500.
The Residual Value Function-Including the Estimated Brand Effects on Residual Values / 13
Can, A. (1992). Specification and Estimation of Hedonic HousingPrice Models. Regional Science and Urban Economics, 22(3),453-474.
Emons, W. and Sheldon, G. (2002): The Market for Used Cars: ANew Test of the Lemons Model. University of Bern,Department of Economics Discussion Paper, May.
Gilligan, T.W. (2004). Lemons and Leases in the Used BusinessAircraft Market. Journal of Political Economy, 112, 1157-1180.
Halonen, M. (1996). Asuntojen Hintojen Selitysmallit jaHintaindeksi. Pro Gradu. University of Helsinki.
______(1997). Eraiden Kestokulutus-Hyodykkeiden Laatu,
Hinnanmuodostus ja Laadunmuutosarviot : Osa II : Jaakaappi-Pakastimien ja Polynimureiden Hinnanmuodostus jaLaadunmuutosarviot. National Consumer Research Center,Tyoselosteita ja Esitelmia, 41.
Halvorsen, R and Pollakowski, H. (1981). Choice of Functional Form ofHedonic Price Equations. Journal of Urban Economics,10(1), 37-49.
Haurin, D. and Hendershott, P. (1991). House Price Indexes:Issues and Results. Areuea Journal, 19(3).
Littell, R., Milliken, G., Stroup, W. and Wolfinger, R. (1996). SASSystem for Mixed Models. SAS Institute Inc.
Pirrotte, H. and Vaessen C. (2008). Residual Value Risk in theLeasing Industry: A European Case. The European Journal ofFinance, 14(2), 157-177.
Rawlings, J., Pantula, S. And Dickey D. (1998). AppliedRegression Analysis: A Research Tool. Springer Texts inStatistics(2 ed.). Springer-Verlag.
Rosen, S. (1981). Hedonic Prices and Implicit Markets: ProductDifferentiation in Pure Competition. Journal of PoliticalEconomy, 82, 34-55.
Spanos, A. (1986). Statistical Foundations of EconometricModelling. Cambridge University Press.
Vartia, Y. and Halonen, M. (1997). Price Measurement of SecondHand Cars Currently Applied in the Finnish CPI. EurostatStudy Group, Helsinki.
ACKNOWLEDGMENT
I wish to thank professor Yrjo Vartia for his education on statistical
and econometrical modeling, biostatistian Hans Helenius for his
wise advices on statistical modeling, professor Ville Aalto-Setala
on his insight on enonomics and price modeling. I would also like
to thank many professionals of leasing companies and car dealers
for their insights on residual values and used car market. I also like
to thank managing director of Grey-hen, Mikael Teerilahti, for the
resources and support for the work and the members of my group
Jere Sillanpaa, Esa Heimo and Ville Helasoja for their support. The
suggestions of editor and two anonymous referees were very valu-
able for developing this paper.
Effect Num DF F Value Pr >Fmcode 33 22.12 <.0001
ika*mcode 33 54.15 <.0001km*mcode 33 16.22 <.0001KulutusIka 1 66.11 <.0001
full_fuel_cons2 1 8.74 0.0031IKALNNPR 1 695.01 <.0001
iknp3 1 30.39 <.0001lnprice 1 120.41 <.0001lnpika 1 2.73 0.0987lnpK1I 1 9.12 0.0025lnpK2I 1 47.21 <.0001lnpK3I 1 115.88 <.0001
ym 1 112.60 <.0001ym3 1 75.11 <.0001km 1 31.87 <.0001
km1P2 1 49.39 <.0001km2P2 1 21.25 <.0001km3P2 1 2.37 0.1240korimal 8 12.45 <.0001
ika*korimal 8 18.22 <.0001km*korimal 8 13.27 <.0001
kayttov 2 22.66 <.0001ika*kayttov 2 2.59 0.0752km*kayttov 2 45.28 <.0001
ovetika 1 1.42 0.2334osuusika 1 11.84 0.0006osuusi20 1 0.00 0.9515
NPS 1 1856.48 <.0001Myynnissa 1 14.18 0.0002
NPS*Myynnissa 1 12.15 0.0005LNOP 1 3.95 0.0469
LNOPIKA 1 15.21 <.0001ad3 1 135.30 <.0001
PAATTYNY 1 10.54 0.0012PAATV 1 77.37 <.0001neCAP 1 0.28 0.5967
neCAPIKA 1 404.37 <.0001neCAPKM 1 17.72 <.0001MALIKA 1 0.01 0.9357
MALLISIKA 1 434.71 <.0001NELIVETO 1 1.28 0.2579
NELIVETOIKA 1 22.29 <.0001full_width 1 16.22 <.0001AUTOM 1 0.22 0.6384
AIKA 1 10.92 0.0010Mokika 1 44.17 <.0001
MOKK1IKA 1 37.02 <.0001MOKK2IKA 1 9.81 0.0017MOKK3IKA 1 26.89 <.0001
MOKKM 1 37.71 <.0001tehoika 1 161.27 <.0001
TEHOIKAK1 1 24.27 <.0001TEHOIKAK2 1 21.39 <.0001
TehoKM 1 7.41 0.0065OMAPAINOika 1 28.84 <.0001
OMAPAINOIKAK1 1 26.40 <.0001
Appendix 1Type 3 Tests of Fixed Effects of Purchase Price Model
14 / International Journal of Automotive Industry and Management, July 2008
[[한한국국어어 요요약약((KKoorreeaann AAbbssttrraacctt))]]
중고차의 가치는 차량과 주행거리에 따라 감가상각된다. 리스 계약 차량의 경우, 계약 만료 시점의차량 가치를‘잔존가치(residual value)’라 하며 차량의 감가상각은 리스 비용구조에 있어 가장 중요한 부분이다. 차량은 그 특징에 따라 감가상각률에 차이를 보이기 때문에 리스 비즈니스의 관건은어떤 차량의 가치가 더 오래 보존되는지를 확인하는 것과 계약 만료 시점의 차량가치를 정확하게 측정하는 데 있다. 이는 완성차업체에도 중요한 함의를 지닌다. 왜냐하면 잔존가치가 높은 차량일수록소비자가 부담하는 비용은 낮아질 것이며, 그러한 차량에 대한 소비자의 선호도와 구매의향은 더 높아질 것이기 때문이다.
핀란드 자동차시장의 데이터와 헤도닉 가격 모형(hedonic model)을 이용하여 차량의 특징과 신차가격 대비 잔존가치의 비율을 예측하는 함수를 구할 수 있다. 변수로 사용되는 가격에는 소매가와실구매가가 있다. 두 가격은 많은 차이를 보이나 각각을 이용한 추정 결과는 매우 유사했다. 따라서브랜드 효과가 잔존가치에 미치는 향을 추정하는 데 있어서 포털사이트에서 흔히 구할 수 있는 소비자 가격을 사용하는 것도 무방해 보인다.
잔존가치 비율에 향을 미치는 변수는 매우 많으나 그 중 가장 중요한 변수는 브랜드이다. 가령,가격 및 사양이 비슷한 차량이라 하더라도 브랜드에 따라 소비자의 지불 의향은 큰 차이가 있을 수있는 것이다. 브랜드 가치는 시간이 지나면서 변화하지만 변화에는 상당한 시간이 소요된다. 짧은시간에 브랜드 가치를 향상시키는 것은 매우 어려운 일이지만 예외도 존재한다. 대표적인 사례가 스코다와 기아자동차이다. 스코다의 경우 핀란드 시장에서 평균 수준의 브랜드 으나 5년여 만에 상위권 브랜드로 도약하 다. 그리고 유럽인에게 생소한 브랜드 던 기아자동차의 인지도와 신뢰도가 빠르게 상승하고 있다. 생소한 브랜드가 단기간에 이렇듯 높은 평가를 받는 것은 어려운 일임에도 불구하고 기아자동차는 핀란드 자동차시장에서 빠르게 성장하여 브랜드 가치를 인정받고 있다. 그 원인으로 핀란드에서 가장 긴 기아차의 보증기간이 상당한 향을 미친 것으로 추측된다. 보증기간도잔존가치에 향을 미칠 수 있는데, 3년 된 기아자동차를 구매할 경우 보증기간이 여전히 남아 있기때문에 잔존가치가 높은 것이다.
동일한 차종을 기준으로, 신차 가격은 잔존가치와 부(-)의 관계에 있다. 즉, 다른 조건이 일정할 경우 고급형 차량의 잔존가치 비율은 더 낮았다. 신차 가격의 변화 또한 중요한 변수이다. 계약기간중 신차 가격이 낮아질 경우 잔존가치도 떨어지나 신차 가격의 할인율보다는 폭이 작은 것으로 나타났다. 또 다른 변수는 차종 세대교체이다. 신 모델(new model) 출시 직후에는 잔존가치가 일정기간 유지되나 새로운 모델이 기존 모델을 대체하는 시점을 기준으로 잔존가치는 점차 줄어든다. 마지막으로 핀란드 시장에서 차량의 연식은 잔존가치에 큰 향을 미치지 않는 것으로 나타났다.

anaging supply chains is an essential part to
obtain competitive advantages. Especially, activ-
ity configuration and activity coordination in the
supply chain are critical elements for competitive advantage
(Porter 1986). Activity configuration is to determine whether
each value activity disperses or concentrates within the sup-
ply chain. Activity coordination is to coordinate among the
divided value activities within the supply chain through shar-
ing and accumulating information, know-how, and expert
knowledge.
Meanwhile, the concept of modularisation is not just sub-
assembly at the supplier side but also module development
or systemization that suggests the best system with idea and
design. Systemization type module means that module mak-
ers do not physically assemble some related parts, but devel-
op the lighter, the better, and the more qualified module with
less number of parts. For such a systemization-oriented mod-
Modularisation Development Pathin the Auto Parts Industry:
Comparison of Korea and Japan
Abstract - Modularisation provides new challenges for the automobile industry. Following the trend,
this study empirically compared the cases of Korea and Japan. This study finds out the characteris-
tics of modularisation dynamics in Korea which are different from those of Japan. The results show
that modularisation of Korean automobile industry is shifting to modularisation in inter-firm system
which outsources the subsystem to the outside suppliers, based on modular (open) supply chain
(organizational) architecture unlike Japan.
Typically, mega suppliers such as Hyundai Mobis produce module systems and OEMs purchase
them. Also, mega suppliers make an effort to develop module systems. On the other hand, modulari-
sation of Japanese automobile industry is shifting to modularisation in OEM production which
insources the sub-system and assembles the customized parts. Japanese 1st tier suppliers develop
and provide the customized parts and Japanese OEMs purchase the parts from the 1st tier suppliers
and assemble complete car as a whole. Thus, while Japan is based on integral organizational archi-
tecture in supply chains and modular product architectures of parts, Korea is based on modular orga-
nizational architecture in supply chains and integral product architecture of module.
Keywords - Modularisation, Product architecture, Supply chain architecture, Inter-firm systems
Ki-Chan Kim & Hi-Sook Kim
Ki-Chan Kim is Dean of Business School at the Catholic University of
Korea. He received Ph.D. from Seoul National University, Korea and had
researched at University of Tokyo, Japan and MIT as a visiting scholar.
He received many academic awards including the best paper award from
The Korean Academic Society of Business Administration in 2005. He is
currently serving as President of Korea Academy of Motor Industry.
Hi-Sook Kim is a university lecturer. She received Ph.D. from The Catholic
University of Korea. She received the best paper award from The Korean
Academic Society of Business Administration in 2005. Her primary
researh field concerns automobile industry, business architecture, capabil-
ity evolution and modularisation. ([email protected])
M
2008, Korea Automotive Research InstituteISSN 1976-7307(Print)
IJAIM, Vol. 2 (July 2008), 15-2215

ularisation, the value activity coordination through sharing
the information and knowledge is most needed. Thus, the
necessary conditions of advanced modularisation in terms of
quality include definite support of IT (Information
Technology) as a tool of activity configuration. In the pre-
sent auto industry, modularisation is used as a tool for value
activity configuration among supply chains, while e-SCM
(electronic Supply Chain Management) is used as a tool for
activity coordination.
Modularisation has 3 different dimensions, which are
modularisation in product architecture, modularisation in
production, and modularisation in inter-firm systems
(Takeishi and Fujimoto 2001). Modularisation in product
architecture indicates shifting to integral architecture.
Modularisation in production means standardization of com-
ponent design within an automaker and functional indepen-
dence/interface simplification. Modularisation in inter-firm
systems is to outsource subsystems in larger units to outside
suppliers.
In an automobile industry, one vehicle needs around
20,000 of 5,000 kinds parts through various processes
like design, production, and assembly. It is impossible
for one company to handle all these parts and processes.
Thus, automobile assembly companies and part compa-
nies are complementing their value activities each other.
This fact implies that the automobile is a system product
which is integrated with different categories of activities.
Configuration in the automobile industry changes cell-
based configuration to module-based configuration in
value chains. Modularisation comes from classical con-
figuration like deal of complexity (Baldwin and Clark
1997). As current automobiles are more complex than
those in the past, the module as a sub-system prorides
with higher flexibility to designers, manufacturers, and
users by dividing complex systems into several pieces.
These pieces, which are called modules, play a role of
outsourcing assembly functions to the company.
Modularisation refers the idea to develop a group of
parts with independent units by designating the interface.
Module makes complex systems or processes by linking
other sub-system based on its own rules.
This study has a purpose to verify the model empirically
to explain correlation between modularisation strategies as
a tool of configuration. This will develop the process of
coordination and configuration to obtain competitive
advantage.
Conceptual Framework and Research Setting
Takeishi and Fujimoto (2001) suggested the three facets of
modularisation which are modularisation in product architec-
ture, modularisation in production, and modularisation in
inter-firm systems. Figure 1 shows the three modularisation
types and its trends.
The data on the trends of modularisation were collected
from Korean automobile 1st tier suppliers. The survey ques-
tionnaires were mailed from June 1, 2002 to August 31, 2002.
In order to obtain more responses, a follow-up letters and fol-
low-up calls were delivered to the designated respondents
after the initial questionnaire administration. 450 survey ques-
tionnaires were sent out to Korean automotive 1st tier suppli-
ers (a survey was administered for each 1st tier supplier of the
four major car makers in Korea: Hyundai-Kia, GM-Daewoo,
Ssang-Yong, and Renault-Samsung). Among 182 responses,
5 were classified as being inadequate due to incomplete
answers or void responses. 177 responses were used for the
analysis. The descriptive statistics of the valid 177 samples
are shown in Table 2, 3, and 4. Overall, the spread by OEM
16 / International Journal of Automotive Industry and Management, July 2008
FIGURE 1Conceptual Framework for Trends in Modularisation
customer mirrors production volumes by these manufactur-
ers, and thus eliminates any concerns regarding a bias
towards a certain vehicle manufacturer.
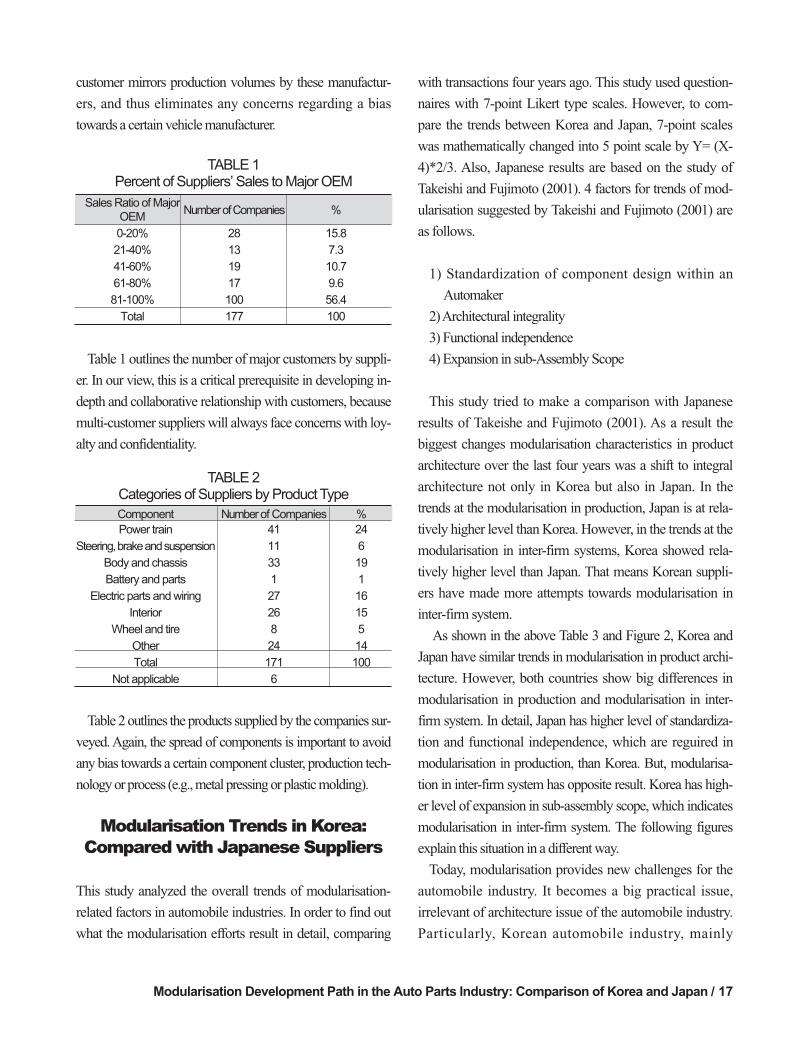
Table 1 outlines the number of major customers by suppli-
er. In our view, this is a critical prerequisite in developing in-
depth and collaborative relationship with customers, because
multi-customer suppliers will always face concerns with loy-
alty and confidentiality.
Table 2 outlines the products supplied by the companies sur-
veyed. Again, the spread of components is important to avoid
any bias towards a certain component cluster, production tech-
nology or process (e.g., metal pressing or plastic molding).
Modularisation Trends in Korea:Compared with Japanese Suppliers
This study analyzed the overall trends of modularisation-
related factors in automobile industries. In order to find out
what the modularisation efforts result in detail, comparing
with transactions four years ago. This study used question-
naires with 7-point Likert type scales. However, to com-
pare the trends between Korea and Japan, 7-point scales
was mathematically changed into 5 point scale by Y= (X-
4)*2/3. Also, Japanese results are based on the study of
Takeishi and Fujimoto (2001). 4 factors for trends of mod-
ularisation suggested by Takeishi and Fujimoto (2001) are
as follows.
1) Standardization of component design within an
Automaker
2) Architectural integrality
3) Functional independence
4) Expansion in sub-Assembly Scope
This study tried to make a comparison with Japanese
results of Takeishe and Fujimoto (2001). As a result the
biggest changes modularisation characteristics in product
architecture over the last four years was a shift to integral
architecture not only in Korea but also in Japan. In the
trends at the modularisation in production, Japan is at rela-
tively higher level than Korea. However, in the trends at the
modularisation in inter-firm systems, Korea showed rela-
tively higher level than Japan. That means Korean suppli-
ers have made more attempts towards modularisation in
inter-firm system.
As shown in the above Table 3 and Figure 2, Korea and
Japan have similar trends in modularisation in product archi-
tecture. However, both countries show big differences in
modularisation in production and modularisation in inter-
firm system. In detail, Japan has higher level of standardiza-
tion and functional independence, which are reguired in
modularisation in production, than Korea. But, modularisa-
tion in inter-firm system has opposite result. Korea has high-
er level of expansion in sub-assembly scope, which indicates
modularisation in inter-firm system. The following figures
explain this situation in a different way.
Today, modularisation provides new challenges for the
automobile industry. It becomes a big practical issue,
irrelevant of architecture issue of the automobile industry.
Particularly, Korean automobile industry, mainly
Modularisation Development Path in the Auto Parts Industry: Comparison of Korea and Japan / 17
Sales Ratio of Major OEM
Number of Companies %
0-20% 28 15.8
21-40% 13 7.3
41-60% 19 10.7
61-80% 17 9.6
81-100% 100 56.4
Total 177 100
TABLE 1Percent of Suppliers’ Sales to Major OEM
Component Numberof Companies %
Power train 41 24
Steering, brake and suspension 11 6
Body and chassis 33 19
Battery and parts 1 1
Electric parts and wiring 27 16
Interior 26 15
Wheel and tire 8 5
Other 24 14
Total 171 100
Not applicable 6
TABLE 2Categories of Suppliers by Product Type

Hyundai and Kia, is aggressively pushing for modularisa-
tion. They are pursuing to reduce costs and increase pro-
ductivity through module type suppliers such as Hyundai
Mobis that focus on developing systemized modules with
new materials and function integration. Subsequently,
modular design is accelerated in part industries and
improved three factors of competitiveness in automobile
industries: cost saving, time saving, and quality improve-
18 / International Journal of Automotive Industry and Management, July 2008
Modularisation Trends Items Korea* Japan**
Function of the component became more complex
(with more function required)
Need for functional coordination with other components increasedModularisation in Shift to Integral
Need for structural coordination with other components 0.68 0.62Product Architecture Architecture
(such as checking matching and interference
Component steps and costs to assemble the component
decreased with the adoption of integrally-molded parts
Standardization of Within the same automaker
component design Across different automakers 0.17 0.43
within an Automaker Between current and earlier models
Size of the component reduced with the same basic structure
Number of interfaces (such as contact points) with other
Modularisation in components decreased
ProductionFunctional Independence/
Designs of interfaces (such as contact points) with other
components were simplified 0.05 0.19Interface Simplification
Designs of interfaces (such as contact points) were standardized
across different automakers
Function of the component became more self-contained
(independent)
Number of parts making up the component increased
Modularisation in Expansion in Sub Number of assembly process steps for the component increased0.25 0.05
Inter-firms System -assembly Scope Component has been incorporated into another assembly
component
TABLE 3Four Categories of Modularisation Trends
* Korean results are based on the questionnaire survey which was conducted in 2002.** Japanese results are based on the study of Takeishi and Fujimoto (2001).
FIGURE 2Trends of Modurisation in Korea and Japan:
Changes over the Last 4 Years
FIGURE 3Dynamics of Modularisation in Production,
Inter-firm System, Product Architecture

ment. Korea automobile company improved the effec-
tiveness of product design and manufacturing.
The following figures explain the trends in detail.
According to Figure 5, Korea has higher levels of modulari-
sation in product shifting to integral architecture. Especially,
Korea is more likely to need structural coordination with
other components such as checking matching and interfer-
ence, while Japan decreased component steps and costs to
assemble the component with the adoption of integrally-
molded parts
note: 17. Production of the component became more complex (with more
function required).
18. Need for functional coordination with other components
increased.
19. Need of structural coordination with other components (such as
checking matching and interference).
5. Component steps and costs to assemble the component decreased
with the adoption of integrally-molded parts.
note: 6. Component design was shared by different models of the same
automaker.
7. Component design was shared between different variations of the
same model.
13. Designs of interfaces (such as contact points) were shared by dif
ferent models of the same automaker.
14. Designs of interfaces (such as contact points) were shared
between different variations of the same model.
note: 8. Component design was standardized across different automakers.
10. The number of variations within a vehicle model decreased.
Modularisation Development Path in the Auto Parts Industry: Comparison of Korea and Japan / 19
FIGURE 4Dynamics of Modularisation in Parts Industry:
Components Architecture vs. Module Architecture
FIGURE 5Modularisation in Product: Shift to Integral Architecture
FIGURE 6Modularisation in Production : Standardization of
Component Design within an Automaker
FIGURE 7Modularisation in Production: Standardization of
Component Design Across Different Automakers
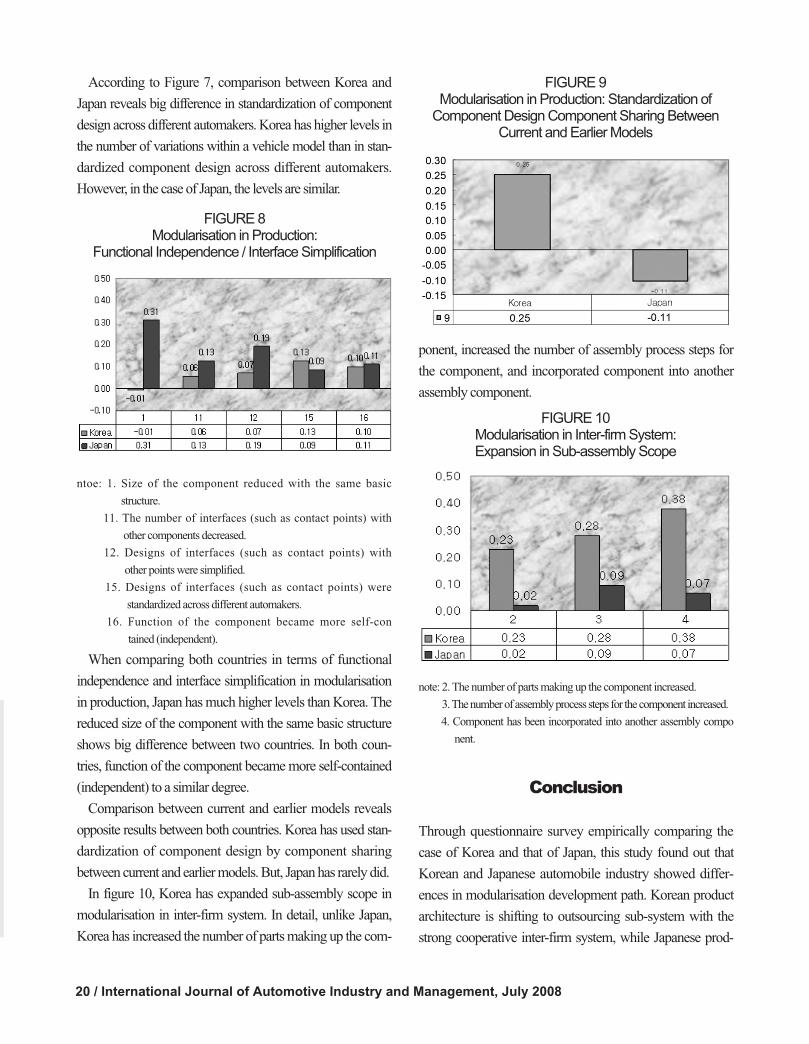
According to Figure 7, comparison between Korea and
Japan reveals big difference in standardization of component
design across different automakers. Korea has higher levels in
the number of variations within a vehicle model than in stan-
dardized component design across different automakers.
However, in the case of Japan, the levels are similar.
ntoe: 1. Size of the component reduced with the same basic
structure.
11. The number of interfaces (such as contact points) with
other components decreased.
12. Designs of interfaces (such as contact points) with
other points were simplified.
15. Designs of interfaces (such as contact points) were
standardized across different automakers.
16. Function of the component became more self-con
tained (independent).
When comparing both countries in terms of functional
independence and interface simplification in modularisation
in production, Japan has much higher levels than Korea. The
reduced size of the component with the same basic structure
shows big difference between two countries. In both coun-
tries, function of the component became more self-contained
(independent) to a similar degree.
Comparison between current and earlier models reveals
opposite results between both countries. Korea has used stan-
dardization of component design by component sharing
between current and earlier models. But, Japan has rarely did.
In figure 10, Korea has expanded sub-assembly scope in
modularisation in inter-firm system. In detail, unlike Japan,
Korea has increased the number of parts making up the com-
ponent, increased the number of assembly process steps for
the component, and incorporated component into another
assembly component.
note: 2. The number of parts making up the component increased.
3. The number of assembly process steps for the component increased.
4. Component has been incorporated into another assembly compo
nent.
Conclusion
Through questionnaire survey empirically comparing the
case of Korea and that of Japan, this study found out that
Korean and Japanese automobile industry showed differ-
ences in modularisation development path. Korean product
architecture is shifting to outsourcing sub-system with the
strong cooperative inter-firm system, while Japanese prod-
20 / International Journal of Automotive Industry and Management, July 2008
FIGURE 9Modularisation in Production: Standardization of
Component Design Component Sharing BetweenCurrent and Earlier Models
FIGURE 8Modularisation in Production:
Functional Independence / Interface Simplification
FIGURE 10Modularisation in Inter-firm System:Expansion in Sub-assembly Scope
uct architecture is shifting to insourcing sub-system.
Typically, mega suppliers such as Hyundai Mobis produce
module systems, along with an efforts to develop them and
OEMs purchase the module systems. Meanwhile, Japanese
1st tier suppliers develop and provide the customized parts to
OEM and Japanese OEMs purchase the parts from them
and assemble complete car as a whole. Thus, while Japan is
focusing on organizational integral architecture and modular
product architecture of parts, Korea is focusing on modular
organizational architecture based on supply chain and inte-
gral product architecture of module developed by mega
module supplier.
REFERENCES
Aoki, Masahiko (2001). Toward a Comparative InstitutionalAnalysis. MIT Press.
_____and Anto, Haruhiko (2002). Modurization: Nature of New
Industry Architecture. Touyo Kejai Sinmusha.
Baldwin, Carliss Y. and Kim, B. Clark(2000). Design Rules: ThePower of Modularity. MIT Press.
_____and
_____(1997). Managing in an Age of Modularity,
Harvard Business Review, 75(5), 84-93.
Fine, Charles(1998). Clockspeed-Winning Industry Control in theAge of Temporary Advantage. Perseus Books.
Fujimoto, Takahiro(2002). Japanese Style Supplier andModurization.
Porter, E. Michael(1986). Competition in Global Industries. The
Free Press.
Kim, Ki-Chan and Im, Il. (2002). The Effects of Electronic SupplyChain Design (e-SCD) on Coordination and Knowledge
Sharing: An Empirical Investigation. Proceedings of the 35th
Annual Hawaii International Conference on System Sciences,
(January), Big Island, Hawaii.
Satosh, Hino(2003). The Secret of Toyota Growth. Tong-Yang
Mungo Publisher.
Starr, M.K. (1965). Modular Production - A new Concept.
Harvard Business Review, 43(6), 131-142.
Takeishi, A. and Fujimoto, T. (2001). Modularisation in the Auto
Industry: Interlinked Multiple Hierarchies of Product,
Production and Supplier Systems, International Journal ofTechnology management, 1(4), 379-396.
ACKNOWLEDGMENT
This work was supported by the IMVP(International Motor Vehicle
Program), MIT.
Modularisation Development Path in the Auto Parts Industry: Comparison of Korea and Japan / 21
22 / International Journal of Automotive Industry and Management, July 2008
[[한한국국어어 요요약약((KKoorreeaann AAbbssttrraacctt))]]
본 연구는 경쟁우위 창출을 위해 가치사슬 내 활동배치의 도구인 모듈화 전략(modularisation)을후지모토(Fujimoto)의 연구모형을 기반으로 한국과 일본의 완성차업체의 사례를 통해 비교·분석하다. 한국의 완성차업계는 모듈형 공급사슬을 발전시키면서 외부 부품업체에게 서브 시스템을 아웃
소싱하는 방식으로 부품업체 간 시스템에 바탕을 둔 모듈화를 진행하고 있다. 그 결과 현대 모비스와 같은 전형적인 대형부품업체를 발전시켜 나가고 있다. 한편, 일본 자동차업계의 모듈화 추세는표준화된 제품을 완성차업체가 주도적으로 내부화하고 서브 시스템화하는 형태로 진행되고 있다.
한국과 일본이 추구하는 모듈화 전략은 상이한데, 그 공통점과 차이점을 정리하면 다음과 같다. 첫째, 부품 간 구조적/물리적 상호연결성이 점차 중요해짐에 따라 모듈화는 한국과 일본 완성차업계에서 공히 추구되고 있다. 둘째, 일본은 지속적인 부품 최적화 설계를 위해 기업 내 혹은 부품업체 간부품설계에 있어 표준화를 추구하는 반면, 한국은 과거에 설계한 부품을 지속 사용하고 있어 부품설계의 표준화 추구율이 일본보다 낮은 것으로 나타났다. 셋째, 부품 및 모듈의 크기에 있어서, 일본은부품의 기본구성은 유지하면서 크기를 줄이고 있으며 차체 마운팅 설계도 단순해진 것으로 나타난반면 한국은 모듈 크기에 큰 변동이 없으며 마운팅 설계에도 큰 변화가 없는 것으로 나타났다. 마지막으로, 서브 어셈블리(sub-assembly), 즉 단위 장치·모듈 조립에 있어서 한국이 일본보다 해당부품을 구성하는 부품 수가 많고 다른 부품의 하위 조립에 들어가는 부품화 비율이 높은 것으로 나타났다. 연구 결과를 종합해 보면, 한국의 자동차산업은 공급사슬 아키텍처에 기반하여 서브 시스템을 아웃소싱하는 기업 간 시스템에서의 모듈화를 취하고 있는 반면, 일본의 자동차산업은 완성차업체 내에서 조립의 최적화를 위한 부품설계와 인터페이스의 표준화를 통한 생산의 모듈화를 추구하고있다.
결론적으로, 한국의 모듈화는 서브 어셈블리 시스템을 통합함으로써 원가절감과 조립시간 단축, 공정 내 불량률을 낮춰 품질 향상에 기여하고 있다. 하지만, 기존 부품의 공용화보다는 부품 간 인터페이스를 최적화하고 경량화할 수 있는 핵심 부품을 개발해야 하는 과제를 두고 있다. 이러한 부품의 최적화를 통해 부품업체 간 모듈화뿐 아니라 일본 메이커와 같은 완성차업체 내에서의 공정의 인터페이스까지 최적화를 이룰 때 한국 완성차업계 만의 생산의 모듈화는 성숙의 단계로 진화할 것이다.
he new politico-economic, technological and
ecological environment led organizations to real-
ize that they must change and restructure the way
of establishing and maintaining relationships. Consequently,
an alliance or network approach based on flexibility, joint
planning, shared information, adaptations, shared interests
and objectives among firms emerged as an effective
approach to meet the challenges and opportunities of the
new environment.
Over the last decade considerable attention has been put
on the changes occurring in the business environment. Of
particular interest is the change in the nature of business
relationships, and particularly the marked shift from adver-
sarial to more strategic alliance relationships and networks
(Zineldin and Dodourova 2005; Agndal and Chetty 2007).
Establishment Processes andBuilding Relationships in Latin
American Countries: The Case ofSwedish Firms in Mexico
Abstract - This paper addresses the establishment processes of two Swedish companies in the auto-
motive industry in Mexico by applying an establishment process model. An exploratory case study is
applied as a research method. One of the main findings of the article is that in both bus and truck
segments (sectors), there are well developed and tightly structured networks which function more or
less in the same way as the networks and relationships in developed countries although Mexico is a
developing country. Another finding is that the level of trust with the Scania’s customers differs in the
two segments. In the bus segment the relationship with customers is dominated by cooperation and
trust, whereas in the truck segment it does not as the market has more trust in other brands than in
Scania’s products and services. A third finding is that Scania’s competitive advantages rely on its
complete solution which includes trucks, parts and services and on its cooperation with some com-
petitors and strong relations with authorities. While Volvo’s competitive advantages are based on its
strong dealers network strengthened through complete solution including training, new financing and
selling programs, i.e. offering integrated services and cooperation with some competitors and strong
relations with authorities. A fourth finding is that in the Mexican market, government relationships are
as important as customer relations and should be dealt with adequately if firms are going to succeed
in their establishment attempts.
Keywords - Automotive industry, Networks, Relationships and interaction approach, Strategic alliance, TRM,
International market entry, Internationalization
Desalegn Abraha, Mosad Zineldin & Valiantsina Vasicheva
Desalegn Abraha is Professor of Business Administration, School of
Technology and Society University of Skovde. Sweden. His primary
research field concerns industrial marketing and strategic alliance.
Mosad Zineldin is Professor of Economics and Strategic Relationship Management,
School of Management and Economics, Vaxjo University. Sweden.
Valiantsina Vasicheva. Minsk State Linguistic University. Belarus.
T
2008, Korea Automotive Research InstituteISSN 1976-7307(Print)
IJAIM, Vol. 2 (July 2008), 23-4823

Prior studies have added to our knowledge of why strategic
alliances form, what are the enablers for initiation success
and what benefits accrue. Contributions, among others,
include Ghoshal (1987), Dyer and Ouchi (1993), Geringer
(1991), Johansson (1997), Hendrick and Ellram (1993),
Stuart and McCutcheon (1996), Soursac (1996), Harrigan
(1989), Hamel et al. (1989), Selwyn (1991), Brucellaria
(1997), Zineldin (1998, 2000, 2002), Zineldin and Jonsson
(2000) Gulati (1998).
The explosive growth of Foreign Direct Investment (FDI)
led primarily to the globalization of markets. FDI grew at
much higher rate in the 1980s and 1990s than world output
and world exports (World Investment Report 2000). FDI
inflows dramatically rose from $250 billion USD in 1990 to
$1.3 trillion USD by 2000 (World Investment Report 2001)
and the total FDI has reached $4.23 trillion USD and 12.59
million Jobs have been created in the past five years (OCO
Monitor 2007). Global FDI inflows grew in 2006 for the
third consecutive year to reach $1,306 trillion USD, the sec-
ond highest level ever recorded (World Investment Report
2007). Among developing regions, Asia remained the main
magnet for FDI flows, followed by Latin America (World
Investment Report 2006). FDI flows to Latin America and
the Caribbean rose by 11% in 2006, to reach $84 trillion
USD. Mexico and Brazil, with inflows of $19 billion USD
each, remained the region’s leading FDI recipients (World
Investment Report 2007).
Given the enormous increase of FDI, the choice of entry
modes is an important research question. Multinational
enterprises (MNEs) follow two paths leading to three
modes of market entry that involve equity investments, i.e.
Wholly owned subsidiaries - either through a Greenfield
venture or by an acquisition - a JV with a local partner.
The literature on modes of entry is extensive (Davis et
al. 2002; Hennart and Reddy 1997; Pan and Tse 2000;
Zejan 1990; Herrmann and Datta 2006; Zhang et al.
2007). In a comprehensive review, Datta et al. (2002)
report 14 studies that used host industry characteristics as
predictors. Of these, only three used all three types of
equity participation, i.e. acquisitions, JV, and wholly
owned subsidiaries as modes of entry. Although the litera-
ture provides some clue as to how a firm selects a particu-
lar partner or country, less is known about the international
business relationship and establishment process, motiva-
tions and achievements (Geringer 1991; Zineldin and
Dodourova 2005).
Entry mode choices and the establishment processes are
often massive, irreversible, can influence the long-term per-
formance of the firm and can have significant and far-reach-
ing consequences on a firm’s performance and survival
(Shrader 2001; Ekeledo and Sivakumar 2004). Therefore the
different relationships during and under the establishment
process and of entry mode is a very important decision for
MNEs competing globally (Herrmann and Datta 2006;
Zhang et al. 2007).
Yet, experience with international strategic relationships
and networks have shown that they face a number of prob-
lems, which can often result in relationship failure (Zineldin
and Dodourova 2005). Most of the limited number of previ-
ous studies provides insights about the critical events and
case studies of the establishment processes of strategic rela-
tionships between foreign companies, how and to what
extent the networks change or affect a firm’s positions in the
market and how the macro-environmental forces affect the
establishment process are not, according to our knowledge,
well empirically investigated. The structure of the networks
can be different in different environments and that would
create a varying nature of opportunities and obstacles to the
firm being established. As a result, the establishment
process becomes different in different environments and the
firm has to be able to develop mechanisms to capitalise on
the opportunities and to deal with the constraints. The spe-
cific purpose of this study is to identify the unique character-
istics of the Mexican industrial networks environment and
how these characteristics can shape and influence the estab-
lishment process. Considering the above reality of the insuf-
ficient cases available regarding the Swedish companies’
establishment process in Mexico, to get deep insight and
understanding of the establishment process, such research
issue cannot be approached by means of a quantitative
study. Therefore a qualitative case study is a relevant
research strategy to study the establishment process of
24 / International Journal of Automotive Industry and Management, July 2008

Swedish firms in Mexico.
Specifically, the main goal of this paper is to describe and
analyze how the Mexican industrial market networks and
environmental issues such as cultural, financial, economical,
legal, political factors etc. have affected (influenced) and
shaped the establishment processes of Swedish firms in
Mexico.
Theoretical Framework(s)
Ekeledo and Sivakumar (2004) and Zhang et al. (2007)
argue that there are shortcomings and limitations of the
internationalization theory and the eclectic theory regarding
entry mode strategies and choice. Recently, Agndal, H. and
Chetty, S. (2007) highlighted the importance of relation-
ships, in particular their influence in market entry and mode
changes. They have found out that multiple dimensions of a
relationship (e.g., relationship level and type) seem to play
an important role during the establishment process in
international markets. We will, therefore study the establish-
ment processes from a different perspective and approach,
i.e. the relationship perspective which includes interaction,
interactive and network approaches.
The Interaction Approach
Hakansson (ed.) (1982) developed an Interaction
Approach’ which is an appropriate tool to study buyer-seller
relationships in industrial markets. The approach explains
the interaction process between seller and buyer in terms of
four variables, which are the environment, the atmosphere,
the interacting parties and the interaction process.
Hakansson (ed.) stressed that industrial relationships are fre-
quently long-term, close and involve a complex pattern of
interaction among the parties involved. The importance of
the interaction/network approach is that all the four major
components and their sub-variables must be seen together in
order to understand the nature of relationships and the fac-
tors influencing them. Within given environment, organiza-
tions must develop clear, real, and strong relationship man-
agement and marketing orientation in formulating organiza-
tion policy and mission.
Relationships that partners ultimately deem successful
involve cooperation and coordination to create new value
together rather than a mere exchange (Kanter 1994;
Gronroos and Ravald 1996). The interaction process is
influenced by the atmosphere and the environment where
they operate. In turn, the atmosphere is influenced by the
characteristics of the parties and the nature of the interac-
tion. The atmosphere can either facilitate or make the rela-
tionship complicated. This atmosphere can be described in
terms of power/dependence which exists/emerges over the
life cycle of a relationship among the parties, the technologi-
cal leadership, skills and competence, the organizational
size, structure, strategies and experiences, the state of coop-
eration/conflicts, uncertainty, closeness or distance of the
relationship, and by the partner’s mutual expectations at
both the individual and organizational level.
Creating such strategic relationship is the efficient way to
cooperate through strategic networks, as long as the sum of
production and organizational costs is less than going at
alone’. In short, the partners believe that their success does
not require others to fail. Their philosophy is that in the spir-
it of trust and commitment, the win-win approach is effec-
tive to create a bigger pie and then obtain a bigger share of
it. The main principle of the network and interaction
approaches is to seek out opportunities to create new values
together and achieve synergic effects.
In such a relationship, the partners can create new value
by reducing the transaction cost, uncertainty and the level of
the financial and practical risks associated with the purchase
or JV. Moreover, there is a great opportunity to gain access
to vast information about, for example, partner’s needs,
wishes, business and investment plans, which provides a
substantial competitive advantage in strengthening the
strategic cooperation.
Partnership in supply chain relationships is clearly a very
powerful strategy. It encourages a joint approach to prob-
lems and it can lead to reductions in costs, improvements in
quality. (Lamming 1993)
A sustainable partner relationship offers the partners with
advantages and opportunities (Juttner and Wehril 1995).
Partners can establish an alliance to develop collaborative
Establishment Processes and Building Relationships in Latin American Countries: The Case of wedish Firms in Mexico / 25
programs beyond their legal boundaries in research and
development, production and joint sourcing. This will lead
to significant benefits and synergic effects such as:
economies of scale, lower costs, skilled labour force, high
research & development level, access to superior engine
technology, access to new markets, greater customer value-
added is achieved at less total cost. All this will ensure prof-
it for all the partners in the alliance or network.
ARelationship/Network Approach
During the 1990s there has been an increasing interest in
the development of strategic alliances, dynamic networks,
and other "loose" cooperative variants between organiza-
tions of all sizes, industries, and nationalities (Faulkner
1992; Webester 1992; Jarillo 1993; Hunt and Morgan,
1995; Elg and Johansson 1996). Some factors that underlie
the importance of merging the new network and collabora-
tive approach are aggressive globalization and international-
ization emerging from the global village’, increasing
homogenization of tastes and attitudes, deregulation and
elimination of physical, fiscal/financial and technical barri-
ers, rapidly advanced scientific and technological innova-
tions, economic turbulence and predictive uncertainty
(Mckenna 1991; Faulkner 1992). The main reason is that
most organizations cannot always have the resources or
know-how to cope with increasingly complex environ-
ments from internal resources alone.
The growth of interorganisational cooperative forms of
business activity calls into question the nature and bound-
aries of the basic building blocks of economic analysis: the
firm, the industry and the national economy...The traditional
categories of the economist become less and less useful as
basic building blocks for analysis. (Faulkner 1992)
In traditional western market economies, firms within an
industry compete with each other for the customers’ favours.
Cooperation and collaboration constrained by national gov-
ernments. Today’s globalization and other environmental
changes compel large and small organizations to recognize
that the essence of a company is to cooperate within a net-
work of different partners (Faulkner 1992; Hunt and
Morgan 1995). The emphasis is now on strategic relation-
ships in the form of alliances and de-integrated networks
(Jarillo 1993).
The knowledge to establish and develop strategic rela-
tionships or networks in a foreign market provides a compa-
ny with the tools to achieve a large scale of operations and
substantial growth. A network perspective connects the syn-
ergy with the energy. Kotler (1994) emphasized the unique
advantages of relationship marketing as follows:
The ultimate outcome of relationship marketing is the
building of a unique company asset called a marketing net-
work. A marketing network consists of the company and its
suppliers, distributors, and customers, with which it has
built solid, dependable business relationships. The operat-
ing principle is to build good relationships, and profitable
transactions will follow.
The basic rule is that a strategic approach, e.g., network
system, business relationship/alliances, should start from the
customer, match the organizations internal and external
resources/energy, and create a competitive edge.
Synergistic benefits often are the basis for unique compet-
itive advantages that can be achieved through cooperation
between collaborators, for example, shared experience,
entrepreneurial and managerial skills, unique culture and
spirit, know-how, production processes or efficient distribu-
tion outlets, unique effective and efficient use of cash flow,
and ability to go abroad or to substitute own investments in
foreign markets (Zineldin et al. 1997). Such synergies can
also determine why one firm is very successful in, for
example, a product-market and the other is less so.
The Evolutionary Pattern ofa Relationship
Hakansson (ed.) (1982) developed the Interaction approach
which defines marketing as all the activities to build, main-
tain, and develop relations with customers, distributors, sup-
pliers, public institutions and individuals. This approach
stresses the significance of the long-term nature of buyer-
seller interactions and the factors that influence the relation-
ship. The process of establishing and developing buyer-sell-
er relationships is described in different stages.
26 / International Journal of Automotive Industry and Management, July 2008

While the IMP approach is limited to buyer-seller rela-
tionships, Zineldin (1995) contributed the evolutionary pat-
tern of the development of a relationship. The concept of
evolution is originally connected to the scientific idea that
plants and animals develop gradually from simpler to more
complicated forms (e.g., evolutionary biology). Evolution,
according to Darwin’s theory (year), is defined as the grad-
ual and incremental change and the development of an idea,
situation, or objects (or plants and animals).
Establishing healthy, close, and strong relationships are
supposed to evolve through different phases- each stage rep-
resenting a major transition in how the parties involved are
connected to each other. It is a dynamic exchange process
where the relationship takes, to some extent, an evolutionary
pattern and moves progressively from one phase into anoth-
er, depending on how the parties deal with and treat each
other.
In essence, the Relationship Evolutionary Pattern propos-
es a very similar life cycle for creating and enhancing
healthy relationships, i.e. that an infant relationship is born
and then goes through various phases, e.g., childhood,
growth, and maturity in its life and becomes a strategic busi-
ness relationship (Zineldin 2002). This pattern is based on
the phase-by-phase approach to be useful in managing one-
on-one relationships.
Almost any relationship begins with recognizing or identi-
fying needs and desires and ends with satisfaction or disap-
pointment and failure. Between the stage of need to the
stage of satisfaction/dissatisfaction, there will be expecta-
tions, communications, actions, co-actions, reactions, com-
mitments, problems, conflicts, and other activities associated
with the willingness/unwillingness of one or both of the
partners involved.
An Interactive Perspective
A relationship-oriented organization looks outward to the
environment in which it operates and which has a major
impact on the actors such as customers, competitors, mar-
keting intermediaries, and suppliers. To develop a long-term
relationship in today’s global economy (village), and highly
competitive climate, it is important for a company to first
understand how the environmental forces affect its market-
ing activities, relationships, networks, alliances, and con-
sumer attitudes and behaviour. (Thorelli 1986; Zineldin et
al. 1997). This holistic and interactive perspective views
economic performance as a dynamic interaction between
institutions. According to Douglas C. North (1993), one of
the Nobel prizes winners for the Economic Sciences in
1993:
Institutions are the humanly devised constraints that
structure human interaction. They are made up of formal
constraints (rules, laws, constitutions), informal constraints
(norms of behaviour, conventions, and self imposed codes of
conduct), and their enforcement characteristics. Together
they define the incentive structure of societies and specifi-
cally economies.
Marketing and organizational problems have to be
viewed in an open, dynamic and behavioural system con-
text that interacts with its environment, receives inputs
from the environment, processes these inputs and exports
outputs to the environment. The relationship and the
interaction process among companies are influenced by
the environment surrounding them. Thus, the system as a
whole is heavily dependent and relies on either the behav-
ioural science, or non-economic sciences (e.g., psycholo-
gy, sociology, anthropology), and the economic sciences
including political economy. Hakansson (1982) states
that:
The Interaction between the two parties does not take
place in a vacuum. On the contrary, it is part of a large
social system. Thus, the features of the environment influ-
ence the interaction in several ways. For instance, the envi-
ronment may determine the alternatives open to both the
selling and the buying firm.
Environmental Forces and Relationships
The current rapid environmental changes resulted in an
emphasis on the importance of building and keeping a close
relationship between companies, customers, and other busi-
ness parties (Berry et al. 1983; Fulkner 1992; Webster 1992;
Zineldin 1998, 2000; Aijo 1996). In traditional marketing,
the relationship perspective was not emphasized, as the
Establishment Processes and Building Relationships in Latin American Countries: The Case of wedish Firms in Mexico / 27

environmental forces were not sufficiently strong as it is
today. Aijo (1996) hinted at this stating that:
It will be shown that early attempts to formulate a general
theory of marketing already included a relationship per-
spective. However, this perspective did not acquire the
importance it has today, because the environmental factors
were not sufficiently strong at the time... These (environmen-
tal) changes resulted in an emphasis on service, close cus-
tomer contacts, and a holistic view of the parties and
processes involved in marketing and business.
All management and marketing activities occur within
legal, political, economic, and social environment to which
strategies and policies must relate. Zineldin et al. (1997)
states that:
The seller and buyer companies operate within a wide
context and a large social system. The characteristics of this
large system influence the relationship and interaction
between the two organizations.
Ford (1993) also hinted at this and pointed out the follow-
ing:
We must also consider the characteristics of the wider
environment surrounding a particular relationship- the
social system.
Today, organizations face a different world and they must
seek a different road to the future (Webster 1992). To do this
managers’ must draw upon the accumulated experiential-
learning and yet to be aware of the fundamental differences
between the past situation and what they face today.
Learning through time, experiences, the significance of
institutions (e.g., political, economic, regulatory) and the
nature of institutional change, are some key aspects that
have a significant impact on corporate policies and its eco-
nomic performance (Porter 1986).
Major Macro DimensionsAffecting the Business
Establishment
Economic systems and conditions, competitive market
structures and trends strongly influence marketing activity
in all aspects. The economic system determines how a soci-
ety allocates resources. Economic changes derive from
broad secular movements in various underlying economic
factors and from business cycles (Jobber 1995; North1993).
As the marketing activity is strongly influenced by the busi-
ness cycle, the economic environment is closely observed
by managers. Therefore, current economic conditions and
changes have a broad impact on the success of marketing
strategies. The changes in economic and competition condi-
tions affect the forces of supply and demand. Moreover,
they influence organizations’, marketers’ and customers’
decisions, hierarchies and activities (Thorelli 1986; Powell
1990).
However, creating a system of networks and alliances
with other high-tech companies provides the means to cre-
ate a competitive advantage for a company (Dickson 1994).
For governments, companies and consumers, practices
from the 1980s are suddenly no longer relevant owing to the
recent political, legal and regulatory changes. A minor
change in any of the political, legal and regulatory dimen-
sion can have a major impact on a national or multinational
enterprise (Dibb et al. 1994; Zikmund et al. 1995). It also
influences the way of building relationships and networks
with domestic and/or foreign suppliers, subsidiary, authori-
ties and public as well as private customers.
It appears that society becomes more concerned about
marketers’ activities which have questionable or negative
ethical consequences (Dibb et al. 1994). New attitudes and
behaviours are demanded from management and marketers
towards the overall society. They have to create healthy
societal relationships. Relations towards consumers, suppli-
ers, subcontractors, other domestic and foreign organiza-
tions, employees, shareholders, the natural resources, the
community and government have to be reconsidered. The
green movement is increasing general awareness of the
physical environment and is altering product design, manu-
facture, packaging and use (Gediscks 1994). It is clear that
in the 1990s, many organizations recognized that business
operates only with a license from society.
Finally, the 1990s technological, political, legal and regu-
latory, social, ecological, economic and competitive change
offer organizations with a number of very important choic-
28 / International Journal of Automotive Industry and Management, July 2008

es. They will be faced with both opportunities for new busi-
ness and threats to their existing markets. The extent to
which companies are affected by the removal of barriers by
1990s depends upon how they respond to the challenges
posed.
Mode of Entry Industry Structure
The increase in international collaboration and relationship
is attributed to increased globalization and rapid changes in
competitive environments (e.g., Beamish and Delios 1997;
Robson 2002). Hence, globalization of markets in recent
years was primarily due to the explosive growth of entry
into foreign markets. Firms have the option of choosing the
appropriate entry mode for international markets based on
balancing their resources, motivations, expected achieve-
ments, capabilities, and international experience with their
desire for ownership and control. International diversifica-
tion through foreign market entry can result in high growth
and profitability unavailable in home markets (Root 1994).
Several studies have examined the performance differences
between the different modes (acquisitions or Greenfield
ventures, joint venture, direct and indirect exporting).
(Nitsch et al. 1996; Pan and Chi 1999; Pan et al. 1999;
Shrader 2001; Simmonds 1990; Malhotra et al. 2002;
Herrmann and Datta 2006; Zhang et al. 2007). Aulakh and
Kotabe (1997) suggest that is not just entry mode per se, but
the "fit" between mode of entry and transaction-specific fac-
tors, organizational capability, and strategic factors that
affect firm performance.
Extensive research supports the entry mode choice using
a transaction cost approach (e.g., Anderson and Gatignon,
1986; Hennart 1988) and firm characteristics (Chang 1995).
Transaction cost theory also suggests that the choice of
entry mode depends on host country characteristics.
Hennart (1991) argues that in resource- and technology-
intensive industries, firms use shared-control modes to
access local resources. Similarly, at the country level, the
influence of national culture on entry mode choice has been
supported (Shane 1994). Eclectic theory suggests that in
developed countries, wholly owned subsidiaries have the
highest long-term potential (Dunning 1988; Ekeledo and
Sivakumar 2004). Erramilli et al. (1997) found that even the
firm-specific advantages of Korean MNEs were dependent
on host country location. Therefore, the role of host country
characteristics on entry mode, of which industry structure is
an underlying element, is well established.
Afirm seeking to operate abroad must determine the most
appropriate mode, or institutional arrangement, for the new
host-market entry (Anderson and Gatignon 1986). Modes
of entry differ in the degree of control the parent firm main-
tains over its foreign operations. Decisions concerning the
modes of entry to particular foreign markets are among the
most important that management has to take. Once the entry
method is selected, its implementation has significant impli-
cations for a wide range of international marketing con-
cerns. The entry methods chosen has to be related to the
company’s overall strategies, goals, motivations and the
time period in which it wishes its objectives to be achieved.
The options for foreign market entry are: indirect and direct
entry, strategies without international investment and strate-
gies with international investment. Indirect and direct mar-
keting entries often are referred to as export marketing.
Indirect market entry is passive exporting which occurs
when the exporter uses independent organizations located in
a foreign country. The main concern under this category is
that the sale is like a domestic one where the firm is not real-
ly engaged in global marketing, because its products are
carried abroad by others. The five main entry modes of this
category are: export commission house, broker, trading
company, export management company and piggybacking.
This entry mode is most appropriate for a firm with limited
international expansion objectives. The skills and know-
how developed abroad are accumulated outside the export-
ing firm. The exporting firm has its advantage because the
exporting firm avoids the overhead and administrative costs
and burden related to the management of its own export
activities and the firm may not even know in which country
the product is sold (Johansson 1997; Petersen and Welch
2002).
Direct market entry: this is an active exporting activity
and effort to enter foreign markets, which involves the use
of domestic and international based intermediaries. The
Establishment Processes and Building Relationships in Latin American Countries: The Case of wedish Firms in Mexico / 29
commitment and required investment is greater than indi-
rect exporting, the expecting rewards are also greater, and
the firm has the better control of exporting activities and it
has better possibility to learn how to operate overseas. It is
not until the firm decides to hire its own overseas staff that a
more strategic involvement in foreign markets becomes fea-
sible (Johansson 1997). Direct exporting modes, however,
include three main options which are export through for-
eign-based against, distributors/or establishing a sales or
representative subsidiary.
Strategies without international investment (contractual
relationships): Industrial or commercial expertise and
know-how can be sold to foreign countries via licensing,
franchising or through the provision of technical expertise
under a contractual manufacturing and/or management
contracts . These entry modes involve minimal amounts of
partner interdependence and have quite specific tasks,
whereby each partner could terminate the agreement with-
out great cost (Zineldin et al. 1997; Petersen and Welch
2002).
Strategies with international investment include bilateral
agreements and strategic alliances. Such alliances include
JVs, establishing of foreign branches and/or subsidiaries
(including DFI in manufacturing plant) and consortia,
whereby the partners make substantial investments in devel-
oping a long-term presence at the targeted foreign countries
and common goal orientation or direction.
A sales/representative subsidiary is different from a whol-
ly owned manufacturing subsidiary. A sales/representative
subsidiary manages marketing and distribution operations
in the foreign country. Usually the product is exported from
the parent country or from another foreign plant. Such
options allows full control with no dilution of profits to
other operators or agents, and it allows the foreign company
to take advantage of financial incentives from the host gov-
ernment, lower labour costs, access to raw materials and dif-
ferent labour and staff skills and culture elements as well as
organisational learning (Johanson and Vahlne 1992; Sharma
and Johanson 1987; Zineldin et al. 1997; Johansson 1997;
Petersen and Welch 2002).
In a Greenfield investment, a foreign firm starts opera-
tions on its own in a host country. This results in the creation
of new capacity/supply in a particular industry. The onus is
on the entrant to provide all the requisite resources and
capabilities for the investment to overcome industry struc-
tural barriers and risks due to liabilities of foreignness. In an
acquisition, the foreign firm merges with or acquires an
established entity in the host country. Acquisitions are used
when time is an important issue in the investment decision,
as it can be done much faster than a Greenfield or joint ven-
ture entry.
Previous scholars suggested that the link between mode
of entry and firm performance was dependent on the "fit"
between mode of entry and transaction-specific factors,
organizational capability, and strategic factors that affect
firm performance (Aulakh and Kotabe 1997). The results of
the present study indicate support for the premise that for-
eign firms seek to reduce the risk posed by host country
industry barriers by choosing modes that attenuate industry
barriers or stabilize industry structural characteristics in host
countries during entry. This strategy by the overseas entrant,
during entry, allows it to participate in the host country
industry with current incumbents while maximizing its own
performance. Each of these modes has, however, a particu-
lar mix of cost, risk and ease of control (Bartlett and
Ghousal 1989; Brooke 1992).
The Applied Model of EstablishmentProcess and Its Development
Two different approaches of foreign market establishments
were taken into consideration, discussed and compared
before developing a model of establishment process in
(Abraha 1994). The two approaches are the direct invest-
ment theory and the network approach. According to the
direct investment theory which is developed on the basis of
the theory of internationalization (e.g., Vernon 1966;
Kindleberger 1969; Hymer 1976; Dunning 1980; Doz
1986; Porter 1986; Hennart 1982), establishment process in
foreign markets is based on the strategic planning by man-
agers, and its implementation is the role of the single firm
itself. Moreover, according to this theory, the establishment
30 / International Journal of Automotive Industry and Management, July 2008

process of the firm has to be planned in advance where the
elements of the plans are adhered strictly and implemented
carefully in order to ensure its success. The cooperation
with other firms in this theory is totally ignored as it
implies that the whole establishment process is a full
responsibility of the top management of the firm. (Abraha
and Mukhtar 2002) also state that the establishment
process of a firm, according to this theory, is believed to be
dictated by the strategic vision set by the management of
the firm.
Whereas, the network approach focuses on the numbers
and types of business relationships built and maintained
with other firms/actors in the foreign market that are active
in the development of those relationships (Johansson et al.
1994). The subject of establishment process is defined in
more or less the same way by stating that if one considers
the market as a network, establishment means that the
establishing firm obtains a unique position in a network
which is new for the firm and its counterparts
(Hammarkvist et al. 1982)1)
. The same source also claims
that the establishment process can take place when a new
firm enters a new geographic area and also when a firm
develops relationships with new customer groups using
new or existing products. The applied model was devel-
oped on the basis of this theory, i.e. the theory of market-
ing in industrial markets developed by Hagg and
Johansson (1982), Johansson and Mattsson (1988), and
Hakansson (1989), and which is generally called "the net-
work approach". The fundamental ideas and concepts of
this approach are accounted for in Johansson and
Mattsson (1984, 1987), Hakansson and Johansson (1979,
1987), Johanson (1989), Mattsson (1983) and Eslsasser
(1984)2)
. On the basis of the network approach, several
studies of business network relationships and international
business connections developments have been conducted
both in the domestic and international market
(Blankenburg 1996; Hakansson and Shnehota 1995;
Mattsson and Johanson 2006; Waluszewski 2006; Baraldi
and Stromsten 2006; Gadde and Araujo 2007). In a related
phenomenon Cook and Emerson (1978, 1984); Burt
(1982) and Granovetter (1985) developed and discussed
social networks. Accordingly, industrial networks are
viewed as sets of connected exchange relationships among
actors who control industrial resources and activities. The
industrial network refers to the exchanges of resources and
the activities performed in the exchange process, whereas
the social network refers to actors and their social relation-
ships. The network approach mainly addresses the
exchange of various resources where social relations are
an integral part of this.
Therefore, in this article a model of establishment process
developed on the basis of the industrial network approach
briefly discussed above is applied as a theoretical frame-
work. Reviewing the literature about the establishment
process, Abraha (1994) found out that most research on
establishment process focused on developed countries and
the developing country markets have received much less
attention. It meant that, understanding of establishment
processes within the context of developing countries
remains an issue for future research. To bridge the gap,
Abraha (1994) examined Swedish firms’ establishments in
Kenya by applying the above referred model3)
. This
research resulted in Abraha’s doctoral dissertation titled
"Establishment Processes in an Underdeveloped Country:
The Case of Swedish Firms in Kenya4)
" As it is clearly
illustrated in the model (see Figure 1) below, establishment
process in developing countries is observed to take place in
four stages (Abraha 1994; Abraha and Hyder 1997, 20005)
;
Abraha and Mukhtar 2002).
Establishment Processes and Building Relationships in Latin American Countries: The Case of wedish Firms in Mexico / 31
This definition of establishment process is also quoted in Abraha(1989), "The Establishment Processes of Swedish Firms in Kenya - AModel of Case studies" and it is also adopted in Abraha and Kaynak(2002), "Foreign Market Entry in a Transitional Environment: TheCase of Swedish Frims in Poland."
This section is adopted from Abraha (1994), "Establishment Processesin an Underdeveloped Country - The Case of Swedish Firms in Kenya."
1)
2)
This model was developed by Abraha (1994) on the basis of the net-work approach and applied in his doctoral dissertation. This section is adopted from Abraha and Kaynak (2002) , "ForeignMarket Entry in a Transitional Environment: The Case of SwedishFirms in Polans:"The model of establishment processed developed and applied byAbraha (1994) was modified and developed further by Abraha andHyder (1997, 2000) and Abraha and Mukhtar (2002) when it wasapplied to study establishment process in different countries markets.
3)
4)
5)
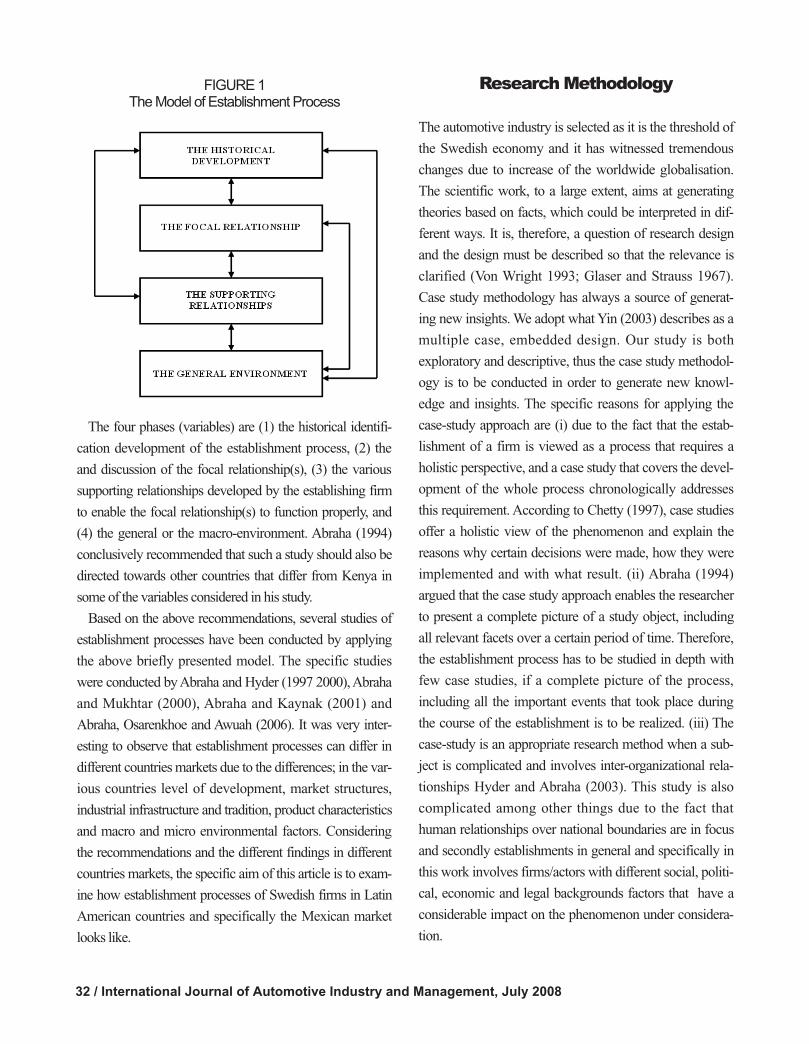
The four phases (variables) are (1) the historical identifi-
cation development of the establishment process, (2) the
and discussion of the focal relationship(s), (3) the various
supporting relationships developed by the establishing firm
to enable the focal relationship(s) to function properly, and
(4) the general or the macro-environment. Abraha (1994)
conclusively recommended that such a study should also be
directed towards other countries that differ from Kenya in
some of the variables considered in his study.
Based on the above recommendations, several studies of
establishment processes have been conducted by applying
the above briefly presented model. The specific studies
were conducted by Abraha and Hyder (1997 2000), Abraha
and Mukhtar (2000), Abraha and Kaynak (2001) and
Abraha, Osarenkhoe and Awuah (2006). It was very inter-
esting to observe that establishment processes can differ in
different countries markets due to the differences; in the var-
ious countries level of development, market structures,
industrial infrastructure and tradition, product characteristics
and macro and micro environmental factors. Considering
the recommendations and the different findings in different
countries markets, the specific aim of this article is to exam-
ine how establishment processes of Swedish firms in Latin
American countries and specifically the Mexican market
looks like.
Research Methodology
The automotive industry is selected as it is the threshold of
the Swedish economy and it has witnessed tremendous
changes due to increase of the worldwide globalisation.
The scientific work, to a large extent, aims at generating
theories based on facts, which could be interpreted in dif-
ferent ways. It is, therefore, a question of research design
and the design must be described so that the relevance is
clarified (Von Wright 1993; Glaser and Strauss 1967).
Case study methodology has always a source of generat-
ing new insights. We adopt what Yin (2003) describes as a
multiple case, embedded design. Our study is both
exploratory and descriptive, thus the case study methodol-
ogy is to be conducted in order to generate new knowl-
edge and insights. The specific reasons for applying the
case-study approach are (i) due to the fact that the estab-
lishment of a firm is viewed as a process that requires a
holistic perspective, and a case study that covers the devel-
opment of the whole process chronologically addresses
this requirement. According to Chetty (1997), case studies
offer a holistic view of the phenomenon and explain the
reasons why certain decisions were made, how they were
implemented and with what result. (ii) Abraha (1994)
argued that the case study approach enables the researcher
to present a complete picture of a study object, including
all relevant facets over a certain period of time. Therefore,
the establishment process has to be studied in depth with
few case studies, if a complete picture of the process,
including all the important events that took place during
the course of the establishment is to be realized. (iii) The
case-study is an appropriate research method when a sub-
ject is complicated and involves inter-organizational rela-
tionships Hyder and Abraha (2003). This study is also
complicated among other things due to the fact that
human relationships over national boundaries are in focus
and secondly establishments in general and specifically in
this work involves firms/actors with different social, politi-
cal, economic and legal backgrounds factors that have a
considerable impact on the phenomenon under considera-
tion.
32 / International Journal of Automotive Industry and Management, July 2008
FIGURE 1The Model of Establishment Process
This study is based partly on theories, concepts and ideas
which are developed in international business, strategy,
management and marketing and partly on traditional
approaches and criteria that are developed and used by
manufacturing organizations to measure the international
business performance. The two approaches are applied
together with a case approach to gain deeper understanding
of the research issues.
In summary, the methodology of the present study can be
summarized as following:
First, based on the previous survey, literatures, theories,
concepts and researches, we believe that the area of investi-
gation is somewhat (relatively) new, so that an exploratory
study is to be made in order to provide a better understand-
ing on the areas of interest and to develop a conceptual
framework. This approach can generate new knowledge
and insights enabling us to deeply understand the complex
nature of the phenomenon examined by explaining how
certain events/processes evolved over time, their conse-
quences, why certain decisions were made, how they were
implemented including their consequences is more or less
addressed in (Chetty 1997; Yin 2003; Ghauri and Gronhaug
2002).
Second, the case study for this approach is concerned
with detailed analysis of a limited number of events or con-
ditions and their inter-relationships. A descriptive case study
that documents the nature of the automotive industry in
Mexico and the establishment processes of two Swedish
manufacturers companies is employed. The study focussed
on case research of Scania and Volvo. Information is col-
lected through semi-structured interviews, i.e. both tele-
phone and email interviews with some key figures of both
organisations in both Mexico and Sweden.
The data collection methods: In the case of Scania semi-
structured email and telephone interviews, i.e. data collec-
tion instruments, are applied. Email interview was conduct-
ed with Scanias Corporate Relations Manager in Latin
America in three different days for approximately five hours
in 2005 and 2007. It was the general manager who decided
that interviews have to be carried out with this specific
respondent. The general manager confirmed that the inter-
viewee has several years of experience and is a qualified
informant who can provide adequate information. In addi-
tion, three telephone and one email interviews were carried
out with Scanias Corporate Relations Press Manager in
Sodertalje in 2005 and 2007. This respondent was recom-
mended by Scanias public relations manager in Latin
America stressing that the respondent has worked in the
company for a long period of time and possess adequate
knowledge about the phenomenon under consideration.
Telephone interviews were conducted in three different days
for total three hours. The respondent is judged to be a quali-
fied respondent from the detailed information that he pro-
vided for every question asked. Before the respondents
were selected, the author was asked to send the questions to
be answered by the company management. After receiving
the questions, the company management carefully read and
discussed the questions within the company management
and the author to select the interviewees. Both respondents
also expressed their readiness to provide further information
whenever necessary. Transcripts were made of both the
email and telephone interviews and they were sent to the
respective interviewees for correction. The respondents
were instructed that they don’t need to return the manu-
scripts if there is no need for correction and additional infor-
mation. The transcripts were returned to the authors with
few and essential corrections.
In the case of Volvo, three semi-structured email inter-
views, i.e. data collection instruments, are applied. The first
interviewee is responsible for the sales of trucks in Latin
America and he was email interviewed for about three hours
in 2005. He works in the Volvo office in Mexico. This per-
son has worked for several years in the Volvo office in
Mexico and is considered to be a qualified respondent by
both the company and the interviewer. He was recommend-
ed by the Volvo head office in Sweden as he has maintained
a high ranking position in the company for a considerable
period of time. Additional email interview was done with the
marketing and communication manager in Volvo Mexico
for about four hours in three different occasions in 2005 and
2007. It was the first interviewee who recommended the
authors to contact the second interviewee whenever addi-
Establishment Processes and Building Relationships in Latin American Countries: The Case of wedish Firms in Mexico / 33
tional information was necessary. The respondents’ position
enables him to possess adequate and relevant information
and that can help us to determine that he is a qualified
respondent. Both respondents were selected by the company
management after carefully reading the interview questions
that were prepared by the authors. When the interviewees
were asked if they were ready to provide additional informa-
tion, they declared that it depends on the workload they will
be having during the specific time. Transcripts were made of
the two email interviews and they were sent to the respective
interviewees for correction and additional information. The
transcripts were returned to the authors one with few where-
as the other with some more corrections. Both interviewees
were informed that there is no need to return the manuscripts
to the authors if no correction is done and no fresh informa-
tion is provided.
The data analysis methods: It can clearly be observed
from how the cases are structured that the authors have
started the analysis by preparing a historical account of the
cases. A combination of the interview content analysis (Yin
2003) and the multi-step qualitative-process of data reduc-
tion, data display and conclusions-drawing (Miles and
Huberman 1994; Pettigrew 1997) methods of interpreting
and analysing the empirical findings have been applied in
this article.
To secure triangulation, two methods of data collection,
both primary and secondary data and a model developed by
combining different concepts extracted from several but
closely related approaches/theories have been applied.
Moreover, various sources and types of data have been
used, compared and analysed in order to triangularize the
data, the methods and the conclusions drawn. In addition,
the various sources of data have been compared and
analysed by keeping strict attention to the various
concepts/themes in the model so that robust conclusions
will be drawn that can enable us to address the research
problems and the purpose of the article. The final aspect of
analysing the data is done by comparing the two cases in
light of the main concepts/themes of the model which is
developed from the various theories and models discussed
in our literature review.
The reason for selecting Scania and Volvo from the auto-
motive industry was because they gave immediate and
positive response when they were requested to provide the
information necessary for preparing the case-studies.
Moreover, proximity and easy access to the people have
also influenced the choice of the locus of the study. The
authors also found out to be appropriate to collect data
from Swedish companies as it is convenient to have con-
tacts with the interviewees both personally and electroni-
cally.
The Case of Scania in Mexico
The Historical Development of the Establishment
Processes
Scania was founded in 1891 in Sweden and up till now it
has built and supplied more than 1,000,000 trucks and buses
for heavy transport work to different parts of the world. The
net sales of the company in 2006, i.e. from vehicles and ser-
vices was 70,738 million SEK and the net sales from
October 06 - September 07 amounted to 78,954 million
SEK which is an increase of about 12 % in 12 months peri-
od. Scania has an integrated product concept that combines
vehicles, service related products and financing.
Specifically, it develops, manufactures, markets and sells
trucks, buses and coaches, and industrial & marine engines.
The company has production facilities in Europe and Latin
America and assembly plants in ten countries in Africa,
Asia and Europe. Scania has about 130 wholly-owned com-
panies operating in the international market and out of total
34,000 around 12,000 employees are working in Sweden.
Up till 95 % of its production is sold abroad and the rest 5 %
in the domestic market.
The case of Scania in Mexico covers the time period from
1991 up till the present, i.e. 2007 and deals with the phe-
nomenon of the establishment process. In one year time, i.e.
until 1992 Scania sold 600 buses which were imported
from the Scania subsidiary in Brazil, which is the regional,
headquarter in Latin America. Until 1994 it was represented
with a distributor that imported trucks and buses from
Brazil. Thereafter, the board of directors decided to expand
34 / International Journal of Automotive Industry and Management, July 2008
its operations in Mexico and opened the fully owned sales
and service subsidiary. Mr. Ulf Greveismuhl was appointed
to be in charge of implementing the project to operate with
the fully owned subsidiary. The reason for initiating this
project was due to the fact that Mexico is the third world’s
largest market after USAand Brazil.
Ulf Greveismuhl gained the right experience by working
in several Scania offices in Sweden, Angola and Brazil
since the 1970. His main duty was to learn the Mexican
market, i.e. to find out how the trucks and buses look like
and the technical specification of the Mexican market.
Moreover, he had to find out in which segment Scania
trucks and buses are suitable and established sales and ser-
vice networks. At present Scania has about 15 service cen-
tres. The sales figure forecasted for the year 2007 is buses
300 units and Tucks 150 units. Regarding the changes that
have taken place in the market share and number of cus-
tomers from 2005 to 2007, Scania is said to have still a
leading position in the bus sector and no changes have
taken place. Whereas in the truck sector, its market share
has declined as the customers are buying the right
American products. The reason why the customers are
buying American rather than Scania truck is due to the fact
that Scania doesn’t have the right products for the cus-
tomers. The American market is the most competitive after
Mexico and Chile.
The fully owned sales and service company is called
Scania de Mexico SAde CV, with offices in Mexico City. A
factory, i.e. an assembling unit and five fully owned dealers
located in San Louis Potosi (SLP). The dealers’ network is
complemented with eight local distributors. Scania started
to operate officially in March, 1995 when it inaugurated a
fully owned factory (assembly plant) in San Louis Potosi
(SLP), which employs about fifty people. Both buses and
trucks are produced in this factory. The distribution office
was opened in March, 1995 in Mexico City. The main
duties of the distributors are to organize and support some
ten independent dealers specifically in the field of sales and
services of Scania products. Until 2005, the factory, i.e. the
assembling unit, was located in San Louis Potosi (SLP) and
the central office was located in Mexico City. Recently both
the factory and the central office, i.e. commercial opera-
tions, are moved to Queretaro City. The changes are done in
order to centralize the operations in, i.e. the commercial and
industrial operations in Queretaro City and to reduce costs.
Scania did not forecast any kind of growth in market share
or number of customers when it took such measures.
However, the strategy is to maintain small activity/presence
in the market but profitable. Actually due to high demand
for heavy vehicles in Europe, Asia and South America,
Scania is prioritizing these other markets where the brand is
highly recognized by the customers.
The Market Structure in Mexico
The Mexican market is one of the most competitive in the
world where almost all auto manufacturers have represen-
tatives. Mexico, Chile and Australia are the markets where
you can find most of the bus and truck manufacturers. All
European, American and Japanese auto manufacturers are
operating in those markets. Scania operates in two markets
in Mexico, i.e. in the truck and the bus market. The truck
market is very unstable where a lot of very well established
companies and is completely dominated by the American
companies. The bus segment is extremely professional and
profitable. The bus segment is European oriented and acts
without any synergy with the truck segment, i.e. there are
no common points or relationship among the two seg-
ments. In the truck segment, Kenworth has 60 (51.5) %,
International 15 (14.4) %, Greightliner 15 %, Volvo USA 8
(8.6) % and Scania has 2 (1.9) % market shares. However,
the bus market is dominated by the European firms. Volvo
has 35 (34.1) %, Scania 25 (23.2) %, Daimler Chysler 25
(30.4) %, MAN 5 (6.4) % and the local companies MCI
and OISA have 10 % market shares6)
. Scania is a signifi-
cant supplier in the bus market. It was a market leader
some years ago, i.e. before it lost its market leadership posi-
tion to Volvo which has about 10 % higher market at pre-
sent.
Establishment Processes and Building Relationships in Latin American Countries: The Case of wedish Firms in Mexico / 35
There are differences among the parenteced and unparanteced marketshares and that is due to the fact that the information provided by thetwo interviewees differed to some extent. However, even if the figuresdiffered to some extent the gap doesn't change the position of the vari-ous auto producers.
6)

Customers
The number of customers is more or less stable and the
market share is showing some small growth mainly in the
truck segment. The main customer is the bus company
called ADO which bought about 600 buses up till 2006.
Scania is the second largest supplier in the bus coaches seg-
ment. Generally, the customers are big and if they buy many
buses from one customer, it will result in a good market
position for the supplier. The second largest customer is a
bus company called Estrella Blanca which already pur-
chased around 300 Scania buses. The third largest customer
is also a bus company called Flecha Amarilla which has
already bought 180 Scania buses.
In general, the customers are satisfied with the Scania’s
products and services as their needs are fulfilled. Most of
the time, the customers buy standard products, but some-
times they claim different kind of power engines as those
offered in Europe. According to Scania customers have
more power in the relationship. Scania has very good prod-
ucts and services and it offers trucks, spare parts, services,
maintenance and repairs to enable its customers in their turn
provide good services to their customers to make profitable
operations. Normally, it is the local distributor who directly
contacts customers as the idea is to live very close to the
customers. The distributor coordinates the contacts with the
factory and the distribution of spare parts. Moreover, distrib-
utors are responsible for technical and sales training. All
customers’ orders go via distributors to the factory. Then, the
factory produces the buses and distributes them through
dealers. Moreover, the dealers do provide services and deal
with the customer relationship. The customers pay in cash
for their purchases in time and as they are financed by the
bank, payment is not a problem.
In the bus segment, the customers are buying products
and parts and they are responsible for the necessary ser-
vices. However in the truck segment Scania sells a complete
solution, i.e. trucks, parts and services. Most of the time cus-
tomers in both segments do buy standard products. The
level of trust with the Scania’s customers differs in the two
segments. In the bus segment, the relationship with cus-
tomers is dominated by cooperation and trust, whereas in
the truck segment it does not as the market has more trust in
other brands than in Scanias products and services.
The Suppliers of Scania Mexico Factory
The components used in the factory are produced both in
Europe and South America, out of which 60 % in Europe.
The source of engines and cabs is Brazil and of the gear
boxes is Argentina. Scania doesn’t have local suppliers and
as the European companies have subsidiaries in different
parts of the world it can be said that the Mexican factory has
a global sources of components. It has also one US supplier
of fuel injection system, i.e. Scania Commins. The complete
kit of products is delivered from Brazil, Argentina, Europe
and the US and the plant in Mexico is just assembling the
vehicles.
The General Mexican Environment
The use of big cabs has become a typical American culture
in the truck market, as those cabs have been used for a long
time. This is called the old cabs concept and the same con-
cept is used in the power train supply. It was very difficult
for Scania to break this concept and to introduce the
advanced cabs concept. Except in the US, Mexican and
Chilean markets wherever you go, you will find the
European trucks/cabs. In Europe there is a regulation of
how long (large) the trucks should be, i.e. the complete
combination. Accordingly, you have to have a short cab
incorporated in the total length of the truck which is 16, 5-
18 meters long. Whereas in the US, they have other mea-
surement systems and the length of the cab doesn’t matter.
That is the tradition which the US producers are used to and
which the American market demands/prefers. However, the
European truck producers are not used to such a tradition
and they find it difficult to fulfil the needs of the Mexican
customers. Scania did not make this adaptation as its sales
are too small to justify the adaptations to be done. To han-
dle this problem, it is putting more focus in the bus segment
and considers the truck market as a potential for the future.
The bus is quite different and they look more or less the
same all over the world.
The environmental legislation was not defined complete-
36 / International Journal of Automotive Industry and Management, July 2008

ly in 2005 and there was some pressure to adopt the North
American Legislation (EPA) and this could create a con-
straint for Scania. The EURO engines were acceptable;
however as EPA was still under discussion there was no
regulation accepted on this issue. However, if the EURO
engines were rejected Scania could be obliged to adapt its
engines to the EPA.
In Mexico, there is a pollution emission regulation.
Europe has another standard, and with the exception of
Taiwan and Korea, Scania uses the Emission Engine in all
other markets. However, in Mexico, to fulfil to EPA, Scania
had to make certain adaptations to the EPA if the EURO
was rejected. It is another test cycle, in contrast, to the
European approval test method/regulation. (as from 2006,
Mexico is accepting EPA and EURO and there are no
restrictions in terms of legislations to Scanias’ products and
from that date onwards there is no need for Scania to make
adaptation of its products.)
Scania’s all competitors are offering credit to their cus-
tomers through their own finance companies. However,
Scania, on the first hand, has not offered this kind of finan-
cial service (captive finance company). It has to some extent
agreements with local banks to offer some financial solu-
tions. But, even in this regard the banks are doing the finan-
cial services without any Scania participation.
The Case of Volvo in Mexico
Introduction
Being one of the leading suppliers of commercial transport
solutions, the Volvo Group provides products such as
trucks, buses, construction equipment, drive systems for
marine and industrial applications as well as aircraft engine
components. Moreover, the group also offers to its cus-
tomers’ financial services. Volvo has about 83,000 employ-
ees, sales activities in some 180 countries and production
facilities in 18 countries. Sales of the Volvo Group increased
by 7 % to 248 billion SEK, with earnings per share increas-
ing by 25 % to 40.20 SEK in 2006.
The case of Volvo in Mexico covers the period from 1994
up till the present, i.e. 2007 and deals with the phenomenon
of the establishment process. Volvo Trucks de Mexico as a
subsidiary of AB Volvo is an independent company from
other business areas or units that currently are represented in
Mexico. The business areas in Mexico are: Volvo Trucks,
Volvo Buses, Volvo Construction Company and Volvo
Financial Services and the only business unit is Volvo Parts
de Mexico. All business areas work independently and
report to Sweden directly. However, they can work together
for group purposes. For example, if the Swedish embassy in
Mexico requires support from the Swedish companies, they
act as a group and are represented just as Volvo. There are
also other specific forms of cooperation among the various
Volvo business areas. Specifically, Volvo Buses and Volvo
Trucks work together for trade shows when buses and
trucks are required to be exhibited.
The Historical Development of the Establishment
Processes in Mexico
Volvo has a fully owned office which doesn’t carry out any
local production. It just sells imported products in the local
market. Volvo started to operate in Mexico in 1994 follow-
ing the initiative taken by Volvo Trucks in North America
(VTNA), which had a commercial agreement with Trailers
de Monterrey. The agreement between VTNA and Trailers
de Monterrey was signed more than a decade ago. As there
were no Volvo Trucks corporate offices in Mexico by that
time, Trailers de Monterrey was in charge of imports of the
vehicles produced by VTNA.
In March 1994, Volvo Trucks de Mexico was established
to do all the Mexican commercial operations of the vehicles
produced in New River Valley and since then Trailers de
Monterey has no agreement either with VTNA or with
Volvo Trucks de Mexico. There is a dealer network devel-
oped mainly for the purpose of sales, which is composed of
21 dealers and nine service points.
The Structure of the Market
There are three other major suppliers with larger market
shares than Volvo operating in the truck segment. They are
Kentworth (KW), Mercedes Benz (MB), and International.
KW is the biggest supplier with about 50 % market share
Establishment Processes and Building Relationships in Latin American Countries: The Case of wedish Firms in Mexico / 37

and its main competitive advantage is pricing. MB belongs
to Daimler Chrysler Group and being the second largest
supplier has 25 % market share. Its competitive advantage
is advanced technology and pricing. A multinational
American firm belongs to the group of Navistar-
International with 17 % market share and its main competi-
tive advantage is pricing. Volvo Trucks has about 10 % mar-
ket share and competes mainly with its advanced technolo-
gy and safety, its prices being higher than the other suppli-
ers. However, the bus market is dominated by the European
firms. Volvo has 35 (34.1) %, Scania 25 (23.2) %, Daimler
Chysler 25 (30.4) %, MAN 5 (6.4) % and the local compa-
nies MCI and OISAhave 10 % market shares. Recently, i.e.
after 2005, several Asian auto makers such as Isuzu, Hino
and Chinese car makers have entered the Mexican market
intensifying further competition.
Volvo has increased its sales in the truck sector by 43 % in
2007 versus 2006 and by 69 % compared to 2005. One of
the main reasons for the growth of sales is that Volvo has
broadened its product range for the Mexican market intro-
ducing the VNM model produced in North America as well
as Mack truck MR model. Moreover, Volvo has broadened
its transport solutions to its customers, that is to say, avail-
ability of critical parts in the dealer network, new mainte-
nance programs, engines software for downloading infor-
mation on engine performance.
Customer Relations
Pricing is a disadvantage in a country where the economy is
neither growing nor stable and that creates a problem for
Volvo in the management of customer relations. However, it
is trying its best to change its customers’ minds to make
them realize that its higher price is a consequence of its
investment in research and technology that concern its
trucks. This will finally mean that they will get a return in
their investment, i.e. through increased revenue when work-
ing with its products and services. Moreover, it is strength-
ening its dealer network with training, new financing and
selling programs for both new vehicles, used trucks and
parts, so that they will be in a position to offer an integrated
services to their customers.
The General Environment
As the EPA and the Euro were not validated until 2007 by
the Mexican legislation that created a sort of uncertainty for
Volvo. This created inconveniencies as it can affect the
industry in which Volvo operates. Until 1997, there was a
pending regulation to be established by the environmental
authorities regarding the use of American or European
engines. As far as the regulation goes, both engines comply
with all environmental requirements, however, there was a
commercial issue among the vehicles producers and the
group has been divided into two. One group formed by
Volvo Trucks, Volvo Buses, Kenworth, Cummins, Scania
and others that support the idea that both kinds of engines
should be accepted so that customers can have more oppor-
tunities and choices for their vehicles. The other group
formed mainly by International and Daimler Chrysler group
which support the idea that just American engines should be
allowed in the Mexican market.
In this particular case, the legislation can cause that some
investments to sell new products in Mexico are delayed or
cancelled depending on the final resolution and that is why
Volvo Group has products that are produced with European
and American engines. Thus, the government decision will
affect the operations and position of Volvo. Since the very
beginning of this issue (situation), Volvo has actively partic-
ipated in several meetings with the both environmental
authorities and government officers as well as other govern-
mental institutions to prove that both engines should be
authorized. Even the Swedish Ambassador in Mexico has
been involved in the whole issue. These efforts have paid-
off and a new emission regulation for diesel engines - Norm
44 is proclaimed and accordingly as from July 1, 2008, all
engines must comply with EPA4 or Euro4.
Analysis
Both Volvo and Scania were represented in Mexico by third
parties in the early phases of their establishments.
Consequently, they didn’t have direct relationships with the cus-
tomers and that made it less probable to fully comprehend and
38 / International Journal of Automotive Industry and Management, July 2008

satisfy customer needs, a scenario that makes developing a
strong position in the market less successful. This could also be
a major hinder for both companies to develop a well function-
ing network of relationships. In other words, in the third party
operations phase neither penetrating the existing Mexican
industrial network nor building new supporting relationships to
develop a market position was possible and it is why the estab-
lishment attempts were not successful. The establishment initia-
tive in the case of Scania was taken by its board of directors and
that of Volvo by VTNA. The two cases show how and to what
extent both the head office and the regional offices are involved
in new foreign market establishments. Three main reasons can
explain the involvement of those actors; first, being the size of
the market second, the presence of almost all major auto manu-
facturers and their networks which makes it easier to learn on
how they work and to develop contacts and third, to understand
and to serve the customers and the market better. The Scania
head office and the VTNA can acquire knowledge about the
market from their well established networks and contacts in the
international market. In sum, both Volvo and Scania were well
knowledgeable about the size of the Mexican market and the
existence of well developed industrial networks in both the bus
and truck sector and it is this knowledge that made them take
the establishment initiatives.
Followed by advanced technology, pricing is found to be a
major competitive tool in the market and specifically in the
truck segment. In addition to the above, pricing combined
with advanced technology have also enabled the three major
actors in the market to develop strong customer relationships
and to enjoy a leading market position in this segment. In
other words, those firms have developed a strong-well func-
tioning networks and strong customer relationships that
enabled them to develop a strong position in this sector of the
market. Volvo and Scania could not press their prices to the
same level as that of their competitors and to use pricing as a
competitive tool among other things due to their inability to
develop a proper network in the truck sector. This is also a
constraint at the same time for both firms in the management
of customer relationships and the development of properly
functioning networks. Consequently, they could not enjoy
large market shares in the truck segment as they do in the bus
segment of the market. Especially, Volvo is trying to change
the attitudes of the customers instead of developing appropri-
ate mechanisms and strategies in order to reduce its costs.
Changing the attitudes of customers means to make them
understand that the higher prices they pay the better quality
of the products which makes their operation profitable in the
long range. The significant role which pricing plays in the
market is also in contrast to the already established role of
pricing in industrial markets.
The old cabs concept is one cultural factor which enabled
the US producers to produce trucks that meet the needs of the
American and Latin American markets and to develop a
competitive advantage over the European firms. Scania and
Volvo are at a disadvantage in this regard because due to the
market size constraint, they couldn’t make the necessary
investments to adapt their products to fulfil customer needs.
This aspect of culture has caused the European firms to loose
competitive advantage. One way of managing this cultural
problem could be, by developing an alliance among Volvo
and Scania, a relationship that can help both firms to increase
their market share and thereafter to make a justifiable product
adaptation in order to solve the cultural problem. This dyadic
relationship among Volvo and Scania can help them to build
successful customer relationships and the broader network of
relationships as a means of developing a strong position in the
truck segment and a successful market establishment.
The EPAis also another factor in the environment that the
International and the Daimler Chrysler group use to
strengthen their position in the market. The European firms
on their part took some measures in collaboration with
Kenworth and Cummins to secure and strengthen their
position in the market. Both groups are engaged in strong
lobbying activities by attempting to develop strong relation-
ships with the various authorities. They both present their
cases in a way that can convince the concerned authorities
to make a decision that favours their position. This clearly
shows how important it is to develop a strong network with
the authorities to be successful in the market. A proper and
successful management of the authorities’ relationships can
enable the firms to get their needs fulfilled which can create
the possibilities of developing properly functioning cus-
Establishment Processes and Building Relationships in Latin American Countries: The Case of wedish Firms in Mexico / 39

Thematic Issues Scania Volvo
Sectors the firms operate in Truck and bus sectors Truck and bus sectors
Market structure Truck sector highly competitive, unstable, Truck sector highly competitive, unstable,
Americans oriented & dominated bus sector Americans oriented & dominated bus sector
highly competitive, extremely professional & highly competitive, extremely professional &
profitable, European oriented & dominated profitable, European oriented & dominated
Network structures Both the truck & bus sectors are tightly and Both the truck & bus sectors are tightly and
well-structured well-structured
Third party operations Didn’t succeed to get established in the truck Didn’t succeed to get established in the truck
and bus sector and bus sector
Why third party operations failed Couldn’t really comprehend and satisfy customer Couldn’t really comprehend and satisfy customer
needs and to build market networks and positions needs and to build market networks and positions
Operations through Assembling & sales subsidiary Sales subsidiary
Market position Strong in the bus sector which is European- Strongest in the bus sector, fourth in the truck
oriented, weak in the truck sector sector which is American-oriented
Competitive advantages in developing Complete solution which includes truck, parts Strong dealers network strengthened through
successful customer relations in the and services. Cooperation with some competitors complete solution including training, new financing
bus sector and strong relations with authorities and selling programs, i.e. offering integrated
services. Cooperation with some competitors &
strong relations with authorities.
Competitive disadvantages to Pricing, Inability to adapt to the old cabs culture Pricing, Inability to adapt to the old cabs culture
develop strong and large customer and to the EPA. Customers trust other brands and to the EPA. Customers trust more other
relations in the truck sector in the truck sector brands in the truck sector
Measures to deal with competitive Provides complete solution which includes truck, Trying to change customers attitudes to believe
disadvantages parts and services that higher prices will pay in the long range in
terms of ROI
Competitive nature of the market Makes the firm to develop strong relations with Makes the firm to develop strong relations with
some competitors and with authorities some competitors and with authorities
Customer satisfaction Strong in bus sector and weak in truck sector Very strong in bus sector and semi-strong in truck
sector
Challenges Difficult to penetrate the truck sector network Difficult to be dominant in the truck sector network
Cultural barrier Difficult to break the old cabs concept & to Difficult to break the old cabs concept & limited
introduce the advanced cabs concept success to introduce advanced cabs concept
Environmental factor EPA makes it difficult to penetrate the truck EPA limits consolidating position in the truck
sector network sector network
Environmental factor Both EPA and Euro accepted reducing the impact Euro & EPA acceptance reduced impact of the
of the environmental regulations environmental regulations
Adaptations Difficult in the truck sector network, whereas Difficult in the truck sector network, whereas
bus are standard products buses are standard products
Establishment attempts Competitive advantages helped to achieve Competitive advantages helped to achieve very
success in the bus sector and competitive high success in the bus sector and quite
disadvantages resulted in less success in the successful in the truck sector
truck sector
Authority relationships Significant resource in establishments Significant resource in establishments
tomer relationships and broader networks which can
strengthen further their market positions and establishments.
The highly competitive nature of the market has also created
two groups of firms that collaborate within their groups in order
to be able to strengthen their competitive power against the other
group. Both groups are acting in almost the same way to beat
their competitors by strengthening the relationships among the
firms in their group. Cooperative relationships are built among
some competitor firms in order to develop a strong position in the
market that weakens the position of the other competitor firms.
40 / International Journal of Automotive Industry and Management, July 2008
TABLE 1 AComparative Analysis of the Cases on the Basis of the
General Theoretical Framework and the Specific Model Applied

Conclusions
The first conclusion from this article is that developing a
strong position or getting established in the Mexican
industrial networks without a direct relationship with the
customers, i.e. by being represented with third parties only,
is the difficult and time consuming process. This clearly
demonstrates and enables us to conclude that third party
relationships are inappropriate or less successful means of
market establishments in the Mexican market. The second
conclusion is that the Mexican bus segment is European
oriented and the truck segment is American oriented. This
being the contrast there are also similarities among the two
markets and that is both in the bus and truck segments,
there are well developed and tightly structured industrial
networks which function more or less in the same as the
networks in developed countries, although Mexico is a
developing country. This is mainly due to the fact that the
Mexican industrial market is highly internationalized and
industrialized because Mexico, Chile and Australia are the
countries where you can find most of the auto manufactur-
ers. Specifically in Mexico all European, American and
Japanese auto manufacturers have physical presence and
are operating there. The third conclusion, that can be
drawn from this article, is that the differences in the orien-
tation among the truck and bus sectors created both oppor-
tunities and constraints for the American and European
firms. That is to say the European-orientation of the bus
sector created an opportunity for the European firms to
build a successful market establishment and a properly
functioning network and at the same time it created a con-
straint for the American firms. Whereas, the American-ori-
entation of the truck sector created an opportunity for the
American firms to build a successful market establishment
and a properly functioning network and at the same time it
created a constraint for the European firms. In contrast, to
earlier findings in the studies of industrial markets, pricing
in the Mexican industrial market is found out to be one of
the major competitive tools for developing and sustaining
a strong market position. It can also be concluded that, to
achieve success in the Mexican automotive industry firms
have to manage the old cabs concept adequately, other-
wise it is difficult to satisfy customer needs and to develop
adequate customers’ relationships and to build a stable
position in the market with a reasonable market share.
Firms have to adapt their products taking this cultural
issue into consideration and this shows the impact of cul-
tural on the success of the establishment process. The
other conclusion to be drawn from this article is in connec-
tion with government relationships. Developing strong
relationships with the various authorities can help firms to
get a certain act adopted that can enable them to create a
competitive edge that weakens the position of their rivals
in the market. It can even be further concluded that man-
aging government relationships properly creates an oppor-
tunity for building supporting relationships to develop
properly functioning customer relationships and the sur-
rounding network of relationships. Finally, cooperative-
competition is observed to be a good strategy in this mar-
ket as it can help firms to strengthen their position and to
bit their rivals. Cooperative-competition means to cooper-
ate with some of your competitors in order to strengthen
your competitive edge and to compete with the rest of the
competitors operating in the market. A firm, instead of
competing with all firms operating in the market, cooper-
ates with some of them and competes with the rest to cre-
ate stronger position.
Managerial Implications
The first management implication that can be done from
this article is that physical presence and direct contacts,
with the customers, without involving third parties, with
the exception of some rare cases, are two important issues
that have to be dealt with properly. Moreover, as the firms
operating in the automotive industry have well established
international connections and networks, in order to achieve
their objectives firms that aim to get established in the
Mexican market have to have international connections or
have to develop a JV or strategic alliances with firms
which have well established international networks.
Management of firms that operate in the Mexican market
and especially in the truck segment, have to take appropri-
Establishment Processes and Building Relationships in Latin American Countries: The Case of wedish Firms in Mexico / 41
ate measures in order to be able to bridge the cultural gap
that can be created by the old cabs concept, otherwise their
investments are risky and they can easily be swallowed by
their competitors. The other implication for management is
that it is necessary to assess the orientation of the market in
question and whether it matches the company’s products
and mode of operations as market orientation can be differ-
ent in different markets. This is important because there are
wide chances for success in the company’s establishment
attempts. If the market orientation matches the companies
products and mode of operations. This article also implies
that Mexican market establishment can be carried out suc-
cessfully either by penetrating the existing network as there
are well developed market networks or by creating sup-
porting relationships and developing a new network for the
firms position in the market. Not only satisfying customers’
needs, but dealing with the various government authorities
adequately is also one of the preconditions for success in
the Mexican market. It is recommended here that firms
should comply and lobby in accordance with the environ-
mental regulations. If flaws are identified in the environ-
mental regulations, management should present convinc-
ing evidence (argument) to the concerned authority in order
to change the regulations and to facilitate its operations in
an ethical manner. In other words, company interests
should comply and take into consideration, what is good
for the environment and the society, otherwise it will have
the negative impact in the environment in the long run and
all involved actors including the company, the government,
and customers and by and large the society will loose.
What management should consider being another typical
characteristic about the Mexican market is that pricing is
also found out to be a strong competitive tool in contrast to
other markets. The final managerial implication that can be
done from this article is that firms should not compete
indiscriminately with all actors in the market, but they have
to make a proper selection and cooperate with some of
them in order to strengthen their competitive edge and to
succeed in their competition with the rest which operate in
the market.
42 / International Journal of Automotive Industry and Management, July 2008
REFERENCES
Abraha, D. (1989). The Establishment Processes of Swedish Firms
in Kenya - A Model of Case Studies. Working Paper Series #3.
Uppsala: Department of Business Studies, University of
Uppsala.
(1994). Establishment Processes in an UnderdevelopedCountry: The Case of Swedish Firms in Kenya. Uppsala:
University of Uppsala.
and Mukhtar, S.M. (2002). The Process of FirmEstablishment in Less Developed and Loosely Structured
Markets: A Case Study of two Swedish Firms in Kenya.
Journal of International Business and Entrepreneurship, 9(1),
85-108.
and (2000). The Processes of Firm Establishment inLess Developed and Loosely Structured Markets: A Case ofTwo Swedish Firms. 9th World Business Congress,
International Management Development Association,
(December 14-17), San Jose Costa Rica, Conference
Proceedings, 6-16.
and Hyder, A-S. (1997). Establishment Processes in aDeveloping Economy: The Case of Swedish Firms in Kenya.
Journal of Euromarketing, 6(2), 1-24.
and (2000). The Service Firms Establishments inDeveloping Countries. Journal of Euromarketing, 9(1), 57-86.
and Kaynak, E. (2001). The Establishment Process ofSwedish Firms in an Emerging Transition Economy of Poland10th World Business Congress, International Management
Development Association, (July 4-8), Zagreb Croatia,
Conference Proceedings, 48-60.
and (2002). The Establishment Processes ofSwedish Firms in an Emerging Transition Economy of Poland.
Journal of International Marketing and Marketing Research,27(2), 59-80.
Osarenkhoe, A, and Awuah, G-B. (2006). Relationshipsand networks in the Processes of Establishment of Firms inTransitional Economies: The Case of Scandinavian Firms in
Eastern and Central Europe. Working Paper Series, #34.
Gavle: Office for Education and Research, University of Gavle.
Abraha, D., Osarenkhoe, A. and Awuah, G-B. (2008). Relationships
and networks in the Processes of Establishment of Firms in
Transitional Economies: The Case of Scandinavian Firms in
Eastern and Central Europe. International Journal of StrategicManagement, 8(1), 25-44.
Agndal, H. and Chetty, S. (2007). The Impact of Relationships on
Changes in Internationalisation Strategies of SMEs. EuropeanJournal of Marketing, 1(11/12), 1449-1474.
Aijo, T. (1996). Theoretical and Philosophical Understandings of
Relationship Marketing: Environmental Factors - Behind the
Changing Marketing Paradigm. European Journal ofMarketing, 30(2), 8-18.
Aulakh, P.S. and Kotabe, M. (1997). Antecedents and
Performance Implications of Channel Integration in Foreign
Markets. J. Int. Bus. Stud, 18, 145-175.
Anderson, E. and Gatignon, H. (1986). Modes of Foreign Entry: A
Transaction Cost Analysis and Propositions. J. Int. Bus. Stud,17, 1-26.
Anderson, J.C. Hakansson, H. and Johanson, J. (1994). Dyadic
Business Relationships within a Business Network Context.
Journal of Marketing, 58(4), 1-15.
Bartlett, C.A. and Ghousal, S. (1989). Managing Across Borders.Hutchinson.
Baraldi, E. and Stromsten, T. (2006). Embedding, Prodding and
Using Low Weight. The IMP Journal, 1(1), 39-70.
Beamish, P.W. and Delios, A. (1997). "Incidence and Propensity
of Alliance Formation" in Beamish P.W. and Killing, J.P.
(eds.), Co-operate Strategies: Asian Pacific Perspectives, San
Francisco: New Lexington Press.
Berry, L.L., Shostack, G.L. and Upah, G.D. (eds.) (1983).
Emerging Perceptions on Service Marketing. Chicago, IL:
American Marketing Association.
Blankenburg-Holm, D. (1996). Business Network Connectionsand International Business Relationships, Dissertation.Uppsala: University of Uppsala.
Brandenburger, A.M. and Nalebuff B. J. (1996). Co-opetitio. New
York: Doubleday.
Brooke, M.Z. (1992). International Management: A Review ofStrategies and Operations, (2nd ed.). Hutchinson.
Bowersox, D.J. Daugherty, P.J. Droge, C.L, Germain, R.N. and
Rogers, D.S. (1992). Logistical Excellence: It’s Not Business asUsual. Burlington, MA: Digital Press.
Brucellaria, M. (1997). Strategic Alliances Spell Success.
Management Accounting, 77(7), 16.
Burt, R. (1982). Towards a Structural Theory of Action. New
York: Academic Press.
Chang, S.J. (1995). International Expansion Strategy of Japanese
Firms: Capability Building Through Sequential Entry. Acad.Management Journal, 38, 283-407.
Chetty, S. (1997). The Case Study Method for Research in Small-
and Medium-Sized Firms. International Small BusinessJournal, 15(1), 73-85.
Cook, K.S. and Emerson, R.M. (1978). Power, Equity,
Commitment in Exchange Networks. American SociologicalReview. 43(Oct), 721-738.
and Emerson, R.S. (1984). Exchange Networks and theAnalysis of Complex Organizations. Research in the Sociologyof Organizations, 3, 1-30.
Cusumano, M. and Takesihi, A. (1991). Supplier Relations and
Management: A Survey of Japanese, Japanese-ransplant and US
Auto Plants. Strategic Management Journal, 12(8), 563-588.
Datta, K.D., Herrmann, P. and Rasheed, A.A. (2002). Choice of
Foreign Market Entry Models: Critical Review and Future
Directions. Adv. Int. Management, 14, 85-153.
Day, G.S. (1994). The Capabilities of Market-Driven
Organizations. Journal of Marketing, 58(4), 37-52.
Dibb, F., Simkin, L., Pride, W. and Ferrel, O. (1994). Marketing:Concepts and Strategies,Boston, MA: Houghton Mifflin Company.
Dickson, P. (1994). Marketing Management. New York: The
Dryden Press.
Dunning, J-H. (1980). Towards an Eclectic Theory of International
Production: Some Empirical Tests. Journal of InternationalBusiness Studies, 11(1), 1-13.
(1988). The Eclectic Paradigm of International Production:a Restatement and Some Possible Extensions. J. Int. Bus.Studies, 26, 46-492.
Davis, P., Desai, A.B. and Francis, J.D. (2002). Mode of
International Entry: an Isomorphism Perspective. J. Int. Bus.Studies, 31, 239-258.
Establishment Processes and Building Relationships in Latin American Countries: The Case of wedish Firms in Mexico / 43

Dos(z), Y. (1986). Strategic Management in MultinationalCompanies. Oxford: Pergamon Press.
Dwyer, F.R., Schurr, P.H. and Oh, S. (1987). Developing Buyer-
Seller Relationships. Journal of Marketing, 51(2), 11-27.
Dyer, J.H. and Ouchi, W.G. (1993). Japanese-style Partnerships:
Giving Companies a Competitive Edge. Sloan ManagementReview, 35(1), 51-63.
Ekeledo, I. and Sivakumar, K. (2004). International Market Entry
Mode Strategies of Manufacturing Firms and Service Firms- A
Resource-based Perspective, International Marketing Review,21(1), 68-101.
Elg, U. and Johansson, U. (1996). Networking When National
Boundaries Dissolve: the Swedish Food Sector. EuropeanJournal of Marketing, 30(2), 61-74.
Ellram, L. M. (1990). The Supplier Selection Decision in Strategic
Partnerships. Journal of Purchasing and MaterialsManagement, 26(4), 8-14.
(1991). Life-Cycle Patterns in Industrial Buyer-SellerPartnerships. International Journal of Physical Distribution &Logistics Management, 21(9), 12-21.
Elsasser, M., 1984. (1984). Marknadsinvesteringar, tva Fallstudierav Etablering pa Utlandsk Marknad. Stockholm: Liber.
Erramilli, M.K., Agarwal, S. and Kim, S. (1997). Are Firm-
Specific Advantages Location-Specific Too? Journal ofInternational Business Studies, 28, 735-757.
Faulkner, D. (1992). "Strategic Alliances: Cooperation for
Competition" in Faulkner, D. and Johnson, G. (eds.), TheChallenge of Strategic Management. London: Kogan Page Ltd.
Ford, D. (ed.) (1993). Understanding Business Markets. London:
Academic Press Limited.
Gadde, L-E., Hakansson, H. Lundgren, A. Snehota, I.Turnbull, P. and Wilson, D. (1998). Managing BusinessRelationships, Wiley.
Gadde, L-E. and Araujo, L. (2007). Business Recipes, Historical
Narratives And the Discovery of Networks. The IMP Journal,1(3), 2-25.
Gedicks, A. (1994). The New Resource Wars: Native andEnvironmental Struggles Against Multinational Corporations.Montreal, Canada: Black Rose Books.
Geringer, J.M. (1991). Strategic Determinants of Partner Selection
Criteria in International Joint Ventures. Journal of InternationalBusiness, 22(1), 41-62.
Ghauri, P. and Gronhaug, K. (2002). Research Methods inBusiness Studies - A Practical Guide (2nd ed.). Harlow: Pearson
Education Limited.
Ghoshal, S. (1987). Global Strategy: An Organizing Framework.
Strategic Management Journal, 8(5), 425-440.
Glaister, K. and P. Buckley. (1996). Strategic Motives for
International Alliance Formation. Journal of ManagementStudies, 33, 301-332.
Glaser, B. and Strauss, A. (1967). The Discovery of GroundedTheory: Strategies for Qualitaitve Research. Chicago: Aldine.
Gulati, R. (1998). Alliances and Networks. Strategic ManagementJournal, 19(4), 293-317.
Granovetter, M. (1985). Economic Action and Social Structure:
The Problem of Embeddedness. American Journal ofSociology, 91(3), 481-510.
Gronroos, C. and Ravald A. (1996). The Value Concept and Relationship
Marketing. European Journal of Marketing, 30(2), 19-30.
Hagg, I. and Johansson, J. (eds.). (1982). Foretag i Natverk-ny synpa Konkurrenskraft. Stockholm: SNS Forlag.
Hamel, G. (1991). Competition for Competence and Inter-Partner
Learning within International Strategic Alliances. StrategicManagement Journal, 12, 83-103.
Doz, Y.L. and Prahalad, C.K. (1989). Collaborate withyour Competitors and Win. Harvard Business Review, 67(1),
133-139.
Hammarkvist, K-O., Hakansson, H. and Mattsson, L.G. (1982).
Marknadsforing for Konkurrenskraft. Malmo: Liber.
Harrigan, K.R. (1989). Restructuring the Data CommunicationsIndustry Through Strategic Alliances. University of Southern
California.
Hendrick, T. and Ellram, L.M. (1993). Strategic SupplierPartnerships: An International Study. Tempa, AZ: Centre for
Advanced Purchasing Studies.
Hennart, J-F. (1982). A Theory of Multinational Enterprise. Ann
arbour: The University of Michigan Press.
44 / International Journal of Automotive Industry and Management, July 2008

(1991). The Transaction Cost Theory of the MNE, TheNature of the Transnational Firm, New York: Routledge.
and Reddy, S. (1997). The Choice Between Mergers/Acquisitions & Joint Ventures: The Case of Japanese Investors in
the United States. Strategic Management Journal, 18, 1-12.
Hunt, S. Morgan, R. (1995). Relationship Marketing in the Era of
Network Competition. Marketing Management, 3(1), 19-28.
Hyder, A.S. and Abraha, D. (2003). Strategic Alliances in Easternand Central Europe. Kidlington, OXFORD: Elsevier Science
Ltd.
Hymer, S.H. (1976). International Operations of National Firms: AStudy of Foreign Direct Investment. Boston: MIT Press.
Hakansson , H. (ed.) (1982). IMP Group, International Marketingand Purchasing of Industrial Goods- An Interaction Approach.Chichester: Wiley & Sons, Ltd.
(1989). Corporate Technological Behavior, Co-operationsand Networks. London: Routledge.
and Johansson, J. (1979). "Svenska ProducentforetagsInternationella Konkurrenskraft - ett Diskussionsinlagg", in:
Arndt, J. and Fridman, A. (eds.), Samhallet Kraver BattreMarknadsforing, Stockholm: Sveriges Marknadsforingsforbund,
161-178.
and (1987). Formal and Informal Strategies inInternational Industrial Networks. Working Paper. Department of
Business Studies. Uppsala: Uppsala University.
and Snehota, I. (1995). Developing Relationships inBusiness Networks. London: Routledge.
and (1995). The Burden of Relationships or Who’sNext, Paper presented at IMP 11th International Conference,
(September 7-9), Manchester.
Jarillo, J.C. (1993). Strategic Networks - Creating the BorderlessOrganization. Oxford: Butterworth-Heineman Ltd.
Jobber, D. (1995). Principles and Practices of Marketing. UK:
McGraw-Hill Book Company.
Johansson, P. O. (1977). Samhallsekonomiska Aspekter pa AlgotsEtablering I Vasterbotten. Umea: Umea Universitet.
Johansson, J. (1997). Global Marketing: Foreign Entry. LocalMarketing and Global Management. IL: Irwin Homewood.
(1989). Business Relationships and Industrial Networks.Perspectives on the Economics of Organizations. Craford
Lectures 1. Lund: University Press.
and Associates. (1994). Internationalization, Relationshipsand Networks. Stockholm: Norsteds tryckeri AB.
and Mattsson, L.G. (1984). Internationalization inIndustrial systems-A Network Approach. Paper prepared for the
Prince Bertil Symposium on Strategies in Global Competition,
(November 7-9), Stockholm school of Economics.
and (1987). Interorganizational Relations inIndustrial Systems - A Network Approach Compared with
the Transaction Cost Approach. Working Paper. Uppsala:
Department of Business Studies, University of Uppsala.
and (1988). Network Positions and Strategic Action- An Analytical Framework. Working Paper. Uppsala:
Department of Business Studies, University of Uppsala.
and Vahlne, J-E. (1977). Internationalization Process of thefirm - a Model of Knowledge Development and Increasing
Foreign Market Commitments. Journal of InternationalBusiness Studies, 8, 23-32.
and (1992). Management of Foreign Market Entry.Scandinavian International Business Review, 1(3), 9-27.
Juttner, U. and Wehril, H.P. (1995). Relationship Marketing froma Value System Perspective in Payne, A. (ed.), Advances inRelationship Marketing. London: Kogan Page.
Kanter, R. (1994). Collaborative Advantage. Harvard BusinessReview, 72(4), 69- 108.
Kindleberger, C. P. (1969). American Business Abroad: SixLectures on direct Investment. New Haven: Yale University
Press.
Kotler, P. (1994). Marketing Management: Analysis, Planing,Implementation, and Control. NJ: Prentice-Hall International.
Lamming, R. (1993). Beyond Partnership: Strategies forInnovation and Lean Supply. NJ: Prentice-Hall International.
Malhotra, N.K., Agarwal, J. and Ulgado, F.M. (2002),
Internationalization and Entry Modes: a Multitheoretical
Framework and Research Propositions, Journal ofInternational Marketing, 11(4), 1-31.
Mattsson, L-G. (1983). An Application of a Network Approach to
Marketing - Defending the Changing Market Positions, PaperPresented at the Workshop on Alternative Paradigms inMarketing, University of Rhode Island.
Establishment Processes and Building Relationships in Latin American Countries: The Case of wedish Firms in Mexico / 45

and Johanson, J. (2006). Discovering the Market Networks.European Journal of Marketing, 40(3-4), 259-274.
McKenna, R. (1991). Relationship Marketing: SuccessfulStrategies for the Age of the Customer. MA: Addison-Wesley
Reading.
Miles, M.B. and Hubermann, A.M. (1994). Qualitative DataAnalysis: An Expanded Source-book. Thousand Oaks, CA: Sage.
Nitsch, D.P., Beamish, P. and Makino, S. (1996). Entry Mode and
Performance of Japanese FDI in Western Europe. Manage. Int.Rev. 36, 27-43.
North, D.C. (1993). Economic Performance Through Time,Stockholm: The Nobel Fundation.
OCO Monitor (2007). www.ocomonitor.com/index.cfm?
page_name=monitor§ion=market_watch.
Pan, Y. and Chi, P.S.K. (1999). Financial Performance and
Survival of Multinational Corporations in China. StrategicManagement Journal, 20, 359-374.
and Tse, D. (2000). The Hierarchical Model of MarketEntry Modes. Journal of International Business Studies, 31,
535-554.
Li, S. and Chi, P.S.K. (1999). The Impact of Order andMode of Market Entry on Profitability and Market Share.
Journal of International Business Studies, 30, 80-101.
Petersen, B. and Welch, L.S. (2002), Foreign Operation Mode
Combinations and Internationalization. Journal of BusinessResearch, 55(2), 157-162.
Pettigrew, A.M. (1997). What is Processual Analysis?
Scandinavian Journal of Management, 3(4), 337-348.
Porter, M. and Fuller, M. (1986). Competition in Global Industries.Boston: Harvard Business School Press.
(1986). Competition in Global Industries. Boston: HarvardBusiness School Press.
Powell, W. (1990). Neither Market nor Hierarchy: Network Forms
of Organization. Research in Organizational Behavior, 12, 295-
336.
Robson, M.J. (2002). Partner Selection in Successful International
Strategic Alliances: The Role of Co-operation. Journal ofGeneral Management, 28(1), 1-15.
Root, F.R. (1994). Entry Strategies for International Markets. San
Francisco, CA: Lexington Books.
Rotter, J.B. (1967). A New Scale for the Measurement of
Interpersonal Trust. Journal of Personality, 35(4), 651-665.
Shane, S. and Oviatt, B-M. (1994). Explaining the Formation of
International New Ventures: The Limits of Theories From
International Business Research. Journal of BusinessVenturing, 9(6), 469-487.
Sharma, D.D. and Johanson, J. (1987). Technical Consultancy in
Internationalization. International Marketing Review, 4(4), 20-
29.
Shrader, J.M. (2001). Collaboration and Performance in Foreign
Markets: The Case of Young High-technology Firms.
Academic Management Journal, 44, 45-60.
Simmonds, P.G. (1990). The Combined Diversification Breadth
and Mode Dimensions and the Performance of Large
Diversified Firms. Strategic Management Journal, 11, 399-410.
Selwyn, M. and Davidson, C. (1991). Making Marriages of
Convenience. Asian Business, 27(1), 26-29.
Soursac, T. (1996). When the Hub Spoke, the Alliance Analyst,from www.allianceanalyst.com, 1-4.
Stuart, F.I. and McCutcheon, D.M. (1996). Sustaining Strategic
Supplier Alliances: Profiling the Dynamic Requirements for
Continued Development. International Journal of Operationsand Production Management, 16 (10), 5-22.
Thorelli, H. (1986). Networks: Between Markets and Hierarchies.
Strategic Management Journal, 7, 37-51.
Varadarajan, P.R. and Cunningham, M.H. (1995). Strategic
Alliances: A Synthesis of Conceptual Foundations. Journal ofthe Academy of Marketing Science, 23(4), 282-296.
Vernon, R. (1966). International Investment and International
Trade in the Product Cycle. Quarterly Journal of Economics,80(2), 190-207.
Von Wright, H. (1993). Explanation and Understanding. New
York: Cornell University Press.
Waluszewski, A. (2006). Hoping For Network Effects or Fearing
Network Effects. The IMP Journal, 1(1), 71-84.
Webster, F. (1992). The Changing Role of Marketing in the
Corporation. Journal of Marketing, 56(4), 1-17.
46 / International Journal of Automotive Industry and Management, July 2008

World Investment Report. (2000). Cross-border Mergers andAcquisitions and Development. New York: United Nations.
(2001). Promoting Linkages. New York: United Nations.
(2006, 2007), Transnational Corporations, ExtractiveIndustries and Development. Switzerland: United Nations
Publication.
Yin, R.K. (2003). Case Study Research, Design and Methods. (3rd
ed.), Thousand Oaks, California: SAGE.
Zhang, Y., Zhang, Z. and Liu, Z. (2007), Choice of Entry Modes
in Sequential FDI in an Emerging Economy. ManagementDecision, 45(4), 749-772.
Zejan, M.C. (1990). New Ventures or Acquisitions. The Choices
of Swedish Multinational Enterprises. Journal of IndustrialEconomics, 38, 349-355.
Zikmund, W. and D’amico, M. (1995). Effective Marketing:Creating and Keeping Customers. St. Paul, MN: West
Publishing Company.
Zineldin, M. (1995). Bank-company Interactions and
Relationships. International Journal of Bank Marketing, 13(2),
30-40.
(1998). Towards an Ecological Collaborative RelationshipManagement. European Journal of Marketing, 32(11/12),
1138-1164.
(2000). Total Relationship Management (TRM) and TotalQuality Management (TQM). Managerial Auditing Journal,15(1/2), 20-28.
(2000a). TRM, Lund, Sweden: Studentlitteratur.
(2002). Co-opetition: the Organization of the Future.Journal of Quality, Innovation and Prosperity, 1, 1-13.
(2002a). Developing and Managing a Romantic BusinessRelationship. Managing Auditing Journal, 17(9), 546-558.
and Dodourova, M. (2005). Motivation, Achievements andFailure of Strategic Alliances: The Case Of Swedish Auto-
manufacturers in Russia, European Business Review, 17(5),
460-470.
Johannisson, B. and Dandridge, T. (1997). StrategicRelationship Management. Stockholm: Almqvist & Wiksell
International.
and Jonsson, P. (2000). An Examination of the MainFactors Affecting Trust/Commitment in Supplier-Dealer
Relationships, The TQM Magazine, 12(4), 245-265.
Establishment Processes and Building Relationships in Latin American Countries: The Case of wedish Firms in Mexico / 47

48 / International Journal of Automotive Industry and Management, July 2008
[[한한국국어어 요요약약((KKoorreeaann AAbbssttrraacctt))]]
본 연구는 멕시코에 진출한 두 스웨덴 완성차업체, 스카니아와 볼보의 공장 건설 프로세스 모델(establishment process model)의 적용 방법을 분석한 것이다. 멕시코 자동차시장의 구조와 법률, 정치, 문화, 재정 측면이 어떻게 외국 업체의 멕시코 진출에 향을 미쳤는지에 대해 분석하 다.아울러 조사 방법으로 탐색적 연구가 진행되었고 상호작용적 접근(interaction approach), 신경망구조 접근(neural network approach) 등이 다양하게 적용되었다. 상호작용적 접근법은 산업 환경과의 상호작용, 관계자들과 상호작용 프로세스 등의 변수를 고려하여 판매자가 구매자 사이의 상호작용을 설명하는 방식이다. 이번 연구는 사실에 근거하여 기술한 탐색적 사례 연구이다. 국제경 , 전략, 관리, 마케팅에서 꾸준히 발전해온 방법론과 더불어 제조업체에서 국제경 성과를 측정하는 전통적인 방법과 기준을 적용하 다.
연구 결과를 정리하면 다음과 같다.
첫째, 비록 멕시코가 개발도상국이기는 하나 버스와 트럭 시장에 있어서는 선진국에 못지 않은 단단한 구조적인 판매 및 서비스 네트워크를 이루고 있다. 멕시코는 매우 경쟁적인 자동차시장으로 세계유수의 자동차 업체들 대부분이 판매 대리인(representative)을 두고 있는데, 특히 버스시장은 매우 전문적이고 많은 이익을 창출하고 있어 트럭 및 다른 차종과는 상이한 구조를 이루고 있다. 다시말해, 버스와 트럭시장 사이에는 상호 시너지효과가 없는 것으로 나타났다. 버스시장은 주로 유럽업체를 중심으로, 트럭은 미국 업체를 중심으로 형성되어 있다.
둘째, 스카니아의 고객 신뢰도 수준이 트럭과 버스 두 세그먼트에서 서로 다르게 나타나고 있다. 즉,트럭에 대한 고객 신뢰도가 특히 크게 나타나고 있으며 타 브랜드에 비해서도 높은 신뢰도를 유지하고 있었다. 이러한 높은 신뢰도는 스카니아의 우수한 상품력(품질)과 완벽한 서비스(빠른 부품 수급,정비, 교육 등) 솔루션을 기반으로 하고 있다. 버스의 경우에는 트럭과 달리 고객과의 관계가 보다유연하다. 즉, 전적인 지원보다는 고객과의 협조 체제로 서비스가 이루어지고 있다.
셋째, 스카니아의 경쟁력은 상품력과 서비스뿐만이 아니라 경쟁사와의 협력적 경쟁관계(coopera-tive-competition) 및 당국과의 강한 유대관계로 이루어진 뛰어난 시스템을 토대로 하고 있다. 여기서, 협동적 경쟁관계란 자사가 부족한 부분을 경쟁업체와 협력하는 반면 나머지 부분에서 경쟁력을 키워 차별화하는 것을 일컫는다. 협력적 경쟁관계는 자사의 경쟁적 지위를 효과적으로 유지시킬수 있는 좋은 전략으로 판명되어 있다. 멕시코 시장에서 기업의 정부와의 관계, 즉 환경규제법 등관계법규를 준수하고 적절한 로비활동을 하는 것은 고객과의 관계만큼 중요하다. 특히 외국기업이멕시코 현지에서 사업을 추진하기 위해서는 이 부분에 관한 철저한 대처가 필요하다.
마지막으로, 볼보의 경쟁 우위는 딜러 교육, 다양한 금융조건을 이용한 판매 조건을 통하여 딜러들과의 강한 네트워크에 기반하고 있다. 그 밖에 우수한 서비스, 협력적 경쟁관계 및 관계 당국과의강한 유대관계는 스카니아의 경쟁력과 유사하다.

n an increasingly competitive global marketplace,
most firms are competing with a high level of market
pressure worldwide. In the context of supply chain
management, it is necessary for industry to develop supply
chain networks of activities involved in producing and
delivering a final product from suppliers to end customers.
However, effective and efficient supply chain management
requires integrated business processes that go beyond pur-
chasing and logistics activities. By integrating closely with
suppliers and customers, firms can improve product quality
in order to remain competitive. While supply chain integra-
tion is definitely crucial for supply chain management,
some doubts are expressed concerning the applicability of
supply chain integration practices. In particular, the literature
in supply chain management pays little attention to environ-
mental uncertainty-supply chain integration practices con-
nection. Specifically, a careful literature search reveals that
no studies have included the effect of environmental uncer-
tainty on the relationship between supply chain integration
and firm competitive capability, especially product quality.
van Donk and van der Vaart (2005) also states that different
Moderating Effects ofEnvironmental Uncertainty onSupply Chain Integration andProduct Quality: An Empirical
Study of Thai Automotive Industry
Abstract - Although effective and efficient supply chain management requires integrated business
processes that go beyond purchasing and logistics activities, some doubts are expressed concerning
the applicability of supply chain integration practices. Specifically, a careful literature search reveals
that no studies have included the effect of environmental uncertainty on the relationship between sup-
ply chain integration and product quality. This study, therefore, represents an attempt to provide the
contribution in the field by developing a model to explore the relationships and to fulfill the gap
between the literature on supply chain integration and environmental uncertainty. The findings indi-
cate that the effects of supply chain integration on product quality are moderated by environmental
uncertainty as demonstrated by Chow tests. The results also provide managerial insights about envi-
ronmental uncertainty-supply chain integration practices connection.
Keywords - Supply chain integration, Environmental uncertainty, Automotive industry, Thailand
Sakun Boon-Itt is Professor of Industrial and Operations Management,
Thammasat University, Thailand. He received Ph.D. in Management of
Technology (Operations Management), School of Management, Asian
Institute of Technology, Thailand, 2006. His primary research field con-
cerns supply chain management and operations strategy.
Himangshu Paul is Professor of RPG International Graduate School of
Business, Kolkata, India. He received Ph.D. in Systems Engineering and
Management, Asian Institute of Technology. His primary research field
concerns technology capability analysis and international transfer of tech-
nology. ([email protected])
Sakun Boon-itt & Himangshu Paul
I
2008, Korea Automotive Research InstituteISSN 1976-7307(Print)
IJAIM, Vol. 2 (July 2008), 49-6149

aspects of supply chain integration might be important
under different circumstances. Hence, there is still a need for
more research to investigate the effect of environmental
uncertainty on the relationships between supply chain inte-
gration practices and product quality. Further empirical
analysis seems necessary to investigate the relationship
between environmental uncertainty as a contingency factor
in determining supply chain integration structure and firm
performance.
This study emphasizes that the contingency factor as the
environmental uncertainty is important to the effect of sup-
ply chain integration on product quality. This paper posits
the following research question: To what extent does the
environmental uncertainty moderate the relationship
between supply chain integration and product quality? This
study, therefore, represents an attempt to provide the contri-
bution in the field by developing a model to explore the
relationships and to fulfill the gap between the literature on
supply chain integration and environmental uncertainty;
Since there has been little research recognizing the value of
the effect of uncertainty on the relationship between supply
chain integration and product quality. As a result, it takes
the next step to understand how management of supply
chain integration is performed under various circum-
stances.
Literature Review
Supply Chain Integration
The development of supply chain integration includes three
stages from strategic to tactical and then to operational per-
spectives (Steven 1989). Strategic perspective establishes a
framework for the supply chain in terms of what the supply
chain has to do well, and ensures a support to the business.
Tactical perspective involves the means by which the
strategic objectives can be realized and translated into goals
and objectives for each function in the supply chain.
Moreover, the tactical perspective includes the tools related
to organizational structure, technologies, systems, and
infrastructure. Operational perspective represents the effi-
cient operation of the supply chain. Steven (1989) also
classifies supply chain integration into three levels from
functional integration, to internal integration, and to exter-
nal integration. However, this study focuses only on inter-
nal and external integration because the functional integra-
tion is claimed as a basic requirement that all firms should
implement and achieve.
1) Internal integration
To best support customer requirements at the lowest total
system cost, internal integration represents the integration of
all internal functions from material management to produc-
tion, sale, and distribution (Morash et al. 1997). At this stage,
the firm focuses not only on the internal flow of goods into
the organization, but also on the way out to the customer.
Moreover, the internal integration is characterized by full
systems visibility from distribution to purchasing, and
required integration across functions under the control of the
firm to achieve customer satisfaction. In practice, it means
that special attention must be given to the interface between
functional areas such as procurement, production, logistics,
marketing, sale, and distribution (Steven 1989; Morash et al.
1997).
2) External integration
In terms of customer integration, the firm will penetrate
deep into the customer organization to understand the
product, culture, market and organization so that it can
response rapidly to the customer’s needs and require-
ments. The important concept of customer integration is
based on the improvement of demand planning and visi-
bility in supply chains (Fisher et al. 1994). Without infor-
mation sharing from one end of the supply chain to the
other, it can lead to tremendous inefficiencies in customer
service. Many studies have considered the classification
of customer-side integration in various dimensions. For
instance, Frohlich and Westbrook (2001) evaluate cus-
tomer integration using the following issues: 1) efficient
delivery, 2) delivery/logistics communication, 3) speed of
delivery/route, 4) inventory stocking points, and 5)
demand planning.
For the supply integration, integration back down to the
50 / International Journal of Automotive Industry and Management, July 2008

Moderating Effects of Environmental Uncertainty on Supply Chain Integration and Product Quality:An Empirical Study of Thai Automotive Industry / 51
suppliers represents a change in attitude, away from conflict
to cooperation starting from product development, supply
high quality products, process and specification change
information, technology exchange, and design support.
Some researchers have investigated the supply-side integra-
tion in different dimensions. Handfield (1993) defines sup-
ply integration as obtaining frequent deliveries in small lots,
using single or dual sources of supply, evaluating alternative
sources on the basis of quality and delivery instead of price,
and establishing long-term contracts with suppliers. In terms
of logistics communication, Ragatz et al. (2002) view sup-
ply integration as the effective alignment, information shar-
ing, and supplier participation between suppliers and manu-
facturers.
3) Environmental uncertainty
Environmental uncertainty has been defined on the basis of
the concept of uncertainty. Duncan (1972) views that uncer-
tainty can consist of the following three components: 1) the
lack of information regarding the environmental factors
associated with a given decision-making situation, 2) not
knowing the outcome of a specific decision in terms of how
much the organization would lose if the decision were incor-
rect, and 3) inability to assign probabilities with any degree
of confidence as to how environmental factors are going to
affect the success or failure of the decision unit in performing
its function. According to Lenz (1980), environmental uncer-
tainty can be defined as the source of events and changing
trends that create opportunities and threats for individual
organizations. As Ettlie and Reza (1992) point out, environ-
mental uncertainty can also be viewed as unexpected
changes of customers, suppliers, competitors, and technolo-
gy. The same classification of environmental uncertainty is
adopted in Li et al.’s (2005) study of integrated model for
supply chain management. Consistent with this perspective,
this study considers environmental uncertainty as the per-
spective of uncertainty on customers, suppliers, competitors,
and technology. This framework represents the core concept
of environmental uncertainty, and allows identifying and
analyzing the influence of uncertainty in supply chain man-
agement practice.
Customer uncertainty is defined as the extent of change and
unpredictability of customer’s needs and demands (Zhang et
al. 2002). Faced with environmental uncertainty and
increased competition, markets are becoming more interna-
tional, dynamic, and customer driven. Customers are more
sophisticated. They demand more variety, higher quality, and
better product (Claycomb et al. 1999). It is becoming more
important to develop new products effectively than to pro-
duce old product effectively. Being efficient is no longer
enough, customers want better product with faster delivery.
Geary et al (2002) state that customer uncertainty can be
viewed as the difference between the actual end-marketplace
demand and the orders placed with an organization by its cus-
tomers. It can be measured in terms of how well companies
meet customer demand. For instance, customers place orders
twice the typical order size, resulting in poor on-time delivery
or fill rate performance. Moreover, customer uncertainty can
be defined as the link to the predictability of the demand for
the product. For example, products which are characterized as
high demand variability, difficult to forecast, irregular pur-
chase, high innovative and short life cycle have highly cus-
tomer uncertainty in terms of product options and volume
(Chang 2002). In terms of product features, Garvin (1988)
also points out that it is important for firms to offer more cus-
tomized products to meet specific customer’s needs. Due to
this customer pressure, the requirement for flexibility and
mass customization that emphasizes flexibility and small
batch production has been developed.
Supply uncertainty is defined as the extent of change and
unpredictability of the suppliers’ design, quality and delivery
performance. Uncertainty caused by suppliers, such as late
delivery, machine broke down, quality of incoming material
or parts, and degree of inconsistency will postpone or delay
a manufacturing process. This uncertainty can lead to
increasing inventory cost which could propagate throughout
the whole network. Geary et al. (2002) consider supply
uncertainty as the results from poorly performing suppliers
not meeting organization’s needs. Supply uncertainty can
also be evaluated by looking at supplier’s delivery perfor-
mance, time series of order placed, actual lead-times, and
supplier quality reports. Effective supply-based activities

can contribute to higher level in performance. For example,
supplier involvement has a significant impact on return on
assets (ROA) and growth (Tan et al. 1999). A manufacturer
with poor performance supplier will find it very difficult to
provide high levels of customer service. Lee (2002) points
out that supply uncertainty can be viewed as evolving sup-
ply process where the manufacturing process and the under-
lying technology are still under early development and are
rapidly changing. Consequently, suppliers may be limited in
both size and experience. In evolving supply process, sup-
ply uncertainty can be evaluated as the dimensions includ-
ing potential quality problem, unreliable suppliers, inflexi-
bility or difficulty of changeover and variable lead time.
Similarly, in the study of Chang et al. (2002), they construct
supply uncertainty by considering the unpredictability
degree of four factors including improvement of vendor
quality as requested, possibility of increasing vendor pro-
duction capacity, possibility of changing vendor delivery
date, and possibility of vender quality variation. In addition
Li (2002) assesses supply uncertainty by providing factors
such as unpredictability of engineering level, product quali-
ty, delivery time, and quantity.
Competitor uncertainty is defined as the extent and unpre-
dictability of the competitors’ actions (Li 2002).
Globalization and demanding customers increase the level
of competency in business. Organizations that focus on
domestic markets must be able to understand foreign rivals
that penetrate their markets. As a result, firms have no
choice but to develop global perspective of competition by
recognizing the entry of new competitors and the necessity
of partnership with other organizations. This competition is
forcing firms to rearrange their business strategies away
from conventional, cost-based strategies to knowing which
feature a customer wants. Jones and Ryan (2002) suggest
that firms cannot operate in such a static environment. Even
in a stable market, business may be exposed to periodic
"shocks" that can move a firm up to high competition. In the
case of Caterpillar and Komatsu, two global companies in
the construction equipment industry, Caterpillar operated in
a stable environment until the 1980’s. Then, Komatsu began
taking over the market share by offering products with simi-
lar performance at a much lower price. For this reason,
Caterpillar forced a movement towards more organic strate-
gies. The literature has suggested how to operationalize
competitor uncertainty. For example, Chang et al. (2002)
suggest three factors regarding possibility and predictability
of competitors changing: 1) price, 2) marketing strategies,
and 3) entry/exit of new/current competitors. Similar to the
Chang et al. (2002) study, Li (2002) provides the measure-
ment including the possibility of competitors to introduce
new product unexpectedly, enter form different
sectors/countries, and unpredictable actions.
Technology uncertainty is defined as the extent of changes
and unpredictability of product and process technology
development. The development of technology provides
numerous opportunities for organizations. For example,
companies apply new technology to offer various products
to take advantage of new opportunities. New market oppor-
tunities come with technological innovation. As technology
becomes more multidisplinary and dynamic, firms are rely-
ing on other firms as a way to attain the technological know-
how necessary as parts of their supply chain restructuring
programmes. Additionally, developments in information
technology enable companies to achieve a degree of control
in international supply chains. Advanced information tech-
nology can also reduce transaction costs relating to the con-
trol of goods flows and the making of a quick response to
customer orders. Ragatz et al. (2002) suggest that technolo-
gy uncertainty can be measured as the degree to which the
product or process technologies employed are new, complex,
and/or rapidly changing. In terms of product technology
uncertainty, Chang et al. (2002) include two variables: 1)
change of core production technology, and 2) change of sup-
porting technology. Technology uncertainty can also be
viewed as how significantly changing of technology in par-
ticular industry, and technology breakthrough resulting in
new product development.
Hypotheses Development
Environmental Uncertainty as a Moderating Effect
The environmental uncertainty could influence the relation-
52 / International Journal of Automotive Industry and Management, July 2008

ship between supply chain integration and firm competitive
capability. As suggested by Lee (2002), a product with a sta-
ble demand and a reliable source of supply should not be
managed in the same way as one with a highly unpre-
dictable demand and an unreliable source of supply. To fur-
ther explain, automotive industry provides an appropriate
example. It is expected that this industry with high level of
supply uncertainty will affect the supply integration strategy
on product quality performance more than other industries
with low supply uncertainty. To support this assumption,
Hrebiniak and Snow (1980) and Fisher (1997) indicate that
uncertainty will vary by product sector or industry. Some
uncertainty characteristics require supply chain strategies
that can provide a competitive edge to companies. In addi-
tion, Stonebraker and Afifi (2004) suggest that different
types and amount of supply chain integrative efforts are
appropriate in different situations. Therefore, the effect of
supply chain integration on product quality capability may
indeed be different under various models, depending on
environmental uncertainty. Therefore, the following
hypotheses were proposed:
H1) Supply uncertainty has a moderating effect on the
relationship between supply chain integration and
product quality.
H2) Customer uncertainty has a moderating effect on
the relationship between supply chain integration
and product quality.
H3) Technology uncertainty has a moderating effect on
the relationship between supply chain integration
and product quality.
H4) Competitor uncertainty has a moderating effect on
the relationship between supply chain integration
and product quality.
Methodology
Survey Instrument and Data Collection
The instrument used to test the hypotheses was a mail sur-
vey. This study used five-point Likert scale for all constructs
to draft a questionnaire. This draft questionnaire then was
pre-tested with academics and practitioners to check its con-
tent validity and modified accordingly. The modified ques-
tionnaire was pilot-tested to examine its suitability for the tar-
get population before large-scale mailing
Empirical data was obtained through a mail survey to pro-
duction or purchasing managers, who had knowledge of
supply chain management practices. These respondents were
asked to rate their firms relative to their understanding on
supply chain integration, environmental uncertainty, and
product quality performance. The unit of analysis in this
study was limited to plant level. Within this perspective,
Flynn et al. (1994) point out that most empirical research in
operations management occurs at the corporation or individ-
ual level of analysis. Moreover, the independent variables of
supply chain management practices usually reflect corporate
level practices. Similarly, the dependent variable of firm
competitive capability also reflects the corporate level
results.
The survey was selected specifically to automotive indus-
try in Thailand because of the following reasons. First, auto-
motive industry is seen as an indicator to measure the
wealth of the economy. Second, the literature in automotive
supply chain has been well documented in previous
research, and there is a clear structure of automotive supply
chain. Finally, automotive sector has been a leader in imple-
menting supply chain management strategies in Thai indus-
try. We forwarded the questionnaire with a cover letter indi-
cating the purpose of this study to 403 qualified first-tier
suppliers and automakers. After six weeks, we received 91
completed responses following 20 questionnaires returned
as the second wave. The total 111 responses were returned
to the response rate of 27.5 %.
Non-Response Bias
In this study, non-response bias was evaluated using the
method suggested by Armstrong and Overton (1977). This
method tested for significant different between early and
late respondents, with a late respondents being considered
as a non-respondent. By using this method, although it did
not investigate non-response directly, a comparison was
made between those subjects who responded in the first
Moderating Effects of Environmental Uncertainty on Supply Chain Integration and Product Quality:An Empirical Study of Thai Automotive Industry / 53

wave and the second wave (Larson and Poist 2004). A one-
way analysis of variance (ANOVA) was used to make the
comparisons in demographic variables, namely, number of
employee, respondent’s position, and number of years in
business. Along with the demographic variables, randomly
selected variables were also included in this analysis. The
results indicate no significant difference on any criteria,
which the significant level, is far from 0.1. Based on the
ANOVA test, non-response bias may not be the problem in
this study and the two waves were pooled for subsequent
analysis.
Data Analysis
Instrument’s Validity and Reliability
As new items were being used, an exploratory factor analy-
sis (EFA) of the items in each constructed was conducted
using a Varimax rotation to reduce the number of items. EFA
is useful in discovering potential latent source of variance
and covariance in observed measurement. Items with good
measurement properties should show high factor loading on
the factor of which they are indicators, while small factor
loading on the factor that are measured by different sets of
indicators. Therefore, this result can provide an evidence of
initial construct validity.
In this sense, validity is defined as the extent to which the
instrument captures what it is intended to capture. According
to Nunnally (1978), to test the construct validity, the EFA is
used to assess either inter- or intra-scale differences, and
established by the following decision rules including: 1) mini-
mum Eigenvalues of 1; 2) the value of 0.5 was used as the
cutoff score for factor loading. In addition, the items with seri-
ous cross loading, which means the items loaded very close
to 0.5 on more than one factor. In this study, factor loadings
lower than 0.4 were removed in order to streamline the final
result. In addition, the Kaiser-Mayer-Olkin (KMO) measure
and Bartlett’s test of sphericity were tested to ensure that the
data had inherent sufficient correlations to perform EFA. The
KMO index was 0.80, and Bartlett’s test of sphericity was sig-
nificant at a level of 0.00, which justified the use of EFA.
To begin, the factor structure of each scale for supply chain
54 / International Journal of Automotive Industry and Management, July 2008
TABLE 1 Sub-group Analysis with Chow Test for Product Quality
(** p 0.01; * p 0.05)

integration, environmental uncertainty, and competitive capa-
bility was explored by conducting a factor analysis on each
scale individually. For each the items loaded on only one fac-
tor, with total variance extracted exceeding 50 percent in all
cases. The reliability of each scale, measured internal consis-
tency using Cronbach , also was above the recommended
threshold of 0.7 (Nunnally 1978). The EFA loading,
Eigenvalue, percentage of variance explains, KMO index,
Bartlett’s test of sphericity for all items are available at the
Appendix A.
1) Supply chain integration
As the independent variables, the internal integration factor
explained 66.3% of the variance with all its four items load-
ing on a single factor with loading ranging between 0.716
and 0.857. The scale Cronbach’s alpha was 0.83. In addition,
the factor of supply integration explained 72.2% of variance
with all its three items loading ranging between 0.748 and
0.840. The scale Cronbach’s alpha was 0.808. Besides both
internal and supply integration, the factor of customer inte-
gration explained 68.85% of variance with all its three items
loading between 0.701 and 0.836. The Cronbach’s alpha of
this factor was 0.765.
2) Environmental uncertainty
Based on results from factor analysis, there are four factors
of types environmental uncertainty in this study. It can be
seen that all items loaded on their respective dimensions,
with most loading greater than 0.60. The cumulative vari-
ance explained by four dimensions is well in excess of 50%.
In addition, the Cronbach’s alpha of supply uncertainty, cus-
tomer uncertainty, competitor uncertainty, and technology
uncertainty are 0.839, 0.767, 0.727, and 0.730 respectively.
3) Product quality
The dependent variable in this study is product quality per-
formance. According to the same recommended value to
test scale validity and reliability used in the previous con-
structs. The cumulative percentage of variance explained for
product quality construct was well in excess of 50%, show-
ing 71.87%. In addition, reliability was tested using
Cronbach’s alpha for each factor. The reliabilities of product
quality construct showed satisfactory scores, representing
0.899
Results and Discussion
This study focuses on the moderating effects of four contin-
gency variables on product quality through three dimensions
of supply chain integration. These four variables are: supply
uncertainty, customer uncertainty, technology uncertainty,
and competitor uncertainty. The Chow test has been often
employed to test whether there is a structural change
between two groups by examining the statistical significance
of the difference in the size of regression coefficients (Chow
1960). Based on the previous studies in operations manage-
ment research (e.g., Hope and Muhlemann 2001; Fynes and
Voss 2002; Bstieler and Gross 2003; Fam and Yang 2006),
these authors also use Chow test to examine the stability of
the regression coefficient across two sub-groups. Thus, the
Chow test is an appropriate methods to test if the above four
variables have a moderating effect on firm competitive capa-
bility. All responses were divided into two groups based on
each of four variables into high and low groups, which are
below and above the composite means of the four contin-
gency variables in order to assess the impact of supply chain
integration on product quality using multiple regression
analysis.
As presented in Table 1, F-statistics for technology uncer-
tainty and competitor uncertainty were significant at 0.05
levels in the case of product quality. Specifically, the results
show that firms which faced low technology uncertainty,
internal integration positively impacted product quality. In
contrast, for the sub-group of firms facing high technology
uncertainty, supply integration was the primary factor to
product quality. In the case of competitor uncertainty, only
for firms reporting low uncertainty does supply integration
predict product quality, while internal integration positively
impact product quality for firms facing high competitor
uncertainty. As the evidence shown in Chow tests, it is also
noteworthy that supply uncertainty and customer uncertainty
are not significantly different between two sub-groups of
Moderating Effects of Environmental Uncertainty on Supply Chain Integration and Product Quality:An Empirical Study of Thai Automotive Industry / 55
environmental uncertainty variables. It appeared that only
technology uncertainty and competitor uncertainty were sig-
nificant contingency variables. Therefore, hypothesis 3 and 4
are supported.
An examination of the relationship between supply chain
integration and product quality for firms reporting low and
high environmental uncertainty yields the following results.
Overall, this present study indicates that the effects of supply
chain integration on product quality are moderated by envi-
ronmental uncertainty as demonstrated by Chow tests. More
specifically, only firms facing low technology uncertainty,
internal integration and customer integration show a signifi-
cant impact on product quality, while in a case of high tech-
nology uncertainty only supply integration shows a signifi-
cant effect on product quality. An explanation for this finding
lies in the action of firms when faced with high technology
uncertainty may be more reluctant to integrate internally and
collaborate to customers since technologies become obsolete
quickly and new products are introduced frequently. Hence,
the integrative business processes among departments and
with customers should be less than when technology obso-
lescence is slow. Among firms reporting low competitor
uncertainty, only supply integration predicts product quality,
where as among firms facing high competitor uncertainty
internal integration predicts product quality. It may imply
that firms prefer not to integrate to their suppliers in a highly
competitive environment. In contrast, decentralization or
internal integration practices are needed to emphasize in
order to survive in a highly competitive environment.
These moderating factors should be considered of poten-
tial interest to researchers and practitioners. Moreover, the
results shed some light on the relative degrees of significance
of the environmental uncertainty variables. This result is con-
sistent with the results in previous studies (e.g., Zacharia and
Mentzer 2004; Fynes et al. 2006). In Fynes et al.’s research
(2005), the interaction between supply chain relationship
quality and environmental uncertainty on supply chain per-
formance is very significant.
However, the findings of this study contradict the idea that
firms must develop supply chain integration practices to deal
with high environment uncertainty (Buvik and John 2000).
In contrast, for firms reporting high uncertainty, supply chain
integration mostly does not impact product quality. The find-
ings could be explained by the following arguments. First,
effective implementation of supply chain integration prac-
tices especially in automotive industry will need the exis-
tence of commitment, shared visions among internal func-
tions as well as suppliers and customers under stable busi-
ness environment. In other words, the empirical results of
this study demonstrate that obtaining favorable results in
product quality is based on building the effective relationship
with business partners under low environmental uncertainty.
This finding supports the work of Morris and Carter (2005),
who suggest that firms should invest their resources in both
reducing uncertainty and increasing cooperation in their rela-
tional exchanges. Second, management in firms operating in
high uncertainty may be more reluctant to integrate internal-
ly and externally to their business partners since those inte-
grative supply chain practices under condition of low uncer-
tainty may be viewed as more strategic than they are under
conditions of high uncertainty. In other words, firms may
emphasize their supply chain integration practices only on
the condition of low uncertainty, but not prepare themselves
for high uncertainty condition. As a result, it is not likely to
see the significant relationship between supply chain integra-
tion and product quality under high environmental uncertain-
ty.
The results of this study pinpoint an important implication
for practitioners by highlighting the importance of environ-
mental uncertainty in implementing supply chain integration.
Although firms have tended to focus on integrative supply
chain practices, they have not given enough attention to the
effect of external factors such as environmental uncertainty.
The results of this study demonstrate to the practitioners that
to achieve high level of product quality through supply chain
integration, spending time and effort understanding types of
uncertainty before investing in supply chain integration is a
must. The basic concept is that the implementation of supply
chain integration is not rigid. Rather, a success is attributable
to the way in which supply chain integration practices are
combined and organized based on the uncertainty or busi-
ness condition factors.
56 / International Journal of Automotive Industry and Management, July 2008
REFERENCES
Armstrong, J.S. and Overton, T.S. (1977). Estimating Nonresponse
Bias in Mail Surveys. Journal of Marketing Research,14, 396-402.
Bstieler, L. and Gross, C.W. (2003). Measuring the Effect of
Environmental Uncertainty on Process Activities, Project Team
Characteristics, and New Product Success, Journal of Business andMarketing, 18(2), 146-161.
Buvik, A. and John, G. (2000). When does Vertical Coordination
Improve Industrial Purchasing Relationships?, Journal ofMarketing, 64(4), 52-64.
Chang, S.C., Lin, N. and Sheu, C. (2002). Alignment Manufacturing
Flexibility with Environmental Uncertainty: Evidence from High-
Technology Component Manufacturers in Taiwan, InternationalJournal of Productions Research, 40(18), 4765-4780.
Chow, G. (1960). Test of Equality between Sets of Coefficient in Two
Linear Regressions, Econometrica,28, 591-605.
Claycomb, C., Droge, C. and Germain, R. (1999). The Effect of Just-In-
Time with Customers on Organizational Design and Performance,
The International Journal of Logistics Management, 10(1), 37-58.
Duncan, R.B. (1972). Characteristics of Organizational Environments
and Perceived Environmental Uncertainty, Administrative ScienceQuarterly,17, 313-327.
Ettlie, J.E. and Reza, E.M. (1992). Organizational Integration and
Process Innovation, Academy of Management Journal, 35(4), 795-
837.
Fam, K.S. and Yang, Z. (2006). Primary Influences of Environmental
Uncertainty on Promotions Budget Allocation and Performance: a
Cross-country Study of Retail Advertisers, Journal of BusinessResearch,59(2), 259-267.
Fisher, M.L. (1997). What is the Right Supply Chain for Your
Product?, Harvard Business Review, 75(2), 105-116.
_________, Hammond, J.H. and Obermeyer, W.R. (1994). Making
Supply Meet Demand in an Uncertain World, Harvard BusinessReview,72(3), 83-93.
Flynn, B.B., Schroeder, R.G. and Sakakibara, S. (1994). A Framework
for Quality Management Practices on Performance and
Competitive Advantage, Decision Science, 26(5), 659-691.
Frohlich, M.T. and Westbrook, R. (2001). Arcs of Integration: An
International Study of Supply Chain Strategies, Journal ofOperations Management, 19, 185-200.
Fynes, B. and Voss, C. (2002). The Moderating Effect of Buyer-supplier
Relationships on Quality Practices and Performance, InternationalJournal of Operations and Production Management, 22(6), 589-613.
, and de Burca, S. (2005). The Impact of Supply ChainRelationship Quality on Quality Performance, International Journalof Production Economics, 96(3), 339-354.
Garvin, D.A. (1988). Managing Quality. New York: The Free Press.
Geary, S., Childerhouse, P. and Towill, D. (2002). Uncertainty and the
Seamless Supply Chain, Supply Chain Management Review, 6(4), 52-
61.
Handfield, R.B. (1993). A Resource Dependence Perspective of Just-In-
Time Purchasing, Journal of Operations Management, 11, 289-311.
Hope, C.A. and Muhlemann, A.P. (2001). The Impact of Culture on
Best-practice Production/Operations Management, InternationalJournal of Management,3(3), 199-217.
Hrebiniak, L.G. and Snow, C.C. (1980). Industry Differences in
Environmental Uncertainty and Organizational Characteristics
Related to Uncertainty, Academy of Management Journal, 23(4),
750-759.
Jones, R.T. and Ryan, C. (2002). Matching Process Choice and
Moderating Effects of Environmental Uncertainty on Supply Chain Integration and Product Quality:An Empirical Study of Thai Automotive Industry / 57
In terms of research contribution, the results obtained in
this study empirically confirm that different business envi-
ronments require different supply chain integration practices
on firm competitive capability. If the supply chain integration
strategy is inappropriate to the level of differentiation, it
would be a reason for increased supply chain costs, and in
the long run suggest potential failure (Stonebraker and Afifi
2004). In regards to implications for managers, firms need to
choose the specific supply chain integration strategy on
developing product quality under different circumstances.
The results provide managerial insights about environmental
uncertainty-supply chain integration practices connection.
Uncertainty Modeling Quality Management, Business ProcessManagement, 8(2), 161-168.
Lee, H.L. (2002). Aligning Supply Chain Strategies with Product
Uncertainties, California Management Review,44(3), 105-119.
Lenz, R.T. (1980). Environment, Strategy, Organization Structure and
Performance: Patterns in One Industry, Strategic ManagementJournal,1, 209-226.
Li, S., Ragu-Nathan, B., Ragu-Nathan, T.S. and Rao, S.S. (2005).
Development and Validation of a Measurement Instrument for
Studying Supply Chain Management Practices, Journal ofOperations Management, 23(6), 618-641.
Morash, E.A., Droge, C., and Vickery, S. (1997). Boundary-spanning
Interfaces Between Logistics, Production, Marketing and New
Product Development, International Journal of PhysicalDistribution and Logistics Management, 27(5/6), 350-369.
Morris, M. and Carter, C.R. (2005). Relationship Marketing and
Supplier Logistics Performance: an Extension of the Key Mediating
Variables Model, The Journal of Supply Chain Management, 41(4),
32-42.
Nunnally, J.C. (1978). Psychometric Theory. New York: McGraw-Hill.
Ragatz, G.L., Handfield, R.B. and Peterson, K.J. (2002). Benefits
Associated with Supplier Integration into New Product
Development under Conditions of Technology Uncertainty,
Journal of Business Research, 55, 389-400.
Stevens, G.S. (1989). Integrating the Supply Chain, International Journalof Physical Distribution and Material Management, 19(8), 3-8.
Stonebraker, P.W. and Afifi, R. (2004). Toward a Contingency Theory
of Supply Chains, Management Decision,42(9), 1131-1144.
Tan, K.C., Kannan, V.R., Handfield, R.B. and Ghosh, S. (1999).
Supply Chain Management: An Empirical Study of its Impact on
Performance, International Journal of Operations and ProductionManagement, 19(10), 1034-1052.
van Donk, D.P. and van der Vaart, T. (2005). A Case of Shared
Resource, Uncertainty and Supply Chain Integration in the Process
Industry, International Journal of Production Economics, 96(1), 97-
108.
Zacharia, Z.G. and Mentzer, J.T. (2004). Logistics Salience in a
Changing Environment, Journal of Business Logistics, 25(1), 187-
209.
Zhang, Q., Vonderembse, M.A. and Lim, J. (2002). Value Chain
Flexibility: A Dichotomy of Competence and Capability,
International Journal of Operations Research,40(3), 561-583.
58 / International Journal of Automotive Industry and Management, July 2008

Appendix A1 Constructs, Variables, Factor Analysis and Internal Consistency for Supply Chain Integration
Internal Integration (II) Factor Loading
II1 We have a high level of responsiveness within our plant to meet other department’s needs 0.733
II2 We have an integrated system across functional areas under plant control 0.857
II3 Within our plant, we emphasis on information flows among purchasing, inventory management, sales,
and distribution departments 0.716
II4 Within our plant, we emphasis on physical flows among production, packing, warehousing, and
transportation departments 0.758
Percentage of variance = 66.3, Internal consistency ( ) = 0.83
Supply Integration (SI) Factor Loading
SI1 We share information to our suppliers through information technologies Dropped
SI2 We have a high degree of strategic partnership with our suppliers (i.e. single/dual sourcing of supply with
long-term relationship) Dropped
SI3 Our plant has a high degree of joint planning to obtain rapid response ordering process (inbound) with our
suppliers 0.793
SI4 Our suppliers provide information to us in the production and procurement processes 0.840
SI5 We obtain efficient and reliable delivery (inbound) from suppliers. 0.748
SI6 Our suppliers are involved in our product development processes Dropped
Percentage of variance = 72.2, Internal consistency ( ) =0.808
Customer Integration (CI) Factor Loading
CI1 We share information to our customers through information technologies 0.701
CI2 Our plant has a high level of information sharing with our customers about market information Dropped
CI3 We have a high degree of joint planning and forecasting with our customers to anticipate demand visibility Dropped
CI4 Our customers provide information to us in the procurement and production processes 0.785
CI5 Our customers are involved in our product development processes 0.836
Percentage of variance =68.85 , Internal consistency ( ) =0.765 2.13
Appendix A2 Constructs, Variables, Factor Analysis and Internal Consistency for Environment Uncertainty
Supply Uncertainty (SU) Factor Loading
SU1 Our suppliers’ delivery performance is unpredictable 0.894
SU2 Our suppliers’ quality performance is unpredictable 0.900
SU3 Our suppliers’ product design performance is unpredictable 0.806
SU4 Our suppliers often change their production capacity. Dropped
SU5 We involve supply process when our suppliers are still under development Dropped
Percentage of variance =78.21 , Internal consistency (a) =0.839
Customer Uncertainty (CU) Factor Loading
CU1 Our customers often order customized products to meet their specific needs Dropped
CU2 Our customers’ requirements regarding product or part preferences often change Dropped
CU3 Our customers often change their order over the month 0.846
CU4 Our customers often change their delivery date over the month 0.889
CU5 The difference in time between the actual delivery date and the orders placed by customer is unreliable Dropped
Percentage of variance =62.93 , Internal consistency (a) =0.707
Technology Uncertainty (TU) Factor Loading
TU1 Process technologies employed in our plant are complex 0.709
TU2 Our plant uses core production technologies that often change 0.658
TU3 Product technologies employed in our plant are complex 0.718
TU4 Our plant uses core supporting technology that often change 0.778
TU5 Our plant uses technology that has short technology life cycle 0.751
Percentage of variance =73.24 , Internal consistency (a) = 0.727
Competitor Uncertainty (COMU) Factor Loading
COMU1 Competitors offer lower prices that change over the year
COMU2 Competitors’ actions regarding marketing promotions are unpredictable 0.625
COMU3 Competitors often introduce new products features frequently 0.827
COMU4 Competitors’ actions regarding changing in entry/exit of new or current competitors are unpredictable 0.787
Percentage of variance =68.84 , Internal consistency (a) =0.730
KMO measure of sampling adequacy= 0.76, Bartlett’s test of sphericity (significant level) = 0.00
KMO measure of sampling adequacy = 0.84, Bartlett’s test of sphericity (significant level) = 0.00
Moderating Effects of Environmental Uncertainty on Supply Chain Integration and Product Quality:An Empirical Study of Thai Automotive Industry / 59
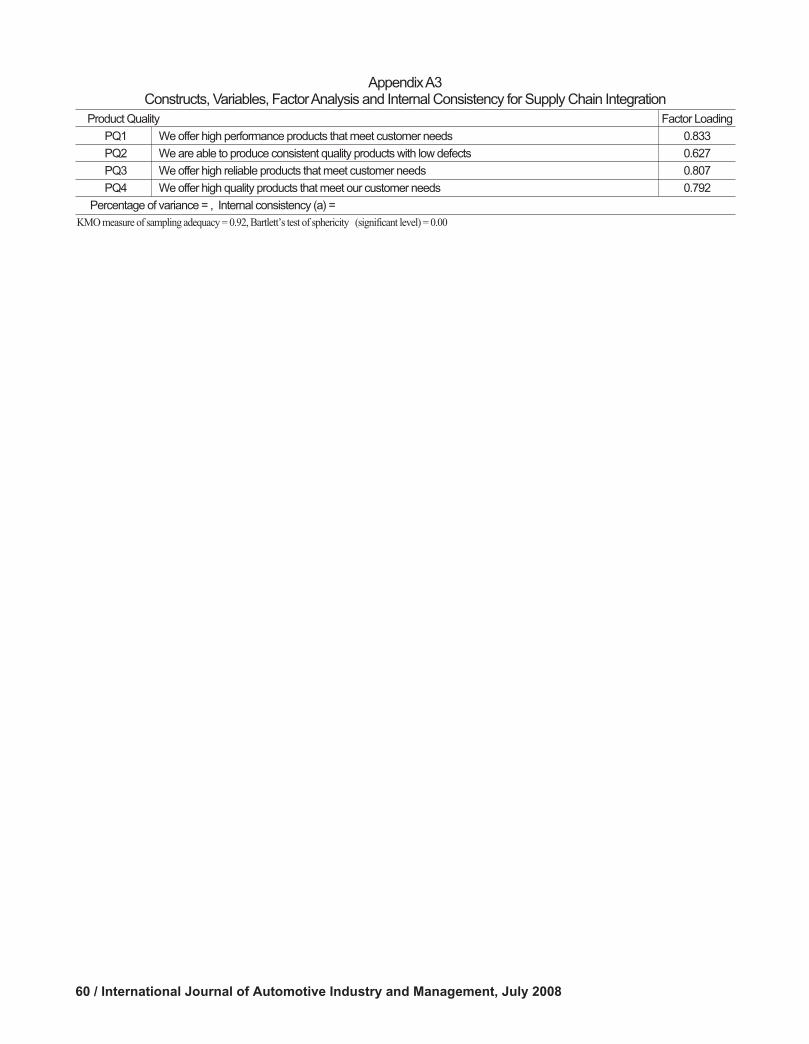
60 / International Journal of Automotive Industry and Management, July 2008
Appendix A3 Constructs, Variables, Factor Analysis and Internal Consistency for Supply Chain Integration
Product Quality Factor Loading
PQ1 We offer high performance products that meet customer needs 0.833
PQ2 We are able to produce consistent quality products with low defects 0.627
PQ3 We offer high reliable products that meet customer needs 0.807
PQ4 We offer high quality products that meet our customer needs 0.792
Percentage of variance = , Internal consistency (a) =
KMO measure of sampling adequacy = 0.92, Bartlett’s test of sphericity (significant level) = 0.00

[[한한국국어어 요요약약((KKoorreeaann AAbbssttrraacctt))]]
로벌 경쟁이 심화되어 공급사슬을 효과적으로 운 해야 할 필요성이 높아지고 있다. 단지 부품을효율적으로 구매하고, 물류를 개선하는 것뿐만 아니라 품질을 높여 경쟁력을 향상시키기 위해서도부품업체에서부터 소비자에까지 이어지는 모든 프로세스가 통합적으로 관리되어야 한다. 자동차산업의 경우 완성차업체들이 공급사슬의 통합 필요성을 인식하고 있으나 경 환경의 불확실성으로 인해실제 적용에는 어려움을 겪고 있다. 뿐만 아니라, 환경 불확실성(environmental uncertainty)이가치사슬 통합과 품질 간의 관계에 미치는 향에 대한 연구도 많지 않은 실정이다.
본 연구는 조절(moderator)변수인 환경적 불확실성에 따라 태국 자동차산업의 가치사슬 통합이 제품 품질에 어떠한 향을 주는지를 살피고 있다. 태국 자동차산업은 타 산업에 비해 공급자 불확실성이 높아 연구에 적합한 측면이 있다. 한편, 가치사슬 통합을 다루는데 있어, 가치사슬 통합을 분류하는 전략적 관점, 전술적 관점, 운 상의 관점 중 운 상의 관점으로 한정하 다. 또한 운 상의 관점 중 업체가 기본적으로 추진하는 기능적 통합은 배제하고 내·외부 통합으로 한정하 다. 내부 통합은 생산, 판매, 유통 등 기업 내부 기능의 통합을 의미하고, 외부 통합은 소비자 만족 극대화를 위한 소비자 통합과 비용절감 및 효율성을 높이기 위한 공급업체 통합을 의미한다. 독립변수로서 가치사슬 통합은 내부 통합, 소비자 통합, 공급업체 통합 등 3가지 측면에서 분석하 다.
조절변수로서 환경 불확실성은 고객 불확실성, 공급업체 불확실성, 경쟁자 불확실성, 기술 불확실성으로 구분하여 분석하 다. 고객 불확실성은 고객의 니즈 및 수요 변동을 의미하며, 공급업체 불확실성은 공급업체의 디자인, 품질, 운송의 변화를 의미한다. 경쟁자 불확실성은 경쟁자 행동의 예측불가성을 의미하고, 마지막으로 기술 불확실성은 제품 기술 및 프로세스 기술 개발의 변화와 관련된것이다. 실증분석을 위해 공급사슬 관리에 정통한 생산, 구매 담당자들에게 5점 척도 설문지를 우편으로 송부해 자사 공급사슬 통합, 환경적 불확실성 및 품질을 평가하도록 하 다. 총 403개 중 111개 설문지가 회수되었다. 조절변수의 정도에 따라 응답자를 두 그룹으로 나누어 독립변수와 종속변수와의 관계를 다중회귀분석과 쵸우 테스트(Chow test)로 분석하 다.
연구 결과, 기술 불확실성과 경쟁자 불확실성 변수가 유의미한 것으로 나타났다. 기술 불확실성이 낮은 경우에는 내부 통합과 고객 통합이 품질에 향을 미친 반면, 기술 불확실성이 높은 경우에는 공급업체 통합이 품질에 향을 주었다. 이를 해석하면, 신기술 개발 속도가 빨라지면 완성차업체들은부서 간 프로세스 통합과 고객과의 통합을 꺼려한다는 것이다. 경쟁자 불확실성이 낮을 때 공급업체통합이 제품 품질에 향을 주고, 경쟁자 불확실성이 높을 때 내부 통합이 품질에 긍정적인 향을주었다. 이는 경쟁이 심화될 때 완성차업체들이 부품업체와 통합하지 않고, 분권화 혹은 내부 통합을추진한다는 것을 의미한다.
본 연구는 완성차업체가 처해있는 경 환경에 따라 각기 다른 공급사슬 통합 전략을 취해야 함을 실증연구로 밝혔다는 점과 환경적 불확실성 요인, 공급사슬 통합, 제품 품질 간의 관계를 설명하는 연구모델을 개발하 다는 점에서 학문적·실무적 의미가 있다.
Moderating Effects of Environmental Uncertainty on Supply Chain Integration and Product Quality:An Empirical Study of Thai Automotive Industry / 61

International Journal of
Automotive Industry and Management
CALL FOR PAPERS
You are welcome to submit papers to
International Journal of Automotive Industry and Management
that report on your research results
The International Journal of Automotive Industry and Management(IJAIM) from KARI
invites submissions of articles to be considered for publication. We welcome reports that
may contribute to understanding of automotive industry and management.
The IJAIM invites invaluable research results in the area of automotive Industry and
Management related to the following topics:
Strategy / Management
Marketing / Sales
Finance / Accounting
Production Strategy / SCM
Economics(e.g. Industrial organization)
Policy & Law
ETC(e.g., History Analysis)
As a scholarly journal, IJAIM is committed to publishing a broad spectrum of conceptual
and empirical studies. The IJAIM accepts and publishes papers ONLY written in English,
and papers submitted for consideration should conform to the IJAIM reference citations and
style. Authors whose manuscripts are accepted for publication will be supported with an hon-
orarium(US$500) to promote their further research. The best papers will be nominated for
"IJAIM Paper of the Year"
Further questions regarding the journal, the review process, or submission of paper should
be directed to [email protected]


Copyright 2008 International Journal of Automotive Industry and Management
Korea Automotive Research Institute
231, Yangjae-dong, Seocho-gu Seoul, 137-938, Korea
Email: [email protected]
Webpase: http://kari.hmc.co.kr/popup/E-pop-jaim.html
Volume 2, Number 1 (August, 2008)
ISSN 1976-7307
International Journal of Automotive Industry and Management