vol.: 11 / no. 1 brno, czech republic, 2020
TRANSCRIPT

Journal of Landscape Management (2020) Vol.: 11 / No. 1
JOURNAL OF LANDSCAPE MANAGEMENT
Vol.: 11 / No. 1 Brno, Czech Republic, 2020

Journal of Landscape Management (2020) Vol.: 11 / No. 1
Editor-in-Chief
prof. Dr. Ing. Miloslav Šlezingr, Mendel University in Brno, CZECH REPUBLIC
Editorial board
prof. Dr. Ing – habil. Detlev Aigner, TU Dresden GERMANY
prof. Ing. Ilja Vyskot, CSc., Mendel University in Brno, CZECH REPUBLIC
prof. Ing. Matúš Jakubis, Ph.D., TU Zvolen SLOVAK REPUBLIC
doc. Ing. Martina Zeleňáková, Ph.D., TU Košice SLOVAK REPUBLIC
doc. dr. sc. Tibor Pentek, Zagreb University, Zagreb, CROATIA
dr. Zoltán Gribovszki, Ph.D., Faculty of Forestry, University of West Hungary, Szopron, HUNGARY
doc. Ing. Petr Hrůza, Ph.D., Mendel University in Brno, CZECH REPUBLIC
Executive editor
Ing. Jitka Fialová, MSc., Ph.D., Mendel University in Brno, CZECH REPUBLIC
Periodicity:
Two issues of journal are published annually
Editor's Office:
Mendel University in Brno, Faculty of Forestry and Wood Technology, Department of Landscape Management, Zemědělská 3, 613 00 Brno, Czech Republic
Contact:
Ing. Jitka Fialová, MSc., Ph.D.; Mendel University in Brno, Faculty of Forestry and Wood Technology, Department of Landscape Management, Zemědělská 3, 613 00 Brno, Czech Republic
Tel: +420 545 134 096, email: [email protected]; www: http://www.utok.cz/node/129
MK ČR E 19342
The journal was in 2014 added to the list of non-impact peer-reviewed journals published in the Czech Republic.
ISSN 1804-2821

Journal of Landscape Management (2020) Vol.: 11 / No. 1
Contents:
Case study on groundwater flooding: the lower part of the Rye Island
Michaela Červeňanská, Dana Baroková, Andrej Šoltész ........................................................ 7
Impact of variable intensity of hydropeaking on river morphodynamics
Daniel Buček, Peter Šulek, Peter Dušička, Martin Orfánus ................................................... 12
Using a combined 1D and 2D hydrodynamic model to simulate the flood of Bratislava
Martin Orfánus, Jerguš Baďura ............................................................................................ 18
Physical Modeling of Energy Dissipation Downstream the Hričov Weir
Martin Pavúček, Ján Rumann ............................................................................................... 25
Assessment of the dry periods on the small stream in the western part of Slovakia
Andrej Šoltész, Lea Čubanová, Jakub Mydla ....................................................................... 31
Selected reasons of the watercourse revitalization (comparison with dams – for
example Hulin)
Miloslav Šlezingr .................................................................................................................. 37

Journal of Landscape Management (2020) Vol.: 11 / No. 1

Journal of Landscape Management (2020) Vol.: 11 / No. 1
Original research paper
7
Case study on groundwater flooding: the lower part of the Rye Island
Michaela Červeňanská, Dana Baroková, Andrej Šoltész Abstract During the flood situations in May and June 2010, the groundwater rose, causing major problems, e.g. flooded cellars and underground spaces (garages), contaminated drinking water in wells, flooded railways and farmlands. In the lower part of the Rye Island, the Váh River and the Danube River culminated at about the same time causing the groundwater level rising, in some boreholes even to their maximum measured levels. The article presents results of a research concentrating on the groundwater flooding phenomena in the lower part of the Rye Island, especially on a construction of the flood hazard maps based on the preliminary flood risk assessment for the whole territory of the Rye Island. The problem was solved using a MODFLOW numerical model using the Groundwater Modeling System (GMS) and concentrated mainly on the previously mentioned flood in 2010. Key words: flood hazard maps, GMS, groundwater flooding, MODFLOW, numerical modelling, Rye Island Introduction Floods that occurred in Slovakia in May and June 2010 were exceptional from a hydrological point of view. Due to the meteorological situation in April and May, flood situations occurred simultaneously in almost all river basins. Due to the saturation of the river basins from previous precipitation and their repetition, the retention capacity of river basins was very limited. The groundwater rose, causing major problems. These devastating,
almost widespread floods caused the ruptures of dykes, road-washing, landslides, the destruction of bridges, the demolition of houses or their partial destruction, flooded cellars and underground spaces (garages), contaminated drinking water in wells, flooded railways and farmlands. Five people lost their lives, and more than sixty were injured. Thousands lost their homes (Blahová et al., 2010).
Fig. 1: The course of water level at the gauging station 6775 Kolárovo (with the designation of the
degree of flood activity, DFA) and the course of the groundwater levels in breholes no. 630 and 2628 in Kolárovo; daily total precipitation in the rain gauging station 17720 Dedina Mládeže – hydrological
year 2010 (SHMI, 2020)

Journal of Landscape Management (2020) Vol.: 11 / No. 1
8
In the second half of May 2010, significant increases in water levels were recorded in the lower part of the Váh River (Fig. 1, Fig. 2), when the water level in Kolárovo reached the level of the 2nd degree of flood activity (Fig. 1). The next flood episode happened from June 2 to 7. The culmination in Kolárovo took place in the night of June 6-7 at a level corresponding to the 3rd degree of flood activity. In addition, the high water level appeared in the Danube River (Fig. 2) as well. Almost 50-year flood discharge was achieved in Komárno on the Danube River what contributed to the increase in water levels in the lower part of the Váh River. The Váh River in Kolárovo and the Danube River in Komárno culminated at about the same time (Blahová et al., 2010). In the area of the lower part of the Rye Island, a gradual rise in the groundwater level has been recorded since the beginning of the hydrological year 2010 (Fig. 1), with a maximum groundwater level at the beginning of June. The groundwater level has been falling since the end of June with fluctuating increases in August and September. The reason was, on one hand, the exceptionally high precipitation totals recorded in May and June, as well as the high water inflow from the Nitra River and the Little Danube River (Fig. 2) and high water levels on the Danube River (SHMI, 2010). In some groundwater level observation boreholes the maximum measured groundwater levels were exceeded in 2010, while in others the measured heads approached the maximum levels observed for the entire observation period (SHMI, 2020).
Materials and Methods The problem of groundwater flooding on the lower part of the Rye Island, respectively a construction of the flood hazard maps, was solved by a MODFLOW (Harbaugh et al., 2000) numerical model developed with the Groundwater Modelling System (GMS) (Aquaveo, 2019). The study was a part of a dissertation thesis developed at the Department of Hydraulic Engineering of the Slovak University of Technology in Bratislava. An area for which the numerical model was constructed, was selected on the basis of the preliminary flood risk assessment for the whole territory of the Rye Island (Fig. 2). The preliminary assessment of the groundwater flood risk was based on the groundwater levels measured using the data in boreholes of the State Groundwater Quantity Monitoring Network of the Slovak Hydrometeorological Institute (SHMI). Data on the maximum measured groundwater levels from the beginning of the observation to the end of the hydrological year 2018 were evaluated in 176 boreholes (SHMI, 2018) located in the intergranular groundwater body of Quaternary sediments of the Danubian Basin in the Váh watershed area (SK1000300P) (Fig. 2), to which the Rye Island belongs. Investigation of the measured groundwater levels identify the hydrological year 2010 as the year with the highest frequency of occurrence of the maxima. Therefore, numerical modelling focused on this year as one of the possible scenarios with negative impacts of rising groundwater levels.
Fig. 2: The maximum measured groundwater levels in the intergranular groundwater body of Quaternary sediments of the Danubian Basin in the Váh watershed area (SK1000300P) until 2018 and
their position in relation to the terrain

Journal of Landscape Management (2020) Vol.: 11 / No. 1
9
The studied part of the Rye Island is the area, in which negative phenomena caused by rising groundwater levels can be expected. It is therefore the area in which the groundwater levels are at a shallow depth below the surface and which can be delimited by natural, geological or hydrological boundaries. The investigated area is bordered (Fig. 3) on the north by the Chotárny channel, on the west and southwest by the Komárno channel, on the east by the Váh River and on the northeast by the Little Danube River. Geological and hydrogeological characteristics of the area of interest were taken into consideration from the final reports and assessments of the Geofond archive of the State Geological Institute of Dionýz Štúr (SGIDŠ). Data on measured groundwater levels, as well as on water levels in rivers, and on the total precipitation in the solved locality, were provided by SHMI (SHMI, 2020). Water levels in the channel system and at pumping stations, as well as operation rules of each pumping station located in the area of interest, were
provided by the Slovak Water Management Enterprise (SWME, 2020). The creation of a steady-state numerical model and its subsequent calibration was performed:
• for the hydrological year 2008, specifically for the mean value of hydrological parameters in this hydrological year. The reason for choosing this period is that the hydrological year 2008 was “average” in terms of precipitation (100 to 109% of the long-term normal) for the regions of western Slovakia (SHMI, 2008).;
• for relatively steady state before the flood in 2010 – for the mean value of the hydrological parameters in the period from November 2009 to March 2010 (Fig. 1). This model served as an initial condition for the numerical model of an unsteady solution.
The unsteady state model simulates the period from April 2010 to February 2011.
Fig. 3: Map of calculated piezometric groundwater head for 7th June 2010 [m a.s.l.] (Δ - flooded area)

Journal of Landscape Management (2020) Vol.: 11 / No. 1
10
Fig. 4: Map showing the depth of the groundwater level under the terrain [m b.g.s.]
Results and Discussion Fig. 3 captures the contours of the calculated piezometric groundwater head for June 7, 2010 during the second flood wave culmination of the Váh River in Kolárovo and the culmination of the Danube River in Komárno at the same time. As can be seen in this figure, a large part of the area was either waterlogged, in the extreme case even flooded due to rising groundwater level, what can cause problems for buildings (and especially their foundations), civil structures (a major problem is caused by flooded sewage treatment plants), and this may also have a negative impact on agricultural production. To illustrate the depth of the calculated groundwater level under the terrain, Fig. 4 was constructed. In addition to flooded areas (with a negative value of the depth), it is also possible to see the depths of the groundwater level under the terrain in the following intervals: 0.00 - 0.80; 0.80 - 2.00; 2.00 - 3.00; 3.00 and more. The value 0.80 was not selected
randomly, it represents the average depth of freezing in Slovakia (STN 73 1001). It is therefore the depth in which the foundations of non-basement buildings are located. Conclusion The article presents results of a research concentrating on the groundwater flooding phenomena in the lower part of the Rye Island, especially on the construction of the flood hazard maps using the numerical model approach. The investigated area was chosen on the basis of the preliminary flood risk assessment for the whole territory of the Rye Island. The modelling step concentrated mainly on the flood situation in 2010 when the exceptionally high precipitation totals were recorded in May and June, as well as the high water inflow from the Nitra River and the Little Danube River and high water levels on the Danube River, causing a gradual rise in the groundwater level.

Journal of Landscape Management (2020) Vol.: 11 / No. 1
11
The flood hazard map which shows the flooded area is illustrated in Fig. 3. As it can be seen, a large part of the area of interest was flooded due to rising groundwater level. This can have a lot of negative impacts, e.g. for the agricultural production, or even flooding of sewage treatment plants and contamination of drinking water in wells. To show the depth of the groundwater level under the terrain, Fig. 4 was constructed. Besides the flooded areas, it can be also seen the waterlogged areas where groundwater is at the depth less than 0.80 m. This value represents the mean depth of freezing in Slovakia, so the presence of groundwater at this depth can cause problems for buildings, especially their foundations. Taking building with basements into account, also the occurrence of groundwater in the depths of 0.80 to 3.0 can be problematic. References Aquaveo (2019). Groundwater Modeling System. Available on the Internet: <https://www.aquaveo.com/software/gms-groundwater-modeling-system-introduction>. Blahová, A. et al. (2010). Flood situation on the rivers of western Slovakia in May and June 2010. Bratislava: SHMI, 96 p. Harbauhg, A. W., Banta, E. R., Hill, M. C.. MODFLOW-2000, The U.S. Geological Survey Modular Ground-Water Model - User Guide to Modularization Concepts and the Ground-Water Flow Process. Reston, Virginia: U.S. Gological Survey, 130 p. SGIDŠ. Final reports and reviews of the Geofond archive from the digital archive. Available on the Internet: <https://www.geology.sk/sluzby/digitalny-archiv/>. SHMI (2020). Data provided for the purpose of preparing the final thesis. SHMI (2008). Evaluation of the hydrological year 2008. Available on the Internet: http://www.shmu.sk/File/Hydrologia/Monitoring_PV_PzV/Monitoring_kvantity_PzV/KnPzV_2008/KnPzV_2008_hodnotenie.pdf. SHMI (2010). Evaluation of the hydrological year 2010. Available on the Internet: http://www.shmu.sk/File/Hydrologia/Monitoring_PV_PzV/Monitoring_kvantity_PzV/KnPzV_2010/KnPzV_2010_hodnotenie.pdf. SHMI (2018): Hydrological yearbook. Groundwater. STN 73 1001 Geotechnical structures. Foundation of buildings (in Slovak). SWME (2020): Data provided for the purpose of preparing the final thesis.
Acknowledgement The contribution was developed within the frame and based on the financial support of the APVV-19-0383 project “Natural and technical measures oriented to water retention in sub-mountain watersheds of Slovakia” as well as VEGA project No. 1/0800/17. Author’s contact: Ing. Michaela Červeňanská, PhD. Department of Hydraulic Engineering, Faculty of Civil Engineering, Slovak University of Technology in Bratislava Radlinského 11, 810 05 Bratislava, Slovak Republic Phone: +421 2 32 888 563 E-mail: [email protected]

Journal of Landscape Management (2020) Vol.: 11 / No. 1
Original research paper
12
Impact of variable intensity of hydropeaking on river morphodynamics
Daniel Buček, Peter Šulek, Peter Dušička, Martin Orfánus
Abstract Hydropower plants may cause frequent flow fluctuations – hydropeaking, in order to meet the demands of the power grid. This study examines the short-term impact of hydropeaking on sediment transport using numerical morphodynamic model. Calibrated morphodynamic model is subjected to six hydropeaking scenarios. All scenarios are designed to be limited by operational bounds of the considered hydropower plant with minimum discharge of 1250 m3/s and maximum discharge of 2750 m3/s. The studied variable of the model is the intensity of hydropeaking. In the evaluation phase the cumulative bedload volume is calculated for each scenario. The differences of transported volumes for considered hydropeaking scenarios are found to be within the margin of error of ca. 3% from the average value and therefore considered negligible. Key words: Danube, hydropeaking, sediment transport, 2D hydrodynamic model
Introduction The subject of this work is the study of the short-term impacts of hydropower plant operation on the sediment flow regime. The area of interest is the Slovak-Hungarian part of the river Danube downstream of the Hydropower plant Gabčíkovo from km 1810 to km 1792 (Sap - Klížska Nemá). This section well represents typical problems associated with disrupting the alluvial flow by a hydropower plant where the continuity of the sediment movement by the built dam is interrupted (Summer, 1994) (Csiki, 2010). Medium- to long-term morphological changes of the river section of interest caused by the construction of the Gabčíkovo Waterworks are well documented in (Holubová, 2015) or (Török, 2017). During the first 10 years after the Gabčíkovo Waterworks was put into operation in 1992, the most dynamic changes occurred in the river section Sap - Medveďov and subsequently downstream of Medveďov. The riverbed of the Danube deepened by about 4-5 m during that period and from km 1798 to km 1780 developed several meters high deposits (Holubová, 2015). The current course of the Danube riverbed indicates a continuing decrease in slope in the upper, more dynamic section (Sap - Gönyü). This trend may have an adverse effect on groundwater levels and is already adversely affecting navigational conditions (Holubová, 2015). The North-Transdanubian Water Directorate in Hungary performs regular measurements of the amount of
transported sediments in the cross section of the Medveďov Bridge (km 1806). From 1998 to 2015, it performed 66 measurements at various flow rates. The analysis of the amount of transported sediments showed a decrease of 94% of the transport of sediments. Based on these findings, there is a presumption that the riverbed morphology has stabilized in the section Gabčíkovo - Medveďov (Török, 2017). Decreasing trend of sediment transport in this river section was also recorded by Holubová (Holubová, 2015) independent of the Török study (Török, 2017). Milder morphological changes are expected in the future, for instance slow bank erosion, particularly during flood events, accompanied by a slight riverbed aggradation (Török, 2017). The primary source of the change of the riverbed morphology aside from natural flooding will be the transformed discharge from Gabčíkovo Waterworks. The hydropower plant Gabčíkovo, as a part of the Gabčíkovo - Nagymaros waterworks, was originally designed as peaking power plant, with the capacity to compensate for the sudden demands in the power grid. Yet since its launch in 1992, it has been operating as a run-off-river hydropower plant. The hydropower plant is designed to transform flowrates of up to 5040 m³.s-1 on sub-daily to hourly scale. Material and methods In order to study the bed load transport a commercial 2D depth averaged numerical flow model with sediment transport module - Mike 21 FM(ST) is used. The

Journal of Landscape Management (2020) Vol.: 11 / No. 1
13
mathematical formulation of the model is not the subject of this study - it is described in detail in the scientific documentation of the model (DHI, 2017). The modelled section has a total length of ca. 18 km and consists of ~ 82,000 elements. It is a part of larger, calibrated hydrodynamic numerical model specifically developed for River Information Services (Mišík, 2017). The hydraulic roughness is determined independently during hydraulic calibration prior any sediment simulation took place (Fig. 1). Grain size distribution of the bed load material is the essential input data for a sediment transport model.
An extensive project of riverbed material sampling was performed in 2014. Bed material samples were taken in a total of 56 locations along the Danube River channel. They were subsequently processed by the sieving method in the hydraulic laboratory of the Water Research Institute in Slovakia. Sampling was carried out from the boat using a cylindrical sampler. In the studied section km 1810 - 1792, the bottom material is very well sorted. It consists mainly of fine to coarse gravel with a predominantly uniform median grainsize ranging from 7.3 mm to 14.4 mm (Lukáč, 2017).
Fig. 1: Detail of roughness map of the river section of interest
Sediment transport rate is solved using a 2D hydrodynamic flow model Mike 21 ST (Sand Transport) code, which calculates the transport of non-cohesive materials. Mike 21 ST code is equipped with several sediment transport formulas (Engelund and Hansen (1967), Van Rijn (1984), Engelund and Fredsøe (1976), Meyer-Peter-Müller (1948)) (Engelund, 1967) (DHI, 2017). Each of them suited for different type of alluvial river. The considered model uses the classic Peter-Meyer-Müller relationship,
which is well suited for studied river section. This relationship is derived from river systems with slopes ranging from 0.0004 to 0.02 and dominating bed load over suspended sediment in regard morphodynamic development. Meyer-Peter-Müller establishes a relationship of dimensionless sediment transport Φ to the dimensionless shear stress applied to the bottom material by:
expressed as intensity of sediment transport:

Journal of Landscape Management (2020) Vol.: 11 / No. 1
14
Where θ' is the roughness-dependent part of Shields parameter [-]; θc is the critical Shields parameter [-]; Φbl is the dimensionless sediment transport [-]; Sbl is the sediment transport [m2/s]; s is the specific weight [-]; g is the gravitational constant [m/s²]; d50 is the median grain size [mm]. The uncertainty of the numerical models can be minimized if measured data are available for calibration and verification. Calibration is the adjustment of model parameters in order to produce results comparable with measured values. Subsequent verification of the model consists of comparing the results of the calibrated with different measurements. It is therefore optimal to dispose of two sets of measurements. In that case, good quality results can be achieved. Even if reliable verification data is not available, numerical models can provide useful qualitative data. For example, they can be used to assess the morphological effects of different scenarios, where the amplitude of change and/or trend is critical. Sediment data for calibration are usually rare, requiring modeler to make assumptions and evaluate the sensitivity and uncertainty of these assumptions throughout the modelling process. The studied section of Danube River benefits from several studies (Holubová, 2015), (Török, 2017), (Holubová, 2004) and (Camenen, 2011). Bedload measurements were taken throughout single river cross section at km 1795.58 for discharges ranging from 972 m³.s-1 to 4745 m³.s-1 (in six verticals during a total of 71 campaigns). Samples were collected using a basket-type bedload sampler with a mesh size of 3 mm and a trapping efficiency of 0.7. Each bedload value represents an average of 10 repeated measurements to minimize the error due to temporal fluctuation in bed load rate (Camenen, 2011). Bedload data originating from this study provide extensive foundation for proper calibration of a
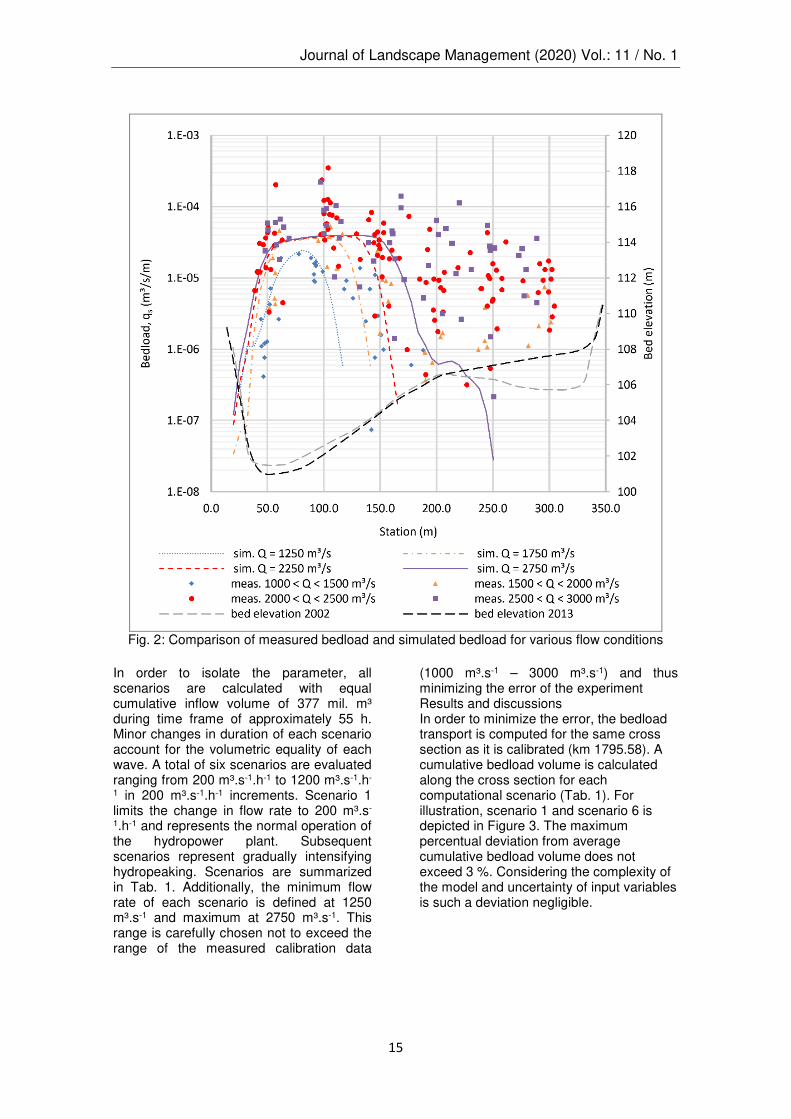
morphodynamic model of studied river section. Calibration parameters are selected by assessing relative sensitivity and uncertainty of each model input. Hydraulic roughness belongs to the category of high sensitivity, but low uncertainty. Proper calibration parameters should be high in sensitivity and uncertainty (Gibson, 2017). Median grain size meets both requirements. Small error in median grainsize can result in large error in transport rate. With median grain size of 8 mm a reasonable agreement of the model with measurements is achieved. Measured median grain size in studied river section ranges from 7.3 mm to 14.4 mm (Lukáč, 2017). Comparison of measured bedload and simulated bedload of calibrated model is depicted in Fig. 2. It has to be noted that the simulated bedload near the right bank is significantly lower than the measured bedload. This can be attributed to shift of flow paths due to point bar formation on the right side of the river channel, which developed sometime between years 2002 and 2013. There can be identified ca. 2 m riverbed elevation difference near right riverbank can be identified in Fig. 2. Most of the discharge is concentrated in the zone of highest flow depth (station 50 m - 150 m). For this reason, the measurement values from station 50 m to 150 m are considered as more decisive during the calibration process.
In order to study the short-term impact of hydropeaking on sediment transport, the calibrated model is subjected to various hydropeaking scenarios. The regulatory aspect of the hydropower plant is represented by the change in flow rate over time. The studied parameter is the ramp-up and ramp-down intensity of both ascending and descending arm of each hydro peak fluctuation of the hydrogram expressed in m³.s-1.h-1.
Journal of Landscape Management (2020) Vol.: 11 / No. 1
15
Fig. 2: Comparison of measured bedload and simulated bedload for various flow conditions
In order to isolate the parameter, all scenarios are calculated with equal cumulative inflow volume of 377 mil. m³ during time frame of approximately 55 h. Minor changes in duration of each scenario account for the volumetric equality of each wave. A total of six scenarios are evaluated ranging from 200 m³.s-1.h-1 to 1200 m³.s-1.h-
1 in 200 m³.s-1.h-1 increments. Scenario 1 limits the change in flow rate to 200 m³.s-
1.h-1 and represents the normal operation of the hydropower plant. Subsequent scenarios represent gradually intensifying hydropeaking. Scenarios are summarized in Tab. 1. Additionally, the minimum flow rate of each scenario is defined at 1250 m³.s-1 and maximum at 2750 m³.s-1. This range is carefully chosen not to exceed the range of the measured calibration data
(1000 m³.s-1 – 3000 m³.s-1) and thus minimizing the error of the experiment Results and discussions In order to minimize the error, the bedload transport is computed for the same cross section as it is calibrated (km 1795.58). A cumulative bedload volume is calculated along the cross section for each computational scenario (Tab. 1). For illustration, scenario 1 and scenario 6 is depicted in Figure 3. The maximum percentual deviation from average cumulative bedload volume does not exceed 3 %. Considering the complexity of the model and uncertainty of input variables is such a deviation negligible.

Journal of Landscape Management (2020) Vol.: 11 / No. 1
16
Tab. 1: Summary of experimental scenarios and their parameters
Conclusions In order to study the short-term impact of transformed flow rates on sediment transport downstream of hydropower plant, a numerical model is created and calibrated. Subsequently the calibrated morphodynamic model is subjected to six hydropeaking scenarios. All scenarios are designed to be bound by operational bounds of considered hydropower plant Gabčíkovo. The intensity of hydropeaking is represented by the change in flow rate over time. In the evaluation phase, the total volume of bedload calculated for river cross section at km 1795.58 is compared for each scenario. Computed transported bedload volumes are for all scenarios near identical. Based on this study, the variable intensity
of hydropeaking of hydropower plant 23.42 km upstream of the studied river section would have negligible effect on the bedload transport. Acknowledgments This article was created with the support of the Ministry of Education, Science, Research and Sport of the Slovak Republic within the Slovak Research and Development Agency, project no. APVV-18-0472. This paper was supported by the Grant agency VEGA under contract No. 1/0361/17. References Holubová K., Čomaj M., Lukáč M.,
Scenario Hydropeaking intensity
Computed cumulative bedload volume
(m³.s-1.h-1) (m³)
1 200 1514.7
2 400 1530.3
3 600 1537.0 4 800 1504.2 5 1000 1502.0
6 1200 1503.4
Fig. 3: Scenario 1 and 6 with corresponding cumulative bedload volume

Journal of Landscape Management (2020) Vol.: 11 / No. 1
17
Mravcová K., Capeková Z., Antalová M., Danube floodplain rehabilitation to improve flood protection and enhance the ecological values of the river in section between Sap and Szob, Final report of the Slovak partners, Project Reg. Nr. HUSK/1001/2.1.2/0060, Bratislava: Water Research Institute, 2015 Török G. T., Baranya S. Morphological investigation of a critical reach of the upper Hungarian Danube, Periodica Polytechnica, Civil Engineering, Vol. 61, No. 4, 2017, pp. 752‒761 Summer W., Stritzinger W., Zhang W. The impact of run-of-river hydropower plants on the temporal suspended sediment transport behavior, Proceedings of the Canberra Symposium, Canberra, Australia, 12-16 December 1994, pp. 411‒419 Csiki S., Rhoads B. L. Hydraulic and geomorphological effects of run-of-river dams, Progress in Physical Geography: Earth and Environment, Vol. 34, No. 6, 2010, pp. 755–780 MIKE 21 Flow Model FM, Flood screening tool, Hydrodynamic module, Scientific documentation, 2017 Mišík M., Vanecek S., Stoklasa J., Kučera M., Gasc A., Implementation of river information services in Europe, Springer, SimHydro 2017 – Choosing the Right Model in Applied Hydraulics, 2017, pp. 373 – 380 Lukáč M., Holubová K., Numerical modelling of the Danube river channel morphological development at the Slovak - Hungarian river section, River Sedimentation: Proceedings of the 13th International Symposium on River Sedimentation, Stuttgart, Germany, 19-22 September 2017, pp. 682-689 MIKE 21 & MIKE 3 Flow Model FM, Sand transport module, Scientific documentation, 2017 Engelund F., Hansen E., A monograph on sediment transport in alluvial streams, Hydraulic Engineering Reports, TEKNISKFORLAG Skelbrekgade 4 Copenhagen V, Denmark, 1 January 1967 Van Rijn L. C., Sediment Transport, Part I: Bed Load Transport, Journal of Hydraulic Engineering, Vol 110, No. 10, October 1984, pp. 1431-1456 Engelund F., Fredsoe J., A Sediment Transport Model for Straight Alluvial Channels, Hydrology Research an International Journal, Vol. 7, No. 5, 1 October 1976, pp. 293-306
Meyer-Peter E., Muller R., Formulas for Bed Load Transport, Proceedings of 2nd meeting of the International Association for Hydraulic Structures Research, Delft, 7 June 1948, pp. 39-64 Gibson S., Comport B., Corum Z. Calibrating a sediment transport model through a gravel-sand transition: Avoiding equifinality errors in HEC-RAS models of the Puyallup and White Rivers, World Environmental and Water Resources Congress, Sacramento, California, USA, 21-25 May 2017, pp. 179‒191 Holubová K., Capeková Z., Szolgay J. Impact of hydropower schemes at bedload regime and channel morphology of the Danube River, River Flow, 2004 Camenen B., Holubová K., Lukáč M., Le Coz J., Paquier A. Assessment of methods used in 1D models for computing bedload transport in a large river: the Danube River in Slovakia, Journal of Hydraulic Engineering, Vol. 137, No. 10, 2011, pp. 1190‒1199 Author’s contact: Slovak University of Technology in Bratislava, Faculty of Civil Engineering, Department of Hydraulic Engineering, Radlinského 11, 810 05 Bratislava, Slovak Republic, +421 2 32 888 336, [email protected]
Journal of Landscape Management (2020) Vol.: 11 / No. 1
Original research paper
18
Using a combined 1D and 2D hydrodynamic model to simulate the flood of Bratislava
Martin Orfánus, Jerguš Baďura
Abstract The aim of the contribution is to simulate procedure of flood modeling of urban areas. Flood modeling of urban areas introduces certain specifics compare to ordinary flood modeling of river reaches. For reaching accurate results it is often necessary to model in detail e.g. influence of buildings, streets, fences, open channels, sometimes also sewer systems. Extent of modeled area is often large and may include whole town and also its surroundings. This example shows flooding plain of Bratislava with the reason for rupture of mobile coverage. Model is combined which means that it contains specifics of 1D modeling and 2D modeling. The aim of the contribution is to show potential impact on urban area after breach of mobile flood protection. Results of modeling are shown in last part of the work. Key words: Mathematical modeling, Flood, Flood protection, Urban area
Introduction The territory is the historical part of the center of Bratislava. The city was hit by major floods in 1991 and then in 1997, after which it began to seriously consider the extent to which Bratislava needed to be protected. In 2002, the city's inhabitants hit another major flood. This has resulted in accelerating the overall decision-making process and building flood protection. Fortunately, the flood did not require any human sacrifice, but the damage to the property was estimated at over 5 million € at he most affected Old Town district and its historical part of the city center. Between 2007 and 2010, the city took action to implement flood control measures not only on the Danube River but also on the Morava River. Total costs of flood protection in Bratislava climbed to more than 30 mil. € of which the Slovak government contributed almost 5 mil. € and the remainder was funded through the Cohesion Fund of the European Union. The flood protection consisted of more than 180 structures in the Danube and Moravia. It has been joined to the rise of the levees, the construction of the underground walls, the mobile protection and many others. Bratislava paid the investment because
already in June 2013 the city flood, which was estimated in terms of maximum flow 3rd largest in history. It has proved to be a very advantageous use of mobile protection, especially on the left bank of the river, where the historical center of the city is situated. Instead of the floodplains that would have to be built too high and would spoil the city's skyline, the foundation for mobilization was built. After the flood risk was declared, the relevant commission decided to increase the crest level by mobile portions. Mobile protection has ultimately proven to be a decisive solution for protecting the urban area. Mobile protection was built under Action 2 of the Bratislava-flood protection project. This task was to solve the problems in the river section from the station rkm 1868,140 - 1869,100 Old Bridge - New Bridge (left bank). The protection was designed to flow in the Danube Q1000 = 13,500 m3 / s + 0,50 m backup. The design level was set at 139.85 m. up to 140.45 m. and a protection dimension of 140.35 m. up to 140.95 m. in the longitudinal slope. The total length of the protective line is 1016 m. The protective line was designed at two levels of height. flood protection [1].

Journal of Landscape Management (2020) Vol.: 11 / No. 1
19
Fig. 1: Mobile flood protection
Material and methods The role of the practical part of this work is to create a hydrodynamic model of water flow during the flood with the HEC-RAS hydraulic software and to analyze its consequences if a mobile breach on the left bank of the Danube River in Bratislava during the flood wave culmination.
Fig.2: Modeled area (Old town of Bratislava)
Fig.2: Area of flooding source (left corner)
Journal of Landscape Management (2020) Vol.: 11 / No. 1
20
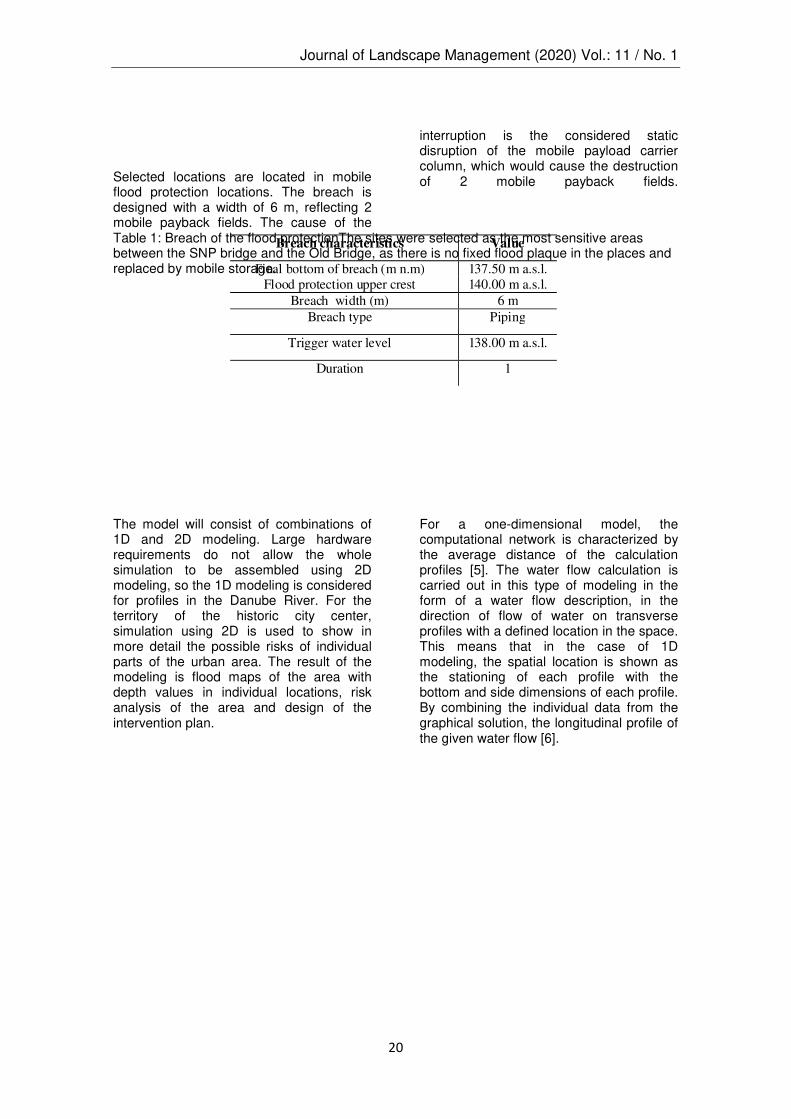
Selected locations are located in mobile flood protection locations. The breach is designed with a width of 6 m, reflecting 2 mobile payback fields. The cause of the
interruption is the considered static disruption of the mobile payload carrier column, which would cause the destruction of 2 mobile payback fields.
Table 1: Breach of the flood protectionThe sites were selected as the most sensitive areas between the SNP bridge and the Old Bridge, as there is no fixed flood plaque in the places and replaced by mobile storage.
Breach characteristics Value
Final bottom of breach (m n.m) 137.50 m a.s.l. Flood protection upper crest 140.00 m a.s.l.
Breach width (m) 6 m
Breach type Piping
Trigger water level 138.00 m a.s.l.
Duration 1
The model will consist of combinations of 1D and 2D modeling. Large hardware requirements do not allow the whole simulation to be assembled using 2D modeling, so the 1D modeling is considered for profiles in the Danube River. For the territory of the historic city center, simulation using 2D is used to show in more detail the possible risks of individual parts of the urban area. The result of the modeling is flood maps of the area with depth values in individual locations, risk analysis of the area and design of the intervention plan.
For a one-dimensional model, the computational network is characterized by the average distance of the calculation profiles [5]. The water flow calculation is carried out in this type of modeling in the form of a water flow description, in the direction of flow of water on transverse profiles with a defined location in the space. This means that in the case of 1D modeling, the spatial location is shown as the stationing of each profile with the bottom and side dimensions of each profile. By combining the individual data from the graphical solution, the longitudinal profile of the given water flow [6].

Journal of Landscape Management (2020) Vol.: 11 / No. 1
21
Fig.3: Hydrograph
The transition from 1D modeling of free surface flow of free water to 2D mathematical modeling allows us to get a better quality class. Flexible computing allows us to concentrate on important areas (line structures, populated areas, etc.) where we either need more accurate results or expect rapid changes in water flow. The flexible computing network is ideal for less important areas (the edge of the calculation element should be larger - 50-100 m) and the important regions (the edge of the element is in the order of dozens of meters). 2D modeling gives us spatially localized modeling results (height of the level in the model element, components of the average depth averaged velocities in the model element.
The river is usually the main source of floods in the city. The flow through is often included in the 2D city model, but this is not a prerequisite. The riverbed is often also modeled using a 1D model, and the detailed 2D model then covers only the out-of-river area. Such a 1D and 2D modeling has its advantages but also a lot of unknowns. The river bed is contained in a 2D model - the shape of the model's network model is adapted to the channel path. In the case of
an unstructured computation network composed of triangular and quadrangular elements, it is advisable for the riverbed to be covered with quadrangular elements oriented with a longer dimension in the direction of flow. Proper computer network layout can reduce the number of computational cells in the model and allow for a more time-consuming calculation, helping to reduce calculation times and hence streamline the financial simplicity of simulations. Covered sections of smaller streams are often found in cities. These can be modeled as closed profiles using a 1D model, similar to sewerage. Flow rates that exceed the capacities of the covered flow sections flow across the surface and model with a 2D model [7]. The river bed is not included in the 2D model - the trough can be contained in a separate 1D model. The modeling results for the 1D region are then used as inputs or as boundary conditions for the 2D region. Results and discussion For the area of area of interest, there is a critical presence of several important buildings in the vicinity of the breach. Among the most important are buildings such as the Slovak National Gallery, the

Journal of Landscape Management (2020) Vol.: 11 / No. 1
22
Slovak National Museum and the historical building of the Slovak National Theater, the Faculty of Law and many others. Flooding of buildings of this importance would cause a great deal of problems not only because of the threats to the buildings themselves but also the risk of deterioration of the exhibits and equipment of the interior parts of buildings. As can be seen in the figures below, the flood caused by the
breach of the spill over 90 minutes will flood the building of the Slovak National Gallery, the Slovak National Museum as well as the hotel buildings at the SNP Bridge.
Fig.4:1D model

Journal of Landscape Management (2020) Vol.: 11 / No. 1
23
Fig.5: Map of depths in time
The flood of hotel buildings is the biggest issue because of the existence of underground garages in these buildings. What matters is the substitution of entrances to these garages in order to protect against water ingress. The water in 3 hours will flood streets like Vajanského nábrežie, Medena street, Fajnorovo nábrežie, Palackého a Rigeleho ul. After 4 hours, thestrteet Šafárikovo square is flooded and the water penetrates the Pribinova street.After 8 hours from the Rázusovo nábřeží, the water floods Eurovea shopping center buildings, the new building of the Slovak National Theater, the building of the Allianz insurance company and the remaining buildings on the Dostoevsky Street. After 24 hours the water flows up to the part of Mlynské Nivy. Gradual drying of the area can help rescue
components from draining water from areas. The average depth in the flooded area is 0.4 m. The average flow rate in the area reaches 0.2 m / s. The water level in the sprawling area ranges from 137.9 to 138.1 m. Acklnowledgement This paper was supported by the VEGA Grant agency under contract No. 1/0800/17 and by the Slovak Research and Development Agency under No. APVV-19-0383. References Ghanem A., Steffler P., Hicks F., Katopodis C., Two-Dimensional Simulation of Physical Habitat Conditions in Flowing Streams, 1996

Journal of Landscape Management (2020) Vol.: 11 / No. 1
24
Habersack H., Hengl M., Huber B., Lalk P., Tritthart M., Fließgewässermodellierung – Arbeitsbehelf Feststofftransport und Gewässermorphologie, 2011 Holubová K., Slovensko-rakúsky úsek Moravy - Morfologický vývoj vo vzťahu k revitalizácii rieky, 2010 Holubová K., Lukáč M., Čomaj M., Mravcová K., Čuban R., Polák V., Rebenda F., Hranková R., MoRe Štúdia uskutočniteľnosti, VÚVH, 2013 Kondolf M., Tools in Fluvial Geomorphology, 2003 Kwan S., River2DM user Guide, 2011 Možiešik Ľ., Šulek P., Orfánus M., Palkovičová A., Tóthová B., MreNa — Štúdia uskutočniteľnosti "Rekreačná plavba po rieke Morava, 2014 Steffler P., Blackburn J., Introduction to Depth Averaged Modeling and User's Manual, 2002 Tritthart M., Gutknecht, Three-Dimensional Simulation of Free-Surface Flows Using Polyhedral Finite Volumes, 2007
Author’s contact: Slovak University of Technology in Bratislava, Faculty of Civil Engineering, Department of Hydraulic Engineering, Radlinského 11, 810 05 Bratislava, Slovak Republic, +421 2 32 888 694, [email protected]

Journal of Landscape Management (2020) Vol.: 11 / No. 1
Original research paper
25
Physical Modeling of Energy Dissipation Downstream the Hričov Weir
Martin Pavúček, Ján Rumann
Abstract The weir of the Hričov water structure was built with an untypical shortened stilling basin. Due to the scour development caused by the basin, a rockfill embankment was constructed to prevent the formation of scours in the riverbed. The fortification is being eroded by increased flows at the weir and subsequently it is necessary to replenish the material back. The research of the Hričov weir and its new fortification was made in the flume at the hydraulic laboratory. A 2D model was created according to Froude’s modelling similarity. For the possibility to simulate scour creation the model consisted of the weir (control gate, spillway, stilling basin) and a part of the downstream riverbed created by gravel. The research examined several fortification designs, which were proposed to protect the downstream riverbed against scour development. The simulated flows were selected from the operational manual and represent extreme flow situations for different hydraulic phenomena – overflow, outflow and free overflow. After each flow simulation the parameters (depth, amount of the material carried away, and the deepest point) were measured. The results of modeling situations are shown in the paper. Key words: Energy dissipation, Hričov water structure, Scour, Stilling basin, physical hydraulic modeling
Introduction
Energy dissipation and scour development is closely associated with dimensions of the weir. In case of water overflow or outflow through the gates, there is almost always a relatively high specific flow rate. It requires a strong fortification of riverbed downstream, so that the safety of the weir itself is not endangered by the scouring effects in the riverbed. Dimensions of the downstream fortification are designed according to the character of the flow. Retroactively, the character of the flow can be affected by the shape and dimensions of downstream fortifications. The most common form of energy dissipator is the stilling basin. (Doležal, 1969) The design of the stilling basins may include expansions, drops, steps, blocks, baffles and sills. They are typically used to decrease the basin length and stabilize the jump toe position. Baffle blocks were investigated in submerged hydraulics jumps by (Habibzabeh, 2012). Stilling basin that was designed at the river-bed level was analyzed by (Raju, 1980) and baffle blocks and sills were used to force the hydraulic jump to the toe of the spillway. To minimize scour by using corrugated aprons which is the stilling basin with installed triangular sheets was investigated by (Ali, 2014). The original design of the stilling basin at the Hričov weir was planned with the depth of 1.85 m and the length of 41 m. However, due to the cost reduction, the size of the weir structure
was reduced (piers, stilling basin), where the dimensions of the stilling basin were 1,5 m in depth and 4 m in length (Fig. 1). After investigations on the shape of the toe of stilling basin a final shape has been designed which was leading the flowing water to a backwards circular motion, that moves the bed material back to the toe of the stilling basin. This flow design was intended to prevent the foundations from being exposed. The Hričov weir was put into operation in 1962. After the first flood, large scours were recorded, that reached up to the bedrock layer. Scours almost unveiled the foundations, what could cause disruption of the weir’s stability. Therefore, it was necessary to design a fortification which would eliminate the scour development. A temporary fortification made of heavy rock reinforced by a steel structure was constructed in the riverbed downstream just below the weir as a result of the investigations for a low-cost durable solution. But not even this could entirely prevent the formation of scours. After every flood situation on the weir the occurring scours in the riverbed need to be filled with material. Material and methods A two-dimensional physical model of the Hričov weir was created in the hydraulic laboratory. The model was fitted in a flume

Journal of Landscape Management (2020) Vol.: 11 / No. 1
26
(Fig. 2) as a section of one of four weir fields with twin radial gates that control the flow through the weir. To enable the simulations of scour creations and development, the downstream riverbed was created from a gravel material (grain size 2-5 mm). Froude’s modeling criterion was used in the design of the physical model. This criterion represents the dynamic similarity of the hydrodynamic phenomena effected by the exclusive action of gravitational forces. Different hydraulic phenomena were simulated on the model (outlet under the gate, overflow, dissipation of kinetic energy etc.), which are
mostly affected by gravitational force. The basic geometry scale of the model is 1:40. According to the Froude’s modeling criterion, the scales for other relevant physical quantities are as follows: flow rate 1:10 119; specific discharge 1:253, time 1:6.235 and velocity 1:6.235 (Dušička, 2018). The discharges at the model were based on the operational manual of the Hričov water structure and were considering different operational situations. For the purposed of the paper 3 different discharge scenarios were selected.
Fig. 1: Original and shortened dimensions of the Hričov weir
Fig. 2: The 2D physical model in flume at hydraulic laboratory
Every simulation and started with a leveled downstream riverbed and the flow simulation lasted 15 minutes of the model time. After each
simulation, the depths of the created scour were measured along the axis of the model

Journal of Landscape Management (2020) Vol.: 11 / No. 1
27
with a laser gauge used for a contactless measurement. Main parameters of the assessed scenarios are listed in Tab. 1. Different sizes and shapes of the riverbed fortifications and the secondary stilling basin were investigated (Fig. 3).
Basic dimensions of the fortifications are in (Tab. 2). Each of these designs were tested for the 3 selected simulation scenarios.
Tab. 1: Parameters of the simulation scenarios
Discharge Gates opened
Total discharge Flow type
[-] [m3.s-1]
Q1 4 1623.00 Outflow under lower segment
Q2 3 2450.00 Freefall over spillway
Q3 3 465.00 Overfall over upper segment
Tab. 2: Dimensions of the investigated fortifications
Depth [m] 0 0.9 1.8
Length [m]
11 IA - -
18 IB IIB IIIB
20 IC IIC IIIC
22 ID IID IIID
24 IE - -
Fig. 3: Scheme of the dimensions of the secondary stilling basin
Results
Results of the scour measurement for all investigated fortification designs were compared to the measurements of the base variant with no fortification of the riverbed. Every result of simulated scenarios was compared separately.
The simulation of discharge Q1 represents flood discharge which approaches maximum recorded flow at the Hričov weir. The discharge flows under the control gates with high kinetic energy causing severe load on the riverbed

Journal of Landscape Management (2020) Vol.: 11 / No. 1
28
resulting in large scour creation. The best effects on scour development reduction for this scenario were achieved for the variant with depth equal to 0m (flat desk). The scour was reduced up to 75% of the depth compared to riverbed without fortification. For other variants, the fortifications decreased the scours just to about 50% what was caused mostly by adding a secondary counter sill at the end of the fortification which pushed the flowing water to a secondary hydraulic jump and thus caused scouring behind the fortification. The simulation Q2 represents a 100-year flood discharge and has not yet been recorded at the Hričov weir. This discharge is considered as a catastrophic situation at the water structure, when severe problems at weir are to be expected. The control gates are fully opened and the discharge flows at high kinetic energy causing severe scouring and riverbed changes in entire riverbed not only in vicinity of the weir. The
scours in the riverbed were for this discharge very large. No significant improvement to the scour size was observed for the tested variants except the shifting of the scour away from the weir structure. The maximum decrease in scour size reached about 20% for the secondary stilling basin with depth of 1.8 m. The fortifications (h=0 m) of the riverbed decreased the size of the scour only by 10% in each discharge. The simulation of discharge Q3 represents maximum discharge overflowing the twin radial gates at an increased upstream water level and the use of only 3 weir field (asymmetric manipulation). In this case, the energy of the flowing water can be sufficiently dissipated with no significant scouring of the riverbed. The results of the measurements show for all investigated variants decreased scour depths by 80% based on the fortification (stilling basin) length. The results of the measurements are plotted in (Fig. 4, Fig. 5).
Fig. 4: Scour depths for simulated scenarios

Journal of Landscape Management (2020) Vol.: 11 / No. 1
29
Fig. 5: Relative scour volume for simulated scenarios
The graph shows that the longer fortification (secondary stilling basin) has positive impact on scours size decrease. The flat fortification (h=0 m) at the length of 22 m reduced the scour depth by 45%. Further elongation of the fortification had slightly better results, but the increase in not so significant. Other investigated variants reduced scours less than 20%.
As well as the depth of scour, the area of removed riverbed has decreased, too. It has reached more than 70%. The research showed that increasing the depth of the secondary stilling basin makes the scouring effects in the riverbed even worse. This is caused mostly by the counter sill of the secondary stilling basin, which vertically disturbs the flow in riverbed, increasing the turbulence downstream and thus increasing the scouring. Discussion The Hričov Water Structure is unique for its short stilling basin. Flow through the weir causes severe scouring in the riverbed downstream the weir. Heavy stone fortification was created to mend this problem, but it works
only partially and needs to be fixed after each flood situation. The flow conditions are affected by the relatively wide riverbed, high flows and relatively high-water level difference at the weir and are negatively influencing the scour development, when the short stilling basin cannot sufficiently dissipate the flow energy. Possible solutions to this problem are constructions of chute or baffle blocks in the existing stilling basin. Similar solution of energy dissipation was investigated by (Padulano et al. 2017), in their study the authors investigated the effects of the placement of chute blocks at the end of the spillway and at the end of the basin. However, this approach is usually only possible with classic long stilling basins, where the water energy can be sufficiently dissipated, and the blocks help just to make this process quicker. Another problem at the Hričov weir is the velocity of water flow, which is very high, and the blocks would probably be abraded soon and would not perform to their full function. Several types of fortifications were investigated by (Hager, 1990), who also extended the investigation to a jump with a control sill (Hager, 1992), but as

Journal of Landscape Management (2020) Vol.: 11 / No. 1
30
the investigation showed it was not suitable for the Hričov weir conditions. Presented research investigated 5 different lengths of the riverbed fortification (11, 18, 20, 22, 24 m) at 3 different depths (0, 0.9, 1.8 m) which were considered as realizable in current conditions and did not required any significant modifications of the existing structures of the weir. Overall, it was proved that the fortification length has a significant impact on the scour reduction. The fortification with the length of 22 m performed best, reducing the scour depth by 45% for the main test Q1. Increasing the depth of the stilling basin did not have significantly positive effects on scour reduction. For the extreme flood Q2, there was no significant improvement to the scour development except of shifting the scour position away from the weir by the length of the fortification (secondary stilling basin). For the Q3 all the tested variants performed similarly well. Acknowledgements This article was created with the support of the Ministry of Education, Science, Research and Sport of the Slovak Republic within the Slovak Research and Development Agency, project no. APVV-18-0472. References Ali, H. M., El Gendy, M. M., Mirdan, A. M. H., Ali, A. A. M., Abdelhaleem, F. S. F. (2014). Minimizing downstream scour due to submerged hydraulic jump using corrugated aprons, Ain Shams Engineering Journal, Vol. 5, No. 4, 2014, pp. 1059–1069. Doležal, L., Kijovský, A., Hubáček, Z. (1969). New method of stabilization of the riverbed behind the stilling basin and its use on the water structure in Hričov, (in Slovak), in New directions in river modifications (in Slovak), Ed. by Slovak Water Management Society (in Slovak), Bratislava, pp. 53‒73. Dušička, P., Orfánus, M., Rumann, J. (2018) Hydraulic research of stilling basin and riverbed on the Hričov WS, Report for the 2nd stage, (in Slovak), Department of Hydraulic, Faculty of Civil Engineering, The Slovak University of Technology in Bratislava, Bratislava. Habibzadeh, A., Loewen, M. R., Rajaratnam, N. (2012). Performance of baffle blocks in submerged hydraulic jumps, Journal of Hydraulic Engineering, Vol. 138, No. 10, pp. 902–908. Hager, W.H., Bremen, R., & Kawagoshi, N., (1990). Classical hydraulic jump: length of
roller, Journal of Hydraulic Research, Vol. 28, No. 5, pp. 591-608. Hager, W.H., Li, D., (1992). Sill-Controlled energy dissipator, Journal of Hydraulic Research, Vol. 30, No. 2, pp. 165-181. Padulano, R., Fecarotta, O., Del Giudice, G., Carravetta, A. (2017). Hydraulic design of a USBR type II stilling basin, Journal of Irrigation and Drainage Engineering Vol. 143, No. 5 [online], [cit. 01.04.2020]. Available: https://ascelibrary.org/doi/10.1061/%28ASCE%29IR.1943-4774.0001150 Raju, K. G. R., Kitaal, M. K., Verma, M. S., Ganeshan, V. R (1980). Analysis of flow over baffle blocks and end sills, Journal of Hydraulic Research, Vol. 18, No. 3, pp. 227–241.
Author’s contact: Slovak University of Technology in Bratislava, Faculty of Civil Engineering, Department of Hydraulic Engineering, Radlinského 11, 810 05 Bratislava, Slovak Republic, +421 2 32 888 322, [email protected], +421 2 32 888 340, [email protected]

Journal of Landscape Management (2020) Vol.: 11 / No. 1
Original research paper
31
Assessment of the dry periods on the small stream in the western part of Slovakia
Andrej Šoltész, Lea Čubanová, Jakub Mydla
Abstract In the context of climate change, the drought balance is coming to the forefront not only of water managers, but especially of people who use water and live close to water. The problems with the lack of water on the Gidra stream were solved by the citizens of the villages in the lower part of the stream, before the confluence with the Dolný Dudváh stream. The impact on water deficit here is not only caused by climatic and hydrological conditions, but also by several intakes into reservoirs and fisheries. The first step in solving the problem is the evaluation of hydrological data from the water gauging station for the monitored period 1961 – 2000, as well as for shorter periods of time in order to detect dry months during the year. Based on such a study it was possible then to design operation on the intake structures so as not to worsen the situation during the drought. Key words: Drought, Dry Month, Hydrological Data, M-daily Discharge Introduction Drought is a natural phenomenon caused by a lack of rainfall which consequently leads to a decrease in the amount of water in various parts of the hydrological cycle. If the amount of available water resources is not sufficient to meet the requirements of society, we speak of water shortages. Drought and water deficit can cause economic losses in key water-using industries and at the same time have environmental impacts on biodiversity, water quality, deterioration of water bodies, loss of wetlands, soil erosion, soil degradation and desertification (Koncepce na ochranu před následky sucha pro území České republiky, 2017). Drought also means a lack of water in the soil, plants and atmosphere and has consequences for the life of human society. As a result of the lack of precipitation, there is a decrease in discharges in surface streams, a decrease in groundwater levels, in lakes, wetlands and in water reservoirs – a hydrological drought begins. The duration of low water season is a continuous time period during which the discharge is less than a suitably selected discharge threshold value (Blaškovičová et al., 2016). Hydrological drought is a natural phenomenon and is a part of the natural hydrological regime of water resources. It represents an occasional, rare decrease in the water yields and a significant deviation from the average state of the natural variability of the water regime of the stream. Hydrological characteristics obtained from unaffected water gauging stations and hydrological balance are used for its evaluation (Danáčová et al., 2015). The Gidra stream (Fig. 1) springs in the Little Carpathians below Baďurka hill at an altitude
of about 470 m a. s. l., is a right-hand tributary of Dolný Dudváh stream. It is 38.5 km long. Under the confluence with the Kamenný brook is the only water gauging station on this stream. It is located near the gamekeeper's house above the village of Píla. It supplies the Častá ponds, water reservoirs, the larger Budmerice reservoir and the smaller Hájiček reservoir, the pond in Cífer, as well as the Ronava reservoir (through 2 intake structures). The most significant tributaries are Štefanovský stream and Ronava (most of the year is dry). The reason why the dry months at Gidra stream were analysed is that several ponds and reservoirs are supplied along its entire length and at the end at the confluence with Dolný Dudváh stream, Gidra shows minimal or nearly zero discharge values (Šoltész et al., 2019). The problem of extreme hydrological phenomena on the Little Carpathian streams was described very precisely by the team from Slovak Water Management Enterprise (Spál et al., 2019), where, among other streams, they also dealt with the Gidra stream. The flood extreme manifested itself on this stream in June 2011, but at present the most significant problem are lower water stages, or drying of this stream. Based on the hydrological analysis of the discharges of the Gidra stream, it will be possible to re-evaluate the amount of water taken. Minimum residual discharge has to be ensured, what allows general use of surface waters and secures the functions of the stream and the preservation of aquatic ecosystems. If it is a question of maintaining the biological balance in the stream under the water structure a minimum (guaranteed, sanitary)

Journal of Landscape Management (2020) Vol.: 11 / No. 1
r
32
discharge is specified downstream the structure. Permits for intakes from surface waters are related to selected values of M-daily discharges, specifically to Q355d (Blaškovičová et al., 2015). M-day discharge is the average daily discharge reached or exceeded after M days in the selected period (currently the hydrological representative period 1961 – 2000 is approved). The period is usually chosen for one year. If another period is used, this must be stated, for example the M-day discharge in
the growing season. For M-day discharges over a multi-annual period, the symbol M indicates the average time of reaching or exceeding the relevant discharge in the year. 330, 355 and 364-day discharges are discharges with high probability and in Slovakia they are among the most used flow characteristics for low water stages in terms of use in water management practice and environmental assessment (Danáčová et al., 2015).
Fig. 1: Gidra stream – schematic view
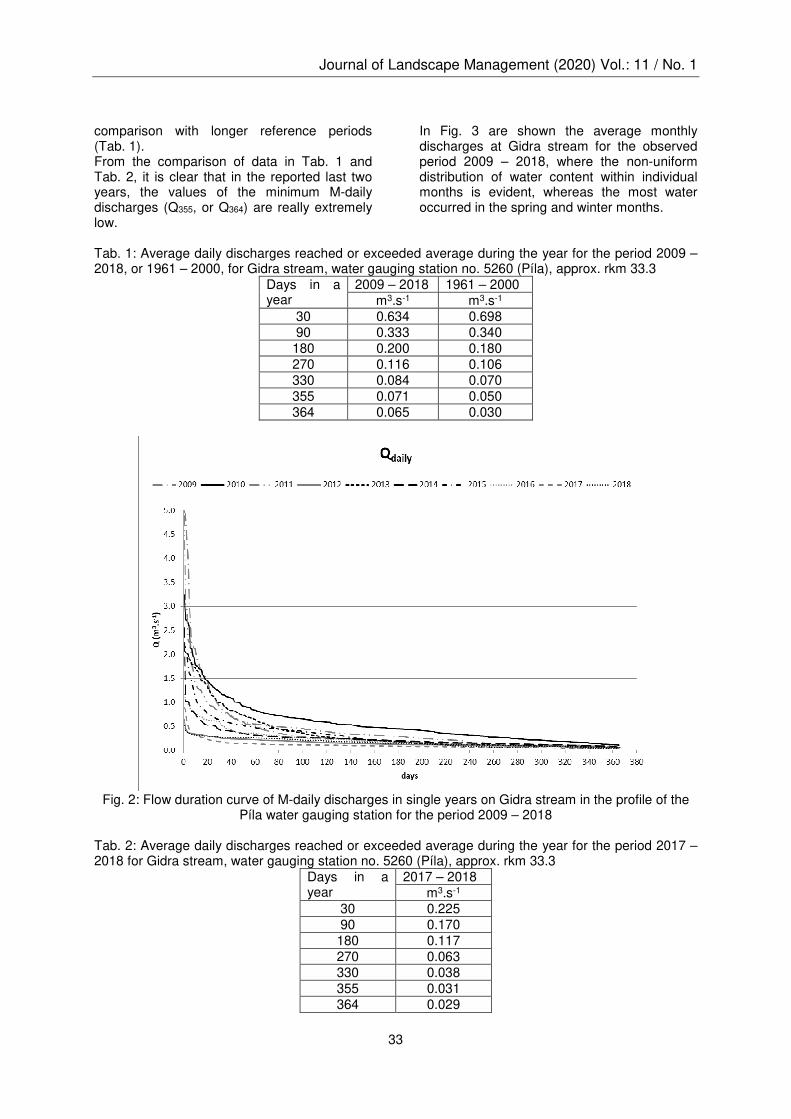
Material and methods Hydrological data For the needs of analysis of hydrological data, data on daily discharges from the Slovak Hydrometeorological Institute (SHMI) from water gauging station no. 5260 Píla for the period 1961 – 2000 were analysed, supplemented by data from hydrological annuals up to year 2018, which were processed in both graphical and tabular form (Tab. 1). From the performed comparison it is clear that for the mentioned period 2009 – 2018 the
minimum daily discharges (Q355, or Q364) are significantly higher (discharge Q364 is more than double) than for the reference period 1961 – 2000. In the analysis of M-daily discharges for individual years (Fig. 2), we found, that despite the finding of higher values of Q355, or Q364, for the shorter and more current period 2009 – 2018, the last two years appeared to be extremely dry according to this data set. Therefore, these “dry” years (2017 and 2018) were evaluated separately (Tab. 2) for
Journal of Landscape Management (2020) Vol.: 11 / No. 1
33
comparison with longer reference periods (Tab. 1). From the comparison of data in Tab. 1 and Tab. 2, it is clear that in the reported last two years, the values of the minimum M-daily discharges (Q355, or Q364) are really extremely low.
In Fig. 3 are shown the average monthly discharges at Gidra stream for the observed period 2009 – 2018, where the non-uniform distribution of water content within individual months is evident, whereas the most water occurred in the spring and winter months.
Tab. 1: Average daily discharges reached or exceeded average during the year for the period 2009 – 2018, or 1961 – 2000, for Gidra stream, water gauging station no. 5260 (Píla), approx. rkm 33.3
Days in a year
2009 – 2018 1961 – 2000 m3.s-1 m3.s-1
30 0.634 0.698 90 0.333 0.340 180 0.200 0.180 270 0.116 0.106 330 0.084 0.070 355 0.071 0.050 364 0.065 0.030
Fig. 2: Flow duration curve of M-daily discharges in single years on Gidra stream in the profile of the
Píla water gauging station for the period 2009 – 2018 Tab. 2: Average daily discharges reached or exceeded average during the year for the period 2017 – 2018 for Gidra stream, water gauging station no. 5260 (Píla), approx. rkm 33.3
Days in a year
2017 – 2018 m3.s-1
30 0.225 90 0.170 180 0.117 270 0.063 330 0.038 355 0.031 364 0.029

Journal of Landscape Management (2020) Vol.: 11 / No. 1
34
Fig. 3: Average monthly discharges on the Gidra stream in the profile of the Píla water gauging station for the period 2009 – 2018
Drought assessment according to SHMI methodology Since we used the term “dry, or extremely dry” month, dry months on the Gidra stream according to the SHMI methodology were evaluated. The occurrence of relative values of monthly discharges in time and space is analysed, as well as the frequency of occurrence of low-water months and days in the reference period, in comparison with the range of corresponding M-daily discharges, which represent low water stages (Q364 and Q355). Discharge values of 80 – 120 % Qma (note: Qma are long-term average monthly discharges) are considered to be values close to the corresponding long-term values. Flow rates below 80 % Qma represent under normal water levels. So we can talk about the following reference quantiles: • 1st quantile (120 to 80 % of Qmes1961-2000 –
normal water levels), • 2nd quantile (80 to 40 % of Qmes1961-2000 –
under normal water levels), • 3rd quantile (less than 40 % of Qmes1961-2000
– critical value of water levels). From the overall analysis of long-term monthly discharges in long-term unaffected stations of the state hydrological network, it is clear that in periods of low water (i. e. periods of summer-autumn and winter months), the value of 40 % Qma approaches up to 355-day discharge, which confirms the assumption that monitored discharges below this limit (< 40 % of Qma) may already indicate the state of hydrological drought. With a limit of 20 % of Qma in these
months, the values at many stations are below 364-day discharge. If such a situation really occurs, it is already extra extreme in terms of drought assessment (Blaškovičová et al., 2019, Danáčová et al., 2015). Thus, dry months are assessed on the basis of average monthly discharges for individual months of the year, where a dry month is considered to be such that 40 % of the average monthly discharge is less than Q355, while the value of Q355 = 0.050 m3.s-1 was considered (SHMI for the period 1961 – 2000, Tab. 1) and Q355 = 0.071 m3.s-1 (evaluated for the shorter reference period 2009 – 2018, Tab. 1) (Šoltész et al., 2019). Results and Discussion In Tab. 3 shows the evaluation of dry months for the period 2009 – 2018 using the value of Q355 = 0.050 m3.s-1 for the SHMI reference period 1961 – 2000 (Tab. 1). Based on such an evaluation, we can state that the only dry month in the evaluated period is the August. When comparing the mean monthly discharges with the value of Q355 = 0.071 m3.s-1 for the evaluated period 2009 – 2018 (Tab. 1), the dry months are the months July till November (Tab. 4). Finally, we evaluated in Tab. 5 and Tab. 6 period of the last two monitored years, i. e. 2017 – 2018 taking into account the value Q355 = 0.050 m3.s-1 for the SHMI reference period 1961 – 2000 (Tab. 1). In this case, the dry months are May till October. When comparing the average monthly discharges with the value Q355 = 0.071 m3.s-1 for the evaluated period

Journal of Landscape Management (2020) Vol.: 11 / No. 1
35
2009 – 2018 (Tab. 1), the dry months are in the whole period from May to December, which
is alarming!
Tab. 3: Evaluation of dry months for the period 2009 – 2018 at Q355 = 0.050 m3.s-1
Tab. 4: Evaluation of dry months for the period 2009 – 2018 at Q355 = 0.071 m3.s-1
Tab. 5: Evaluation of dry months for the period 2017 – 2018 at Q355 = 0.050 m3.s-1
Tab. 6: Evaluation of dry months for the period 2017 – 2018 at Q355 = 0.071 m3.s-1

Journal of Landscape Management (2020) Vol.: 11 / No. 1
36
In addition to the evaluation of dry years, based on data from the SHMI, we made an overview of the average monthly discharges for each month of the year for the reference period 2009 – 2018. This analysis indicates to the water content, or low water stages in individual months of the year, when it is clear that the biggest amount of water in the Gidra stream is in the period January – April and the lowest stages are in the summer and autumn months, which is fully according to the evaluation of dry months. Conclusion The analysis of dry months on the Gidra stream was carried out on the basis of the requirements of the public, because in its lower section there was a significant decrease in the water level regime in the stream. The results pointed to a relatively long low-water period during the year, whereas 2017 and 2018 being extremely dry. Based on such an analysis, it is then clearer where the water "losts", as the Gidra stream subsidizes the reservoirs and ponds mentioned in the introduction (Fig. 1). Although these intakes are controlled by the operation rules of individual structures, it is necessary to harmonize them, to be able to control their amount and ensure a minimum residual discharge downstream these structures. As more significant fluctuations in the hydrological cycle can be expected due to climate change, dry and low-water periods are likely to occur with higher periodicity. Only appropriate water management on the stream can help to overcome such adverse periods. In the future, therefore, it will probably be necessary to re-evaluate the operation rules of the structures on the Gidra stream and adjust them so that they can rehabilitate the flow regime in Gidra with the accumulated water from their storage space so that life preserves in the stream. The paper was developed within the frame of and based on the financial support of the VEGA 1/0800/17 project and APVV-16-0278 project. References Blaškovičová, L., Poórová, J., Melová, K., Jeneiová, K. (2019). Nastavenie limitných hodnôt pre hodnotenie hydrologického sucha. Zborník konferencie: Manažment povodí a extrémne hydrologické javy 2019, ISBN 978-80-570-1236, Vyhne. Blaškovičová, L., Melová, K., Poórová, J., Škoda, P. (2016). Assessment of the
hydrological regime of Slovakia with a focus on the hydrological drought assessment in surface waters. Zborník konferencie: Efektívne využívanie vodných zdrojov v podmienkach prebiehajúcej klimatickej zmeny (sucho a nedostatok vody) (http://w5.shmu.sk/File/Hydrologia/Publikacna_cinnost/2016/Vodne_zdroje_Sucho_BA_2016/2016_Sucho_nedostatok_vody_Blaskovicova_kol_Hodnotenie%20hydrologickeho_rezimu_na_sucho_abstrakt.pdf [online], [cit. 2020-09-30]). Blaškovičová, L., Melová, K., Danáčová, Z., Lovásová, Ľ., Šimor, V., Poórová, J. (2015). Minimálny bilančný prietok vo vzťahu k ekologickým prietokom. Acta Hydrologica Slovaca, roč. 16, tematické číslo, ISSN 1335-6291, 23-30. Danáčová, Z., Blaškovičová, L., Lovásová, Ľ., Poórová, J., Šimor, V., Škoda, P. (2015). Hydrologické extrémy: Modelovanie a predpovedanie. Acta Hydrologica Slovaca, roč. 16, tematické číslo, ISSN 1335-6291, 13-22. Koncepce na ochranu před následky sucha pro území České republiky, 2017. Databáze strategií - portál pro strategické řízení. (www.databaze-strategie.cz [online], [cit. 2020-09-30]). Spál, M., Kováč, J., Baďurová, H., (2019). Extrémne hydrologické javy na tokoch v Malokarpatskom regióne. Zborník konferencie: Manažment povodí a extrémne hydrologické javy 2019, ISBN 978-80-570-1236, Vyhne. Šoltész, A., Čubanová, L., Mydla, J. (2019). Gidra – vodohospodárske riešenie odtokových pomerov z hľadiska minimálnych prietokov. SvF STU, Bratislava. Author’s contact: Slovak University of Technology in Bratislava, Faculty of Civil Engineering, Department of Hydraulic Engineering, Radlinského 11, 810 05 Bratislava, Slovak Republic, +421 2 32 888 698, [email protected]
Journal of Landscape Management (2020) Vol.: 11 / No. 1
Original research paper
37
Selected reasons of the watercourse revitalization (comparison with dams – for example Hulin)
Miloslav Šlezingr
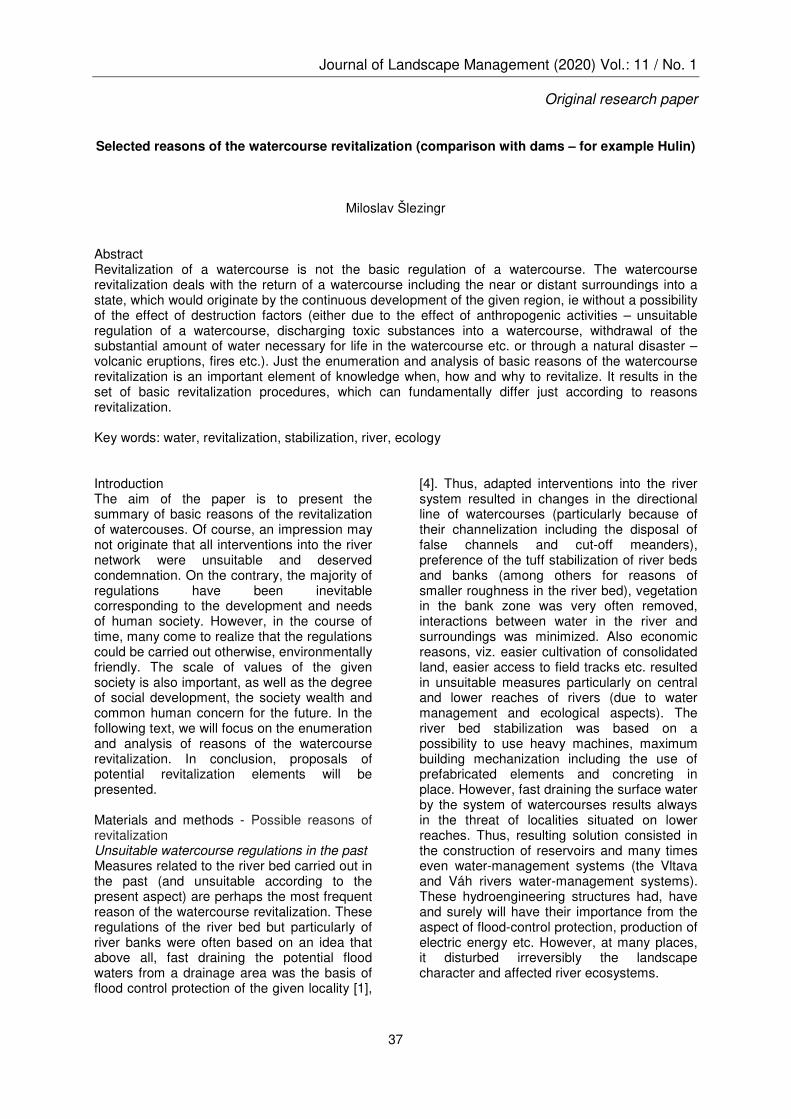
Abstract Revitalization of a watercourse is not the basic regulation of a watercourse. The watercourse revitalization deals with the return of a watercourse including the near or distant surroundings into a state, which would originate by the continuous development of the given region, ie without a possibility of the effect of destruction factors (either due to the effect of anthropogenic activities – unsuitable regulation of a watercourse, discharging toxic substances into a watercourse, withdrawal of the substantial amount of water necessary for life in the watercourse etc. or through a natural disaster – volcanic eruptions, fires etc.). Just the enumeration and analysis of basic reasons of the watercourse revitalization is an important element of knowledge when, how and why to revitalize. It results in the set of basic revitalization procedures, which can fundamentally differ just according to reasons revitalization. Key words: water, revitalization, stabilization, river, ecology Introduction The aim of the paper is to present the summary of basic reasons of the revitalization of watercouses. Of course, an impression may not originate that all interventions into the river network were unsuitable and deserved condemnation. On the contrary, the majority of regulations have been inevitable corresponding to the development and needs of human society. However, in the course of time, many come to realize that the regulations could be carried out otherwise, environmentally friendly. The scale of values of the given society is also important, as well as the degree of social development, the society wealth and common human concern for the future. In the following text, we will focus on the enumeration and analysis of reasons of the watercourse revitalization. In conclusion, proposals of potential revitalization elements will be presented. Materials and methods - Possible reasons of revitalization Unsuitable watercourse regulations in the past Measures related to the river bed carried out in the past (and unsuitable according to the present aspect) are perhaps the most frequent reason of the watercourse revitalization. These regulations of the river bed but particularly of river banks were often based on an idea that above all, fast draining the potential flood waters from a drainage area was the basis of flood control protection of the given locality [1],
[4]. Thus, adapted interventions into the river system resulted in changes in the directional line of watercourses (particularly because of their channelization including the disposal of false channels and cut-off meanders), preference of the tuff stabilization of river beds and banks (among others for reasons of smaller roughness in the river bed), vegetation in the bank zone was very often removed, interactions between water in the river and surroundings was minimized. Also economic reasons, viz. easier cultivation of consolidated land, easier access to field tracks etc. resulted in unsuitable measures particularly on central and lower reaches of rivers (due to water management and ecological aspects). The river bed stabilization was based on a possibility to use heavy machines, maximum building mechanization including the use of prefabricated elements and concreting in place. However, fast draining the surface water by the system of watercourses results always in the threat of localities situated on lower reaches. Thus, resulting solution consisted in the construction of reservoirs and many times even water-management systems (the Vltava and Váh rivers water-management systems). These hydroengineering structures had, have and surely will have their importance from the aspect of flood-control protection, production of electric energy etc. However, at many places, it disturbed irreversibly the landscape character and affected river ecosystems.

Journal of Landscape Management (2020) Vol.: 11 / No. 1
38
Fig. 1: Unsuitable watercourse regulation outside the town residential area – long direct line (river
banks are stabilized by heavy riprap, streamside accompanying vegetation is insufficient) – effects in the landscape do not function naturally. Such treatments were many times “forced” by requirements on
the part of an agrarian sector. Illustration photo.
Fig. 2: Unsuitable watercourse regulation outside the town residential area Illustration photo. Part of unsuitable treatments in the past consisted in an unambiguous tendency to the proposal of the “systematic regulation of a
watercourse”. This way of treatment results from a definition of the steady uniform flux in open river channels. It is good that at the

Journal of Landscape Management (2020) Vol.: 11 / No. 1
39
uniform longitudinal gradient I and uniform cross profile A
I = const. A = const.
also speed v and thus also discharge Q are constant. Within the design and implementation of the systematic regulation of a watercourse, mostly a uniform river channel originated of the same width at the river level, very often also with the uniform type of bank stabilization. In the similar sense, the streamside accompanying vegetation is subsequently designed – stands in regular spacing, often we can see alley plantings of one species only, namely many times strictly unsuitable species (black poplar – cultivar “Italica” with a slim fusiform crown, fruit trees – walnut Juglans regia etc.) Unsatisfactory quality of water in a watercourse The long-term unsatisfactory quality of water is another important reason of the necessary revitalization of a watercourse. This situation occurs (and many times also occurred in the past) particularly on watercourses, which were regularly and for a long time loaded by the
drainage of insufficiently cleaned sewage waters, loaded by downwash (including residues of fertilizers etc.) from adjacent land etc. We do not speak here on an ecological disaster, ie situation when a watercourse is exceptionally loaded by the significant amount of a substrate causing fatal changes in the water quality, but about the long-term loading of the system [2] [3] [5]. After a certain time, the stage of “exhaustion” occurs and the watercourse, as an ecosystem, is no more able to resist long-term loading. With the gradual death of higher and lower organisms the food chain is interrupted and pathogenic organisms predominate and thus, the system degradation happens (this affected reaches of the Vltava and Elbe rivers and part of the Bílina river in the past). Dealing with the problem is known – building the sewage disposal plants (both industrial waste treatment plants and city waste water treatment plants), catching the washing already at its origin (ie realization of the reallocation of land in broad extent) and the design of infiltration belts along watercourses, consistent and regular maintenance of river banks and accompanying vegetation etc. However, we refer to a basic problem here, ie lack of funds and property relations.
Fig. 3: Eutrophication - cause a significant overgrowing riverbed (M.Šlezingr 2011)

Journal of Landscape Management (2020) Vol.: 11 / No. 1
40
Values of the resistance r
c differ in the nature depending on the relation between the surface water level and groundwater level. In case of infiltration
rh h> and for the drainage
rh h< .
Numerical models mostly offer the possibility to define different values of the resistance for infiltration and drainage processes (CI and CD) (Zaadnoordijk, 2009; Rushton, Zaadnoordijk, 2010). Determination of river bed (channel) bottom resistance is the matter of model calibration. Investigation of
0k and
0b
parameters separately is very complicated. There are no relevant river bed resistance values in the available literature recommended for the modelling purposes. Approach to dealing with the problems It is necessary to realize that the basis of self-purification processes consists in microorganisms stuck to submersed objects (root systems, river bed roughness – stones, submerged parts of stems, stumps etc.), on parts of vegetation growing in a watercourse (profundal zone) and in the bank zone (above all sublitoral zone). Ensuring the permeability of a watercourse belongs to principles, which are used at the revitalization design. It dos not concern only permeability for fish stock but also for all or at least the majority of organisms living in the watercourse. Here, we encounter the problem of cross structures and their usability within revitalization measures. A special chapter aimed at the design of migration ways deals with this problem. Another fundamental question at the watercourse regulation (particularly at the watercourse regulation design) consists in the problem of the stream alignment. The observance of basic attributes of the watercourse regulation is necessary, viz. alternating reverse curves, minimization of channel straightening; maximum use of existing suitable reaches and, at the design of the total watercourse revitalization, considering the original natural watercourse route [3]. The design of a longitudinal profile should correspond to requirements for the channel water biotope. At the same time, it is necessary a question of the channel resistance and ensuring its function at the flow of high waters to correspond to its special-purpose function and minimization of the channel maintenance requirement. The continuous course of the bed vertical alignment is unsuitable. At longer reaches, it is necessary to divide the channel by changes of the longitudinal gradient using sections (reaches)
with effective roughness, superelevated sills, gradient structures (sills, chutes) together with depressions, pools and fords, namely according to hydrotechnical assessment (www.revitalizace vodnich toku). A very important aspect of the watercourse revitalization design is the proposal of suitable streamside vegetation. A vital species-rich and spatially stabilized riparian stand (all-aged best), ie trees, shrubs and herbs of a sublitoral and eulitoral zone. The riparian stand continues an accompanying stand, which differs somewhat in fulfilling its basic functions. At smaller watercourses, riparian and accompanying stands often merge. At watercourses in floodplain forests, trees growing in a greater distance from the bank line are also considered to be a riparian stand. Thus, the actual condition of the given locality is decisive. Conclusion Increasing the ecological stability of a watercourse as well as of the whole floodplain is an important task of the watercourse revitalization, our fundamental objective and indicator of the design successfulness and subsequent realization. Among others, it will become evident in the richer stock of fish in the watercourse. Just the frequency and versatility of the fish stock provide information on the quality of the whole food chain thriving in the water environment. Likewise prosperous vital streamside vegetation reaching behind the bank line gives notice on a steady landscape element, which can subsequently serve as a basis for the establishment of the territorial system of ecological stability in the landscape. References Baroková, D. (2006). Determination of influence of the water structure on groundwater level regime and possibilities of its control. Edition of scientific papers, No. 33,. STU Bratislava 152 p. (in Slovak) Junáková, N., Balintová M.,(2013) Revitalization of small water reservoir for its future use : Journal of Landscape management. Vol. 4, no. 1 (2013), p. 67-71. - ISSN 1804-2821 PELIKAN, P., ŠLEZINGR, M., (2015) Parameters of wind driven waves on Nove Mlyny water reswevoir, Conference: 14th International Symposium on Water Management and Hydraulic Engineering 2015, Pages: 55-64 Location: Brno, CZECH REPUBLIC Date: SEP 08-10, 2015

Journal of Landscape Management (2020) Vol.: 11 / No. 1
41
Schields, F.D., Gray, D.H. Effects of woody vegetation on the structural integrity of sandy levees, Water Resources Bulletin 1993, s.917-931 Slezingr, M., (2010) Function of bankside trees and shrubs, Conference on Recreation and Conservation, 17 – 18p. Location: Kritiny, CZECH REPUBLIC Date: MAY 05-06, 2010 Slezingr, M., foltznova, l., zelenakova,m., (2010). Assessment of the current condition of riparian and accompanying stands, In.: Colloquium on Landscape Management Location: Mendel Univ, Brno, feb. 05, 2010 24 – 27 p. Slezingr, M., Jedlička l., (2010) Accompanying vegetation – grassland, In.: Colloquium on Landscape Management Location: Mendel Univ, Brno, feb. 05, 2010 28 – 30 p. SYNKOVÁ, J. Possibility of utilization of direction construction in river revitalization [Možnosti využití usměrňovacích staveb v rámci revitalizace toku] (2009) Acta Universitatis Agriculturae et Silviculturae Mendelianae Brunensis, 57 (5), pp. 279-284. Wilde, S.A. Forest Soils: Thein protection and Relation to Silviculture, New York, Donald press 1558 WU,T.H. Slope stabilization, in.R.P.C. Morgan and R.J.Rickson 1995 Zeleňáková, M., Petriláková, A.,Galas S. 2011. Evaluation of the development potential of the village Spisské Bystre, Conference on Public Recreation and Landscape Protection – Hand in Hand? MENDELU, 4-6.5.2011, p. 45 – 50
Acknowledgement This publication is the result of the project implementation: Project IGA – LDF_PSV-2016002, Project ÚČ VUT FAST: BD 12400033 The research was funded from the following grants and projects: Supported by the Specific University Research Fund of the FFWT Mendel University in Brno). LDF_TP_2019002
Author’s contact: Univerzity of technology Brno Civil Engineering Faculty, Institute of Water Management e-mail: [email protected] Mendel Univerzity Faculty of Forestry and Wood technology, Zemědělská 3, 6013 Brno [email protected]

Journal of Landscape Management (2020) Vol.: 11 / No. 1
42
Journal of Landscape Management Instructions to Authors The journal publishes original scientific papers, review articles and reports from the field of landscape management, water management, forest management, forest engineering. Papers are published in English. The author is fully responsible for the originality of the paper, formal and language correctness. Papers intended for publication should be sent in electronic version to e-mail: [email protected] Manuscript layout: Microsoft Word should be used. Paper size A4 with margins of 2.5 cm, full text divided into two columns. Writing: Arial font style, size 10, single spacing, do not use bold, underlining or any other way of text highlighting. Text alignment: to the block, chapter titles aligned to the left, article title and authors’ names aligned to the center. Figures: photos, maps, graphs, illustrations and diagrams should be numbered according to the order in which they are included in the text using Arabic numerals. The caption is placed below the figure. All figures should be in the gray scale (not coloured). Graphs should be provided in Microsoft Excel and stored with original data. Raster pictures should be submitted in JPEG format and must be of high quality (minimum 300 dpi resolution) and of sufficient dimensions for printing. Example: Fig. 1 Surface, growing stock and 10-year harvesting volume in the studied object Tables: are to be numbered with Arabic numerals in the order in which they are referred to in the text and have a brief, but self-explanatory title. The caption is placed above the tables. Abbreviations or symbols used in the tables must be explained either in the table caption or as a footnote. Example: Tab. 1 Surface, growing stock and 10-year harvesting volume in the studied object Each figure and table must be submitted on a separate page. Measurement units: the SI international system should be used. Scientific names: plants, animals and phytosociological units should be written in italics. Abbreviations: shall be explained appropriately when they are used in the text for the first time. Paper format: should consist of title and complete name(s) of the author(s), abstract (short summary of the whole paper), keywords (a maximum of 6 in alphabetical order). The main text of the scientific paper must be developed under the following headings: Introduction, Material and Methods, Results, Discussion, Conclusion, References, Author’s contact address. Results and Discussion can be presented under one heading. Citation. The family name of the first author followed by the year of publishing, e.g. (Pauling, 2005), (Pauling and Liu, 2004), (Paulig et al., 2004). References: should be a list of refereed sources arranged in alphabetical order according to the surname of the first authors. Literary sources should be cited in the original language and be familiar with APA style. Only papers cited in the text should be included in the list of references. Examples: Book:
Sheril, R. D. (1956). The terrifying future: Contemplating color television. San Diego, CA: Halstead.
Work in periodical: Crackton, P. (1987). The Loonie: God's long-awaited gift to colourful pocket change? Canadian
Change, 64(7), 34–37. Proceeding: Jones, K. (1974). Knowledge as power. In Houghton, V. and Richardson, K. (eds.). Recurrent
education. London: Ward Lock Educational, 45-56. Web page: Lagoze, C. (2002). The Open Archives Initiative Protocol for Metadata Harvesting [online]. [cit.
2006-03-30]. Retrieved from http://www.openarchives.rog/OAI.html Author’s contact address: should include the postal address, telephone and fax number, and e-mail of the corresponding author. Compliance with these instructions is obligatory for all authors. If a manuscript does not comply exactly with the above requirements, the Editorial Office will not accept it for consideration and will return it to the authors without reviewing.


Edited by
Department of Landscape Management Brno, Czech Republic, 2020
Printing: Mendel University Press, Mendel University in Brno
ISSN 1804-2821