vodafone omnitel 18 months to make a une 2002 pag. 1 18 months to make an analytical crm dream come...
TRANSCRIPT
June 2002 Pag. 1
18 months to makean Analytical CRM dream come true:
results obtained by Vodafone Omnitel in B2B churn prevention
SEUGI 20
Paris, June 2002
Alessandro Bernorio � VODAFONE OMNITELPaola Bauce - NUNATAC
AAAA BBBB

June 2002 Pag. 2
Agenda
! Introduction to the business care
! Methodological background
! Test Campaing
! Churn prevention models
! Churn Prevention Activity
! Results Obtained
! Presentation! Presentation

June 2002 Pag. 3
Vodafone Omnitel
" 88 offices: located throughout Italy
" Investment in UMTS: 5.1 millions euro between 2000 and 2010
" Coverage: 97% of the country equal to 99.4% of the population
" Call Centres: 8 Call Centres operating in Milan, Rome, Padua, Ivrea, Naples, Pisa, Cataniaand Bologna, dealing with an average of over 5 million calls a month
" Retail outlets: 764 Omni One, 45 Spazio Omnitel stores and 1,876 independent dealers
" International roaming: agreements with 270 operators in 162 countries
17,400,000 customers as of 31 December 2001
4%
47%
15%34%
4%
47%
15%34%
4%
47%
15%34%

June 2002 Pag. 4
! Born 1994, SAS Quality Partnerfrom 1997
! 20 Consultants with specific skillsof I.T. and STATISTICS for thedevelopment of AnalyticalSystems
! Visit WWW.NUNATAC.IT
Nunatac

June 2002 Pag. 5
Agenda AAAA BBBB
! Methodological background
! Test Campaign
! Churn prevention models
! Churn Prevention Activity
! Results Obtained
! Presentation
! Introduction to the business care

June 2002 Pag. 6
Implement an effective CRM STRATEGY through:
1. Customer Centric Data Warehousing
2. Data Mining
3. Caring and investing on good and potentially good Customers
The main goal of the Company
Passion for the world around usWe will help the people of the world to have fuller lives � both through the serviceswe provide and through the impact we have on the world around us
Passion for customersOur customers have chosen to trust us. In return, we must strive to anticipate andunderstand their needs and delight them with our service
Passion for resultsWe are action-oriented and driven by a desire to be the best
Passion for our peopleOutstanding people working together make Vodafone exceptionally successful

June 2002 Pag. 7
Reduce the voluntary attrition rate
of Corporate Customers
developing a
Churn Prevention Predictive ModelChurn Prevention Predictive Model
The goal of the Project

June 2002 Pag. 8
Agenda
! Methodological background
! Test Campaign
! Churn prevention models
! Churn Prevention Activity
! Results Obtained
! Presentation
! Introduction to the business care
June 2002 Pag. 9
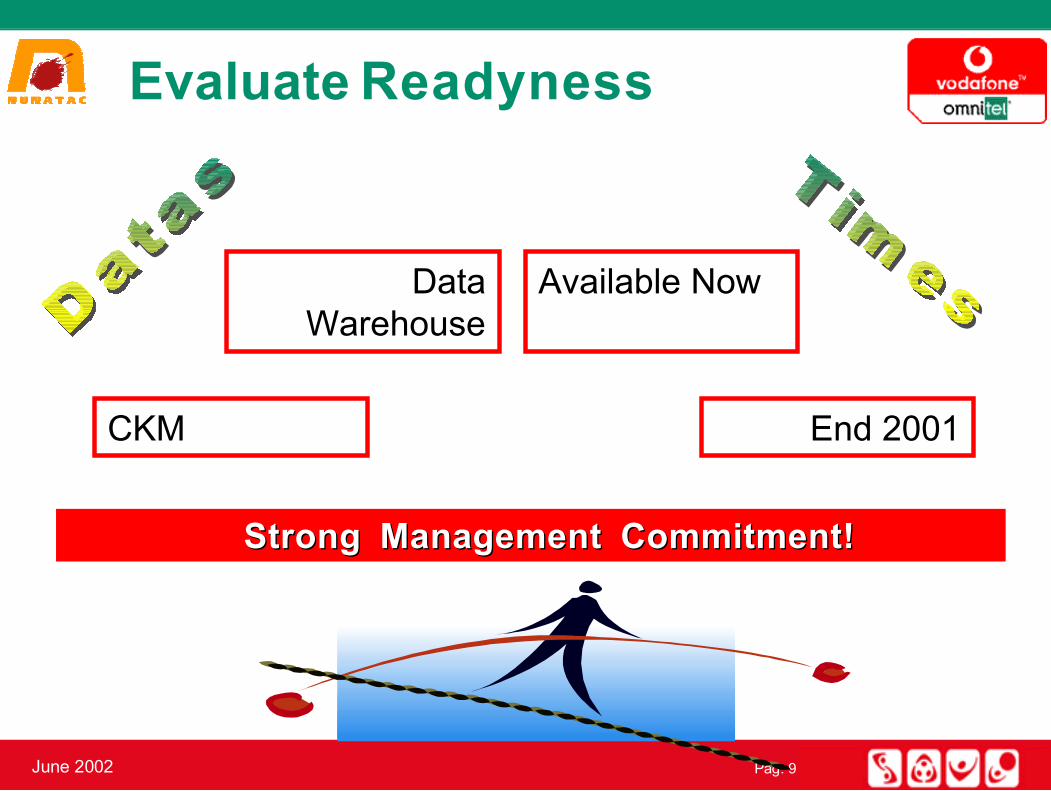
Strong Management Commitment!Strong Management Commitment!
DataWarehouse
Available Now
CKM End 2001
Evaluate Readyness

June 2002 Pag. 10
Extraction of a SAMPLE of 20.000 customers:
Structural Data
Preliminary phase
Historical Data
SIMs Active/Deactived
Call Behaviour
#$To identify the logical unitof analysis
%$To define the targetvariable

June 2002 Pag. 11
High behavioural uniformityof the SIM cards of the one client
The logical unit of analysis
Customer vs SIM

June 2002 Pag. 12
The target variable definition
HISTORY PREDICTIONDARK
t -1 t0
! Voluntary churn in the period of forecasting (no more activeSIMs), where voluntary churn is based on cut-off of customer SIMs
! Outgoing Traffic of a customer during forecast period isdrastically reduced compared to the preceding period

June 2002 Pag. 13
Make Data Available (1)
> 100.000 Customers> 1.000.000 SIMs
! Structural Data & Historical Data
! 18 months of history (active/deact � traffic)
At the same time:#$I.T. extracted data OFF-LINE for
churn prevention model%$I.T. Resources were starting the
CKM Project

June 2002 Pag. 14
Make Data Available (2)
HISTORY PREDICTIONDARK
t -1 t0
Oct.2000
Sep.2000
t -12
Oct.1999
t+6
March2001
18 months

June 2002 Pag. 15
�A priori� segmentation
XPrepaid
XXContractsOther
XXContracts BigClients
Withoutobligations
Withobligations

June 2002 Pag. 16
From Data AvailableTo Customer Table Available
! Modeling:& Contracts / Prepaid& With Obligations / Without Obligations
! Explanatory Structure:& Dynamic of company SIM portfolio: Deviation Indicators
(on quarter summaries of incoming and outgoing traffic)& Snapshot of company SIM portfolio& Seniority of customer

June 2002 Pag. 17
Agenda
! Methodological background
! Test Campaign
! Churn prevention models
! Churn Prevention Activity
! Results Obtained
! Presentation
! Introduction to the business care

June 2002 Pag. 18
Mining Details (1)
! A Propensity Model for eachof Three Segmentsdeveloped with SASEnterprise Miner
! Decision Tree � basedmodels; the results are:& Easier legible& Interpreted more immediate
and direct way
The Algorithm guarantee:& Good Performance& Robustness

June 2002 Pag. 19
Mining Details (2)

June 2002 Pag. 20
Mining Details (2)
PREPAID
REDEMPTION (PERCENTILES)
02468
101214161820222426283032343638404244464850
0 5 10 15 20 25 30 35 40 45 50 55 60 65 70 75 80 85 90 95 100
% sample
Training
Validation

June 2002 Pag. 21
Mining Details (3)
FOR EACH MODELFOR EACH MODEL:
! Leaves grouped based on risk levels! Determination of clusters considering:
& Statistical methodology& Business needs

June 2002 Pag. 22
Implement in Production
! Starting Point& Off-line analytical environment, Three Models developed
with SAS Enterprise Miner& CKM Environment (Test Phase)
! Transmit the specifics to I.T.:& Rules for the construction of Customer Table used for the
models& Historical Recovery of the information& Data Audit activity& Score Code for the Operative Test
TIMING: from September 2001 to January 2002

June 2002 Pag. 23
Agenda AAAA BBBB
! Methodological background
! Test Campaign
! Churn prevention models
! Churn Prevention Activity
! Results Obtained
! Presentation
! Introduction to the business care

June 2002 Pag. 24
Test Campaign Goals
####$$$$ Test the statistical model
%%%%$$$$ Test the entire system (Back End)
''''$$$$ Test operational and organizational aspects
(Front End)
(((($$$$ Measure expected R.O.I.

June 2002 Pag. 25
Data Available andTest Campaign Schedule
! Beginning of feb 2002: Attritionscore applied to the situation ofthe Customer Base at 31 oct 2001
! List of potential churners finetuning (target definition) & controlsample design
! Customer Care resources training
! Churn prevention activity onHigh - Middle risk customers
Forecasting period (Feb � Apr 2002)
1 week
3 days
1 month
We are late!
�. some potential churners hadalready gone

June 2002 Pag. 26
Test Campaign Target Definition
! Considering a cross-tab between attrition scorer & actualrevenue we obtained different level of priority:
! Prepaid
! Contracts withObligations
! Contracts withoutObligations
Risk &
Value
High
Risk
Medium
Risk
Low
Risk
High
ValuePriority 1 Priority 2 Priority 3
Middle
ValuePriority 3 No action
Low
ValuePriority 2
Risk &
Value
High
Risk
Medium
Risk
Low
Risk
High
ValuePriority 1 Priority 2 Priority 3
Middle
ValuePriority 3 No action
Low
ValuePriority 2
! Control sample: random selection of 2.000 customers
! Test sample: random selection of 4.000 customersFromFromPriority 1 &Priority 1 &
22
June 2002 Pag. 27
Agenda
! Methodological background
! Test Campaign
! Churn prevention models
! Churn Prevention Activity
! Results Obtained
! Presentation
! Introduction to the business care

June 2002 Pag. 28
Retention Offers based on Cluster
vvvvaaaarrrriiiiaaaabbbblllleeee ooooffffsssseeeeggggmmmmeeeennnnttttaaaattttiiiioooonnnn
11110000 ddddiiiiffffffffeeeerrrreeeennnntttt cccclllluuuusssstttteeeerrrr
segmentation variables Cluster 1 Cluster 2 Cluster 3 (...)
Average age
Tariff plan (old / new)
% of sim inactive
% traffic towards Vodafone
% of risk
Value of customer
(....)
offers Cluster 1 Cluster 2 Cluster 3 (...)
!New Plan on Old Plans X
!Push Options X
!Landline Network X
!Change of handset X
!Commercial visit
! (....)

June 2002 Pag. 29
Agenda
! Methodological background
! Test Campaign
! Churn prevention models
! Churn Prevention Activity
! Results Obtained
! Presentation
! Introduction to the business care

June 2002 Pag. 30
Churn Prevention Test41% NOTNOT
OPERABLE:OPERABLE:
)Unavailable)Disactivated)Customer in
Dunning)No Contacted
100%customers
in test
59%contacts
contactable
) Push options! Commercial Visit! Plan Change ! Change of handset
73%
27%
Results obtained% churn (apr 2002)
LIFT:
% churn Control Sample
% churn Test Sample
High 6,0
Middle 4,2
Low 5,8
Contracts without
obbligations10,6
Contracts with
obbligations7,1
Prepaid 4,0
Total 5,8
LIFT:
% churn Control Sample
% churn Test Sample
High 6,0
Middle 4,2
Low 5,8
Contracts without
obbligations10,6
Contracts with
obbligations7,1
Prepaid 4,0
Total 5,8
55% OK55% OK
4% KO4% KO

June 2002 Pag. 31
Conclusions
####$$$$ Targeted churn prevention actions, studying the
client profiles
%%%%$$$$ Evolution of the clients over time with regard to
churn inclination and measured behaviours following
recovery actions
''''$$$$ How to best exploit the production environment
(((($$$$ Organisation of different players

June 2002 Pag. 32
Merci

1
18 months to make an Analytical CRM dream come true:results obtained by Vodafone Omnitel in B2B churn prevention
Authors:Flavia Cavallo, Alessandro Bernorio – Vodafone OmnitelGuido Cuzzocrea, Paola Bauce – Nunatac
AbstractImplementing Analytical CRM, are you ready to go? You need money, commitment, technology, right skills andmanagement . . ., just like John Belushi had sun glasses, half a tank of gas and above all a strong and determined willto go.Are you worried about the monsters you will encounter, before getting a possible return on your investment? We wouldbe glad to share what the following points actually mean:• Allow the IT resources the necessary time to prepare the infrastructure for “the big project”, but do not wait until
the CRM environment is available;• transform your business goal into a non trivial analytical design;• build a predictive model for churn prevention, considering the future data production process, the continuously
changing characteristics of the offer, the timing and details of the customer caring activity,• implement in a new production environment a data mining process, developed off-line;• do not reach paradise, but achieve a reasonable quality standard to start with successful.
1. Introduction
Churn management of ones clients entails theoptimisation the client number turnover whileminimising the out-flow of profitable clients, which istypical in the contest in which we are operating,namely that of highly competitive mobile phonetelecommunication companies. In concrete terms, thismeans analysing the phenomenon of attrition with theaim of predicting the single out-going churn event onthe basis of the succession of behaviour that the clientdisplays in a defined period of time.Predicting churn on behalf of ones clients using multi-varied statistical methodologies, equates to a basiccompetitive advantage for Vodafone Omnitel becauseit allows them to adopt counter-measures formaintenance and loyalty of so-called “at risk” clients:in doing so, a preventative approach to churn isadopted rather than a costly cure approach.Predict to prevent: this, then, needs to be the finalgoal of a churn management system that will assistVodafone Omnitel in the construction of a privilegedand long-lasting relationship with its clients.
2. Presentation of Vodafone Omnitel and Nunatac*
2.1 Vodafone Omnitel
Vodafone Omnitel, the private mobile telephoneoperator, has been present in the Italian market sinceDecember 1995. From the outset, Omnitel stood outfor its innovative approach, which made it a drivingforce for change in the Italian telecommunicationssector, both from a commercial point of view and
with regard to the communications services on offer.Omnitel placed the customer at the centre of everyactivity and initiative, developing a new CustomerRelationship Management Model, based on themeslinked to innovation, development and progress.
Having become part of the Vodafone Group, theworld's biggest mobile telecommunications group, asof April 2000 Omnitel now boasts about 16 millionsubscribers, 8 operational call centres spread aroundthe country, over 2,000 retail outlets and 137 SpazioOmnitel stores. The GSM network covers 97% ofItaly, representing 99.4% of the population, as doesthe GPRS network, which was completed at the endof 2000. Omnitel currently has international roamingagreements with 81 countries.
2.2. Nunatac
NUNATAC is a European Quality Partner of SAS,composed of a group of professional consultants withstatistical, computing and marketing skills.The defining characteristic of NUNATAC is thecombination of specific abilities and a well developed"know-how" in the field of Database Marketing.Over the course of the last 9 years, Nunatac hasdeveloped vertical market capabilities in thefollowing sectors: Banking, Insurance, Mail Order,the Automotive Industry and the Cellular PhoneIndustry.

2
3. Goal of the Project
The goal of the project is to predict the probability ofchurn for corporate clients. In concrete terms, thistranslates to the construction of a model, which canassign to each client a probability that they abandonthe company, or that they drastically reduce the use ofits services, in a period of time measured from themoment of prediction.This is carried out via a multi-varied statisticaloperation of particular behaviours that the singleclients manifest in a fixed period of time that precedesthe moment of prediction. The aim, therefore, is tosummarise, in terms of a score, the symptoms ofdissatisfaction, on different levels, of the clients, so asto anticipate their decision to chrurn or to reorganisethe supply of services from Vodafone Omnitel.This obviously entails:• assigning a probability of churn to each client in
a future defined time period;• drawing up a list of “high-risk” clients;• setting up a Customer Care service which will
formulate alternative proposals that look at needswhich have not been addressed up to that time;
• recording, with the assistance of hindsight, thecontainment achieved in the rate of “CustomerAttrition”.
4. Description of the project: from churn modeldevelopment to operative test
4.1 The corporate client
A feature of corporate clients derives directly fromone of the requirements that needs to be satisfiedwhen taking out a company Telephone plan, be it anormal contract plan or a prepaid one. That is,activation is only possible with a minimum number ofSIM cards. This is considered at all times wheneverwe are dealing with a corporate client. When ourgoals are to seek answers to questions of the type: “Isthe client high or low value?”, “Is the client inclinedto take our certain tariff plans and/or services?”, “Isthe client a high or low churn risk?”, then we cannotdisregard the fact that the client, in this case, is the“summary” of its own company SIM portfolio. Giventhe high behavioural uniformity of the SIM cards ofthe one client, it is more appropriate to undertake ananalysis of client logic unity rather than the client’sindividual SIMs, which is what normally occurs in thecase of consumer clients. This approach was alsoadopted in the analysis which is the subject of thepresent paper:
1 SIM CARD = 1 CLIENT1 CLIENT = 1 COMPANY SIM PORTFOLIO
4.2 Analysis Methodology
The objective of the project was to define a rule thatassigns a probability of churn to each client so as toperiodically identify the clients that have the highestchurn risk. This was done using propensity modelswhose development required a precise definition of:• the predicted time period;• the analysis Population;• the typology of the clients;• the target variable;• the explanatory structure.
4.2.1. The temporal dimension
To better predict attrition, it is of prime importance tospecify the time period in which to study thephenomenon. In our case we identified three intervals:the prediction period (on which the target variable isexploited and the prediction is carried out); the darkperiod (consisting of the time required to update thedata warehouse and the insertion into the system ofthe contract cancellation); the history period (requiredin order to construct the model input indicators whichconsider the evolution of the client in time). Themodels obtained refer to the temporal dimension asshown in the following diagram:
Diagram 1
In the production phase, the prediction horizon of themodel will be the months following the days ofcommercial darkness.
4.2.2 The Reference Universe
What we are dealing with here are all the activecorporate clients at the temporal moment t-1 with theexclusion of several categories:i. clients deactivated in the dark period;ii. clients deactivated involuntarily (in the case of
Vodafone Omnitel cancelling service to insolventclients or the physical replacement of the SIMcard);
iii. big clients;
HISTORY PREDICTIONDARK
t- -1 t-0

3
iv. clients with no traffic in the whole 18 monthsconsidered (the three periods, history, dark andprediction).
4.2.3. Client typology
The dynamics of churn among clients turn out to bedifferentiated according to their individualcharacteristics, even in terms of requirements and theterms of the contract. In the case in point, wedistinguished between clients which took out onlycompany prepaid SIMs and those that also took out asubscription type contract; this last group wassubdivided on the basis of the percentage of SIMcards with obligations; lastly, we took intoconsideration the size of the client thereby obtainingthe following analysis segments:
With obligations Withoutobligations
Contracts BigClients
X X
Contracts Other X X
Prepaid X
This basic segmentation was further reduced to threesegments which are numerically more relevant, andfor each one a propensity model was constructed forthe specific churn:1. Prepaid,2. Contracts With Obligations,3. Contracts Without Obligations.
4.2.4. The target variable
The constructed models are able to predict voluntarychurn of a client. With reference to the three-monthprediction period, clients who satisfied the followingwere considered targets:• those that had deactivated completely their own
company SIM portfolio within the end of theprediction period (deactivations must bevoluntary; this is real churn), or
• those that had drastically reduced total outgoingtraffic compared to the preceding three months(reduction of more than a third; this is reducedtraffic churn).
4.2.5. The explanatory structure
The fundamental concept behind the formulationgiven to the project, is, as we have already explained,the step from SIM entity to an entity which ishierarchically more advanced, that of CLIENT. At thetime of the development of the models, the company’sData Warehouse (DWH) predicted the recording of
the information almost completely at a SIM level. Aswe didn’t have access to the definitive dataenvironment, we had to revise the data available inthe system to reach the unit which interested us from aCorporate perspective: in other words the Client,proceeding with particular caution, and trying tominimise the loss of information. An example of theprocess is as follows: The variable Tariff Plans, at theSIM level, form an extremely detailed piece ofinformation; at the client level, it was revised as apercentage distribution of the SIMs associated withthe client compared to the type of tariff planconsidered important at a company level.The analysis dimensions brought together in theCustomer Table, which was constructed expressly forthe development of the churn models, refer to thefollowing categories:1. General client features: activation areas, activation
channels, …;2. Seniority of client: in terms of average seniority of
the active company SIM portfolio, last contactmade and months since first activation;
3. Snapshot of company SIM portfolio at t-1: numberof SIMs, tariff plans, options, obligations, …;
4. Dynamic of company SIM portfolio in the 12month history period: calculation of deviationindicators on quarter summaries of the number ofactive and deactived SIMs;
5. Client traffic at t-1: incoming and outgoing traffic(with relative split for traffic guidelines), numberof SIMs with zero traffic;
6. Traffic dynamic in the 12-month history period:calculation of deviation indicators on quartersummaries of incoming and outgoing traffic(differentiated by traffic guidelines).
4.3. Construction of the models
The churn models were produced by applying thetechnique of Decision Trees; this choice was madebecause of the need to obtain an instrument that waslegible and was able to be interpreted not only byanalysts; this algorithm rendered the Department’swork easier with reference to the spreading within thecompany of the obtained results and of the way theactual project was carried out. In general, the resultsobtained using this technique can be interpreted in amore immediate and direct way compared to theresults obtained using other Data Mining techniques;also, the algorithm guarantees a good performanceand proves to be at the same time sufficiently robustfrom a perspective of model scoring at a later time.
4.4. Implementation of models in production
The definition of the characteristics and therequirements of the data structure needed for the

4
development of the models, occurred with the help ofdata drawn out expressly for this project. In May2001, which is when the work commenced, IT wasengaged in functional analysis for the construction ofa production environment to be used for thedevelopment and the production of all the modellingconcerning the clients Vodafone Omnitel. Thisenvironment, named SAS4CKM, puts the companyDWH (based on Oracle DB), in touch with SAStables which have a simplified structure across a veryeasy-to-use interface. Marketing analysts, whocomprise the main users of this application, are ableto specify alone the Data Mart for the analyses theyintend to carry out.In this new environment the implementation of churnmodels required a significant commitment which gaveform to a series of steps with the following aims:1. transmit the specifics to IT for the construction of
the Table containing all the information used forthe development, both as analysis variables andvariables useful for profile description. The keyfor the table is the client. Also, the calculation ofthe indicators already includes all the SIMs thatbelong to it.
2. Historical recovery of the information.SAS4CKM carries out the loading of the dataevery month. To be able to test the models, accessto 12 months’ history was required. So, inNovember 2001, when the pre-production phasethat was needed to test the constructedenvironment commenced, data was recovered toreconstruct the history of active clients in October2001, going back to November 2000.
3. At this stage, a data audit activity was plannedwhose aim was to verify that the indicators wereconstructed correctly, that the distribution ofvariables corresponded to the developmentenvironment, and that the results were consistentwith what was obtained with the data a yearbefore. The activity carried out was ofconsiderable importance for both the identifyingof problems linked to the data loading and to gainan understanding of the availability of a dataenvironment which was certainly similar to thedevelopment one, but not completely identical.For example, the very definition of company SIMportfolio is slightly different:• In development: only company type SIMs;• In production: all the SIMs, both company and
individual.This phase forced IT to carry out multipleloadings with the aim of making up forinconsistencies as they were detected.
4. In January 2002, the first list of high risk churnclients was extracted, thereby commencing clientprevention and recuperation actions. The
Operative Test was based on a pre-productionenvironment, which was almost entirely in linewith the structure thought up for the modelimplementation but in any case referred to theactive clients in October 2001, three monthsbefore the beginning of the churn preventionactivities.
5. Conclusions
What has been done up to now and the resultsobtained with the Test Campaign provide us withmultiple elements which constitute the basis forfurther reflection with regard to:• Targeted churn prevention actions, studying the
client profiles;• Evolution of the clients over time with regard to
churn inclination and measured behavioursfollowing recovery actions;
• How to best exploit the production environment:the monthly extraction of lists of high risk churnclients now requires an effort to integrateSAS4CKM with the campaign managementsoftware; at present, the extraction of a listrequires an exercise in creaming off and ofchecking, carried out off-line, with regard toclients who have already been contacted in othercampaigns or who have been classified as highrisk in the preceding months and therefore whohave already been contacted. The list, in aparticular format, is given to the CampaignManager to trigger a contact action. The results,recorded within the same Campaign Manager, arein turn dealt with off-line for result summaries.
• The goal is to achieve an ideal design in which allthe process components communicate within justone flux.
• In this regard, we consider what has already beenexperimented with the implementation inproduction of a model developed off-line:
• The organisation of different players, resourcesand abilities requires a huge organisationaloperation, in terms of communication,transmission of concepts, especially if the intent isfor everybody involved to achieve the same goal.
* NUNATAC Via Crocefisso 5, 20122 Milano – (Italy)Tel.+39 02 86996848 Fax. +39 02 89012074E-mail: [email protected]; [email protected]